a data-driven appearance model for human fatigue
TRANSCRIPT

University of Pennsylvania University of Pennsylvania
ScholarlyCommons ScholarlyCommons
Departmental Papers (CIS) Department of Computer & Information Science
2011
A Data-Driven Appearance Model for Human Fatigue A Data-Driven Appearance Model for Human Fatigue
Joseph T. Kider Jr. University of Pennsylvania, [email protected]
Kaitlin Pollock University of Pennsylvania
Alla Safonova University of Pennsylvania, [email protected]
Follow this and additional works at: https://repository.upenn.edu/cis_papers
Part of the Computer Sciences Commons
Recommended Citation Recommended Citation Joseph T. Kider Jr., Kaitlin Pollock, and Alla Safonova, "A Data-Driven Appearance Model for Human Fatigue", . January 2011.
Kider, J., Pollock, K., & Safonova, A., A Data-Driven Appearance Model for Human Fatigue, Eurographics/ACM SIGGRAPH Symposium on Computer Animation, SCA 2011, doi: 10.2312/SCA ACM COPYRIGHT NOTICE. Copyright © 2011 by the Association for Computing Machinery, Inc. Permission to make digital or hard copies of part or all of this work for personal or classroom use is granted without fee provided that copies are not made or distributed for profit or commercial advantage and that copies bear this notice and the full citation on the first page. Copyrights for components of this work owned by others than ACM must be honored. Abstracting with credit is permitted. To copy otherwise, to republish, to post on servers, or to redistribute to lists, requires prior specific permission and/or a fee. Request permissions from Publications Dept., ACM, Inc., fax +1 (212) 869-0481, or [email protected].
This paper is posted at ScholarlyCommons. https://repository.upenn.edu/cis_papers/670 For more information, please contact [email protected].

A Data-Driven Appearance Model for Human Fatigue A Data-Driven Appearance Model for Human Fatigue
Abstract Abstract Humans become visibly tired during physical activity. After a set of squats, jumping jacks or walking up a flight of stairs, individuals start to pant, sweat, loose their balance, and flush. Simulating these physiological changes due to exertion and exhaustion on an animated character greatly enhances a motion’s realism. These fatigue factors depend on the mechanical, physical, and biochemical function states of the human body. The difficulty of simulating fatigue for character animation is due in part to the complex anatomy of the human body. We present a multi-modal capturing technique for acquiring synchronized biosignal data and motion capture data to enhance character animation. The fatigue model utilizes an anatomically derived model of the human body that includes a torso, organs, face, and rigged body. This model is then driven by biosignal output. Our animations show the wide range of exhaustion behaviors synthesized from real biological data output. We demonstrate the fatigue model by augmenting standard motion capture with exhaustion effects to produce more realistic appearance changes during three exercise examples. We compare the fatigue model with both simple procedural methods and a dense marker set data capture of exercise motions.
Disciplines Disciplines Computer Sciences
Comments Comments Kider, J., Pollock, K., & Safonova, A., A Data-Driven Appearance Model for Human Fatigue, Eurographics/ACM SIGGRAPH Symposium on Computer Animation, SCA 2011, doi: 10.2312/SCA
ACM COPYRIGHT NOTICE. Copyright © 2011 by the Association for Computing Machinery, Inc. Permission to make digital or hard copies of part or all of this work for personal or classroom use is granted without fee provided that copies are not made or distributed for profit or commercial advantage and that copies bear this notice and the full citation on the first page. Copyrights for components of this work owned by others than ACM must be honored. Abstracting with credit is permitted. To copy otherwise, to republish, to post on servers, or to redistribute to lists, requires prior specific permission and/or a fee. Request permissions from Publications Dept., ACM, Inc., fax +1 (212) 869-0481, or [email protected].
This conference paper is available at ScholarlyCommons: https://repository.upenn.edu/cis_papers/670

Eurographics/ ACM SIGGRAPH Symposium on Computer Animation (2011)A. Bargteil and M. van de Panne (Editors)
A Data-driven Appearance Model for Human Fatigue
Joseph T. Kider Jr., Kaitlin Pollock, and Alla Safonova
University of Pennsylvania
Abstract
Humans become visibly tired during physical activity. After a set of squats, jumping jacks or walking up a flight
of stairs, individuals start to pant, sweat, loose their balance, and flush. Simulating these physiological changes
due to exertion and exhaustion on an animated character greatly enhances a motion’s realism. These fatigue
factors depend on the mechanical, physical, and biochemical function states of the human body. The difficulty of
simulating fatigue for character animation is due in part to the complex anatomy of the human body. We present a
multi-modal capturing technique for acquiring synchronized biosignal data and motion capture data to enhance
character animation. The fatigue model utilizes an anatomically derived model of the human body that includes a
torso, organs, face, and rigged body. This model is then driven by biosignal output. Our animations show the wide
range of exhaustion behaviors synthesized from real biological data output. We demonstrate the fatigue model by
augmenting standard motion capture with exhaustion effects to produce more realistic appearance changes during
three exercise examples. We compare the fatigue model with both simple procedural methods and a dense marker
set data capture of exercise motions.
Categories and Subject Descriptors (according to ACM CCS): I.3.3 [Computer Graphics]: Three-DimensionalGraphics and Realism—Computer Animation
1. Introduction
Currently in animated films and video games, the visualiza-tion of human exhaustion is either artistically stylized or ig-nored completely. Every human sweats, pants, flushes, andloses balance as they perform physical activity (Figure 1).No one has the fitness level of an animated character. Run-ning up a hill or climbing stairs has a physiological effecton the body. Therefore the physiological effects of fatiguecannot be ignored when producing realistic animations. Tra-ditionally, artists tediously paint textures and meticulouslylayer subtle motions to produce dynamic exhaustion effects.This process is ad hoc, tedious and time-consuming for an-imators to tune the visual effect. We present a novel data-driven approach to automatically simulate exhaustion effectson virtual characters so they appear more tired the longerthey perform motions. This work enhances animation by tak-ing advantage of biomedical research and exercise physiol-ogy to apply captured data on anatomically inspired model.
Traditional motion capture techniques produce believablecharacter animation. However, traditional 30-60 data markersets only approximate change in human motion. As virtualcharacters become more realistic, it is important to simulate
physiological appearance changes in addition to motion cap-ture to simulate the body’s response to physical activity. Ex-haustion effects are particularly challenging since they arenon-periodic and complex, involving both motions and ap-pearance changes.
Figure 1: This figure shows the first frame and the last frame
of a jumping jack exercise. On the right, the character ap-
pears red, sweaty, and moves his head back since he feels
fatigued from jumping for 2 minutes.
In this paper, we introduce a data-driven method to cap-ture and animate physiologically apparent exhaustion ef-
c© The Eurographics Association 2011.

Joseph T. Kider Jr., Kaitlin Pollock, & Alla Safonova / A Data-driven Appearance Model for Human Fatigue
fects on a human character. We propose a multi-modal mo-tion capture approach for capturing both human motion andbiosignal data (EKG, BVP, GSR, respiration, and skin tem-perature) visualized in Figure 2. This novel capture processgreatly enhances the quality of the data we collect. Our ob-jective is to apply this data onto a human character to en-hance secondary exhaustion animation effects such as sweat-ing, breathing, and flushing (Figure 1). We accurately recre-ate an anatomically inspired human body to demonstrate theexhaustion effects. The human model consists of a riggedskeleton, lungs, ribs, spine, intestines, heart, and face. Thebiosignal data controls the deformation of the human model.This allows us to automatically generate exhaustion effectslayered on human motion. We propose a straightforwardmethod for producing a data-driven appearance model of hu-man fatigue.
To validate the fatigue model, we captured exercise mo-tions of ten subjects (five males and five females) rangingin size and shape. The subjects all exhibited the same sig-nificant signs of exhaustion when they performed the exer-cise motions. We illustrate these physiological changes ofexercise by showing biosignal output plots. Physical activ-ity produces significant change in the plots of respirationrate, pulse, skin temperature, and galvanic skin response. Wedemonstrate the fatigue output on a virtual character whoseexhaustion effects change due to the biosignal output sig-nals for three types of exercise motions: jumping jacks, stairstepping, and squatting. Lastly, we evaluate the results bycomparing the simulated model to a dense motion capturemarker set that covers the chest. The fatigue model producessimilar chest deformations without needing to capture 50 ex-tra chest markers. Additionally, the fatigue model is able toadd flushing and sweating to the virtual characters, whichcannot be captured effectively with previous methods.
The main contribution of this work is presenting a biosig-nal data capture technique that drives a human characterto augment its visual appearance. We layer various dy-namic physiological effects such as perspiration, flushing,and breathing on the human character. These effects changedue to the biodata output providing more realistic appear-ance of fatigue on the character animation.
2. Related Work
To our knowledge, little work has been conducted to en-hance virtual character animations with synchronized bio-data output. In the movie Beowulf, Sony Picture Imageworkscombined electrooculography (EOG) with motion captureto create realistic eye movement on characters. Some re-searchers [SCCH09, TLX10, MTCS08] capture electromyo-graphy (EMG) with motion capture to measure and recordthe electrical activity produced by skeletal muscles. Unfor-tunately, full body EMG systems are extremely expensive,very invasive for the subject, and produce extremely noisydata. These biodata enhancements are cheaper, non-invasive,
Figure 2: This figure shows the biodata sensor enhance-
ments to the motion capture process. The subject (a) is asked
to wear five different sensors: (b) a respiration sensor that
wraps around the chest, (c) an electrocardiography sensor
with three leads on the chest, (d) external skin temperature
sensor behind the ear, (e) blood volume pulse sensor and (f)
galvanic skin response sensor on the left hand. These sen-
sors are minimally invasive and only take an additionally
five minutes to place on the subject.
and produce cleaner data which can be directly applied toenhance animations.
The simulation and visual appearance of anatomical sec-ondary animation effects is well studied in graphics. Mon-heit and Badler [MB91] simulated a flexible torso andspine. Lee and Terzopoulos [LT06] introduced an animatedbiomechanical model for the human neck.. Promayon et al.[PBP97] looked at the rib cage, lungs, diaphragm, and ab-domen during calm breathing patterns. Kaye et al. [KMP97]modeled a basic cardiorespiratory physiology of the bodybased on CT scans.
Zordan et al. [ZCCD06] presented an anatomically in-spired model of the human torso to simulate realistic res-piration on human characters. Their torso simulation recon-structed the human rib cage, spine, lungs, diaphragm mus-cle, and lower abdomen. Characters became more alive withsimulated breathing motions. Sanders et al. [SDZB08] im-proved the technique by placing 40 additional markers onthe human torso as input for the system. We compare the fa-
tigue model’s results to a similar dense marker set found inthis paper. DiLorenzo et al. [Dil09,DZS08] presented a tech-nique for using sound tracks to drive the breathing model forlaughing, coughing, and sneezing. The underlying model ofthe rib cage, spine and lungs follow a similar model to thisapproach. We use output from the biosensors to drive thefatigue model, rather than a dense marker set. Additionally,our approach simulates heartbeats, flushing, mouth motionsand perspiration.
Many researchers have simulated facial movements[PB81,KHYS02,Wat87,SNF05]. Sagar [Sag06] and Bradley
c© The Eurographics Association 2011.

Joseph T. Kider Jr., Kaitlin Pollock, & Alla Safonova / A Data-driven Appearance Model for Human Fatigue
et al. [BHPS10] captured facial expressions, geometry, andtextures to apply to facial animations. The fatigue model
does not simulate facial muscles or utilize an expensiveperformance capture technique; instead it uses data-derivedblend shapes for the facial motion from sample facial cap-tures. This motion is guided by the respiration data to mod-ify the blend shape of the underlying facial rigs [DCFN06]to simulate mouth breathing.
The appearance of human skin, specifically for the faceand neck, contribute to showing the level of fatigue. Igarashiet al. [INN07] survey various appearance models for skin.Kalra and Magnenat-Thalmann [KMT02] first proposedmodeling facial color changes based on a texturing ap-proach. Weyrich et al. [WMP∗06] looked at skin measure-ments under various hot and sweaty conditions. Yamadaand Watanabe [YW07] observed facial color change dur-ing anger. Melo and Gratch [MG09] propose a method tolayer sweating and blushing on virtual characters. They fo-cused on interactions with other characters so the blushingand sweating were caused by emotional stress and not ther-moregulation.
Jimenez et al. [JSB∗10] captured real subject measure-ments of melanin and hemoglobin concentrations to dynam-ically model the appearance of facial color. For one of thesubject tests, a person ran stairs and measurements weretaken once a minute. The facial color appearance model isbased on this approach for simulating the skin color changesduring the exercise motions. However, we use real biosignaldata to drive the appearance rig parameters.
Methods have been proposed to capture and animate thecomplex skin deformations of the human body. Allen etal. [ACP02] calculated skeleton-driven body deformationsby utilizing range scan data. Sand et. al. [SMP03] pre-sented a method to acquire deformations based on silhou-ettes. Park and Hodgins [PH06] captured subtle movementsof skin during dynamic movements with a high dimensional(350) marker set, with 50 of these on the chest alone. Theyproduced very realistic effects for breathing, jiggling, andbulging. However, the marker setup is not only uncomfort-able to wear, but the data is tedious to clean and label. Theirfollow up work [PH08] utilized the capture database of skindeformations to produce a statistical model to layer skin de-formations on various motions.
The fatigue model differs in important ways from theseskin performance capture techniques. Foremost, the fatigue
model’s data capture is less intrusive to the subject, andtakes less time to clean and process the motion data. Thoughskin performance techniques produce highly realistic resultsfor subtle deformations, we are primarily concerned withbreathing in this paper. The fatigue model simulates the un-derlying anatomical model from output of the biodata tosimulate realistic chest movement. Additionally, we simu-late a variety of fatigue effects such as sweating and flushingwhich could not be captured by these techniques alone.
3. Exercise Mechanics
As humans perform physical activity they put their body un-der stress. The more intense the motion is the more intensethe body’s physiological reaction. Exercise presents one ofthe highest levels of stress on the human body. Major signsof fatigue include: changes in respiration, heart rate, perspi-ration, temperature changes, and flushing. The system at-tempts to model these major changes so the virtual charac-ters appear more fatigued as they perform motions. Thereare two types of motion classes we are looking at: anaerobic(squats) where the muscles are exerted for a short period oftime, and aerobic (jumping jacks, stair stepping) performedfor a longer period of time.
As humans begin physical activity, their respiration me-chanics change. Breathing becomes deeper and more vig-orous. This breathing pattern is called hyperpnea. The res-piratory changes seen in hyperpnea match metabolic de-mands of the body. First, ventilation increases abruptly asexercise begins. The excitatory impulses from propriocep-tors in the muscles and tendons activate the respiratory cen-ters. Ventilation then declines suddenly after exercise stops[Mar98, Min93, Wes04].
Figure 4: These graphs show the changes in the heat flow
rates and body temperature during exercise.
To prolong motions for extended periods of time, theheart must simultaneously supply enough blood flow to mus-cles, ensure oxygen is distributed in the body, and moveadequate blood to the skin so heat can dissipate to meetthe body’s thermoregulatory demands [LM88]. As the heartpumps more blood to meet the demands of oxygen in thebody tissues, it recruits more muscle fibers. This increasesthe force required to perform the blood flow movement. Theheart’s contraction and expansion increases. The blood rush-ing to the body’s tissues changes both the internal and ex-ternal temperature. Warm blood returns to the body’s core.
c© The Eurographics Association 2011.

Joseph T. Kider Jr., Kaitlin Pollock, & Alla Safonova / A Data-driven Appearance Model for Human Fatigue
Figure 3: This figure shows an overview of the simulation pipeline. We capture the data, clean the motion capture take, apply
the biodata to the simulation parameters, deform the organs, which in turn deform the skin, change the appearance of the figure
(sweating, flushing), then render the final output.
The muscles contract causing vasoconstriction to reduce theblood flow. This makes peripheral skin temperature decreasedue to the sympathetic nervous system during intense mo-tions. This thermoregulation change can be seen in Figure 4[LM88].
The facial skin tissue has more capillary loops per areathen other parts of the body. Vasodilation (widening ofblood vessels) occurs in the face producing a blushing ef-fect [MAP∗82]. Jimenez et al. [JSB∗10] related this effectto a “texture look up” of hemoglobin and melanin values.
The sympathetic nervous system directly controls sweatgland activity and skin pore size. Skin conductance measureshow skin can conduct current. This galvanic skin response isdirectly proportional to sweat being produced [PT57].
There are many other factors that contribute to fatigue,such as lactic acid build up, hydrogen ion accumulation andglycogen depletion. Though these factors are important inhuman fatigue, we do not consider them in the paper sincethey require blood work, and other invasive measuring meth-ods to properly measure.
4. System Overview
We introduce a data-driven method to capture and animatefatigue effects on a human character. An overview of the fa-
tigue model is found in Figure 3. First, we capture the motioncapture data on the subject. We use a standard 40 motioncapture marker setup, augmented with 5 biosignal sensors.We then clean and process the data. The next stage simulatesthe underlying anatomically derived model. We use the out-put from the biosignal sensors to drive the anatomical sim-ulation which relates the data into parameters which can beused to deform the organs. We use these parameters to drivethe underlying organs: heart, lungs, etc. The organ simula-tion deforms the skin of the virtual character so it appearsalive. We then adjust the character’s outer appearance fromthe biodata parameters making the character flush and sweatas the data changes. Finally, we render the final output in thescene.
Figure 5: The left image shows the internal anatomy of the
virtual human. The right image shows an x-ray view of the
organs inside the body.
5. Data Acquisition
For an experimental analysis we captured 10 subjects (5males and 5 females) of various weights (48kg to 108kg)and sizes (157cm to 195cm). The subjects ranged between20 to 34 years of age and had a variety of fitness levels ac-cording to their responses on a questionnaire. Each subjectperformed at least 2 exercise types: jumping jacks, squats,or stair aerobics giving us around 25 unique exercise sam-ple motions. We have made the data publicly available at:http://cg.cis.upenn.edu/hms/research/Exhaustion/.
5.1. Motion Capture
We used a commercial 16 near infra-red camera optical mo-tion capture system from Vicon [vic11]. The motion datawas captured at 120 frames per second in a 3m by 3m by3m capture volume. We used a standard 40 retro-reflectivemarker setup for the motions. Additionally, we placed ap-proximately 50 markers on the chest and 16 markers onthe face so we could compare deformations, capturing, andcleaning times. We captured, reconstructed, and cleaned themarker data using VICON BLADE 1.6 [vic11]. The motionwas then transferred to a skinned virtual character in Maya.
c© The Eurographics Association 2011.
Joseph T. Kider Jr., Kaitlin Pollock, & Alla Safonova / A Data-driven Appearance Model for Human Fatigue
5.2. Biosignal Sensors
We captured five biosignal sensors in addition to the motioncapture data. These sensors are illustrated in Figure 2. Weused a ProComp Infiniti encoder to wirelessly capture thedata on a subject at a rate of 2040 samples per second. Tosynchronize the sensors we used a 5 volt TTL signal gener-ated when a motion capture session started. This signal wascaptured as a sixth channel in the encoder and used to syn-chronize the motion after the capture process.
Respiration: The respiration sensor is placed around thesubject’s upper chest. The sensor measures the abdomi-nal expansion of a subject during respiration. The devicestretches and contracts as the subject breaths and records thesignal’s waveform.
Electrocardiography (EKG): An EKG signal detects andamplifies the small electrical voltage the heart muscle fibersgenerates when it contracts and expands. The EKG sensorused 3 leads: a negative sensor on the right shoulder, the pos-itive sensor on the lower center of the chest, and the groundsensor on the right shoulder area.
Peripheral skin temperature: This sensor is a 0.125 inchthermistor that detects changes in skin temperature. The skintemperature changes as blood perfuses to the skin. We placedthe sensor on the back of the ear to measure the skin temper-ature of the upper body.
Blood Volume Pulse (BVP): bounces infra-red light againstthe skin and measures the reflected light; this sensor is alsocommonly referred to as photoplethysmography in the liter-ature. We attached this sensor to the middle finger.
Galvanic Skin Response (GSR): This sensor measures theskin conductance of electricity. A small voltage is appliedbetween the two sensors placed on the index and fourth fin-ger. Skin conductance correlates with the sweat gland andskin pore size of the subject.
We filter the EKG signal after capturing. It is measuredin microvolts. This output gives us a waveform signal thatwe further process. First, we run a low frequency filter set ateither 0.5 Hz or 1 Hz and high frequency filter set at 40 Hz.This limits artifacts for routine cardiac rhythm monitoring.The high-pass filter helps reduce artifacts and the low-passfilter helps reduce 60 Hz power line noise.
6. Simulation Model
The virtual human characters have an anatomical model ofthe internal organs, such as the lungs, heart, esophagus, andlower trunk [Mar98]. We have also added a rib cage andspine [MB91, SDZB08]. This internal anatomy moves anddeforms based on biosignal data output. We visualize ourinternal model and an x-ray view in our virtual characterin Figure 5. We derive equations inspired from the exer-cise physiology literature [PT57, MAP∗82, LM88, Wes04,
Min93]. These equations map the biosignal sensor output toour organ deformations and visual appearance changes.
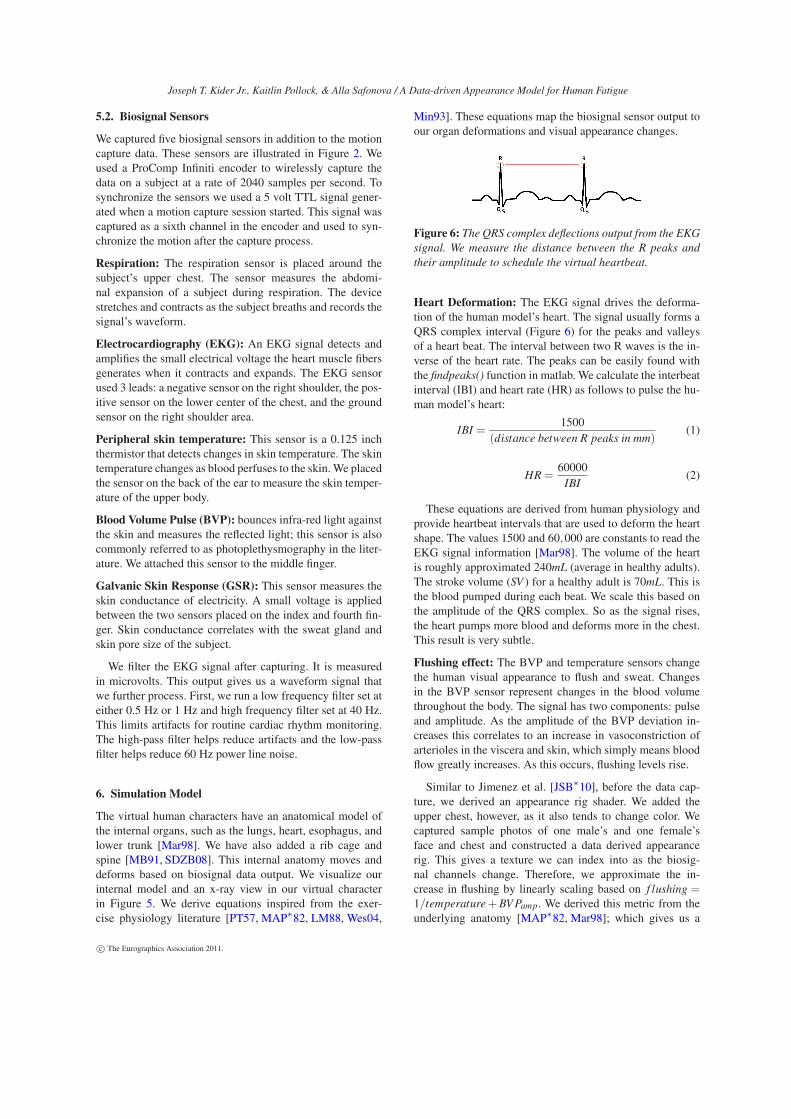
Figure 6: The QRS complex deflections output from the EKG
signal. We measure the distance between the R peaks and
their amplitude to schedule the virtual heartbeat.
Heart Deformation: The EKG signal drives the deforma-tion of the human model’s heart. The signal usually forms aQRS complex interval (Figure 6) for the peaks and valleysof a heart beat. The interval between two R waves is the in-verse of the heart rate. The peaks can be easily found withthe findpeaks() function in matlab. We calculate the interbeatinterval (IBI) and heart rate (HR) as follows to pulse the hu-man model’s heart:
IBI =1500
(distance between R peaks in mm)(1)
HR =60000
IBI(2)
These equations are derived from human physiology andprovide heartbeat intervals that are used to deform the heartshape. The values 1500 and 60,000 are constants to read theEKG signal information [Mar98]. The volume of the heartis roughly approximated 240mL (average in healthy adults).The stroke volume (SV ) for a healthy adult is 70mL. This isthe blood pumped during each beat. We scale this based onthe amplitude of the QRS complex. So as the signal rises,the heart pumps more blood and deforms more in the chest.This result is very subtle.
Flushing effect: The BVP and temperature sensors changethe human visual appearance to flush and sweat. Changesin the BVP sensor represent changes in the blood volumethroughout the body. The signal has two components: pulseand amplitude. As the amplitude of the BVP deviation in-creases this correlates to an increase in vasoconstriction ofarterioles in the viscera and skin, which simply means bloodflow greatly increases. As this occurs, flushing levels rise.
Similar to Jimenez et al. [JSB∗10], before the data cap-ture, we derived an appearance rig shader. We added theupper chest, however, as it also tends to change color. Wecaptured sample photos of one male’s and one female’sface and chest and constructed a data derived appearancerig. This gives a texture we can index into as the biosig-nal channels change. Therefore, we approximate the in-crease in flushing by linearly scaling based on f lushing =1/temperature+BV Pamp. We derived this metric from theunderlying anatomy [MAP∗82, Mar98]; which gives us a
c© The Eurographics Association 2011.

Joseph T. Kider Jr., Kaitlin Pollock, & Alla Safonova / A Data-driven Appearance Model for Human Fatigue
perceptual metric to make the human characters flush as theyexhaust.
Sweating model: Perspiration is modeled from the GSRbiosignal. We layer sweat particles and change the specu-larity of the skin’s subsurface scattering layers to simulatesweating. The relationship between active sweat glands andskin conductance is linear [PT57]. Here Gt is the total con-ductance we measure from the sensor, N is the number ofunknown sweat glands that are currently active. Gg we rep-resent as a constant, which represents the average conduc-tance increment of each active gland. Ga is a constant. Thisis the average value for an additional conducting path whosecontribution to the total conductance is not related to thethe test area. We set these values to 0.18 and 0.08 respec-tively. These constants were derived from the empirical ex-periments of Price et al. [PT57]. The equations to solve forthe active sweat glands are as follows.
Gt = Ga +GgN (3)
N =Gt −Ga
Gg(4)
Lung Deformation: The respiration output drives the lungdeformations. We simplified the lung model so that wemodeled both lungs as only having a single compart-ment [Met97]. The respiration sensor measures the relativeamount of expansion. The average lung volume is 6 liters inmen, and 4.2 liters in women. The total lung capacity T LC
is commonly calculated as the vital capacity (VC) + residualvolume (RV ). The vital capacity (VC) is calculated from in-spiratory reserve volume (IRV ) + expiratory reserve volume(ERV ) + the tidal volume (Vt ). Contracting the diaphragmpulls the bottom of the lung cavity down, increasing the vol-ume and decreasing the pressure. The sensor directly mapsthe change in the volume of the lungs. We get the startinglung volume measurements (VC, ERV and Vt ) from spirom-eter readings taken from every subject.
Face Deformation: The respiration output also drives theface deformations. Using 16 facial markers, we initially cap-tured datasets from one male and one female face. From thismotion we derived blend shapes of mouth and nostril mo-tions for breathing. The system uses the respiration outputto determine when a breath occurs and its amplitude. We usethese two parameters to drive the facial blend shapes so thecharacter appears to breathe. The subjects therefore do nothave to wear facial markers for their capture.
7. Experimental Results
In the submission video that accompanies this paper, resultsare included for three different subjects performing three dif-ferent motions: jumping jacks, stair stepping, and squats.The subjects show signs of exhaustion as they perform themotion. For rendering, the shaders are developed in Men-
tal Ray and modeled the figures in Autodesk’s Maya. The
characters are scaled to be proportional to the capture sub-ject’s dimensions. The appearance model and character rigcan easily fit into an animation pipeline, and only adds asmall overhead to apply our exhaustion plug-in simulationand shaders.
7.1. Analysis of Biodata
25 different motions were captured from 10 subjects. For ev-ery experiment we asked the subjects to idle before the mo-tion, perform the exercise, then idle to cool down afterwards.Figure 11(a) shows the output from all the biosensors (res-piration, galvanic skin response, electrocardiography, skintemperature, and blood volume pulse) for one of the subjectsperforming a jumping jacks exercise. On each graph, the firstred line indicates the start of the exercise and the second redline indicates the end of the exercise. As can be readily notedin this figure, there is a major difference in the biodata dur-ing an exercise: after the first red line temperature starts todip, the respiration pattern dramatically changes, GSR rises,and the heart rate and BVP intensify.
Figures 11(b) shows the output from the temperature sen-sor for four different subjects. The general form of all fourcurves is the same for all the subjects - after the first red linethe temperature starts to dip and it starts going back to nor-mal after the second red line. Figures 11(c) show the outputfrom the respiration sensor for four different subjects. Again,the general form of all four curves is the same across allsubjects. This result shows that the exercise experiments arevery repeatable across subjects and exercises. Due to spacelimitation we could not include data for other sensors andfor all 10 subject, but the same conclusion holds for the restof the data.
Figure 8: The left image shows the model without any ex-
haustion effects. The right image shows the model flushing,
and perspiring after an exhausting squat exercise.
7.2. Comparison Results
We compare chest deformations for the fatigue model witha chest deformation computed from a dense marker set (seeFigure 9 for marker setup we used). We capture 40 markersfor the body, augmented with 50 markers for the chest, and
c© The Eurographics Association 2011.
Joseph T. Kider Jr., Kaitlin Pollock, & Alla Safonova / A Data-driven Appearance Model for Human Fatigue
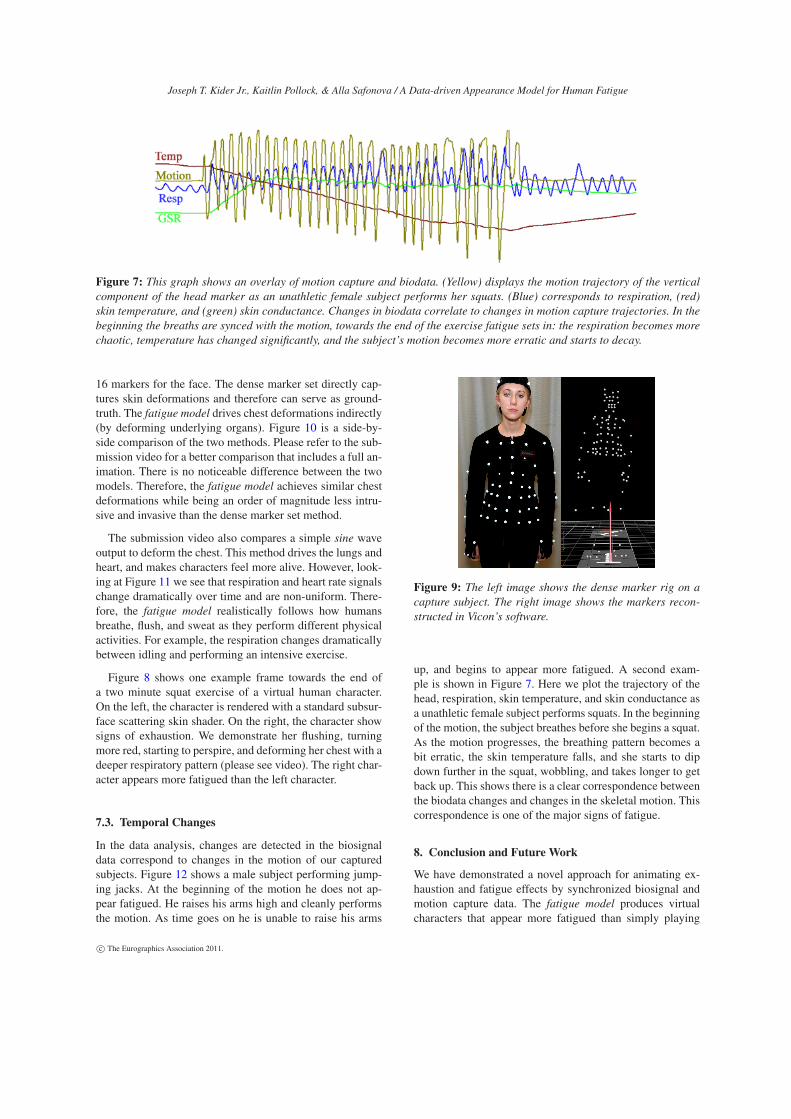
Figure 7: This graph shows an overlay of motion capture and biodata. (Yellow) displays the motion trajectory of the vertical
component of the head marker as an unathletic female subject performs her squats. (Blue) corresponds to respiration, (red)
skin temperature, and (green) skin conductance. Changes in biodata correlate to changes in motion capture trajectories. In the
beginning the breaths are synced with the motion, towards the end of the exercise fatigue sets in: the respiration becomes more
chaotic, temperature has changed significantly, and the subject’s motion becomes more erratic and starts to decay.
16 markers for the face. The dense marker set directly cap-tures skin deformations and therefore can serve as ground-truth. The fatigue model drives chest deformations indirectly(by deforming underlying organs). Figure 10 is a side-by-side comparison of the two methods. Please refer to the sub-mission video for a better comparison that includes a full an-imation. There is no noticeable difference between the twomodels. Therefore, the fatigue model achieves similar chestdeformations while being an order of magnitude less intru-sive and invasive than the dense marker set method.
The submission video also compares a simple sine waveoutput to deform the chest. This method drives the lungs andheart, and makes characters feel more alive. However, look-ing at Figure 11 we see that respiration and heart rate signalschange dramatically over time and are non-uniform. There-fore, the fatigue model realistically follows how humansbreathe, flush, and sweat as they perform different physicalactivities. For example, the respiration changes dramaticallybetween idling and performing an intensive exercise.
Figure 8 shows one example frame towards the end ofa two minute squat exercise of a virtual human character.On the left, the character is rendered with a standard subsur-face scattering skin shader. On the right, the character showsigns of exhaustion. We demonstrate her flushing, turningmore red, starting to perspire, and deforming her chest with adeeper respiratory pattern (please see video). The right char-acter appears more fatigued than the left character.
7.3. Temporal Changes
In the data analysis, changes are detected in the biosignaldata correspond to changes in the motion of our capturedsubjects. Figure 12 shows a male subject performing jump-ing jacks. At the beginning of the motion he does not ap-pear fatigued. He raises his arms high and cleanly performsthe motion. As time goes on he is unable to raise his arms
Figure 9: The left image shows the dense marker rig on a
capture subject. The right image shows the markers recon-
structed in Vicon’s software.
up, and begins to appear more fatigued. A second exam-ple is shown in Figure 7. Here we plot the trajectory of thehead, respiration, skin temperature, and skin conductance asa unathletic female subject performs squats. In the beginningof the motion, the subject breathes before she begins a squat.As the motion progresses, the breathing pattern becomes abit erratic, the skin temperature falls, and she starts to dipdown further in the squat, wobbling, and takes longer to getback up. This shows there is a clear correspondence betweenthe biodata changes and changes in the skeletal motion. Thiscorrespondence is one of the major signs of fatigue.
8. Conclusion and Future Work
We have demonstrated a novel approach for animating ex-haustion and fatigue effects by synchronized biosignal andmotion capture data. The fatigue model produces virtualcharacters that appear more fatigued than simply playing
c© The Eurographics Association 2011.

Joseph T. Kider Jr., Kaitlin Pollock, & Alla Safonova / A Data-driven Appearance Model for Human Fatigue
Figure 10: The left image shows the model’s breathing de-
formation. The right image shows the dense set marker’s de-
formation. We see that there is no visual difference between
the two chests.
back motion capture data. We simulated an anatomically in-spired human to generate these effects without having to doperformance capture using an expensive dense marker set.The breathing, flushing, and perspiration effects enhancedthe virtual character’s appearance. We compared our modelto simple sinusoidal breathing models, and dense markerset captures. Our method produced more realistic effectsthan the naïve models without a large quality loss from thedense marker set captures. Compared to tedious processingof dense marker sets, the fatigue model simulation offers alow overhead add-on to an existing animation pipeline.
The current model only focuses on certain fatigue ef-fects. Other equally important aspects affecting human exer-cise motion such as muscle deformation, facial expressions,wrinkles, and eye movement are not being considered in thispaper. All of these change over the course of a intensive ex-ercise. We hope to layer some of these effects on the modelin the future.
We plan to develop an even more robust model of the vi-sual appearance. Some limitations of the fatigue effects lie inthat we are not considering all the complex processes of thehuman body. Finding a blood oxygen sensor would greatlyenhance how we could simulate oxygenation of the skin andbody. Also, there are sensors that measure the internal bodytemperature of a subject, however they are extremely inva-sive to wear. We opted not to stick sensors inside the subjectas they performed the exercise motions. However, internaltemperature data would produce more accurate physiologi-cal effects.
In the future, we want to compare the data across exer-cise classes to see how they correlate with different changesin motion. The analysis of the biosignal channel user studydata shows the results produced during the captured exer-cises are very repeatable. We plan to parameterize the de-formations and fatigue effect and learn these parameters tolayer the effects on motion without having to always cap-
ture synchronized data. For example, people who are moreathletic and fit tire differently than less fit individuals. Thefatigue parameters will help us apply the proper exhaustioneffects to characters of varying build and fitness.
References
[ACP02] ALLEN B., CURLESS B., POPOVIC Z.: Articulatedbody deformation from range scan data. In ACM SIGGRAPH
2002 Papers (New York, NY, USA, 2002), SIGGRAPH ’02,ACM, pp. 612–619.
[BHPS10] BRADLEY D., HEIDRICH W., POPA T., SHEFFER A.:High resolution passive facial performance capture. In ACM SIG-
GRAPH 2010 papers (New York, NY, USA, 2010), SIGGRAPH’10, ACM, pp. 41:1–41:10.
[DCFN06] DENG Z., CHIANG P.-Y., FOX P., NEUMANN U.:Animating blendshape faces by cross-mapping motion capturedata. In Proceedings of the 2006 symposium on Interactive
3D graphics and games (New York, NY, USA, 2006), I3D ’06,ACM, pp. 43–48.
[Dil09] DILORENZO P. C.: Breathing, laughing, sneezing, cough-
ing: model and control of an anatomically inspired, physically-
based human torso simulation. PhD thesis, University of Cali-fornia, Riverside, USA, 2009. AAI3350078.
[DZS08] DILORENZO P. C., ZORDAN V. B., SANDERS B. L.:Laughing out loud: control for modeling anatomically inspiredlaughter using audio. In ACM SIGGRAPH Asia 2008 papers
(New York, NY, USA, 2008), SIGGRAPH Asia ’08, ACM,pp. 125:1–125:8.
[INN07] IGARASHI T., NISHINO K., NAYAR S. K.: The appear-ance of human skin: A survey. Found. Trends. Comput. Graph.
Vis. 3 (January 2007), 1–95.
[JSB∗10] JIMENEZ J., SCULLY T., BARBOSA N., DONNER C.,ALVAREZ X., VIEIRA T., MATTS P., ORVALHO V., GUTIER-REZ D., WEYRICH T.: A practical appearance model for dy-namic facial color. In ACM SIGGRAPH Asia 2010 papers (NewYork, NY, USA, 2010), SIGGRAPH ASIA ’10, ACM, pp. 141:1–141:10.
[KHYS02] KÄHLER K., HABER J., YAMAUCHI H., SEIDEL
H.-P.: Head shop: generating animated head models withanatomical structure. In Proceedings of the 2002 ACM SIG-
GRAPH/Eurographics symposium on Computer animation (NewYork, NY, USA, 2002), SCA ’02, ACM, pp. 55–63.
[KMP97] KAYE J., METAXAS D. N., PRIMIANO JR. F. P.: A 3dvirtual environment for modeling mechanical cardiopulmonaryinteractions. In Proceedings of the First Joint Conference on
Computer Vision, Virtual Reality and Robotics in Medicine and
Medial Robotics and Computer-Assisted Surgery (London, UK,1997), CVRMed-MRCAS ’97, Springer-Verlag, pp. 389–398.
[KMT02] KALRA P., MAGNENAT-THALMANN N.: Modellingof vascular expressions in facial animation. In Proceedings of
Computer Animation (2002), pp. 50–58.
[LM88] LAMB D., MURRY R.: Perspectives in Exercise Science
and Sports Medicine. Benchmark Press, 1988.
[LT06] LEE S.-H., TERZOPOULOS D.: Heads up!: biomechan-ical modeling and neuromuscular control of the neck. In ACM
SIGGRAPH 2006 Papers (New York, NY, USA, 2006), SIG-GRAPH ’06, ACM, pp. 1188–1198.
[MAP∗82] MELLANDER S., ANDERSSON, P.O. A., L.E.,HELLSTRAND P.: Neural beta-adrenergic dilatation of the fa-cial vein in man: possible mechanism in emotional blushing. InActa Physiologica Scandinavica (1982), pp. 393–399.
c© The Eurographics Association 2011.

Joseph T. Kider Jr., Kaitlin Pollock, & Alla Safonova / A Data-driven Appearance Model for Human Fatigue
Figure 11: This graph shows the biodata capture of 5 different subjects from the user experiment. For each motion capture
take the subject was asked to idle, perform an exercise (area between red lines on plots), then idle to cool down. There is a
major difference in the biodata during an exercise. (a) shows Subject 1’s (Male 180lbs athletic build): respiration, galvanic
skin response, electrocardiography, skin temperature, and blood volume pulse for a jumping jack exercise, (b) and (c) show
two male and two female subjects’ biodata for squats, jumping jacks, and stair climbing exercises. (b) shows four subjects’
skin temperature signal. All four subjects have similar thermal events: warm blood moving from the skin to the body core, and
producing perspiration to cool down temperature during the exercise. Warm blood then returns to the skin immediately after
the exercise. (c) shows four subjects’ respiration signal. Again, all the subjects’ breathing patterns become deeper and more
vigorous during the exercise than when they idled. Towards the end of the exercise, as fatigue sets in the respiration signal
shows the deeper breaths people take.
[Mar98] MARIEB E.: Human Anatomy and Physiology. AddisionWesley, 1998.
[MB91] MONHEIT G., BADLER N. I.: A kinematic model of thehuman spine and torso. IEEE Comput. Graph. Appl. 11 (March1991), 29–38.
[Met97] METAXAS D. N.: Physics-Based Deformable Models.
Kluwer Academic Publishers, 1997.
[MG09] MELO C. M., GRATCH J.: Expression of emotions usingwrinkles, blushing, sweating and tears. In Proceedings of the 9th
International Conference on Intelligent Virtual Agents (Berlin,Heidelberg, 2009), IVA ’09, Springer-Verlag, pp. 188–200.
[Min93] MINES A.: Respiratory Physiology. Raven Press, 1993.
c© The Eurographics Association 2011.

Joseph T. Kider Jr., Kaitlin Pollock, & Alla Safonova / A Data-driven Appearance Model for Human Fatigue
Figure 12: This figure shows a male subject performing jumping jacks. In the left frame, he appears energetic. In successive
frames to the right he starts to flush, sweat, and pant more. Also, at the start of the motion (far left) he raises his arms high,
towards the end (far right) he appears more exhausted and cannot lift his arms as high. This shows the biodata and the motion
change together.
[MTCS08] MAGNENAT-THALMANN N., CHARBONNIER C.,SCHMID J.: Multimedia application to the simulation of humanmusculoskeletal system: A visual lower limb model from mul-timodal captured data. In Multimedia Signal Processing, 2008
IEEE 10th Workshop on (oct. 2008), pp. 520 –525.
[PB81] PLATT S. M., BADLER N. I.: Animating facial expres-sions. In Proceedings of the 8th annual conference on Computer
graphics and interactive techniques (New York, NY, USA, 1981),SIGGRAPH ’81, ACM, pp. 245–252.
[PBP97] PROMAYON E., BACONNIER P., PUECH C.: Physically-based model for simulating the human trunk respiration move-ments. In Proceedings of the First Joint Conference on Computer
Vision, Virtual Reality and Robotics in Medicine and Medial
Robotics and Computer-Assisted Surgery (London, UK, 1997),CVRMed-MRCAS ’97, Springer-Verlag, pp. 379–388.
[PH06] PARK S. I., HODGINS J. K.: Capturing and animatingskin deformation in human motion. ACM Trans. Graph. 25 (July2006), 881–889.
[PH08] PARK S. I., HODGINS J. K.: Data-driven modeling ofskin and muscle deformation. In ACM SIGGRAPH 2008 papers
(New York, NY, USA, 2008), SIGGRAPH ’08, ACM, pp. 96:1–96:6.
[PT57] PRICE THOMAS I. K.: Relationship between sweat glandactivity and electrical resistance of the skin. In Journal of Applied
Physiology (1957), pp. 578–586.
[Sag06] SAGAR1 M.: Facial performance capture and expressivetranslation for king kong. In ACM SIGGRAPH 2006 Courses
(New York, NY, USA, 2006), SIGGRAPH ’06, ACM.
[SCCH09] SHIRATORI T., COLEY B., CHAM R., HODGINS
J. K.: Simulating balance recovery responses to trips basedon biomechanical principles. In Proceedings of the 2009 ACM
SIGGRAPH/Eurographics Symposium on Computer Animation
(New York, NY, USA, 2009), SCA ’09, ACM, pp. 37–46.
[SDZB08] SANDERS B., DILORENZO P., ZORDAN V., BAKAL
D.: Toward anatomical simulation for breath retraining inmind/body medicine. In Workshop on 3D Physiological Human
(2008).
[SMP03] SAND P., MCMILLAN L., POPOVIC J.: Continuouscapture of skin deformation. In ACM SIGGRAPH 2003 Papers
(New York, NY, USA, 2003), SIGGRAPH ’03, ACM, pp. 578–586.
[SNF05] SIFAKIS E., NEVEROV I., FEDKIW R.: Automatic de-termination of facial muscle activations from sparse motion cap-ture marker data. In ACM SIGGRAPH 2005 Papers (New York,NY, USA, 2005), SIGGRAPH ’05, ACM, pp. 417–425.
[TLX10] TENGYU Z., LIFENG L., XIAOJUN S.: Design and ap-plication of gait analysis system for prosthesis wearers. In Pro-
ceedings of the 4th International Convention on Rehabilitation
Engineering & Assistive Technology (Kaki Bukit TechPark II„Singapore, 2010), iCREATe ’10, Singapore Therapeutic, Assis-tive & Rehabilitative Technologies (START) Centre, pp. 53:1–53:3.
[vic11] Vicon motion systems, May 2011.
[Wat87] WATERS K.: A muscle model for animation three-dimensional facial expression. In Proceedings of the 14th annual
conference on Computer graphics and interactive techniques
(New York, NY, USA, 1987), SIGGRAPH ’87, ACM, pp. 17–24.
[Wes04] WEST J.: Respiratory Physiology: the essentials. Lip-pincott Williams & Wilkins, 2004.
[WMP∗06] WEYRICH T., MATUSIK W., PFISTER H., BICKEL
B., DONNER C., TU C., MCANDLESS J., LEE J., NGAN A.,JENSEN H. W., GROSS M.: Analysis of human faces using ameasurement-based skin reflectance model. In ACM SIGGRAPH
2006 Papers (New York, NY, USA, 2006), SIGGRAPH ’06,ACM, pp. 1013–1024.
[YW07] YAMADA T., WATANABE T.: Virtual facial image syn-thesis with facial color enhancement and expression under emo-tional change of anger. In 16th IEEE International Conferenceon Robot & Human Interactive Communication, pp. 49–54.
[ZCCD06] ZORDAN V. B., CELLY B., CHIU B., DILORENZO
P. C.: Breathe easy: model and control of human respiration forcomputer animation. Graphical Models 68 (March 2006), 113–132.
c© The Eurographics Association 2011.