a data logger for monitoring maternal vital signs during
TRANSCRIPT

UNIVERSITY OF NAIROBI
SCHOOL OF COMPUTING AND INFORMATICS
A DATA LOGGER FOR MONITORING
MATERNAL VITAL SIGNS DURING LABOUR
BY: KENNEDY ABWAO OGENDO
REG. NO. P51/65174/2013
SUPERVISOR: PROF. PETER. W. WAGACHA
JULY, 2019
A RESEARCH PROJECT PROPOSAL SUBMITTED IN PARTIAL FULFILLMENT OF THE
REQUIREMENTS FOR THE AWARD OF THE DEGREE OF MASTER OF SCIENCE IN
APPLIED COMPUTING OF THE UNIVERSITY OF NAIROBI


i
DECLARATION
This thesis report is my own work and has not been presented for any degree award in any other
university or institution of higher learning.
Signature Date
Kennedy Abwao Ogendo
School of Computing and Informatics
University of Nairobi
This thesis report has been submitted for examination with my approval as the university appointed
supervisor.
Signature Date
Prof Peter W. Wagacha
School of Computing and Informatics
University of Nairobi

ii
DEDICATION
To our mothers. We salute you.
To all the women who are mothers and mothers to be.
We take our hats off to all those mothers who did not make it.
Our hearts go to their families and friends
I tip my hat to all the men and women doing research work to improve maternal care

iii
ACKNOWLEDGEMENTS
With profound gratitude I acknowledge my supervisor Professor Peter W. Wagacha for the support
and guidance he gave towards the completion of this project research thesis. I appreciate the patience,
knowledge and encouragement he accorded to me through this journey far beyond his call of duty. I
would also like to thank the University of Nairobi School of Informatics and Computing for their
support and direction particularly the non-teaching staff and my fellow students.
I acknowledge the support and inputs I got from Kenyatta National Hospital and Mbagathi Hospital
towards this research. I acknowledge the staff at the University of Nairobi, Science and Technology
Park Maker Space for their feedback and inputs towards this research.
Finally, I acknowledge the support and encouragement I received for my family and friends.

iv
ABSTRACT
Worldwide, maternal morbidity and mortality remains high with an estimated 830 women dying daily
from preventable complications associate with pregnancy, with most of these cases occur in
developing countries (WHO, 2017). The partograph has been recommend as a tool for use to help
monitor labour progress to mitigate these risks. Nevertheless, completion of the partographs has
proved to be evasive due to factors such as; staff shortage, inadequate training of staff and lack of
supplies to monitor labour among others. These factors have thus resulted in a maternal mortality rate
of 510 death for every 100,000 births in Kenya which is very high compared to the global ratio of
216 deaths for every 100,000.
In an effort to reduce maternal morbidity and mortality, this research seeks to study the current
interventions used to mitigate maternal morbidity and mortality during the labour process and develop
solutions around these findings.
Progress has been made in the area of maternal healthcare with an aim to reduce maternal mortality,
related works that have been done before include; The partopen which is a digital pen used to fill a
partograph form and is capable of giving time-based reminder with decision support. A second
solution is the e-partogram. This is a monitoring and decision support electronic version of the
partograph which focuses on connecting peripheral level providers to a central level supervisor.
mlabour is another solution based on a mobile application which envelops an electronic partograph
into workflows for recording patient details, updating and resolving maternal issues.
To develop the prototype, an awareness of the problem was studied with the use of secondary data.
Tools used for measurement, under-staffing and overcrowding will be investigated with the help of
questionnaires. We then built our prototype informed by the information collected. The prototype
comprised of two main parts; the hardware which will be responsible for collection of the maternal
vital signs, processing of the data and relaying it to the server which is the second part of the
prototype. The server will be responsible for the storage of data received from the hardware as well
as receiving and process request from a user.
The design of the prototype involved the selection of the resources to be used based on local
availability. Once the resources were obtained the prototype was broken down to module and unit

v
tests carried out to test for correct functionality, after which the modules were integrated.
Partograph completion level was show to be less than 40%. Foetal heart rate and cervical dilation
had the highest completion rate while urinalysis, moulding and amniotic fluid had the lowest.
The prototype would be useful in assisting nurses fill their partographs by recording vitals that a
normally neglected or minimally recorded resulting in a better completion rate
Further work needs to be done to monitor foetal conditions as our study focused on maternal
condition. Additionally, sharing of information among health facilities would further improve care.

vi
Table of Contents
ABSTRACT ........................................................................................................................................ iv
LIST OF FIGURES .......................................................................................................................... viii LIST OF TABLES .............................................................................................................................. ix DEFINITION OF TERMS ................................................................................................................... x LIST OF ABBREVIATIONS .............................................................................................................. xi 1 INTRODUCTION ...................................................................................................................... 1
1.1 BACKGROUND ....................................................................................................................... 1 1.1.1 KEY CHALLENGES IN MATERNAL HEALTHCARE ......................................... 1
1.1.2 USE OF INFORMATION COMMUNICATION TECHNOLOGY (ICT) IN
HEALTHCARE …………………………………………………………………….…2 1.2 PROBLEM STATEMENT ........................................................................................................ 3
1.3 RESEARCH GAP ..................................................................................................................... 4 1.4 RESEARCH OBJECTIVES ..................................................................................................... 5
1.5 RESEARCH QUESTIONS ....................................................................................................... 5 1.6 SCOPE ...................................................................................................................................... 6 1.7 JUSTIFICATION ...................................................................................................................... 6
2 LITERATURE REVIEW ........................................................................................................... 7
2.1 LABOUR AND ITS PROCESSES ........................................................................................... 7 2.1.1 INTRODUCTION...................................................................................................... 7
2.1.2 MONITORED VITAL SIGNS ................................................................................... 7 2.2 PARTOGRAPH ......................................................................................................................... 8
2.2.1 INTRODUCTION...................................................................................................... 8
2.2.2 FILLING THE PARTOGRAPH ................................................................................ 9 2.3 RELATED WORKS ................................................................................................................ 12
2.3.1 PARTOPEN .............................................................................................................. 12 2.3.2 EPARTOGRAM ....................................................................................................... 12
2.3.3 MLABOUR .............................................................................................................. 14 2.4 FRAMEWORK ....................................................................................................................... 15
3 RESEARCH METHODOLOGY ............................................................................................. 17 3.1 INTRODUCTION ................................................................................................................... 17
3.2 AWARENESS OF THE PROBLEM ....................................................................................... 17 3.3 SUGGESTIONS ...................................................................................................................... 18 3.4 DEVELOPMENT ................................................................................................................... 20 3.5 EVALUATION ........................................................................................................................ 21 3.6 ETHICAL CONSIDERATIONS ............................................................................................. 22
4 PROTOTYPE DESIGN AND ANALYSIS .............................................................................. 23 4.1 PARTOGRAPH USE IN HEALTH FACILITIES .................................................................. 23
4.2 PROTOTYPE DESCRIPTION ............................................................................................... 24 4.2.1 TECHNOLOGIES ....................................................................................................... 25
4.2.1.1 ARDUINO ....................................................................................................... 25 4.2.1.2 SENSORS ....................................................................................................... 26 4.2.1.3 COMMUNICATION MODULE .................................................................... 26
4.2.1.4 MYSQL DATABASE ..................................................................................... 27 4.2.1.5 HTML AND PHP ......................................................................................... 27
4.3 PROTOTYPE DESIGN .......................................................................................................... 27 4.3.1 HARDWARE ............................................................................................................... 27
4.3.1.1 PROCESSING UNIT (ARDUINO) ................................................................ 27

vii
4.3.1.2 BLOOD PRESSURE AND HEART RATE MEASUREMENTS ............... 28
4.3.1.3 TEMPERATURE MEASUREMENT .......................................................... 31 4.3.1.4 URINE VOLUME MEASUREMENT ........................................................ 31
4.3.1.5 CONTRACTIONS ....................................................................................... 32 4.3.1.6 COMMUNICATION MODULE ................................................................. 33
4.3.2 SOFTWARE ................................................................................................................ 35 4.3.2.1 FRONT-END ............................................................................................... 35 4.3.2.2 BACK-END ................................................................................................. 37
4.4 TESTING AND EVALUATION ............................................................................................. 37 4.4.1 UNIT TEST ................................................................................................................. 38
4.4.1.1 BLOOD PRESSURE AND HEART RATE .................................................... 38 4.4.1.2 TEMPERATURE ......................................................................................... 41 4.4.1.3 URINE ......................................................................................................... 43
4.4.1.4 CONTRACTIONS ....................................................................................... 44
4.4.1.5 COMMUNICATION MODULE ................................................................. 44
4.4.1.6 PATIENT’S PARTICULARS ....................................................................... 45 4.4.1.7 PATIENT RECORD ..................................................................................... 45
4.4.2 INTEGRATION TEST ............................................................................................. 46 4.5 RESULT AND ANALYSIS ..................................................................................................... 46
5 CONCLUSION AND RECOMMENDATION .............................................................................. 49 5.1 HOW OBJECTIVES WERE ACHIEVED ............................................................................. 49
5.1.1 TO INVESTIGATE EXISTING SOLUTION AND HOW THEY ARE USED ......... 49 5.1.2 TO DEVELOP A PROTOTYPE OF THE DATALOGGER ....................................... 49 5.1.3 EVALUATE THE SYSTEM ....................................................................................... 50
5.2 CONTRIBUTION OF THE STUDY .................................................................................. 50 5.3 STUDY LIMITATIONS .......................................................................................................... 51
5.4 RECOMMENDATION AND FURTHER WORK ................................................................. 51
REFERENCES................................................................................................................................... 53
APPENDICES ................................................................................................................................... 57 APPENDIX A: CONFIDENTIALITY AGREEMENT FORM .................................................... 57 APPENDIX B: INFORMED CONSENT NOTE ......................................................................... 58
APPENDIX C: CONSENT FORM ............................................................................................... 60
APPENDIX D: QUESTIONNAIRE ............................................................................................. 61

viii
LIST OF FIGURES
Figure 1: The modified WHO paragraph ........................................................................................... 11
Figure 2: Epartogram ......................................................................................................................... 14
Figure 3: Conceptual Model .............................................................................................................. 16
Figure 4: Block diagram of datalogger .............................................................................................. 25
Figure 5: An arduino mega board ...................................................................................................... 28
Figure 6: U80EH automatic blood pressure monitor ......................................................................... 29
Figure 7: U80EH automatic blood pressure monitor debug pins ....................................................... 30
Figure 8: blood pressure monitor connected to an arduino mega ...................................................... 30
Figure 9: Temperature module circuit ................................................................................................ 31
Figure 10: Urine volume module circuit ............................................................................................ 32
Figure 11: Contractions simulation circuit ......................................................................................... 33
Figure 12: WIFI module pinout ......................................................................................................... 34
Figure 13: WIFI module circuit ......................................................................................................... 35
Figure 14: New patient entry particulars ............................................................................................ 36
Figure 15: Sample patient record output ............................................................................................ 37
Figure 16: blood pressure monitor test code ...................................................................................... 39
Figure 17: Binary output from the blood pressure monitor ............................................................... 40
Figure 18: Test result serial output ..................................................................................................... 41
Figure 19: Prototype temperature test output ..................................................................................... 42
Figure 20: Commercial thermometer output ...................................................................................... 42
Figure 21: Urine volume sensor serial output .................................................................................... 43
Figure 22: Serial output of wifi module ............................................................................................. 45
Figure 23: Serial output the integrated hardware module .................................................................. 46

ix
LIST OF TABLES
Table 1: vitals and their sensors ......................................................................................................... 26
Table 2: partograph completion rate .................................................................................................. 47

x
DEFINITION OF TERMS
systolic blood
pressure
Minimum blood pressure in between two heartbeats
Eclampsia Convulsions occurring in a pregnant or puerperal woman, associated with
preeclampsia, i.e., with hypertension, proteinuria, or edema
Effacement The taking up or obliteration of the cervix in labour when it is so changed that only
the thin external os remains.
Hypertension
A persistent blood pressure of 140 mm Hg systolic or 90 mm Hg diastolic.
Labour The expulsion of conception through the vagina from the uterus
Meconium The first tool passed out by the foetus that is made up of ingested materials consumed
while in the uterus. These materials are the intestinal epithelial cells, amniotic fluid,
lanugo, bile, water and mucus.
systolic blood
pressure
Maximum blood pressure during one heartbeat

xi
LIST OF ABBREVIATIONS
AIDS Acquired Immunodeficiency Syndrome
EEPROM Electronically Erasable Programmable Read Only Memory
HIV Human Immunodeficiency Virus
HTML Hypertext Markup Language
ICT Information Communication Technology
IDE Integrated Development Environment
IP Internet Protocol
KNCHR Kenya National Commission on Human Rights
PCB Printed Circuit Board
RF Radio Frequency
SDG Sustainable Development Goal
SRAM Static Random Access Memory
UI User Interface
WHO World Health Organisation
Wi-Fi Wireless Fidelity


1
1 INTRODUCTION
1.1 BACKGROUND
1.1.1 KEY CHALLENGES IN MATERNAL HEALTHCARE
An estimated 830 women died daily from preventable difficulty associated with pregnancy in 2015
of which a majority occurred in developing countries (WHO, 2017). Statistics from the same report
also shows that Kenya’s maternal mortality stood at 510 deaths for every 100,000 live births, well
above the global maternal mortality ratio of 216 deaths for every 100,000 which in turn is well above
the Sustainable Development Goals (SDGs) aim of 70 deaths for every 100,000 by 2030 (United
Nations, 2017).
Approximately 99% of recorded maternal deaths occur in developing counties. Blood pressure that
is high while pregnant (pre-eclampsia and eclampsia), bleeding excessively, infections (usually after
childbirth), delivery difficulties and hazarders abortions are the major complication credited for
approximately three quarters of maternal deaths. The remaining 25% result from or are associated
with diseases like malaria and Human Immunodeficiency virus (HIV) / Acquired Immunodeficiency
syndrome AIDS. Other factors adding to this statistic are the inability of some women to receive and
seek care during labour due to; distance, lack of information, poverty, inadequate services and cultural
practices (WHO, 2016).
In a study carried out across nine healthcare facilities in private, public and faith-based facilities
ranging from a centre of health to tertiary hospital in four Kenyan provinces found that, low correct
filling of the partograph which was blamed on the staff shortage within these facilities. In facilities
where these tools where in use, records were incomplete with a 30% to 80% recording of
contraction, 53% to 90% foetal heart rate recording and 70% to 97% cervical dilation recording.
Minimal recording or documentation was done for the condition of the liquor, skull moulding and
descent of the head as well as maternal parameters such as heart rate, blood pressure and urine
composition. To worsen this situation, equipment for labour progress monitoring such as fetoscopes
and blood pressure machines were in limited supply and some of those available were out of order
(Qureshi et.al, 2010). This poor usage of the partograph was a result of shortage of staff,
minimal/inadequate training and lacking of knowledge particularly with regards to interpreting
findings, complexity of the form, negative attitudes, disputes among healthcare providers as to their

2
part in filling the form, and lack of role modelling by senior staff regarding the use, encouragement
and application of the form (Qureshi et.al, 2010; Underwood, 2012). This poor use of the
partograph is reflected in other hospitals in developing countries such as South Africa, Ethiopia and
Nigeria with similar shortcoming recorded (Maphasha et al., 2017; Masika et al., 2015; Okokon et
al., 2014; Ollerhead and Osrin, 2014; Yisma E et al. 2013).
A second study showed that in Kenya’s public health facilities providing delivery services only 36%
had the bare minimum delivery infrastructure and equipment with remote and low-level facilities
being poorly equipped. This infrastructure challenge in some hospitals is further complicated with
the free maternal care offered by the government of Kenya thus resulting in; an increase in mothers
well beyond the capacity of the maternity wards, mothers being required to vacate the facility earlier
so as to create room for new arrivals as well as delivery on the hospital floors due to insufficient
number of beds. Nurses are also overburdened, with almost all working extra-time and as much as 3
nurses assisting 20 to 49 mothers at one time (Bourbonnais, 2013; Underwood et al., 2012; Qureshi
et.al, 2010).
With challenges as these being commonplace particularly in developing counties, the WHO endorses
the used of partograph as an effective and affordable intervention tool for labour monitoring that if
used properly could provide decision support to midwives by enabling them in detection emerging
labour complications. This would prove beneficial more so in rural clinics with limited equipment,
where the partograph can assist in early detection of complications giving health worked time to
transfer the patient to a higher-level facility capable of handling these complications.
1.1.2 USE OF INFORMATION COMMUNICATION
TECHNOLOGY (ICT) IN HEALTHCARE
There being an increase in use of information technology over the last decades and a half, more and
more utilization of ICT in healthcare has been used to mitigate challenges facing the health system.
Devices such as smart phones and tablets are starting to take the place of traditional monitoring and
recording systems. Technology has also contributed to services being taken out of the health centres
and into portable devices. Some of the impact of ICT on healthcare include increased accessibility,
reduced cost of care, improved quality of care and increased education on health-related matters
(Rudowski, 2008). However, various gaps can be seen in the maternal and child care sector as stated

3
above, these include a high mortality rate, limited infrastructures and human resources, poor service
delivery, poor communication among health providers, limited knowledge on use of existing tools
among others.
Some of the uses of ICT in health include; the electronic health record that is a central and productive
tool in the retrieval of patient details as well as a health tool for data and population, mhealth which
is a mobile healthcare device that enable healthcare providers and patients look at the healthcare
processes on the go, telemedicine or telehealth is a tool that utilizes telecommunication technologies
for remote diagnosis and treatment, Self-service kiosks for assisting hospital administrators check-in
patients as well as payment for services, genome sequencing focuses on order of deoxyribonucleic
acid (DNA) as well as diseases related to it, wireless communication with secure protocol for
transmitting data within the hospital such as lab test, sensors and wearable technology such as heart
rate monitor watches among others.
Some example of field use of these technologies includes home monitoring and telemedicine for the
elderly. The system is applied in diseases such as cardiac failure, hypertension and diabetes and has
been shown to assist in reducing the cost of healthcare by transmission of patient data over cellular
networks (Rudowski, 2008). Apart from solving the poverty problem, the solution also looks into
solving the problem of distance from a health centre. Transmission of ECG signals from the
ambulance to invasive cardiology centre resulting in improved acute coronary syndrome diagnosis.
(Rudowski, 2008). Teleradiology were images are transmitted to a location where radiologist on duty
is available. Mobile phones and specialized tablets are also utilized as periodic reminder devices in
busy facilities as well as for data entry and communication among healthcare providers
1.2 PROBLEM STATEMENT
With 830 women dying of pregnancy related complication daily in 2015 and 216 deaths for every
100,000 live births globally and a target reduction of maternal associated death to 70 deaths for every
100,000 live births by 2030 (WHO, 2017; United Nations, 2017), the WHO is in the forefront of
endorses the used of partograph as an effective and affordable intervention tool for labour monitoring.
However, this has been difficult to implement particularly in developing countries with high ratio of
maternal mortality.
In developing countries including Kenya several challenges have played a role in the difficulty

4
encountered in the correct or complete use of the partograph as an intervention tool. These challenges
include; shortage of staff and overburdened staff particularly in public facilities (which are further
worsened with the introduction of free maternal healthcare provided by the Kenyan government),
inadequate training and inability to interpret findings, complexity of the form, social factors and a
shortage of labour monitoring equipment or no functional equipment.
Several technology-based solutions have been done in an effort to enhance the monitoring of labour
progress with limited success. These solutions used time-based reminders that required the caregiver
to attend to the patient of which in some cases was not possible due some of the challenges mentioned
above such as staff shortages, inadequate training and form complexity.
This lack of proper monitoring of labour progress occasionally results in pregnancy related
complication that may have been acted upon before the condition became critical or life threatening
resulting in emergency actions which may include transfer of a mother to a higher-level hospital with
the necessary equipment to handle the emergency.
Thus, this research study will seek to look at how we can leverage the use of microcontrollers and
sensors technologies to achieve periodic data logging of maternal vital signs hence facilitating a
higher completion rate of partographs by nurses enabling a better decision support system.
1.3 RESEARCH GAP
Several steps have been taken to decrease maternal morbidity and mortality, one mitigating solution
is the utilization of the partograph a paper-based system for observing labour progress in which the
caregiver periodically records the mother’s and foetus’ vitals. Interpreting of this tool has proved to
be difficult in areas with caregivers who have limited knowledge of how to reading the partograph
particularly in identifying emerging complications that may be developing.
To mitigate the challenge of limited skill level in using and interpreting the partograph, electronic
solutions such as the partopen and e-partographs which serve as a training tool and an electronic
based time reminder with decision support.
These tools have focused on solving various gaps found in maternal care which include monitoring
of the vitals of both the mother and foetus and identifying developing problems. Providing decision

5
support to the caregivers and a training tool as well as using time-based reminders for periodic reading
of these vitals.
Nevertheless, some gap in maternal care still exist. The gaps we are addressing are those of the time
and human resource. Overcrowding in public facilities and understaffing makes it very challenging
for caregivers to effectively monitor labour progress of all the mothers and within the specified
periods that they need to be carried out in. Thus, this research seeks look at the possibility of
automating the measuring and logging of maternal vital signs during the labour process and retrieval
of these data to assist in the completion of a partograph as well as decision support. This would
contribute to the efforts of mitigating maternal mortality during labour by leveraging information
communication technology (ICT) in maternal care.
1.4 RESEARCH OBJECTIVES
The key objective of this research is to study how technology can be leverage to improve maternal
healthcare.
The following are this research’s specific objectives:
• To review interventions that can decrease maternal mortality and morbidity
• To investigate existing solutions and how they are used.
• To develop a prototype of the data logger.
◦ Integrate the various modules and microcontroller into one unit
◦ To develop a software interface for data storage and retrieval
◦ interface the data logger with the server
• Evaluate the system
1.5 RESEARCH QUESTIONS
• What activities are performed to ensure the best maternal care?
• How are maternal vital sign data monitored?
• How can ICT, microcontroller and sensor technologies be used to design a maternal
vital sign monitoring?
• How does our solution compare to existing maternal vital sign monitoring solutions?

6
1.6 SCOPE
This research study will be limited to the following:
• Investigating and demonstrating whether and how microcontrollers and sensors can be used
as a tool for collecting maternal vital signs
• Investigating existing tools used in hospitals in Kenya to measure maternal vital signs
• Designing and fabricating of a hardware prototype of the data logging solution.
◦ The Data logger will focus on maternal vital signs alone
• Designing and implementing of the software that will capture and store the maternal vital
signs.
1.7 JUSTIFICATION
This study seeks to enhance healthcare provided to expectant mothers by providing an auxiliary
system for nurses and midwives by assisting them to record maternal vital signs. This service would
result in a better completion rate of partographs forms thus better services in that complications can
be detected early enough and appropriate action taken.
The process of completion of the partograph will be done through the use of information
communication technology (ICT) to read data from the various sensors interpreted them to human
readable information, storing them on a server and avail them to the health worker when requested.
The successful use of ICT in this research could in turn encourage policies that favour the use of new
and innovative technology in the field of maternal care opening the door to more innovative solution
on ICT and automation that will improve efficiency in service delivery as well as cut cost of hiring
extra staff and enabling the staff to perform other critical duties.

7
2 LITERATURE REVIEW
2.1 LABOUR AND ITS PROCESSES
2.1.1 INTRODUCTION
The Dorland's medical dictionary (2012) defines labour as the function of the female organism by
which the product of conception is expelled from the uterus through the vagina to the outside world.
The dictionary also divides the process of labour into four stages as explained:
• The first stage begins with regular contractions of the uterine and ends with the full dilation
of the os uteri.
• The second stage two begins at the completion of stage one all the way to the expulsion of the
infant.
• The third stage begins at the completion of stage two and ends at the expulsion of the placenta
and membranes.
• Stage four is the period after delivery which lasts an hour or two, in which the uterine tone is
established. The goal of this stage is to stop any profuse bleeding from the uterine atony
(failure of the uterus to contract) and the cervical or vaginal lacerations.
2.1.2 MONITORED VITAL SIGNS
During labour, foetal assessments are performed to ensure that the foetal is well as well as detecting
any signs that may indicate. The primary foetal assessments include the foetal heart rate (FHR) and
patterns and character of the amniotic fluid. Irregularities in these assessments may be associated with
abnormal foetal gas exchange and infection. FHR is assessed every hour during latent phase, half
hourly during active phase and transition and quarter hourly during the second stage (Murray &
McKinney, 2005).
Maternal assessments include monitoring of contractions, labour progress and vital signs. Labour
progress is assessed to determine cervical dilation and effacement and foetal descent. Monitored
maternal vital signs include blood pressure, heartbeat, temperature and respiration. Common values
for these are; temperature 35.8°-37.3° C, heartbeat 60-100/min, respiration 12-20/min and blood
pressure near baseline levels established during pregnancy. These signs are observed to identify the

8
start of hypertension and infection. The hypertension is in some cases a disorder specific to pregnancy
or may be chronic, temperature of 38° C (100.4° F) and higher imply infection (Murray & McKinney,
2005). Temperature is taken after 4 hours and after 2 hours after membranes rupture or if elevated.
While blood pressure, pulse and respiration are taken every hour (Murray & McKinney, 2005).
2.2 PARTOGRAPH
2.2.1 INTRODUCTION
Yisma E et al. (2013, pp 2) defines a partograph as a single page paper form that contains information
about heart rate of the foetus, contraction of the uterine, drugs given and other important factors that
could minimize descriptive notes. The partograph is a useful tool when used in a active labour ward
with a large number of cases, but a small number of healthcare providers to screen for irregular labour.
The partograph’s use removes the repeated recording of labour events. The tool enables the
determination of deviations from normal labour progress, and assists in an intervention that is timely
and proven.
The partograph is divided into 3 main parts:
• Foetal Condition: heart rate of the foetus, status of the amniotic fluid & moulding
• Progress of labour: cervical dilation, descent of the foetal head & uterine contractions
• Maternal condition: Heartbeat, blood pressure, temperature, urine, oxytocin & drugs given
The first WHO partograph covered the latent and active phases of labour. The latent phase covered a
time period of 8 hours and the active phase began with a 3 cm dilatated of the cervix. The active phase
sits between the alert line and an action line. These lines are drawn 4 hours apart on the partograph.
This partograph’s used the principal that cervical dilation should be less than 1 cm/hour in the active
labour (WHO, 1994). The modified WHO partograph was introduced to eliminate the disadvantages
found in the first partograph. These modifications included few prolonged latent phases which was
not usually associated with poor perinatal outcome and differentiating between the latent phase and
false labour (Yisma E et al. 2013). The modified partograph does away with the latent phase and
indicates 4 cm dilatation of the cervix instead of 3 cm as the beginning of the active phase.
Fistula Care (2011) lists benefits of the quality of service with proper partograph use that include
enhance communication among providers, increase interaction between providers and the labouring

9
women, promote continuity of care across providers, and encourage teamwork.
2.2.2 FILLING THE PARTOGRAPH
Use of partograph begins in the active phase of labour. This is when the mother has regular contraction
and the cervix is 4cm or more dilated. The main readings are the Cervix dilation, the descent of the
head and hours in labour.
Patient information is filled at the top this are:
• The name of the patient
• gravida: The number of times the mother has been pregnant including those not carried to the
end and the present pregnancy
• para: The number of above 24-week births (both viable and non-viable e.g. stillbirths). These
are separated with a ‘+’ sign for example 2+0 would be 2 viable and no non-viable
• Hospital number
• Admission date
• Admission time
• Time of ruptured membrane or time elapsed since rupture of membrane
Foetal heart rate would be recorded every 30 minutes. Reading would usually be taken using a foetal
doppler. To use this apparatus gel is usually placed on the mother’s stomach beforehand for ease of
instrument movement and comfort and the doppler apparatus moved across the stomach as the
healthcare giver locates the foetal heartbeat which would be displayed on the screen of the device.
Another tool used in conjunction with a watch or clock is a foetal scope that is placed on the mother’s
stomach and the foetus’s heartbeat timed.
Amniotic fluid colour is recorded at every virginal check-up and the table filled. ‘I’ indicates an intact
membrane, ‘R’ membrane is raptured. If membrane is raptured, we use ‘C’ to indicate clear fluid, ‘M’
to indicate meconium stained and ‘B’ to indicate blood stained
The extent to which the bones of the foetal skull are overlapping indicating the degree of compression
the head is subjected to as it passes through the birth canal is referred to as moulding. Entry of
moulding on the partograph is one using a scale from 0 to +1. ‘0’ indicates no moulding, ‘+1’ indicates
that the bones are just touching each other, ‘+2’ indicated overlapping bones that are easily separated
using finger pressure and ‘+3’ indicates overlapping bones that cannot be separated easily with finger

10
pressure.
Cervix dilation are recorded after 4 hours and marked with an ‘X’. The first plot is placed on the alert
line. The action line is 4 hours away and parallel to the alert line. If labour progress is not following
the expected course and the plot begins to approaches the action line, it would signal the need for
action to be taken such as referrals before the action line is crossed. To record Cervix dilation, a
vaginal examination is done by the caregiver.
Descent of the baby’s head is done at the same time as the vaginal examination and marked with an
‘O’ on the graph. This is assessed by abdominal palpation.
Hours in Labour and the time are recorded with the aid of a clock or watch.
Contractions are recorded every 30 minutes. This is done by counting the number of contractions
within a 10-minute time period and record their length in seconds. For contractions count below 20
seconds dots are used to indicate this, for contractions between 20 and 40 seconds diagonal lines are
used and if contractions last more than 40 seconds blacked out boxes are used.
If oxytocin is being used, the amount used is recorded as well as the volume of intravenous fluid it
has been added to. The drops per minutes are recorded at the start and after every 30 minutes. Addition
drugs given are recorded in their table
The mother’s pulse is recorded half hourly and marked with a dot. Her blood pressure is measured
after 4 hours and marked with an arrow. The readings are usually measured with a digital blood
pressure machine which gives readings of blood pressure and pulse rate on their display. Alternatively,
a stethoscope and a mercury-based blood pressure machine are used.
The mother’s temperature is recorded every 2 hours. This reading is done using either a contact based
or none contact-based thermometer.
Urine samples are collected and volume passed measured and test for protein and acetone content
performed. Time urine was passed is also recorded.

11
Figure 1: The modified WHO paragraph

12
2.3 RELATED WORKS
Several works of research and innovations have been done in the domain of maternal health utilising
information communication technology (ICT) some of those related to this particulate work are:
2.3.1 PARTOPEN
To mitigate the challenge of skill level requirement found in using the partograph, the partopen was
developed. The partopen is an electronic partograph solution usable as a training tool for medical
students as well as an electronic time-based reminder with decision support. Its instruction manual
are short audio recordings accessed by placing the pen on any of the text on the left side of the
partograph. The pen is used for data entry on to a standard WHO partograph. The working principle
of the pen is based on a Dot Position System which uses printed microdots arranged in specific
patterns enabling the pen to establish its placement on a form (Underwood H et al., 2012). The
electronic pen used to realise the Partopen solution includes a speaker for audio output, a microphone
for audio input, a standard audio headphone jack, memory storage up to 8gigabytes (equivalent to
audio recording of 800 hours), a small display, a rechargeable battery, and a micro-USB connector
for charging and data transfer.
2.3.2 EPARTOGRAM
The e-partogram (Saving Lives at Birth, 2011; jhpiego, 2009) is a handheld monitoring and decision
support electronic version of the partograph designed for peripheral level providers. The device
targeted the semi trained midwives. The e-partogram has feature contained in both the partograph and
the partopen. The e-partogram was designed to change the perception of healthcare workers with
respect to the partograph from being a burden on workflow to a helpful decision support tool.
The paper partograph was found to have various limitations that restricted its implementation. Some
of the findings included the difficulty in learning how to fill the form correctly and lack of feedback
thus failing to visualize the benefits to the user. The document was seen more as a recording device
as opposed to a decision support tool, it is tedious to fill, difficult to interpret in real time and time
consuming when obtaining all required measurements.
The challenges the e-partogram was looking to solve were:

13
• Provision of decision support
• Enable nurses to interpreter partographs easily
• Ease the process of data collection
• Better time management
Thus, the device enables efficient recording of labour, accurate determination of difficulties and a
faster process of making choices. A sensory module is also included to partly automate the data
collection process.
The design aim of the partogram was to make the device as easy as possible to use and interpret.
Some of the design decision were hinged on the fact that the mobile phone is a ubiquitous device
even in rural setting.
The e-partogram contains a telemedicine module that focus on connecting peripheral level providers
to a central level supervisor enabling them to get support and guidance. The device's networking
capacity is thanks to its communication module that utilises a sim card. The e-partogram also provides
the ability of telemedicine between the peripheral level providers with the central level provider. With
the devices networked the supervisor is able to monitored labour progresses with data transmitted to
a web-server from the device and take action on problematic cases when they arise. The device also
has an optional sensor belt that measure uterine contractions and can transmit text message data using
a cell phone network.

14
2.3.3 MLABOUR
Schweers M et al. (2016, pp 2) define mlabour as a mobile application which envelops an electronic
partograph into workflows for recording patient details, updating and resolving maternal issues. The
primary work screen of the application is a list of patients that updates per minute and sorts on
priority-bases
which include: when the next examination is, risk level of patient, manual flagging by nurses for
extra attention and if labour progress is progressing slow to the point of risk. Each patient’s major
demographic and personal information is summed up on a tile, with images representing
circumstances that are not usual: emergency during labour, history of high risk, examination overdue,
or user set flags. The mobile application contains four major workflows which are:
• Patient registration, which collects identification data, obstetric history and high-risk factor
screening.
Figure 2: Epartogram
Figure 17: Epartogram

15
• Record measurements, which are taken during an exam, this flow also includes information
on the next check-up and an alarm is set.
• Notes and Flags: These are an alternative for information not recorded in the record
measurement form which is more structured. A user is able to add or delete any tag showing
a patient’s need of special attention. Details of the status are captured in a free text field.
• Resolution of Post-labour: this includes two forms, one for record delivery and another for
recording transference to another doctor or facility
This digital solution of the partograph looked into improving on the standard partograph by increasing
efficiency by generating graph instead of drawing by hand, error reduction be ensuring necessary
measures are taken and validating measurements to expected range, increased usability by in-
cooperating colour, animation and sound resulting in better data presentation and emphasis on
abnormality.
2.4 FRAMEWORK
The works mentioned above were designed to meet various limitations encountered in the use of the
partograph. The partopen uses a reminding system to alert nurses on pending reading to be taken as
well as a training tool for medical students. The e-partogram contains feature found in both the
partopen and partograph. Apart from having an alert system the e-partogram focuses on data sharing
between peripheral level providers to central level supervisor. The mlabour is a simplified digital
version of the partograph for use in mobile phone with features that assisting the midwife identify
risks and slow labour progress.
These solutions require that the midwife periodically attend to a mother and record all necessary
reading onto a physical or electronic partograph. Failure of which result in an incomplete partograph.
A study by Underwood H et.al (2012; 2013) has shown that reminders and alert have proved to be a
useful resource in the monitoring and management of mother during labour. The same study has also
shown that due to limited workforce in the labour ward, midwives are not always able to attend to
patients on a periodic basic (Qureshi et.al, 2010) has also shown that maternal vital signs are
minimally recorded. This research seeks to file this gap caused by under-staffing and overcrowding
by leveraging ICT, microcontrollers and sensors in implement a data logging solution for vital signs
monitoring to assist nurses and midwives perform their duties through periodic measurements of
blood pressure, respiration, heartbeat and temperature of mothers in labour.

16
The proposed solution will have two major part; hardware and software. The hardware potion will
constitute of various sensors for collecting vital signs, microcontroller for processing data from the
sensors and a communication module for transmitting the data to a central server on which we will
have a software for receiving the data from the hardware and compiling this into information that is
useful to the nurses thus enabling them provide better service to mothers.
Figure 3: Conceptual Model
Figure 31: Conceptual Model
Figure 32: Conceptual Model
Figure 33: Conceptual Model
Figure 34: Conceptual Model
Figure 35: Conceptual Model
Figure 36: Conceptual Model
Figure 37: Conceptual Model
Figure 3: Conceptual Model
Figure 38: Conceptual Model
Figure 39: Conceptual Model
Figure 40: Conceptual Model
Logging, processing
and presenting of
sensor data
Logging, processing
and presenting of
sensor data
Logging, processing
and presenting of
sensor data
Logging, processing
and presenting of
sensor data
Logging, processing
and presenting of
sensor data
Logging, processing
and presenting of
sensor data
Logging, processing
and presenting of
sensor data
Logging, processing
and presenting of
sensor data
Maternal vital
signs measurement
Maternal vital
signs measurement
Maternal vital
signs measurement
Maternal vital
signs measurement
Maternal vital
signs measurement
Maternal vital
signs measurement
Maternal vital
signs measurement
Maternal vital
signs measurement
Maternal vital
signs measurement
Maternal vital
signs measurement
Maternal vital
signs measurement
Maternal vital
signs measurement
Maternal vital
Enhances maternal
care monitoring
Enhances maternal
care monitoring
Enhances maternal
care monitoring
Enhances maternal
care monitoring
Enhances maternal
care monitoring
Enhances maternal
care monitoring
Enhances maternal
care monitoring
Enhances maternal
care monitoring
Enhances maternal
care monitoring
Enhances maternal
care monitoring
Enhances maternal
care monitoring
Enhances maternal
care monitoring
Enhances maternal
Mothers have
better health
outcome
Mothers have
better health
outcome
Mothers have
better health
outcome
Mothers have
better health
outcome
Mothers have
better health
outcome
Mothers have
better health
outcome
Mothers have
better health
outcome
Mothers have

17
3 RESEARCH METHODOLOGY
3.1 INTRODUCTION
Design and creation research strategy was utilized as our research focuses on using technology in the
development of a maternal vital sign data logger device.
Our study used an iterative process with five steps: knowing about the problem, proposing a solution,
developing the solution, evaluation the solution and drawing conclusions (Vaishnavi & Kuechler,
2004).
Thus, the research study was organised as follows:
• Awareness of the problem
• Suggestion
• Development
• Evaluation
• Conclusion
3.2 AWARENESS OF THE PROBLEM
To get an understanding of the problem involved investigating the current condition within labour
wards in health facilities including current interventions. This would involve interaction with nurses
and midwives with the use of questionnaires, observation as well as looking at previously conducted
researches. The objective here was to bring to light:
• Partograph completion rate
• Tools used for measurement
• How measurements are obtained
• Skills of caregiver
• Human resource - Overcrowding and under-staffing
Collection of data within any health facility in Kenya follows a strict protocol procedure. This

18
required the submission of our letter of approval from the school, a research protocol and
questionnaire to the ethical board for consideration (See appendix D).
Once all requirements are met and approvals granted, we were required to brief all participants on the
research and its’ objective as well as to ensure the confidentiality of the information collected (See
appendices A, B and C)
Our Questionnaire was designed to collect data that gave us information on:
• Communication among the healthcare givers within a facility
• Communication among different facilities
• Skill level of the healthcare giver
• Availability of partographs
• Completion rate of the partograph
• Time management
A pilot of the questionnaire will be conducted to enhance reliability of the data collection tool. This
will be conducted among 10 -15 randomly selected potential as well as gathering expert opinions. A
final questionnaire will then be produced for this study.
Collection of measurement and tools used to take these measurements was done via observation as
well as use of secondary data from other sources.
As mentioned above all correspondents were briefed on the research and what is expected of them as
participants in the research. Our main target group for this research were those persons who work
closely with the partograph, these include the midwives, nurses in labour wards and obstetricians.
3.3 SUGGESTIONS
Review of literature showed that 830 women died of complication related to pregnancy daily in 2015
and 216 died for every 100,000 live births globally (WHO, 2017), the WHO is in the forefront of
promoting the use of the partograph as an effective and affordable intervention tool for labour
progress checking. However, this has been difficult to implement particularly in developing countries
with high ratio of maternal mortality.

19
Several challenges have played a role in the difficulty encountered in the correct or complete use of
the partograph as an intervention tool in Kenya as well as other developing countries. These
challenges include; shortage of staff and overburdened staff particularly in public facilities (which
are further worsened with the introduction of free maternal services provided by the Kenyan
government), inadequate training and inability to interpret findings, complexity of the form, social
factors and a shortage of labour monitoring equipment or no functional equipment.
A number of technology-based solutions have been made in an effort to enhance the monitoring of
labour progress with success in various aspects of the partograph. These solutions used time-based
reminders that required the caregiver to attend to the patient of which in some cases was not possible
due some of the challenges mentioned above such as staff shortages, inadequate training and form
complexity.
Once these problems were identified through review of literature and data collection tools, a
suggestion on how to solve the problem was proposed. A digital data logger to automatically monitor
vital signs during labour process was seen to be the most viable option based on the information
collected. Preparation of what needs to be done to achieve our goal was then developed. This was
divided into 4 parts:
• Selecting the hardware components and relevant software
• Preparation of bill of materials
• Selection of software tools and supporting hardware
• Limitations of selections
The selection of hardware and software components was done on the basis of what was available
locally. Ease of use of components and technical expertise also played a major part on what
components were to be used. Once the components were identified information on the costing of each
component was sought for after which a budget was created. The software interface on the computer
side was then looked at, programming skill and operating system being used played a role on selection
of some of the software used. As mentioned above the limitations encountered include; technical skill,
availability of resource as well as time. Other limitation was on the basis of inability to record some
of the condition due to lack of resource and others that require a visual inspection.

20
3.4 DEVELOPMENT
An ideal solution would to one that records all entries required in the partograph analyse progress of
labour and automatically transfer the mother to a better health facility if complications are identified.
However, this would require a great amount of technical expertise, resources and time that we do not
have. Our proposed solution sought to implement some of the functions of an ideal solution. Hence
our solution will focus on automation of some patient information, maternal vitals and foetal heart
rate. This would be achieved by measurement of these entries and recording them into a digital storage
where they may be retrieved on request by authorized personnel.
The design of the maternal vital sign data logging prototype was guided by the conceptual model as
shown in Figure 3: Conceptual Model. The solution constitutes of two main modules which are the
software module and the hardware module.
Components that make up the prototype will be selected based on functionality required, availability,
ease of integration and expertise available. The next step is to develop the prototype device. This
involved:
• Circuit design
• Assembly of prototype modules
• Setting up of a local web-server
• Development of the user interface
• Software hardware integration
The hardware portion of the prototype was further sub-divided into the various data collecting
modules. Each of these modules require that a simple circuit be designed as well as writing it’s
accompanying firmware program that would be loaded onto the chosen controller. These modules
were:
• Blood pressure sensor
• Heart rate sensor
• Temperature sensor
• Fluid flow sensor

21
• Contraction sensor
• Foetal heart rate sensor
• Communication Module
• Computing module
Each of these modules would be individually tested after which they would be integrated into a single
system for an integration test and ensure that everything is working as expected.
A web-server would be chosen based on the server’s operating system, these would include a web-
server application, a database management system and a scripting language. The server will be used
to store data received from the hardware module via its communication module as well as having a
web-based user interface for users to communicate with the system. The user interface will enable
the user to see records in a familiar readable format as well as input data into the database.
The final step of development will be the integration of the various hardware sub-modules, the
software sub-modules and finally the hardware and software modules.
3.5 EVALUATION
To evaluate the prototype unit tests would be conducted on the various modules. For the hardware
modules each sensory sub-module would be tested individually as well as the communication sub-
module. This involved making sure that the sub-modules would functioning as expected and able to
give correct readings as well as communicate with a Wi-Fi router. Once proper working of the sub-
modules has been confirmed, the sub-modules would then be integrated into a final hardware
prototype and tested as a single unit for proper functionality.
For the software portion of the prototype. A web interface would be created and customised so us to
resemble a partograph form. It would then be tested on the various devices to check for correctness
of display. For the second sub-module a script would be used to store and retrieve data from the
database. Once proper working has been confirmed, it would be integrated to the web-server and data
retrieval and display to check for proper working. This included checking that data from the hardware
module were received correctly, user inputs were stored and processed correctly as well as correct
display of user requests.

22
The prototype would then be presented to random participants for their views on the device. These
participants include technical persons, those in the medical field and random persons
Findings from other related research work would be analysed and patterns deduced and compared to
our prototype.
3.6 ETHICAL CONSIDERATIONS
To conduct this research legal frameworks governing research activities typically require clearance
from the relevant authorization bodies such as Kenyatta National Hospital – University of Nairobi
Ethics and research committee (KNH-UoN ERC).

23
4 PROTOTYPE DESIGN AND ANALYSIS
The WHO endorses the used of partograph as an effective and affordable intervention tool for labour
management that if used properly could provide decision support to midwives by enabling them in
detection emerging labour complications. This would prove beneficial more so in rural clinics with
limited equipment, where the partograph can assist in early detection of complications giving health
worked time to transfer the patient to a higher-level facility capable of handling these complications.
The partograph is a paper-based system of monitoring labour progress where the health worker
manually records entries into the form for each individual patient they are attending to. The nurse is
then responsible for determining whether the labour is proceeding normally or complications may
arise and take any necessary action
4.1 PARTOGRAPH USE IN HEALTH FACILITIES
In a study in a sub county hospital in Kenya, where 177 partographs were analysed only 25.4% were
complete, 63.3% had their admission details complete, 84.2% had the mother’s name complete,
Cervical dilatation and descent were documented 74% and 54% respectively while the uterine
contraction was at 49.7% and blood pressure at 46.9%. Factors that hindered completeness were
workload, inefficient supervision, poor attitude, lack of motivation and supervision (Sigei, 2018).
In a second study across nine healthcare facilities partograph records were incomplete with a 30% to
80% recording of contraction, 53% to 90% foetal heart rate recording and 70% to 97% cervical
dilation recording. Minimal recording or documentation was done liquor state, skull moulding and
head descent as well as maternal parameters such as heartbeat, blood pressure and urinalysis. This
poor usage of the partograph was attributed to shortage of staff, minimal/inadequate training and
lacking of knowledge particularly with regards to interpreting findings, complexity of the form,
negative mind-set, conflict among providers pertaining to the filling of the form, and lack of role
modelling by senior staff with regards to utilization, promotion and application of the form (Qureshi
et.al, 2010)
In a third study to see the effects of free delivery services on partograph utilization at Naivasha district
hospital 88 partograph for the period July 2012 to December 2013 were assessed. Foetal heart rate
was filled between 72.7% and 83%, 70% to 85% has adequate information on monitoring of cervical

24
dilation, descent and uterine contractions, blood pressure was recorded between 64.8% to 71.6%.
Pulse was between 62.5% and 63.6%. Overall the completeness of partographs was less than 40%
(Maina, 2016)
Kenyatta national hospital was selected as the field of research. The target demography are nurses in
the labour ward and obstetricians. A questionnaire was developed as a data collection tools that will
be used for gathering additional data such as nurse patient ratio, measuring tools as well as patterns
and themes.
4.2 PROTOTYPE DESCRIPTION
An ideal solution would to one that records all entries required in the partograph analyse progress of
labour and automatically transfer the mother to a better health facility if complications are identified.
Our proposed solution sought to implement some of the functions of an ideal solution. They include
monitoring of some of the maternal conditions by measuring them and recording them into digital
storage where they can be retrieved when needed.
The design of the maternal vital sign data logging prototype was guided by the conceptual model as
shown in Figure 3. The solution constitutes of two main modules which are the software module and
the hardware module.
The prototype has two main modules as mentioned above. The main functions of the prototype are:
• To measure vitals of mother during labour
• Transmit the data to a web-server
• Store the measured data into a database
• Process queries on patient by health workers
The block diagram in figure 4 below visually describes these functions

25
Expectant mother’s
vital signs
Data logger
Vital sign records
Server
4.2.1 TECHNOLOGIES
This section describes the hardware and software technologies used for the implementation of our
prototype and their rational. The choice of hardware components was restricted to items that were
available locally as well as affordable
4.2.1.1 ARDUINO
The Arduino is an open source electronic hardware platform build around the 8bit and 32bit Atmel
microcontrollers. It is a platform used by both novices and experts can develop and test prototype
electronic project in a rapid manner. The platform comes with an integrated development environment
(IDE) developed in processing and an Arduino programming language based on wiring. The platform
also comes with a wide variety of libraries and supported hardware making prototyping simple.
The choice to use this platform was based on that we were familiar with the platform, its simplicity,
Figure 4: Block diagram of data logger
Figure 45: Block diagram of data logger
Figure 46: Block diagram of data logger
Figure 47: Block diagram of data logger
Figure 48: Block diagram of data logger
Figure 49: Block diagram of data logger
Figure 50: Block diagram of data logger
Figure 51: Block diagram of data logger
Figure 452: Block diagram of data logger
Figure 53: Block diagram of data logger
Figure 54: Block diagram of data logger
Temperature
sensor
Temperature
sensor
Temperature
sensor
Temperature
sensor
Temperature
sensor
Temperature
sensor
Temperature
sensor
Temperature
sensor
Temperature
sensor
Temperature
sensor
Temperature
sensor
Temperature
sensor
Temperature
sensor
Temperature
Urine
volume
Contractions
Contractions
Contractions
Contractions
Contractions
Contractions
Contractions
Contractions
Contractions
Contractions
Contractions
Contractions
Contractions
Contractions
Contractions
Contractions
Microcontroller
Computation and
conversion of
electric signals to
digital data
Communication
Module
Communication
Module
Communication
Module
Communication
Module
Communication
Module
Communication
Module
Communication
Module
Communication
Module
Communication
Module
Communication
Module
Communication
Module
Communication
Module
Communication
Module
Communication
Module
Communication
Module
Communication
Module
Database
(sensor readings)
Database
(sensor readings)
Database
(sensor readings)
Database
(sensor readings)
Database
(sensor readings)
Database
(sensor readings)
Database
(sensor readings)
Database
(sensor readings)
Database
(sensor readings)
Database
(sensor readings)
Database
(sensor readings)
Database
(sensor readings)
Database
(sensor readings)
Database
(sensor readings)
Database
(sensor readings)
Database
(sensor readings)
User Interface
(patient X vitals)
User Interface
(patient X vitals)
User Interface
(patient X vitals)
User Interface
(patient X vitals)
User Interface
(patient X vitals)
User Interface
(patient X vitals)
User Interface
(patient X vitals)
User Interface
(patient X vitals)
User Interface
(patient X vitals)
User Interface
(patient X vitals)
User Interface
(patient X vitals)
User Interface
(patient X vitals)
User Interface
(patient X vitals)
User Interface
(patient X vitals)
Pulse Rate
sensor
Pulse
Ratesensor
Pulse
Ratesensor
Pulse
Ratesensor
Pulse
Ratesensor
Pulse
Ratesensor
Pulse
Ratesensor
Pulse
Ratesensor
Pulse
Ratesensor
Pulse
Ratesensor
Pulse
Ratesensor
Pulse
Ratesensor
Pulse
Ratesensor
Pulse
Ratesensor
Pulse
Ratesensor
Blood Pressure
sensor
Blood Pressure
sensor
Blood Pressure
sensor
Blood Pressure
sensor
Blood Pressure
sensor
Blood Pressure
sensor
Blood Pressure
sensor
Blood Pressure
sensor
Blood Pressure
sensor
Blood Pressure
sensor
Blood Pressure
sensor
Blood Pressure
sensor
Blood Pressure
sensor
Blood Pressure
sensor

26
the low system requirements of the modules it used and that it had the necessary capability to perform
all the function required to develop the hardware potion of the prototype
4.2.1.2 SENSORS
A variety of sensors were looked at with regards to the vital signs selected to be monitored, these are
presented in table 1
Vital Sensor
Blood Pressure U80EH automatic blood pressure monitor
Heart rate U80EH automatic blood pressure monitor
Temperature DS18B20 temperature sensor
Urine Volume Flow meter
Contractions Push button
Table 1: vitals and their sensors
The U80EH automatic blood pressure monitor was selected for measuring blood pressure and heart
rate due to its availability in the local market as well as the ease of retrieving data from the device.
The device also reduced our work load by interpretation of the blood pressure and heartbeat signals
which was done by the device and their results simply sent to our controller for transmission.
4.2.1.3 COMMUNICATION MODULE
The communication module selected was the esp8266 module. This is a radio frequency (RF) module
that uses Wi-Fi protocol to communicate with other devices. The module was selected as the
communication device of choice due to its compatibility with the selected controller as well as its low
cost.

27
4.2.1.4 MYSQL DATABASE
MYSQL database was selected for the database management system for managing patient
data and their retrieval. It was selected due to its wide support and availability.
4.2.1.5 HTML AND PHP
Hypertext markup language (HTML) was used as the user interface (UI) and PHP was used to save
patient information as well as retrieve and display results from the database
4.3 PROTOTYPE DESIGN
As mentioned previously, the prototype constitutes of two main parts; the hardware and the software
modules that constitutes our prototype solution.
4.3.1 HARDWARE
This sub-section describes the components of the hardware module and their circuit diagrams.
Software used to achieve this were gimp which is an image manipulating software and eagle which
is a schematic and printed circuit board design software. The firmware program for interpreting and
transmitting data was written in the Arduino programming language as well as Atmel C++. The
program was then loaded onto the microcontroller through the Arduino integrated development
environment.
4.3.1.1 PROCESSING UNIT (ARDUINO)
An Arduino mega board was selected for use in the development of the prototype. The Arduino mega
is a low power board equip with at Atmel atmega2560 8bit microcontroller that formed the brain of
our hardware. This microcontroller has 256 kilobytes of flash memory, 4,096 bytes of electronically
erasable programmable read only memory (EEPROM) and 8,192 bytes of static random access
memory (SRAM) which is more than enough to store and execute our firmware. The Arduino mega
also gave us access to 70 input and output pins that support digital and analogue signals as well as
communication protocols enabling us connect all our sensors and communication module with plenty
of pins to spare. The Arduino mega additionally has six timers enabling us to perform periodic
routines critical to our prototype.
28
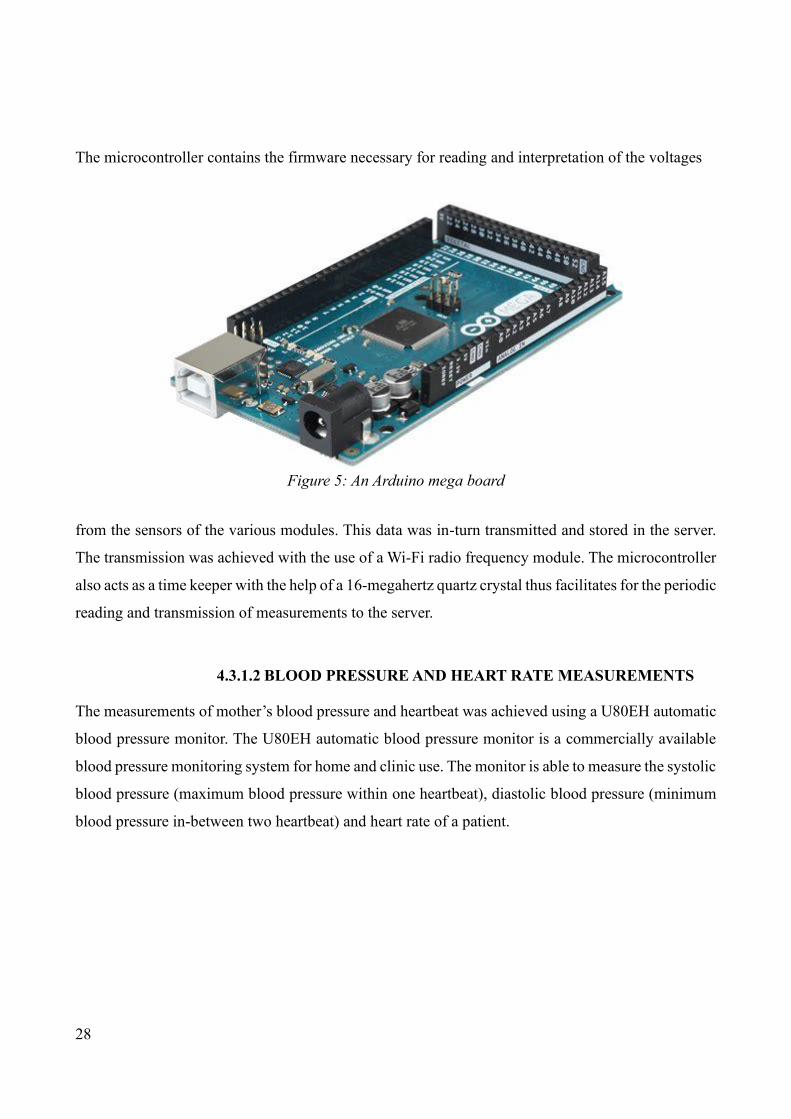
The microcontroller contains the firmware necessary for reading and interpretation of the voltages
from the sensors of the various modules. This data was in-turn transmitted and stored in the server.
The transmission was achieved with the use of a Wi-Fi radio frequency module. The microcontroller
also acts as a time keeper with the help of a 16-megahertz quartz crystal thus facilitates for the periodic
reading and transmission of measurements to the server.
4.3.1.2 BLOOD PRESSURE AND HEART RATE MEASUREMENTS
The measurements of mother’s blood pressure and heartbeat was achieved using a U80EH automatic
blood pressure monitor. The U80EH automatic blood pressure monitor is a commercially available
blood pressure monitoring system for home and clinic use. The monitor is able to measure the systolic
blood pressure (maximum blood pressure within one heartbeat), diastolic blood pressure (minimum
blood pressure in-between two heartbeat) and heart rate of a patient.
Figure 5: An Arduino mega board
Figure 60: An arduino mega board
Figure 61: An arduino mega board

29
The U80EH automatic blood pressure monitor contains its own controller and algorithm for
interpreting signals from its sensors. These are then stored into its internal memory as well as
outputted to its debugging pins.
To get access to these pins the blood pressure monitor was disassembled exposing the printed circuit
board. We then soldered jumper wires from the transmission (TXD) pin of the blood pressure monitor
to the receive pin (RX1) of the microcontroller as well as shorting their ground terminals together. A
third jumper wire was also connected between the to the start stop button of the blood pressure
monitor and digital pin 12 of the Arduino mega so us to control the measuring and reading of blood
pressure based on set predetermined values within the microcontroller’s firmware.
Figure 6: U80EH automatic blood pressure monitor
Figure 75: U80EH automatic blood pressure monitor

30
Figure 7: U80EH automatic blood pressure monitor debug pins
Figure 89: U80EH automatic blood pressure monitor debug pins
Figure 8: blood pressure monitor connected to an Arduino mega
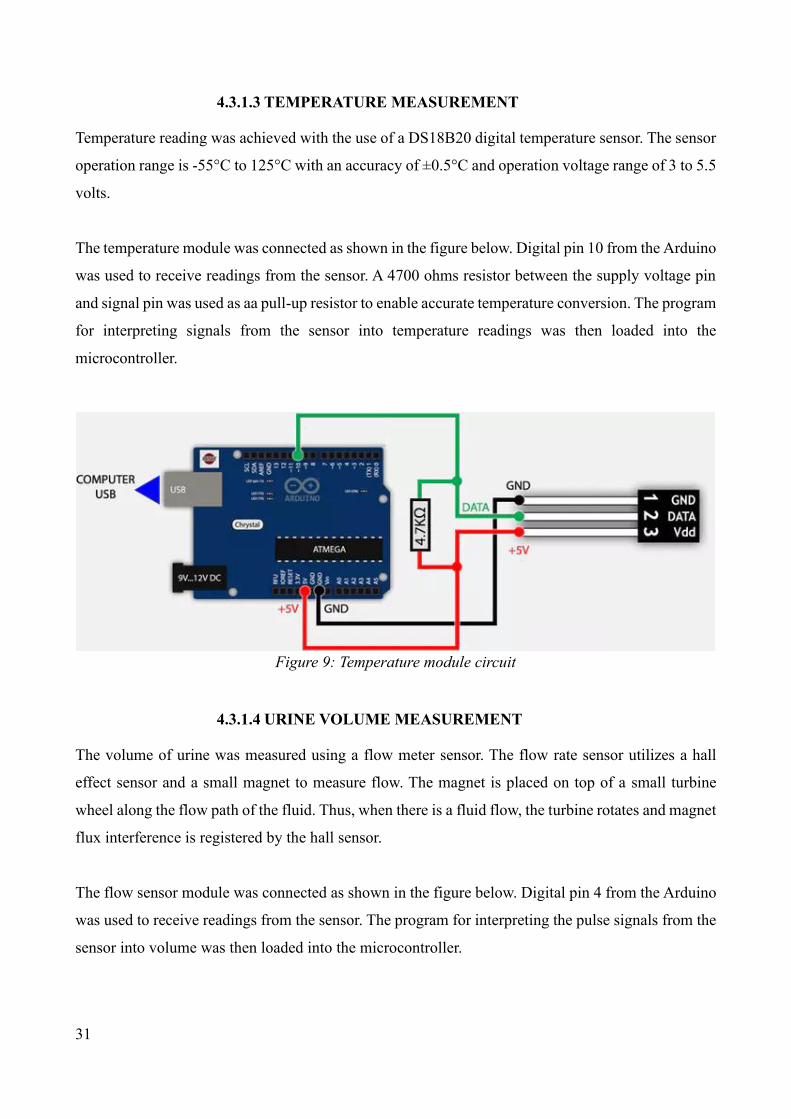
31
4.3.1.3 TEMPERATURE MEASUREMENT
Temperature reading was achieved with the use of a DS18B20 digital temperature sensor. The sensor
operation range is -55°C to 125°C with an accuracy of ±0.5°C and operation voltage range of 3 to 5.5
volts.
The temperature module was connected as shown in the figure below. Digital pin 10 from the Arduino
was used to receive readings from the sensor. A 4700 ohms resistor between the supply voltage pin
and signal pin was used as aa pull-up resistor to enable accurate temperature conversion. The program
for interpreting signals from the sensor into temperature readings was then loaded into the
microcontroller.
4.3.1.4 URINE VOLUME MEASUREMENT
The volume of urine was measured using a flow meter sensor. The flow rate sensor utilizes a hall
effect sensor and a small magnet to measure flow. The magnet is placed on top of a small turbine
wheel along the flow path of the fluid. Thus, when there is a fluid flow, the turbine rotates and magnet
flux interference is registered by the hall sensor.
The flow sensor module was connected as shown in the figure below. Digital pin 4 from the Arduino
was used to receive readings from the sensor. The program for interpreting the pulse signals from the
sensor into volume was then loaded into the microcontroller.
Figure 9: Temperature module circuit
Figure 118: Temperature module circuit

32
4.3.1.5 CONTRACTIONS
Monitoring of contractions was implemented using a push button where a recording of the presses of
the push button presses were captures. The microcontroller would then calculate the number of
contractions per 10 minutes based on these button presses. The circuit was connected as shown in the
diagram below with a pull-up resistor ensuring that the input received on digital pin 2 was stable. The
accompanying program was then loaded onto the microcontroller.
Figure 10: Urine volume module circuit
Figure 132: Urine volume module circuit

33
4.3.1.6 COMMUNICATION MODULE
Communication between the data logger and the server was done via the Wi-Fi protocol using the
ESP8266 Wi-Fi module. The ESP8266 module consists of 8 pins used for various purposes as shown
in the diagram below.
Figure 11: Contractions simulation circuit
Figure 146: Contractions simulation circuit

34
The Wi-Fi module was connected as shown in the figure below the two diodes connected between
digital pin 16 and the receiver of the Wi-Fi module are used to drop down the voltage as the Wi-Fi
module works on a lower voltage than the Arduino. Digital pins 16 and 17 were used for serial
communication between the module and Arduino. The Arduino was then loaded with a program to
connect to the Wi-Fi module after which the module would then connect to a Wi-Fi network and data
sent to the server.
Figure 12: WIFI module pinout
Figure 161: WIFI module pinout
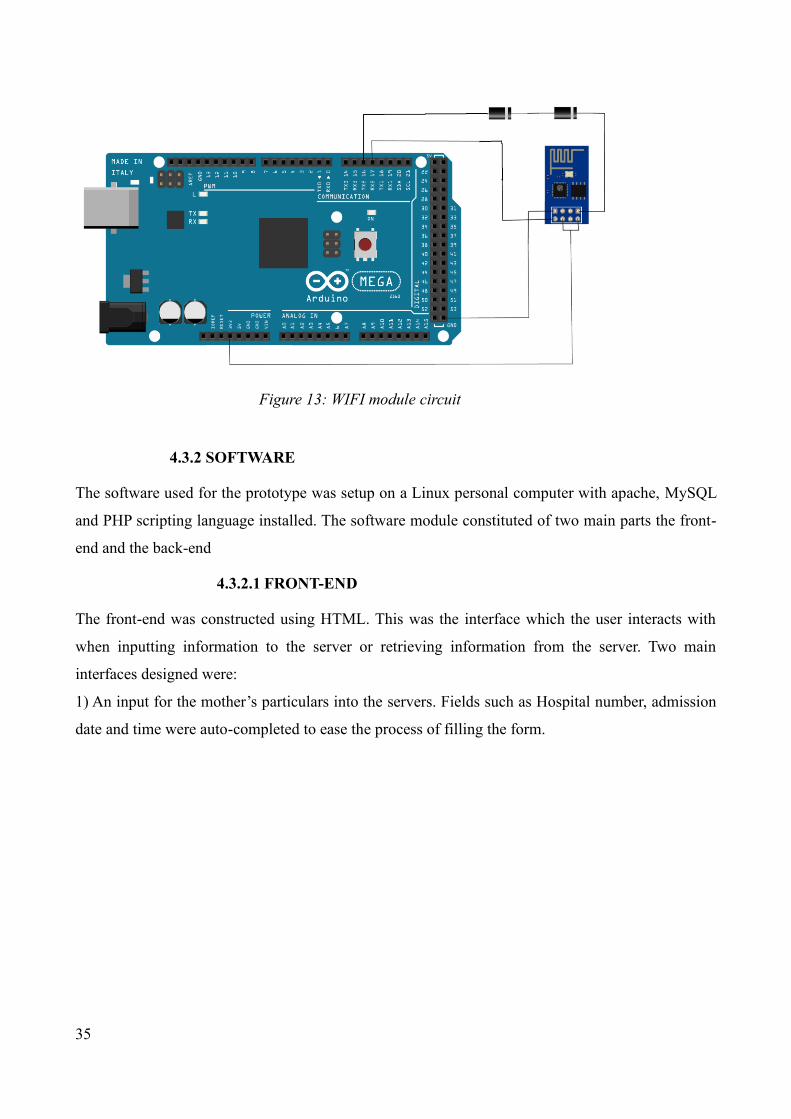
35
4.3.2 SOFTWARE
The software used for the prototype was setup on a Linux personal computer with apache, MySQL
and PHP scripting language installed. The software module constituted of two main parts the front-
end and the back-end
4.3.2.1 FRONT-END
The front-end was constructed using HTML. This was the interface which the user interacts with
when inputting information to the server or retrieving information from the server. Two main
interfaces designed were:
1) An input for the mother’s particulars into the servers. Fields such as Hospital number, admission
date and time were auto-completed to ease the process of filling the form.
Figure 13: WIFI module circuit
Figure 176: WIFI module circuit
Figure 177: WIFI module circuit

36
2) Displaying the measurements recorded by the hardware, simulations as well as the patient’s
particulars
Figure 14: New patient entry particulars
Figure 191: New patient entry particulars

37
4.3.2.2 BACK-END
An apache hypertext transfer protocol (HTTP) server, a MySQL database management system and
PHP scripting language made up the back-end of the server. The apache server was responsible for
listening to port 80 for requests from either the user or the hardware. MySQL was used for storage of
data inputted from the user and the hardware module. Inputs from the user and hardware modules
were processed using PHP which is a server-side scripting language that was used for querying the
database as well as processing data to be stored.
4.4 TESTING AND EVALUATION
When developing solutions, it is hoped that it will perform properly in accordance with our vision.
However, in practice this is usually not the case as errors and bugs as well as defective hardware
influence the resulting outcomes. Thus, the main purpose of evaluation and prototype testing is to
find and correct as many errors as possible as well as fixing any failure encountered in the solution.
The objectives of the prototype system testing were:
• Ensure system performs as expected
Figure 15: Sample patient record output
Figure 205: Sample patient record output

38
• Test for correctness of result
4.4.1 UNIT TEST
Each of the sub-modules was tested as a separate unit and their outputs studied separately. The
hardware sub-modules were checked for correct functionally in comparison to commercially
available solution. While the software sub-modules were checked for correctness in data recording
and displaying.
4.4.1.1 BLOOD PRESSURE AND HEART RATE
This test dealt with checking whether the results sent to the computer and that displayed by the blood
pressure monitor were the same. There being very little information on data being outputted from the
blood pressure monitor. Two main steps were taken to establish what kind of data was being outputted
by the blood pressure monitor. These included:
• Testing the various standard serial baud rates
• Outputting the data to the serial monitor
For these two tests a simple serial monitor program was written on the Arduino IDE and the output
monitored using the Arduino serial monitor. Once the blood pressure monitor started a measurement,
data was observed on the Arduino’s serial monitor however the data was unreadable so the baud rate
of the blood pressure monitor was adjusted to try and resolve this with no success.

39
To solve the challenge of this printable data we used minicom a serial monitoring software to dump
the content of the serial port onto file. This was achieved using the command ‘minicom --device
/dev/ttyACM0 --baud 115200 -C capturefile’ on the Linux terminal with the output being saved into
a file named capturefile.
We then used a hexadecimal editor to read the files content. We sought out for patterns that could give
us a clue on what the data being transmitted was. This was found at the tail end of the file where the
blood pressure monitor outputted two bytes with a value of 253 indicating a successful measurement
followed by one byte containing the systolic blood pressure value followed by one byte containing
the diastolic blood pressure and another byte containing the value of the heart rate.
Figure 16: blood pressure monitor test code

40
Once this was achieved another program was written to display these readings to the Arduino serial
Figure 17: Binary output from the blood pressure monitor

41
monitor and the reading on the blood pressure monitor compared for consistency with output on the
Arduino serial monitor.
4.4.1.2 TEMPERATURE
This test dealt with checking whether the results from the temperature sensor were valid. After which
they were compared to the result of a commercial non-contact infrared thermometer. First the
thermometer circuit was connected and the thermometer program loaded with the output being sent
to the serial monitor of the Arduino. The result from the commercial thermometer and our prototype
were within 0.2 degrees Celsius of each other.
Figure 18: Test result serial output
Figure 248: Test result serial output

42
Figure 19: Prototype temperature test output
Figure 262: Prototype temperature test output
Figure 20: Commercial thermometer output

43
4.4.1.3 URINE
The urine volume measurement sub-module was setup as shown on Figure 10 and an interrupt driven
program written to test fluid volume readings. Approximately half a litre of water was placed into a
container with a measuring scale. The water was then poured through the flow meter and the serial
monitor value compared to the measured value. The outputted value from the controller was
approximately the same to that of the measured jar.
Figure 21: Urine volume sensor serial output

44
4.4.1.4 CONTRACTIONS
The contractions measurement circuit was assembled as shown on figure 11 and an interrupt driven
program written to test the capture of contraction count as well as handle button debouncing. The
Arduino serial monitor output was then compared with the number of times the button was pressed.
The resulting output was that for every button press the Arduino registered it and outputted the result
to the serial monitor
4.4.1.5 COMMUNICATION MODULE
The esp8266 Wi-Fi breakout board was connected as show on figure 13. A Wi-Fi router was then
configured to connect the server and hardware module. A test program was then loaded on to the
microcontroller and connection to the router verified with an internet protocol (IP) number
assignment by the router. The output of the test is as shown in the figure below.

45
4.4.1.6 PATIENT’S PARTICULARS
This test dealt with testing whether the patient particulars were captures correctly.
4.4.1.7 PATIENT RECORD
This test dealt with testing whether the patient records were retrieved and displayed correctly.
Figure 22: Serial output of Wi-Fi module

46
4.4.2 INTEGRATION TEST
This test strategy combined all the modules that made-up the prototype. These modules were then
tested together to verify that the work together correctly. All the hardware sub-modules were
combined and their combine functionality tested.
4.5 RESULT AND ANALYSIS
To have a good understanding of the challenges of completing the partograph, 3 previous studies were
looked at. Two of the studies were done within a one health facility while the other was done across
Figure 23: Serial output the integrated hardware module

47
9 different health facilities stretching from a health centre to a tertiary hospital. Below is a table
showing how partographs were filled.
Quantity Completeness (study 1) Completion (study 2) Completion (study 3)
Partograph completion 25.4% incomplete <40%
Admission details 63.3% - -
Cervical dilatation 74% 70%-97% 70%-85%
Foetal descent 54% minimal
contractions 49.7% 30%-80%
Blood pressure 46.9% minimal 64.8%-71.6%
Foetal Heart rate - 53%-90% 72.7%-83%
Amniotic fluid - minimal
Moulding - minimal
Pulse - minimal 62.5%-63.6%
urinalysis - minimal
Table 2: partograph completion rate
From the table it can be noted that completion rate of the partograph is below 40%. Vitals with
relatively good completion rate were Foetal heart rate and cervical dilation. Recordings of urinalysis,
moulding and amniotic fluid were more or less none existent.
Some of the common reason across the studies for not completing the partograph were poor
supervision, no role model, staff shortage and excessive work load.
Result from the prototype hardware module unit test provided good results. The blood pressure and
pulse reading were extracted from a commercially available blood pressure monitor that is used in
health facilities as well as at home. A feature added to this device was the automatic periodic reading
via the hardware control unit. The temperature module based on the DS18B20 chip was also tested

48
and its result compared to a commercially available non-contact infrared thermometer. The results
from our prototype and the commercial product were mostly the same with occupational variance of
about 0.2 degrees Celsius. The flow meter module was tested as well. Once the device was configured
a measured amount of water (approximately half a litre) was measured through it and the reading
indicated by the module was 520 millilitres which gives a 4% difference. The final measurement
module is the contractions this was simulated using a bush button that were registered by our
controller for each push. The final hardware module to be tested was the communication module
which was tested to see if it would connect to a router and relay data to a server.
The final set of data collected was from 8 volunteers who reviewed the system. The volunteers had
backgrounds that included engineering and journalism and have been interacting with medical
devices on a regular basis. After making a presentation and demonstration the prototype feedback
was obtained using guided question. Only 50% had heard about the partograph, 37.5% were familiar
with it, and 25% knew how it was used. On first impressions of the device 6 people participated and
give an average score of 80.7%, for usable 5 people participated and gave an average score of 76.8%.
The comments give were that the device would assist nurse to fill the graphs and human error would
be reduced.

49
5 CONCLUSION AND RECOMMENDATION
In this chapter a summary of the findings of the research and their implication to maternal care and
their stakeholders in this case the nurses and mothers. The chapter sections are; how the study
objectives were meet, the contribution of the study, limitations encountered during the study,
recommendations and further works to be done.
5.1 HOW OBJECTIVES WERE ACHIEVED
5.1.1 TO INVESTIGATE EXISTING SOLUTION AND HOW THEY ARE
USED
In an effort to address this objective, this study sought answers to the objective through literature
reviews. The review looked at the stages of labour, what maternal vital signs constituted and the
various way the labour process is monitored. Details of this can be found in chapter two of this
document.
The chapter describes the labour process as having four stages and the active stage of labour falling
between stage one and the end of stage two. The most common tool used to monitor active labour
progress is called a partograph. This is a paper-based tool developed by WHO and recommended for
use particularly in low resource areas. The tool is divided into three main section that are monitored,
these are: Foetal condition, labour progress and maternal conditions.
Other tools developed for labour progress monitoring that employed technology were also looked at,
these were the partopen that is a digital partograph solution based on a Dot Position System which
uses printed microdots arranged in specific patterns allowing the pen to establish its placement on a
form. Another solution looked at was the mlabour which is a mobile application that envelops an
electronic partograph into workflows for recording patient details, updating and resolving maternal
issues. The final case looked at was the epartogram which is a monitoring and decision support
electronic version of the partograph that contains features of both the partograph and the partopen.
5.1.2 TO DEVELOP A PROTOTYPE OF THE DATALOGGER
A prototype solution was developed to meet this objective. The solution composed of two main parts;

50
the software potion where information was stored and managed and a hardware portion on which all
the sensory systems were housed. The sensors used where:
• A blood pressure and heart rate monitor for measuring the mother’s systolic blood
pressure, diastolic blood pressure and heartbeat
• A temperature sensor for the measurement of the mother’s temperature
• A flow meter for measuring urine volume
• A push button for counting contractions
A communication module was also included and it was responsible for transmission of data to the
server. At the heart of the hardware was a control unit responsible or time keeping, measurement and
interpretation of signals from the sensors as well as transmission of the data to the server.
5.1.3 EVALUATE THE SYSTEM
This study pursued at look at the possibility of automating the measurement and logging of maternal
vital signs during the active stage of labour and their retrieval to assist in the completion of the
partograph.
Testing of the solution was mainly confined to laboratory experiments and feedback from colleagues.
Feedback from the test indicated that the solution faithfully monitored and recorded the vitals as well
as gave an accurate reading of the vitals measured. From the group discussion the idea was thought
to be useful and could assist nurses in plotting their graphs., it would also reduce the occurrence of
human errors that occur during measurements and recording.
5.2 CONTRIBUTION OF THE STUDY
This research sought to develop a digital information technology solution to assist nurses and
midwives record labour progress during the active stage of labour. The prototype created a platform
in which some of the periodic vital signs measured during labour were automated these included
blood pressure, heart rate, temperature, contractions and urine volume. These signs were periodically
measured and recorded to a server from where they could later be retrieved to assist in completion of
the partograph. Hence removing the need of nurses having to generate random data to complete a
partograph as well as enabling them attend to mothers more effectively.

51
5.3 STUDY LIMITATIONS
Various limitations were encountered within this study. Design of a data logging solution proved to
be a technical challenge as material resources for use in this project proved to be unavailable resulting
in sourcing of some of the material resources from outside the country which in-turn took time to be
delivered. This resulted in a longer duration would be required to identify and source for needed
material as well as testing their functionality.
Another limitation had to do with the medical nature of this study. Acquiring ethical approval to
conduct research in any health facility was required. This process takes between one and two months
at best. To go around this secondary data from other research works was used as a foundation of some
of the findings as well as feedback from persons working on medical devices pertaining to maternal
care.
For a good evaluation of the solution clinical trials would give a good indicator of how well the
solution performs in the real world in the hands of actual nurses and mothers. However, this would
take a few months to conduct hence not possible within the time period of the project as well as need
ethical approval as mentioned above.
5.4 RECOMMENDATION AND FURTHER WORK
This research focused mainly on monitoring of maternal vital signs. The decision to focus on
digitization of maternal vital signs was arrived at due to limitation of locally available technologies,
time resource, financial constraints and technical complexity of measuring and recording of some of
the signs such as automation of visual inspection, drug administration where applicable and chemical
analysis. Hence there is still a need to create a digital solution that is capable of monitoring, measuring
and recording more if not all the vitals on the partograph.
Sharing of information among the health facilities is also another point of note This would enable
better service provision to mothers in referral cases as the hospital the mother has been referred to
will easily be able to conclude on the exact state the mother and baby are in without having to perform
their own independent test and analysis.
Clinical trials of the prototype would also need to be performed to test the performance of the
prototype under real world conditions. This would shed more light on limitations and advantages of

52
its functionality by the nurses, unforeseen failure points and its capacity to perform in a real-world
test compared to laboratory testing.
53
REFERENCES
1. Bourbonnais, N. (2013). Implementing Free Maternal Health Care in Kenya: challenges,
strategies and recommendations. KNCHR Available at:
<http://www.knchr.org/Portals/0/EcosocReports/Implementing%20Free%20Maternal%20He
alth%20Care%20in%20Kenya.pdf> [Accessed 23 January 2018]
2. Elsevier Saunder, (2012). Dorland's illustrated medical dictionary, 32ed. Philadelphia,
ElsevierSaunder
3. Fistula Care, (2011), Revitalizing the Partograph: Does the evidence support a global call to
action?, Fistula Care. Available at: <http://www.fistulacare.org/pages/pdf/program-
reports/EngenderHealth-Fistula-Care-Partograph-Meeting-Report-9-April-12.pdf>
[Accessed 11 February 2018]
4. jhpiego, (2009). Addressing Labor Complications: A Low-Cost Solution for a Persistent
Global Health Challenge Available at:
<https://www.globalhealthlearning.org/sites/default/files/page-
files/LaborComplicationsLowCostSolutions_withmast.pdf > [Accessed 7 July 2018]
5. Maina S. M, (2016). The Effect Of Free Delivery Services on Partograph Utilization at
Naivasha District Hospital. Masters level. University of Nairobi Available at:
<http://erepository.uonbi.ac.ke/bitstream/handle/11295/99639/Kigotho_The%20Effect%20O
f%20Free%20Delivery%20Services%20On%20Partograph%20Utilization%20At%20Naiva
sha%20District%20Hospital.pdf?sequence=1&isAllowed=y> [Accessed 11 march 2019]
6. Maphasha O. M., Govender I., Motloba D. P., and C Barua. (2017) Use of the partogram by
doctors and midwives at Odi District Hospital, Gauteng, South Africa. South African Family
Practice. 59(2), 82-86 Available at:
<https://www.tandfonline.com/doi/full/10.1080/20786190.2017.1280899> [Accessed 15
May 2019]
7. Masika M. A., Katongole S. P., and Govule P., (2015). Improving Partograph

54
Documentation and Use by Health Workers of Bwera Hospital: A Process Improvement
Research. International Journal of Nursing and Health Science 2(4), 37-45 Available at:
<http://www.umu.ac.ug/wp-content/uploads/2015/09/7190168.pdf> [accessed 29 April
2018]
8. Murray, S. and McKinney, E., (2005). Foundation of Maternal Newborn Nursing, 4ed.
Philadelphia, ElsevierSaunder Available at:
<http://www.coursewareobjects.com/objects/evolve/E2/book_pages/murray/pdfs/Murray_26
6-305_Ch13.qxd.pdf> [Accessed 11 March 2018]
9. Okokon I. B., Oku A. O., Agan T. U., Asibong U. E., Essien E. J., and Monjok E. (2014),
An Evaluation of the Knowledge and Utilization of the Partogragh in Primary, Secondary,
and Tertiary Care Settings in Calabar, South-South Nigeria. International Journal of Family
Medicine 2014(105953), 1-9 [pdf] Available at:
<http://downloads.hindawi.com/journals/ijfm/2014/105853.pdf> [Accessed 5 May 2019]
10. Ollerhead Elizabeth and Osrin David, (2014), Barriers to and incentives for achieving
partograph use in obstetric practice in low- and middle-income countries: a systematic
review. BMC Pregnancy and Childbirth 14(281) Available at:
<https://bmcpregnancychildbirth.biomedcentral.com/articles/10.1186/1471-2393-14-281>
[accessed 4 April 2019]
11. Qureshi Z. P., Sekadde- Kigondu C. and Mutiso S.M. 2010, Rapid assessment of Partograph
utilisation in selected maternity units in Kenya. East African Medical Journal 87(6), 235-241
Available at: <https://www.ajol.info/index.php/eamj/article/download/63081/50949>
[Accessed 13 February 2018]
12. Rudowski Robert, 2008. Impact of information and communication technologies on health
care [pdf] Available at:
<http://www.map.uniroma2.it/digital_evolution/papers/rudowski_paper.pdf> [Accessed 25
April 2018]
13. Savinglivesatbirth. (2011). Saving Lives at Birth: Low Cost E-Partogram [YouTube video]
Available at: <http://www.youtube.com/watch?v=mPa6KNlqD-Y> [Accessed 7 July 2018]

55
14. Schweers, J., Khalid, M., Underwood, H., Bishnoi, S., and Chhugani, M., (2016). mLabour:
Design and evaluation of a mobile partograph and labor ward management application.
Procedia Engineering 159, 35-43 Available at:
<https://www.sciencedirect.com/science/article/pii/S1877705816322032> [Accessed 28
March 2018]]
15. Sigei, J. K., (2018). Completeness of Partographs used by Midwives in a Sub County
Hospital in Kenya. Kenyan journal of nursing & Midwifery. 3(2), 51-57 Available at:
<http://www.kjnm.co.ke/index.php/kjnm/article/view/132> [Accessed 11 March 2019]
16. Underwood M. H., (2013). The partopen: Using digital pen technology to improve maternal
labor monitoring in the developing world. Doctrate level. University of Colorado Boulder.
Available at:
<http://www.partopen.com/uploads/1/3/6/8/13683592/underwood_dissertation_final.pdf>
[Accessed 28 March 2018]
17. Underwood H., Sterling S. R. and Bennett K. J., 2012 Improving Maternal Labor
Monitoring in Kenya Using Digital Pen Technology: A User Evaluation [pdf] Available at:
<http://www.partopen.com/uploads/1/3/6/8/13683592/underwood_ghtc_cr.pdf> [Accessed
18 June 2018]
18. United Nations., (2017). Progress towards the.Sustainable Development Goals. United
Nations: 2. Available at: <https://unstats.un.org/sdgs/files/report/2017/secretary-general-sdg-
report-2017--EN.pdf> [Accessed 12 February 2018]
19. Vaishnavi, V. and Kuechler, W. (2004). “Design science research in information systems”.
January 20, 2004; last updated: October 23, 2013. <http://www.desrist.org/design-research-
in-information-systems> [Accessed 18 March 2019]
20. World Health Organization., 1994 Preventing prolonged labour: a practical Guide, The
Partograph Part I [pdf] Available from:

56
<https://apps.who.int/iris/bitstream/handle/10665/58903/WHO_FHE_MSM_93.8.pdf?seque
nce=1&isAllowed=y> [Accessed 15 April 2018]
21. World Health Organization., (2016) Fact Sheet. [Online] World Health Organization Media
Center for Maternal mortality. Available at:
<http://www.who.int/mediacentre/factsheets/fs348/en/> [Accessed 3 February 2018]
22. World Health Organization., (2017) World health statistics 2017 Monitoring health for the
SDGs. France: iris. Available from:
<http://apps.who.int/iris/bitstream/10665/255336/1/9789241565486-eng.pdf> [Accessed 12
February 2018]
23. Yisma E., Dessalegn B., Astatkie A and Fesseha N., (2013) Completion of the modified World
Health Organization (WHO) partograph during labour in public health institutions of Addis
Ababa, Ethiopia. Reproductive health. 10(23) Available at: <http://www.reproductive-health-
journal.com/content/pdf/1742-4755-10-23.pdf> [Accessed 4 July 2018]

57
APPENDICES
APPENDIX A: CONFIDENTIALITY AGREEMENT FORM
I Kennedy Abwao Ogendo, Reg. No P51/65174/2013 , a bona fide student of the University of
Nairobi, School of Computing and Informatics agree that as the principal investigator executing this
research exercise, I will ensure that all information captured and handled in whatever form in the
process of carrying out this research exercise will be kept confidential and will not at any point in
time; during and/or after the research exercise be disclosed to any other person or used for any other
purpose other than the intended research.
Signature.............................................................
Date....................................................................

58
APPENDIX B: INFORMED CONSENT NOTE
Research Title
A DATA LOGGER FOR MONITORING MATERNAL VITAL SIGNS DURING LABOUR
Introduction: Background
I Kennedy Abwao Ogendo, a MSc student at the University of Nairobi School of Computing and
Informatics intend to carry out a study that aims at evaluating interventions that can reduce maternal
mortality and the outcomes resulting from these interventions.
Research Procedure Brief
The research procedure and process involve interacting with healthcare workers who in one way or
another interact with expectant mothers or mothers in labour. Data will be collected from the
respondent using questionnaires. We will analyse the data collected in an effort to understand the
interventions that can reduce maternal mortality and the outcomes resulting from these interventions.
Confidentiality Issues
All information captured will have no respondent’s identifier (Huduma Number, ID Number, Name,
Passport Number, Birth certificate Number etc.). After collection, all data and information will be in
the custody of the principal researcher for safe and secure keeping.
Respondents Voluntary Participation
Each respondent will voluntarily participate in the study after a briefing on what the study is all about.
They will be required to read and understand the informed consent note and seek all clarification
where necessary. Each respondent will be allowed time to make an independent decision on whether
or not they would like to participate in the study. They will then be required to sign a consent form as
evidence of their voluntary participation in the research.

59
Respondents Eligibility to Participate
Respondents of this study will be required to fulfil the following requirements:
• Should be one who interact with expectant mothers or mothers in labour
• Should voluntarily agree to participate in the study
Motivation and Drive
Our motivation for this study is to establish and understand the outcome of interventions with respect
to maternal healthcare. This will provide a knowledge base that can help in the creation of solutions
that will mitigate mortality caused by labour related factures.

60
APPENDIX C: CONSENT FORM
I acknowledge that I have read and understood Informed Consent Note concerning this research
and that I have also sought all necessary clarification concerning my participation as a
respondent in the research. By appending my signature, I voluntarily agree to participate in this
particular study.
Names.............................................................................…
Signature ........................................................................…
For any further information or clarification about this research, please contact:
Kennedy Abwao Ogendo
C/o University of Nairobi,
School of Computing and Informatics
P.O. Box 30197 – 00100
Nairobi, Kenya
Tel: +254 -721 587 688
If you (respondent) have any concern or complaint relating to the conduct of this research, kindly
contact:
The Chairperson
KNH-UoN Ethics Review Committee
P.O. Box 19676 - 00202
Nairobi, Kenya
Tel: 020-272 6300-9 ext. 44355

61
APPENDIX D: QUESTIONNAIRE PART A: BRIEF ON THE RESEARCH
This questionnaire is part of a research by Kennedy Abwao Ogendo towards a Master of Science
Degree at the University of Nairobi, School of Computing and Informatics. The study seeks to review
and understand the interventions that can reduce maternal mortality. Possible solution for mitigating
some of the healthcare challenges associated with maternal care will then be designed based on this
data.
PART B: IMPORTANT NOTE TO THE RESPONDENT
NO respondent’s personal identification information should be filled anywhere in this questionnaire.
These will include but not limited to those listed below
• Huduma Number
• National Identity Card Details (Number and Names)
• Passport Details (Number and Names)
• Birth Certificate Number
• Hospital Records, employee number
PART C: WORKING CONDITONS
1. How many colleagues do you work with in a shift? _____________________________
2. How long is a shift? _____________________________________________________
3. How many mothers do you have to attend to in a shift? (less than, between, more than)
4. How many shifts does the labour process take? (1 shift, 2 shifts, more than 2 shaft)
PART D: SKILLS AND MONITORING TOOL
5. On a scale of 1 – 10 (1=not available, 10=readily available) how available are partographs
for use to monitor labour? _______________________
6. On a scale of 1 – 10 (1=easy, 10=hard) how available are partographs for use to monitor
labour? ____________
7. How often do you get training on the use of the partograph? (never, occasionally, frequently)

62
PART E: TOOL COMPLETION LEVEL
8. Please fill the table below with respect to the partograph
On a scale of 1 -10 how often are
these reading taken during labour
progress? (1=never, 10=always)
How is the vital recorded?
(visual inspection, using a tool
(please mention tool) or both)
Contraction
Cervical dilation & effacement
Descent of head
Urinalysis
Mother’s blood Pressure
Mother’s temperature
Mother’s pulse
Respiratory
Amniotic fluid moulding
Foetus pulse rate
9. How long does it take to complete one entry on the partograph? ___________________
10. How much time do you think you need to measure and record all the data required in the
partograph for all the mothers you need to attend to? ____________________________
PART F: INTER-FACILITY COMMUNICATION
11. Do you get referrals? (YES / NO)
If yes
1. What state are the mothers in on a scale of 1-10 (1=normal, 10=critical)? _____
2. Do the mothers come accompanied with a partograph in a scale of l-10? (1=never,
10=always) _______________
1. if yes, how complete are they on a scale of 1-10? (1=blank, 10=completed)
__________________
2. If yes, how helpful is it in giving the state of the mother? (1=not at all, 10=very

63
helpful)
12. Is there anything important you think I may have missed? ___________________________
__________________________________________________________________________
__________________________________________________________________________
__________________________________________________________________________
CONTACT:
Kennedy Abwao Ogendo
C/O University of Nairobi,
School of Computing and Informatics
P. O. Box 30197-00100
Nairobi, Kenya.