a data warehouse solution for analysis on indoor tracking ... · a data warehouse solution for...
TRANSCRIPT

A Data Warehouse Solution for Analysison Indoor Tracking Data
Department of Computer Science @ Aalborg University
Extract-Transform-Load(ETL)
DW
CPH
C#
MS SQL2008
MSAnalysisServices
2008
Targit BISuite
12
34
5
Data
MOLAP
Analysis
Group d521aJonas T. HansenStig JørgensenSimon Nicholas M. TinggaardRune L. Wejdling


Department of Computer Science
Title:A Data Warehouse Solution forAnalysis on Indoor TrackingData
Project period:DAT5:1st of September to 19th ofDecember, 2008
Project Group:Computer Science, d521a
Members:Jonas T. HansenStig JørgensenSimon Nicholas M. TinggaardRune L. Wejdling
Supervisor:Torben Bach PedersenHua Lu
Copies:7
Pages in Report:38
Pages in Appendix:1
Pages in total:39
Abstract:
This project concerns the design and im-plementation of a data warehouse foranalysis on tracking data collected atCopenhagen Airports A/S. The projectis done in cooperation with BLIP Sys-tems A/S who has a Bluetooth basedtracking system implemented in Copen-hagen Airports A/S. First, we introducea number of technologies that can be ap-plied for indoor tracking, then we de-scribe how BLIP Systems A/S storesthe collected tracking data and proposea data warehouse design that enablesanswering some business intelligence re-lated questions provided by BLIP Sys-tems A/S. As a part of the ExtractTransform Load, some data cleansinghas been performed on the source data.Additionally, we introduce two case-specific algorithms, FlyerFrequencyCal-culation, used for calculating measuresand BounceDetection, which normalizesthe tracking data. By utilizing Targit BISuite, we address some of the questionspresented and provide answers throughgraphs. Lastly, we conclude on theproject and suggests directions for fur-ther work.
The content of this report is freely available, but publication (with source reference) may only
be made with the approval of the authors.


CONTENTS
Contents
1 Introduction 1
2 Technological Background 32.1 Temporary Mobile Subscriber Identity . . . . . . . . . . . . . . . 32.2 Radio Frequency Identification . . . . . . . . . . . . . . . . . . . 42.3 Bluetooth . . . . . . . . . . . . . . . . . . . . . . . . . . . . . . . 52.4 Comparison . . . . . . . . . . . . . . . . . . . . . . . . . . . . . . 5
3 The BLIP Systems Data Set 63.1 Data Collection . . . . . . . . . . . . . . . . . . . . . . . . . . . . 63.2 Copenhagen Airport Implementation . . . . . . . . . . . . . . . . 7
4 Data Warehouse Design 94.1 Dimension Descriptions . . . . . . . . . . . . . . . . . . . . . . . 104.2 Cube design . . . . . . . . . . . . . . . . . . . . . . . . . . . . . . 12
5 Extract Transform Load 135.1 ETL Overview . . . . . . . . . . . . . . . . . . . . . . . . . . . . 145.2 Frequent Flyer Analysis . . . . . . . . . . . . . . . . . . . . . . . 165.3 Bounce Detection . . . . . . . . . . . . . . . . . . . . . . . . . . . 16
6 Results 216.1 Bounce Detection Test . . . . . . . . . . . . . . . . . . . . . . . . 216.2 Analysis of BI Related Questions . . . . . . . . . . . . . . . . . . 22
7 Conclusion 28
8 Future Work 28
A BLIP systems access point setup 33
iii


1 Introduction
It is becoming increasingly more common for mobile devices to have at least apositioning device or network module. This fact combined with the continuouslygrowing number of mobile devices and Location Based Services (LBS) [1] [8], hasresulted in various advancements within the area of tracking and monitoring ofmobile devices, and thereby also the users. Most LBS utilize Global PositioningSystem (GPS) to track the users and rely on the users submitting their locationperiodically.
Using GPS modules in mobile devices for tracking in an outdoor environmentprovides a good estimation of the position of the device, but it is too inaccuratefor indoor tracking. Instead Bluetooth [3] and other wireless networks or RadioFrequency Identification (RFID) can be used to obtain positions in indoor envi-ronments. However, these solutions require an underlying infrastructure withinthe immediate area to work, i.e. a number of strategically placed Bluetoothaccess points or RFID readers. An advantage of these tracking methods is theability to track devices without the need of special software running on thedevices, e.g., it is possible to track and monitor the location of a device if ithas its Bluetooth device enabled. Because a Bluetooth infrastructure supportscreating a Personal Area Network (PAN) between the Bluetooth access pointsand the tracked devices, it can also provide users with LBS, such as navigationguidance, mobile-mapping and location specific content, by pushing informationto the devices. To support this, extra software installed on the devices could berequired.
The motivation behind the tracking of devices is often related to BusinessIntelligence (BI) [9]. The topic BI is very broad and covers a variety of subjects,where the common denominator is a transformation of data into knowledge.This report focuses primarily on data analysis. Many organizations can benefitby redefining their business processes according to the knowledge derived fromBI related analysis.
The knowledge that can be derived from tracking people within an organi-zation’s physical environment can be used to increase its revenues. In the caseof shopping malls or airports, this knowledge of people’s behavior can be put touse when deciding the physical placement of shops and services. Furthermore,the mix of tenants within the mall or airport can be optimized using the datagathered. Other business decisions, such as rent per square meter based on thelocation of the store, can be improved, using the knowledge gathered to assistthe decision making. Supermarkets can use analysis of the flow of the peoplein the store to decide where to place their products, e.g., they might discoverthat 95% of the people seen at section A, at some time later in their visit is alsoseen at section B. This knowledge could be used for placing advertisements insection A, targeting products in section B, to influence the shopper’s shoppingbehavior.
This report, in cooperation with BLIP Systems A/S [16], focuses on defin-ing and implementing a data warehouse and analyzing data gathered from aBluetooth network infrastructure. To provide an efficient and effective analysissolution, we propose the system presented in Figure 1. The architecture showshow our Extract, Transform, and Load (ETL) application extracts data fromthe source data set and pushes the transformed data to an MS SQL Server 2008RDBMS. MS Analysis Services 2008 is used to pull the data from the RDBMS,
1

1 Introduction
Extract-Transform-Load(ETL)
DW
CPH
C#
MS SQL2008
MSAnalysisServices
2008
Targit BISuite
12
34
5
Data
MOLAP
Analysis
Figure 1: Proposed system architecture.
define multidimensional cubes, and store them physically on disk in a propri-etary format. Targit BI Suite is used to analyze the data by slicing and dicingthe cubes and presenting graphical results.
In order to answer a series of BI related questions, a specific site, namelyCopenhagen Airports A/S, is chosen. For the remainder of this report we willrefer to BLIP Systems A/S as BLIP and Copenhagen Airports A/S as CPH.
BLIP is working in collaboration with CPH’s administration on the SPOPOSproject [1] to develop a tracking and LBS system. The goal of SPOPOS is,amongst others, to offer a range of services to the passengers, helping themmake their flights in time and thereby reducing the number of delayed flights.This is done by tracking the passengers and send them a text message or givethem a call when it is time for them to board. If the gate personnel can tell bya passengers position in the airport that the passenger will not be able to makethe flight, they make arrangements for the passengers baggage to be taken offthe flight. Before the SPOPOS project was launched, tracking of people in theairport was done manually using video surveillance. The manual method allowsthe airport to track up to 200 people a day, without the ability to recognizerecurring visitors. With the SPOPOS project, and BLIPs implementation ofautomatic tracking, even across subsequent visits, this number is up to 6,500people a day. Another goal is to enable the administration to compare thecurrent visitor movement in the airport with historical data. Some BI relatedquestions relevant for the airport administration based on historical data wouldinclude the following.
1. How often have visitors been seen in the airport?
2. How is the visitor load distributed over the weekdays?
3. How much time do visitors spend at the different locations in the airport?
4. How is the distribution of time spent at a specific location?
5. How is the distribution of time spent at different times of the day?
2

These questions all refer to the time spent by visitors in the airport orthe amount of visits to the airport. More complex questions would include flowanalysis of the visitors in the airport to detect movement patterns and to classifydifferent visitor types. This topic is left for future work.
The structure of this report is as follows. Section 2 introduces existing tech-nologies for tracking of moving objects and presents a comparison of these.Section 3 covers how BLIP tracks objects and, specifically, how it is imple-mented in CPH. A data warehouse design is presented in Section 4 to answerthe questions proposed by BLIP. Section 4.1 describes which dimensions arecreated. In Section 4.2, the creation of the OLAP cube is described. Once thedata warehouse is in place, the process of ETL is described in Section 5. Sec-tion 5.1 presents the selection criteria from which the source data is selected.A set of case specific problems were encountered and two algorithms, namelyFlyer Frequency Calculation and Bounce Detection are proposed in Section 5.2and 5.3, respectively, to solve the problems. Section 6 presents experimentalresults and analysis of the BI related questions, performed on the BLIP dataset. Lastly, we conclude on our work and elaborate on future work in Section 7and 8.
2 Technological Background
This section introduces BLIPs tracking method as well as two other projectswhose focus areas are similar to BLIPs. These are introduced in order to pro-vide sufficient grounds for evaluating and comparing different ways of collectingtracking data in an indoor environment. We will compare and evaluate the pos-sibilities of each technology with respect to the needs of our specific case. Allthree projects involve tracking devices indoors, as well as transforming the gath-ered data into knowledge that can be used to support business decisions withinan organization or provide users with LBS. The major difference between theprojects is the way data is collected - one project tracks the Temporary MobileSubscriber Identity (TMSI) in mobile phone signals, the second tracks RadioFrequency Identification (RFID) tags, and the third tracks Bluetooth devices.
2.1 Temporary Mobile Subscriber Identity
A company called Path Intelligence Ltd. [11] has specialized in tracking mo-bile phones by listening in on the network communication between the mobilephones and base stations using strategically placed monitoring units. They usean identification number contained in the communication packages called theTemporary Mobile Subscriber Identity [14] to isolate and track the individualphones within the area. TMSI is an ID assigned to a cell phone when it entersa new location (base station) on the GSM and UMTS network1. The TMSIis periodically transmitted between the device and the base station and is alsoused when creating communication channels for receiving or making calls. TheID is temporary and changes over time and location. Path Intelligence Ltd. hasdeveloped a method allowing them to track the devices and present results from
1 Global System for Mobile communications and Universal Mobile TelecommunicationsSystem
3

2 Technological Background
data analysis, such as shopper flow and densities in a mall, to the customer. Anoverview of the pros and cons of this approach can be seen in the following:
Pros: Because the system is able to track any cell phone as long as it is turnedon, the penetration rate is very high. The range of a cell phone is rather largeup to 3-20 miles depending on the amount of interference and obstructions inthe area, therefore the number of nodes needed to monitor signals in the airportcan be kept at a minimum depending on the accuracy wanted. The systemprovided by Path Intelligence has an accuracy of down to 1-2 meters usingtriangulation [10].
Cons: Because the TMSI is only broadcast periodically, e.g. when the cellphone is being used or changes base station due to low signal strength, the timebetween updates varies from a couple of seconds up to a number of minutes.Additionally, because the TMSI is changing continuously, there is a possibilitythat the tracking sessions end prematurely, thereby obscuring the data collected.The system provided by Path Intelligence provides no means of communicatingto the tracked devices. Because the system relies on triangulation for pinpointingthe position of a device the complexity of the tracking system greatly increases.
2.2 Radio Frequency Identification
The second project of interest to us uses RFID technology for tracking. LyngsoeSystems A/S [7] is one of the worlds leading suppliers of solutions for complexRFID based logistic systems, e.g. baggage tracking in airports and parcel track-ing in postal services. Currently, Lyngsoe is involved in the same project asBLIP, namely SPOPOS [1], in which Lyngsoe supplies the technology for RFIDbased tracking in CPH. Lyngsoe uses active RFID tags with a much highersignal strength, as opposed to passive tags with a low signal strength that aredepending on the RFID readers to power them [13]. The active tags have beenchosen because they have a much longer range and thereby covering the areaswanted to be monitored in the airport. The tags used by Lyngsoe are set tohave a range of approximately 30 meters. An overview of the pros and cons ofusing active RFID tags in this approach can be seen in the following:
Pros: An active RFID tag has a unique identifier which can be continuouslytracked with approximately 1 update per second as long as its signal reaches anRFID reader. The range of an active RFID tag is up to 200 meters, in Lyngsoescase, the range has been set to 30 meters to better suit the environment [12]. Inorder to save battery life and reduce the number of updates sent to the system,Lyngsoe has developed tags that only broadcast when moved.
Cons: Because the system uses costly active RFID tags, tags must be handedout and linked to individuals or otherwise be available to the passengers andcollected again when leaving the airport. This requires passengers as well asairport staff to take action for the system to work, thereby lowering the pene-tration of the system. The system provided by Lyngsoe provides no means ofcommunicating with the tracked individuals. To implement this functionalitywould require the RFID tag to be integrated in a device such as a PDA, mobile
4

2.3 Bluetooth
phone or similar. In order to perform analysis of a specific passenger’s subse-quent visits, information about the passenger has to be collected and the tagshave to be registered to the passenger when handed out.
2.3 Bluetooth
BLIP use Bluetooth technology for their tracking system in the SPOPOS project,in the form of access points scanning Bluetooth enabled devices in range for theirunique Bluetooth addresses and other metadata. Bluetooth devices are verycommon in mobile phones, PDAs and laptops. Bluetooth transceivers are avail-able in three classes, defining the maximum power output and thereby range ofthe signal. A class 1 transceiver has the highest power output and with it thelongest range of up to 100 meters. Class 2 and 3 devices have a range of up to10 meters and 1 meter, respectively [15]. The range of class 2 and 3 devices canbe slightly extended due to higher sensitivity by using class 1 access points. Anoverview of the pros and cons of this approach can be seen in the following:
Pros: Most mobile phones come with Bluetooth modules, meaning that thebest case penetration is nearly as high as for TMSI, but because they haveto be activated to be seen, there is a moderate penetration rate when usingthis technology for tracking. BLIPs system queries for unique devices once persecond. The Bluetooth system provided by BLIP is ready for communicatinglocation and context specific content on the network.
Cons: According to SPOPOS the range of the Bluetooth tracking system inCPH is only up to 20 meters. The short range requires many access points tobe installed in order to cover the area. If the system should be upgraded tosupport triangulation, many more access points would be required. Due to thefact that most Bluetooth transceivers in mobile devices are class 2 transceiversand the signal output of different vendor Bluetooth modules varies greatly, theirrange is limited to approximately 10-30 meters with a precision of about 5-10meters.
2.4 Comparison
The three different approaches to tracking described in the previous sectionsallows us to compare the strengths and weaknesses of each approach in relationto the airport tracking case. This is shown in Table 1.
TMSI RFID BTPenetration High Low MediumRange Long Short ShortEffort required toimplement 2-way N/A High LowcommunicationUpdate frequency Infrequent Frequent FrequentFlexible updates ÷ X ÷Unique tracking ÷ X X
Table 1: Technology comparison.
5

3 The BLIP Systems Data Set
As can be seen in the table, the highest level of penetration is achieved usingthe TMSI for tracking. However, RFID, as well as Bluetooth, can, in the caseof an airport, achieve an equally high level, by providing services that adds pos-itively to a passengers travel experience. In the case of RFID this would haveto include a solution to the problem of communicating information to the pas-sengers. With respect to the Bluetooth solution, useful services could motivatemany users to turn on the Bluetooth transceiver on their mobile phone [1]. Thelimited number of nodes and the high precision offered by the TMSI solutionwould be desirable, but the TMSI solution’s update rate is no match to thatof the RFID or Bluetooth solutions. In our case, a delay of e.g. 5 minutes inthe update of a position, is not suitable for tracking within a small area like aairport. The flexible updates supported by Lyngsoe’s RFID tags means thatthe system needs to process fewer updates per second than BLIPs system does.The short range and low precision provided by RFID and Bluetooth is one ofthe major drawbacks opposed to TMSI, but this is made up for by the abilityto uniquely and continuously track passengers, even on subsequent visits, andthe ability to implement communication solutions.
3 The BLIP Systems Data Set
This section describes how BLIPs tracking data set is recorded and stored. It in-troduces some quantitative measures about the data set and devices tracked, aswell as some of the irregularities within the data set. Lastly, it introduces someterms relevant when analyzing the data, which will be used for the remainderof this report.
3.1 Data Collection
BLIP has developed a system that collects data of the movement of passengersin airports. This is done utilizing strategically placed Bluetooth access points,hereafter referred to as access points, that monitors a given area. Figure 2 showsBLIPs system architecture. A central monitor-server polls each of the accesspoints every second. Each access point replies to the poll by returning a listcontaining all devices in the vicinity including various device information.
CPH
Data
Figure 2: BLIP system architecture.
The Bluetooth device information retrieved is a unique Bluetooth address,signal strength, class of device, device manufacturer and model. Class of deviceis a 3 byte variable, that indicates which type of device that has been tracked,e.g. camera, mobile phone or smart phone. Signal strength stores the Received
6

3.2 Copenhagen Airport Implementation
Signal Strength Indicator (RSSI), which is a measurement of the signal strengthin a received radio signal. By logging the first and last time each device isdetected by an access point, the entry and exit time for the devices are obtained.To know when the device was closest to an access point, BLIP store the peaktime2 of the device, as well as signal strength at the peak time, this also givesan indication of how close a device was to the access point. The signal strength,peak time, entry time, exit time, Bluetooth device information and access pointinformation is continuously logged to a database.
T r a c k i n g
I d
E n t e r T i m e
E x i t T i m e
P e a k T i m e
Z o n e
B l u e t o o t h D e v i c e
M a x R S S I
L b s Z o n e
I d
Z o n e
P a r e n t _ I d
B l u e t o o t h A d d r e s s
I d
A c t i v a t e d
B l u e t o o t h A d d r e s s
C l a s s O f D e v i c e
M o b i l e M a n u f a c t u r e r
M o b i l e M o d e l
R e g i s t e r e d
U s e r N a m e
Figure 3: BLIP source schema.
The table configuration of the database is based on the data schema seenin Figure 3. The data schema consists of a main table, Tracking, and twosupporting tables, namely LbsZone and BluetoothAddress. The trackingtable contains EnterTime, ExitTime, PeakTime, and MaxRSSI as well as twoforeign keys to the supporting tables. BluetoothAddress includes more datathan the name indicates, as it also contains miscellaneous data retrieved bythe access points. BLIP has prepared to include additional personal metadatathrough the Registered and UserName attributes. However, BLIP is not usingthese values in the data set. The name of a zone is stored in the Zone attributein the LbsZone table. The attribute Parent Id is used to describe a parent-childrelationship between zones, which is used to define zones as a tree-structure witharbitrary height.
3.2 Copenhagen Airport Implementation
BLIP have this tracking solution implemented in CPH where they collect up to500.000 tracking records per day, distributed over up to 6.500 unique devices.Figure 4 shows a part of the CPH access point setup. The airport is physicallydivided into three areas, the land area represented with the light grey coloron Figure 4, the fly area represented with the dark grey color, and a securityarea connecting the two areas. E.g. the security area and the immediate areasurrounding it is covered by access point 16, 17 and 18. The issue of dividingthe airport into different areas will be addressed further in Section 4.1. A mapover the entire BLIP access point setup can be seen in Appendix A.
The data set provided by BLIP is sampled over a period from 04/23/2008to 10/16/2008, registering 21 million tracking records distributed on 310.000unique devices sampled from 25 access points. However, problems occurredwith the system resulting in an incomplete data set. The majority of the 25access points were running as intended from 04/23/2008 to 05/23/2008. The
2 Timestamp that indicates when the signal was strongest.
7

3 The BLIP Systems Data Set
Figure 4: Extract of the access point setup.
remaining period, from 05/23/2008 to 10/26/2008, had 12 operational accesspoints in average.
In the CPH access point setup, the access points do not provide completecoverage of the airport, which is partly to limit the amount of data to processand because only some areas are relevant to monitor. The access points areplaced in so called hot spots, areas of particular interest. These hot spots aretypically chosen to be areas where most passengers must pass by at some time,such as entry points, exit points, bottleneck passages, gates and security checks,and areas where passengers spend time, such as waiting areas, queuing areas,shopping areas and other areas that might have specific interest to the airportadministration.
When tracking passengers movement in an airport, we need to define somemeasurements indicating the amount of time spent in the airport. A simplemeasure is to look at the passengers dwell time in different areas of the airport.BLIP defines dwell time as texit − tenter, where tenter is the time a device isfirst detected near an access point and texit is the last detection of that devicebefore it moves to another access point.
In order to take the areas that are not covered by access points into accountwe introduce the notion of idle time, i.e. the time a passenger spends in betweentwo access points. We define idle time as tenter − texit, where tenter is the entertime at the current access point and texit is the exit time from the previousaccess point.
The data schema BLIP is using to store the data set is simple and is notnormalized, so it contains a high degree of redundancy. With the right indexes itcan be used to answer simple statistical queries within acceptable time, e.g Whatis the average dwell time of visitors in year 2008?. The airport is interested inlearning more about the movement of devices within the airport in terms of bothdwell- and idle time, however these are facts that are not stored in the currentschema. While the calculation of dwell- and idle time are trivial for each trackingrecord, it is not possible to write efficient queries on these measurements andhow they change over time.
We propose a multidimensional schema in Section 4 which joined with OLAP(Online Analytic Processing) [6] tools can provide fast results to these moreadvanced historical analysis queries. An example of an advanced query could beWhat is the average dwell time of visitors on weekends compared to weekdays?.
8

F a c t _ T r a c k i n g
E n t e r T i m e : k e y
E x i t T i m e : k e y
P e a k T i m e : k e y
E n t e r T i m e U T C : k e y
E x i t T i m e U T C : k e y
P e a k T i m e U T C : k e y
E n t e r D a t e : k e y
E x i t D a t e : k e y
P e a k D a t e : k e y
E n t e r D a t e U T C : k e y
E x i t D a t e U T C : k e y
P e a k D a t e U T C : k e y
L o c a t i o n : k e y
L a s t L o c a t i o n : k e y
B l u e t o o t h D e v i c e : k e y
D w e l l T i m e : i n t
I d l e T i m e : i n t
M a x R S S I : i n t
C l a s s i f i c a t i o n : k e y
D i m e n s i o n _ L o c a t i o n
I D : i n t
L o c a t i o n I D : i n t
L o c a t i o n N a m e : s t r i n g
Z o n e I D : i n t
Z o n e N a m e : s t r i n g
A r e a I D : i n t
A r e a N a m e : s t r i n g
S i t e N a m e : s t r i n g
D i m e n s i o n _ B l u e t o o t h D e v i c e
I D : i n t
B l u e t o o t h A d d r e s s : b i g i n t
M o b i l e M a n u f a c t u r e r : s t r i n g
M o b i l e M o d e l : s t r i n g
C l a s s O f D e v i c e : s t r i n g
F l y e r F r e q u e n c y : i n t
U s e r N a m e : s t r i n g
F u l l N a m e : s t r i n g
A d d r e s s : s t r i n g
C i t y : s t r i n g
C o u n t r y : s t r i n g
P o s t a l C o d e : i n t
D i m e n s i o n _ D a t e
I D : i n t
Y e a r : i n t
S e m e s t e r : i n t
Q u a r t e r : i n t
M o n t h : i n t
D a y O f M o n t h : i n t
D a y O f Y e a r : i n t
D a t e T y p e : s t r i n g
D a y O f W e e k : i n t
D i m e n s i o n _ T i m e O f D a y
I D : i n t
H o u r : i n t
M i n u t e : i n t
S e c o n d : i n t
T i m e O f D a y T y p e : s t r i n g
D i m e n s i o n _ C l a s s i f i c a t i o n
I D : i n t
C l a s s i f i c a t i o n N a m e : s t r i n g
Figure 5: The proposed data warehouse schema.
4 Data Warehouse Design
To support Business Intelligence analysis, and thereby answer the questions in-troduced in Section 1, we propose the data warehouse design shown in Figure 5.The proposed multi-dimensional database schema is a star schema with one facttable and five dimension tables. The star schema is less complex compared toa snow flake schema where the dimensions are partly normalized. In this case,the storage saved by normalizing the dimensions is not worth the performancepenalty obtained from the multiple joins needed to query the dimensions in asnowflake schema. In Section 4.1, the different dimensions are described, afterwhich the fact table is introduced to link all the dimensions to the facts andcalculated measures in the fact table. As seen in Figure 5, the date and timehas been split up into two dimensions in order to save records compared to acombined dimension table. If date and time were modeled in one table therecould be over 86400 records for each day. In a year that would give over 31 mil-lion records in the dimension which could result in a slow query performance.Another reason for splitting up the two dimensions is that queries are normallyperformed on either a date basis or a time of day basis.
As seen in the Figure 5, all the dimension tables have their own surrogatekey, ID, which is common practice used to give dimensions a unique key, and toprepare the design for slowly changing dimensions [6]. The rest of the attributes,e.g. version timestamps and expiration timestamp, needed to handle slowlychanging dimensions, has not been implemented since it is not relevant in thecurrent case.
9
4 Data Warehouse Design
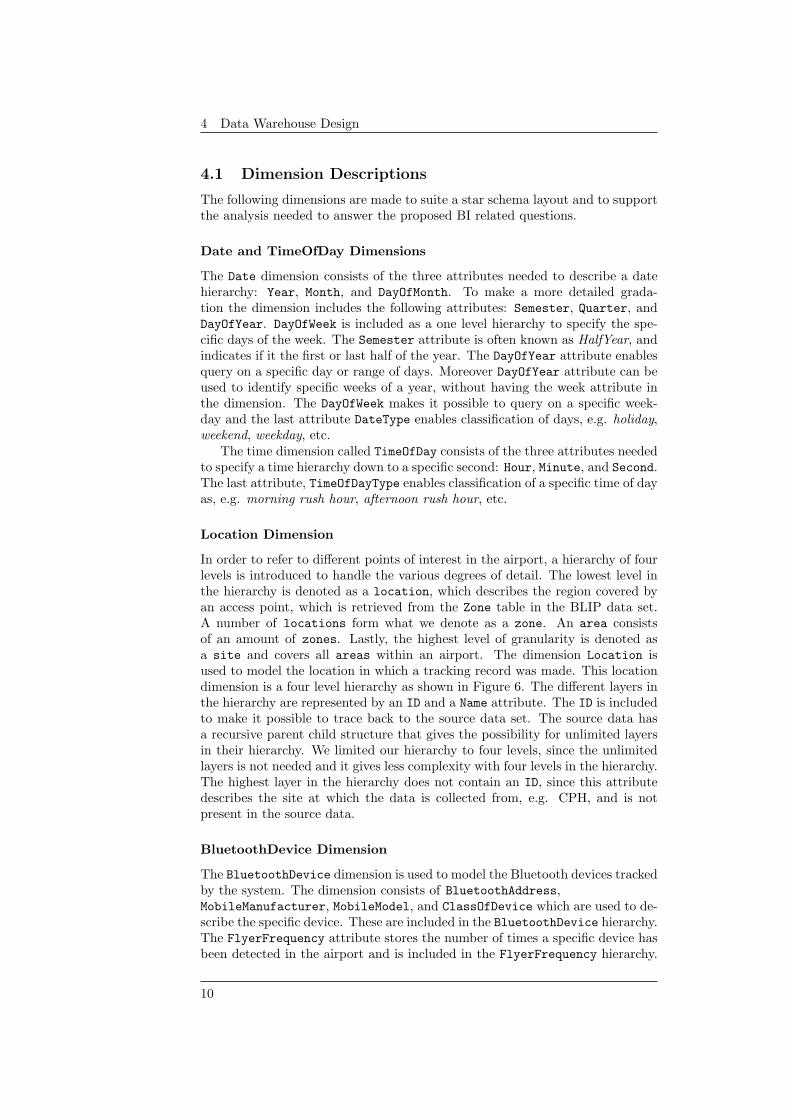
4.1 Dimension Descriptions
The following dimensions are made to suite a star schema layout and to supportthe analysis needed to answer the proposed BI related questions.
Date and TimeOfDay Dimensions
The Date dimension consists of the three attributes needed to describe a datehierarchy: Year, Month, and DayOfMonth. To make a more detailed grada-tion the dimension includes the following attributes: Semester, Quarter, andDayOfYear. DayOfWeek is included as a one level hierarchy to specify the spe-cific days of the week. The Semester attribute is often known as HalfYear, andindicates if it the first or last half of the year. The DayOfYear attribute enablesquery on a specific day or range of days. Moreover DayOfYear attribute can beused to identify specific weeks of a year, without having the week attribute inthe dimension. The DayOfWeek makes it possible to query on a specific week-day and the last attribute DateType enables classification of days, e.g. holiday,weekend, weekday, etc.
The time dimension called TimeOfDay consists of the three attributes neededto specify a time hierarchy down to a specific second: Hour, Minute, and Second.The last attribute, TimeOfDayType enables classification of a specific time of dayas, e.g. morning rush hour, afternoon rush hour, etc.
Location Dimension
In order to refer to different points of interest in the airport, a hierarchy of fourlevels is introduced to handle the various degrees of detail. The lowest level inthe hierarchy is denoted as a location, which describes the region covered byan access point, which is retrieved from the Zone table in the BLIP data set.A number of locations form what we denote as a zone. An area consistsof an amount of zones. Lastly, the highest level of granularity is denoted asa site and covers all areas within an airport. The dimension Location isused to model the location in which a tracking record was made. This locationdimension is a four level hierarchy as shown in Figure 6. The different layers inthe hierarchy are represented by an ID and a Name attribute. The ID is includedto make it possible to trace back to the source data set. The source data hasa recursive parent child structure that gives the possibility for unlimited layersin their hierarchy. We limited our hierarchy to four levels, since the unlimitedlayers is not needed and it gives less complexity with four levels in the hierarchy.The highest layer in the hierarchy does not contain an ID, since this attributedescribes the site at which the data is collected from, e.g. CPH, and is notpresent in the source data.
BluetoothDevice Dimension
The BluetoothDevice dimension is used to model the Bluetooth devices trackedby the system. The dimension consists of BluetoothAddress,MobileManufacturer, MobileModel, and ClassOfDevice which are used to de-scribe the specific device. These are included in the BluetoothDevice hierarchy.The FlyerFrequency attribute stores the number of times a specific device hasbeen detected in the airport and is included in the FlyerFrequency hierarchy.
10

4.1 Dimension Descriptions
Al l
S i t e
Z o n e
A r e a
L o c a t i o n
Figure 6: Location hierarchy.
Al l
C l a s s O f D e v i c e
M o b i l e M o d e l
M o b i l e M a n u f a c t u r e r
B l u e t o o t h A d d r e s s
C o u n t r y
C i t y
P o s t a l C o d e
A d d r e s s
F u l l N a m e
U s e r n a m e
F l y e r F r e q u e n c y
Figure 7: Bluetooth device dimension hierarchies.
Flyer frequency calculation is described in Section 5.2. The remaining six userinformation attributes are included to prepare the layout for future implemen-tation of users into the BluetoothDevice dimension. The hierarchies of theBluetoothDevice dimension are shown in Figure 7.
Classification Dimension
The Classification dimension enables classification of the tracking recordsin the data warehouse e.g. ok, wrong time, etc. Classification is utilized in,e.g. the bounce detection algorithm, Section 5.3, to mark tracking records asModifiedBounceRecord. This enables querying on specific parts of the data set,e.g. to only query on data that is not classified as ModifiedBounceRecord. Theclassification string is stored in the attribute called ClassificationName.
Fact Tracking
The Tracking fact table binds the tracking records to the relevant entries in thedimensions. The relations to the TimeOfDay and Date dimension are representedtwice for each datetime attribute from the source data. This is to store boththe wall clock time, and the UTC time when considering tracking records fromdifferent sites, e.g. CPH. Another solution for the UTC time would be to includeextra attributes into the TimeOfDay and Date dimensions and then create twohierarchies in each dimensions, one representing UTC and one representing wallclock. We chose the current solution where we doubled the amount of timeand date keys, to simplify loading the data through the ETL, considering theproblems occurring when the UTC time and wall clock time are on differentdates. The two attributes Location and LastLocation link to the locations in
11
4 Data Warehouse Design
which the specific device was detected and previously detected. The computedDwellTime and IdleTime of a given device is stored in the DwellTime andIdleTime attributes and the maximum signal strength is stored in the MaxRSSIattribute.
4.2 Cube design
We build a multidimensional cube on top of the the previously described datawarehouse design. This will be described in the following section, starting withthe different measures and calculations.
Aggregations have been implemented to speedup the browsing process ofthe cube. The aggregation design is primarily done by utilizing the built-inaggregation optimization algorithms in Microsoft Business Intelligence Studioand will therefore not be discussed further in this report.
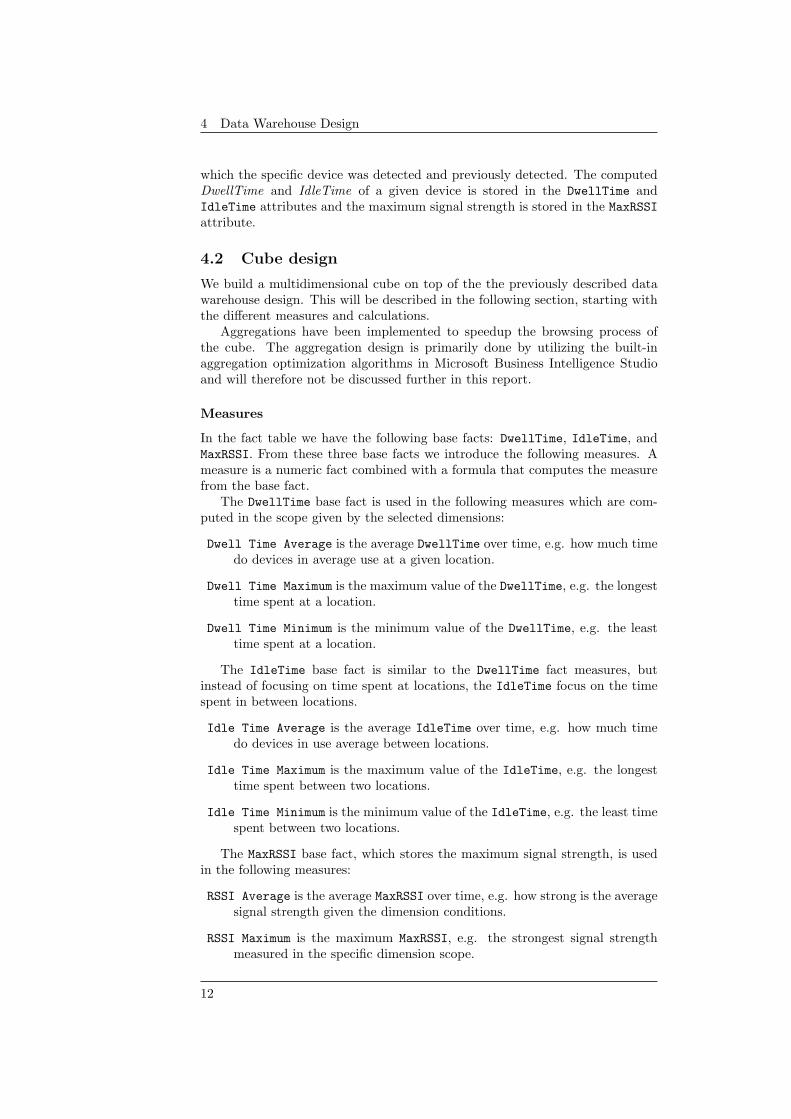
Measures
In the fact table we have the following base facts: DwellTime, IdleTime, andMaxRSSI. From these three base facts we introduce the following measures. Ameasure is a numeric fact combined with a formula that computes the measurefrom the base fact.
The DwellTime base fact is used in the following measures which are com-puted in the scope given by the selected dimensions:
Dwell Time Average is the average DwellTime over time, e.g. how much timedo devices in average use at a given location.
Dwell Time Maximum is the maximum value of the DwellTime, e.g. the longesttime spent at a location.
Dwell Time Minimum is the minimum value of the DwellTime, e.g. the leasttime spent at a location.
The IdleTime base fact is similar to the DwellTime fact measures, butinstead of focusing on time spent at locations, the IdleTime focus on the timespent in between locations.
Idle Time Average is the average IdleTime over time, e.g. how much timedo devices in use average between locations.
Idle Time Maximum is the maximum value of the IdleTime, e.g. the longesttime spent between two locations.
Idle Time Minimum is the minimum value of the IdleTime, e.g. the least timespent between two locations.
The MaxRSSI base fact, which stores the maximum signal strength, is usedin the following measures:
RSSI Average is the average MaxRSSI over time, e.g. how strong is the averagesignal strength given the dimension conditions.
RSSI Maximum is the maximum MaxRSSI, e.g. the strongest signal strengthmeasured in the specific dimension scope.
12

RSSI Minimum is the minimum MaxRSSI. e.g. the weakest signal strength mea-sured in the specific dimension scope.
Besides measures computed from the base facts, we also include the followingmeasures which are computed from the fact table:
Bluetooth Device Distinct Count, which is the distinct number ofBluetoothDevice attribute values.
Location Distinct Count, which is the distinct number of Location at-tribute values.
Fact Tracking Count, which is the number of tracking records in the givendimension scope.
Fact Dimension
To support the BI related questions about DwellTime and IdleTime distribu-tion, the DwellTime and IdleTime needs to be clustered into groups. This isdone by creating a fact dimension also called a degenerate dimension [2] on thefact table attribute DwellTime and IdleTime. This dimension then clusters theDwellTime and IdleTime values into groups which are then used like a normaldimension.
Calculations
Percentage calculations was made to ease comparison of data when browsingthe cube. The calculation simply takes the tracking record count at currenthierarchy level and divide it with the tracking record count at the parent hi-erarchy level. Since this percentage calculation uses the dimension hierarchywhen counting the tracking records it needs to be specified for each dimensionin which it is to be used. We have made the percentage calculation for thefollowing dimensions:
Location Fact count calculation enables comparison on percentage of track-ing records per location.
DwellTime Fact count calculation enables comparison on percentage of track-ing records per dwell time group.
TimeOfDay Fact count calculation enables comparison on percentage of track-ing records per TimeOfDay entry.
5 Extract Transform Load
In this section we present the Extract-Transform-Load application designed toload BLIP’s data set into the data warehouse design presented in Section 4. Inthe following overview we present the abstract layered architecture of the ETL,followed by the data types used in this section, the selection criteria used inthe extraction layer and finally some problems with the source data that willbe handled in the transformation layer. In Section 5.2 we present the FrequentFlyer Analysis used in the transformation layer and in Section 5.3 we presentan algorithm that solves one of the problems with the source data.
13
5 Extract Transform Load
5.1 ETL Overview
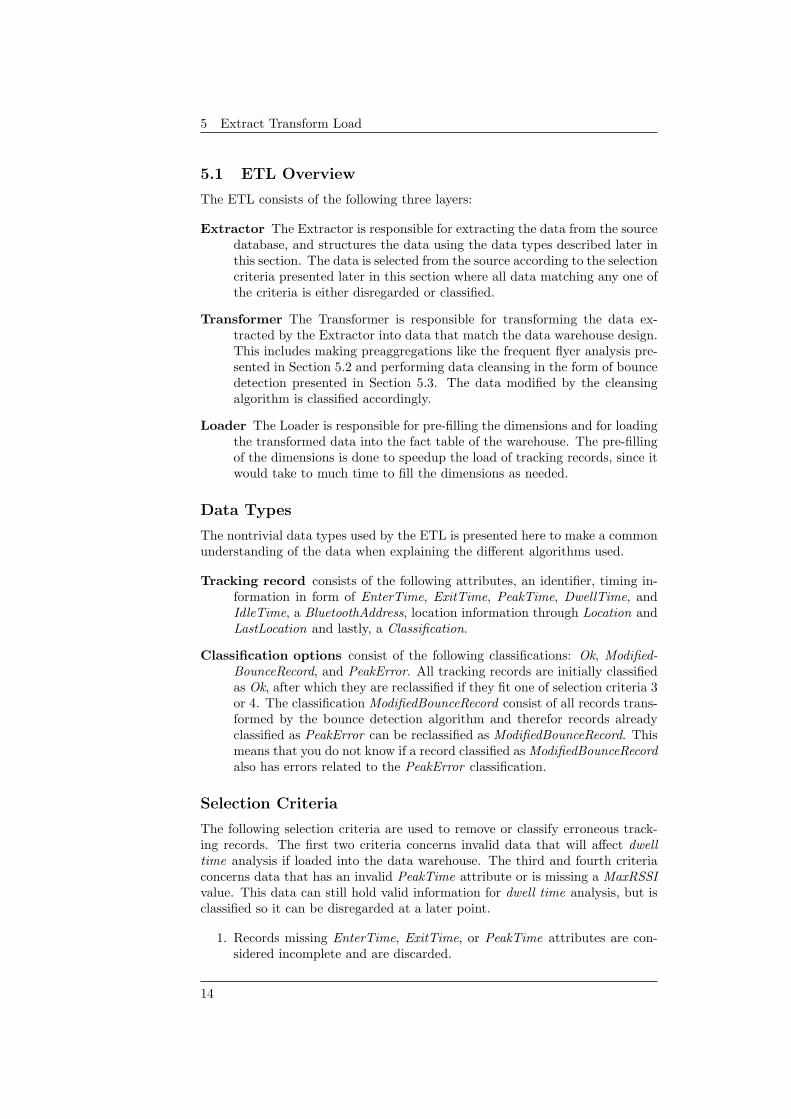
The ETL consists of the following three layers:
Extractor The Extractor is responsible for extracting the data from the sourcedatabase, and structures the data using the data types described later inthis section. The data is selected from the source according to the selectioncriteria presented later in this section where all data matching any one ofthe criteria is either disregarded or classified.
Transformer The Transformer is responsible for transforming the data ex-tracted by the Extractor into data that match the data warehouse design.This includes making preaggregations like the frequent flyer analysis pre-sented in Section 5.2 and performing data cleansing in the form of bouncedetection presented in Section 5.3. The data modified by the cleansingalgorithm is classified accordingly.
Loader The Loader is responsible for pre-filling the dimensions and for loadingthe transformed data into the fact table of the warehouse. The pre-fillingof the dimensions is done to speedup the load of tracking records, since itwould take to much time to fill the dimensions as needed.
Data Types
The nontrivial data types used by the ETL is presented here to make a commonunderstanding of the data when explaining the different algorithms used.
Tracking record consists of the following attributes, an identifier, timing in-formation in form of EnterTime, ExitTime, PeakTime, DwellTime, andIdleTime, a BluetoothAddress, location information through Location andLastLocation and lastly, a Classification.
Classification options consist of the following classifications: Ok, Modified-BounceRecord, and PeakError. All tracking records are initially classifiedas Ok, after which they are reclassified if they fit one of selection criteria 3or 4. The classification ModifiedBounceRecord consist of all records trans-formed by the bounce detection algorithm and therefor records alreadyclassified as PeakError can be reclassified as ModifiedBounceRecord. Thismeans that you do not know if a record classified as ModifiedBounceRecordalso has errors related to the PeakError classification.
Selection Criteria
The following selection criteria are used to remove or classify erroneous track-ing records. The first two criteria concerns invalid data that will affect dwelltime analysis if loaded into the data warehouse. The third and fourth criteriaconcerns data that has an invalid PeakTime attribute or is missing a MaxRSSIvalue. This data can still hold valid information for dwell time analysis, but isclassified so it can be disregarded at a later point.
1. Records missing EnterTime, ExitTime, or PeakTime attributes are con-sidered incomplete and are discarded.
14

5.1 ETL Overview
2. Records with ExitTime < EnterTime are invalid and are discarded.
3. Records with EnterTime > PeakTime, or PeakTime > ExitTime are clas-sified as PeakError.
4. Records missing the MaxRSSI attribute are also classified as PeakError.
Bounce Problem
The data gathering application used to gather the BLIP data set is not designedto handle devices that are tracked in more than one location at a time. Thismeans that when a device is located in an area that is covered by more than oneaccess point the data gathering application creates bounce records. An exampleof this is shown in Figure 8 where the grey areas are overlapping areas. If adevice is traversing though AP1, AP2, AP3, and AP4 as indicated by the red line,there is a large possibility that the system will generate bounce records whenthe device is located in the grey areas.
A P 1
A P 2
A P 3
A P 4
Figure 8: Bounce problem scenario.
The problem with these bounce records is that they can have a very negativeeffect when analyzing the dwell time of devices. This is because a device that islocated in an area covered by multiple access points can produce many trackingrecords with a dwell time of 0 seconds. Summing up the dwell time of theserecords will produce an inaccurate total time spent in the areas by the deviceand lower the average dwell time.
In order to compensate for these inaccurate results, we propose a BounceDetection algorithm in Section 5.3.
15

5 Extract Transform Load
5.2 Frequent Flyer Analysis
As Section 1 states, one of the BI questions that we would like to answer is ifthere is a difference between how different types of people interact in the airport.A method to distinguish people is how often they appear in the airports, i.e.tourists will travel less frequent than businessmen. A frequent flyer is a person,who visits the airport more than once. The notion frequent flyer covers seeinga device entering and exiting the airport a number of times with at least aimplementation specific threshold between each visit. It does not cover anyinformation about if there are certain patterns within each occurrence, but ismerely a number, denoted as flyer frequency, representing how often the devicehas been seen in the airport. A visit describes the enter time and leave time forone distinct appearance in the airport from a given device.
The identification of frequent flyers is done by examining each trackingrecord in the entire data set, and keeping track of when a device was last seen.If the time between the last point of time where a device has been spotted andthe point of enter time of a new tracking object exceeds a pre-defined thresh-old, then the flyer frequency for the device in question is incremented. Whenperforming these operations on each element in the data set, the output is a setdescribing the flyer frequency for each device.
Example If given two passengers A and B where, A has two visits, namely8.00-8.30 and 15.00-15.30 and B has two visits, namely 8.00-8.30 and 17.00-17.30and the flyer frequency threshold is set to eight hours. The flyer frequency wouldget incremented once for passenger A and twice for passenger B.
The algorithm for calculating flyer frequency can be seen in Algorithm 1.The algorithm uses two data types, a tracking record tr as defined in Sec-tion 5.1 and a temporary device td. The td type contains three attributes,BluetoothAddress to identify which device it represents, FlyerFreqency repre-senting the frequency of the device in the current data set, and LastSeen usedto keep track of when the device was last seen in any zone.
On Line 2 the algorithm starts to loop through all the tracking records inTRQ. If there all ready exists a temporary device record td for the currenttracking record device in the device set DS, the record is extracted in Line 4.The device record is removed from DS in Line 5 so it can be added again with theupdated attributes. If the time between the enter time of the current trackingrecord and the last seen attribute of the device exceeds the given threshold, theflyer frequency is incremented and last seen is updated. Otherwise only the lastseen attribute is updated. On Line 12 the updated td is added to DS.
Line 14 to 17 handles the case the device of the tracking record is not pre-viously registered in DS. A new temporary device record is created with thedevice information, flyer frequency is set to 1 and the record is added to DS.
5.3 Bounce Detection
As a solution to the bouncing problem presented in Section 5.1 we propose abounce detection algorithm.
To describe the algorithm a clear definition of the following terms is needed.Bounce threshold is an implementation specific threshold set according to the
16

5.3 Bounce Detection
Algorithm 1: FlyerFrequencyCalculation(TRQ, threshold), calcu-late flyer frequency per device given a queue of tracking records orderedby ascending enter time and a threshold. Returns a set of device recordswith the calculated flyer frequency.
DS ← ∅;1
while tr ← TRQ.dequeue() do2
if trBluetoothAddress ∈ DS then3
td← The element td from DS where4
tdBluetoothAddress = trBluetoothAddress;DS ← DS\{td};5
if trEnterT ime − tdLastSeen > threshold then6
tdFlyerFreqency ← tdFlyerFreqency + 1;7
tdLastSeen ← trExitT ime;8
else9
tdLastSeen ← trExitT ime;10
end11
DS ← DS ∪ {td};12
else13
tdBluetoothAddress ← trBluetoothAddress;14
tdFlyerFreqency ← 1;15
tdLastSeen ← trExitT ime;16
DS ← DS ∪ {td};17
end18
end19
Return DS;20
constraints of the given data set. We define a bounce record as a tracking recordwith dwell time < bounce threshold for bounce threshold > 0. We define a bounceregion as a time span in which a device produces only bounce records and theidle time between the records is less than bounce threshold. The terms bouncerecord and bounce region are clarified by the following example.
Example Figure 9 presents an example of a device that moves through thearea presented in Figure 8 on page 15. At time t0 the device is detected byAP1, and at time t1 the device starts to bounce between AP1 and AP2, whichstarts the bounce region, until t2. As the device moves around the area coveredby multiple access points, the bounce region continues. The device is next beingtracked through a number of bounce records between AP2 and AP3 in the times-pan from t2 to t3. In the timespan from t3 to t4, the device is seen in threedifferent access points, AP1, AP2 and AP3. The last part of the bounce region isfrom t5 to t6, where the device is seen at both AP1 and AP3. At time t5 thebounce region ends because the device produces a tracking record with a dwelltime > bounce threshold in AP3. At time t6 the device makes a clean shift fromAP3 to AP4 with no bounce records.
By using this Bounce Detection approach, there can be tracking recordsthat are not actually bouncing between two or more locations yet they will be
17

5 Extract Transform Load
classified as such. E.g. if you have a device that reappears in a single locationwith a short and dwell- and idle time each time the device is tracked, then thecurrent device creates a bounce region even though it is only been tracked fromone location. This produces misleading data classification as the bounce recordsshould be classified as ok, yet are classified as ModifiedBounceRecord.
Figure 9: Time line example showing the tracking history of the device move-ment shown in Figure 8. Each solid white box represents a clean tracking record,and the greyed boxes represent many bounce records. The red line presents anexample of the tracking record distribution.
The Bounce Detection algorithm is shown in Algorithm 2. The algorithmtakes an ordered queue of tracking records (TRQ) as input and the previouslymentioned bounce threshold.
From Line 2 to 17 in the algorithm every tracking record tr is processed todetect bounce regions and eliminate the bounce records in these.
On Line 3 in the algorithm, a queue (BE) of all previous bounce recordsfrom BQ with the same Bluetooth Address as the current tr, is created. OnLine 4 the dwell time of tr is compared to Bouncethreshold. Bouncethreshold
is an implementation specific variable that needs to be set according to theconstraints of the given data set. Empirical tests with this value are presentedin Section 6.1. If the dwell time of tr is larger than Bouncethreshold this ends thecurrent bounce region and all bounce records in BE are removed from BQ. OnLine 6 to 7 the Bounce Elimination algorithm presented later in this Section,is run on the records in BE and an AddToLoadQueue function is run on thecurrent tr. AddToLoadQueue takes a processed tracking record and adds it toa queue of records that are ready to be loaded into the data warehouse. OnLine 9 to 14 the algorithm handles the case where dwell time of tr is less thanor equal to Bouncethreshold. If the idle time of tr is unknown or less thanBouncethreshold we add tr to BQ, which continues the current bounce regionor starts a new one. Otherwise, we end the current bounce region by removingthe records in BE from BQ, running the Bounce Elimination algorithm on BEand add tr to BQ to start a new bounce region.
To process all bounce records left in BQ a set (BT ) of the Bluetooth addresses
18

5.3 Bounce Detection
of the devices that still have records in BQ is created in Line 18. From Line 19to 23 all the remaining bounce records in BQ are processed.
Algorithm 2: BounceDetection(TRQ, Bouncethreshold), detect bounceregions within a queue of tracking records ordered by ascending enter time.
BQ.clear();1
while tr ← TRQ.dequeue() do2
BE ← Queue of tracking records t from BQ where3
tBluetoothAddress = trBluetoothAddress;if trDwellT ime > Bouncethreshold then4
Remove all elements in BE from BQ;5
BounceElimination(BE) ;6
AddToLoadQueue(tr) ;7
else8
if trIdleT ime < Bouncethreshold ∨ trIdleT ime = Unknown then9
BQ.enqueue(tr);10
else11
Remove all elements in BE from BQ;12
BounceElimination(BE);13
BQ.enqueue(tr);14
end15
end16
end17
BT ← Set of all unique BluetoothAddress in BQ;18
foreach bt ∈ BT do19
BE ← Queue of tracking records t from BQ where20
tBluetoothAddress = bt;Remove all elements in BE from BQ;21
BounceElimination(BE);22
end23
Bounce Elimination
The Bounce Elimination algorithm is shown in Algorithm 3. It takes a queueof bounce records detected as a bounce region and eliminates the bounce recordsby combining them into as few records as possible.
On Line 1 the algorithm handles the case where there is only 1 bounce recordin BE. The bounce record is simply added unmodified to loader since there areno other records to combine it with.
If there is more than one record in BE, the start and end time of the bounceregion is found in Line 5 and 6. The start time is set to the minimum enter timeand the end time is set to the maximal exit time of all the records in the bounceregion. On Line 7 a set (L) of all locations in the bounce region is created. Inthe case that only 1 location is part of the bounce region, a new tracking recordis created and added to the load queue in Line 8 to 15.
If more than one location is part of the bounce region a new tracking recordfor each location is created in Line 18 to 28. The value of regiontotal representsthe total time span of the bounce region in seconds and toffset is the amount
19

5 Extract Transform Load
Algorithm 3: BounceElimination(BE), given a queue of bounce recordsit creates new records that match all locations and time span of the bounceregion.
Input: Queue of bounce records BE ordered by enter time ascendingif BE.length() = 1 then1
br ← BE.dequeue();2
AddToLoadQueue(br);3
else4
regionStart ← brEnterT ime, where br is the element i BE with the5
lowest enter time;regionEnd ← brExitT ime, where br is the element in BE with the6
highest exit time;L← Queue of all unique Location in BE ordered be enter time;7
if L.length() = 1 then8
br ← Any element from BE;9
brEnterT ime ← regionStart;10
brExitT ime ← regionEnd;11
brDwellT ime ← brExitT ime − brEnterT ime;12
brClassification ← ModifiedBounceRecord ;13
AddToLoadQueue(br);14
else15
regionTotal ← regionEnd − regionStart ;16
tOffset ← 0;17
while loc← L.dequeue() do18
tCount ← The number of elements br in BE where19
brLocation = loc;tDwellT ime ← ( tCount
|BE| ∗ regionTotal);20
br ← Any element br from BE where brLocation = loc;21
brEnterT ime ← regionStart + tOffset;22
brExitT ime ← brEnterT ime + tDwellT ime;23
brDwellT ime ← tDwellT ime;24
brClassification ← ModifiedBounceRecord ;25
AddToLoadQueue(br);26
tOffset ← tOffset + tDwellT ime;27
end28
end29
end30
of dwell time already allocated to already processed locations in the currentbounce region. On Line 19 the total amount of tracking records for the givenlocation is counted in order to make a weighted distribution of the regiontotal
on Line 20. This is done to divide the total time of the bounce region accordingto the amount of tracking records produced for a given location. On Line 21 to25 the new tracking record is created and classified as a ModifiedBounceRecord.The record is then added to the load queue and toffset is updated.
20

6 Results
In this section we present experimental results to support the Bouncethreshold
setting introduced in Section 5.3 and analysis of the BI related questions intro-duced in Section 1.
The data warehouse design presented in Section 4 has been implemented inMicrosoft SQL Server 2008, the cube design presented in Section 4.2 has beenimplemented in Microsoft Analysis Services using MOLAP as the storage model,and we have used TARGIT BI Suite [4] to perform the analysis and create thegraphical output.
The analysis has been performed on a modern desktop computer, with adual core 2.66GHz CPU and 8 GB memory, running Windows Server 2008 64bitEdition. On this platform we can transform and load the entire BLIP data set inapproximately 30 minutes using the ETL, presented in Section 5, implemented inMicrosoft C# .NET. After the data is loaded it takes approximately 30 minutesto build the cube and process the aggregations in Analysis Services. When thedata is loaded and the cube is fully processed, TARGIT BI Suite is able togenerate each of the analysis results presented later in this section in near-realtime, i.e less than 10 seconds per result.
We have used the previously described data set collected at CPH. The dataset contains a total of 21,161,406 tracking records collected from 10-25 accesspoints. The number of access points vary, because not all access points wereactive in the whole period. During the selection phase (extraction of sourcedata) the ETL discarded 92,377 records and the transformation phase resultedin the removal of 2,549,718 tracking records. When all the data has been loadedinto the data warehouse there is a total of 18,519,311 tracking records in thefact table.
6.1 Bounce Detection Test
In this experiment we simulate loading the complete data set into the datawarehouse using different values (0 - 30 seconds) on the Bouncethreshold settingin the ETL. The simulation results are shown in Figure 10 and include the totalnumber of records loaded into the warehouse, the number of records classifiedas ModifiedBounceRecord, and the number of records classified as Ok.
The results show that the number of ModifiedBounceRecord records increasesrapidly in the beginning and flattens out at approximately a 7 second threshold.Figure 11 shows the increment in the number of records classified as Modified-BounceRecord at each Bouncethreshold in the interval. The figure shows thatthe flattening also starts at a 7 second Bouncethreshold.
Because we do not have the precise location and coverage radius of eachaccess point, we have to rely on intuition and the results presented in Figures 10and 11 to estimate the best Bouncethreshold setting. If Bouncethreshold is settoo high, records that are not actual bounce records, but merely people crossingin an access points peripheral, will be marked as bounce records. If it is set toolow, too few of the bounce records are eliminated. Based on the previous resultswe set the Bouncethreshold to 7 seconds, which eliminates 2.5 million bouncerecords.
21

6 Results
Figure 10: Effect of the Bouncethreshold attribute on the number of records.
Figure 11: Effect of the Bouncethreshold attribute on the increment of recordsclassified as ModifiedBounceRecord.
6.2 Analysis of BI Related Questions
In the following we present the results to answer the BI related questions in-troduced in Section 1. Figure 12 shows the number of active access pointsduring the entire span of the data set we are working on. The graph clearlyshows the many fluctuations caused by the offline access points as mentioned inSection 3.2. The results presented in this section are, unless stated otherwise,based on data collected from 04/23/2008 - 05/30/2008, since this is the periodin which we have the most complete data set.
How often have visitors been seen in the airport?
To show how often visitors have been seen in the airport we query the cube withthe Bluetooth Device Distinct Count as the fact measure, grouped by theFlyerFrequency hierarchy from the BluetoothDevice dimension. Because theflyer frequency is computed on the entire data set, this graph is also computed
22

6.2 Analysis of BI Related Questions
2008 S1 Q2 Apr 23 2008 S1 Q2 May 3 2008 S1 Q2 May 14 2008 S1 Q2 May 25 2008 S2 Q3 Jul 14 2008 S2 Q3 Jul 25 2008 S2 Q3 Aug 5 2008 S2 Q4 Oct 8
25
24
23
22
21
20
19
18
17
16
15
14
13
12
11
10
9
8
7
6
5
4
3
2
1
0
Dates
Num
ber o
f Loc
atio
ns
Figure 12: Number of monitored locations over time.
on the complete data set. The result shown in Figure 13 is limited to a maximumflyer frequency of 30 to make the graph more readable.
How is the visitor load distributed over the weekdays?
To show the distribution of visitors in the airport on the different days of theweek, we query the cube with Bluetooth Device Distinct Count as the factmeasure, grouped by the DayOfWeek hierarchy from the Date dimension. Theresult is shown in Figure 14. Surprisingly, the airport experiences the largestnumber of distinct visitors on Thursdays in this period.
How much time do visitors spend at the different locations in theairport?
To show how much time visitors spend in average in the different locations wequery the cube with the Average Dwell Time as the fact measure, grouped bythe Location hierarchy. The result is shown in Figure 15. The graph can beused by the airport administration to identify high congestion areas. Accordingto BLIP, the location named ”ms-spopos1.16”, covers part of the security andtax free shopping area. This is a valid explanation for the high dwell time inthis area.
How is the distribution of time spent at a specific location?
To show the distribution of time spent at a specific location, in this case the”ms-spopos1.16” location, we query the cube with the Fact Tracking Countas the fact measure grouped by the Grouped Dwell Time hierarchy from thedegenerate dimension and the location set as a criteria. The result is shown inFigure 16.
The graph shows a large number of records with a low DwellTime, whichcould be devices tracked in the peripheral of the access point or visitors quickly
23

6 Results
180,00 0160,000140,000120,000100,00080,00060,00040,00020,0000
1
23
45
67
89
101112
1314
15
16
1718
1920
2122
2324
25
26
2728
2930
176653 87819
20079 10326
4752
2874 1748
1208 844 579 462 365 257 256 191
160 136 104 135 94 110 59 75 51 55
42 51 31 47 50
Freq
uenc
y
Number of devices
Figure 13: Number of devices distributed over flyer frequency.
Sun Mon Tue Wed Thu Fri Sat
45,000
40,000
35,000
30,000
25,000
20,000
15,000
10,000
5,000
0
Week day
Num
ber o
f dev
ices
Figure 14: Number of distinct devices distributed over weekdays.
24

6.2 Analysis of BI Related Questions
ms-spop
os1.1
ms-spop
os1.10
01
ms-spop
os1.11
ms-spop
os1.12
ms-spop
os1.13
ms-spop
os1.14
ms-spop
os1.15
ms-spop
os1.16
ms-spop
os1.17
ms-spop
os1.18
ms-spop
os1.19
ms-spop
os1.2
ms-spop
os1.20
ms-spop
os1.21
ms-spop
os1.22
ms-spop
os1.23
ms-spop
os1.24
ms-spop
os1.26
ms-spop
os1.3
ms-spop
os1.4
ms-spop
os1.5
ms-spop
os1.6
ms-spop
os1.7
ms-spop
os1.9
ms-spop
os1.99
9
900
800
700
600
500
400
300
200
100
0
Locations
Aver
age
Dw
ellT
ime
Figure 15: Average DwellTime in the different locations.
passing through the location. We notice that the number of records slowlystart to increase as DwellTime gets larger, this could be explained by peoplestopping to look at merchandise in the tax free shopping area. We see that asmall number of people are staying in the location for a significantly long periodof time. We believe these people to be employees in the shop.
How is the distribution of time spent at different times of the day?
To show the distribution of DwellTime in the airport over 24 hours, we selectAverage Dwell Time as the fact measure grouped by the TimeOfDay hierarchy.The result shown in Figure 17 is a comparison between the average DwellTime inthe weekend (green area) and the weekdays (red area). To show how this relatesto the number of passengers we made a query on the number of devices over24 hours. This is done using Bluetooth Device Distinct Count as the factmeasure grouped by the TimeOfDay hierarchy and again made as a comparisonbetween weekend and the weekdays. This result is shown in Figure 18.
When examining the figures it can be seen that the number of passengershave a direct impact on the average time spent at locations in the airport,which could be caused by increased queue time caused by the increased densityin visitors in the airport. Another thing to notice is the early peak in thenumber of passengers flying early in the weekdays and the peak in the numberof passengers flying late afternoon in the weekends. This information could bevery useful for the airport when deciding on the number of staff needed duringa week.
25

6 Results
0 -
01
- 1
2 -
23
- 3
4 -
45
- 5
6 -
67
- 7
8 -
89
- 9
10 -
1011
- 11
12 -
1213
- 13
14 -
1415
- 15
16 -
1617
- 17
18 -
1819
- 19
20 -
2021
- 22
23 -
2324
- 24
25 -
2627
- 27
28 -
2930
- 30
31 -
3233
- 34
35 -
3637
- 38
39 -
4142
- 43
44 -
4546
- 48
49 -
5152
- 55
56 -
5859
- 62
63 -
6768
- 72
73 -
7980
- 86
87 -
9495
- 10
510
6 - 1
1711
8 - 1
3313
4 - 1
5215
3 - 1
7817
9 - 2
1221
3 - 2
6026
1 - 3
3233
3 - 4
5745
8 - 7
9980
0 - 8
1976
75,000
70,000
65,000
60,000
55,000
50,000
45,000
40,000
35,000
30,000
25,000
20,000
15,000
10,000
5,000
0
DwellTime distribution
Num
ber o
f rec
ords
Figure 16: Distribution of DwellTime in the tax free area.
0 h 0 m 1 h 6 m 2 h 20m 3 h 37m 4 h 54m 6 h 9 m 7 h 24m 8 h 41m 9 h 58m 11h 18m 12h 40m 14h 0 m 15h 20m 16h 42m 18h 2 m 19h 22 m 20h 44m 22h 4 m 23h 24 m
1,300
1,250
1,200
1,150
1,100
1,050
1,000
950
900
850
800
750
700
650
600
550
500
450
400
350
300
250
200
150
100
50
0
Time of day
Aver
age
Dw
ellT
ime
Figure 17: Average DwellTime in the weekends (green) and the weekdays (red)over TimeOfDay hierarchy.
26

6.2 Analysis of BI Related Questions
0 h 0 m 1 h 25m 3 h 0 m 4 h 32m 6 h 4 m 7 h 36m 9 h 8 m 10h 43 m 12h 25 m 14h 3 m 15h 41 m 17h 23 m 19h 1 m 20h 39 m 22h 21 m
6,50 0
6,00 0
5,50 0
5,00 0
4,50 0
4,00 0
3,50 0
3,00 0
2,50 0
2,00 0
1,50 0
1,00 0
500
0
Time of day
Num
ber o
f dev
ices
Figure 18: Distinct devices in the weekends (green) and the weekdays (red) overTimeOfDay hierarchy.
27

8 Future Work
7 Conclusion
The main focus of this report is to provide an effective way to provide historicalanalysis of the tracking data collected by BLIP in CPH. To achieve this wedesign and implement a data warehouse to suit the analysis and an ETL toload the data into the data warehouse. BLIP tracks Bluetooth devices in CPHto help the airport administration answer a series of BI related questions. Wepropose several BI related questions that can be answered by analyzing thedata.
To provide a motivational reason to get involved in this kind of project, wediscuss some of the different technologies that can be used for in-door tracking.These provide roughly the same features, but they vary greatly with respect tohow well they provide these features. We conclude that the choice of technologydepends entirely on the requirement of the project.
We present a data warehouse design based on a star schema and imple-ment this in Microsoft SQL Server 2008. We define the dimensions, dimensionhierarchies and measures necessary for analysis in Microsoft Analysis Services2008.
The ETL application developed in Section 5 extracts data from the BLIPdata set, then transforms the data to suit the data warehouse and finally loadsthe data into the warehouse. The ETL utilizes the proposed algorithms toperform data cleansing and classification and thereby reduces the total numberof records from approximately 21 to 18.5 million of which 4.2 million are markedas modified bounce records. The result of the transformation is directly seenwhen analyzing the data, since the data provides a more realistic measure ofthe dwell times in the different locations than before the transformation. Theclassification dimension allows the person performing the analysis to disregardany data modified in the transformation.
We show how the implemented solution can be used to answer the introducedBI related questions by utilizing Targit BI Suite to visualize the results. Bystudying the results we discover different tendencies like that CPH have themost visitors on Thursdays, and that the amount of visitors peak in the morningduring weekdays and at noon in the weekends.
8 Future Work
This section contains a description of topics for future work. We will describeeach new topic and the possible knowledge to derive from its analysis. Thissection is divided into two major areas of interest that we would like to address,namely flow analysis and real-time monitoring.
Flow Analysis
Flow analysis covers the ability to, based on the movements of the passengers inthe airport, do further classifications. The concept of flow analysis introducedas flyer frequency was found insufficient. One of the BI related questions thatwe would like to answer is How do transit passengers deviate from forced routesduring rush hour?. This question introduces two new concepts.
28

First, it redefines the flyer concept, since our flyer frequency cannot dis-tinguish between different types of people seen in the airport. If you haveinformation about where you track a device for the first and last time withina visit, you can classify people in the airport into, e.g., guests, that enter andleave through an entrance, transit passengers, that enter and leave through agate, departing passengers that enter at an entrance and leave at a gate, andarriving passengers that enter though a gate and leave though an entrance.
Second, it introduces forced routes, where a forced route is a route the personhas to follow, typically the shortest route, and a non-forced route is one thatdeviates from the forced route. A forced route can either be dictated by durationor a pattern, meaning if most people take 20 minutes to get from A to B, or aspecific route, e.g., the specific route from security to a gate. It would also beinteresting to find general patterns within the devices such as correlation.
The movement of people in an airport can be analyzed on various levels ofdetail depending on which information the airport wants to derive. We proposetwo different approaches namely visit and visitor movement to model movementin the airport into a format we can perform data analysis on.
Visit
A simple option is to consider flow as being an enter time and location and aleave time and location for a given device which can be implemented in variousways. This paragraph will describe a case utilizing a new fact table, and therebyexpanding the star schema to a constellation schema, and using this new facttable to store movement information. A concrete fact record will be denoted asa visit.
The current data warehouse schema should be expanded with a new facttable Fact Visit to incorporate visits. The table Fact Visit should share thedimensions Dimension TimeOfDay, Dimension Date,Dimension BluetoothDevice, and Dimension Location with Fact Tracking.Fact Visit consists of keys to model enter and leave time, keys to theDimension Location to describe enter- and leave location, andDimension BluetoothDevice to connect a visit to a device. Additionally, itcontains measures for duration of the visit for the given airport as well as totaldwell- and idle time.
Detecting visits would be a part of the ETL, namely in the transformationlayer. The frequent flyer algorithm, described in Section 5.2, can be modifiedto support visits by expanding it to include logic for determining type of visitand maintaining a data type that maps a device to a number of visits.
The fact table Fact Visit can be used for the airport to answer a numberof questions that were unanswerable with the current tracking fact table. Theairport is interested in having more device classification options than frequentflyer, such as guests, arriving-, departing-, and transit passengers. This wouldenable answering queries such as How many visits do transit passengers haveover a period of time?.
Visitor Movement
Rather than seeing flow as an entry point and an exit point, a more complexvisitor movement model is proposed. Visitor movement approaches flow differ-
29

8 Future Work
ently as it considers the movement inside the airport as important, and focuseson movement patterns. A pattern is an abstract representation of movement,that stores timing and locations bounded by a visit. Additionally, it would bepossible to look at sub-patterns within patterns. By representing movement insuch a way, the system would be able to answer more complex queries, e.g., Dopeople follow forced routes during rush hours?.
The visitor movement should be created each time the tracked device isconsidered to be on a new visit to the airport. Related work proposes a numberof ways to model movement [17] [5] such as tourists moving at a site or trackingnavigation on a website, which has techniques that are applicable for the CPHcase. The proposed Bounce Detection algorithms, as seen in Section 5.3, cleansesthe tracking records by combining bounce records into longer records. Havingfewer, longer records reduces the amount of possible patterns, which makes iteasier to find tendencies within movement patterns.
Real-Time Data Warehouse
Another interesting topic for future work would be to make a real-time datawarehouse implementation. A real-time data warehouse could give possibilitieslike prediction of device destinations and the usage of monitoring systems thatalerts the airport-, gate-, or security-personnel when congestion in certain areasexceed some threshold.
A real-time data warehouse could also be the underlying database, e.g., thedata warehouse presented in Section 4, for LBS services to the mobile deviceusers, e.g., the passengers would be able to receive information from the airportif they somehow identified themselves. The system could also provide assistancewith time management within the airport as it would help the users to arriveat the gate in time.
One approach for implementing this could be to develop a multidimensionaldatabase schema and implement this in both a MOLAP cube and ROLAP cube.This would give the possibility to query the MOLAP cube for historical data,and the ROLAP for real-time data. Since the ROLAP cube is much easier toupdate with new data, this could be used to hold the data for, e.g., one week.All data older than one week would then be loaded into the MOLAP cube.
30

REFERENCES
References
[1] Alexandra Instituttet A/S. Spopos project. http://www.spopos.dk,2007, Accessed: 12/19/2008.
[2] Bob Becker - Kimball Design Tip 46:. Another look at degeneratedimensions. www.rkimball.com/html/designtipsPDF/DesignTips2003/KimballDT46AnotherLook.pdf, 2003, Accessed: 12/19/2008.
[3] Bluetooth security review. http://www.securityfocus.com/infocus/1830, 2008, Accessed: 12/19/2008.
[4] Targit a/s. http://www.targit.com, 2008, Accessed: 12/19/2008.
[5] Jensen, A. H., Larsen, R. S., Pedersen, T. B., Andersen, J., An-dersen, J., Giversen, A., Giversen, A., Rune, L., Torben, S., Ped-ersen, B., Jensen, A., Skyt, J., and Skyt, J. Analyzing clickstreamsusing subsessions. In In Proceedings of the 3rd International Workshop onData Warehousing and OLAP (2000), ACM Press, pp. 25–32.
[6] Jensen, C. S., and Pedersen, T. B. Multidimensional databases andolap. Submitted to J. Hammer and M. Schneider (Ed.s): Handbook ofDatabase Technologies, CRC Press, forthcoming (2007).
[7] Lyngsoe Systems A/S. Lyngsoe systems a/s. http://www.lyngsoesystems.com, 2007, Accessed: 12/19/2008.
[8] Michal Lev-Ram - for Business 2.0 Magazine. Putting mobileservices on the map. http://money.cnn.com/2007/01/26/magazines/business2/gpsservices.biz2/index.htm, 2007, Accessed: 12/19/2008.
[9] Microsoft. Business intelligence capabilities. http://www.microsoft.com/bi/bicapabilities/default.aspx, 2008, Accessed: 12/19/2008.
[10] Path Intelligence Ltd. Our footpath technology. http://www.pathintelligence.com/website-prodnserv.htm, 2007, Accessed:12/19/2008.
[11] Path Intelligence Ltd. Path intelligence ltd. http://www.pathintelligence.com, 2007, Accessed: 12/19/2008.
[12] Purelink Technology Inc. Active rfid and real-time location sys-tem. http://www.purelink.ca/Product/Tags.aspx, 2008, Accessed:12/19/2008.
[13] Q.E.D. Systems, Savi Technologies. Active and passive rfid: Twodistinct, but complementary, technologies for real-time supply chainvisibility. http://www.autoid.org/2002_Documents/sc31_wg4/docs_501-520/520_18000-7_WhitePaper.pdf, 2002, Accessed: 12/19/2008.
[14] Tutorials Point. Gsm - addresses and identifiers. http://www.tutorialspoint.com/gsm/gsm_addressing.htm, 2007, Accessed:12/19/2008.
31

References
[15] Wikipedia. Bluetooth. http://en.wikipedia.org/wiki/Bluetooth#Uses, 2008, Accessed: 12/19/2008.
[16] Blip systems - bluetooth marketing solutions. http://www.blipsystems.com/, 2008, Accessed: 12/19/2008.
[17] Xia, J., Ciesielski, V., and Arrowsmith, C. Data mining of touristsspatio-temporal movement patterns —a case study on phillip island. Pro-ceedings of the 8th International Conference on GeoComputation (2005).
32

A BLIP systems access point setup
Chec
k-in
155
-93
Check-in 38-21
Check-in 1-18
12
45
3
A
CB
DTe
rmin
al 3
Term
inal
2
Tran
sfer
ce
nter
Arr
ival
Secu
rity
21 3
4
657
9
1016
17
23
26
2425
27
28
29
18
19
2032
2122
30
3534
33
1112
13
1415
Figure 19: BLIP systems access point setup.
33