a database of alkali metal-containing peptide cross...
TRANSCRIPT

Ao
JD
a
ARRAA
KIIP
1
ms[mRissaivTs
Ntcat[ta
1h
International Journal of Mass Spectrometry 330–332 (2012) 35–45
Contents lists available at SciVerse ScienceDirect
International Journal of Mass Spectrometry
journa l homepage: www.e lsev ier .com/ locate / i jms
database of alkali metal-containing peptide cross sections: Influence of metalsn size parameters for specific amino acids
onathan M. Dilger, Stephen J. Valentine, Matthew S. Glover, Michael A. Ewing, David E. Clemmer ∗
epartment of Chemistry, Indiana University, Bloomington, IN 47405, United States
r t i c l e i n f o
rticle history:eceived 19 March 2012eceived in revised form 27 April 2012ccepted 1 May 2012vailable online 29 August 2012
a b s t r a c t
Ion mobility/mass spectrometry techniques have been used to generate a cross section database con-taining 1772 entries (147 singly-, 1325 doubly-, and 300 triply-charged) for protonated and alkalatedtryptic peptide ions. Such a large number of values make it possible to assess the influence of alkalimetal cations [where the cation (M+) corresponds to Li+, Na+, K+, or Cs+] on peptide ion conformation.Peptide ion sizes generally increase with increasing cation size relative to the respective singly- or doubly-
2+
eywords:on mobility spectrometryntrinsic amino acid size parametereptide ion structure
protonated species. Intrinsic size parameters for individual amino acid residues for alkali [Pep+M+H]and [Pep+2M]2+ ions are similar to those obtained from the [Pep+2H]2+ ions. However, polar residues (Asp,Glu, Asn, Gln, His, and carboxyamidomethylated Cys), as well as Met, appear to be substantially smaller formetal-containing [Pep+M+H]2+ species compared with [Pep+2H]2+ species. This suggests these residuesform tight binding interactions with these metals. A discussion of these results and the implications
rovid
regarding structure are p. Introduction
Metal ions play key roles in enzymatic activity, cellularetabolism, and structural stabilization [1–4]. Because of this,
tructural studies aim to determine the locations of binding sites5–7], the nature of metal ion coordination [8–12], and the role that
etal–ligand interactions have on structure and function [2–4].ecently, the structures of metal-containing peptides and proteins
n the absence of solvent have been investigated [13–24]. Thesetudies are possible because of the development of soft ionizationources such as electrospray ionization (ESI) [25]. Interestingly, theddition of metals to electrospray solutions often influences theonization efficiency of macromolecules [26–33], and upon acti-ation, metal ions also influence fragmentation patterns [34–44].hese results suggest the existence of highly-specific metal-bindingites.
In this paper we examine the influence of alkali metal ions (Li+,a+, K+, and Cs+) on peptide structure by ion mobility spectrome-
ry (IMS) techniques. We report the first large database of collisionross sections for metal-containing peptides. The cross section ofn ion is related to its structure; compact geometries have rela-ively small cross sections compared with more open geometries
45–47]. In the present work we use the database of cross sectionso extract general trends in the sizes of the peptides upon associ-tion with different metals. The large scale of the database makes∗ Corresponding author.E-mail address: [email protected] (D.E. Clemmer).
387-3806/$ – see front matter © 2012 Published by Elsevier B.V.ttp://dx.doi.org/10.1016/j.ijms.2012.05.001
ed.© 2012 Published by Elsevier B.V.
it possible to extract information about the average contributionsof specific amino acids to the cross section (when containing thesedifferent metal ions). Several databases of cross sections for proton-ated peptides have been presented [48–51]. These data have beenused to derive intrinsic size parameters (ISP)s [48–52] as well asvolumes [53] for specific amino acid residues in the absence of sol-vent. Comparisons of these existing data to the metal ion databaseprovide insight to relatively detailed interactions that arise becauseof the presence of the metal ion.
We begin our analysis by comparing measurements for pro-tonated ions with values reported as a database of 660 crosssections for protonated peptides [50]. The database presentedbelow contains 1772 cross section entries (818 protonated and 954alkalated). The current measurements are carried out under differ-ent source conditions, using a substantially higher-resolving powerdrift tube. Thus, one difference between the data presented hereand prior work is that we observe more peaks from the higher-resolution measurement for individual peptides. With this said,overall there is good agreement between the values reported pre-viously and those reported here for protonated species giving ushigh confidence in the accuracy of values for the metal-containingspecies.
In IMS measurements, it is often assumed that identical crosssections for closely-related species are indicative of structuralhomology. The ISPs derived from our database suggest when sub-
stituting a metal for a proton that this is not always the case.We illustrate this idea by considering the measured cross sec-tions of 208.2 ± 0.6 A2 and 207.2 ± 0.2 A2 for the doubly-chargedforms of the Met-Gln-Ile-Phe-Val-Lys peptide that differ only by
36 J.M. Dilger et al. / International Journal of Mass Spectrometry 330–332 (2012) 35–45
F tion oa etails
istttdpt
bwesi[iataaHtt
2
asostas∼etnaM
ws1b(m
ig. 1. Schematic diagram of the IMS–IMS–TOF instrument utilized for characterizatime-of-flight mass spectrometer for subsequent mass analysis. The operational d
nclusion of Na+. At first glance the nearly identical cross sectionsuggest that the polypeptide chain exists in a fixed conformationhat is not influenced by the charge carrying species. However,he values of ISPs that are derived for all peptides suggest thathe cross sections are the same because some residues interactifferently with the Na+ site. Molecular modeling studies of therotonated and sodiated forms are used to illustrate this interpre-ation.
Finally, the overall approach we have taken here is inspiredy studies of the periodic trends in the reactivity of metal ionsith small molecules [54,55]. This work shows the key depend-
nce of reaction rates on metal ion kinetic energy and electronictate – benchmark studies that led to a detailed understand-ng of metal–ligand thermochemistry and reaction mechanisms56,57]. An understanding of the periodic trends in binding makest possible to predict values when no data exists [58]. Thispproach of studying ion-molecule reactions across a region ofhe periodic table was pioneered by Peter Armentrout’s groupnd is sometimes affectionately referred to as “Armentrouting”molecule or system by students and colleagues in this field.ere, we extend this experimental philosophy to assess general
rends in alkali metal–peptide interactions that influence ion struc-ure.
. Experimental
General. Nested IMS–MS measurements were performed onhome-built instrument that is described elsewhere [59–61]. A
chematic diagram of the instrument is shown in Fig. 1. Mixturesf peptides for tryptic digests of individual proteins are electro-prayed into an hour-glass geometry ion funnel (F1) [62,63], wherehey accumulate and are periodically pulsed into the drift tubessembly (D1 and D2) (150-�s-wide pulses were used in thesetudies). Ions are transmitted through the drift tube containing3 Torr of He buffer gas (300 K) under the influence of a uniformlectric field (∼10 V cm−1). To prevent ion losses in the middle ofhis instrument the ion packets are focused through two ion fun-els (F2 and F3). Mobility-separated ions exit the drift tube throughdifferentially-pumped region and are detected by time-of-flightS.Formation of mixtures of peptide ions. Large mixtures of peptides
ere produced by tryptic digestion of the 24 protein (and proteinubunits) listed in Table 1. Peptides were obtained by dissolving
0–100 mg of the whole protein in 2 mL of 200 mM ammoniumicarbonate buffer solution containing 6 M urea. DithiothreitolDTT, Sigma–Aldrich D8255-5G) was added in a 40:1 (DTT:protein)olar ratio to each protein solution, followed by a two-hour 37 ◦C
f all digests. The instrument is comprised of a source region, a 1.8 m drift tube, andof the instrument are contained within the text.
water bath for cleavage of disulfide bonds. Iodoacetamide (IAM,Sigma I6125-5G) was added in an 80:1 (IAM:protein) molar ratioto each protein solution, followed by a two-hour 4 ◦C ice bath incomplete darkness for carboxyamidomethylation of cysteine thiolgroups (residue modification denoted as Cys* or C*). Cysteine wasadded in a 40:1 (Cys:protein) molar ratio and allowed to react atroom temperature for 30 min to quench the excess IAM. Finally,TPCK-treated trypsin (Sigma–Aldrich T1426-100MG) was added toprovide a 1:50 trypsin:protein ratio (wt:wt). A 200 mM ammoniumbicarbonate buffer solution was used for each digestion reactionwith a maximum urea molarity of ∼2 M. Trypsin reaction mixtureswere placed in a 37 ◦C water bath and allowed to react for 24 h toensure efficient enzymatic digestion.
Solid-phase extraction was performed using 3 �L Oasis HLB Car-tridges (Waters Corporation P/N WAT094226) placed in a vacuummanifold that is maintained at ∼5 in Hg. Tryptic digest productswere placed into a Centrivap concentrator for evaporation untildryness. The dry peptide powders were resuspended in 1 mL of50:50 ACN:H2O solution and diluted to ∼0.1 mg mL−1 in the samesolution; acid was omitted to reduce competition of metal cationicsubstitution with free protons in solution. The final concentra-tion of peptide content was estimated assuming a 25% recoveryof initial protein product. To produce cationized peptides, severaldifferent concentrations of metal acetates (obtained from Aldrichor Sigma) were added to a typical ESI solution and examined. A∼0.5 mM metal acetate solution (containing ∼0.1 mg mL−1 totalpeptide) was found to produce optimal metal adduction and ESIstability. Separate solutions were prepared to favor protonatedpeptides.
Peptide ion assignments. Specific peptides were assigned by com-parison of measured m/z values with calculated values obtainedfrom the ExPASy Proteomics Server PeptideMass [64] online tool.For all peptides, assignments up to 2 missed cleavages are consid-ered. An in-house peak-picking software was used with a 0.25 m/ztolerance and an intensity threshold of 5 counts to locate all poten-tial peaks above the noise threshold. Drift time distributions wereobtained by integrating all m/z bins across a narrow m/z rangecorresponding to the monoisotopic mass. The centers of promi-nent features corresponding to peak maxima are recorded in thedatabase. For metalated samples, these assigned peaks were fur-ther cross-checked against peak positions expected for protonatedspecies. Any metalated assignment that might also be assigned asdifferent protonated sequences are eliminated to reduce false posi-
tives. The veracity of assignments of peaks as to metal-containingpeptides were also bolstered by changes in intensities upon addingmetals, as well as shifts in m/z and drift time compared with pro-tonated ions.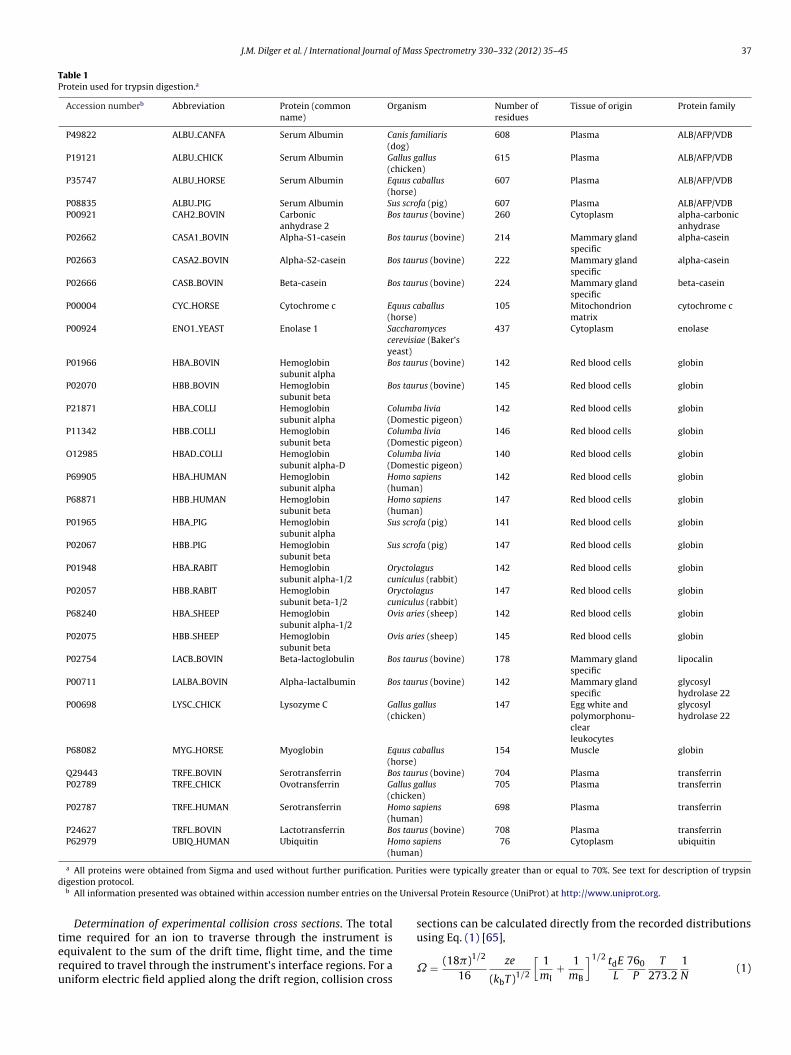
J.M. Dilger et al. / International Journal of Mass Spectrometry 330–332 (2012) 35–45 37
Table 1Protein used for trypsin digestion.a
Accession numberb Abbreviation Protein (commonname)
Organism Number ofresidues
Tissue of origin Protein family
P49822 ALBU CANFA Serum Albumin Canis familiaris(dog)
608 Plasma ALB/AFP/VDB
P19121 ALBU CHICK Serum Albumin Gallus gallus(chicken)
615 Plasma ALB/AFP/VDB
P35747 ALBU HORSE Serum Albumin Equus caballus(horse)
607 Plasma ALB/AFP/VDB
P08835 ALBU PIG Serum Albumin Sus scrofa (pig) 607 Plasma ALB/AFP/VDBP00921 CAH2 BOVIN Carbonic
anhydrase 2Bos taurus (bovine) 260 Cytoplasm alpha-carbonic
anhydraseP02662 CASA1 BOVIN Alpha-S1-casein Bos taurus (bovine) 214 Mammary gland
specificalpha-casein
P02663 CASA2 BOVIN Alpha-S2-casein Bos taurus (bovine) 222 Mammary glandspecific
alpha-casein
P02666 CASB BOVIN Beta-casein Bos taurus (bovine) 224 Mammary glandspecific
beta-casein
P00004 CYC HORSE Cytochrome c Equus caballus(horse)
105 Mitochondrionmatrix
cytochrome c
P00924 ENO1 YEAST Enolase 1 Saccharomycescerevisiae (Baker’syeast)
437 Cytoplasm enolase
P01966 HBA BOVIN Hemoglobinsubunit alpha
Bos taurus (bovine) 142 Red blood cells globin
P02070 HBB BOVIN Hemoglobinsubunit beta
Bos taurus (bovine) 145 Red blood cells globin
P21871 HBA COLLI Hemoglobinsubunit alpha
Columba livia(Domestic pigeon)
142 Red blood cells globin
P11342 HBB COLLI Hemoglobinsubunit beta
Columba livia(Domestic pigeon)
146 Red blood cells globin
O12985 HBAD COLLI Hemoglobinsubunit alpha-D
Columba livia(Domestic pigeon)
140 Red blood cells globin
P69905 HBA HUMAN Hemoglobinsubunit alpha
Homo sapiens(human)
142 Red blood cells globin
P68871 HBB HUMAN Hemoglobinsubunit beta
Homo sapiens(human)
147 Red blood cells globin
P01965 HBA PIG Hemoglobinsubunit alpha
Sus scrofa (pig) 141 Red blood cells globin
P02067 HBB PIG Hemoglobinsubunit beta
Sus scrofa (pig) 147 Red blood cells globin
P01948 HBA RABIT Hemoglobinsubunit alpha-1/2
Oryctolaguscuniculus (rabbit)
142 Red blood cells globin
P02057 HBB RABIT Hemoglobinsubunit beta-1/2
Oryctolaguscuniculus (rabbit)
147 Red blood cells globin
P68240 HBA SHEEP Hemoglobinsubunit alpha-1/2
Ovis aries (sheep) 142 Red blood cells globin
P02075 HBB SHEEP Hemoglobinsubunit beta
Ovis aries (sheep) 145 Red blood cells globin
P02754 LACB BOVIN Beta-lactoglobulin Bos taurus (bovine) 178 Mammary glandspecific
lipocalin
P00711 LALBA BOVIN Alpha-lactalbumin Bos taurus (bovine) 142 Mammary glandspecific
glycosylhydrolase 22
P00698 LYSC CHICK Lysozyme C Gallus gallus(chicken)
147 Egg white andpolymorphonu-clearleukocytes
glycosylhydrolase 22
P68082 MYG HORSE Myoglobin Equus caballus(horse)
154 Muscle globin
Q29443 TRFE BOVIN Serotransferrin Bos taurus (bovine) 704 Plasma transferrinP02789 TRFE CHICK Ovotransferrin Gallus gallus
(chicken)705 Plasma transferrin
P02787 TRFE HUMAN Serotransferrin Homo sapiens(human)
698 Plasma transferrin
P24627 TRFL BOVIN Lactotransferrin Bos taurus (bovine) 708 Plasma transferrinP62979 UBIQ HUMAN Ubiquitin Homo sapiens
(human)76 Cytoplasm ubiquitin
Puritid
e Univ
teru
a All proteins were obtained from Sigma and used without further purification.igestion protocol.b All information presented was obtained within accession number entries on th
Determination of experimental collision cross sections. The total
ime required for an ion to traverse through the instrument isquivalent to the sum of the drift time, flight time, and the timeequired to travel through the instrument’s interface regions. For aniform electric field applied along the drift region, collision crosses were typically greater than or equal to 70%. See text for description of trypsin
ersal Protein Resource (UniProt) at http://www.uniprot.org.
sections can be calculated directly from the recorded distributions
using Eq. (1) [65],˝ = (18�)1/2
16ze
(kbT)1/2
[1
mI+ 1
mB
]1/2 tdE
L
760
P
T
273.21N
(1)

38 J.M. Dilger et al. / International Journal of Mass Spectrometry 330–332 (2012) 35–45
Fig. 2. Nested IMS–MS dot plots for the electrosprayed mixture of peptide ions from the trypsin digest of Hemoglobin from Ovis aries (sheep). The datasets have been recordedfor samples that contain approximately 0.1 mg mL−1 digest in a water:acetonitrile (50:50) solution. The protonated spectrum is shown in panel A and the spectrum obtainedfor the sample containing sodium acetate is shown in panel B. Mobility families for the doubly- and triply-charged peptide ions are indicated by white lines. Labels havebeen assigned to five represented peptide ions expected as products of the tryptic digestion. Drift profiles for each of these doubly-charged peptide species are displayed inpanel C, with black, pink, and green drift spectra corresponding to [Pep+2H]2+, [Pep+Na+H]2+, and [Pep+2Na]2+ species. Each peak apex in the drift time dimension for them , obtad is figu
wcitarinadksfvtsp
3
ftpiE
onoisotopic mass is used to derive collision cross section values. A mass spectrumisplayed on the left of each plot. (For interpretation of the references to color in th
here ze, kb, mI, and mB refer to the charge of the ion, Boltzmann’sonstant, the mass of the ion, and the mass of the buffer gas (heliumn these experiments). The variables td, E, L, P, T, and N correspondo the drift time, electric field, drift tube length, buffer gas pressurend temperature, and the neutral number density of the buffer gas,espectively. The final term in the equation normalizes the mobil-ty to standard temperature and pressure. Due to the presence ofon-linear field regions associated with the two ion funnels (F2nd F3), the experimental drift times need to be calibrated. This isone by two methods. First, we calibrate values to those for well-nown systems (e.g. bradykinin and polyalanine). Second, we canelect ions in the D1 region to vigorously determine a cross sectionor some ions (as described previously [66]) and calibrate for thesealues. Both of these calibrations provide highly accurate cross sec-ions. Values determined here for ions that are believed to have theame structures typically agree to within ∼1% of values reportedreviously [50].
. Results and discussion
Nested IMS–MS measurements and observation of charge-stateamilies for protonated and sodiated peptides. Distributions of pep-
ide ions (either protonated, or containing Li+, Na+, K+, or Cs+) wereroduced by ESI. These ions were introduced into the IMS–MSnstrument and data were recorded for 5 min for each sample.xample IMS–MS distributions for protonated and sodiated forms
ined by integrating all bins across the entire drift time range for each m/z value, isre legend, the reader is referred to the web version of the article.)
of tryptic peptides from sheep hemoglobin are shown in Fig. 2. Asreported previously [67], peaks for protonated peptides fall intofamilies that arise because of similarities in the size-to-charge ratioof the ions. Peaks found in the datasets for alkali-containing speciesfall into similar families. Primarily doubly-charged species and toa lesser extent singly- and triply-charged peptides are observed,consistent with the idea that most peptides contain two highlybasic sites (the N-terminal amino group and the C-terminal Lysor Arg side chain). We expect protons to be stabilized by inter-actions at the basic C-terminal-residue side chain (butylamine inthe case of Lys, propylguanidine group in the case of Arg) and theN-terminal amine. A third proton may be incorporated along thepeptide backbone or associated with other basic residues, whichis expected to be especially important for peptide sequences thatarise as a product of missed cleavages (and those containing the Hisresidue). It is less clear where charges will reside upon substitutionof alkali metals for a proton. Prior work has shown that substi-tution of Na+ for H+ in polyalanine chains reduces the abundanceof globular structures [68] and stabilizes helices through interac-tions with multiple carbonyl groups on the C-terminal end of thepolypeptide chain [13]. We anticipate that larger alkali cations willbe stabilized through multiple interactions with electronegative
groups.Changes in drift times upon substituting Na+ for H+ in pep-tide sequences. All of the digests and metals studied here lead tonoticeable changes in the drift time distributions compared with

of Mas
pfAVtgsVrtiGitstsc
AclfotCa29s[f
siSpptr(4pbatii8et8ap[ta[t[
oipTf
J.M. Dilger et al. / International Journal
rotonated systems. An example of typical changes can be observedrom the data in Fig. 2. The five most intense peaks correspond to theAVTGFWGK, MFLSPTTK, VVAGVANALAHK, FLANVSTVLTSK, andGGNAGAYGAEALER sequences. For these sequences, we observe
he [Pep+2H]2+, [Pep+Na+H]2+, and [Pep+2Na]2+ ions. Drift timesenerally increase upon substituting Na+ for H+. For example,ubstitution of a single Na+ to the MFLSPTTK, FLANVSTVLTSK,VAGVANALAHK, and VGGNAGAYGAEALER sequences leads to aelative drift time increase of 0.9%, 1.4%, 4.0%, and 1.6%, respec-ively. The AAVTGFWGK sequence appears to contract by 0.3% uponncorporating single sodium. Peaks for the doubly-sodiated AAVT-FWGK, MFLSPTTK, VVAGVANALAHK, and VGGNAGAYGAEALER
ons are shifted even more (2.5%, 1.9%, 4.1%, and 3.5%, respec-ively). In this comparison, the FLANVSTVLTSK ion peak shifts tohorter drift times (by a factor of 1.5%) compared with the respec-ive [Pep+2H]2+ ion. Sometimes, the drift times for doubly-sodiatedpecies are observed to be smaller than their counterparts, as is thease for FLANVSTVLTSK.
Summary of cross sections obtained from analysis of a single digest.sense of the distribution of species that are characterized in the
ross section database can be obtained by examining Table 2 whichists all cross sections for doubly-charged peptide ions obtainedrom the single sheep hemoglobin digest. We find 29 peptide ionsbserved across all doubly-charged configurations. Of these pep-ide sequences, 22 contain a C-terminal lysine and 7 contain a-terminal arginine with 6 sequences containing missed cleav-ges. Here, cross sections for the major features are reported for6 [Pep+2H]2+, 45 [Pep+M+H]2+, and 49 [Pep+2M]2+ ions. Of these4 metal-containing peptides, 74 are observed to increase in crossection (35 [Pep+M+H]2+ and 39 [Pep+2M]2+) as compared to thePep+2H]2+ ions. No relative decreases in cross section are notedor the [Pep+2Cs]2+ ions.
Summary of the complete database. Complete lists of crossections for all singly-, doubly-, and triply-charged peptideons identified across all charge configurations are located inupplemental Tables 1–3, respectively. These supplemental tablesrovide information on number of residues, peptide sequence,rotein source, and molecular mass information for all peaks iden-ified for each observed charge configuration. Cross sections areeported for 78 singly- (containing 1–9 residues), 405 doubly-containing 2–17 residues), and 140 triply-charged (containing–22 residues) peptide sequences. The majority of these trypticeptides contain a C-terminal lysine residue (59 singly-, 269 dou-ly, and 94 triply-charged) followed by those peptides containingC-terminal arginine residue (15 singly-, 125 doubly-, and 43
riply-charged). Of the peptide ions observed, sequences containingnternal lysine or arginine residues are fairly common, compris-ng 34.8% of all assigned sequences (5 singly-, 124 doubly-, and6 triply-charged). Here, we report a total of 1772 cross sectionntries (147 singly-, 1325 doubly-, and 300 triply-charged) for pro-onated and alkalated tryptic peptide ions. Of these cross sections,18 are charged only by protons (67 [Pep+H]+, 500 [Pep+2H]2+,nd 251 [Pep+3H]3+). The remaining reported measurements incor-orate alkali cations, with 262 containing Li+ (28 [Pep+Li]+, 145Pep+Li+H]2+, 84 [Pep+2Li]2+, and 5 [Pep+Li+2H]3+), 316 con-aining Na+ (20 [Pep+Na]+, 158 [Pep+Na+H]2+, 110 [Pep+2Na]2+,nd 28 [Pep+Na+2H]3+), 222 containing K+ (8 [Pep+K]+, 126Pep+K+H]2+, 75 [Pep+2K]2+, and 13 [Pep+K+2H]3+), and 154 con-aining Cs+ (24 [Pep+Cs]+, 80 [Pep+Cs+H]2+, 47 [Pep+2Cs]2+, and 3Pep+Cs+2H]3+).
Assessing the accuracy of cross sections reported here. Althoughur solution conditions were designed to favor alkalated peptide
ons (e.g., metal acetate solutions with no added acid), protonatedeptide ions are still observed and are reported within our database.herefore, it is possible to compare many cross section valuesor specific protonated peptide ions with measurements reporteds Spectrometry 330–332 (2012) 35–45 39
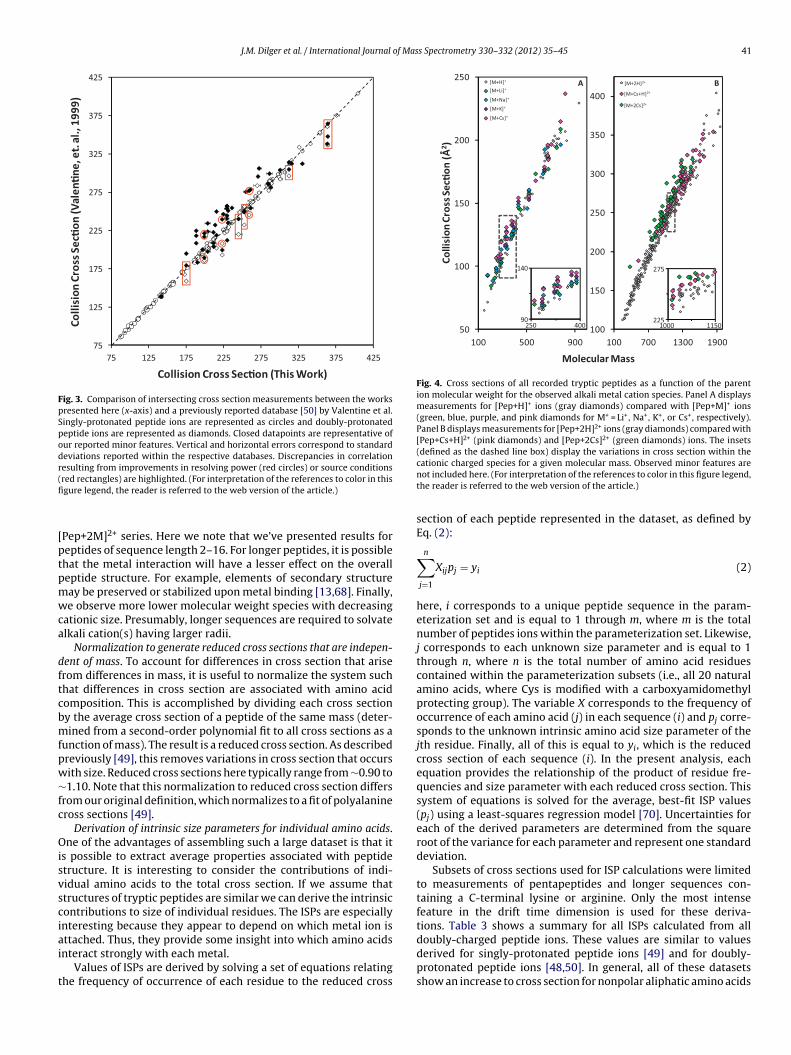
previously [50]. Fig. 3 shows a plot of all singly- and doubly-protonated measurements contained within both datasets. Acomparison of cross sections for these peptides is observed to fallalong a line for the entire range of measurements. Within thesemeasurements, the relative change in cross section for 53 singly-protonated peptide is calculated to be 0.8 ± 0.6%. Similar agreementis observed for the major features of 89 doubly-protonated peptideions reported within both datasets.
While most values measured here are in excellent agreementwith prior measurements, there are some differences. One dif-ference arises because of variations in relative abundance. Here,some cross sections for minor features agree with prior results. Onepossible explanation for the differences in major features is thatthe previous measurements [50] were recorded using an injected-ion drift tube. In that work, the ion injection process causes arapid heating/cooling cycle which may alter conformer populationsrelative to the source distributions. Outliers in our reported mea-surements are generally associated with relatively minor features.It is also clear that an improvement in the experimental resolvingpower is responsible for some of the observed differences. Severalpeptide ions appear to have been previously observed as the aver-age of multiple features that are resolved in this work. Overall thereis excellent agreement between the cross sections reported hereand our previous work [50].
Understanding the range of cross sections for species with simi-lar masses. Comparisons of cross sections for species with similarmasses provides some insight about the range of different ionstructures that are present. Fig. 4 shows cross sections for thesingly-charged species (all alkali cations) and doubly-charged pep-tides (for only the Cs+-containing ions) as a function of molecularweight. Note that all doubly-charged values are reported in thedatabase but are not included here because the plots become con-gested and are less instructive. For all charge configurations, astrong correlation of increasing cross section with mass is observed.At a given mass, comparisons with calculated values for modelstructures shows that the smallest values have tightly-packed glob-ular geometries while the largest values have relatively open,elongated structure. For small peptides (m ∼ 1000), cross sectionsvary by ∼±5%. As the peptide size increases so does the range ofpossible structures. At m = ∼1200, ions display ∼±6% range of crosssections. This increases to ∼±8% for m = ∼1400.
Variations in cross section with cation size. Another trend is thatcross sections increase with increasing cation size, as is observed inFig. 4. Literature values for the effective radii of the alkali cations arer(Li+) = 0.76 A, r(Na+) = 1.02 A, r(K+) = 1.38 A, and r(Cs+) = 1.67 A [69].Compared with singly-charged [Pep+H]+ species, singly-chargedmetal-containing species are larger by an average of 4.1 ± 5.5 A2
(Li+), 4.9 ± 4.4 A2 (Na+), 5.3 ± 4.6 A2 (K+), and 9.6 ± 7.0 A2 (Cs+), cor-responding to an 4.3 ± 6.7%, 4.6 ± 6.3%, 4.6 ± 3.8%, and 7.4 ± 4.7%change, respectively. These changes are much greater than thecation sizes, requiring that addition of a metal lead to a substantialchange in structures of many of the amino acid chains.
Fig. 4 also shows significant increases in cross section fordoubly-charged [Pep+Cs+H]2+ and [Pep+2Cs]2+ peptide ion species.Compared to the doubly-protonated [Pep+2H]2+ species, the[Pep+M+H]2+ ions are larger by an average of 1.5 ± 7.8 A2 (Li+),3.1 ± 8.8 A2 (Na+), 5.1 ± 8.2 A2 (K+), and 7.6 ± 8.7 A2 (Cs+), cor-responding to a change of 0.6 ± 2.9%, 1.3 ± 3.3%, 1.9 ± 3.1%, and3.0 ± 3.8%, respectively. For the [Pep+2M]2+ species, the observedincreases are 2.0 ± 8.1 A2 (Li+), 2.7 ± 7.3 A2 (Na+), 5.8 ± 8.2 A2 (K+),and 15.0 ± 9.1 A2 (Cs+), corresponding to a change of 0.9 ± 3.5%,1.2 ± 3.0%, 2.4 ± 3.4%, and 6.5 ± 5.4%, respectively. Compared to
the doubly-protonated [Pep+2H]2+ species, larger cross sectionsare observed upon incorporation of alkali cations for 65.6% (Li+),65.0% (Na+), 72.5% (K+), and 83.8% (Cs+) for the [Pep+M+H]2+ seriesand 61.9% (Li+), 65.7% (Na+), 81.1% (K+), and 100% (Cs+) for the
40J.M
.Dilger
etal./InternationalJournalofM
assSpectrom
etry330–332
(2012)35–45
Table 2Cross sections for doubly-charged peptides from the tryptic digest of Ovis aries (sheep).a
Number ofresidues
Assigned sequenceb Peptide massc Cross Section (Å2)d
[Pep+2H]2+ [Pep+Li+H]2+ [Pep+Na+H]2+ [Pep+K+H]2+ [Pep+Cs+H]2+ [Pep+2Li]2+ [Pep+2Na]2+ [Pep+2K]2+ [Pep+2Cs]2+
2 LR 287.20 118.2 (0.6, 4)2 VK 245.17 112.32 YR 337.18 126.6 (0.3, 2)4 AHGK 411.22 138.8 (1.0, 2) 138.14 SNVK 446.255 AAWGK 531.28 156.6 (0.4, 3)5 AHGKK 539.32 162.8 (0.9, 4)5 GHGEK 526.25 160.2 169.46 HLDDLK 739.396 VKAHGK 638.39 177.1 (0.8, 4)7 MLTAEEK 820.40 221.67 VAAALTK 672.42 186.2 (0.5, 2) 192.8 192.87 VDPVNFK 817.43 201.0 (0.7, 7) 208.9 219.0 207.4 (0.5, 3)7 VLSAADK 702.39 186.2 (0.5, 2) 201.2 203.59 AAVTGFWGK 935.49 225.2 239.6 224.5 235.5 238.8 237.7 230.9 240.0 249.19 LHVDPENFR 1125.56 257.5 (1.1, 3) 256.6 (0.6, 2) 261.6 261.4 (0.6, 2) 266.89 LRVDPVNFK 1086.62 263.9 (0.6, 7) 254.7 (2.3, 3) 255.3 (1.8, 6) 261.8 (0.7, 4) 263.5 (1.0, 3) 256.5 261.9 258.7 (0.6, 2) 270.59 MFLSFPTTK 1070.55 254.3 (0.6, 3) 257.9 (0.6, 2) 256.5 (1.0, 3) 258.6 (1.5, 3) 259.8 (0.6, 2) 248.0 259.2 (1.2, 2) 263.3 (0.6, 2) 266.8
10 LLVVYPWTQR 1273.72 291.7 (0.8, 5) 293.9 294.6 (1.1, 4) 297.0 (1.5, 3) 302.2 280.2 (0.0, 2) 285.2 (0.7, 2) 309.710 VLDSFSNGMK 1096.52 250.0 259.3 261.0 268.3 264.911 KVLDSFSNGMK 1224.62 283.8 264.9 265.6 273.8 280.8 270.1 271.111 VDEVGAEALGR 1114.56 259.211 VLSAADKSNVK 1130.63 258.2 261.1 264.7 270.1 278.9 272.4 266.5 269.2 278.912 FLANVSTVLTSK 1278.72 289.7 (1.0, 5) 297.1 (0.7, 2) 293.9 (0.6, 4) 299.9 (2.1, 2) 303.6 (0.7, 2) 285.4 (1.0, 2) 300.8 (0.8, 2) 318.112 VVAGVANALAHK 1148.67 274.6 (1.0, 5) 281.3 (0.7, 2) 285.5 (1.2, 5) 277.5 (1.0, 3) 281.7 (0.0, 2) 271.4 285.9 (1.6, 2) 288.0 (0.7, 2) 296.613 VKVDEVGAEALGR 1341.73 277.4 294.8 300.3 303.2 289.2 288.4 303.0 307.815 VGGNAGAYGAEALER 1433.69 286.6 294.8 291.1 294.8 289.2 296.6 301.2 303.216 HHGNEFTPVLQADFQK 1866.90 353.4 358.716 TYFPHFDLSHGSAQVK 1832.88 336.6 (1.2, 3) 352.3 350.1 (0.5, 2) 354.5
a All values were obtained using a coupled ion-mobility time-of-flight home-built instrument. See text and references for full description of the instrument.b Peptide sequence correspond to fragments expected from tryptic digests as obtained from the Peptide Mass tool at http://expasy.org/tools/peptide-mass.html.c Molecular weight is reported as the monoisotopic mass of the peptide without the ionizing species.d Cross sections correspond to the average values of all datasets. Uncertainties are given parenthetically along with the total number of measurements made per charge state and correspond to one standard deviation about
the mean when three or more measurements are reported, or as a range when only two measurements are reported.
J.M. Dilger et al. / International Journal of Mass Spectrometry 330–332 (2012) 35–45 41
75
125
175
225
275
325
375
425
75 125 175 225 275 325 375 425
Collision
CrossS
ec�o
n(Valen
�ne,et.al.,19
99)
Collision Cross Sec�on (ThisWork)
Fig. 3. Comparison of intersecting cross section measurements between the workspresented here (x-axis) and a previously reported database [50] by Valentine et al.Singly-protonated peptide ions are represented as circles and doubly-protonatedpeptide ions are represented as diamonds. Closed datapoints are representative ofour reported minor features. Vertical and horizontal errors correspond to standarddeviations reported within the respective databases. Discrepancies in correlationresulting from improvements in resolving power (red circles) or source conditions(fi
[ptpmwca
dftcbmfpw∼fc
Oisvsciai
t
50
100
150
200
250
100 500 900
[M+H]+[M+Li]+[M+Na]+[M+K]+[M+Cs]+
100
150
200
250
300
350
400
100 700 1300 1900
[M+2H]2+
[M+Cs+H]2+
[M+2Cs]2+
MolecularMass
Collision
CrossSec�o
n( Å
2 )
225
275
1000 1150
BA
250 40090
140
[M+H][M+Li]
[M+K]
[M+Na]
[M+Cs]
[M+2H]
[M+Cs+H]
[M+2Cs]
Fig. 4. Cross sections of all recorded tryptic peptides as a function of the parention molecular weight for the observed alkali metal cation species. Panel A displaysmeasurements for [Pep+H]+ ions (gray diamonds) compared with [Pep+M]+ ions(green, blue, purple, and pink diamonds for M+ = Li+, Na+, K+, or Cs+, respectively).Panel B displays measurements for [Pep+2H]2+ ions (gray diamonds) compared with[Pep+Cs+H]2+ (pink diamonds) and [Pep+2Cs]2+ (green diamonds) ions. The insets(defined as the dashed line box) display the variations in cross section within the
doubly-charged peptide ions. These values are similar to values
red rectangles) are highlighted. (For interpretation of the references to color in thisgure legend, the reader is referred to the web version of the article.)
Pep+2M]2+ series. Here we note that we’ve presented results foreptides of sequence length 2–16. For longer peptides, it is possiblehat the metal interaction will have a lesser effect on the overalleptide structure. For example, elements of secondary structureay be preserved or stabilized upon metal binding [13,68]. Finally,e observe more lower molecular weight species with decreasing
ationic size. Presumably, longer sequences are required to solvatelkali cation(s) having larger radii.
Normalization to generate reduced cross sections that are indepen-ent of mass. To account for differences in cross section that ariserom differences in mass, it is useful to normalize the system suchhat differences in cross section are associated with amino acidomposition. This is accomplished by dividing each cross sectiony the average cross section of a peptide of the same mass (deter-ined from a second-order polynomial fit to all cross sections as a
unction of mass). The result is a reduced cross section. As describedreviously [49], this removes variations in cross section that occursith size. Reduced cross sections here typically range from ∼0.90 to1.10. Note that this normalization to reduced cross section differs
rom our original definition, which normalizes to a fit of polyalanineross sections [49].
Derivation of intrinsic size parameters for individual amino acids.ne of the advantages of assembling such a large dataset is that it
s possible to extract average properties associated with peptidetructure. It is interesting to consider the contributions of indi-idual amino acids to the total cross section. If we assume thattructures of tryptic peptides are similar we can derive the intrinsicontributions to size of individual residues. The ISPs are especiallynteresting because they appear to depend on which metal ion isttached. Thus, they provide some insight into which amino acids
nteract strongly with each metal.Values of ISPs are derived by solving a set of equations relatinghe frequency of occurrence of each residue to the reduced cross
cationic charged species for a given molecular mass. Observed minor features arenot included here. (For interpretation of the references to color in this figure legend,the reader is referred to the web version of the article.)
section of each peptide represented in the dataset, as defined byEq. (2):
n∑j=1
Xijpj = yi (2)
here, i corresponds to a unique peptide sequence in the param-eterization set and is equal to 1 through m, where m is the totalnumber of peptides ions within the parameterization set. Likewise,j corresponds to each unknown size parameter and is equal to 1through n, where n is the total number of amino acid residuescontained within the parameterization subsets (i.e., all 20 naturalamino acids, where Cys is modified with a carboxyamidomethylprotecting group). The variable X corresponds to the frequency ofoccurrence of each amino acid (j) in each sequence (i) and pj corre-sponds to the unknown intrinsic amino acid size parameter of thejth residue. Finally, all of this is equal to yi, which is the reducedcross section of each sequence (i). In the present analysis, eachequation provides the relationship of the product of residue fre-quencies and size parameter with each reduced cross section. Thissystem of equations is solved for the average, best-fit ISP values(pj) using a least-squares regression model [70]. Uncertainties foreach of the derived parameters are determined from the squareroot of the variance for each parameter and represent one standarddeviation.
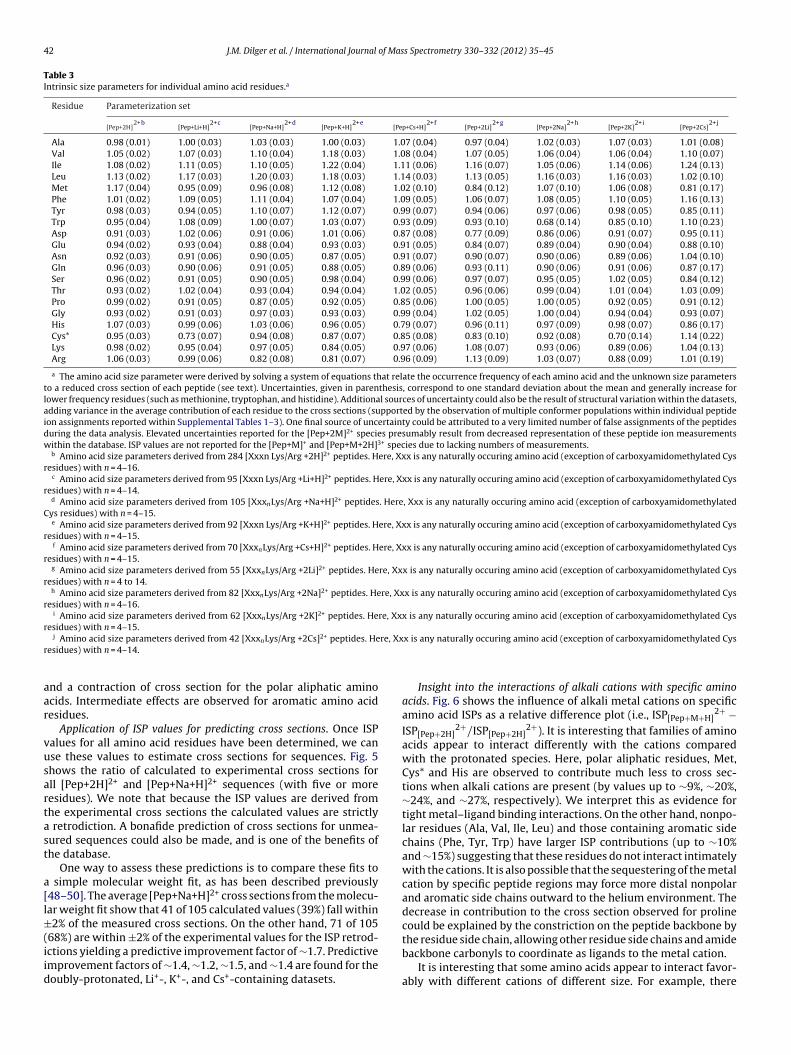
Subsets of cross sections used for ISP calculations were limitedto measurements of pentapeptides and longer sequences con-taining a C-terminal lysine or arginine. Only the most intensefeature in the drift time dimension is used for these deriva-tions. Table 3 shows a summary for all ISPs calculated from all
derived for singly-protonated peptide ions [49] and for doubly-protonated peptide ions [48,50]. In general, all of these datasetsshow an increase to cross section for nonpolar aliphatic amino acids
42 J.M. Dilger et al. / International Journal of Mass Spectrometry 330–332 (2012) 35–45
Table 3Intrinsic size parameters for individual amino acid residues.a
Residue Parameterization set
[Pep+2H]2+b
[Pep+Li+H]2+c
[Pep+Na+H]2+d
[Pep+K+H]2+e
[Pep+Cs+H]2+f
[Pep+2Li]2+g
[Pep+2Na]2+h
[Pep+2K]2+i
[Pep+2Cs]2+j
Ala 0.98 (0.01) 1.00 (0.03) 1.03 (0.03) 1.00 (0.03) 1.07 (0.04) 0.97 (0.04) 1.02 (0.03) 1.07 (0.03) 1.01 (0.08)Val 1.05 (0.02) 1.07 (0.03) 1.10 (0.04) 1.18 (0.03) 1.08 (0.04) 1.07 (0.05) 1.06 (0.04) 1.06 (0.04) 1.10 (0.07)Ile 1.08 (0.02) 1.11 (0.05) 1.10 (0.05) 1.22 (0.04) 1.11 (0.06) 1.16 (0.07) 1.05 (0.06) 1.14 (0.06) 1.24 (0.13)Leu 1.13 (0.02) 1.17 (0.03) 1.20 (0.03) 1.18 (0.03) 1.14 (0.03) 1.13 (0.05) 1.16 (0.03) 1.16 (0.03) 1.02 (0.10)Met 1.17 (0.04) 0.95 (0.09) 0.96 (0.08) 1.12 (0.08) 1.02 (0.10) 0.84 (0.12) 1.07 (0.10) 1.06 (0.08) 0.81 (0.17)Phe 1.01 (0.02) 1.09 (0.05) 1.11 (0.04) 1.07 (0.04) 1.09 (0.05) 1.06 (0.07) 1.08 (0.05) 1.10 (0.05) 1.16 (0.13)Tyr 0.98 (0.03) 0.94 (0.05) 1.10 (0.07) 1.12 (0.07) 0.99 (0.07) 0.94 (0.06) 0.97 (0.06) 0.98 (0.05) 0.85 (0.11)Trp 0.95 (0.04) 1.08 (0.09) 1.00 (0.07) 1.03 (0.07) 0.93 (0.09) 0.93 (0.10) 0.68 (0.14) 0.85 (0.10) 1.10 (0.23)Asp 0.91 (0.03) 1.02 (0.06) 0.91 (0.06) 1.01 (0.06) 0.87 (0.08) 0.77 (0.09) 0.86 (0.06) 0.91 (0.07) 0.95 (0.11)Glu 0.94 (0.02) 0.93 (0.04) 0.88 (0.04) 0.93 (0.03) 0.91 (0.05) 0.84 (0.07) 0.89 (0.04) 0.90 (0.04) 0.88 (0.10)Asn 0.92 (0.03) 0.91 (0.06) 0.90 (0.05) 0.87 (0.05) 0.91 (0.07) 0.90 (0.07) 0.90 (0.06) 0.89 (0.06) 1.04 (0.10)Gln 0.96 (0.03) 0.90 (0.06) 0.91 (0.05) 0.88 (0.05) 0.89 (0.06) 0.93 (0.11) 0.90 (0.06) 0.91 (0.06) 0.87 (0.17)Ser 0.96 (0.02) 0.91 (0.05) 0.90 (0.05) 0.98 (0.04) 0.99 (0.06) 0.97 (0.07) 0.95 (0.05) 1.02 (0.05) 0.84 (0.12)Thr 0.93 (0.02) 1.02 (0.04) 0.93 (0.04) 0.94 (0.04) 1.02 (0.05) 0.96 (0.06) 0.99 (0.04) 1.01 (0.04) 1.03 (0.09)Pro 0.99 (0.02) 0.91 (0.05) 0.87 (0.05) 0.92 (0.05) 0.85 (0.06) 1.00 (0.05) 1.00 (0.05) 0.92 (0.05) 0.91 (0.12)Gly 0.93 (0.02) 0.91 (0.03) 0.97 (0.03) 0.93 (0.03) 0.99 (0.04) 1.02 (0.05) 1.00 (0.04) 0.94 (0.04) 0.93 (0.07)His 1.07 (0.03) 0.99 (0.06) 1.03 (0.06) 0.96 (0.05) 0.79 (0.07) 0.96 (0.11) 0.97 (0.09) 0.98 (0.07) 0.86 (0.17)Cys* 0.95 (0.03) 0.73 (0.07) 0.94 (0.08) 0.87 (0.07) 0.85 (0.08) 0.83 (0.10) 0.92 (0.08) 0.70 (0.14) 1.14 (0.22)Lys 0.98 (0.02) 0.95 (0.04) 0.97 (0.05) 0.84 (0.05) 0.97 (0.06) 1.08 (0.07) 0.93 (0.06) 0.89 (0.06) 1.04 (0.13)Arg 1.06 (0.03) 0.99 (0.06) 0.82 (0.08) 0.81 (0.07) 0.96 (0.09) 1.13 (0.09) 1.03 (0.07) 0.88 (0.09) 1.01 (0.19)
a The amino acid size parameter were derived by solving a system of equations that relate the occurrence frequency of each amino acid and the unknown size parametersto a reduced cross section of each peptide (see text). Uncertainties, given in parenthesis, correspond to one standard deviation about the mean and generally increase forlower frequency residues (such as methionine, tryptophan, and histidine). Additional sources of uncertainty could also be the result of structural variation within the datasets,adding variance in the average contribution of each residue to the cross sections (supported by the observation of multiple conformer populations within individual peptideion assignments reported within Supplemental Tables 1–3). One final source of uncertainty could be attributed to a very limited number of false assignments of the peptidesduring the data analysis. Elevated uncertainties reported for the [Pep+2M]2+ species presumably result from decreased representation of these peptide ion measurementswithin the database. ISP values are not reported for the [Pep+M]+ and [Pep+M+2H]3+ species due to lacking numbers of measurements.
b Amino acid size parameters derived from 284 [Xxxn Lys/Arg +2H]2+ peptides. Here, Xxx is any naturally occuring amino acid (exception of carboxyamidomethylated Cysresidues) with n = 4–16.
c Amino acid size parameters derived from 95 [Xxxn Lys/Arg +Li+H]2+ peptides. Here, Xxx is any naturally occuring amino acid (exception of carboxyamidomethylated Cysresidues) with n = 4–14.
d Amino acid size parameters derived from 105 [XxxnLys/Arg +Na+H]2+ peptides. Here, Xxx is any naturally occuring amino acid (exception of carboxyamidomethylatedCys residues) with n = 4–15.
e Amino acid size parameters derived from 92 [Xxxn Lys/Arg +K+H]2+ peptides. Here, Xxx is any naturally occuring amino acid (exception of carboxyamidomethylated Cysresidues) with n = 4–15.
f Amino acid size parameters derived from 70 [XxxnLys/Arg +Cs+H]2+ peptides. Here, Xxx is any naturally occuring amino acid (exception of carboxyamidomethylated Cysresidues) with n = 4–15.
g Amino acid size parameters derived from 55 [XxxnLys/Arg +2Li]2+ peptides. Here, Xxx is any naturally occuring amino acid (exception of carboxyamidomethylated Cysresidues) with n = 4 to 14.
h Amino acid size parameters derived from 82 [XxxnLys/Arg +2Na]2+ peptides. Here, Xxx is any naturally occuring amino acid (exception of carboxyamidomethylated Cysresidues) with n = 4–16.
i Amino acid size parameters derived from 62 [XxxnLys/Arg +2K]2+ peptides. Here, Xxx is any naturally occuring amino acid (exception of carboxyamidomethylated Cysresidues) with n = 4–15.
re, Xxr
aar
vusartast
a[l±(iid
j Amino acid size parameters derived from 42 [XxxnLys/Arg +2Cs]2+ peptides. Heesidues) with n = 4–14.
nd a contraction of cross section for the polar aliphatic aminocids. Intermediate effects are observed for aromatic amino acidesidues.
Application of ISP values for predicting cross sections. Once ISPalues for all amino acid residues have been determined, we canse these values to estimate cross sections for sequences. Fig. 5hows the ratio of calculated to experimental cross sections forll [Pep+2H]2+ and [Pep+Na+H]2+ sequences (with five or moreesidues). We note that because the ISP values are derived fromhe experimental cross sections the calculated values are strictlyretrodiction. A bonafide prediction of cross sections for unmea-
ured sequences could also be made, and is one of the benefits ofhe database.
One way to assess these predictions is to compare these fits tosimple molecular weight fit, as has been described previously
48–50]. The average [Pep+Na+H]2+ cross sections from the molecu-ar weight fit show that 41 of 105 calculated values (39%) fall within2% of the measured cross sections. On the other hand, 71 of 105
68%) are within ±2% of the experimental values for the ISP retrod-ctions yielding a predictive improvement factor of ∼1.7. Predictivemprovement factors of ∼1.4, ∼1.2, ∼1.5, and ∼1.4 are found for theoubly-protonated, Li+-, K+-, and Cs+-containing datasets.
x is any naturally occuring amino acid (exception of carboxyamidomethylated Cys
Insight into the interactions of alkali cations with specific aminoacids. Fig. 6 shows the influence of alkali metal cations on specificamino acid ISPs as a relative difference plot (i.e., ISP[Pep+M+H]
2+ −ISP[Pep+2H]
2+/ISP[Pep+2H]2+). It is interesting that families of amino
acids appear to interact differently with the cations comparedwith the protonated species. Here, polar aliphatic residues, Met,Cys* and His are observed to contribute much less to cross sec-tions when alkali cations are present (by values up to ∼9%, ∼20%,∼24%, and ∼27%, respectively). We interpret this as evidence fortight metal–ligand binding interactions. On the other hand, nonpo-lar residues (Ala, Val, Ile, Leu) and those containing aromatic sidechains (Phe, Tyr, Trp) have larger ISP contributions (up to ∼10%and ∼15%) suggesting that these residues do not interact intimatelywith the cations. It is also possible that the sequestering of the metalcation by specific peptide regions may force more distal nonpolarand aromatic side chains outward to the helium environment. Thedecrease in contribution to the cross section observed for prolinecould be explained by the constriction on the peptide backbone by
the residue side chain, allowing other residue side chains and amidebackbone carbonyls to coordinate as ligands to the metal cation.It is interesting that some amino acids appear to interact favor-ably with different cations of different size. For example, there

J.M. Dilger et al. / International Journal of Mass Spectrometry 330–332 (2012) 35–45 43
0.80
0.90
1.00
1.10
1.20
500 1000 1500 2000
0.80
0.90
1.00
1.10
1.20
500 1000 1500 2000
Molecular Mass
Ωr(retrod
ic�o
n)/Ω
r(experim
ental)
size parameter retrodic�on
molecular weight retrodic�on
A
B
Fig. 5. Prediction accuracy scatter plots for reduced cross sections of 284[(Xxx)nLys/Arg +2H]2+ (open diamonds) and 105 [(Xxx)nLys/Arg +Na+H]2+ (soliddiamonds) peptide ions. Here, Xxx is any naturally occurring amino acid (exceptfor cysteine residues, which are carboxyaminomethylated) and n = 4–16. ISP retro-dwr
ePwmepta
hips
Fiataeavti
Fig. 7. Representative structures for low-energy conformations of [MQIFVK+2H]2+
(panel A) and [MQIFVK+Na+H]2+ (panel B). Two separate orientations (rotated 90◦
along the y-axis) are depicted for comparison of surface exposure of the amino acidside chains (particularly methionine, colored yellow) resulting from charge solva-tion effects. The peptide backbone is rendered as a cartoon with charge-solvatingamide carbonyls exhibited. The accessible surface area is transparently overlaid oneach structure. Green, red, white, blue, and purple coloration corresponds to surface
ictions are displayed in panel A and those obtained from a polynomial moleculareight fit to cross section data are displayed in panel B. Dotted lines indicate where
etrodicted values agree to within 2% of the experimental measurements.
xists a smaller ISP contribution for interactions of Cs+ with His andro residues than for the much smaller Li+ cation. At first glance weere surprised that such detailed interactions between individualetals and residues could be extracted from this database. How-
ver, we note that because independent datasets are used for eacharameterization, there is high confidence in these observed con-ributions to cross section by the individual amino acid residuesnd changes imparted by each metal ion.
Implications for use of cross sections in determining structuralomology between protonated and alkalated peptides. The differences
n ISP values for cationized sequences, compared with protonatedeptides, raise an interesting twist in using cross sections to assesstructural similarities. One powerful use of cross section values is toig. 6. Relative difference plot in amino acid residue ISP for the alkali [Pep+M+H]2+
on series compared to the ISPs obtained from [Pep+2H]2+ ions. Green, blue, purple,nd pink bars correspond to M+ Li+, Na+, K+, or Cs+, respectively. Uncertainties inhe calculation (displayed as bars) represent one standard deviation about the meannd are propagated as the square root of the sum of the products of the squaredrrors and their partial derivatives. Relative differences for the [Pep+M+H]2+ seriesre calculated by maintaining ISP values for lysine and arginine equivalent to thosealues derived within the [Pep+2H]2+ parameterization set (0.98 and 1.06, respec-ively). (For interpretation of the references to color in this figure legend, the readers referred to the web version of the article.)
exposure of carbon, oxygen, hydrogen, nitrogen, and sodium atoms, respectively.Charge sites have been pictured as spheres. (For interpretation of the references tocolor in this figure legend, the reader is referred to the web version of the article.)
suggest structural homology. For example if protonated and sodi-ated ions of the same sequence have similar cross sections, onemight suggest that these ions have similar structures. The ISP val-ues for cationized and protonated ions indicate that this may notbe the case. As an example, consider the MQIFVK sequence hav-ing ˝([Pep+2H]2+) = 208.2 A2 and ˝([Pep+Na+H]2+) = 207.2 A2. Onemight assume that the peptide favors the same structure upon sub-stitution of Na+. However, our impression from the significant sizeparameter differences for amino acids that arise upon substitutionof Na+ suggests a different interpretation. The ISPs suggest that thepolar aliphatic residue (Gln) as well as Met should decrease in con-tribution to the cross section (relative to the doubly-protonatedspecies), whereas the nonpolar aliphatic residues (Ile and Val) andthe aromatic residue (Phe) will increase in contribution to the crosssection. The net effect is that the peptide cross section does not sig-nificantly vary because of a cancellation of these opposing effects.
To illustrate this idea further we have carried out some prelim-inary molecular modeling studies of these ions. These simulationswere performed on the MQIFVK peptide (observed in the trypticdigest of ubiquitin) using the Insight II software package (AccelrysInc., San Diego, CA) with the consistent valence forcefield (CVFF)using the Discover 3 program.
Trajectory model cross sections calculated [45] for the low-energy structures generated by simulated annealing are shown inFig. 7. The [MQIFVK+2H]2+ ion conformer is relatively compact withthe calculated cross section for the displayed structure (208.2 A2)in excellent agreement with the experimental value (208.2 A2). Inthis case, the protonated Lys is solvated by the amide backbone car-
bonyls of Ile and Gln and the protonated N-terminus interacts withthe C-terminus carbonyl and backbone carbonyl associated withVal. The resulting structure is a compact globule that is cappedon one face by the protonated Lys side chain with the opposing
4 of Mas
fMfs(sHvctv(ttli
4
tp2a[c1[swmroic(gpdL
icfotidatIii
sMfidsaccdwl
[
[
[
[
[
[
[
[
[
[
[
4 J.M. Dilger et al. / International Journal
ace containing the protruding side chains of Gln, Ile, Phe, Val, andet. The [MQIFVK+Na+H]2+ ion conformer (the lowest energy con-
ormation that we found in these studies) has a calculated crossection of 208.4 A2, which is also in agreement with experiment207.2 A2). However, in contrast to the protonated peptide, theodium-containing species has a significantly different structure.ere, Na+ caps one face of the peptide structure such that it is sol-ated by four amide backbone carbonyls as well as the C-terminalarbonyl. The protonated Lys side chain is primarily solvated byhe Gln side-chain carbonyl as well as the N-terminus. These sol-ation effects result in a globule with extension of the non-polarIle and Val) and the aromatic (Phe) residue side chains towardhe molecular surface. Additionally, the Met side chain is observedo collapse on the molecular face opposing Na+, allowing the twoone electron pairs of the sulfur atom to participate in long-range,on–dipole interactions with Na+.
. Summary and conclusions
This work presents a database of 1772 collision cross sec-ions of protonated and alkalated peptide ions, including: 818rotonated (67 [Pep+H]+, 500 [Pep+2H]2+, and 251 [Pep+3H]3+),62 containing Li+ (28 [Pep+Li]+, 145 [Pep+Li+H]2+, 84 [Pep+2Li]2+,nd 5 [Pep+Li+2H]3+), 316 containing Na+ (20 [Pep+Na]+, 158Pep+Na +H]2+, 110 [Pep+2Na]2+, and 28 [Pep+Na+2H]3+), 222ontaining K+ (8 [Pep+K]+, 126 [Pep+K+H]2+, 75 [Pep+2K]2+, and3 [Pep+K+2H]3+), and 154 containing Cs+ (24 [Pep+Cs]+, 80Pep+Cs+H]2+, 47 [Pep+2Cs]2+, and 3 [Pep+Cs+2H]3+). These crossections were obtained from the tryptic digestion of 24 proteinsith the accuracy assessed by comparisons to previous measure-ents [50]. Of the sequences reported, 68% terminate with a lysine
esidue and 35% contain missed cleavages. Such a large numberf values enable generalizations on the assessment of peptideon conformation resulting from solvation effects of the alkaliation(s). For singly-charged (i.e. [Pep+M]+) and doubly-chargedi.e. [Pep+M+H]2+ or [Pep+2M]2+) peptide ions, the cross section isenerally observed to increase with increasing cationic size. Multi-le conformers (i.e. minor features) are often observed among theoubly- and triply-charged species, particularly with protonated,i+- or Na+-containing species.
We find that amino acid composition plays a significant rolen the observed peptide ion cross sections. Contributions toross section by individual amino acid residues were assessedor each alkali doubly-charged configuration with the derivationf ISPs. The [Pep+2H]2+ ISPs display similar charge solva-ion effects to previously derived protonated ISPs, [48,49] asndividual contributions to cross section are observed to beecreased for polar aliphatic residues and increased for nonpolarliphatic and aromatic residues. An amplification of these solva-ion effects are displayed with comparisons of the [Pep+M+H]2+
SPs with the [Pep+2H]2+ ISPs with specific amino acid residuesnteracting favorably with different alkali cations of differingonic size.
The ISP-derived solvation effects are supported with low-energytructures obtained from molecular dynamics simulations of theQIFVK peptide in the [Pep+2H]2+ and [Pep+Na+H]2+ charge con-
gurations. While the empirical measurements for these ionsisplay little change in cross section, structural differences uponubstitution of a Na+ with a H+ are illustrated with increased inter-ctions of Gln and Met (as well as the peptide backbone) with theharges. Structural dissimilarity is prominently displayed with the
ollapsing of Met on the molecular face opposing Na+ within theepicted low-energy structure of [MQIFVK+Na+H]2+, in contrastith the significant surface protrusion of Met within the depictedow-energy structure of [MQIFVK+2H]2+.
[
s Spectrometry 330–332 (2012) 35–45
Acknowledgements
JMD gratefully acknowledges the financial support receivedfrom the PhD Fellowship provided by Naval Surface Warfare Cen-ter, Crane Division. This work is supported in part by funding fromthe “Next Generation Threat” fund provided by Naval Surface War-fare Center, Crane Division (contract number N00164-08-C-JQ11)as well as funding from the METACyt Grant from the Lilly Endow-ment.
Appendix A. Supplementary data
Supplementary data associated with this article can be found, inthe online version, at http://dx.doi.org/10.1016/j.ijms.2012.05.001.
References
[1] E.A. Permyakov, Metalloproteomics, Wiley, New Jersey, 2009.[2] R.H. Holm, P. Kennepohl, E.I. Solomon, Structural and functional aspects of
metal sites in biology, Chemical Reviews 96 (1996) 2239–2314.[3] J.M. Page, E. Di Cera, Role of Na+ and K+ in enzyme function, Physiological
Reviews 86 (2006) 1049–1092.[4] H. Reyes-Caballero, G.C. Campanello, D.P. Giedroc, Metalloregulatory proteins:
metal selectivity and allosteric switching, Biophysical Chemistry 156 (2011)103–114.
[5] J.A. Loo, P. Hu, Interaction of angiotensin peptides and zinc metal ions probedby electrospray ionization mass spectrometry, Journal of the American Societyfor Mass Spectrometry 5 (1994) 959–965.
[6] O.V. Nemirovskiy, M.L. Gross, Determination of calcium binding sites in gas-phase small peptides by tandem mass spectrometry, Journal of the AmericanSociety for Mass Spectrometry 9 (1998) 1020–1028.
[7] L.M. Teesch, R.C. Orlando, J. Adams, Location of the alkali metal ion in gas-phase peptide complexes, Journal of the American Chemical Society 113 (1991)3668–3675.
[8] P. Hu, J.A. Loo, Gas-phase coordination properties of Zn2+, Cu2+, Ni2+, and Co2+
with histidine-containing peptides, Journal of the American Chemical Society117 (1995) 11314–11319.
[9] P.B. Armentrout, M.T. Rodgers, J. Oomens, J.D. Steill, Infrared multiphotondissociation spectroscopy of cationized serine: effects of alkali-metal cationsize on gas-phase conformation, Journal of Physical Chemistry A 112 (2008)2248–2257.
10] M.T. Rodgers, P.B. Armentrout, J. Oomens, J.D. Steill, Infrared multiphoton dis-sociation spectroscopy of cationized threonine: effects of alkali-metal cationsize on gas-phase conformation, Journal of Physical Chemistry A 112 (2008)2258–2267.
11] T. Wyttenbach, D. Liu, M.T. Bowers, Interactions of the hormone oxytocin withdivalent metal ions, Journal of the American Chemical Society 130 (2008)5993–6000.
12] B.A. Cerda, C. Wesdemiotis, Zwitterionic vs. charge-solvated structures in thebinding of arginine to alkali metal ions in the gas phase, Analyst 125 (2000)657–660.
13] C. Wu, J. Klasmeier, H.H. Hill Jr., Atmospheric pressure ion mobility spec-trometry of protonated and sodiated peptides, Rapid Communications in MassSpectrometry 13 (1999) 1138–1142.
14] M. Kohtani, B.S. Kinnear, M.F. Jarrold, Metal-ion enhanced helicity in the gasphase, Journal of the American Chemical Society 122 (2000) 12377–12378.
15] B.T. Ruotolo, D.H. Russell, Gas-phase conformations of proteolytically derivedprotein fragments: influence of solvent on peptide conformation, Journal ofPhysical Chemistry B 108 (2004) 15321–15331.
16] B.T. Ruotolo, C.C. Tate, D.H. Russell, Ion mobility-mass spectrometry applied tocyclic peptide analysis: conformational preferences of gramicidin S and linearanalogs in the gas phase, Journal of the American Society for Mass Spectrometry15 (2004) 870–878.
17] M. Kohtani, M.F. Jarrold, S. Wee, R.A.J. O’Hair, Metal ion interactions withpolyalanine peptides, Journal of Physical Chemistry B 108 (2004) 6093–6097.
18] M.K. Drayß, P.B. Armentrout, J. Oomens, M. Schaefer, IR spectroscopy of cation-ized aliphatic amino acids: stability of charge-solvated structure increaseswith metal cation size, International Journal of Mass Spectrometry 297 (2010)18–27.
19] Y. Berezovskaya, C.T. Armstrong, A.L. Boyle, M. Porrini, D.N. Woolfson, P.E. Bar-ran, Metal binding to a zinc-finger peptide: a comparison between solution andthe gas phase, Chemical Communications 47 (2011) 412–414.
20] J.T.S. Hopper, N.J. Oldham, Alkali metal cation-induced destabilization of gas-phase protein–ligand complexes: consequences and prevention, Analytical
Chemistry 83 (2011) 7472–7479.21] J. Pan, L. Konermann, Calcium-induced structural transitions of thecalmodulin–melittin system studied by electrospray mass spectrometry:conformational subpopulations and metal-unsaturated intermediates, Bio-chemistry 49 (2010) 3477–3486.
of Mas
[
[
[
[
[
[
[
[
[
[
[
[
[
[
[
[
[
[
[
[
[
[
[
[
[
[
[
[
[
[
[
[
[
[
[
[
[
[
[
[
[
[
[
[
[
[
[
J.M. Dilger et al. / International Journal
22] L. Deng, N. Sun, E.N. Kitova, J.S. Klassen, Direct quantification of protein-metalion affinities by electrospray ionization mass spectrometry, Analytical Chem-istry 82 (2010) 2170–2174.
23] J.R. McLean, J.A. McLean, Z. Wu, C. Becker, L.M. Pérez, C.N. Pace, J.M. Scholtz, D.H.Russell, Factors that influence helical preferences for singly charged gas-phasepeptide ions: the effects of multiple potential charge-carrying sites, Journal ofPhysical Chemistry B 114 (2010) 809–816.
24] L. Chen, Y.Q. Gao, D.H. Russell, How alkali metal ion binding alters the confor-mation preferences of gramicidin A: a molecular dynamics and ion mobilitystudy, Journal of Physical Chemistry A 116 (2012) 689–696.
25] J.B. Fenn, M. Mann, C.K. Meng, S.F. Wong, C.M. Whitehouse, Electrospray ion-ization for mass spectrometry of large biomolecules, Science 246 (1989) 64–71.
26] Z.L. Cheng, K.W.M. Siu, R. Guevremont, S.S. Berman, Electrospray mass spec-trometry: a study on some aqueous solutions of metal salts, Journal of theAmerican Society for Mass Spectrometry 3 (1992) 281–288.
27] M. Satterfield, J.S. Brodbelt, Enhanced detection of flavonoids by metalcomplexation and electrospray ionization-mass spectrometry, AnalyticalChemistry 72 (2000) 5898–5906.
28] K.J. Kock, T. Aggerholm, S.C. Nanita, R.G. Cooks, Clustering of nucleobases withalkali metals studied by electrospray ionization tandem mass spectrometry:implication for mechanisms of multistrand DNA stabilization, Journal of MassSpectrometry 37 (2002) 676–686.
29] M. Vairamani, M.L. Gross, G-Quadruplex formation of thrombin-bindingaptamer detected by electrospray ionization mass spectrometry, Journal of theAmerican Chemical Society 125 (2003) 42–43.
30] K. Fukushima, Iwahashi H, 1:1 complex of guanine quartet with alkali metalcations detected by electrospray ionization mass spectrometry, Chemical Com-munications 11 (2000) 895–896.
31] C. Wang, S.H. Yang, J. Wang, P. Kroll, K.A. Schug, D.W. Armstrong, Study ofcomplexation between cyclofructans and alkali metal cations by electrosprayionization mass spectrometry and density functional theory calculations, Inter-national Journal of Mass Spectrometry 291 (2010) 118–124.
32] H.J. Sterling, J.D. Batchelor, D.E. Wemmer, E.R. Williams, Effects of buffer loadingfor electrospray ionization mass spectrometry of a noncovalent protein com-plex that requires high concentrations of essential salts, Journal of the AmericanSociety for Mass Spectrometry 21 (2010) 1045–1049.
33] T.G. Flick, S.I. Merenbloom, E.R. Williams, Anion effects on sodium ion andacid molecule adduction to protein ions in electrospray ionization mass spec-trometry, Journal of the American Society for Mass Spectrometry 22 (2011)1968–1977.
34] M. Rozman, S.J. Gaskell, Non-covalent interactions of alkali metal cationswith singly charged tryptic peptides, Journal of Mass Spectrometry 45 (2011)1409–1415.
35] L.M. Teesch, J. Adams, Fragmentations of gas-phase complexes between alkalimetal ions and peptides: metal ion binding to carbonyl oxygens and other neu-tral functional groups, Journal of the American Chemical Society 113 (1991)812–820.
36] W.Y. Feng, S. Gronert, K.A. Fletcher, A. Warres, C.B. Lebrilla, The mechanism ofC-terminal fragmentations in alkali metal ion complexes of peptides, Interna-tional Journal of Mass Spectrometry 222 (2003) 117–134.
37] D. Bensadek, F. Monigatti, J.A.J. Steen, H. Steen, Why b, y’s? Sodiation-inducedtryptic peptide-like fragmentation of non-tryptic peptides, International Jour-nal of Mass Spectrometry 268 (2007) 181–189.
38] Y.M.E. Fung, H. Liu, T.-W.D. Chan, Electron capture dissociation of peptides met-alated with alkaline-earth metal ions, Journal of the American Society for MassSpectrometry 17 (2006) 757–771.
39] A.J. Kleinnijenhuis, R. Mihalca, R.M.A. Heeren, A.J.R. Heck, Atypical behaviorin the electron capture induced dissociation of biologically relevant transitionmetal ion complexes of the peptide hormone oxytocin, International Journal ofMass Spectrometry 253 (2006) 217–224.
40] H. Liu, K. Håkansson, Electron capture dissociation of tyrosine O-sulfated pep-tides complexed with divalent metal cations, Analytical Chemistry 78 (2006)7570–7576.
41] H. Liu, K. Håkansson, Divalent metal ion–peptide interactions probed by elec-tron capture dissociation of trications, Journal of the American Society for MassSpectrometry 17 (2006) 1731–1741.
42] G.E. Hofmeister, Z. Zhou, J.A. Leary, Linkage position determination in lithium-cationized disaccharides: tandem mass spectrometry and semiempiricalcalculations, Journal of the American Chemical Society 113 (1991) 5964–5970.
43] M. Kohler, J.A. Leary, Gas phase reactions of doubly charged alkaline earthand transition metal(II)–ligand complexes generated by electrospray ioniza-tion, International Journal of Mass Spectrometry and Ion Processes 162 (1997)17–34.
44] H.M. Watson, J.B. Vincent, C.J. Cassady, Effects of transition metal ion coordi-
nation on the collision-induced dissociation of polyalanines, Journal of MassSpectrometry 46 (2011) 1099–1107.45] M.F. Mesleh, J.M. Hunter, A.A. Shvartsburg, G.C. Schatz, M.F. Jarrold, Structuralinformation from ion mobility measurements: effects of the long-range poten-tial, Journal of Physical Chemistry 100 (1996) 16082–16086.
[
[
s Spectrometry 330–332 (2012) 35–45 45
46] D.E. Clemmer, R.R. Hudgins, M.F. Jarrold, Naked protein conformations:cytochrome c in the gas phase, Journal of the American Chemical Society 117(1995) 10141–10142.
47] G. von Helden, T. Wyttenbach, M.T. Bowers, Conformation of macromoleculesin the gas phase: use of matrix-assisted laser desorption methods in ion chro-matography, Science 267 (1995) 1483–1485.
48] S.J. Valentine, M.A. Ewing, J.M. Dilger, M.S. Glover, S. Geromanos, C. Hughes,D.E. Clemmer, Using ion mobility data to improve peptide identification:intrinsic amino acid size parameters, Journal of Proteome Research 10 (2011)2318–2329.
49] S.J. Valentine, A.E. Counterman, C.S. Hoaglund-Hyzer, D.E. Clemmer, Intrin-sic amino acid size parameters from a series of 113 lysine-terminatedtryptic digest peptide ions, Journal of Physical Chemistry B 103 (1999)1203–1207.
50] S.J. Valentine, A.E. Counterman, D.E. Clemmer, A database of 660 peptide ioncross sections: use of intrinsic size parameters for bona fide predictions of crosssections, Journal of the American Society for Mass Spectrometry 10 (1999)1188–1211.
51] L. Tao, J.R. McLean, J.A. McLean, D.H. Russell, A collision cross-section databaseof singly-charged peptide ions, Journal of the American Society for Mass Spec-trometry 18 (2007) 1232–1238.
52] S.C. Henderson, J. Li, A.E. Counterman, D.E. Clemmer, Intrinsic size parametersfor Val, Ile, Leu, Gln, Thr, Phe, and Trp residues from ion mobility measure-ments of polyamino acid ions, Journal of Physical Chemistry B 103 (1999)8780–8785.
53] A.E. Counterman, D.E. Clemmer, Volumes of individual amino acid residues ingas-phase peptide ions, Journal of the American Chemical Society 121 (1999)4031–4039.
54] M.T. Rodgers, P.B. Armentrout, A thermodynamic “vocabulary” for metal ioninteractions in biological systems, Accounts of Chemical Research 37 (2004)989–998.
55] S.J. Ye, P.B. Armentrout, Absolute thermodynamic measurements of alkali metalcation interactions with a simple dipeptide and tripeptide, Journal of PhysicalChemistry A 112 (2008) 3587–3596.
56] P.B. Armentrout, Electronic state-specific transition metal ion chemistry,Annual Review of Physical Chemistry 41 (1990) 313–344.
57] E.R. Fisher, J.L. Elkind, D.E. Clemmer, R. Georgiadis, S.K. Loh, N. Aristov, L.S.Sunderlin, P.B. Armentrout, Reactions of fourth-period metal ions (Ca+–Zn+)with O2: metal-oxide ion bond energies, Journal of Chemical Physics 93 (1990)2676–2691.
58] P.B. Armentrout, L.F. Halle, J.L. Beauchamp, Periodic trends in transitionmetal–hydrogen, metal–carbon, and metal–oxygen bond dissociation energies,correlation with reactivity and electronic structure, Journal of the AmericanChemical Society 103 (1981) 6501–6502.
59] S.L. Koeniger, S.I. Merenbloom, D.E. Clemmer, Evidence for many resolvablestructures within conformation types of electrosprayed ubiquitin ions, Journalof Physical Chemistry B 110 (2006) 7017–7021.
60] S.L. Koeniger, S.I. Merenbloom, S.J. Valentine, M.F. Jarrold, H.R. Udseth, R.D.Smith, D.E. Clemmer, An IMS–IMS analogue of MS–MS, Analytical Chemistry78 (2006) 4161–4174.
61] S.I. Merenbloom, S.L. Koeniger, S.J. Valentine, M.D. Plasencia, D.E. Clemmer,IMS–IMS and IMS–IMS–IMS/MS for separating peptide and protein fragmentions, Analytical Chemistry 78 (2006) 2802–2809.
62] S.A. Shaffer, K.Q. Tang, G.A. Anderson, D.C. Prior, H.R. Udseth, R.D. Smith, A novelion funnel for focusing ions at elevated pressure using electrospray ionizationmass spectrometry, Rapid Communications in Mass Spectrometry 11 (1997)1813–1817.
63] S.A. Shaffer, D.C. Prior, G.A. Anderson, H.R. Udseth, R.D. Smith, An ionfunnel interface for improved ion focusing and sensitivity using elec-trospray ionization mass spectrometry, Analytical Chemistry 70 (1998)4111–4119.
64] ExPASy Proteomics Server Peptidemass, http://expasy.org/tools/peptide-mass.html.
65] E.A. Mason, E.W. McDaniel, Transport Properties of Ions in Gases, Wiley, NewYork, 1988.
66] S.L. Koeniger, S.I. Merenbloom, S. Sevugarajan, D.E. Clemmer, Transfer of struc-tural elements from compact to extended states in unsolvated ubiquitin,Journal of the American Chemical Society 128 (2006) 11713–11719.
67] S.J. Valentine, A.E. Counterman, C.S. Hoaglund, J.P. Reilly, D.E. Clemmer, Gas-phase separations of protease digests, Journal of the American Society for MassSpectrometry 9 (1998) 1213–1216.
68] J.A. Taraska, A.E. Counterman, D.E. Clemmer, Large anhydrous polyalanine ions:substitution of Na+ for H+ destabilizes folded states, International Journal ofMass Spectrometry 204 (2001) 87–100.
69] R.D. Shannon, Revised effective ionic radii and systematic studies of inter-atomic distances in halides and chalcogenides, Acta Crystallographica A32(1976) 751–767.
70] S.J. Leon, Linear Algebra with Applications, 3rd ed., Macmillan, New York,1990.