a decomposition method for synthesizing complex...
TRANSCRIPT

Computers and Chemical Engineering 28 (2004) 2165–2188
A decomposition method for synthesizing complex columnconfigurations using tray-by-tray GDP models
Mariana Barttfelda,b, Pıo A. Aguirrea, Ignacio E. Grossmannb,∗a INGAR, Instituto de Desarrollo y Diseño, Avellaneda 3657, 3000 Santa Fe, Argentina
b Department of Chemical Engineering, Carnegie Mellon University, Pittsburgh, PA 15213, USA
Received 25 June 2003; received in revised form 10 February 2004; accepted 15 March 2004
Available online 2 June 2004
Abstract
This paper describes an optimization procedure for the synthesis of complex distillation configurations. A superstructure based on theReversible Distillation Sequence Model (RDSM) is proposed embedding all possible alternative designs using tray-by-tray models. Generalizedisjunctive programming (GDP) is used to model the superstructure. Each column section of the superstructure is modeled using rigorousMESH equations. Due to the large size and complexity of the formulation, as well as the great difficulty in coverging the correspondingequations, a decomposition solution strategy is proposed where discrete decisions are decomposed into two hierarchical levels within aniterative procedure. In the first level, the column sections are selected yielding a candidate configuration. In the second level, the feed locationand the number of trays of the selected sections are optimized. A preprocessing phase including thermodynamic information is consideredto provide a good starting point to the algorithm in order to improve the convergence and robustness of the method. Examples are presentedfor zeotropic and azeotropic multicomponent mixtures to illustrate the performance of the proposed method. Non-trivial configurations areobtained involving modest solution times.© 2004 Elsevier Ltd. All rights reserved.
Keywords:Disjunctive programming; Complex distillation columns; Initialization
1. Introduction
The synthesis of a process addresses the fundamentalproblem of finding a configuration that satisfies a set ofgoals and specifications. The separation of more than twocomponents by continuous distillation has been usually ac-complished by arranging columns in series. However, evenunder the assumption of minimum reflux, past work hasshown that complex arrangements can lead to significantsavings in the operating costs. Most of the effort in thefield of distillation synthesis has been applied to developshort-cut and simplified methods (Annakou & Mizsey,1996; Fidkowski & Krolikowski, 1986; Glinos & Malone,1988; Triantafyllou & Smith, 1992). As an example of re-cent work,Caballero and Grossmann (2002)have presenteda systematic approach for generating all the thermodynamicequivalent structures for a given sequence.
∗ Corresponding author. Tel.:+1-412-2683642; fax:+1-412-2687139.E-mail address:[email protected] (I.E. Grossmann).
The generation of complex column configurations hasbeen principally developed bySargent and Gaminibandara(1976), Agrawal (1996)andFidkowski and Agrawal (1995,1996). Other superstructures include for instance the one byKoehler, Aguirre, and Blass (1992)who considered thermo-dynamic aspects. However, the problem of systematicallyobtaining the optimal design out of superstructure was notaddressed by these authors. Some recent work has appliedmathematical programming tools to rigorously solve the dis-tillation design problem. The superstructure most commonlyused in the literature is based on the one proposed bySargentand Gaminibandara (1976)for ideal mixtures and laterextended for azeotropic cases (Sargent, 1998). A differentsuperstructure that is not so commonly used is the oneproposed byBauer and Stichlmair (1998)that uses thermo-dynamic information in the representation itself. These au-thors applied this representation in the design of azeotropicsequences.
Dunnebier and Pantelides (1999)have considered theoptimal design of thermally coupled distillation columnsand dividing wall columns for ideal mixtures using detailed
0098-1354/$ – see front matter © 2004 Elsevier Ltd. All rights reserved.doi:10.1016/j.compchemeng.2004.03.006

2166 M. Barttfeld et al. / Computers and Chemical Engineering 28 (2004) 2165–2188
Nomenclature
Ccool cooling water costCsteam steam costCinv investment costCop operating costCtrays tray cost in sectionsCcols column shell cost in sectionsCcondk condenser cost in columnkCrebk reboiler cost in columnkDcoln diameter of traynFo feed flowfLn,i fugacity in the liquid phase of
componenti in tray nfVn,i fugacity in the vapor phase of
componenti in tray nhfeednf ,n enthalpy of the feednf entering traynhliqn enthalpy of the liquid stream leaving traynhvapn enthalpy of the vapor stream leaving traynhpliqn enthalpy of liquid product leaving traynhpvapn enthalpy of vapor product leaving traynhPj enthalpy of productji componentk set denoting each column of
the superstructureLn total liquid flow emerging from traynmvk mole flow of steam in columnkmwk mole flow of water in columnkntrays number of trays of sectionsPn pressure of traynPhj total enthalpy of productjPLn liquid product flow emerging columnnPVn vapor product flow emerging columnnPPj flow of final productjPzj,i individual product flow of product
j in componentiQn energy exchanged in traynstgn counter for the existence of a traynTL
n temperature of the liquid phase in traynTV
n temperature of the vapor phase in traynVn total vapor flow emerging from traynWn boolean variable denoting the
existence of a traynxn,i mole fraction of componenti
in tray n in the liquid phaseyn,i mole fraction of componenti
in tray n in the vapor phaseYs boolean variable denoting the
existence of a sectionszfn,i mole fraction of componenti
in feed stream entering traynzfoi mole fraction of componenti in feed streamzPj,i mole fraction of componenti in productjτ recovery fraction of componentiε purity of componenti
distillation models and optimization. The solution of theseproblems is non-trivial since they are solved in full space.Yeomans and Grossmann (2000a)developed a disjunctiveprogramming procedure for the optimal design of idealand non-ideal tray-by-tray distillation units and separa-tion sequences as well as complex column configurations(Yeomans and Grossmann, 2000b). While in these methodsthe size of the NLP subproblems is reduced the optimiza-tion of superstructures is also non-trivial due to the non-linearities and non-convexities inherent in these problems.
Based on our previous work (Barttfeld, Aguirre, &Grossmann, 2003) where alternative representation and for-mulations for single distillation columns were studied, a gen-eral superstructure is presented in this paper that incorporatestray-by-tray models and can synthesize complex columns.Given the large size and complexity of the optimizationmodel, as well as the great difficulty in coverging the corre-sponding equations, a new generalized disjunctive optimiza-tion model for the synthesis of complex columns configura-tions is proposed as well as a new effective decompositionalgorithm for optimizing the superstructure. Also, a prepro-cessing procedure is included as the initialization phase inorder to increase the robustness of the proposed algorithm.The major motivation in this work is to produce a methodthat is robust and has reasonable computation requirements.
This paper is organized as follows. InSection 2 theproblem is stated. InSection 3, the solution strategy usedto model and solve the complex columns configurationsis outlined. The superstructure is described inSection 4,while in Section 5, the detailed formulations are presented.In Section 6, the detailed solution procedure is described.In Section 7, several examples are produced to illustratethe performance of the proposed synthesis method. Finally,results and conclusions are discussed inSection 8.
2. Problem statement
The problem addressed in this paper can be stated as fol-lows. Given is a multicomponent feed with known flowrateand composition, and given are the desired products specifi-cations. The problem then consists in selecting the structureand operating conditions of a complex configuration of dis-tillation columns involving minimum investment and oper-ating cost. Complex columns configurations in this work in-clude simple column sequences, Petlyuk columns, columnswith side-rectifiers and side strippers. It is assumed that con-densers and reboilers are only placed at the extremes of thecolumn sections. For modeling purposes, tray-by-tray mod-els are considered and we neglect effects of mass transferand assume that phase equilibrium is attained in every tray.
3. Outline of solution strategy
Tray-by-tray distillation synthesis models are very diffi-cult to optimize due to the highly non-linear and non-convex

M. Barttfeld et al. / Computers and Chemical Engineering 28 (2004) 2165–2188 2167
equations that are involved, as well as to the large size ofthe corresponding formulations. Convergence problems areoften found when solving these complex models (Bauer &Stichlmair, 1998; Dunnebier & Pantelides, 1999; Yeomans& Grossmann, 2000b). Therefore, there is a clear need fordeveloping a computational strategy that exploits the natureof the decisions involved in this problem in order to yieldrobust and computationally effective models.
In the optimal synthesis of complex distillation configu-rations the discrete decision regarding the existence of eachcolumn has to be established. Moreover, if a given columnexists in the configuration, it is also desired to optimize thefeed tray location and the number of trays of that unit. For-mulating and solving a single optimization problem to es-tablish all the decisions simultaneously generally leads to avery difficult problem that often fails to converge. For thesereasons, we first formulate the synthesis problem as a gener-alized disjunctive program, which does not have to be solvedsimultaneously and is amenable to decomposition. In par-ticular, we propose an iterative decomposition strategy thatexploits two major levels of decisions in the problem. In thefirst level, a configuration is derived by making the decisionrelated to the selection of column sections. In this level eachsection is assigned a maximum number of trays in order toproduce a bounding solution. In the second level, the feedtray location and the number of trays of the selected sectionsare optimized.
The proposed algorithm solves the disjunctive program-ming model by iteratively solving an MILP for selecting thesections, an MILP for selecting the trays of that configura-tion and an NLP subproblem for optimizing the particulardesign. A thermodynamic based NLP is solved for the ini-tialization of this decomposition method. Several numericalexamples are presented to illustrate the efficiency and ro-bustness of the proposed method.
4. Superstructure of complex configurations
The construction of a general superstructure for complexdistillation column systems is a non-trivial problem due tothe large number of alternative designs that are possible.Different designs are obtained by making structural choicesin the superstructure, such as the selection of the unit inter-connections, feeds, products and heat exchange locations aswell as the selection of trays in each column.
Most of the superstructures found in the literature arebased on the superstructures proposed by Sargent andGaminibandara for zeotropic and azeotropic cases (Sargent,1998; Sargent & Gaminibandara, 1976). The superstruc-ture proposed by these authors is represented in termsof the “state-task-network” (STN) introduced byKondili,Pantelides, and Sargent (1993). In Fig. 1, the STN repre-sentation for a zeotropic mixture with componentsA, B,C, D (decreasing volatility fromA to D) is shown. Thecircles represent possible states and the links between them
Fig. 1. Sargent–Gaminibandara STN representation for a four componentzeotropic mixture.
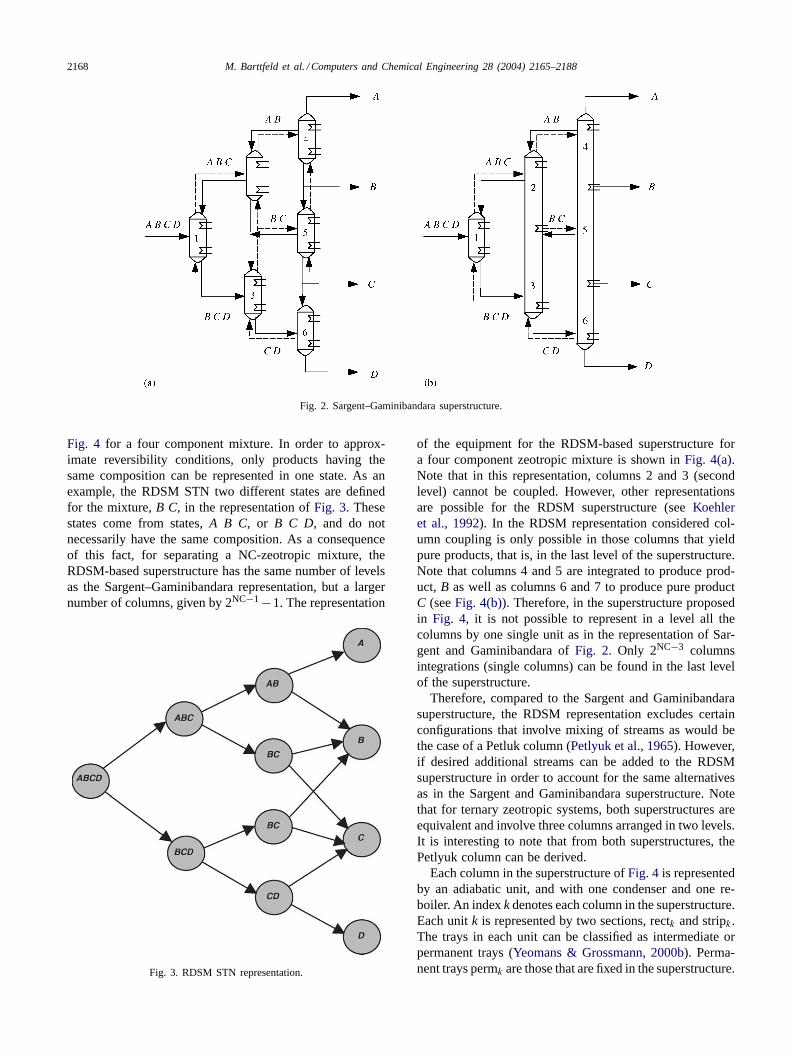
are the tasks. The arrows indicate the direction of the netflows trough the network. From the feed stream, a distillateproduct with components,A B C, is obtained as well as aternary bottom product,B C D. These products become thefeed of subsequent units. Note that the states in the networkare generated by removing the heaviest component from thedistillate product and the lightest component from the bot-tom product. The tasks are defined as follows. All the stateshaving the same components are joined, which is equivalentto coupling the units. InFig. 2, the column representationfor the network presented inFig. 1 is shown. Note that thestripping section of column 2 and the rectifying section ofcolumn 3, both in the second level ofFig. 2(a), are coupled,which is equivalent to representing product,B C, in onlyone state. In all the levels of the Sargent–Gaminibandarasuperstructure the columns can be coupled and representedby one single unit (seeFig. 2(b)). For a mixture containingNC components this representation will have(NC− 1) lev-els and a maximum of 1/2 NC(NC − 1) columns (Sargent& Gaminibandara, 1976).
The superstructure considered in this paper is based on theReversible Distillation Sequence Model (RDSM) proposedby Fonyó (1974), which allows the introduction of thermo-dynamic aspects in the design (for details of the RDSM the-ory seeKoehler et al., 1992; Barttfeld & Aguirre, 2003). Thissuperstructure can be automatically generated for zeotropicas well as for azeotropic mixtures. In the latter case, a com-position diagram of the mixture is assumed to be available(Fig. 3).
The RDSM-based superstructure can be generated us-ing the STN representation ofSargent (1998). For theRDSM-based superstructure the states are defined in thesame way as in the Sargent–Gaminibandara superstructure,but the tasks in this representation are different as seen in
2168 M. Barttfeld et al. / Computers and Chemical Engineering 28 (2004) 2165–2188
Fig. 2. Sargent–Gaminibandara superstructure.
Fig. 4 for a four component mixture. In order to approx-imate reversibility conditions, only products having thesame composition can be represented in one state. As anexample, the RDSM STN two different states are definedfor the mixture,B C, in the representation ofFig. 3. Thesestates come from states,A B C, or B C D, and do notnecessarily have the same composition. As a consequenceof this fact, for separating a NC-zeotropic mixture, theRDSM-based superstructure has the same number of levelsas the Sargent–Gaminibandara representation, but a largernumber of columns, given by 2NC−1−1. The representation
Fig. 3. RDSM STN representation.
of the equipment for the RDSM-based superstructure fora four component zeotropic mixture is shown inFig. 4(a).Note that in this representation, columns 2 and 3 (secondlevel) cannot be coupled. However, other representationsare possible for the RDSM superstructure (seeKoehleret al., 1992). In the RDSM representation considered col-umn coupling is only possible in those columns that yieldpure products, that is, in the last level of the superstructure.Note that columns 4 and 5 are integrated to produce prod-uct, B as well as columns 6 and 7 to produce pure productC (seeFig. 4(b)). Therefore, in the superstructure proposedin Fig. 4, it is not possible to represent in a level all thecolumns by one single unit as in the representation of Sar-gent and Gaminibandara ofFig. 2. Only 2NC−3 columnsintegrations (single columns) can be found in the last levelof the superstructure.
Therefore, compared to the Sargent and Gaminibandarasuperstructure, the RDSM representation excludes certainconfigurations that involve mixing of streams as would bethe case of a Petluk column (Petlyuk et al., 1965). However,if desired additional streams can be added to the RDSMsuperstructure in order to account for the same alternativesas in the Sargent and Gaminibandara superstructure. Notethat for ternary zeotropic systems, both superstructures areequivalent and involve three columns arranged in two levels.It is interesting to note that from both superstructures, thePetlyuk column can be derived.
Each column in the superstructure ofFig. 4is representedby an adiabatic unit, and with one condenser and one re-boiler. An indexk denotes each column in the superstructure.Each unitk is represented by two sections, rectk and stripk.The trays in each unit can be classified as intermediate orpermanent trays (Yeomans & Grossmann, 2000b). Perma-nent trays permk are those that are fixed in the superstructure.

M. Barttfeld et al. / Computers and Chemical Engineering 28 (2004) 2165–2188 2169
Fig. 4. RDSM superstructure for a four component mixture.
Each unit has three permanent trays: the feed tray and thetop and bottom trays, topk and botk, respectively, where theenergy exchange takes place (seeFig. 5). The representa-tion selected for the column is the one that has been foundto be the most effective to model distillation columns withGDP formulations (Barttfeld et al., 2003). Those trays thatcan disappear in the superstructure optimization are the in-
Fig. 5. Single column superstructure.
termediate traysitk. Note that the column sections containintermediate trays and each section is located between twopermanent trays. An upper bound on the number of traysNTk is assigned to each section of columnk.
The columns in the superstructure are interconnected byfeeds and products streams. The columns where multicom-ponent separations take place (columns 1, 2 and 3,Fig. 4),are coupled by the feeds and products streams. Each columncan be fed by primary and secondary feeds. The primary feedFk,n (seeFig. 5) is the stream containing the componentsthat are to be separated, while the secondary feedsS2k,n andS2k+1,n enter in the top and bottom trays providing part orthe total amount of the reflux and reboil, respectively. Theprimary products PVtopk and PLbotk turn into the primaryfeedF2k,n andF2k+1,n of a preceding column, respectively.Secondary products,Sk,n, turn into the secondary feeds of aprevious unit, as seen inFig. 5.
As was mentioned above, the unit sections located in thelast level of the scheme (columns 4–7 inFig. 4(a)) where bi-nary separations take place can also be coupled if the sameproducts emerge from them. InFig. 4, the stripping sectionof column 4 is integrated with the rectifying section of col-umn 5. In previous work (Barttfeld & Aguirre, 2002), theintegration of the sections in the RDSM-based was consid-ered. However, in this work the general superstructure forthe column integration is presented. InFig. 6, the generalsuperstructure for the coupling of sections is shown. Notethat the reflux of columnk + 1 can be provided either bythe liquid product flow PLbotk from columnk bottom, by the
2170 M. Barttfeld et al. / Computers and Chemical Engineering 28 (2004) 2165–2188
Fig. 6. Column integration superstructure.
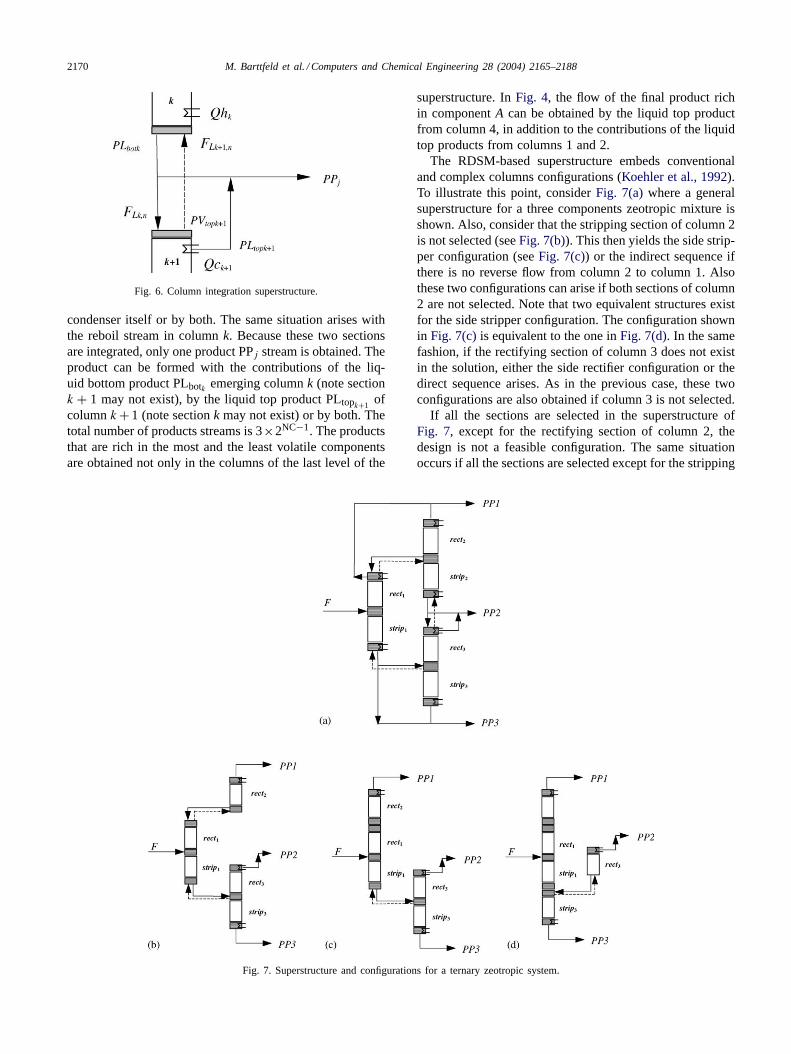
condenser itself or by both. The same situation arises withthe reboil stream in columnk. Because these two sectionsare integrated, only one product PPj stream is obtained. Theproduct can be formed with the contributions of the liq-uid bottom product PLbotk emerging columnk (note sectionk + 1 may not exist), by the liquid top product PLtopk+1
ofcolumnk + 1 (note sectionk may not exist) or by both. Thetotal number of products streams is 3×2NC−1. The productsthat are rich in the most and the least volatile componentsare obtained not only in the columns of the last level of the
Fig. 7. Superstructure and configurations for a ternary zeotropic system.
superstructure. InFig. 4, the flow of the final product richin componentA can be obtained by the liquid top productfrom column 4, in addition to the contributions of the liquidtop products from columns 1 and 2.
The RDSM-based superstructure embeds conventionaland complex columns configurations (Koehler et al., 1992).To illustrate this point, considerFig. 7(a)where a generalsuperstructure for a three components zeotropic mixture isshown. Also, consider that the stripping section of column 2is not selected (seeFig. 7(b)). This then yields the side strip-per configuration (seeFig. 7(c)) or the indirect sequence ifthere is no reverse flow from column 2 to column 1. Alsothese two configurations can arise if both sections of column2 are not selected. Note that two equivalent structures existfor the side stripper configuration. The configuration shownin Fig. 7(c)is equivalent to the one inFig. 7(d). In the samefashion, if the rectifying section of column 3 does not existin the solution, either the side rectifier configuration or thedirect sequence arises. As in the previous case, these twoconfigurations are also obtained if column 3 is not selected.
If all the sections are selected in the superstructure ofFig. 7, except for the rectifying section of column 2, thedesign is not a feasible configuration. The same situationoccurs if all the sections are selected except for the stripping

M. Barttfeld et al. / Computers and Chemical Engineering 28 (2004) 2165–2188 2171
section of column 3. To avoid these infeasible designs, logicconstraints will be included in the formulation presented inthe next section.
The superstructure considered in this work can also beextended for azeotropic distillation. Due to the existence ofdistillation boundaries in this case, the order of the rela-tive volatility of the components cannot be predefined. Asa consequence, it is not possible to define the states a priorias in the zeotropic case. A composition diagram showingthe distillation boundaries is needed to define the feasiblestates that can be achieved from a given feed. Consider aternary azeotropic mixture with a topology composition di-agram given byFig. 8(a). This mixture has one azeotropebetween the middle and the heaviest component. In orderto generate the STN representation, the mass balances foreach reversible separation task (Barttfeld & Aguirre, 2002,2003; Fonyó, 1974; Koehler et al., 1992) have to be de-fined in this diagram. InFig. 8(a), the feed composition isdenoted byF. Two products are obtained from this feed: adistillate productD1 and a bottom productB1. Note thatdue to the existence of a distillation boundary, productD1is a ternary mixture instead of binary, like in the zeotropiccase. Assuming thatD1 is located in a different distillationregion than the feed (D1 crosses the distillation boundary),the procedure for generating the states follows in the same
Fig. 8. Azeotropic STN representation and superstructure.
fashion as in the zeotropic case. However, for azeotropicmixtures, the azeotrope is considered as a pseudo compo-nents (Sargent, 1998). The complete states and tasks defini-tions are presented in the STN representation inFig. 8(b).The superstructure for the separation of this mixture intopure products is derived inFig. 8(c). Note that the streamwith the azeotrope composition is recycled to be fed in thefirst column of the scheme.
5. GDP formulation
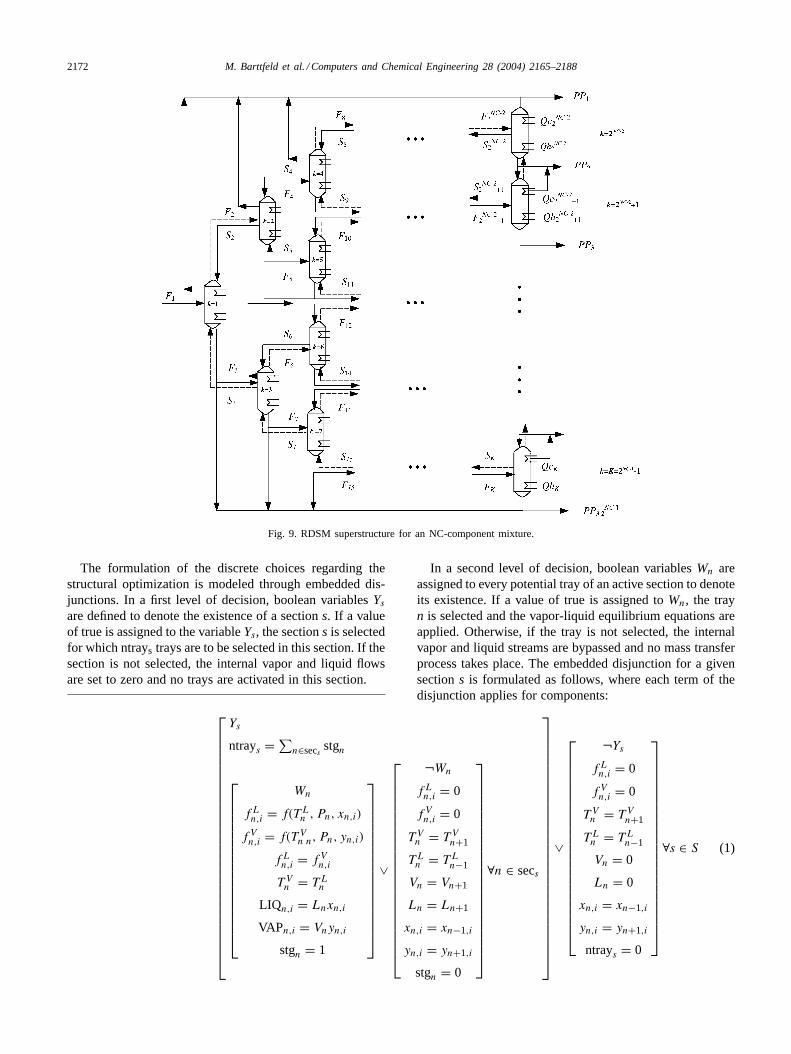
In this section, the Generalized Disjunctive Programming(Turkay & Grossmann, 1996) formulation for the optimalsynthesis for the separation of a NC-component zeotropicmixture is presented. Let Fo andzfoi be the feed flow rate andcomposition, respectively. LetC be the set of componentsi present in the feed:C = i|i = 1, . . . ,NC. As definedin the previous section, let the indexk denote each columnin the sequence: NCOL= k|k = 1, . . . , K = 2NC−1 −1. Let NTRAY be the set of potential trays NTRAY=n|n = 1, . . . ,NT and letNk represents the subset of traysnk in columnk: Nk = nk|nk = 1, . . . ,NTk. Also considerthe general RDSM superstructure shown inFig. 9 for theseparation of a NC-zeotropic mixture.
2172 M. Barttfeld et al. / Computers and Chemical Engineering 28 (2004) 2165–2188
Fig. 9. RDSM superstructure for an NC-component mixture.
The formulation of the discrete choices regarding thestructural optimization is modeled through embedded dis-junctions. In a first level of decision, boolean variablesYs
are defined to denote the existence of a sections. If a valueof true is assigned to the variableYs, the sections is selectedfor which ntrays trays are to be selected in this section. If thesection is not selected, the internal vapor and liquid flowsare set to zero and no trays are activated in this section.
In a second level of decision, boolean variablesWn areassigned to every potential tray of an active section to denoteits existence. If a value of true is assigned toWn, the trayn is selected and the vapor-liquid equilibrium equations areapplied. Otherwise, if the tray is not selected, the internalvapor and liquid streams are bypassed and no mass transferprocess takes place. The embedded disjunction for a givensections is formulated as follows, where each term of thedisjunction applies for components:
Ys
ntrays = ∑n∈secs stgn
Wn
fLn,i = f(TL
n , Pn, xn,i)
f Vn,i = f(T V
n n, Pn, yn,i)
fLn,i = fV
n,i
T Vn = TL
n
LIQn,i = Lnxn,i
VAPn,i = Vnyn,i
stgn = 1
∨
¬Wn
fLn,i = 0
fVn,i = 0
TVn = TV
n+1
TLn = TL
n−1
Vn = Vn+1
Ln = Ln+1
xn,i = xn−1,i
yn,i = yn+1,i
stgn = 0
∀n ∈ secs
∨
¬Ys
fLn,i = 0
fVn,i = 0
TVn = TV
n+1
TLn = TL
n−1
Vn = 0
Ln = 0
xn,i = xn−1,i
yn,i = yn+1,i
ntrays = 0
∀s ∈ S (1)

M. Barttfeld et al. / Computers and Chemical Engineering 28 (2004) 2165–2188 2173
In (1) Sis the set of rectifying and stripping column sectionsin the sequence:S = s|s = rect1, strip1, rect2, strip2, . . . ,
rectK, stripK. In order to assign a set of trays to a section, theset secs is defined to denote the set of potential intermediatetrays that belong to sections.
The design specifications and logic propositions are givenby the general expressions (2) and (3), which involve onlyboolean variables:
Ω(Ys) = True ∀s ∈ S (2)
Ω(Wn) = True ∀n ∈ IT (3)
In Eq. (3), the set IT denotes all the intermediate traysof the superstructure: IT= ⋃K
k=1ITk. These propositionsmodel feasibility conditions for the separation and logicexpressions. Feasibility conditions can be formulated forzeotropic mixtures considering that the minimum number ofcolumn sections required to achieve pure products is 2(n−1)(Agrawal, 1996). To illustrate feasibility conditions, con-sider a zeotropic ternary mixture. According to the super-structure shown inFig. 7(a), the following logic feasibilitypropositions apply:
¬Ystrip2⇒ Ystrip3
∧ Yrect3 (4)
¬Yrect3 ⇒ Ystrip2∧ Yrect2 (5)
¬Yrect2 ⇒ ¬Ystrip2(6)
¬Ystrip3⇒ ¬Yrect3 (7)
Eq. (4) imposes the condition that if the stripping sectionof column 2 is not selected (Ystrip2 is false), column 3 hasto be selected (Ystrip3 andYstrip3 true) in order to achieve afeasible design. The analogous situation is model inEq. (5)if the rectifying section of column 3 is not selected.Eq. (6)avoids that the stripping section of column 2 is selected ifthe rectifying section of this column was previously acti-vated. For column 3,Eq. (7)avoids the selection of the rec-tifying section if the stripping section of this column wasnot previously activated.
For the trays which belong to selected sections, logic ex-pressions are considered to avoid the possibility of obtainingmultiple solutions with the same objective function value.Eqs. (8) and (9)enforce that the selected trays be selectedabove and below the feed tray (Yeomans & Grossmann,2000b):[
Ys
Wn+1 ⇒ Wn
]∨
[¬Ys
Wn = false
]∀s ∈ RECT, n ∈ secs
(8)
[Ys
Wn ⇒ Wn+1
]∨
[¬Ys
Wn = false
]∀s ∈ STRIP, n ∈ secs
(9)Note that the set RECT contains all the rectifying sections:RECT = rect1, rect2, . . . , rectK and the set STRIP allthe stripping sections: STRIP= strip1, strip2, . . . , stripK.Also, letNF bethe set of all feed streams in the superstruc-ture:NF = nf|nf = F, S, L.
The VLE and equilibrium conditions are applied for allthe permanent trays of the sequence inEq. (10). The set ofpermanent stages in each columnk are defined as follows:permk = prodk
⋃nf feednf,k, where prodk is a tray where
a product is withdrawn and feednf ,k is a tray where feednf enters in columnk. Then, the set of all permanent traysin the superstructure is given by PERM= ⋃K
k=1permk.Eq. (11) include the summation of the mole fractions andthe definition of the enthalpies for the internal vapor andliquid streams:
fLn,i = f(Tn, Pn, xn,i)
f Vn,i = f(Tn, Pn, yn,i)
f Vn,i = fL
n,i
T Vn = TL
n
LIQn,i = Lnxn,i
VAPn,i = Vnyn,i
stgn = 1
∀n ∈ PERM, i ∈ C (10)
NC∑i=1
xn,i = 1
NC∑i=1
yn,i = 1
hliqn = f(TLn ,LIQn,i)
hvapn = f(T Vn ,VAPn,i)
∀n ∈ NTRAY (11)
Eq. (12)define the individual feed flow for each feed streamnf.
FEEDnf,n,i = Fnf,n zfnf,i
∀n ∈ PERM, n ∈ feednf,k,nf ∈ NF, i ∈ C (12)
The liquid and vapor intermediate product individual flowsare defined inEq. (13) as well as the liquid and vaporproducts enthalpies. In this constraint, NPROD is the setof products of the superstructure: NPROD= ⋃K
k=1nprodk,where nprodk is the set of products stages in each columnk: nprodk = topk ∪ botk
⋃np sidepnp,k. Note that the set
sidepnp,k refers to the candidate trays from where a productnp can be withdrawn in columnk.
PLIQn,i = PLnxn,i
PVAPn,i = PVnyn,i
hpliqn = f(TLn ,PLIQn,i)
hpvapn = f(T Vn ,PVAPn,i)
∀n ∈ PERM, n ∈ NPROD, i ∈ C (13)

2174 M. Barttfeld et al. / Computers and Chemical Engineering 28 (2004) 2165–2188
Mass and energy balances are formulated for every tray.Eq. (14)model the feed trays,Eq. (15)are applied to all intermediatetrays, andEqs. (16) and (17)model top and bottom trays, respectively. Note that TOP= ⋃K
k=1topk and BOT= ⋃Kk=1botk.
Eq. (18)are applied to those trays from where side products emerge.∑nf∈feednf,k
FEEDnf,n,i − LIQn,i − VAPn,i + LIQn−1,i + VAPn+1,i = 0 ∀i ∈ C
∑nf∈feednf,k
hfeednf,n − hliqn − hvapn + hliqn−1 + hvapn+1 = 0
∀nf ∈ NF, n ∈ feednf,k (14)
LIQn,i + VAPn,i − LIQn−1,i − VAPn+1,i = 0 ∀i ∈ C
hliqn + hvapn − hliqn−1 − hvapn+1 = 0
∀n ∈ IT (15)
VAPn+1,i − LIQn,i − PLIQn,i − PVAPn,i = 0 ∀i ∈ C
hvapn+1 − hliqn − hpliqn − hpvapn − Qn = 0
∀n ∈ TOP (16)
LIQn−1,i − VAPn,i − PLIQn,i = 0 ∀i ∈ C
hliqn−1 − hvapn − hpliqn + Qn = 0
∀n ∈ BOT (17)
LIQn−1,i + VAPn+1,i − LIQn,i − VAPn,i − PVAPn,i − PLIQn,i = 0 ∀i ∈ C
hliqn−1 + hvapn+1 − hliqn − hvapn − hpvapn − hpliqn = 0
∀n ∈ sidepnp,k (18)
The energy requirements in the condenserQck and reboilerQhk of every columnk are defined inEq. (19):
Qck = Qn n ∈ topk
Qhk = Qn n ∈ botk
∀k ∈ NCOL (19)
Total mass and energy balances are formulated for the superstructure inEq. (20). In constraints (21) mass and energybalances are formulated for each columnk of the superstructure (seeFig. 9).
∑n∈feedF1,1
FF1,n =J∑
j=1
PPj
∑n∈feedF1,1
FEEDF1,n,i =J∑
j=1
Pzj,i ∀i ∈ C
∑n∈feedF1,1
hfeedF1,n +K∑
k=1
(Qhk − Qck) =J∑
j=1
Phj
(20)
∑n∈Nk
∑nf∈feednf,k
FEEDnf,n,i =∑n∈Nk
(PLIQn,i + PVAPn,i) ∀i ∈ C
∑n∈Nk
∑nf∈feednf,k
hfeednf,n + Qhk − Qck =∑n∈Nk
(hpliqn + hpvapn)
∀k ∈ NCOL (21)
Column interconnection balances are considered next. The problem feed flow, composition and enthalpy are defined inEq. (22):∑n∈feedF1,1
FF1,n = Fo
∑n∈feedF1,1
FEEDF1,n,i = Fo zfoi ∀i ∈ C
∑n∈feedF1,1
hfeedF1,n = hfo
(22)
M. Barttfeld et al. / Computers and Chemical Engineering 28 (2004) 2165–2188 2175
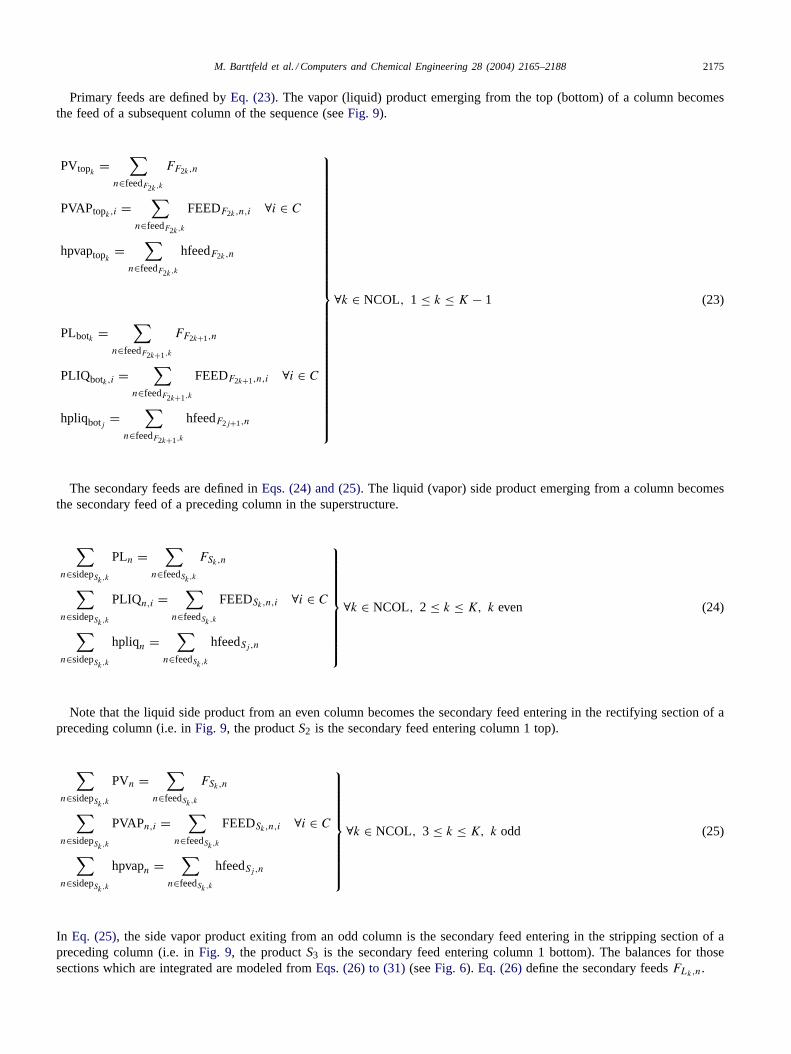
Primary feeds are defined byEq. (23). The vapor (liquid) product emerging from the top (bottom) of a column becomesthe feed of a subsequent column of the sequence (seeFig. 9).
PVtopk =∑
n∈feedF2k,k
FF2k,n
PVAPtopk,i =∑
n∈feedF2k,k
FEEDF2k,n,i ∀i ∈ C
hpvaptopk=
∑n∈feedF2k,k
hfeedF2k,n
PLbotk =∑
n∈feedF2k+1,k
FF2k+1,n
PLIQbotk,i =∑
n∈feedF2k+1,k
FEEDF2k+1,n,i ∀i ∈ C
hpliqbotj =∑
n∈feedF2k+1,k
hfeedF2j+1,n
∀k ∈ NCOL, 1 ≤ k ≤ K − 1 (23)
The secondary feeds are defined inEqs. (24) and (25). The liquid (vapor) side product emerging from a column becomesthe secondary feed of a preceding column in the superstructure.
∑n∈sidepSk,k
PLn =∑
n∈feedSk,k
FSk,n
∑n∈sidepSk,k
PLIQn,i =∑
n∈feedSk,k
FEEDSk,n,i ∀i ∈ C
∑n∈sidepSk,k
hpliqn =∑
n∈feedSk,k
hfeedSj,n
∀k ∈ NCOL, 2 ≤ k ≤ K, k even (24)
Note that the liquid side product from an even column becomes the secondary feed entering in the rectifying section of apreceding column (i.e. inFig. 9, the productS2 is the secondary feed entering column 1 top).
∑n∈sidepSk,k
PVn =∑
n∈feedSk,k
FSk,n
∑n∈sidepSk,k
PVAPn,i =∑
n∈feedSk,k
FEEDSk,n,i ∀i ∈ C
∑n∈sidepSk,k
hpvapn =∑
n∈feedSk,k
hfeedSj,n
∀k ∈ NCOL, 3 ≤ k ≤ K, k odd (25)
In Eq. (25), the side vapor product exiting from an odd column is the secondary feed entering in the stripping section of apreceding column (i.e. inFig. 9, the productS3 is the secondary feed entering column 1 bottom). The balances for thosesections which are integrated are modeled fromEqs. (26) to (31)(seeFig. 6). Eq. (26)define the secondary feedsFLk,n.

2176 M. Barttfeld et al. / Computers and Chemical Engineering 28 (2004) 2165–2188
PLbotk ≥∑
n∈feedLk,k
FLk,n
PLIQbotk,i ≥∑
n∈feedLk,k
FEEDLk,n,i ∀i ∈ C
hpliqbotk ≥∑
n∈feedLk,k
hfeedLk,n
PVtopk+1=
∑n∈feedLk+1,k
FLk+1,n
PVAPtopk+1,i=
∑n∈feedLk+1,k
FEEDLk+1,n,i ∀i ∈ C
hpvaptopk+1=
∑n∈feedLk+1,k
hfeedLk+1,n
∀k ∈ NCOL, k ∈ 2NC−1 − 1 − NC+ m, 0 ≤ m ≤ K − 1, m even
(26)
Eq. (27)define the products PPj emerging from totally integrated sections. The indexj denotes each final product FP=j|j = 1, . . . , J = 3 × 2NC−1.
PLbotk −∑
n∈feedLk,k
FLk,n + PLtopk+1= PPj
PLIQbotk,i −∑
n∈feedLk,k
FEEDLk,n,i + PLIQtopk+1,i= Pzj,i ∀i ∈ C
hpliqbotk −∑
n∈feedLk,k
hfeedLk,n + hpliqtopk+1= Phj
∀k ∈ NCOL, j ∈ FP, k ∈ 2NC−1 − 1 − NC+ m, j = 3m − 1, 0 ≤ m ≤ K − 1, m even (27)
Constraints (28) define the final product that is rich in the lightest component PP1:
PPj = PLtop1+
∑k∈Kz1
PLtopk
Pzj,i = PLIQtop1,i+
∑k∈Kz1
PLIQtopk,i ∀i ∈ C
Phj = hpliqtopK−NC+
∑k∈Kz1
hpliqtopk
∀j ∈ FP, j = 1 (28)
In Eq. (28), Kz1 is the subset of NCOL defined as follows:Kz1 = k|2 ≤ k ≤ 2NC−2, k ∈ ∑mr=22r−1 with 1 ≤ m ≤ NC.
Note that the product rich in the lightest component PP1, is formed with the top product of column 1 and with the contributionsof all the top products of the first columns of each level (seeFig. 9). Then,Kz1 is the subset defining the first column at eachlevel of the superstructure.
Constraints (29) define the final product that is rich in the heaviest component PPJ :
PPj = PLbotK +∑
k∈Kz2
(PLbotk −∑
n∈feedF2k+1,k
FF2k+1,n)
Pzj,i = PLIQbotK,i +∑
k∈Kz2
(PLIQbotk,i −∑
n∈feedF2k+1,k
FEEDF2k+1,n,i) ∀i ∈ C
Phj = hpliqbotK +∑
k∈Kz2
(hpliqbotk −∑
n∈feedF2k+1,k
hfeedF2k+1,n)
∀j ∈ FP, j = J (29)
In Eq. (29), Kz2 is the subset of NCOL defined as follows:Kz2 = kr|1 ≤ kr ≤ K, kr = 2kr−1 + 1, k0 = 1, r ∈ Z. Notethat the product that is rich in the heaviest component PPJ, is formed with the bottom product of columnK and with thecontributions of all the bottom products of the last columns of each level (seeFig. 9). Then,Kz2 is the subset defining thelast column at each level of the superstructure.

M. Barttfeld et al. / Computers and Chemical Engineering 28 (2004) 2165–2188 2177
Fig. 10. Superstructure for a five components feed.
Next, the final products emerging from the non-integrated rectifying section are defined. ConsiderFig. 10, where thesuperstructure is shown for a five component feed. Two types of top products can be defined. Product PP4 (seeFig. 10) isformed by the contributions of the top products of column 10 and column 5. If column 10 is not selected, product PP4 richin componentB will emerge directly from column 5. For a multicomponent mixture,Eq. (30)model this product as follows:
PPj = PLtopk + PLtopk/2
Pzj,i = PLIQtopk,i + PLIQtopk/2,i∀i ∈ C
Phj = hpliqtopk+ hpliqtopk/2
k ∈ NCOL, j ∈ FP, k ∈ 2NC−2 + 2 + m, 5 ≤ k < K, j = 4,10,16, . . . , m = 0,4,8, . . . (30)
Note that inFig. 10, product PP7 is formed by the contributions of the top product of column 12 as well as by the top productsof columns 3 and 6. If column 12 is not selected in the superstructure, then product PP7 will emerge from the top of column6. If both columns 6 and 12 are not selected, this product will exit from the top section of column 3. For a multicomponentfeed the definition of this type of final product is given byEq. (31):
PPj = PLtopk +∑k∈Kz3
PLtopk
Pzj,i = PLIQtopk,i +∑k∈Kz3
PLIQtopk,i ∀i ∈ C
Phj = hpliqtopk+
∑k∈Kz3
hpliqtopk
k ∈ NCOL, j ∈ FP, k ∈ 2NC−2 + 4 + m, 12 ≤ k < K, j = 7,14, . . . , m = 0,4,8, . . . (31)
In the aboveEq. (31), Kz3 is the subset of NCOL defined as follows:Kz3 = kr|3 ≤ kr ≤ K, kr = 2kr−1, k0 = 3, r ∈ Z.Note that for a five component feed,Kz3 is the subset containing columns 3 and 6.
2178 M. Barttfeld et al. / Computers and Chemical Engineering 28 (2004) 2165–2188
The products from non-integrated stripping sections aredefined next.
PPj = PLbotk + PLbot(k−1)/2
Pzj,i = PLIQbotk,i + PLIQbot(k−1)/2,i∀i ∈ C
Phj = hpliqbotk + hpliqbot(k−1)/2
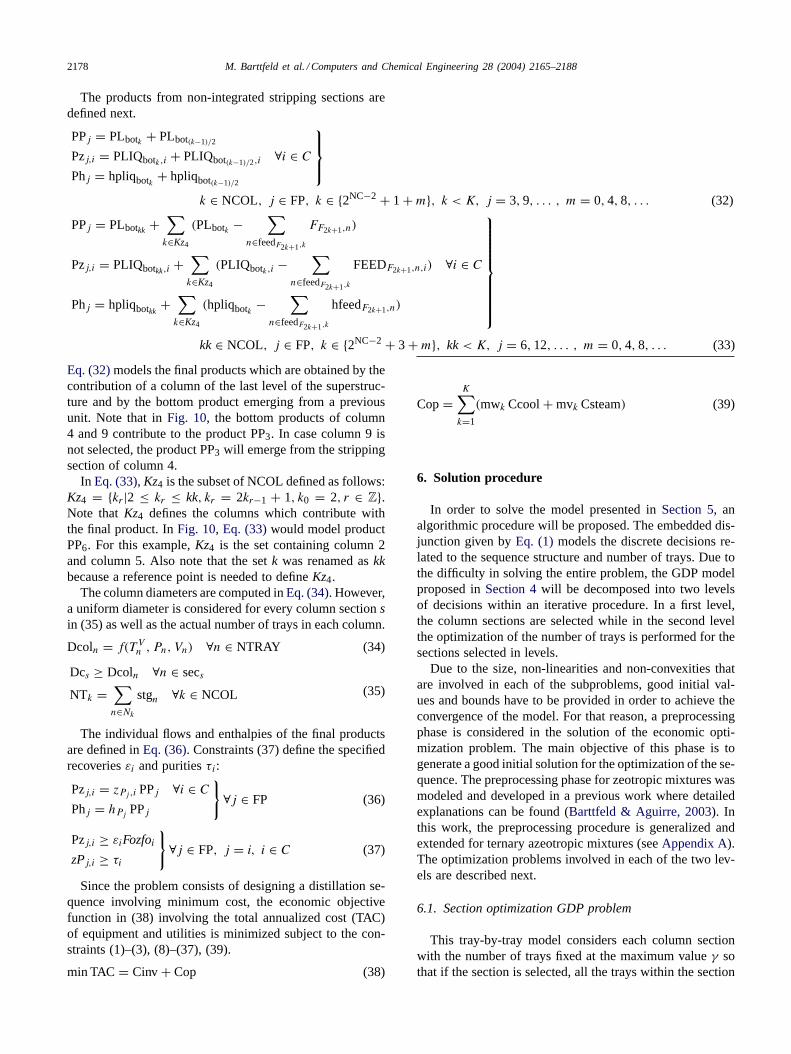
k ∈ NCOL, j ∈ FP, k ∈ 2NC−2 + 1 + m, k < K, j = 3,9, . . . , m = 0,4,8, . . . (32)
PPj = PLbotkk +∑k∈Kz4
(PLbotk −∑
n∈feedF2k+1,k
FF2k+1,n)
Pzj,i = PLIQbotkk,i+
∑k∈Kz4
(PLIQbotk,i −∑
n∈feedF2k+1,k
FEEDF2k+1,n,i) ∀i ∈ C
Phj = hpliqbotkk+
∑k∈Kz4
(hpliqbotk −∑
n∈feedF2k+1,k
hfeedF2k+1,n)
kk ∈ NCOL, j ∈ FP, k ∈ 2NC−2 + 3 + m, kk< K, j = 6,12, . . . , m = 0,4,8, . . . (33)
Eq. (32)models the final products which are obtained by thecontribution of a column of the last level of the superstruc-ture and by the bottom product emerging from a previousunit. Note that inFig. 10, the bottom products of column4 and 9 contribute to the product PP3. In case column 9 isnot selected, the product PP3 will emerge from the strippingsection of column 4.
In Eq. (33), Kz4 is the subset of NCOL defined as follows:Kz4 = kr|2 ≤ kr ≤ kk, kr = 2kr−1 + 1, k0 = 2, r ∈ Z.Note thatKz4 defines the columns which contribute withthe final product. InFig. 10, Eq. (33)would model productPP6. For this example,Kz4 is the set containing column 2and column 5. Also note that the setk was renamed askkbecause a reference point is needed to defineKz4.
The column diameters are computed inEq. (34). However,a uniform diameter is considered for every column sectionsin (35) as well as the actual number of trays in each column.
Dcoln = f(T Vn , Pn, Vn) ∀n ∈ NTRAY (34)
Dcs ≥ Dcoln ∀n ∈ secs
NTk =∑n∈Nk
stgn ∀k ∈ NCOL (35)
The individual flows and enthalpies of the final productsare defined inEq. (36). Constraints (37) define the specifiedrecoveriesεi and puritiesτi:
Pzj,i = zPj,i PPj ∀i ∈ C
Phj = hPj PPj
∀j ∈ FP (36)
Pzj,i ≥ εiFozfoizPj,i ≥ τi
∀j ∈ FP, j = i, i ∈ C (37)
Since the problem consists of designing a distillation se-quence involving minimum cost, the economic objectivefunction in (38) involving the total annualized cost (TAC)of equipment and utilities is minimized subject to the con-straints (1)–(3), (8)–(37), (39).
min TAC = Cinv + Cop (38)
Cop=K∑
k=1
(mwk Ccool+ mvk Csteam) (39)
6. Solution procedure
In order to solve the model presented inSection 5, analgorithmic procedure will be proposed. The embedded dis-junction given byEq. (1)models the discrete decisions re-lated to the sequence structure and number of trays. Due tothe difficulty in solving the entire problem, the GDP modelproposed inSection 4will be decomposed into two levelsof decisions within an iterative procedure. In a first level,the column sections are selected while in the second levelthe optimization of the number of trays is performed for thesections selected in levels.
Due to the size, non-linearities and non-convexities thatare involved in each of the subproblems, good initial val-ues and bounds have to be provided in order to achieve theconvergence of the model. For that reason, a preprocessingphase is considered in the solution of the economic opti-mization problem. The main objective of this phase is togenerate a good initial solution for the optimization of the se-quence. The preprocessing phase for zeotropic mixtures wasmodeled and developed in a previous work where detailedexplanations can be found (Barttfeld & Aguirre, 2003). Inthis work, the preprocessing procedure is generalized andextended for ternary azeotropic mixtures (seeAppendix A).The optimization problems involved in each of the two lev-els are described next.
6.1. Section optimization GDP problem
This tray-by-tray model considers each column sectionwith the number of trays fixed at the maximum valueγ sothat if the section is selected, all the trays within the section

M. Barttfeld et al. / Computers and Chemical Engineering 28 (2004) 2165–2188 2179
are active but with a lower bound for the cost (i.e. minimumnumber of trays). The idea is to provide a lower bound tothe cost by providing the maximum scope for separationwhile underestimating the investment cost. The embeddeddisjunction given byEq. (1)reduces then into the followingsimple disjunction:
Ys
ntrays =∑
n∈secs
stgn = γ
fLn,i = f(TL
n , Pn, xn,i) ∀n ∈ secs, i ∈ C
fVn,i = f(T V
n n, Pn, yn,i)
fLn,i = fV
n,i
T Vn = TL
n
LIQn,i = Ln xn,i
VAPn,i = Vn yn,i
∨
¬Ys
ntrays = 0
fLn,i = 0
fVn,i = 0
TVn = TV
n+1
TLn = TL
n−1Vn = 0Ln = 0xn,i = xn−1,i
yn,i = yn+1,i
∀s ∈ S (40)
If Ys is true the sections is selected and the upper boundγ ofthe number of trays become active. Then, the VLE equationsare applied to these trays. If the section is not selected, theVLE are not imposed and the vapor and liquid internal flowsare set to zero.
The constraints for this problem are given byEqs. (2),(3), (10)–(31) and (36)–(40). The problem then consists inminimizing the total annualized cost TAC, which is definedin Eq. (38). In addition, the following equations are addedto the model. The investment cost Cinv involves the cost forthe column trays Ctrays, the cost of the column shell Ccolsand the condenser and reboiler costs Ccondk and Crebk,respectively (seeEq. (41)). Eq. (42)are global constraintswhich define the trays and column shell costs.
Cinv =∑s
(Ctrays + Ccols) +K∑
k=1
(Ccondk + Crebk) (41)
Ctrays = γ loφ1
Ccols = γ loφ2
∀s ∈ S (42)
If a sections is selected, a number ntrays is assigned toeach column section. However, to underestimate the invest-ment costs, a lower bound for the number of trays,γ lo, andthe parametersφ1 andφ2 are considered inEq. (42). Thismodel does not include the calculation of the columns di-ameters. A constant average diameter is considered for each
unit section and defined asφ1 = ft(Dck) andφ2 = fc(Dck).The section diameters can be easily computed from thetray-by-tray preprocessing phase model by adding to theconstraints (34) and (35) to the preprocessing formulation.
In summary, by solving the section optimization problema candidate configuration with a lower bound for the cost isobtained. In the context of the algorithm the MILP approx-imation to the GDP problem will be used.
6.2. Tray optimization GDP problem
The optimization of the number of trays is formulatedin a reduced space since the optimization is carried outover a candidate configuration instead over the initial super-structure. This problem is solved in a reduced space sincethe sections that are not selected are excluded from thisproblem.
The embedded disjunction which models the discrete de-cision of selecting the number of trays of active sections isgiven by the following constraint, which is only applied tothose trays within selected sections(Ys = True):
Wn
fLn,i = f(TL
n n, Pn, xn,i) ∀i ∈ C
fVn,i = f(T V
n , Pn, yn,i)
fLn,i = fV
n,i
T Vn = TL
n
LIQn,i = Ln xn,i
VAPn,i = Vn yn,i
stgn = 1
∨
¬Wn
fLn,i = 0
fVn,i = 0
TVn = TV
n+1
TLn = TL
n−1
Vn = Vn+1
Ln = Ln+1
xn,i = xn−1,i
yn,i = yn+1,i
stgn = 0
∀n ∈ secs, for Ys = True (43)

2180 M. Barttfeld et al. / Computers and Chemical Engineering 28 (2004) 2165–2188
If Wn is assigned a value of true, the trayn is selected andthe VLE equations are applied. Otherwise, the vapor andliquid streams are by passed and no mass transfer processtakes place.
The other constraints of this problem are given byEqs. (3),(8)–(31) and (34)–(39). Also, Eq. (44) is included for thecomputation of the investment cost as well asEq. (45)whichmodel the cost for the trays and the column shell.
Cinv =K∑
k=1
(Ccondk + Crebk + Ctrayk + Ccolk) (44)
Ctrayk = NTk ft(Dcs)
Ccolk = NTk fc(Dcs)
∀k ∈ SCOL, s ∈ S (45)
Note that SCOLk is the set relating one column with itsrectifying and stripping sections, e.g., for column 1 (k = 1),SCOL1 = rect1, 1 strip1.
These equations are global constraints that are functionsof the number of trays of each unit NTk and also of thecolumns diameter, which is modeled inEqs. (34) and (35).The MILP approximation to this problem is also used inthe algorithm in the next section while the NLP subproblemarises for a fixed choice of the boolean variablesWn.
6.3. Solution algorithm
After solving the preprocessing phase models, thelogic-based outer approximation method byTurkay andGrossmann (1996)and its modification byYeomans andGrossmann (2000b)is applied to solve the GDP prob-lem. The algorithm iterates between the two MILP masterproblems and the reduced NLP subproblems. The MILPproblems are formulated with accumulated linearizationsand Big-M constraints, while the NLP subproblem simplyarises for fixed configuration (Ys) and trays (Wn).
Fig. 11. Decomposition algorithm.
In Fig. 11, the steps of the solution algorithm are pre-sented. After solving the initialization problem, the sectionGDP problem is first solved as an MILP problem yielding anoptimal sequence configuration by selecting the column sec-tions. The boolean variables that define the existence of sec-tions(Ys = true) are used to fix the configuration of the nextMILP problem for the optimization of the number of trayswhich is solved in reduced space by eliminating the falseterms in the disjunctions (e.g. equations for non-existent sec-tions). An NLP model is solved next for the selected config-uration and number of trays and feed location. Integer cutsinvolving the boolean variables related to the existence oftraysWn are then added to enforce the selection of a differenttray selection in the next iteration of the algorithm. Note thatinteger cuts involving the boolean variablesYs are not addedto the section MILP problem because the same selection ofsections (configuration) can lead to different total costs if adifferent number of trays is selected in the configuration.
The GDP algorithm stops when there is no improvementin the objective function of the NLP subproblems. It shouldbe noted that global optimality cannot be guaranteed dueto the non-convexities involved in the model. Their effect,however, is reduced with the GDP model since non-existingtrays are not included in the NLP subproblem.
7. Numerical examples
The performance of the algorithm is tested with four ex-amples that are presented in this section. In all cases, finalpure products are specified. A constant pressure of 1.01 baris considered for each column. A feed flow of 10 mol/s andsaturated liquid products are specified. The thermodynamicproperties are taken formReid, Prausnitz, and Poling (1987).
Example 1 and 2 involve the separation ofn-pentane,n-hexane andn-heptane and uses ideal equilibrium while

M. Barttfeld et al. / Computers and Chemical Engineering 28 (2004) 2165–2188 2181
Table 1Computational results for example 1
Preprocessing phase: NLP Tray-by-Tray ModelsContinuous variables 3297Constraints 3225CPU time (min) 2.20
Model descriptionContinuous variables 3301Discrete variables 96Constraints 3230Non-linear nonzero elements 3244Number of iterations 5NLP CPU time (min) 6.97MILP CPU time (min) 2.29CPU time (min) 9.25
Objective value (US$/year) 140880
Total CPU time (min) 11.46
example 3 and 4 deal with the separation of the azeotropicmixture methanol, ethanol and water and uses ideal gasmodel for the vapor phase and the Wilson model for the liq-uid phase. In all cases, the VLE equations involve the trans-formation of variables suggested byBauer and Stichlmair(1998)in order to improve the convergence of the NLP sub-problems. This transformation yields more linear equationswhen modeling the VLE equations.
The examples were implemented and solved in GAMS20.7 (Brooke, Kendrick, Meeraus, & Raman, 1998) in aPentium III, 667 MHz with 256 MB of RAM. The codeCPLEX 7.5 was used for solving the mixed integer linearprogramming (MILP) problems and CONOPT2 for the NLPsubproblems.
7.1. Example 1
A feed ofn-pentane (A),n-hexane (B) andn-heptane (C)with molar composition of 0.33/0.33/0.34 is given. The re-quired purity for the products is 98% forA, B andC with
Fig. 13. Example 1: (a) Superstructure with selected sections; (b) optimal Configuration in terms of two columns.
0.0 0.1 0.2 0.3 0.4 0.5 0.6 0.7 0.8 0.9 1.00.0
0.1
0.2
0.3
0.4
0.5
0.6
0.7
0.8
0.9
1.0
Mol
e fr
actio
n of
n-p
enta
ne
Mole fraction of n-hexane
Feed Column 1 Column 2 Column 3
Fig. 12. Example 1: Preprocessing solution liquid profiles.
a minimum recovery of 98% of each product. Each sectionis assigned a maximum of 15 trays. Ideal VLE model wasused for this system.
The method proposed in this paper was applied to thisproblem and the solution is reported in Table 1. The prepro-cessing phase is solved in 2.20 CPU min. The preprocessingsolution profiles are shown in Fig. 12. The decompositionalgorithm is applied next and the optimal solution was foundafter 5 iterations in 9.25 CPU min (6.97 min for the NLPsubproblems and 2.29 min for the MILP subproblems). Thetotal solution time is 11.46 CPU min.
The optimal configuration with a total cost of 140,880US$/year is shown in Fig. 13(b) (see Table 1). The solutionconfiguration involves the 6 sections selected in the super-structure, as can be seen in Fig. 13(a). Column 1 has 22trays selected with the feed entering in tray 12, column 2has 23 trays with a vapor feed entering in tray 14 and col-umn 3 also has also 23 trays and the feed stream in locatedin tray 10. This scheme can be rearranged in terms of two

2182 M. Barttfeld et al. / Computers and Chemical Engineering 28 (2004) 2165–2188
columns, according to the tray diameters obtained in the so-lution. Column 1, the stripping section of column 2 and therectifying section of column 3 have a diameter of 0.45 m,the rectifying section of column 2 has a diameter of 0.6 mwhile the stripping section of column 3 has a diameter of0.63 m (see Fig. 13(a)). Therefore, the rectifying section ofcolumn 2 is moved to the top of column 1 and the strippingsection of column 2 is placed on the top of column 3. In thisway, the configuration shown in Fig. 13(b) is obtained. Inthe optimal rearranged solution, column 1 has 36 trays andthe feed stream enters in tray 26. Column 2 has 32 stages,a feed is placed in tray 19 and two liquid product streamsare withdrawn from tray 9 and 32. Due to the column cou-pling, column 2 does not have condenser. Column 1 has twocondensers, one on the top tray and the other in tray 12. Itis interesting to note that the existence of the equipment inan intermediate tray of the column improves the efficiencyof the separation scheme since the heat is eliminated in tray12 at a lower temperature than in the top tray of column 1.
The liquid composition profiles for the optimal configu-ration of Fig. 13(b) are shown in Fig. 14. As can be seenfrom Fig. 14, the separation takes place close to minimumreflux conditions since the composition profiles of column1 intersect at the feed composition.
The same problem was formulated as a MINLP problem.The formulation of this problem involved the optimizationof the feed stream and reboiler location. This representationfor tray optimization happens to be the most suitable repre-sentation for the superstructure (Barttfeld et al., 2003). Thepreprocessing phase was also applied to this formulation andDICOPT was used as the solver for this problem giving a re-laxed solution with a cost of 140,088 US$/year. The problemcould not be solved as an integer problem, since no integerfeasible solution was found by the solver, even by applyingthe domain reduction procedure (see Barttfeld et al., 2003)over the binary variables to reduce the size of the problem.The relaxed MINLP solution involves a slightly lower cost
0.0 0.1 0.2 0.3 0.4 0.5 0.6 0.7 0.8 0.9 1.00.0
0.1
0.2
0.3
0.4
0.5
0.6
0.7
0.8
0.9
1.0
Mol
e fr
actio
n of
n-p
enta
ne
Mole fraction of n-hexane
Feed Column 1 (trays 1 to 14) Column 1 (trays 15 to 36) Column 2 (trays 1 to 9) Column 2 (trays 10 to 32)
Fig. 14. Liquid composition profiles of the optimal configuration.
than the solution found with the decomposition GDP al-gorithm. However, since the integer mixed integer solutioncould not be found, both solutions cannot be compared.
Two conventional alternatives which lead a feasible de-sign for this separation were also optimized, the direct se-quence configuration and the side-rectifier configuration.The direct sequence yields a cost of 145,040 US$/year, whilethe side-rectifier configuration has a total cost of 143,440US$/year. This fact allows to conclude that the proposedalgorithm with 140,880 US$/year obtained a significantlybetter solution for this example problem.
7.2. Example 2
This example also involves the separation of n-pentane(A), n-hexane (B) and n-heptane (C) but the molar compo-sition considered is 0.6/0.2/0.2. The required purity for theproducts is 98% for A, B and C with a minimum recovery of98% of each product. Each section is assigned a maximumof 15 trays.
The computational results are shown in Table 2. The pre-processing phase is solved in 0.78 CPU min and the liquidcomposition profiles for this solution are shown in Fig. 15.
The optimal configuration has a total cost of 137,760US$/year and convergence is achieved in 7 iterations of thealgorithm. The total solution time is 13.07 min (8.85 minfor the NLP subproblems and 4.22 min for the MILP sub-problems). The optimal solution selects all sections of thesuperstructure as seen in Fig. 16(a). Column 1 has 23 traysactivated and uniform diameter of 0.5 m, column 2 has 24trays and a diameter of 0.62 m for the rectifying section and0.39 m for the stripping section, and column 3 also has 23trays and a uniform diameter of 0.39 m. This solution canbe rearranged in terms of two columns, as shown in Fig. 16.
The MINLP formulation was also used to solve this ex-ample. In this case as in the previous example, we could notsolve the integer problem. However, the relaxed solution for
0.0 0.1 0.2 0.3 0.4 0.5 0.6 0.7 0.8 0.9 1.00.0
0.1
0.2
0.3
0.4
0.5
0.6
0.7
0.8
0.9
1.0
Mol
e fr
actio
n of
n-p
enta
ne
Mole fraction of n-hexane
Feed Column 1 Column 2 Column 3
Fig. 15. Example 2: preprocessing solution liquid profiles.

M. Barttfeld et al. / Computers and Chemical Engineering 28 (2004) 2165–2188 2183
Fig. 16. Example 2: (a) optimal configuration; (b) liquid composition profiles of the optimal configuration.
this problem yields a cost of 121,120 US$/year, which islower bound to the one obtained by applying the GDP de-composition algorithm. Since the MINLP formulation couldnot be solved as an integer problem no comparisons can bemade between the MINLP and GDP solutions.
The direct sequence which is a feasible design for thisproblem, was optimized yielding a total cost of 138,480US$/year, which is a marginally higher than the one achievedwith the proposed method.
7.3. Example 3
A feed of methanol (A), ethanol (B) and water (C) withmolar composition of 0.5/0.3/0.2 is given. The specifica-tions considered for this problem were taken from Yeomansand Grossmann (2000b), where the required purity for theproducts is 90%. Each section is assigned a maximum of 20trays. This example uses ideal VLE model for the gas phaseand Wilson model to formulate the vapor–liquid equilibrium
Table 2Computational results for example 2
Preprocessing phase: NLP Tray-by-Tray ModelsContinuous variables 3297Constraints 2831CPU time (min) 1.3
Model descriptionContinuous variables 3301Discrete variables 96Constraints 3230Non-linear nonzero elements 3244Number of iterations 7NLP CPU time (min) 8.85MILP CPU time (min) 4.22CPU time (min) 13.07
Objective value (US$/year) 137760
Total CPU time (min) 14.37
in the liquid phase. The superstructure for this example isshown in Fig. 17.
The solution found for this problem after applying thedecomposition algorithm is reported in Table 3. The prepro-cessing phase is solved in 6 CPU min. The liquid compo-sition profiles for the columns in the preprocessing phasesolution are shown in Fig. 18. Note that pure products areobtained in each column since the distillate product of col-umn one crosses the distillation boundary.
The decomposition algorithm is applied next and the op-timal solution was found after three iterations in 56.1 CPUmin as shown in Table 3. Note that most of the computa-tion time involved is used for solving the NLP subproblems(54.7 min for the NLP subproblems and 2.33 min for theMILP subproblems). The total solution time is 62.15 CPUmin (Table 4).
Fig. 17. Example 3: superstructure.

2184 M. Barttfeld et al. / Computers and Chemical Engineering 28 (2004) 2165–2188
Table 3Computational results for example 3
Preprocessing phase: NLP Tray-by-Tray ModelsContinuous variables 9025Constraints 8996CPU time (min) 6.05
Model descriptionContinuous variables 8755Discrete variables 210Constraints 9466Non-linear nonzero elements 18230Number of iterations 3NLP CPU time (min) 54.7MILP CPU time (min) 2.33CPU time (min) 56.1
Objective value (US$/year) 321,680
Total CPU time (min) 62.15
The optimal solution yields a total cost of 321,680US$/year. Both sections of columns 1 and 2 were selectedfrom the initial superstructure. Column 1 has 40 trays witha diameter of 0.70 m. Column 2 has 39 trays with diametersof 0.70 and 0.55 m for the rectifying and stripping sections,respectively. This solution can be rearranged in terms ofone column and a side stripper as shown in Fig. 19. Therectifying section of the original column 2 was placed onthe top of the first column since both have the same di-ameter. The main feed enters in tray 40 of column 1 andproduct is withdrawn from this column in tray 20 to providepart of the main product PP1 (see Fig. 19). Note that theproduct rich in methanol (A) is formed by the contributionsof both the liquid top product of columns 1 and 2. Note thatthe liquid top product emerging from column 1 top has ahigher purity (98.9% of A) than the one required in the finalproduct, but this stream is mixed with the liquid productwithdrawn in tray 20 of column 1 (51% of A) to meet the
0.0 0.1 0.2 0.3 0.4 0.5 0.6 0.7 0.8 0.9 1.00.0
0.1
0.2
0.3
0.4
0.5
0.6
0.7
0.8
0.9
1.0
Met
hano
l (m
ole
frac
tion)
Ethanol (mole fraction)
Feed composition liquid composition profile column 1 liquid composition profile column 2 liquid composition profile column 3 liquid composition profile column 4 liquid composition profile column 5
Fig. 18. Example 3: liquid composition profiles in the preprocessing phasesolution.
Table 4Computational results for example 4
Preprocessing phase: NLP Tray-by-Tray ModelsContinuous variables 9025Constraints 8996CPU time (min) 6.05
Model descriptionContinuous variables 8755Discrete variables 210Constraints 9466Non-linear nonzero elements 18230Number of iterations 3NLP CPU time (min) 36.26MILP CPU time (min) 3.70CPU time (min) 39.97
Objective value (US$/year) 318,400
Total CPU time (min) 46.01
Fig. 19. Example 3: optimal configuration for products purity of 90%.
0.0 0.1 0.2 0.3 0.4 0.5 0.6 0.7 0.8 0.9 1.00.0
0.1
0.2
0.3
0.4
0.5
0.6
0.7
0.8
0.9
1.0
Met
hano
l Com
posi
tion
(mol
efr
actio
n)
Ethanol Composition (mole fraction)
Feed composition Column 1 liquid composition profile Column 2 liquid composition profile
Fig. 20. Example 3: liquid composition profiles of the economic solutionwith products purity of 90%.

M. Barttfeld et al. / Computers and Chemical Engineering 28 (2004) 2165–2188 2185
Fig. 21. Example 4: optimal configuration for products purity of 95%.
required purity of 90%. This situation is shown in Fig. 20,where the liquid composition profiles of the configurationof Fig. 19 are presented.
It is worth noting that the optimal configuration found bythe algorithm does not produce products with the azeotropiccomposition. This is because of the required purity of theproducts. As can be seen in Fig. 20, column 1 separates thefeed into a bottom product rich in water (90%) and a topproduct which is located on a different distillation regionthan the original feed. This product enters column 2 to beseparated into a top product with high purity in methanol andinto a bottom product which already achieved the requiredpurity of methanol. It should be noted that the separationis performed close to minimum reflux conditions since thecolumns involve a large number of trays.
7.4. Example 4
Another example involving a higher purity requirementfor the products was solved for the same feed compositionin example 3. In this case, a purity of 95% was specified forthe system in Example 2.
The optimal configuration is shown in Fig. 21 wherecolumns 1, 2 and 3 were selected form the initial super-structure. The cost is $ 318,400/yr, which is lower than the90% purity design, an indication that the latter correspondsto a suboptimal solution due to nonconvexities in the model.This solution was found in 3 iterations of the decompositionalgorithm and the recycle of a stream with the azeotropecomposition in order satisfy the products purity. The totalsolution time is 46 CPU min (36.26 CPU min for the NLPsubproblems, 3.70 CPU min for the MILP subproblems and6 CPU min to solve the preprocessing phase). Column 1involves 39 trays and a diameter of 0.65 m, column 2 has 38trays and a diameter of 0.56 m while column 3 has 35 trays
and a diameter of 0.32 m. In Fig. 22, the liquid compositionprofiles for the optimal configuration are presented.
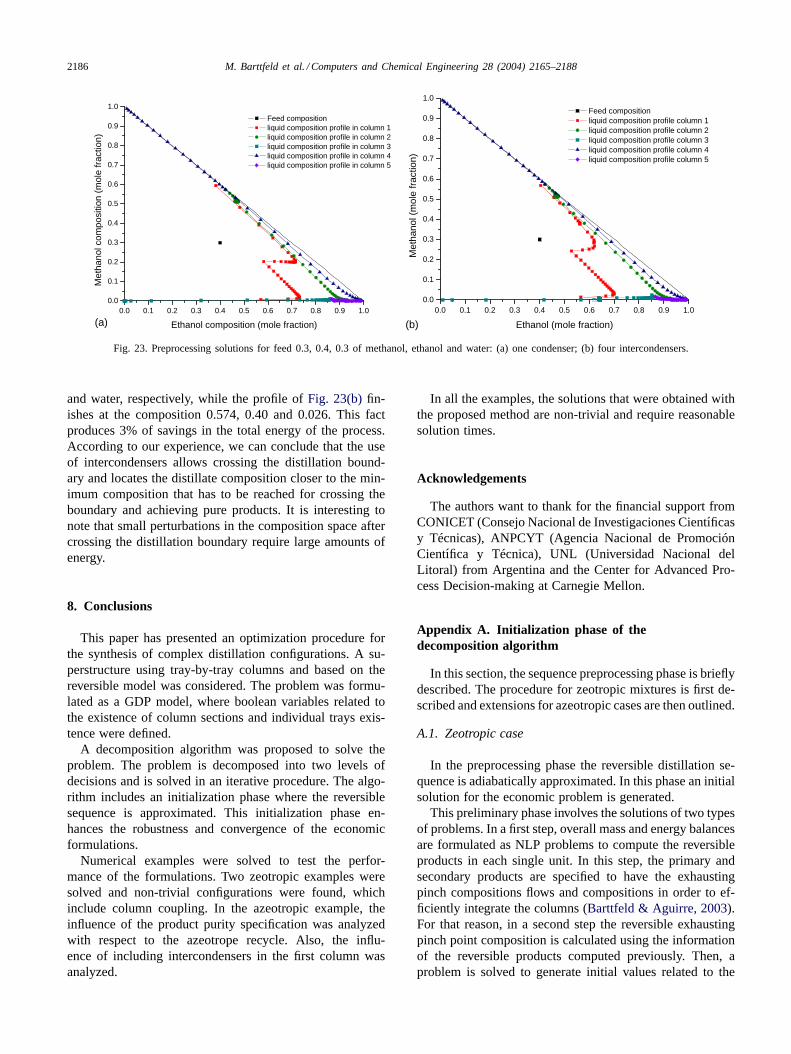
Finally, the use of intermediate condensers in column 1was analyzed. In Fig. 23, the preprocessing solution for afeed composition of 0.3, 0.4 and 0.3 of methanol, ethanoland water, respectively, is shown. In part (a) of Fig. 23,column 1 has only one condenser located in the top traywhile the profiles shown in Fig. 23(b) were obtained byplacing four intercondensers in column 1 on trays 1, 3, 5and 10. Column 1 of Fig. 23(b) requires less energy thancolumn 1 in Fig. 23(a). Both configurations achieved pureproducts. However, the structure without intercondensershas a column 1 profile which crosses more deeply intothe distillation boundary than the scheme with intercon-densers. The composition profile of Fig. 23(a) finishes atthe composition 0.594, 0.381, 0.024 of methanol, ethanol
0.0 0.1 0.2 0.3 0.4 0.5 0.6 0.7 0.8 0.9 1.00.0
0.1
0.2
0.3
0.4
0.5
0.6
0.7
0.8
0.9
1.0
Met
hano
l mol
e fr
actio
n
Ethanol mole fraction
Feed composition Liquid composition in column 1 Liquid composition in column 2 Liquid composition in column 3
Fig. 22. Example 4: liquid composition profiles of the economic solutionwith products purity of 95%.
2186 M. Barttfeld et al. / Computers and Chemical Engineering 28 (2004) 2165–2188
0.0 0.1 0.2 0.3 0.4 0.5 0.6 0.7 0.8 0.9 1.00.0
0.1
0.2
0.3
0.4
0.5
0.6
0.7
0.8
0.9
1.0M
etha
nol c
ompo
sitio
n (m
ole
frac
tion)
Ethanol composition (mole fraction)
Feed compositionliquid composition profile in column 1liquid composition profile in column 2liquid composition profile in column 3liquid composition profile in column 4liquid composition profile in column 5
0.0 0.1 0.2 0.3 0.4 0.5 0.6 0.7 0.8 0.9 1.00.0
0.1
0.2
0.3
0.4
0.5
0.6
0.7
0.8
0.9
1.0
Met
hano
l (m
ole
frac
tion)
Ethanol (mole fraction)
Feed composition liquid composition profile column 1 liquid composition profile column 2 liquid composition profile column 3 liquid composition profile column 4 liquid composition profile column 5
(a) (b)
Fig. 23. Preprocessing solutions for feed 0.3, 0.4, 0.3 of methanol, ethanol and water: (a) one condenser; (b) four intercondensers.
and water, respectively, while the profile of Fig. 23(b) fin-ishes at the composition 0.574, 0.40 and 0.026. This factproduces 3% of savings in the total energy of the process.According to our experience, we can conclude that the useof intercondensers allows crossing the distillation bound-ary and locates the distillate composition closer to the min-imum composition that has to be reached for crossing theboundary and achieving pure products. It is interesting tonote that small perturbations in the composition space aftercrossing the distillation boundary require large amounts ofenergy.
8. Conclusions
This paper has presented an optimization procedure forthe synthesis of complex distillation configurations. A su-perstructure using tray-by-tray columns and based on thereversible model was considered. The problem was formu-lated as a GDP model, where boolean variables related tothe existence of column sections and individual trays exis-tence were defined.
A decomposition algorithm was proposed to solve theproblem. The problem is decomposed into two levels ofdecisions and is solved in an iterative procedure. The algo-rithm includes an initialization phase where the reversiblesequence is approximated. This initialization phase en-hances the robustness and convergence of the economicformulations.
Numerical examples were solved to test the perfor-mance of the formulations. Two zeotropic examples weresolved and non-trivial configurations were found, whichinclude column coupling. In the azeotropic example, theinfluence of the product purity specification was analyzedwith respect to the azeotrope recycle. Also, the influ-ence of including intercondensers in the first column wasanalyzed.
In all the examples, the solutions that were obtained withthe proposed method are non-trivial and require reasonablesolution times.
Acknowledgements
The authors want to thank for the financial support fromCONICET (Consejo Nacional de Investigaciones Cientıficasy Técnicas), ANPCYT (Agencia Nacional de PromociónCientıfica y Técnica), UNL (Universidad Nacional delLitoral) from Argentina and the Center for Advanced Pro-cess Decision-making at Carnegie Mellon.
Appendix A. Initialization phase of thedecomposition algorithm
In this section, the sequence preprocessing phase is brieflydescribed. The procedure for zeotropic mixtures is first de-scribed and extensions for azeotropic cases are then outlined.
A.1. Zeotropic case
In the preprocessing phase the reversible distillation se-quence is adiabatically approximated. In this phase an initialsolution for the economic problem is generated.
This preliminary phase involves the solutions of two typesof problems. In a first step, overall mass and energy balancesare formulated as NLP problems to compute the reversibleproducts in each single unit. In this step, the primary andsecondary products are specified to have the exhaustingpinch compositions flows and compositions in order to ef-ficiently integrate the columns (Barttfeld & Aguirre, 2003).For that reason, in a second step the reversible exhaustingpinch point composition is calculated using the informationof the reversible products computed previously. Then, aproblem is solved to generate initial values related to the

M. Barttfeld et al. / Computers and Chemical Engineering 28 (2004) 2165–2188 2187
sections integration in the last level of the superstructure.This formulation computes the connection flows and energydemands after the integration of the column takes place.These preliminary formulations are well-behaved problemsthat compute initial values and bounds for the rigorouspreprocessing NLP tray-by-tray formulation. The formula-tions as well as an algorithmic procedure to sequentiallysolve these problems are described in detail in Barttfeld andAguirre (2003).
After these problems are solved, initial values to ther-modynamically optimize the superstructure of Fig. 9 areavailable. Then, the RDSM-based sequence is optimized toapproximate reversible conditions. Some of the characteris-tics of this problem are outlined next:
• All the columns of the superstructure are fixed. It meansthat all sections and all trays are selected and no structuraloptimization (discrete decisions) takes place.
• In order to approximate reversibility conditions, thecolumns of the superstructure have the number of traysfixed at the upper bound.
• The separation task performed in each column is thereversible or preferred separation (Barttfeld & Aguirre,2002; Fonyó, 1974; Koehler et al., 1992; Stichlmair &Fair, 1998).
• The main products are specified to have the exhaustingpinch point composition (Barttfeld & Aguirre, 2003). Sec-ondary feeds are specified to be in equilibrium with themain products.
• Heat exchange is allowed in all columns despite the factthat integration between columns takes place. As a conse-quence, the energy can be exchanged at intermediate lev-els of the superstructure, leading to more efficient designs.
Because good initial values and bounds are available forthis problem its convergence is enhanced. Thus, a good ini-tial guess, which is a feasible solution for the economicproblem is generated.
This rigorous tray-by-tray problem approximates the re-versible separation task in each column is described next.The objective function is given by Eq. (A.1):
z =NC∑i=1
K∑k=1
(ytopk,i− y
pinchtopk,i
)2 +K∑
k=1
(xbotk,i − xpinchbotk,i
)2
+K∑
k = 1k even
(zfSk,i − xpinchtopk,i
)2 +K∑
k = 1k odd
(zfSk,i − ypinchbotk,i
)2
+J∑
j=1
(zPj,i − xpj,i)2 (A.1)
Eq. (A.1) expresses the difference between each stream com-position which connect the units respect to the reversibleexhausting pinch point composition. The first (second) termof Eq. (A.1) specifies the vapor (liquid) composition ytopk,i
(xtopk,i) exiting from the top (bottom) of a column to have
the composition of the vapor (liquid) emerging from the re-versible rectifying (stripping) exhausting pinch point zoney
pinchtopk,i
(xpinchtopk,i
) (see Fig. 2). By including the third (fourth)term in Eq. (A.1), the liquid (vapor) secondary feed com-position zfSk,i will be similar to the liquid (vapor) compo-
sition xpinchtopk,i
(ypinchbotk,i
) entering in the reversible rectifying(stripping) exhausting pinch point zone. Then, the liquid andvapor streams connecting columns where multicomponentseparations take place have the composition and flow of thereversible exhausting pinch point. Note that the pinch pointcompositions were previously computed by solving the aux-iliary NLP problems mentioned before. Then, these compo-sitions are parameters in the tray-by-tray NLP model whichapproximates the reversible sequence in the preprocessingphase. The final products are also specified in the fifth termof the objective function. In this term, xpj,i is the desiredcomposition of the final product j.
The constraints of the rigorous pre-processing problemare given by Eqs. (10)–(31) and the following two extraconstraints:
PLtopk= FF2k+1,n 1 ≤ k ≤ K − NC− 1, k ∈
m∑
r=1
2r−1
,
1 ≤ m ≤ NC− 1 (A.2)
PLtopk= 0 2 ≤ k ≤ k − NC − 1 (A.3)
Eq. (A.2) impose the condition that the flow from the bot-tom of a column becomes the feed of a next column and itdoes not contribute to form the final product PPJ . In Fig. 9,note that this condition requires that the bottom product flowthat emerges from column 1 is fed to column 3. No flowcontributing to the product PPJ is allowed. This conditionis imposed in the preprocessing problem because every col-umn has a number of trays fixed in the upper bound. Itmeans that no structural optimization is considered in thisphase and the problem is solved keeping all the columns ofthe initial superstructure. Eq. (A.3) models the analogoussituation for the top products, requiring that no liquid prod-uct emerge from any top tray. Since no sections are elim-inated in this phase, the final product PP1 is formed justwith the contribution of the top product of column 2NC−2
(see Fig. 9).
A.2. Azeotropic case
The preprocessing procedure presented above can be eas-ily extended for ternary azeotropic mixtures containing acomposition diagram similar to the one in Fig. 8. The maindifference in the scheme in this case relies on the fact thatdue to the existence of a distillation boundary, the distil-late product of the first column is given by a ternary mix-ture. Then, the reversible product composition and flowscannot be computed by overall mass and energy balancesas in the zeotropic case. Moreover, since the distillate prod-uct of column 1 has the same number of components as the

2188 M. Barttfeld et al. / Computers and Chemical Engineering 28 (2004) 2165–2188
feed stream, the reversible exhausting point does not takeplace in the rectifying section of column 1. For that rea-son, for azeotropic mixtures, a preprocessing phase for col-umn 1 as a single unit has to be included. In this phase,the single column is modeled as a tray-by-tray model toapproximate reversible conditions. Details on this proce-dure can be found in our previous work (Barttfeld et al.,2003).
After solving the single column preprocessing phase forcolumn 1, the composition of the ternary distillate prod-uct yrever
top1,iis known. As was shown in our previous work
(Barttfeld et al., 2003), this composition crosses the distilla-tion boundary. Then, the objective function for the azeotropiccase is given by the following expression:
z =NC∑i=1
(ytop1,i− yrever
top1,i)2 +
K∑k=2
(ytopk,i− y
pinchtopk,i
)2
+K∑
k=1
(xbotk,i − xpinchbotk,i
)2 +K∑
k = 2k even
(zfSk,i − xpinchtopk,i
)2
+K∑
k = 2k odd
(zfSk,i − ypinchbotk,i
)2 +J∑
j=1
(zPj,i − xpj,i)2 (A.4)
Note that Eq. (A.4) only differs from Eq. (A.1) in the termformulated for the top product exiting column 1. The dif-ference between the distillate product composition ytop1,i
from column 1 and the reversible composition yrevertop1,i
is min-imized. Also note that there is no secondary feed in the rec-tifying section of column 1 since the exhausting pinch pointdoes not take place. The constraints of the problem are thesame than in the zeotropic case.
References
Agrawal, R. (1996). Synthesis of distillation column configurations formulticomponent separations. Ind. Eng. Chem. Res., 35, 1059.
Annakou, O., & Mizsey, P. (1996). Rigorous comparative study ofenergy-integrated distillation schemes. Ind. Eng. Chem. Res., 35,1877.
Barttfeld, M., & Aguirre, P. A. (2002). Optimal synthesis of distillationprocesses. part i. preprocessing phase for zeotropic mixtures. Ind. Eng.Chem. Res., 41, 5298.
Barttfeld, M., & Aguirre, P. A. (2003). Optimal Synthesis of Multicom-ponent Zeotropic Distillation Processes. Part II. Preprocessing Phaseand Rigorous Optimization of Efficient Sequences. To appear in Ind.Eng. Chem. Res.
Barttfeld, M., Aguirre, P. A., & Grossmann, I. E. (2003). Alternativerepresentations and formulations for the economic optimization ofmulticomponent distillation. Comp. Chem. Eng., 27, 363–383.
Bauer, M. B., & Stichlmair, J. (1998). Design and economic optimiza-tion of azeotropic distillation processes using mixed-integer nonlinearprogramming. Comput. Chem. Eng., 22(9), 1271.
Brooke, A., Kendrick, D., Meeraus, A., & Raman, R., GAMS, A UserGuide. 1998.
Caballero, J.A., & Grossmann, I.E. (2002). Thermodynamically EquivalentConfigurations for Thermally Coupled Distillation Columns. Submittedfor publication.
Dunnebier, G., & Pantelides, C. C. (1999). Optimal design of thermallycoupled distillation columns. Ind. Eng. Chem. Res., 38, 162.
Fidkowski, Z., & Agrawal, R. (1995). Utilization of waste heat steam indistillation. Industrial and Engineering Chemistry Research, 34, 1287.
Fidkowski, Z., & Agrawal, R. (1996). On the Use of Intermediate Con-densers in the Rectifying Section and Reboilers in the Stripping Sec-tion. Industrial and Engineering Chemistry Research, 35, 2801.
Fidkowski, Z., & Krolikowski, L. (1986). Thermally coupled system ofdistillation columns: optimization procedure. AICHE Journal, 32, 537.
Fonyó, Z. (1974). Thermodynamic Analysis of Rectification I. ReversibleModel of Rectification. International Chemical Engineering, 14(1),18.
Glinos, K., & Malone, F. (1988). Optimality regions for complex columnalternatives in distillation systems. Chemical Engineering Researchand Design, 66, 229.
Koehler, J., Aguirre, P. A., & Blass, E. (1992). Evolutionary thermody-namic synthesis of zeotropic distillation sequences. Gas SeperationPurification, 6(3), 153.
Kondili, E., Pantelides, C. C., & Sargent, R. W. H. (1993). A generalalgorihm for short-term scheduling of batch operations. Part I. MILPformulation. Computers and Chemical Engineering, 17, 211.
Petlyuk, F. B., Platonov, V. M., & Slavinskii, D. M. (1965). Thermody-namically optimal method for separating multicomponent mixtures.International Chemical Engineering, 5(3), 555.
Reid, R.C., Prausnitz, M.P., & Poling, B.E. (1987). The properties ofgases and liquids. McGraw-Hill: New York.
Sargent, R. W. H. A. (1998). Functional approach to process synthesis andits application to distillation systems. Comput. Chem. Eng., 22, 31.
Sargent, R. W. H., & Gaminibandara, K. (1976). Optimal design of platedistillation columns. In: L. C. W. Dixon (Ed.), Optimization in action.New York: Academic Press.
Stichlmair, J. G., & Fair, J. R. (1998). Distillation. Principles and practice.New York: Wiley.
Triantafyllou, C., & Smith, R. (1992). The design and optimization offully thermally coupled distillation columns. Translational Institute ofChemical Engineers, 70, 118.
Turkay, M., & Grossmann, I. E. (1996). Logic-based MINLP algorithm forthe optimal synthesis of process networks. Computers and ChemicalEngineering, 20, 959.
Yeomans, H., & Grossmann, I. E. (2000a). Disjunctive programmingmodels for the optimal design of distillation columns and separationsequences. Industrial and Engineering Chemistry Research, 39, 1637.
Yeomans, H., & Grossmann, I. E. (2000b). Optimal design of complex dis-tillation columns using rigorous tray-by-tray disjunctive programmingmodels. Industrial and Engineering Chemistry Research, 39, 4326.