a decrease in serine levels during growth transition
TRANSCRIPT

A Decrease in Serine Levels during Growth Transition TriggersBiofilm Formation in Bacillus subtilis
Jennifer Greenwich,a* Alicyn Reverdy,a Kevin Gozzi,a* Grace Di Cecco,a Tommy Tashjian,a* Veronica Godoy-Carter,a
Yunrong Chaia
aDepartment of Biology, Northeastern University, Boston, Massachusetts, USA
ABSTRACT Biofilm development in Bacillus subtilis is regulated at multiple levels.While a number of known signals that trigger biofilm formation do so through theactivation of one or more sensory histidine kinases, it was discovered that biofilmactivation is also coordinated by sensing intracellular metabolic signals, includingserine starvation. Serine starvation causes ribosomes to pause on specific serinecodons, leading to a decrease in the translation rate of sinR, which encodes a masterrepressor for biofilm matrix genes and ultimately triggers biofilm induction. How ser-ine levels change in different growth stages, how B. subtilis regulates intracellularserine levels, and how serine starvation triggers ribosomes to pause on selective ser-ine codons remain unknown. Here, we show that serine levels decrease as cells en-ter stationary phase and that unlike most other amino acid biosynthesis genes, ex-pression of serine biosynthesis genes decreases upon the transition into stationaryphase. The deletion of the gene for a serine deaminase responsible for convertingserine to pyruvate led to a delay in biofilm formation, further supporting the ideathat serine levels are a critical intracellular signal for biofilm activation. Finally, weshow that levels of all five serine tRNA isoacceptors are decreased in stationaryphase compared with exponential phase. However, the three isoacceptors recogniz-ing UCN serine codons are reduced to a much greater extent than the two that rec-ognize AGC and AGU serine codons. Our findings provide evidence for a link be-tween serine homeostasis and biofilm development in B. subtilis.
IMPORTANCE In Bacillus subtilis, biofilm formation is triggered in response to envi-ronmental and cellular signals. It was proposed that serine limitation acts as a proxyfor nutrient status and triggers biofilm formation at the onset of biofilm entrythrough a novel signaling mechanism caused by global ribosome pausing on selec-tive serine codons. In this study, we reveal that serine levels decrease at the biofilmentry due to catabolite control and a serine shunt mechanism. We also show thatlevels of five serine tRNA isoacceptors are differentially decreased in stationary phasecompared with exponential phase; three isoacceptors recognizing UCN serinecodons are reduced much more than the two recognizing AGC and AGU codons.This finding indicates a possible mechanism for selective ribosome pausing.
KEYWORDS Bacillus subtilis, biofilms, catabolite control, serine, tRNA
Bacteria in the natural environment are often found in surface-attached multicellularcommunities known as biofilms (1–3). Biofilms are a leading cause of hospital-
acquired infections (4). Biofilms also pose problems in the environment and industrialsettings. Bacillus subtilis is a Gram-positive, rod-shaped bacterium commonly used as amodel system for studies of biofilm formation (5, 6). Under laboratory settings, B. subtilisis capable of forming two different types of biofilms, namely, pellicles, which form atthe air-liquid interface, and colony biofilms, which form on solid surfaces (2, 5). B. subtilisis also able to form plant root-associated biofilms when living in the rhizosphere (7–9).
Citation Greenwich J, Reverdy A, Gozzi K, DiCecco G, Tashjian T, Godoy-Carter V, Chai Y.2019. A decrease in serine levels during growthtransition triggers biofilm formation in Bacillussubtilis. J Bacteriol 201:e00155-19. https://doi.org/10.1128/JB.00155-19.
Editor Tina M. Henkin, Ohio State University
Copyright © 2019 American Society forMicrobiology. All Rights Reserved.
Address correspondence to Yunrong Chai,[email protected].
* Present address: Jennifer Greenwich,Department of Biology, Indiana UniversityBloomington, Bloomington, Indiana, USA;Kevin Gozzi, Department of Biology,Massachusetts Institute of Technology,Cambridge, Massachusetts, USA; TommyTashjian, Department of Biochemistry andMolecular Biology, University of MassachusettsAmherst, Amherst, Massachusetts, USA.
J.G. and A.R. contributed equally to this work.
Received 26 February 2019Accepted 17 May 2019
Accepted manuscript posted online 28 May2019Published
RESEARCH ARTICLE
crossm
August 2019 Volume 201 Issue 15 e00155-19 jb.asm.org 1Journal of Bacteriology
10 July 2019
on July 10, 2019 by guesthttp://jb.asm
.org/D
ownloaded from

The genetic circuitry governing biofilm formation in B. subtilis has been well studied(reviewed in reference 6), but less is known about the signals and signal transductionmechanisms that trigger biofilm formation.
Canonically, extracellular signals activate one or more sensory histidine kinases,which then trigger a phosphorelay, leading to the phosphorylation of Spo0A, a masterregulator for cell development in B. subtilis (10–12). Upon phosphorylation, Spo0A�Pactivates transcription of the sinI gene (13). sinI encodes an antagonist for the masterbiofilm repressor SinR (14, 15). SinI binds to SinR and sequesters it off its DNA targets,leading to expression of SinR-repressed genes responsible for production of the biofilmmatrix, which include a 15-gene epsA-to-epsO operon and a three-gene tapA-sipW-tasAoperon (6). Furthermore, small changes in SinR protein levels are shown to havedramatic effects on the expression of matrix genes (13, 16), primarily due to theultrasensitivity of the SinI-SinR regulatory module, indicating that its levels need to betightly regulated within the cell. Metabolic stimuli of biofilm formation have also beenidentified (16–18). In a previous study, we showed that serine starvation acts as a proxyfor nutrient limitation at the onset of stationary phase and triggers biofilm formation inB. subtilis (16). Serine starvation results in decreased translation of sinR due to ribo-somes preferentially pausing on the four UCN (N stands for A, G, U, and C) serinecodons. These four UCN codons are overly abundant in the sinR gene (16). It remainsto be confirmed if serine levels decrease during the transition from exponential- tostationary-phase growth. This also leads to other interesting questions, such as how B.subtilis cells regulate serine levels and how decreased serine levels cause ribosomes topause on selective serine codons.
The amino acid serine is a centrally important biomolecule, not only as a buildingblock for protein synthesis but also as a precursor of nucleotides, other amino acids(such as cysteine, tryptophan, and glycine), and phospholipids (19). While the biochem-ical reactions involved in serine metabolism are well known, how bacterial cellsregulate serine homeostasis and maintain intracellular serine concentrations remainspoorly understood. Serine biosynthesis is intimately linked to central metabolism (Fig.1A). Glycerate-3-phosphate serves as both a glycolytic intermediate and a precursor toserine. The first, rate-limiting step in serine biosynthesis is the conversion of glycerate-3-phosphate to 3-phosphohydroxypyruvate, catalyzed by SerA (Fig. 1A) (20). Theregulation of serA transcription has been elucidated in Escherichia coli. serA is positivelyregulated by two global metabolic regulators, cAMP receptor protein (CRP) and leucinerich repeat protein (Lrp) (21). CRP, also known as catabolite activator protein (CAP),activates genes responsible for secondary carbon source utilization in E. coli in acAMP-dependent fashion (22, 23). Lrp responds to the amino acid leucine and isactivated under leucine starvation (24). This indicates that under nutrient starvation,transcription of serA is activated in E. coli. In B. subtilis, regulation of serA on a geneticlevel remains unclear. Different from E. coli, in B. subtilis, carbon metabolism is chieflyregulated in a cAMP-independent manner by catabolite control protein A (CcpA) (25,26). A link between carbon metabolism and biofilm formation has been investigated inseveral previous studies (27, 28). Biofilm formation is triggered when cells are starvedfor glucose and dependent on catabolite control. Deletion of the ccpA gene increasesbiofilm formation (27). This indicates that CcpA negatively regulates biofilm formationin B. subtilis (27). Another global metabolic regulator CodY is also shown to be involvedin biofilm formation in B. subtilis (29). In both cases, the underlying mechanisms remainunknown.
In bacteria, serine levels are also affected by a single enzymatic reaction, whichconverts serine to pyruvate and ammonia (Fig. 1A) (30). This reaction is carried out bya serine deaminase (also known as serine dehydratase) (30, 31). Serine deamination isclearly important because in E. coli there are three serine deaminases and at least oneof the three serine deaminases is active under any given growth condition (32). In B.subtilis, only one serine deaminase has been identified (33). This two-subunit proteincomplex is encoded by the sdaAA and sdaAB genes (33). The metabolic benefits(s) ofserine deamination has not been fully investigated and remains largely unclear. Previ-
Greenwich et al. Journal of Bacteriology
August 2019 Volume 201 Issue 15 e00155-19 jb.asm.org 2
on July 10, 2019 by guesthttp://jb.asm
.org/D
ownloaded from

ous studies have shown that serine is depleted far faster than other amino acids in E.coli upon nutrient limitation or when cells enter stationary phase (34–36). Presumably,serine is converted to pyruvate and used for central metabolism, energy generation,and even gluconeogenesis. This can be considered a shunt pathway for serine frombeing used as a building block for protein synthesis. It is unclear how B. subtilis cellswould regulate serine homeostasis to ensure an adequate balance between carbonflow into amino acid biosynthesis and central metabolism.
In this study, we set out to elucidate the mechanism by which serine depletiontriggers biofilm formation and how cells regulate intracellular serine levels in B. subtilis.We found that serine levels decreased in stationary phase relative to exponential phaseand that expression of serine biosynthesis genes declined as cells enter stationaryphase. The key serine biosynthetic gene serA was regulated in an indirect manner bycatabolite control in B. subtilis. But unlike in E. coli, serA in B. subtilis appeared to beexpressed when nutrients are plentiful. In addition to a decrease in serine levels, theabundance of serine tRNAs (a total of 5 isoacceptors) that recognize six synonymousserine codons (UCA, UCC, UCG, UCU, AGC, and AGU) also decreased in stationary phasecompared with exponential phase, but the decrease differed significantly for differentisoacceptors.
RESULTSSerine levels decrease upon entry into stationary phase. We previously showed
that early-stationary-phase conditions (biofilm entry) or induced serine starvation in the
FIG 1 Supernatants of B. subtilis cells support growth of a serine auxotroph. (A) Serine metabolism is linked to central metabolismthrough glycerate-3-phosphate (G-3-P). G-3-P is a precursor for serine biosynthesis through the activities of SerA, SerC, and SerB. SerAcarries the rate-limiting step in serine biosynthesis. The SdaA deaminase complex is involved in converting serine back to G-3-P. (B)Microbiological assays were used to assess serine levels in the supernatant. Supernatants from three different strains (WT, JG08 [serAoverexpression], and JG59 [ΔsdaAA]) grown in MSgg medium were prepared during exponential phase (OD600, �0.6) and earlystationary phase (OD600, �1.4) to mimic biofilm entry. Auxotroph cultures, ΔserA (YC913), were washed and subcultured for growthinto the supernatants and then plated for CFU counts. Adjusted fold CFU was defined as fold changes of CFU and calculated bycomparing the CFU of the serine auxotroph strain after growth in the supplemented supernatant to the CFU of the initial inoculum.As shown, exponential-phase supernatant from cells with serA overexpression (serA��, JG08) was able to support growth about 10times better than stationary-phase supernatant (****, P � 0.0001). Also, adding supernatant from significantly increased populationgrowth during exponential phase compared with stationary phase from cells with a deleted sdaAA gene (JG59) (*, P � 0.05).Supernatant did not show a significant decrease in cell growth from wild-type supernatant in stationary compared with exponentialstage (ns, P � 0.05). Exponential-phase supernatants of both JG08 and JG59 supported much higher growth of the auxotroph thanthe exponential-phase supernatant of the wild type (****, P � 0.0001), indicating the effectiveness of genetic manipulation inincreasing cellular serine accumulation. Dots represent individual data points. Error bars represent standard deviations. (C) Standardcurve of ΔserA strain (YC913) in MSgg growth medium supplemented with different concentrations of serine. After 24 h of incubation,YC913 cells were plated, and CFU were counted the next day. CFU count was adjusted to the CFU of initial inoculum to get theadjusted fold CFU per milliliter. The best-fit curve has equation y � 397.40x � 40.72 (R � 0.9626) and can be used to better estimatethe concentration of serine in the harvested supernatant. Error bars represent standard deviations.
Serine Levels Act as a Biofilm Signal Journal of Bacteriology
August 2019 Volume 201 Issue 15 e00155-19 jb.asm.org 3
on July 10, 2019 by guesthttp://jb.asm
.org/D
ownloaded from

exponential phase led to ribosome pausing on selective serine codons and reducedtranslation of sinR (16). Thus, we proposed that serine starvation occurred in earlystationary phase and acted as a trigger for biofilm induction. It remained to beconfirmed if serine levels were decreasing upon cells entering stationary phase undernormal conditions. We initially applied biochemical approaches (primarily high-pressure liquid chromatography [HPLC] and mass spectrometry [MS]/spectrometry) tomeasure concentrations of free intracellular amino acids, but experienced an inconsis-tency of the results in both experimental and control samples. We then decided todevelop a novel microbiological assay for the measurement (see Materials and Meth-ods). Briefly, wild-type B. subtilis cells capable of synthesizing serine were grown in aminimal medium (MSgg) without exogenous serine. Supernatant from either theexponential- (optical density at 600 nm [OD600], 0.6) or early stationary-phase (OD600,1.4) culture was prepared as described in the Materials and Methods and then addedto the fresh minimal medium inoculated with a B. subtilis serine auxotroph strain (ΔserA)(16). ΔserA cells were cultured for 24 h and then plated. The relative growth of theauxotroph was calculated by comparing the final CFU to the initial inoculum. We alsoengineered two B. subtilis strains predicted to accumulate higher levels of serine (JG08for serA overexpression or serA�� and JG59 for ΔsdaAA). We collected supernatantsfrom those cultures accordingly and tested growth support of the serine auxotroph bythose supernatants. As shown in Fig. 1B, supernatant from exponentially growingwild-type cells was able to support more than four times higher growth of theauxotroph strain than the stationary-phase supernatant (as calculated by CFU) (Fig. 1B).The exponential-phase supernatant of JG08 (serA��) was able to support even highergrowth of the auxotroph (about 10 times) than the supernatant from the stationary-phase culture (P � 0.0001) (Fig. 1B). The exponential-phase supernatant from theΔsdaAA strain (JG59) also demonstrated a significant increase in supporting auxotrophgrowth compared with supernatant from the stationary phase (P � 0.05) (Fig. 1B).
Compared to auxotroph growth in the media with known concentrations of serine(Fig. 1C), we estimated about 0.82 �g/ml and 0.08 �g/ml serine in the exponential andearly stationary phase of the wild-type supernatants, 38.0 �g/ml and 3.65 �g/ml serinein the exponential and early stationary phase of JG08 (serA��) supernatants, and 80.99�g/ml and 27.85 �g/ml serine in the exponential and early stationary phase of JG59(ΔsdaAA) supernatants, respectively. Our results supported the note of significantlyhigher levels of free serine in the supernatant of the exponential-phase culture than thestationary-phase culture. Although we could not directly measure the intracellularserine levels, we infer that intracellular serine levels are likely proportionally higher inthe exponential-phase cells than in the stationary culture.
Manipulation of intracellular serine levels alters biofilm formation. We previ-ously showed that adding exogenous serine to the media delayed biofilm formation byB. subtilis (16). This suggested that manipulation of serine levels might affect the timingof biofilm induction. To understand the physiological implications of changes inintracellular serine levels during growth transition, we decided to investigate if manip-ulation of the serine biosynthesis or shunt pathway would affect biofilm formation. Asdescribed above (Fig. 1A), two enzymatic pathways play key roles in serine homeostasisin B. subtilis, namely, de novo serine biosynthesis primarily from pyruvate mediated bySerA/SerB/SerC and deamination of serine back to pyruvate, mediated by the serinedeaminase complex SdaAA/SdaAB. Based on the results of microbiological assays (Fig.1B), we already observed that supernatants from the two engineered strains (JG08 andJG59) supported substantially higher serine auxotroph cell growth than that of the wildtype (P � 0.0001 for both JG08 and JG59), indicating that both genetic manipulationssuccessfully allowed increased serine accumulation.
Next, we investigated how the genetic manipulations could affect biofilm for-mation by performing biofilm assays for the two engineered strains. We observedthat deletion of the sdaAA gene severely delayed biofilm formation. The ΔsdaAAmutant formed a very weak pellicle biofilm at 24 and 48 h, and only at 72 h, the
Greenwich et al. Journal of Bacteriology
August 2019 Volume 201 Issue 15 e00155-19 jb.asm.org 4
on July 10, 2019 by guesthttp://jb.asm
.org/D
ownloaded from

pellicle biofilm of the mutant showed up to a level comparable to the wild type (Fig.2A). By using a �-galactosidase reporter assay, we further determined that at both24 and 48 h, there was a significant decrease in the expression of the biofilm matrixgene tapA in the ΔsdaAA mutant relative to the wild type (Fig. 2B). On the otherhand, overexpression of serA only mildly impacted biofilm formation with a modestdelay at 48 h (Fig. 2A), and changes in tapA expression were also insignificantcompared with the wild type (Fig. 2B). It is possible that the increase in serine levelsby serA overexpression is still below a threshold to significantly alter the timing ofbiofilm induction. Consistent with that idea, in the previous assay (Fig. 1B) weshowed that the stationary-phase supernatant from a serA overexpression strainsupported much more serine autotroph growth than the wild type (WT), but to alesser degree than the ΔsdaAA strain (Fig. 2B). We did not test how ΔserA couldimpact biofilm formation simply because the growth of the auxotroph strain inMSgg required supplementation of large amounts of exogenous serine. Overall, ourresults supported the idea that alteration of serine levels by genetic manipulationimpacted biofilm formation. However, we would not rule out other possibilities. Inthe case of ΔsdaAA, it is also possible that increased levels of pyruvate instead ofdecreasing serine levels contribute to the biofilm phenotype.
serA expression decreases upon entry into stationary phase. Decreasing serinelevels upon cells entering stationary phase could be due to the regulation of serinehomeostasis. Amino acid biosynthesis genes are normally upregulated upon entryinto stationary phase, as that is when cells resume de novo amino acid biosynthesis(37). This is the case for serA in E. coli, which is under catabolite control (21). Toinvestigate if the regulation of serA is the same in B. subtilis as in E. coli, weconstructed a PserA-lacZ reporter fusion and tested PserA expression over time. Asshown in Fig. 3A and 4A, in wild-type cells, serA transcription initially increased untilpeaking at around 3 to 4 hours after inoculation, depending on the initial inoculum.Following this increase, serA transcription began to decrease. The peak of serAexpression corresponded with the timing when cells began to transition fromexponential phase to early stationary phase (OD600, �1.0) (Fig. 4A). The timing alsocorresponded to when the induction of biofilm genes occurred, based on previousstudies (38, 39). A decrease in serA expression could contribute to the decrease inserine levels. More importantly, it indicates that in B. subtilis, serine biosynthesis isregulated in an unusual manner relative to biosynthesis of other amino acids. Adecrease in serA expression upon entry into stationary phase in B. subtilis was alsoshown by transcription profiling in a published study (40).
FIG 2 Inability to convert serine into pyruvate delays biofilm formation. (A) The ΔsdaAA strain (JG08) shows aweaker biofilm robustness compared to wild type (3610) at 48 hours but not at 72 hours in MSgg, indicating a delayin biofilm formation. Scale bar, 5 mm. (B) PtapA-lacZ expression from pellicles grown in MSgg is significantly lowerin the ΔsdaAA strain (JG101) at 24 and 48 hours than that in the wild type (YC755) (***, P � 0.001). Dots representindividual data points. Error bars represent standard deviations.
Serine Levels Act as a Biofilm Signal Journal of Bacteriology
August 2019 Volume 201 Issue 15 e00155-19 jb.asm.org 5
on July 10, 2019 by guesthttp://jb.asm
.org/D
ownloaded from

Because the timing of decrease in serA expression also coincided with the timingwhen induction of biofilm genes occurred, based on previous studies (38, 39), wewanted to further investigate a possible correlation between decreasing serA expres-sion and biofilm gene induction. To do this, we constructed a dual fluorescent reporterstrain. We fused the regulatory region of serA to the gfp gene and the regulatory regionof the biofilm gene tapA to mKate2, which encodes a red fluorescent protein. We thentracked the expression of the two reporters in the engineered cell population over timeduring biofilm development. As shown in Fig. 3B, most cells were expressing serA at 48hours (cells false-colored in purple), while only a small proportion of cells wereexpressing tapA (cells false-colored in cyan). The bimodal pattern of tapA expressionwas reported previously by several published studies (38, 41, 42). After 96 hours, cells,many of which were in the form of bundles and clumps due to matrix production, werestill strongly expressing tapA, while serA expression was largely diminishing (Fig. 3B).Our results seemed to support the correlation between a decrease in serA expressionand induction of biofilm genes, although it was not yet clear if decreasing serAexpression proceeded the biofilm gene induction.
On the other hand, it was also possible that the biofilm pathway impacting serinehomeostasis and decreasing serA expression were a result of biofilm activation. To testthis possibility, we “locked” the cells into the “biofilm on” state by deleting the sinR
FIG 3 Expression of serine pathway in relation to biofilm gene expression. (A) The deletion of sinR allows cells to constitutively turn on biofilm genes (43), andto prevent clumping, epsH, a transferase gene involved in building the biofilm matrix, was also deleted (44). Beta-galactosidase assay quantification of PserAexpression in wild-type cells (JG106) compared with the ΔsinR ΔepsH double mutant (ABR167) under shaking conditions in MSgg. The wild type had peakexpression at 4 h, while the mutant peaked at 5 h, indicating a slight delay in expression decline. Error bars represent standard deviations. There is no significantdifference in expression except at 5 and 7 h after inoculation (**, P � 0.01; ***, P � 0.001). The lack of significant difference (P � 0.05) in other time points furthersuggests that expression of serA is regulated independent of biofilm formation. (B) Dual reporter assay of PserA-GFP (green) and PtapA-mkate2 (76) in wild-typecells (JG157) during growth in MSgg. PserA expression was constitutively on at 48 hours but decreased significantly when cells entered mature biofilm stage (96hours). The decrease was accompanied by the continued turn on of matrix gene expression (PtapA-mkate2). Scale bar, 10 �m. (C) Beta-galactosidase assayquantification of PsdaA expression in wild-type cells (ABR176) under shaking conditions in MSgg. Low overall expression and decreasing expression as enteringbiofilm stage. Error bars represent standard deviations.
Greenwich et al. Journal of Bacteriology
August 2019 Volume 201 Issue 15 e00155-19 jb.asm.org 6
on July 10, 2019 by guesthttp://jb.asm
.org/D
ownloaded from

gene for the biofilm master repressor (43). This allowed matrix genes to be constitu-tively expressed for biofilm formation and resulted in hyperrobust biofilms (43). TheepsH gene, which encodes a sugar transferase for exopolysaccharide (EPS) biosynthesis,was also deleted to prevent cell clumping due to excess matrix production andfacilitate sample collection during bioassays (44). As shown in Fig. 3A, there was nodifference in serA expression up until the transition point (hour 4). serA expression wasthen decreased in the wild-type cells while the “biofilm on” cells (ΔepsH ΔsinR) did notshow decrease in serA expression until an hour later (Fig. 3A). This result suggests thatthe biofilm pathway does not impact the expression of the serine biosynthetic geneserA, and it is less likely that decreasing serine levels is due to activation of the biofilmpathway. Lastly, we wanted to examine the expression of the serine deaminase genes(sdaAB-sdaAA). If serine levels are being depleted, it may be as well because the serinedeaminase is activated to convert existing serine back to pyruvate for metabolism. Wetested this by constructing a lacZ fusion to the promoter of the sdaA operon (sdaAB-sdaAA) PsdaAB-lacZ. Cells were grown in MSgg, and expression of the reporter wasmeasured over time. We found that overall sdaA expression was very low and decliningover time (Fig. 3C). This result does not seem to support the note of elevated serinedeaminase activity through increased gene expression.
CcpA activates serA expression. Following the observation of decreased serAexpression upon entry into stationary phase, we decided to characterize potentialregulators of serA. The regulation of serA is well-studied in E. coli, where serinebiosynthesis is under the regulation of catabolite control. serA is activated by both CRPand Lrp (45), indicating that its production increases when cells run out of preferredcarbon sources and begin to rely on secondary carbon sources. In B. subtilis, CcpA, themaster regulator of catabolite control, is a functional counterpart of CRP in E. coli. WhileCcpA is commonly thought of as a transcriptional repressor (46), there is evidence ofCcpA also serving as an activator of genes in the pathways involved in carbonutilization, such as the acetate metabolism (47) or branched-chain amino acid biosyn-thesis (leucine, isoleucine, and valine) (37, 48). We examined serA expression in a B.subtilis strain deleted for ccpA and found that deletion of ccpA led to lowered levels ofserA expression compared with the wild-type strain (Fig. 4A). Lowered expression ofserA in the ccpA mutant was also confirmed using reverse transcription-quantitativePCR (qRT-PCR) (Fig. 4B). These results suggest that CcpA positively regulates serAexpression.
FIG 4 PserA transcription is regulated by CcpA but not intracellular serine levels. (A) Expression of serA in wild-typecells initially increased during exponential phase and then began to decrease at approximately OD600 of 1.0; thearrow indicates the time point of OD600 around 1.0. Deletion of ccpA led to constitutively low expression of serA.Error bars represent standard deviations. (B) Confirmation of the �-galactosidase assay with qRT-PCR. At all timepoints tested, serAmRNA levels were significantly lower than in the ΔccpAmutant (**, P � 0.01; ***, P � 0.001). Dotsrepresent individual data points. Error bars represent standard deviations.
Serine Levels Act as a Biofilm Signal Journal of Bacteriology
August 2019 Volume 201 Issue 15 e00155-19 jb.asm.org 7
on July 10, 2019 by guesthttp://jb.asm
.org/D
ownloaded from
We could not identify a direct binding site of CcpA in the serA promoter. This, wespeculated that CcpA regulates serA likely through repression of a repressor. In an effortto further elucidate the mechanism of serA regulation by CcpA, we examined two genesin the characterized CcpA regulon both encoding regulatory proteins of unknownfunction (49). Importantly, these two genes were shown to be upregulated underbiofilm conditions (49–51). The first candidate gene ykuL encodes a putative CBS-domain containing protein. ykuL is both repressed by CcpA and activated by Spo0A (51,52). The second candidate yvnA encodes a transcriptional repressor. yvnA is repressedby both CcpA and AbrB (49, 50). However, as shown in Fig. S1A in the supplementalmaterial, deletion of either gene had no impact on serA expression. Thus, how CcpAactivates serA is still unclear. Lastly, deletion of sdaAA also did not significantly affectexpression of serA (Fig. S1B), indicating that serine levels did not affect serA transcrip-tion via any putative feedback mechanism.
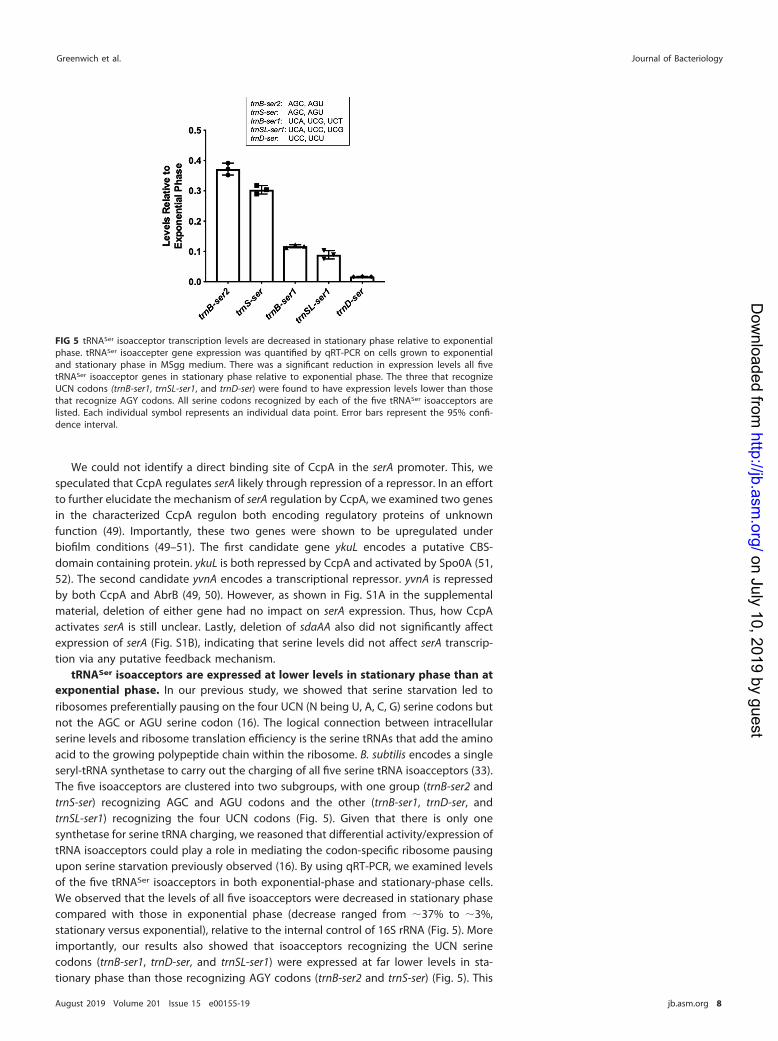
tRNASer isoacceptors are expressed at lower levels in stationary phase than atexponential phase. In our previous study, we showed that serine starvation led toribosomes preferentially pausing on the four UCN (N being U, A, C, G) serine codons butnot the AGC or AGU serine codon (16). The logical connection between intracellularserine levels and ribosome translation efficiency is the serine tRNAs that add the aminoacid to the growing polypeptide chain within the ribosome. B. subtilis encodes a singleseryl-tRNA synthetase to carry out the charging of all five serine tRNA isoacceptors (33).The five isoacceptors are clustered into two subgroups, with one group (trnB-ser2 andtrnS-ser) recognizing AGC and AGU codons and the other (trnB-ser1, trnD-ser, andtrnSL-ser1) recognizing the four UCN codons (Fig. 5). Given that there is only onesynthetase for serine tRNA charging, we reasoned that differential activity/expression oftRNA isoacceptors could play a role in mediating the codon-specific ribosome pausingupon serine starvation previously observed (16). By using qRT-PCR, we examined levelsof the five tRNASer isoacceptors in both exponential-phase and stationary-phase cells.We observed that the levels of all five isoacceptors were decreased in stationary phasecompared with those in exponential phase (decrease ranged from �37% to �3%,stationary versus exponential), relative to the internal control of 16S rRNA (Fig. 5). Moreimportantly, our results also showed that isoacceptors recognizing the UCN serinecodons (trnB-ser1, trnD-ser, and trnSL-ser1) were expressed at far lower levels in sta-tionary phase than those recognizing AGY codons (trnB-ser2 and trnS-ser) (Fig. 5). This
FIG 5 tRNASer isoacceptor transcription levels are decreased in stationary phase relative to exponentialphase. tRNASer isoaccepter gene expression was quantified by qRT-PCR on cells grown to exponentialand stationary phase in MSgg medium. There was a significant reduction in expression levels all fivetRNASer isoacceptor genes in stationary phase relative to exponential phase. The three that recognizeUCN codons (trnB-ser1, trnSL-ser1, and trnD-ser) were found to have expression levels lower than thosethat recognize AGY codons. All serine codons recognized by each of the five tRNASer isoacceptors arelisted. Each individual symbol represents an individual data point. Error bars represent the 95% confi-dence interval.
Greenwich et al. Journal of Bacteriology
August 2019 Volume 201 Issue 15 e00155-19 jb.asm.org 8
on July 10, 2019 by guesthttp://jb.asm
.org/D
ownloaded from
significantly differentiated decrease in the levels of the tRNASer isoacceptors recogniz-ing the four UCU serine codons and of those recognizing the AGC and AGU serinecodons could contribute to the preferential pausing of ribosomes on the UCN serinecodons under serine starvation that we observed previously (16).
Overexpression of individual tRNASer genes does not impact biofilm formation.Following the above reasoning, we further argued that if ribosome pausing on selectiveserine codons was due to differentially lower production of individual tRNASer isoac-ceptors upon serine starvation, it was then possible to be overcome by overexpressingcorresponding tRNASer isoacceptors. As a prior example, it was shown that in E. coli,amino acid starvation led to differential charging of leucine tRNA isoacceptors, whichwas overcome by overexpressing the leucine tRNAs that were charged at lower levelsduring starvation (53). To test if our argument was valid, we used a genetic approachand overexpressed each of the five serine tRNA genes from an alternative chromosomallocus in the wild-type strain. We then tested its effect on biofilm matrix gene expres-sion. However, our results showed that overexpression of the individual serine tRNAsdid not impact matrix gene expression (see Fig. S2A in the supplemental material).However, it is possible that the induction is not strong enough to be physiologicallyrelevant, as tRNAs in general are expressed at high levels and quite stable in the cells(54, 55). Note that in the E. coli study, leucine tRNA genes were overexpressed using ahigh copy number plasmid system (56).
We previously showed that synonymously mutating the AGC and AGT serine codonsin the sinR gene to any of the four TCN codons dramatically increased the impact ofserine starvation on sinR translation and increased expression of the matrix operon (16).We speculated that strains with those synonymous substitutions in the sinR gene mightbecome more sensitive than the wild-type strain to the alteration of specific serinetRNA levels. We repeated serine tRNA gene overexpression in selected synonymousmutants. However, overexpression of individual tRNASer genes in the two engineeredstrains each carrying a different type of synonymous mutations in sinR (AGY to TCC inFig. S2B and AGY to TCT in Fig. S2C) did not significantly affect matrix gene expression.
DISCUSSION
We previously showed that serine depletion triggered biofilm induction in B. subtilisdue to global ribosome pausing on selective serine codons during translation andspecifically a decrease in translation of the master biofilm repressor gene sinR (16).What remained unaddressed was the regulation driving the decrease in intracellularserine levels at the entry of stationary phase and the mechanism of serine starvation-triggered preferential ribosome pausing on the UCN serine codons. In this study, weinvestigated both how serine depletion occurs in early stationary phase (biofilm entry)and how changes in serine tRNA levels may be playing a role in causing ribosomes tostall selectively on UCN serine codons. By using a novel microbiological assay, weshowed that levels of serine decreased when cells enter stationary phase. Our resultssuggest that serine levels in the cell act as a signal for biofilm formation. Our result alsoaligns with previous evidence that serine is one of the first amino acids to be exhaustedin E. coli (34–36). While using supernatant is an indirect measurement of intracellularlevels, the finding that higher levels of auxotroph growth were observed when grownin the supernatant from cells overexpressing serA or lacking sdaAA supports such apositive correlation between intracellular and extracellular serine levels (Fig. 1B).
Serine depletion upon entry into stationary phase is likely due to a decrease inserine biosynthesis and the shunt pathway that converts serine to pyruvate. Weshowed that the key serine biosynthesis gene serA was regulated by the cataboliterepressor CcpA, linking the regulation of serine homeostasis to cell global metabolicstatus. A previous study presented evidence suggesting that carbon metabolism andserA expression were linked, as levels of serA transcription decreased 22-fold followinga minute of glucose starvation in M9 medium (57), but the mechanism was unclear.Here, we also showed that serA was subject to catabolite regulation, being activated byCcpA. This regulation is most likely indirect, due to the lack of a direct binding site of
Serine Levels Act as a Biofilm Signal Journal of Bacteriology
August 2019 Volume 201 Issue 15 e00155-19 jb.asm.org 9
on July 10, 2019 by guesthttp://jb.asm
.org/D
ownloaded from
CcpA in the promoter region of serA. While most amino acid biosynthesis genes areupregulated under nutrient starvation, our data indicate that serA actually begins todecrease in expression upon entry into stationary phase. The peak expression ofserA happens at approximately the same time as B. subtilis is beginning to run outof its preferred carbon sources and it switches to secondary carbon sources, knownas the diauxic shift (58).
A link between glucose metabolism and biofilm formation has been previouslyidentified in B. subtilis (27). Glucose represses biofilm formation in a CcpA-dependentmanner (27). Our work fits into this model, adding a connection between a decrease inCcpA activity and an increase in biofilm formation. A lack of glucose would decreaseCcpA activity, leading to a decrease in serA expression, which, in turn, decreases serinelevels. This drop in serine causes a decrease in SinR protein levels due to ribosomespausing on the enriched TCN codons in sinR (16). Decreases in free SinR derepressesmatrix gene expression, leading to biofilm formation. Regulating biofilm formation inthis manner allows B. subtilis to monitor its environment as well as its intracellularmetabolic state.
Finally, we showed that all five tRNASer isoacceptors were accumulated at lowerlevels in stationary phase than in exponential phase. More interestingly, the decreasediffered significantly for different isoacceptors in that the three isoacceptors recogniz-ing the UCN serine codons decreased more substantially than the two isoacceptorsrecognizing the AGC and AGU serine codons. In this study, we primarily focused on thedifferential expression by using qRT-PCR. One can argue that shutting off transcriptionof tRNA genes would not be fast enough to reduce tRNA levels due to the stability ofthe tRNA molecules in the cells (55). One mechanism that may regulate this stability isthe various modifications of tRNAs (reviewed in reference 59). Modifications of tRNAshave been well studied in both eukaryotic cells and model bacteria, such as E. coli, butless is known in B. subtilis (reviewed in references 59–61). Only three tRNA modificationenzymes have been studied, namely, MiaB, YmcB, and YqeV, which includes twohomologs of E. coli (62). In E. coli, MiaB is involved in methylthiolation of selected tRNAs(63). In B. subtilis, the gene that encodes YmcB is in an operon with ymcA, a regulatorygene known to be essential for biofilm formation (43, 64, 65). In contrast to ymcA, theymcB gene is not important for biofilm formation (Y. Chai, unpublished data). YmcB isa methylthiotransferase (MTT), which modifies an already present tRNA modification(62). It is possible that the primary modification is critical for regulating the degradationof tRNAs upon nutrient starvation.
In addition to gene expression, the decrease in serine tRNA levels may also be dueto a lack of charging. Recent work in E. coli suggests that tRNAs become unstableduring amino acid starvation (66). Using strains auxotrophic for specific amino acids, itwas shown that upon induction of starvation, levels of tRNAs decreased. This was notedfor the specific amino acid cells that were starved for as well as other amino acids. It wasspeculated that a reduction in charging (due to amino acid starvation) leads todecreased translation, which, in turn, triggers a degradation of excess tRNA, regardlessof its acylation state (66). Our data fit into this hypothesis, as the decrease in serinetRNA expression levels coincides with a decrease in serine levels.
MATERIALS AND METHODSStrains, media, and growth conditions. For general purposes, Bacillus subtilis strains PY79 (67) and
NCBI3610 (hereafter 3610) (5) and their derivatives were grown at 37°C in lysogeny broth (LB) (10 gtryptone, 5 g yeast extract, and 10 g NaCl per liter broth) or on solid LB medium supplemented with 1.5%(wt/vol) agar. For assays of biofilm formation, LBGM and MSgg media were used. LBGM is composed ofLB with supplementation of 1% (vol/vol) glycerol and 100 �M MnSO4 (68). The MSgg medium is aspreviously described (5). Escherichia coli DH5� was used as a host for molecular cloning and grown at37°C in LB medium. When required, antibiotics were added at the following concentrations for growthof B. subtilis: 1 �g/ml of erythromycin, 5 �g/ml of tetracycline, 5 �g/ml of chloramphenicol, 100 �g/mlof spectinomycin, and 10 �g/ml of kanamycin. For growth of E. coli, 100 �g/ml of ampicillin was used.A list of strains used in this study is summarized in Table 1.
DNA manipulation. General methods for molecular cloning followed the published protocols (69).Restriction enzymes (New England BioLabs) were used according to the manufacturer’s instructions.Transformation of plasmid DNA into B. subtilis strains was performed as described previously (70). SPP1
Greenwich et al. Journal of Bacteriology
August 2019 Volume 201 Issue 15 e00155-19 jb.asm.org 10
on July 10, 2019 by guesthttp://jb.asm
.org/D
ownloaded from

phage-mediated general transduction was also used to transfer antibiotic-marked DNA fragmentsamong different strains (71). Plasmids used in this study are listed in Table 2 and oligonucleotides(purchased from Eurofins) are listed in Table S1 in the supplemental material.
Strain construction. For construction of the insertional deletion mutations of ccpA and sdaAA in3610, the corresponding mutants in the B. subtilis strain 168 were obtained from the Bacillus GeneticStock Center (BGSC) at Ohio State University. Antibiotic cassette-marked deletions were introduced into3610 using SPP1 phage-mediated transduction to generate strains JG138 and JG8 (71).
To overexpress serA in B. subtilis, the serA coding sequence was amplified by PCR using 3610 genomicDNA as the template and primers serA-F and serA-R. The PCR product was then cloned into the HindIIIand BamHI sites of pDR111, which contains an isopropyl-�-D-thiogalactopyranoside (IPTG)-induciblehyperspank promoter flanked by the amyE gene, generating the recombinant plasmid pJG01 (72). The
TABLE 1 Strains used in this study
Strain Detailsa Reference or source
DH5� E. coli strain for molecular cloning InvitrogenPY79 Laboratory strain of B. subtilis used for genetic manipulation 67168 Domesticated strain of B. subtilis 773610 Undomesticated strain B. subtilis capable of robust biofilm formation 5YC755 Tn917::140°(ylnF/yloA)�amyE::PtapA-lacZ Cmr in 3610 16YC913 ΔserA::Tetr in 3610 16YC1173 sinR�Kanr at native locus, Ser32 AGC�TCA, Ser76 AGT�TCA in sinR in 3610 16YC1174 sinR�Kanr at native locus, Ser32 AGC�TCC, Ser76 AGT�TCC in sinR in 3610 16YC1175 sinR�Kanr at native locus, Ser32 AGC�TCG, Ser76 AGT�TCG in sinR in 3610 16YC1176 sinR�Kanr at native locus, Ser32 AGC�TCT, Ser76 AGT�TCT in sinR in 3610 16YCN095 sacA::PtapA-mkate2 Kanr in 3610 74JG8 ΔsdaAA::Mlsr in 3610 This studyJG59 amyE::Physpank-serA Specr in 3610 This studyJG87 Tn917::140°(ylnF/yloA)�amyE::PtapA-lacZ Cmr in YC1173 This studyJG88 Tn917::140°(ylnF/yloA)�amyE::PtapA-lacZ Cmr in YC1173 This studyJG89 Tn917::140°(ylnF/yloA)�amyE::PtapA-lacZ Cmr in YC1173 This studyJG90 Tn917::140°(ylnF/yloA)�amyE::PtapA-lacZ Cmr in YC1173 This studyJG91 amyE::Physpank-trnD-ser Specr in 3610 This studyJG92 amyE::Physpank-trnS-ser Specr in 3610 This studyJG93 amyE::Physpank-B-ser2 Specr in 3610 This studyJG96 amyE::Physpank-SL-ser1 Specr in 3610 This studyJG97 amyE::Physpank-B-ser1 Specr in 3610 This studyJG100 Tn917::140°(ylnF/yloA)�amyE::PtapA-lacZ Cmr in JG59 This studyJG101 ΔsdaAA::Mlsr Tn917::140°(ylnF/yloA)�amyE::PtapA-lacZ Cmr in 3610 This studyJG105 amyE::PserA-lacZ Cmr in PY79 This studyJG106 amyE::PserA-lacZ Cmr in 3610 This studyJG111 amyE::Physpank-trnD-ser Specr Tn917::140°(ylnF/yloA)�amyE::PtapA-lacZ Cmr in YC1173 This studyJG112 amyE::Physpank-trnD-ser Specr Tn917::140°(ylnF/yloA)�amyE::PtapA-lacZ Cmr in YC1174 This studyJG113 amyE::Physpank-trnD-ser Specr Tn917::140°(ylnF/yloA)�amyE::PtapA-lacZ Cmr in YC1175 This studyJG114 amyE::Physpank-trnD-ser Specr Tn917::140°(ylnF/yloA)�amyE::PtapA-lacZ Cmr in YC1176 This studyJG115 amyE::Physpank-trnB-ser1 Specr Tn917::140°(ylnF/yloA)�amyE::PtapA-lacZ Cmr in YC1176 This studyJG116 amyE::Physpank-trnB-ser2 Specr Tn917::140°(ylnF/yloA)�amyE::PtapA-lacZ Cmr in YC1176 This studyJG117 amyE::Physpank-trnS-ser Specr Tn917::140°(ylnF/yloA)�amyE::PtapA-lacZ Cmr in YC1176 This studyJG118 amyE::Physpank-trnSL-ser1 Specr Tn917::140°(ylnF/yloA)::PtapA-lacZ Cmr in YC1176 This studyJG119 amyE::Physpank-trnB-ser1 Specr Tn917::140°(ylnF/yloA)�amyE::PtapA-lacZ Cmr in YC1173 This studyJG120 amyE::Physpank-trnB-ser2 Specr Tn917::140°(ylnF/yloA)�amyE::PtapA-lacZ Cmr in YC1173 This studyJG121 amyE::Physpank-trnS-ser Specr Tn917::140°(ylnF/yloA)�amyE::PtapA-lacZ Cmr in YC1173 This studyJG122 amyE::Physpank-trnSL-ser1 Specr Tn917::140°(ylnF/yloA)�amyE::PtapA-lacZ Cmr in YC1173 This studyJG123 amyE::Physpank-trnB-ser1 Specr Tn917::140°(ylnF/yloA)�amyE::PtapA-lacZ Cmr in YC1174 This studyJG125 amyE::Physpank-trnS-ser Specr Tn917::140°(ylnF/yloA)�amyE::PtapA-lacZ Cmr in YC1174 This studyJG126 amyE::Physpank-trnSL-ser1 Specr Tn917::140°(ylnF/yloA)�amyE::PtapA-lacZ Cmr in YC1174 This studyJG127 amyE::Physpank-trnB-ser2 Specr Tn917::140°(ylnF/yloA)�amyE::PtapA-lacZ Cmr in YC1175 This studyJG128 amyE::Physpank-trnS-ser Specr Tn917::140°(ylnF/yloA)�amyE::PtapA-lacZ Cmr in YC1175 This studyJG129 amyE::Physpank-trnSL-ser1 Specr Tn917::140°(ylnF/yloA)�amyE::PtapA-lacZ Cmr in YC1175 This studyJG130 amyE::Physpank-trnB-ser1 Specr Tn917::140°(ylnF/yloA)�amyE::PtapA-lacZ Cmr in YC1175 This studyJG138 ΔccpA::Mlsr in JG106 This studyJG147 ΔykuLA::Mlsr in JG106 This studyJG148 ΔyvnA::Mlsr in JG106 This studyJG156 amyE::PserA-gfp Cmr in 3610 This studyJG157 amyE::PserA-gfp Cmr sacA::PtapA-mKate2 Kanr in 3610 This studyABR167 ΔepsH::Tetr ΔsinR::kan amyE::PserA-lacZ Cmr in 3610 This studyABR176 amyE::PsdaAB-lacZ Specr in 3610 This studya140°(ylnF/yloA)�amyE::PtapA-lacZ, the PtapA-lacZ fusion was introduced into a locus between the ylnF and yloA genes at 140° on the chromosome; Cmr,chloramphenicol resistance; Kanr, kanamycin resistance; Mlsr, erythromycin resistance; Specr, spectinomycin resistance; Tetr, tetracycline resistance.
Serine Levels Act as a Biofilm Signal Journal of Bacteriology
August 2019 Volume 201 Issue 15 e00155-19 jb.asm.org 11
on July 10, 2019 by guesthttp://jb.asm
.org/D
ownloaded from

recombinant plasmid was then introduced into the B. subtilis laboratory strain PY79 by genetic trans-formation for a double-crossover recombination of the DNA sequences at the amyE locus. The constructwas then introduced into 3610 by transformation to generate strain JG59 (71). Overexpression of eachof the five tRNASer isoacceptor genes was done in a similar manner, using primers listed in Table S1 togenerate strains JG91 through JG97.
To compare the expression of the serA gene in the wild-type and various deletion strains, thepromoter sequence of serA was amplified by PCR using primers PserA-F and PserA-R and genomic DNAof 3610 as the template. The PCR products were digested with EcoRI and HindIII and cloned into theplasmid pDG268 (73), which carries a chloramphenicol resistance marker and a polylinker upstream ofthe lacZ gene between two arms of the amyE gene. The resulting recombinant plasmid pJG02 containsa PserA-lacZ transcriptional fusion. For comparison of tapA expression in wild-type and various engineeredstrains for serine metabolism, lysate from a strain containing a PtapA-lacZ fusion (YC755) was introducedinto strains JG08 and JG59 by SPP1 phage-mediated transduction. The PtapA-lacZ fusion was introducedinto a locus between the ylnF and yloA genes at 140° on the chromosome, as previously described (13).This insertion keeps the amyE gene intact, which allows for additional insertions, such as the Physpank-serAor tRNA overexpression constructs, and for measurement of lacZ transcription as well as IPTG induction.
To examine single-cell fluorescence and track both serA expression and biofilm matrix gene expres-sion, a dual reporter strain was constructed. The regulatory sequence of serA was amplified by PCR usingprimers PserA-F and PserA-R and genomic DNA of B. subtilis strain 3610 as the template. The PCR productwas digested with EcoRI and HindIII and cloned into the plasmid pYC121, which has a promoterless gfpgene (gfp-mut2) flanked by the amyE sequence (38). This resulting plasmid pJG08 was then introducedinto B. subtilis PY79 by genetic transformation for a double-crossover recombination at the amyE locus.The reporter fusion was then moved into 3610 by transduction (71), generating strain JG156. Toconstruct the dual-reporter strain, the PserA-gfp reporter was introduced to YCN095, which contains aPtapA-mKate2 reporter fusion integrated at sacA (74), generating strain JG157.
To measure sdaAA expression, a 150-bp promoter region (PsdaAB) was amplified using primersPsdaAB-F and PsdaAB-R and 3610 genomic DNA as the template. The PCR product was digested withBamHI and HindIII restriction enzymes and inserted onto the pDG1728 vector backbone to generateplasmid pABR174. pABR174 was then transformed into B. subtilis PY79 and further into 3610 to generatestrain ABR176 (71).
Serine auxotroph assay. To harvest supernatant, wild-type 3610 cells or its derivatives were grownovernight on an LB plate at 37°C. Single colonies were then grown overnight in 3 ml of LB medium undershaking conditions at 37°C. Cells were subcultured at 1:100 into MSgg medium. Cultures were collectedat OD600 of 0.6 (exponential phase) and OD600 of 1.4 (stationary phase), and cells were removed bycentrifugation at 15,000 g for 10 min. Supernatants were filter sterilized (0.2 �m) to further remove thecells, passed through a mini-sizing column (molecular weight [MW] cutoff, 5,000 Da; Qiagen) to removelarge molecular weight macromolecules, such as proteins, and then diluted in MSgg. The final dilutedsupernatant was equivalent to the spent culture medium of 108 cell per ml. To test auxotroph growth,the ΔserA strain (YC913) was grown overnight on an LB plate at 37°C. Single colonies were grownovernight in 3 ml of LB medium under shaking conditions at 37°C. Cells were subcultured at 1:100 intoMSgg medium for 6 hours. Cells were washed in fresh MSgg and then diluted to a concentration ofapproximately 100 CFU/ml in fresh MSgg. One milliliter of cells was added to 1 ml of supernatant. Cellswere grown for 24 hours under shaking conditions at 37°C. After 24 hours of incubation, cells were platedand CFU were counted the next day. Resulting CFU were divided by starting CFU to assess relativegrowth ability. Experiments were performed in triplicate and repeated at least three times for each strain.
For generation of the standard curve, YC913 was grown as described above. However, after 6 h ofgrowth, the culture was diluted to 104 cells per ml. This dilution was inoculated 1:100 into 2-ml culturetubes containing MSgg with various concentrations of serine (Sigma). An initial inoculum was plated forCFU onto LB plates. The remaining cultures grew at 37°C under shaking conditions for 24 h and werethen plated for CFU. The calculation of the curves was standardized to the initial inoculum. The standardcurve was carried out in triplicate for four independent experiments.
TABLE 2 Plasmids used in this study
Plasmid Detailsa Reference or source
pDG268 An amyE integration vector with a promoterless lacZ, Ampr Cmr BGSCpDG1728 An amyE integration vector with a promoterless lacZ, Ampr Specr BGSCpDR111 An amyE integration vector that contains Physpank, Ampr Specr BGSCpYC121 An amyE integration vector with a promoterless gfp-mut2, Ampr Specr 38pJG01 amyE::Physpank-serA in pDR111, Ampr Specr This studypJG02 amyE::PserA-lacZ in pDG268, Ampr Cmr This studypJG03 amyE::Physpank-trnB-ser1 in pDR111, Ampr Specr This studypJG04 amyE::Physpank-trnB-ser2 in pDR111, Ampr Specr This studypJG05 amyE::Physpank-trnS-ser in pDR111, Ampr Specr This studypJG06 amyE::Physpank-trnSL-ser1 in pDR111, Ampr Specr This studypJG07 amyE::Physpank-trnD-ser in pDR111, Ampr Specr This studypJG08 amyE::PserA-gfp Ampr Cmr This studypABR174 amyE::PsdaAB-lacZ in pDG1728, Ampr Specr This studyaAmpr, ampicillin resistance; Cmr, chloramphenicol resistance; Specr, spectinomycin resistance.
Greenwich et al. Journal of Bacteriology
August 2019 Volume 201 Issue 15 e00155-19 jb.asm.org 12
on July 10, 2019 by guesthttp://jb.asm
.org/D
ownloaded from

�-Galactosidase activity assay. For assays of �-galactosidase activity, an established protocol wasused (75). Briefly, cells were incubated in a flask of MSgg or LBGM medium at 37°C with shaking. Onemilliliter of culture was collected at each indicated time point after inoculation. Cells were spun down,and pellets were resuspended in 1 ml Z buffer (40 mM NaH2PO4, 60 mM Na2HPO4, 1 mM MgSO4, 10 mMKCl, and 38 mM �-mercaptoethanol) supplemented with 200 �g/ml freshly made lysozyme. Resuspen-sions were incubated at 30°C for 15 min. Reactions were started by adding 200 �l of 4 mg/mlo-nitrophenyl-�-D-galactopyranoside (ONPG) and stopped by adding 500 �l of 1 M Na2CO3. Sampleswere spun down to remove any cell debris. OD420 and OD550 values of the samples were recorded usinga Bio-Rad SmartSpec 3000 instrument. The �-galactosidase-specific activity was calculated according tothe following equation: activity (Miller units) � [OD420 1.75(OD550)/(time volume OD600)] 1,000.Experiments were performed in triplicate and repeated at least three times. Statistical analyses wereperformed by using Student’s t test.
Bioassays on pellicle biofilms. B. subtilis cells were grown in LB broth at 37°C to mid-log phase. Forpellicle formation, 4 �l of the cells was mixed with 4 ml of liquid MSgg medium in 12-well plates(Corning). Plates were incubated at 30°C for up to 72 hours. Images were taken using a Leica MZ10Fdissecting scope. For �-galactosidase activity assays on pellicle biofilm samples, pellicle biofilms were setup as described above and collected at 24, 48, or 72 hours. Pellicles were resuspended using the mediumin the well and gently sonicated to disrupt cell chains and bundles but not individual cells. One milliliterof the pellicle was spun down and resuspended in 1 ml Z buffer. A total of 100 �l of sample was thendiluted into 900 �l Z buffer due to high cell density in the pellicle. The �-galactosidase activity wasassayed as described above. The activity was calculated similarly as described above. Experiments wereperformed in triplicate and repeated at least three times.
Quantitative real-time PCR. Five hundred microliters of B. subtilis cells was harvested duringexponential phase (OD600, �0.6) and stationary phase (OD600, �1.4) and added to 1 �l of RNAProtectbacteria reagent (Qiagen). After incubation at room temperature for 60 minutes, samples were spundown (15,000 g for 5 min), and the cell pellet was resuspended in 1 ml of TRIzol reagent (Thermo) andincubated for 5 minutes at room temperature. Total RNA was extracted using the Zymo Direct-zol RNAkit (Zymo) following the manufacturer’s protocol. RNA concentration and purity were measured using aNanoDrop One instrument (Thermo). RNA was converted to cDNA using a high-capacity cDNA reversetranscription kit (Applied Biosciences). Quantitative PCR (qPCR) was performed using the primers listedin Table S3 in the supplemental material using the protocol provided by the manufacturer for the FastSYBR green master mix (Applied Biosystems) using a StepOnePlus real-time PCR machine (AppliedBiosystems). Relative expression was calculated using the comparative threshold cycle (ΔΔCT) for eachsample. Technical triplicates were run for each sample to calculate the ΔΔCT and biological triplicateswere run for each strain, and the experiment was repeated three times, for a total of nine biologicalreplicates. The relative expression was standardized using the endogenous 16S control with theexponential-phase samples used as the reference sample. A one-way analysis of variance (ANOVA) wasused to assess statistical significance (P � 0.05).
Dual reporter assay. For the dual reporter assay, the strain JG157 containing the PserA-gfp andPtapA-mKate2 fluorescent reporters was first grown in LB broth overnight. On the next day, pellicleformation was performed by mixing 4 �l of the overnight cells with 4 ml of liquid MSgg medium in12-well plates (Corning). Plates were incubated at 30°C for up to 96 hours. Cells were collected atdifferent time points for microscopic observation. To visualize cells under the microscope, 1 ml of cellswas harvested, washed with 1 ml of phosphate-buffered saline (PBS) buffer to remove residual MSggmedium, and then concentrated in 100 �l of PBS buffer. A volume of 2 �l of cells was added to a 1%agarose pad (wt/vol) and covered with a coverslip. Cells were imaged using a Leica DFC3000 G cameraon a Leica AF6000 microscope. Images of samples collected from different time points were taken usingthe same exposure settings. For GFP observation, the setting of the excitation wavelength was 450 to 490nm, while the setting of the emission wavelength was 500 to 550 nm. For mKate2 observation, theexcitation wavelength setting was at 540 to 580 nm and the emission wavelength setting was at 610 to680 nm. The experiment was conducted in triplicate, and images taken were representatives of the threereplicates.
SUPPLEMENTAL MATERIALSupplemental material for this article may be found at https://doi.org/10.1128/JB
.00155-19.SUPPLEMENTAL FILE 1, PDF file, 0.5 MB.
ACKNOWLEDGMENTSWe thank the members of the Chai and Godoy labs for helpful discussions. We thank
Leticia Lima Angelini, Christina Potter, Rachel Son, and Philip Wasson for technicalassistance.
Funding for this work was provided by Northeastern University and a grant from theNational Science Foundation to Y. Chai (MCB1651732).
J.G., A.R., K.G., V.G.-C., and Y.C. designed the experiments. J.G., A.R., and G.D.C.performed the experiments. T.T. provided substantial technical help. J.G., A.R., and Y.C.wrote the manuscript.
Serine Levels Act as a Biofilm Signal Journal of Bacteriology
August 2019 Volume 201 Issue 15 e00155-19 jb.asm.org 13
on July 10, 2019 by guesthttp://jb.asm
.org/D
ownloaded from

REFERENCES1. Hall-Stoodley L, Costerton JW, Stoodley P. 2004. Bacterial biofilms: from
the natural environment to infectious diseases. Nat Rev Microbiol2:95–108. https://doi.org/10.1038/nrmicro821.
2. O’Toole G, Kaplan HB, Kolter R. 2000. Biofilm formation as microbialdevelopment. Annu Rev Microbiol 54:49–79. https://doi.org/10.1146/annurev.micro.54.1.49.
3. Stoodley P, Sauer K, Davies DG, Costerton JW. 2002. Biofilms as complexdifferentiated communities. Annu Rev Microbiol 56:187–209. https://doi.org/10.1146/annurev.micro.56.012302.160705.
4. Hall-Stoodley L, Stoodley P. 2009. Evolving concepts in biofilm infec-tions. Cell Microbiol 11:1034–1043. https://doi.org/10.1111/j.1462-5822.2009.01323.x.
5. Branda SS, Gonzalez-Pastor JE, Ben-Yehuda S, Losick R, Kolter R. 2001.Fruiting body formation by Bacillus subtilis. Proc Natl Acad Sci U S A98:11621–11626. https://doi.org/10.1073/pnas.191384198.
6. Vlamakis H, Chai Y, Beauregard P, Losick R, Kolter R. 2013. Stickingtogether: building a biofilm the Bacillus subtilis way. Nat Rev Microbiol11:157–168. https://doi.org/10.1038/nrmicro2960.
7. Chen Y, Cao S, Chai Y, Clardy J, Kolter R, Guo JH, Losick R. 2012. A Bacillussubtilis sensor kinase involved in triggering biofilm formation on theroots of tomato plants. Mol Microbiol 85:418–430. https://doi.org/10.1111/j.1365-2958.2012.08109.x.
8. Chen Y, Yan F, Chai Y, Liu H, Kolter R, Losick R, Guo JH. 2013. Biocontrol oftomato wilt disease by Bacillus subtilis isolates from natural environmentsdepends on conserved genes mediating biofilm formation. Environ Micro-biol 15:848–864. https://doi.org/10.1111/j.1462-2920.2012.02860.x.
9. Beauregard PB, Chai Y, Vlamakis H, Losick R, Kolter R. 2013. Bacillussubtilis biofilm induction by plant polysaccharides. Proc Natl Acad SciU S A 110:E1621–E1630. https://doi.org/10.1073/pnas.1218984110.
10. McLoon AL, Kolodkin-Gal I, Rubinstein SM, Kolter R, Losick R. 2011. Spatialregulation of histidine kinases governing biofilm formation in Bacillus sub-tilis. J Bacteriol 193:679–685. https://doi.org/10.1128/JB.01186-10.
11. Hamon MA, Lazazzera BA. 2001. The sporulation transcription factorSpo0A is required for biofilm development in Bacillus subtilis. Mol Mi-crobiol 42:1199–1209.
12. Burbulys D, Trach KA, Hoch JA. 1991. Initiation of sporulation in Bacillussubtilis is controlled by a multicomponent phosphorelay. Cell 64:545–552. https://doi.org/10.1016/0092-8674(91)90238-T.
13. Chai Y, Norman T, Kolter R, Losick R. 2011. Evidence that metabolism andchromosome copy number control mutually exclusive cell fates in Bacillussubtilis. EMBO J 30:1402–1413. https://doi.org/10.1038/emboj.2011.36.
14. Bai U, Mandic-Mulec I, Smith I. 1993. SinI modulates the activity of SinR,a developmental switch protein of Bacillus subtilis, by protein-proteininteraction. Genes Dev 7:139–148. https://doi.org/10.1101/gad.7.1.139.
15. Newman JA, Rodrigues C, Lewis RJ. 2013. Molecular basis of the activityof SinR protein, the master regulator of biofilm formation in Bacillussubtilis. J Biol Chem 288:10766–10778. https://doi.org/10.1074/jbc.M113.455592.
16. Subramaniam AR, Deloughery A, Bradshaw N, Chen Y, O’Shea E, LosickR, Chai Y. 2013. A serine sensor for multicellularity in a bacterium. Elife2:e01501. https://doi.org/10.7554/eLife.01501.
17. Townsley L, Yannarell SM, Huynh TN, Woodward JJ, Shank EA. 2018.Cyclic di-AMP acts as an extracellular signal that impacts Bacillus subtilisbiofilm formation and plant attachment. mBio 9:e00341-18. https://doi.org/10.1128/mBio.00341-18.
18. Chen Y, Chai Y, Guo JH, Losick R. 2012. Evidence for cyclic Di-GMP-mediated signaling in Bacillus subtilis. J Bacteriol 194:5080–5090. https://doi.org/10.1128/JB.01092-12.
19. Stauffer G. 2004. Regulation of serine, glycine, and one-carbon biosyn-thesis. EcoSal Plus https://doi.org/10.1128/ecosalplus.3.6.1.2.
20. Saski R, Pizer LI. 1975. Regulatory properties of purified 3-phospho-glycerate dehydrogenase from Bacillus subtilis. Eur J Biochem 51:415–427.https://doi.org/10.1111/j.1432-1033.1975.tb03941.x.
21. Rex JH, Aronson BD, Somerville RL. 1991. The tdh and serA operons ofEscherichia coli: mutational analysis of the regulatory elements ofleucine-responsive genes. J Bacteriol 173:5944–5953. https://doi.org/10.1128/jb.173.19.5944-5953.1991.
22. de Crombrugghe B, Busby S, Buc H. 1984. Cyclic AMP receptor protein:role in transcription activation. Science 224:831–838. https://doi.org/10.1126/science.6372090.
23. Taniguchi T, O’Neill M, de Crombrugghe B. 1979. Interaction site of
Escherichia coli cyclic AMP receptor protein on DNA of galactose operonpromoters. Proc Natl Acad Sci U S A 76:5090–5094. https://doi.org/10.1073/pnas.76.10.5090.
24. Newman EB, D’Ari R, Lin RT. 1992. The leucine-Lrp regulon in E. coli: aglobal response in search of a raison d’etre. Cell 68:617–619. https://doi.org/10.1016/0092-8674(92)90135-Y.
25. Henkin TM, Grundy FJ, Nicholson WL, Chambliss GH. 1991. Cataboliterepression of alpha-amylase gene expression in Bacillus subtilis involvesa trans-acting gene product homologous to the Escherichia coli lacl andgalR repressors. Mol Microbiol 5:575–584. https://doi.org/10.1111/j.1365-2958.1991.tb00728.x.
26. Gorke B, Stulke J. 2008. Carbon catabolite repression in bacteria: manyways to make the most out of nutrients. Nat Rev Microbiol 6:613–624.https://doi.org/10.1038/nrmicro1932.
27. Stanley NR, Britton RA, Grossman AD, Lazazzera BA. 2003. Identificationof catabolite repression as a physiological regulator of biofilm formationby Bacillus subtilis by use of DNA microarrays. J Bacteriol 185:1951–1957.https://doi.org/10.1128/jb.185.6.1951-1957.2003.
28. Chen Y, Gozzi K, Yan F, Chai Y. 2015. Acetic acid acts as a volatile signalto stimulate bacterial biofilm formation. mBio 6:e00392. https://doi.org/10.1128/mBio.00392-15.
29. Brinsmade SR, Alexander EL, Livny J, Stettner AI, Segrè D, Rhee KY,Sonenshein AL. 2014. Hierarchical expression of genes controlled by theBacillus subtilis global regulatory protein CodY. Proc Natl Acad Sci U S A111:8227–8232. https://doi.org/10.1073/pnas.1321308111.
30. Su HS, Lang BF, Newman EB. 1989. L-serine degradation in Escherichiacoli K-12: cloning and sequencing of the sdaA gene. J Bacteriol 171:5095–5102. https://doi.org/10.1128/jb.171.9.5095-5102.1989.
31. Tobey KL, Grant GA. 1986. The nucleotide sequence of the serA gene ofEscherichia coli and the amino acid sequence of the encoded protein,D-3-phosphoglycerate dehydrogenase. J Biol Chem 261:12179–12183.
32. Zhang X, Newman E. 2008. Deficiency in L-serine deaminase results inabnormal growth and cell division of Escherichia coli K-12. Mol Microbiol69:870–881. https://doi.org/10.1111/j.1365-2958.2008.06315.x.
33. Zhu B, Stulke J. 2018. SubtiWiki in 2018: from genes and proteins tofunctional network annotation of the model organism Bacillus subtilis.Nucleic Acids Res 46:D743–D748. https://doi.org/10.1093/nar/gkx908.
34. Liebs P, Riedel K, Graba JP, Schrapel D, Tischler U. 1988. Formation of someextracellular enzymes during the exponential growth of Bacillus subtilis.Folia Microbiol (Praha) 33:88–95. https://doi.org/10.1007/BF02928073.
35. Sezonov G, Joseleau-Petit D, D’Ari R. 2007. Escherichia coli physiology inLuria-Bertani broth. J Bacteriol 189:8746–8749. https://doi.org/10.1128/JB.01368-07.
36. Pruss BM, Nelms JM, Park C, Wolfe AJ. 1994. Mutations in NADH:ubiquinone oxidoreductase of Escherichia coli affect growth on mixedamino acids. J Bacteriol 176:2143–2150. https://doi.org/10.1128/jb.176.8.2143-2150.1994.
37. Molle V, Nakaura Y, Shivers RP, Yamaguchi H, Losick R, Fujita Y, Sonen-shein AL. 2003. Additional targets of the Bacillus subtilis global regulatorCodY identified by chromatin immunoprecipitation and genome-widetranscript analysis. J Bacteriol 185:1911–1922. https://doi.org/10.1128/jb.185.6.1911-1922.2003.
38. Chai Y, Chu F, Kolter R, Losick R. 2008. Bistability and biofilm formationin Bacillus subtilis. Mol Microbiol 67:254–263. https://doi.org/10.1111/j.1365-2958.2007.06040.x.
39. Chu F, Kearns DB, McLoon A, Chai Y, Kolter R, Losick R. 2008. A novelregulatory protein governing biofilm formation in Bacillus subtilis. MolMicrobiol 68:1117–1127. https://doi.org/10.1111/j.1365-2958.2008.06201.x.
40. DeLoughery A, Lalanne J-B, Losick R, Li G-W. 2018. Maturation of poly-cistronic mRNAs by the endoribonuclease RNase Y and its associatedY-complex in Bacillus subtilis. Proc Natl Acad Sci U S A 115:E5585–E5594.https://doi.org/10.1073/pnas.1803283115.
41. Vlamakis H, Aguilar C, Losick R, Kolter R. 2008. Control of cell fate by theformation of an architecturally complex bacterial community. Genes Dev22:945–953. https://doi.org/10.1101/gad.1645008.
42. Lopez D, Fischbach MA, Chu F, Losick R, Kolter R. 2009. Structurallydiverse natural products that cause potassium leakage trigger multicel-lularity in Bacillus subtilis. Proc Natl Acad Sci U S A 106:280–285. https://doi.org/10.1073/pnas.0810940106.
43. Kearns DB, Chu F, Branda SS, Kolter R, Losick R. 2005. A master regulator
Greenwich et al. Journal of Bacteriology
August 2019 Volume 201 Issue 15 e00155-19 jb.asm.org 14
on July 10, 2019 by guesthttp://jb.asm
.org/D
ownloaded from

for biofilm formation by Bacillus subtilis. Mol Microbiol 55:739–749.https://doi.org/10.1111/j.1365-2958.2004.04440.x.
44. Marvasi M, Visscher PT, Casillas Martinez L. 2010. Exopolymeric sub-stances (EPS) from Bacillus subtilis: polymers and genes encoding theirsynthesis. FEMS Microbiol Lett 313:1–9. https://doi.org/10.1111/j.1574-6968.2010.02085.x.
45. Yang L, Lin RT, Newman EB. 2002. Structure of the Lrp-regulated serApromoter of Escherichia coli K-12. Mol Microbiol 43:323–333. https://doi.org/10.1046/j.1365-2958.2002.02744.x.
46. Tuan LR, D’Ari R, Newman EB. 1990. The leucine regulon of Escherichiacoli K-12: a mutation in rblA alters expression of L-leucine-dependentmetabolic operons. J Bacteriol 172:4529–4535. https://doi.org/10.1128/jb.172.8.4529-4535.1990.
47. Grundy FJ, Waters DA, Allen SH, Henkin TM. 1993. Regulation of theBacillus subtilis acetate kinase gene by CcpA. J Bacteriol 175:7348–7355.https://doi.org/10.1128/jb.175.22.7348-7355.1993.
48. Wunsche A, Hammer E, Bartholomae M, Volker U, Burkovski A, Seidel G,Hillen W. 2012. CcpA forms complexes with CodY and RpoA in Bacillussubtilis. FEBS J 279:2201–2214. https://doi.org/10.1111/j.1742-4658.2012.08604.x.
49. Blencke HM, Homuth G, Ludwig H, Mader U, Hecker M, Stulke J. 2003.Transcriptional profiling of gene expression in response to glucose inBacillus subtilis: regulation of the central metabolic pathways. Metab Eng5:133–149. https://doi.org/10.1016/S1096-7176(03)00009-0.
50. Chumsakul O, Takahashi H, Oshima T, Hishimoto T, Kanaya S, OgasawaraN, Ishikawa S. 2011. Genome-wide binding profiles of the Bacillus subtilistransition state regulator AbrB and its homolog Abh reveals their inter-active role in transcriptional regulation. Nucleic Acids Res 39:414–428.https://doi.org/10.1093/nar/gkq780.
51. Molle V, Fujita M, Jensen ST, Eichenberger P, Gonzalez-Pastor JE, Liu JS,Losick R. 2003. The Spo0A regulon of Bacillus subtilis. Mol Microbiol50:1683–1701. https://doi.org/10.1046/j.1365-2958.2003.03818.x.
52. Blencke HM, Reif I, Commichau FM, Detsch C, Wacker I, Ludwig H, Stulke J.2006. Regulation of citB expression in Bacillus subtilis: integration of multiplemetabolic signals in the citrate pool and by the general nitrogen regulatorysystem. Arch Microbiol 185:136–146. https://doi.org/10.1007/s00203-005-0078-0.
53. Sorensen MA, Elf J, Bouakaz E, Tenson T, Sanyal S, Bjork GR, EhrenbergM. 2005. Over expression of a tRNA(Leu) isoacceptor changes chargingpattern of leucine tRNAs and reveals new codon reading. J Mol Biol354:16–24. https://doi.org/10.1016/j.jmb.2005.08.076.
54. Waldron C, Lacroute F. 1975. Effect of growth rate on the amounts ofribosomal and transfer ribonucleic acids in yeast. J Bacteriology 122:855–865.
55. Davis BD, Luger SM, Tai PC. 1986. Role of ribosome degradation in thedeath of starved Escherichia coli cells. J Bacteriol 166:439–445. https://doi.org/10.1128/jb.166.2.439-445.1986.
56. Subramaniam AR, Pan T, Cluzel P. 2013. Environmental perturbations liftthe degeneracy of the genetic code to regulate protein levels in bacte-ria. Proc Natl Acad Sci U S A 110:2419–2424. https://doi.org/10.1073/pnas.1211077110.
57. de Jong IG, Veening JW, Kuipers OP. 2012. Single cell analysis of geneexpression patterns during carbon starvation in Bacillus subtilis revealslarge phenotypic variation. Environ Microbiol 14:3110–3121. https://doi.org/10.1111/j.1462-2920.2012.02892.x.
58. Jacob F, Monod J. 1961. Genetic regulatory mechanisms in thesynthesis of proteins. J Mol Biol 3:318–356. https://doi.org/10.1016/S0022-2836(61)80072-7.
59. Shepherd J, Ibba M. 2015. Bacterial transfer RNAs. FEMS Microbiol Rev39:280–300. https://doi.org/10.1093/femsre/fuv004.
60. Pan T. 2018. Modifications and functional genomics of human transferRNA. Cell Res 28:395–404. https://doi.org/10.1038/s41422-018-0013-y.
61. Maraia RJ, Arimbasseri AG. 2017. Factors that shape eukaryotic
tRNAomes: processing, modification and anticodon-codon use. Biomol-ecules 7:26. https://doi.org/10.3390/biom7010026.
62. Anton BP, Russell SP, Vertrees J, Kasif S, Raleigh EA, Limbach PA, RobertsRJ. 2010. Functional characterization of the YmcB and YqeV tRNA meth-ylthiotransferases of Bacillus subtilis. Nucleic Acids Res 38:6195–6205.https://doi.org/10.1093/nar/gkq364.
63. Esberg B, Leung H-C, Tsui H-C, Björk GR, Winkler ME. 1999. Identificationof the miaB gene, involved in methylthiolation of isopentenylated A37derivatives in the tRNA of Salmonella Typhimurium and Escherichia coli.J Bacteriol 181:7256–7265.
64. Branda SS, González-Pastor JE, Dervyn E, Ehrlich SD, Losick R, Kolter R.2004. Genes involved in formation of structured multicellular commu-nities by Bacillus subtilis. J Bacteriol 186:3970–3979. https://doi.org/10.1128/JB.186.12.3970-3979.2004.
65. DeLoughery A, Dengler V, Chai Y, Losick R. 2016. Biofilm formation byBacillus subtilis requires an endoribonuclease-containing multisubunitcomplex that controls mRNA levels for the matrix gene repressor SinR.Mol Microbiol 99:425–437. https://doi.org/10.1111/mmi.13240.
66. Svenningsen SL, Kongstad M, Stenum TS, Muñoz-Gómez AJ, SørensenMA. 2017. Transfer RNA is highly unstable during early amino acidstarvation in Escherichia coli. Nucleic Acids Res 45:793–804. https://doi.org/10.1093/nar/gkw1169.
67. Schroeder JW, Simmons LA. 2013. Complete genome sequence of Ba-cillus subtilis strain PY79. Genome Announc 1:e01085-13. https://doi.org/10.1128/genomeA.01085-13.
68. Shemesh M, Chai Y. 2013. A combination of glycerol and manganesepromotes biofilm formation in Bacillus subtilis via histidine kinase KinDsignaling. J Bacteriol 195:2747–2754. https://doi.org/10.1128/JB.00028-13.
69. Sambrook J. 2001. Molecular cloning. a laboratory manual. Cold SpringHarbor Laboratory Press, Cold Spring Harbor, NY, USA.
70. Gryczan TJ, Contente S, Dubnau D. 1978. Characterization of Staphylo-coccus aureus plasmids introduced by transformation into Bacillus sub-tilis. J Bacteriol 134:318–329.
71. Yasbin RE, Young FE. 1974. Transduction in Bacillus subtilis by bacterio-phage SPP1. J Virol 14:1343–1348.
72. Chai Y, Kolter R, Losick R. 2009. A widely conserved gene cluster required forlactate utilization in Bacillus subtilis and its involvement in biofilm formation.J Bacteriol 191:2423–2430. https://doi.org/10.1128/JB.01464-08.
73. Antoniewski C, Savelli B, Stragier P. 1990. The spoIIJ gene, which regu-lates early developmental steps in Bacillus subtilis, belongs to a class ofenvironmentally responsive genes. J Bacteriol 172:86–93. https://doi.org/10.1128/jb.172.1.86-93.1990.
74. Gozzi K, Ching C, Paruthiyil S, Zhao Y, Godoy-Carter V, Chai Y. 2017.Bacillus subtilis utilizes the DNA damage response to manage multicel-lular development. NPJ Biofilms Microbiomes 3:8. https://doi.org/10.1038/s41522-017-0016-3.
75. Yu Y, Yan F, He Y, Qin Y, Chen Y, Chai Y, Guo J-H. 2018. The ClpY-ClpQprotease regulates multicellular development in Bacillus subtilis. Micro-biology 164:848–862. https://doi.org/10.1099/mic.0.000658.
76. Huang X, Fredrick KL, Helmann JD. 1998. Promoter recognition byBacillus subtilis sigmaW: autoregulation and partial overlap with thesigmaX regulon. J Bacteriol 180:3765–3770.
77. Kunst F, Ogasawara N, Moszer I, Albertini AM, Alloni G, Azevedo V,Bertero MG, Bessières P, Bolotin A, Borchert S, Borriss R, Boursier L, BransA, Braun M, Brignell SC, Bron S, Brouillet S, Bruschi CV, Caldwell B,Capuano V, Carter NM, Choi SK, Codani JJ, Connerton IF, Cummings NJ,Daniel RA, Denizot F, Devine KM, Düsterhöft A, Ehrlich SD, Emmerson PT,Entian KD, Errington J, Fabret C, Ferrari E, Foulger D, Fritz C, Fujita M,Fujita Y, Fuma S, Galizzi A, Galleron N, Ghim SY, Glaser P, Goffeau A,Golightly EJ, Grandi G, Guiseppi G, Guy BJ, Haga K, et al. 1997. Thecomplete genome sequence of the Gram-positive bacterium Bacillussubtilis. Nature 390:249–256. https://doi.org/10.1038/36786.
Serine Levels Act as a Biofilm Signal Journal of Bacteriology
August 2019 Volume 201 Issue 15 e00155-19 jb.asm.org 15
on July 10, 2019 by guesthttp://jb.asm
.org/D
ownloaded from