a deep learning architecture for psychometric natural
TRANSCRIPT
A Deep Learning Architecture for Psychometric NaturalLanguage Processing
FAIZAN AHMAD, University of VirginiaAHMED ABBASI, University of VirginiaJINGJING LI, University of VirginiaDAVID G. DOBOLYI, University of VirginiaRICHARD G. NETEMEYER, University of VirginiaGARI D. CLIFFORD, Emory University and Georgia TechHSINCHUN CHEN, University of Arizona
Psychometric measures reflecting people’s knowledge, ability, attitudes and personality traits are criticalfor many real-world applications, such as e-commerce, healthcare, and cybersecurity. However, traditionalmethods cannot collect and measure rich psychometric dimensions in a timely and unobtrusive manner.Consequently, despite their importance, psychometric dimensions have received limited attention from thenatural language processing and information retrieval communities. In this paper, we propose a deep learningarchitecture, PyNDA, to extract psychometric dimensions from user-generated texts. PyNDA contains a novelrepresentation embedding, a demographic embedding, a structural equation model (SEM) encoder, and amulti-task learning mechanism designed to work in unison to address the unique challenges associated withextracting rich, sophisticated and user-centric psychometric dimensions. Our experiments on three real-worlddatasets encompassing eleven psychometric dimensions, including trust, anxiety, and literacy, show thatPyNDA markedly outperforms traditional feature-based classifiers as well as the state-of-the-art deep learningarchitectures. Ablation analysis reveals that each component of PyNDA significantly contributes to its overallperformance. Collectively, the results demonstrate the efficacy of the proposed architecture for facilitatingrich psychometric analysis. Our results have important implications for user-centric information extractionand retrieval systems looking to measure and incorporate psychometric dimensions.
CCS Concepts: • Computing methodologies→ Natural language processing.
Additional Key Words and Phrases: Deep learning, natural language processing, psychometric measures, textclassification.
ACM Reference Format:FaizanAhmad, AhmedAbbasi, Jingjing Li, David G. Dobolyi, RichardG. Netemeyer, Gari D. Clifford, andHsinchunChen. 2018. A Deep Learning Architecture for Psychometric Natural Language Processing. 1, 1 (October 2018),29 pages. https://doi.org/10.1145/1122445.1122456
Authors’ addresses: Faizan Ahmad, University of Virginia; Ahmed Abbasi, University of Virginia; Jingjing Li, University ofVirginia; David G. Dobolyi, University of Virginia; Richard G. Netemeyer, University of Virginia; Gari D. Clifford, EmoryUniversity and Georgia Tech; Hsinchun Chen, University of Arizona.
Permission to make digital or hard copies of all or part of this work for personal or classroom use is granted without feeprovided that copies are not made or distributed for profit or commercial advantage and that copies bear this notice and thefull citation on the first page. Copyrights for components of this work owned by others than the author(s) must be honored.Abstracting with credit is permitted. To copy otherwise, or republish, to post on servers or to redistribute to lists, requiresprior specific permission and/or a fee. Request permissions from [email protected].© 2018 Copyright held by the owner/author(s). Publication rights licensed to ACM.XXXX-XXXX/2018/10-ART $15.00https://doi.org/10.1145/1122445.1122456
, Vol. 1, No. 1, Article . Publication date: October 2018.
2 F. Ahmad, A. Abbasi, J. Li, D.G. Dobolyi, R.G. Netemeyer, G.D.Clifford and H. Chen
1 INTRODUCTIONPSYCHOMETRICS is concerned with the measurement of knowledge, ability, attitudes, and per-sonality traits. With the increased importance of analytics at the micro-level [10], including un-derstanding and prediction of individuals’ behaviors [4], accurate and timely measurement ofpsychometrics has become of paramount importance. In cybersecurity contexts, self- efficacy andthreat perceptions are critical psychometric dimensions known to be strong indicators of enduser susceptibility to phishing attacks [5]. Similarly, financial literacy and psychological traits areimportant antecedents for downstream financial behaviors [24]. In e-commerce, satisfaction witha website’s browsing experience is a crucial lead indicator for purchase propensity and e-loyalty[18]. In health settings, psychometric measures, including health numeracy, subjective literacy,and perceptions of trust and anxiety related to physicians, have been shown to have a profoundimpact on various health and wellness outcomes such as future doctors’ visits and all-aroundwell-being [8], [22], [53]. Hence, accurately and efficiently measuring psychometrics inherent inuser-generated content can provide an important information access refinement with positiveimplications for many real-world tasks, including information retrieval, mobile text analytics, andbehavior modeling [25] [4] [20].
Psychometric data collection efforts have traditionally relied on survey-based methods adminis-tered on a monthly or quarterly basis. Effectively collecting and measuring relevant constructs ina timely and unobtrusive manner has proven elusive in real-world settings [27]. In recent years,machine-learning methods for natural language processing (NLP) have been successfully appliedto certain psychometric dimensions such as sentiment and emotion [11] [29]. Such NLP techniques,which analyze user-generated text and automatically score them along the target variable, affordopportunities for real-time, passive monitoring and measurement. However, several gaps andchallenges remain:
• Many rich psychometric dimensions remain underexplored: Whereas numerous NLP methodshave been proposed for sentiment and emotion, other aspects such as attitudes, perceptions,and characteristics have received limited attention [6]. It is unclear how effectively NLPmethods can tackle these novel dimensions.
• User-centric versus task-centric modeling:Most prior NLP classification objectives and data setshave been arranged around a given task (e.g., sentiment polarity) . Psychometric dimensionssuch as attitudes and perceptions are very individualized, with multiple inter-related targetvariables of interest associated with each person. There is an opportunity for psychometricNLP methods to incorporate provisions for user-centric modeling.
• Demographic-sensitive modeling: Factors such as age, race, gender, and education can havea profound impact on various psychometric measures (e.g., literacy, trust, anxiety) [22].These differences can be amplified in user-generated text [61]. Several recent studies suggestthat machine learning models that fail to properly control for demographics are prone toinaccurate generalizations [21]. Psychometric NLP methods that are accurate across diversedemographic populations are a necessary and understudied research area.
• Paucity of available text: Several recent NLP studies have examined "short-text" contexts suchas Twitter [57] and news articles [59] [37]. User-generated text associated with psychometricsoften appears in similarly sparse environments such as comment boxes, text messages, andmicroblogs, necessitating methods capable of learning patterns from limited linguistic cues.
In order to address these gaps, we propose a novel deep learning architecture for psychometric NLP.Our architecture incorporates provisions to address the aforementioned issues, including novelrepresentation and demographic embeddings and a structural equation modeling (SEM) encoder,coupled with a robust multi-task learning method. The proposed architecture was evaluated
, Vol. 1, No. 1, Article . Publication date: October 2018.
A Deep Learning Architecture for Psychometric Natural Language Processing 3
on a rich health test bed encompassing three data sets comprised of pertinent psychometricdimensions - such as health numeracy, literacy, trust, anxiety, and drug experiences - related toa set of demographically diverse users. The results reveal that the proposed architecture is ableto garner markedly better classification accuracy, precision, and recall rates across psychometricdimensions, relative to baseline and benchmark machine learning NLP methods. Ablation analysisshows that each component significantly contributes to overall performance, thereby underscoringthe efficacy of the proposed architecture.
2 RELATEDWORKPsychometric dimensions are measures of latent constructs related to knowledge, ability, attitudes,perceptions, and personality traits [52]. These dimensions are known to be important antecedents,mediators, and moderators for important humanistic outcomes and behaviors [38]. For instance,in the health context, health literacy is a subjective reflection of one’s "knowledge pertaining tohealth care issues" [45]. The trust in doctors that patients place and anxiety visiting doctors areadditional examples of health-related psychometric dimensions [22][54]. All three of these, andother related dimensions, have been shown to impact future health outcomes including well-being[45]. However, effectively collecting and measuring such covariates in a timely and unobtrusivemanner has proven elusive in real-world settings [27]. Many psychometric dimensions require 10 ormore survey responses [46][14], making them less feasible in persistent measurement environments.Recent studies have suggested that NLP methods applied to user-generated content might offer acomplementary or alternative mechanism for measuring psychometric dimensions [27]. However,whereas NLP has a longstanding tradition for certain dimensions such as sentiment polarity(i.e., positive, negative, neutral) and select emotions (e.g., happiness, anger) [65][11][33], manyimportant psychometric dimensions have been largely unexplored. Given the potential implicationsof psychometrics for information retrieval, as noted in the introduction, one of goals of this studyis to demonstrate the efficacy of NLP methods for measuring rich psychometric dimensions fromtext. Accordingly, in the remainder of this section we review relevant NLP literature.
2.1 Feature Based Classifiers for NLPFeature-based text classifiers - a special type of NLP technique-have demonstrated their effectivenessin extracting certain commonly studied psychometric dimensions, such as sentiment and emotions,from user generated text [11]. These techniques rely on supervised machine learning methods thatleverage rich linguistic features to classify texts into several types (e.g., emotion classes or sentimentpolarities) and/or intensity levels (e.g., high versus low). Past studies have shown that supervisedmachine learning methods, such as Support Vector Machines [48], Naive Bayes [43], and logisticregression [28] are especially effective for text classification. An important area of focus for feature-based classifiers is to find the ideal feature set for representing the richness of the texts in orderto enhance classification performance. This is particularly critical since linguistic feature spacescan be massive, encompassing lexical measures, parts-of-speech, alternative syntactical patterns,domain-specific and general-purpose semantic lexicons, and pragmatic information. Consequently,several NLP feature ranking techniques have been proposed, such as FSH and FRN [23] [3], toenrich and enhance feature engineering efforts. In contrast, recent studies have found that deeplearning affords opportunities for automatic feature engineering [13]. However, deep learning oftenworks better when applied to large-scale texts [57] [59]. Thus, feature engineering and domainadaptation intuitions from feature-based text classification may complement deep learning whenfacing data paucity in diverse linguistic environments such as those encountered for psychometricNLP.
, Vol. 1, No. 1, Article . Publication date: October 2018.

4 F. Ahmad, A. Abbasi, J. Li, D.G. Dobolyi, R.G. Netemeyer, G.D.Clifford and H. Chen
2.2 RNNs for NLPRecurrent neural networks (RNNs) selectively pass information across sequence steps, whileprocessing sequential data one element at a time [23]. In order to deal with the gradient vanishingproblem that commonly appears in long-term sequence learning processes, two major gatingmechanisms have been proposed: gated recurrent units (GRU) [13] and long short-term memory(LSTM) [32] . The basic idea is to use a set of gates to regulate the values (through a weightedsum activation function) flowing into each hidden state so that the gradients are refrained fromapproximating to zero. These types of RNNs have been shown to be effective for many NLPtasks (e.g., [49] [33]). In the context of psychometric NLP, RNNs could capture long-term linguisticdependencies [12] - which are typically hard to capture throughmanual feature engineering - in user-generated texts to improve classification performance for previously underexplored psychometricdimensions of interest.
2.3 CNNs for NLPConvolutional neural networks (CNN) utilize layers with convolving filters to apply to localfeatures [36]. Originally invented for computer vision, CNNs have recently demonstrated superiorperformance on several NLP tasks (e.g., [16]). An interesting line of work is to learn character-levelCNN embeddings to accommodate possible spelling errors and prefix and suffix information [60].In addition, Kim et al. [35] used a CNN trained on top of pre-trained word vectors for sentencelevel classification [19]. Deriu et al. [19] used an ensemble of CNNs with distant supervision and arandom forest classifier for message-level sentiment analysis. Coneau et al. [17] proposed a verydeep CNN (VD-CNN) to accommodate character-level information for public text classification. Insummary, CNNs could be particularly useful for text classification of user-generated psychometriccontent, which often contains significant mis-spellings and domain-specific expressions.
2.4 Hybrid ArchitecturesSeveral articles (e.g., Cho et al. [13]) have discussed application areas for RNNs and CNNs in NLP.For example, CNNs are well-suited for mining local features regardless of position information,whereas RNNs are good at extracting long-term sequential information. Due to their complementarycharacteristics, researchers often utilize a hybrid architecture comprising RNNs and CNNs to solvecomplex NLP classification tasks. For example, Zhou et al. [62] used CNNs to learn phrase-levelfeatures through a convolutional layer and fed the sequence of such higher-level representationsinto RNNs to learn long- term dependencies. Inferring psychometric measures may benefit fromhybrid architectures capable of accommodating rich and diverse linguistic patterns appearing inuser-generated texts.
2.5 Multi-task Adversarial LearningMulti-task learning [64], [63] is an effective approach for improving the performance of a single taskby learning multiple tasks jointly. Recent progress in deep learning has offered novel opportunitiesfor implementing multi-task learning in a general neural-based framework: learning shared repre-sentations across multiple tasks to facilitate feature sharing, and finally mapping to individual tasksvia a task-specific predictor. The shared representation could utilize a hybrid architecture, perhapsfrom lower level word representations [15] to higher level contextual representations such asRNNs [49]. This general framework has recently been shown to work well for NLP tasks includingsequence tagging [58], text classification, and discourse analysis [40]. A notable improvement ofthe neural-based multi-task learning framework is to adopt adversarial learning [30] to ensure theshared representations only contain common and task-invariant information. Such approaches have
, Vol. 1, No. 1, Article . Publication date: October 2018.

A Deep Learning Architecture for Psychometric Natural Language Processing 5
worked well for several NLP tasks [40] and may also be effective in the context of psychometricNLP.
2.6 Summary of Research GapsBased on our review of relevant literature, we have identified three major research gaps. First,although psychometric dimensions such as sentiment and emotion have been studied extensively,there has been limited focus on other rich psychometric dimensions such as trust, anxiety and liter-acy. Research examining such psychometric dimensions is of theoretical and practical importance.For instance, effectively capturing such psychometric dimensions necessitates consideration ofuser-centric modeling techniques capable of considering inter-related dimensions in unison, as wellas demographic-sensitive modeling. Second, little work has been done to fuse the rich linguisticresources, methods, and domain knowledge developed in the feature-based NLP classificationliterature with novel deep learning architectures. Given the complexity of psychometric utterancesand paucity of available text, such fusion could facilitate enhanced accuracy by leveraging richlinguistic feature representations in concert with robust deep learning schemes. Third, hybrid deeplearning architectures encompassing CNNs, LSTMs, and multi- task learning mechanisms havebeen underexplored. Prior work suggests these approaches offer complementary benefits such aspattern detection from local features, consideration of long-term dependencies, and inclusion ofthe interplay between closely related user-level psychometric dimensions. In the ensuing section,we propose an architecture expressly designed to address these gaps.
Fig. 1. PyNDA architecture diagram
3 PROPOSED ARCHITECTURE: DEEP LEARNING FOR PSYCHOMETRIC NLPFigure 1 depicts our proposed PyNDA Psychometric NLP Deep Learning Architecture, whichencompasses four base neural nets that are fused via a concatenation layer that feeds into denselayers and also leverages a novel multi-task learningmechanism. Each component of the architecture
, Vol. 1, No. 1, Article . Publication date: October 2018.
6 F. Ahmad, A. Abbasi, J. Li, D.G. Dobolyi, R.G. Netemeyer, G.D.Clifford and H. Chen
is intended to address the aforementioned research gaps, thereby resulting in enhanced textclassification capabilities for psychometric dimensions:
• A character embedding convolution neural network (CNN) for capturing fundamental spatialsyntactic patterns in user-generated texts, at the character and prefix, suffix, and root levels.
• A bi-directional long short-term memory (Bi-LSTM) recurrent neural network that usesa novel underlying parallel representation embedding that encompasses an array of topic,sentiment, emotion, and syntactic linguistic representations. This embedding leveragesfeature subsumption methods capable of ingesting large, diverse feature spaces and refiningthem into a small set of rich attributes.
• A second Bi-LSTM that incorporates a novel demographic embedding scheme intended tobetter capture nuances and norms inherent across different gender, race, and age segments.
• A structural equation model (SEM) Encoder that allows inclusion of related "secondary"attitude and behavior information to allow superior classification of key target psychometricdimensions.
• A novel multi-task learning mechanism that enables better inclusion of joint informationbetween related target psychometric dimensions.
In the remainder of the section, we describe each component of the proposed architecture.
3.1 Character EmbeddingIn order to consider the morphological patterns (e.g. prefix, suffix and misspelling) of the inputtext, we build a character-level embedding using convolutional neural networks. Such neuralnetwork based embeddings have shown great promise on a wide variety of tasks [31] [47] [37].The input for the character embedding is a sequence of encoded characters. Each character isrepresented as a one-hot (or one-over-l ) vector д(x) ∈ [1, l] → R, where l is the size of the alphabet.The alphabet used in our model consists of 70 characters, including 26 English letters, 10 digits,33 other characters, and the new line character. The convolutional kernel function is defined asf (x) ∈ [1,k] → R, where k is the size of the filters. Given the stride of d we can get the convolutionh(y) ∈ [1, [l − k + 1/d]] → R between f (x) and д(x) as follows:
h(y) =k∑
x=1f (x) ◦ д(y ◦ d − x + c) (1)
where c = k−d+1 is an offset constant. This convolutional layer is later connected to a max-poolinglayer, defined as:
h(y)maxpoolinд =maxkx=1 д(y ◦ d − x + c) (2)
The embedding process uses two convolutional layers, each followed by a max pooling layer. Theresulting embedding is fed into two fully-connected layers, which are then concatenated withlayers from other embeddings for the finally psychometric variable classification.
3.2 Representation EmbeddingExamination of rich psychometric dimensions pertaining to diverse user demographics could posechallenges for deep learning methods, particularly in situations involving limited user-generatedtext. Recent work has shown that rich feature-based methods can often attain text classificationperformance levels that are comparable to simple deep learning architectures [65], whereas com-bining the two can often yield enhanced performance [51] [33]. Accordingly, we propose a novelrepresentation embedding that utilizes a rich array of parallel feature representations that capturea bevy of semantic and syntactic information at varying granularities, coupled with grid-based
, Vol. 1, No. 1, Article . Publication date: October 2018.
A Deep Learning Architecture for Psychometric Natural Language Processing 7
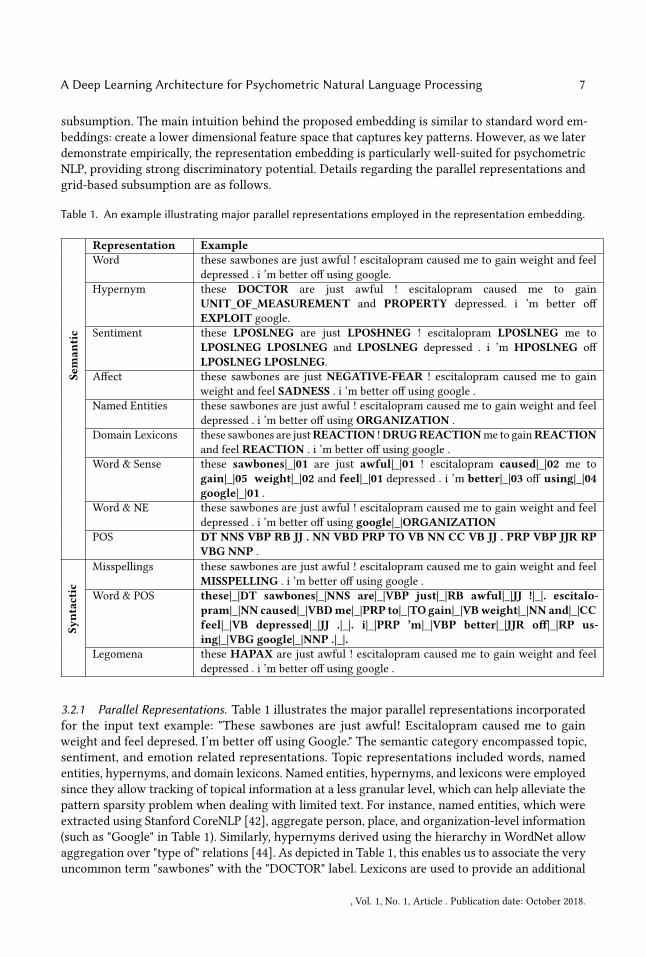
subsumption. The main intuition behind the proposed embedding is similar to standard word em-beddings: create a lower dimensional feature space that captures key patterns. However, as we laterdemonstrate empirically, the representation embedding is particularly well-suited for psychometricNLP, providing strong discriminatory potential. Details regarding the parallel representations andgrid-based subsumption are as follows.
Table 1. An example illustrating major parallel representations employed in the representation embedding.
Representation Example
Seman
tic
Word these sawbones are just awful ! escitalopram caused me to gain weight and feeldepressed . i ’m better off using google.
Hypernym these DOCTOR are just awful ! escitalopram caused me to gainUNIT_OF_MEASUREMENT and PROPERTY depressed. i ’m better offEXPLOIT google.
Sentiment these LPOSLNEG are just LPOSHNEG ! escitalopram LPOSLNEG me toLPOSLNEG LPOSLNEG and LPOSLNEG depressed . i ’m HPOSLNEG offLPOSLNEG LPOSLNEG.
Affect these sawbones are just NEGATIVE-FEAR ! escitalopram caused me to gainweight and feel SADNESS . i ’m better off using google .
Named Entities these sawbones are just awful ! escitalopram caused me to gain weight and feeldepressed . i ’m better off using ORGANIZATION .
Domain Lexicons these sawbones are justREACTION !DRUGREACTIONme to gainREACTIONand feel REACTION . i ’m better off using google .
Word & Sense these sawbones|_|01 are just awful|_|01 ! escitalopram caused|_|02 me togain|_|05 weight|_|02 and feel|_|01 depressed . i ’m better|_|03 off using|_|04google|_|01 .
Word & NE these sawbones are just awful ! escitalopram caused me to gain weight and feeldepressed . i ’m better off using google|_|ORGANIZATION
POS DT NNS VBP RB JJ . NN VBD PRP TO VB NN CC VB JJ . PRP VBP JJR RPVBG NNP .
Syntactic
Misspellings these sawbones are just awful ! escitalopram caused me to gain weight and feelMISSPELLING . i ’m better off using google .
Word & POS these|_|DT sawbones|_|NNS are|_|VBP just|_|RB awful|_|JJ !|_|. escitalo-pram|_|NN caused|_|VBDme|_|PRP to|_|TO gain|_|VBweight|_|NN and|_|CCfeel|_|VB depressed|_|JJ .|_|. i|_|PRP ’m|_|VBP better|_|JJR off|_|RP us-ing|_|VBG google|_|NNP .|_|.
Legomena these HAPAX are just awful ! escitalopram caused me to gain weight and feeldepressed . i ’m better off using google .
3.2.1 Parallel Representations. Table 1 illustrates the major parallel representations incorporatedfor the input text example: "These sawbones are just awful! Escitalopram caused me to gainweight and feel depresed. I’m better off using Google." The semantic category encompassed topic,sentiment, and emotion related representations. Topic representations included words, namedentities, hypernyms, and domain lexicons. Named entities, hypernyms, and lexicons were employedsince they allow tracking of topical information at a less granular level, which can help alleviate thepattern sparsity problem when dealing with limited text. For instance, named entities, which wereextracted using Stanford CoreNLP [42], aggregate person, place, and organization-level information(such as "Google" in Table 1). Similarly, hypernyms derived using the hierarchy in WordNet allowaggregation over "type of" relations [44]. As depicted in Table 1, this enables us to associate the veryuncommon term "sawbones" with the "DOCTOR" label. Lexicons are used to provide an additional
, Vol. 1, No. 1, Article . Publication date: October 2018.
8 F. Ahmad, A. Abbasi, J. Li, D.G. Dobolyi, R.G. Netemeyer, G.D.Clifford and H. Chen
dimension for semantic abstraction. In the health domain example presented in Table 1, lexiconsrelated to common prescription drug names and adverse reactions are incorporated and used toreplace words appearing in the respective lexicon term lists (e.g., the drug escitalopram).
A key aspect of these representations is that they all have the same length (i.e., an equal number oftokens). This property allows these "parallel" representations to bemerged into feature combinations.Within the semantic category, words are merged with sense tags derived using WordNet in orderto allow better word sense disambiguation. Similarly, words can be combined with named entities(e.g., "Google" and "organization") to provide varying levels of granularity.
Additional semantic categories incorporated were sentiment and affect. Sentiment allows us togauge users’ levels of subjectivity and sentiment polarity. Words were mapped to their respectiveword sense’s positive and negative sentiment polarity scores in SentiWordNet [7]. These scoreswere grouped into high/medium/low bins, resulting in nine potential sentiment polarity tags. Forinstance, the word "awful" has high negative polarity and a low positive polarity score. Similarly,words were mapped to affect category tags based on WordNet Affect [55]. In the example presentedin Table 1, the word "depressed" gets mapped to the SADNESS emotion category.
The syntactic representations incorporated were parts of speech (POS) tags, words combined withPOS tags, misspellings, and legomena. Misspellings are a major source of sparsity and noise in short,user-generated texts. Accordingly, spellchecking with support for word important psychometriccues, the misspelling representation was included. In Table 1, the misspelled input "depresed"is corrected for all representations and noted with the MISSPELLING tag. Consistent with priorstudies, legomena were included in order to alleviate sparsity attributable to once-appearing wordsin the training set (e.g. "sawbones)" with a HAPAX tag [2]. The combination of words with theirrespective parts of speech were included as an additional layer of word disambiguation [3].
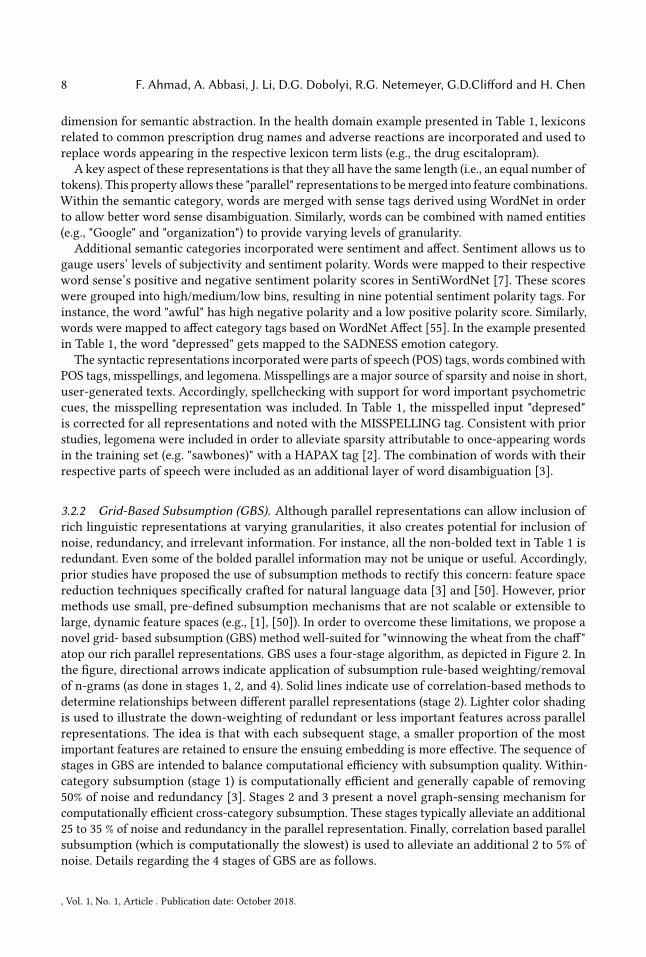
3.2.2 Grid-Based Subsumption (GBS). Although parallel representations can allow inclusion ofrich linguistic representations at varying granularities, it also creates potential for inclusion ofnoise, redundancy, and irrelevant information. For instance, all the non-bolded text in Table 1 isredundant. Even some of the bolded parallel information may not be unique or useful. Accordingly,prior studies have proposed the use of subsumption methods to rectify this concern: feature spacereduction techniques specifically crafted for natural language data [3] and [50]. However, priormethods use small, pre-defined subsumption mechanisms that are not scalable or extensible tolarge, dynamic feature spaces (e.g., [1], [50]). In order to overcome these limitations, we propose anovel grid- based subsumption (GBS) method well-suited for "winnowing the wheat from the chaff"atop our rich parallel representations. GBS uses a four-stage algorithm, as depicted in Figure 2. Inthe figure, directional arrows indicate application of subsumption rule-based weighting/removalof n-grams (as done in stages 1, 2, and 4). Solid lines indicate use of correlation-based methods todetermine relationships between different parallel representations (stage 2). Lighter color shadingis used to illustrate the down-weighting of redundant or less important features across parallelrepresentations. The idea is that with each subsequent stage, a smaller proportion of the mostimportant features are retained to ensure the ensuing embedding is more effective. The sequence ofstages in GBS are intended to balance computational efficiency with subsumption quality. Within-category subsumption (stage 1) is computationally efficient and generally capable of removing50% of noise and redundancy [3]. Stages 2 and 3 present a novel graph-sensing mechanism forcomputationally efficient cross-category subsumption. These stages typically alleviate an additional25 to 35 % of noise and redundancy in the parallel representation. Finally, correlation based parallelsubsumption (which is computationally the slowest) is used to alleviate an additional 2 to 5% ofnoise. Details regarding the 4 stages of GBS are as follows.
, Vol. 1, No. 1, Article . Publication date: October 2018.
A Deep Learning Architecture for Psychometric Natural Language Processing 9
Fig. 2. A four-stage grid-based subsumption (GBS) algorithm
Stage 1 of GBS is mostly consistent with prior subsumption methods [3], [50], where onlyhigher-order n-grams with enhanced discriminatory potential are retained over their lower-ordern-gram feature counterparts within the same-representation. Given the set ofm representationsR = {r1, r2, ..., rm} , where each rx signifies a parallel representation described in Table 1 (e.g.,word), we extract all n-gram features such that any fi jx element in feature set F represents the ithfeature in n-gram category j for representation rx , and fi jx is initially weighted as follows:
w(fi jx ) = maxca,cb
(p(fi jx |ca)loд(p(fi jx |ca)
p(fi jx |cb ))) + s(fi jx ) (3)
where ca and cb are amongst the set of C class labels, ca , cb , y is one of the d tokens in fi jxwith w possible word senses, and function s is the mean semantic orientation score across alltoken-senses, computed as the difference between the positive and negative polarity scores forsense q of token fi jx in SentiWordNet:
s(fi jx ) =d∑
y=1
w∑q=1
pos(fi jx ,q) − neд(fi jx ,q)
dw(4)
, Vol. 1, No. 1, Article . Publication date: October 2018.
10 F. Ahmad, A. Abbasi, J. Li, D.G. Dobolyi, R.G. Netemeyer, G.D.Clifford and H. Chen
The first part of the weighting equation considers the discriminatory potential of the feature basedon its log-likelihood ratio, whereas the second part factors in the semantic orientation to ensurethat features with opposing orientation (e.g., "like" versus "don’t like") are differentiated in terms ofoverall weights and when making subsumption decisions. Once features are weighted, the withinrepresentation rx subsumption is performed as follows. Each n-gram feature fi jx withw(fi jx ) > 0is compared against each lower-order n-gram feature fuvx , where v < j, w(fuvx ) > 0, and fuvxcontains some sub-sequence of tokens from fi jx . If c(fi jx ) = c(fuvx ), where:
c(fi jx ) = arдmaxca,cb (p(fi jx |ca)loд(p(fi jx |ca)
p(fi jx |cb ))) + s(fi jx ) (5)
Then we determine whether to subsume the higher order n-gram as follows, where t is a subsump-tion threshold:
w(fi jx ) =
{0 i f w(fi jx ) ≤ w(fuvx ) + t
w(fi jx ) otherwise(6)
Stage 2 entails cross-representation subsumption. Prior studies have relied on manually craftedsubsumption graphs encompassing predefined representations and relation links (e.g., [46], [12]).In order to make the subsumption process more dynamic and extensible across an array of novelpsychometric dimensions, we propose a graph construction approach. For each unique pair ofrepresentations rx and rz in R, let A and B signify randomly selected subsets of m features fromthese representations where each fi jx ∈ A and fuvz ∈ B is such that j,v = 1 (i.e., only unigramfeatures). Since representations vary with respect to feature frequency and co-occurrence patterns,it is important to factor in such nuances by considering within category similarities when makingcross-category comparisons. We use k-Means clustering to find the ideal partition over the 2mfeature sample encompassing all elements in AUB. With k = 2, this results inG = {д1,д2} clusters.A link is formed between rx and rz if the cross-cluster entropy reduction ratio attributable torepresentation affiliation information is below a certain threshold:
L(rx , rz ) =
1 i f
H (G |r )
H (G)≤ l
0 otherwise(7)
where H (G) is the entropy across clusters and H (G |r ) is:
H (G |r ) = −∑
r={rx ,rz }
P(r )∑д∈G
P(д |r )loд2P(д |r ) (8)
In Stage 3, once links are formed between representations as described in equation 7, cross-representation subsumption between any pair of rx and rz where L(rx , rz ) = 1 is performedsimilarly to the approach described in equations 5 and 6 of Stage 1. Since the links are bidirec-tional, L(rx , rz ) = L(rz , rx ). Hence, two-way comparisons are made, where each remaining fi jxwith w(fi jx ) > 0 in rx is compared against each lower-order n-gram feature fuvz where v < j,w(fuvz ) > 0, and fuvz contains some sub-sequence of tokens from fi jx , and then, each remainingfuvz withw(fuvz ) > 0 in rz is compared against its lower-order n-gram counterparts in rx meetingthe same criteria.
Finally, in Stage 4, we account for highly correlated non-subsuming cross-representation features.For each pair of rx and rz where L(rx , rz ) = 1, each remaining fi jx with w(fi jx ) > 0 in rx iscompared against all remaining fuvz in rz with weight greater than 0, where j = v . If the correlationbetween fi jx and fuvz is greater than threshold p,w(fi jx ) = 0.
, Vol. 1, No. 1, Article . Publication date: October 2018.

A Deep Learning Architecture for Psychometric Natural Language Processing 11
3.2.3 Embedding and BiLSTM. For each representation, we use word2vec to learn an l sizedembedding vector for each token in that representation’s data. However, only tokens withw(fi jx ) =0 are included. For all other tokens, the embedding vector is replaced with a vector comprised of0s. This embedding is then fed into a Bi-LSTM layer to learn the sequential dependency amongwords. Given a sequence of words x1,x2, ...,xt , ...,xT , where is xt a vector for word embedding,RNN learns the hidden features of each word based on all previous words in the sequence.
ht = σ (W hhht−1 +Whxxt + b) (9)
whereW hh is the weights matrix based on the previous hidden features ht−1 andW hx is the weightsmatrix based on the input word vector xt , b is a bias term, and σ is a non-linearity function. Theequation above learn the hidden features based on previous words. Additionally, we can also createhidden features by learning features based on next words, which is formulated as follows:
ht = σ (W hhht+1 +Whxxt + b) (10)
RNNs can theoretically capture long-term dependencies, but are hard to accomplish this in realitydue to the gradient vanishing problem. LSTM uses input, forget, output gates to maintain morepersistent memory to capture the long-term dependencies. It is formulated as follows:
it = σ (W (i)X (t ) +U (i)h(t−1)) (11)
ft = σ (W (f )X (t ) +U (f )h(t−1)) (12)
ot = σ (W (o)X (t ) +U (o)h(t−1)) (13)
c∼t = tanh(W (c)X (t ) +U (c)h(t−1)) (14)
ct = ft ◦ ct−1 + it ◦ c∼t (15)
ht = ft ◦ tan(ct ) (16)whereW (i),W (f ),W (o),W (c),U (i),U (f ),U (o), and U (c) are weights matrices depending on the inputword vector and preceding hidden features. The Bi-LSTM is later concatenated with hidden featuresof other embeddings as well as a softmax trained on weighted vectors where binary presence of "1"is replaced withw(fi jx ) for each token in the text.
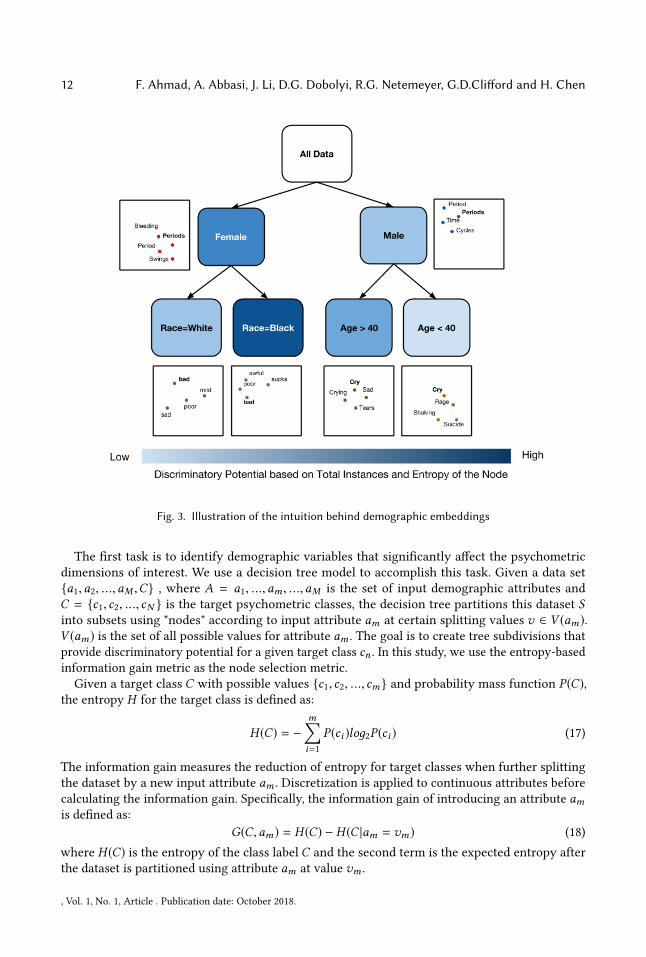
3.3 Demographic EmbeddingDemographics can have a profound impact on individuals’ language usage tendencies and psycho-metric characteristics [8]. We build a novel demographic word- embedding to capture nuances andnorms inherent to different demographic segments. More specifically, the demographic embed-ding identifies segments with the greatest entropy for a target psychometric dimension such thatmodeling within versus across such demographics may alleviate systematic bias [21] and enhanceclassification potential by better aligning embeddings with users’ underlying semantic intent. Figure3 illustrates the key intuition behind the demographic embeddings, which are somewhat analogousto the segment-specific modeling idea espoused by techniques such as classification and regressiontrees (CART). Using real data and the demographic embedding described in this section, the figureshows how constructing embeddings within text associated with demographics such as gender, age,and race can alter the word embedding space. For instance, depending on the gender of the writer,terms such as "period" and "periods" can connote biological versus temporal meaning. Words suchas "bad" can signify stronger emotional valence when used by certain races. Similarly, the word"cry" may be associated with varying health and wellness implications depending on the user’sage. The demographic embedding attempts to calibrate users’ embeddings based on various suchdemographic considerations. Details are as follows.
, Vol. 1, No. 1, Article . Publication date: October 2018.
12 F. Ahmad, A. Abbasi, J. Li, D.G. Dobolyi, R.G. Netemeyer, G.D.Clifford and H. Chen
Fig. 3. Illustration of the intuition behind demographic embeddings
The first task is to identify demographic variables that significantly affect the psychometricdimensions of interest. We use a decision tree model to accomplish this task. Given a data set{a1,a2, ...,aM ,C} , where A = a1, ...,am , ...,aM is the set of input demographic attributes andC = {c1, c2, ..., cN } is the target psychometric classes, the decision tree partitions this dataset Sinto subsets using "nodes" according to input attribute am at certain splitting values v ∈ V (am).V (am) is the set of all possible values for attribute am . The goal is to create tree subdivisions thatprovide discriminatory potential for a given target class cn . In this study, we use the entropy-basedinformation gain metric as the node selection metric.Given a target class C with possible values {c1, c2, ..., cm} and probability mass function P(C),
the entropy H for the target class is defined as:
H (C) = −
m∑i=1
P(ci )loд2P(ci ) (17)
The information gain measures the reduction of entropy for target classes when further splittingthe dataset by a new input attribute am . Discretization is applied to continuous attributes beforecalculating the information gain. Specifically, the information gain of introducing an attribute amis defined as:
G(C,am) = H (C) − H (C |am = vm) (18)where H (C) is the entropy of the class label C and the second term is the expected entropy afterthe dataset is partitioned using attribute am at value vm .
, Vol. 1, No. 1, Article . Publication date: October 2018.
A Deep Learning Architecture for Psychometric Natural Language Processing 13
For the demographic embedding, we build two types of decision trees. The first type utilizesall demographic variables, termed as "global tree" Tд . The second type consists of a collection of"local trees" Tl j , each of which excludes one among the demographic variables. In the same spiritas the random forest algorithm [9], these local trees build on a random subset of input attributes toalleviate the possible dependency on a few dominant attributes. In order to be computationallyfeasible, we employ a binary tree structure and use depth parameter d = 1, 2, ...,D to control thetree size. The demographic trees are formulated as follows:
Tд = {am = vm |a ∈ A,ht(Tд) = d} (19)
Tl j = {am = vm |a ∈ A, {ai },ht(Tl j = d)} (20)where ht() is the height function of the tree. The most prominent demographic conditions affectingthe psychometric classes are selected based on node score I .
I (am = vm) =NA(am = vm)
H (C |am = vm)+N (am = vm)
N (S)(21)
where am = vm is the node representing a condition defined by an attribute am and its splittingvalue vm (e.g., Age = 35); NA(am = vm) is the average of the accuracies of all the leaves underneaththis node; H (C |am = vm) is the entropy with regards to class label for this node; N (am = vm) isthe number of data points belong to this node; and N (S) is the total number of data points in thedata set.
The final set of demographic conditionsM incorporated include the root node of the global treeand the top K − 1 nodes (ranked by node score I ) from the local trees:
M = {a0 = v0 |Tд}U {am = vm |Tlk , l(am = vm) ∈ rt l (I1, I2, ..., IK−1)} (22)
where a0 = v0 |Tд is the root node condition for the global tree and rt l (I1, I2, ..., IK−1 is the top K − 1node scores for the local trees. The demographic embedding leverages this information as follows:(1) Letmk represent one of the K elements inM . For eachmk , we identify a subset of individuals
satisfying that condition in the training set and construct a sub-corpus comprising text onlybelonging to those individuals. We use word2vec to learn an l-sized word embedding vectorfor each word j in the sub-corpusmk such thatwk j = (wk j1,wk j2, ...,wk jl ). We also train ageneral word embedding across each word in the entire training setw j = (w j1,w j2, ...,w jl ).
(2) For each individual ui , we can identify the subset Ms = {m1,m2, ...,ms |m ∈ M} of demo-graphic conditions applicable to that user. Following the average embedding idea [61], thedemographic embedding weightwdi j for word j appearing in a text instance associated withindividual ui is defined as the weighted average of node score Iw and the node-specific wordembeddingws j :
wdi j =
(∑ |Ms
s Iw ∗ws j )
|Ms |i f |Ms | > 0
wdi j i f |Ms | = 0(23)
As discussed earlier in the beginning of the section using a small real-data based illustration,demographic embeddings allow the word embeddings for a user to be calibrated based on the user’sdemographics. The visuals appearing in Figure 3 are naturally illustrative, not exhaustive. Figure4 delves deeper by showing another example of how that calibration looks, in this case for usersabove or below the age of 40. From the figure we can see that words such as "drive", "crying", and"old" have different semantic connotations for different age groups. As we later demonstrate inthe evaluation section, the inclusion of such demographic embeddings can allow more precise
, Vol. 1, No. 1, Article . Publication date: October 2018.

14 F. Ahmad, A. Abbasi, J. Li, D.G. Dobolyi, R.G. Netemeyer, G.D.Clifford and H. Chen
representation of words that might otherwise be susceptible to mean-centering across diversesubsets of the user population when modeled using a single global word embedding.
Fig. 4. Example embedding calibration based on demographics
3.4 Structural Equation Model (SEM) EncoderPsychometric dimensions are inherently correlated. For example, a patient with high anxietyassociated with seeing a physician may also have low self-esteem [22]. In order to incorporatesuch secondary psychometric dimension information in PyNDA, we propose a novel StructuralEquation Model (SEM) encoder. The underlying intuition behind our encoder is similar to thefeature augmentation idea commonly used in multi-task learning, which and has been shown tooffer significant performance lifts. Similarly, as illustrated in the ablation analysis in Section 4, ourSEM encoder significantly enhances performance for classification of psychometric dimensions.Details are as follows. . In order to incorporate such secondary psychometric dimension informationin PyNDA, we propose a novel Structural Equation Model (SEM) encoder. The underlying intuitionbehind our encoder is similar to the feature augmentation idea commonly used in multi-tasklearning, which and has been shown to offer significant performance lifts. Similarly, as illustratedin the ablation analysis in Section 4, our SEM encoder significantly enhances performance forclassification of psychometric dimensions. Details are as follows.SEM is a general multivariate statistical modeling technique to depict and test relationships
among variables related to psychometric measures [36]. It models the psychometric dimensions aslatent variables and discovers their most suitable relationships based on data. Figure 5 illustratesthe important components of an SEM. The circles represent latent variables (or psychometricdimensions), whereas the straight arrows signify the relationships between them. P denote thepath coefficients for relationships. R2 is the variance explained in a consequent variable by a set ofantecedent variables. Model fit refers to the ability of an SEM model to fit the data. Common modelfit indices include Comparative Fit Index (CFI), Tucker Lewis Index (TLI) and Root Mean SquaredError of Approximation (RMSEA). CFI and TLI are comparative fit indices that compare the modelof interest with an alternative, such as a null model. They range between zero and one, with a
, Vol. 1, No. 1, Article . Publication date: October 2018.

A Deep Learning Architecture for Psychometric Natural Language Processing 15
higher value indicating a better fit. RMSEA is an absolute measure of fit based on the non-centralityparameter. Higher RMSEA indicates poor model fit. The SEM encoder aims to incorporate these
Fig. 5. Structural equation models for psychometric dimensions
multivariate, structured correlations between psychometric dimensions into PyNDA. Specifically,we build a series of SEM models for a given target psychometric dimension of interest alongwith other dimensions potentially affecting it. Let S represents a set of SEM models for a targetpsychometric dimension. Each modelGi in S can be considered a directed graph containing latentvariables (or nodes) and directed links, arranged in a linear sequence with K levels and J nodesfor each level such that node nk j at level k ≥ 1 connects to each nk+1j in the next level. P is thepath coefficient from an antecedent nk j leading to a consequent variable nk+1j with variance R2
across all of its inbound antecedent links from level k . The target psychometric dimension onlyappears in level k ≥ 2 to ensure it has antecedent variables and valid P and R2. For each Gi , wecan obtain the model fit indices CFI, TLI and RMSEA. In order to include a balanced model fitmeasure, we useMF = (CFI +TLI + (1 − RMSEA))/3 to depict the average model fit indices. Foreach non-target variable v ∈ V , we find a subset S∗ of all the SEM models containing them. We usea scoring function which weights path coefficients and model fit indices equally to summarize therelevance of any v to the target variable:
w(v) =1S∗
|∑S∗
P | +1
2|S∗ |(∑S∗
R2 +∑S∗
MF ) (24)
Finally, for each target variable we can derive the top K from V based onw(v) values. In order toavoid future leaks, we assume that V is unknown for test instances and must be predicted. Hence,a model is built on the training data to jointly score each selected v . This is done using a standardword embedding, followed by a Bi-LSTM layer and a fully-connected dense layer to classify theselected independent variables. The learned dense layer is then directly concatenated with the onesyielded by other etmbeddings to classify the target psychometric dimensions of interest.
3.5 Structural Multitask LearningGiven the user-centric nature of psychometric analysis, structural relationships among targetpsychometric measures provide a unique opportunity for multitask learning. For example, if "trustin doctors" and "anxiety of seeing physicians" are correlated, we can share their input text featuresand jointly train the two classifiers together to augment the feature set for the current task. Notably,the relationship amongst psychometric measures follows a hierarchical structure, as discussed inthe SEM encoder section. Therefore, we can build a structural feature sharing representation toreflect this unique property.
, Vol. 1, No. 1, Article . Publication date: October 2018.

16 F. Ahmad, A. Abbasi, J. Li, D.G. Dobolyi, R.G. Netemeyer, G.D.Clifford and H. Chen
Figure 6 presents our proposed MTL approach. Suppose we have four target variables of interest,and wish to share features amongst them. Following [41], we create "separate LSTMs" comprisingtask-specific features and a single "shared LSTM" as a cross-task representation that reflects commonpatterns and cues across the different classification tasks. We jointly train these classifiers to allowfeature sharing. In order to maintain orthogonality between shared and separate representations[41], adversarial training is used to optimize the purity of the shared representations. The idea isto build two neural networks, generator and discriminator, to combat one another. The generatortries to generate the purest shared feature set, while the discriminator attempts to distinguish theshared features into specific tasks. In our case, the single "shared LSTM" is used as the generatorthat works adversarially against a multi-layer perceptron as the discriminator. For the generatorto learn to purify the shared feature set, it needs the gradients from the discriminator which arepropagated back via a "Gradient Reversal Layer (GRL)" [26]. GRL applies an identity function onthe inputs in the forward pass and sends the negative gradients back in the backward pass, whichenables learning in the generator network. To train the discriminator, we simply map the sharedrepresentations into a probability distribution predicting what kinds of tasks can be inferred. Crossentropy loss is used to train the discriminator.
The tension between two networks results in convergence when the discriminator is no longerable to perform such differentiation, thereby resulting in better feature sharing. Collectively, this isaccomplished via the loss function L = LTask + λLAdv +γLDif f . As depicted in Figure 4, we extendthis idea for our context in two ways. First, we perform MTL across various components of ourarchitecture, including the final concatenation layer, demographic embedding LSTM, representationembedding LSTM, and character CNN:
LTask =K∑k=1
αk L(x(k),y(k)) (25)
where L(x(k),y(k)) is the cross-entropy of the true/predictions distributions on the trainingset, K is the product of the tasks and architecture components, and k is a given task-architecturecomponent with a learned weight αk . This allows flexibility in accounting for interaction effectsbetween and across tasks and architecture components in our MTL setup.
Fig. 6. Structural multitask learning for psychometric dimensions
, Vol. 1, No. 1, Article . Publication date: October 2018.

A Deep Learning Architecture for Psychometric Natural Language Processing 17
Second, we perform cross-task training instance alignment by minimizing the distance betweenconcurrent inputs (e.g., anxiety and trust text instances). Since back propagation occurs across alltasks via the unified loss function, the idea is to input texts from different tasks that are similar onpsychometric dimensions in order to challenge the discriminator (i.e., LAdv ). For instance, giventhe target task variable is anxiety, for an input instance with high anxiety, we may wish to pairit with a low or high trust text instance from a different user that also has high anxiety. Sinceminimizing such distance between concurrent training instances is an NP-hard problem, we use asimple greedy heuristic where the tasks concurrent to the target are ranked based on theirw(v) asdefined in Eq. 25. The target tasks’ training instances are then paired with the non-target task withthe highest w(v) based on Euclidean distance between users’ psychometrics. These tuples are thencompared with instances from the next task based on minimal distance, and so on, resulting inconcurrent instance sets that are somewhat homogenous across psychometric dimensions, allowingMTL to learn richer separate and shared features. As later demonstrated in the ablation analysis,structural multitask learning with adversarial training provides an additional performance lift forour psychometric extraction tasks.
4 TESTBEDIn order to evaluate the proposed PyNDA architecture, an extensive research testbed was con-structed, comprising three data sets and eleven total classification tasks. While psychometrics areknown to be important in various application domains including security and e-commerce, inthis study we focused on the health domain. The first two datasets encompassed four importantpsychometric dimensions known to be predictive of health outcomes.
1) Health Literacy (HL) - In essence, HL is a subjective construct reflecting how much one thinksone knows about health [46]. Low HL has been associated with increased mortality, increasedhospitalization, and poor adherence and self-maintenance to a host of chronic diseases such asdiabetes, heart disease, and risk of stroke [46].
2) Health Numeracy (HN) - Conversely, health numeracy (HN) is an objective construct reflectingthe ability to calculate, use, and understand numeric and quantitative concepts in the context ofhealth issues. HN has been associated with outcomes such as the ability to understand dosage inmedication and adherence to treatment [14].
3) Trust in Doctors (TD) - Perceptions of trust in physicians/doctors (TD) can have an importantmediating role on health outcomes [22].4) Anxiety Visiting Doctors (AV) - Anxiety when visiting the doctor’s office is another strong
mediator for health outcomes such as future doctor’s visits and wellness [54].For each of the four aforementioned psychometric dimensions (HL, HN, TD, and AV), well-
established survey items have been developed in the literature. These items can be used to computeindividuals’ scores on a fixed continuous scale (e.g., 1-10). In order to construct our user-generatedtext datasets, we developed equivalent free response questions with accompanying text boxes thatimmediately followed the survey items. These questions were validated through pre-testing andwere found to nicely represent the target variable for each users’ collected text.
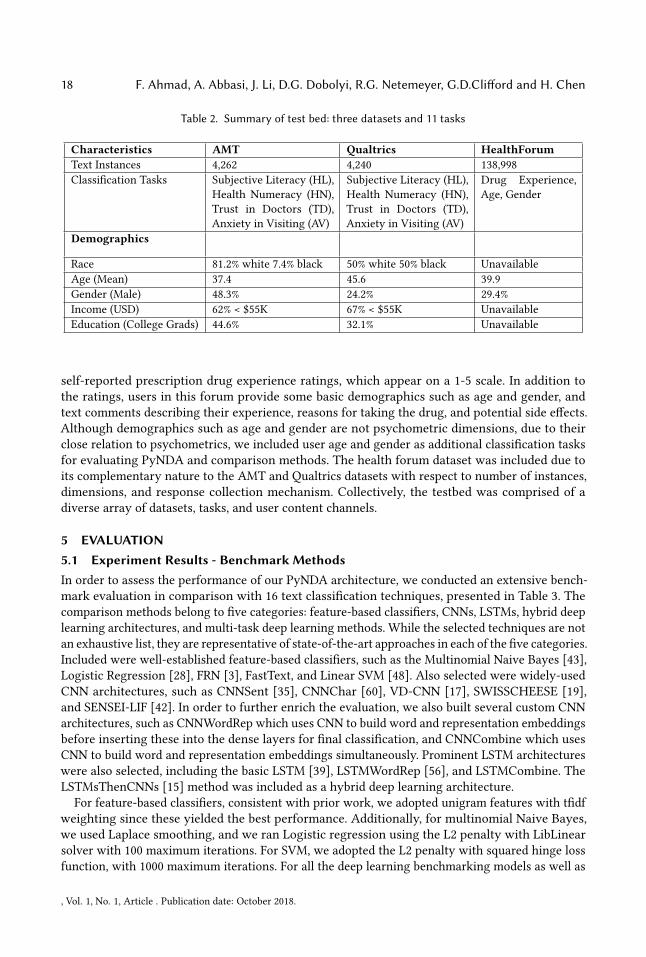
Table 2 summarizes the three datasets and related classification tasks incorporated in our testbed.Consistent with several prior psychometric and NLP studies, for our first dataset we used AmazonMechanical Turk (AMT) since it is considered somewhat representative of the broader Internetpopulation. Each respondent provided quantitative and text responses for all four target dimensionsof interest, some additional secondary dimensions, plus demographics such as age, gender, race,income, etc. A total of 4,262 usable user responses were collected.The third data set was comprised of 138,998 user drug experience assessments collected from
an online health forum. The major psychometric dimension of interest in this dataset was users’
, Vol. 1, No. 1, Article . Publication date: October 2018.
18 F. Ahmad, A. Abbasi, J. Li, D.G. Dobolyi, R.G. Netemeyer, G.D.Clifford and H. Chen
Table 2. Summary of test bed: three datasets and 11 tasks
Characteristics AMT Qualtrics HealthForumText Instances 4,262 4,240 138,998Classification Tasks Subjective Literacy (HL),
Health Numeracy (HN),Trust in Doctors (TD),Anxiety in Visiting (AV)
Subjective Literacy (HL),Health Numeracy (HN),Trust in Doctors (TD),Anxiety in Visiting (AV)
Drug Experience,Age, Gender
Demographics
Race 81.2% white 7.4% black 50% white 50% black UnavailableAge (Mean) 37.4 45.6 39.9Gender (Male) 48.3% 24.2% 29.4%Income (USD) 62% < $55K 67% < $55K UnavailableEducation (College Grads) 44.6% 32.1% Unavailable
self-reported prescription drug experience ratings, which appear on a 1-5 scale. In addition tothe ratings, users in this forum provide some basic demographics such as age and gender, andtext comments describing their experience, reasons for taking the drug, and potential side effects.Although demographics such as age and gender are not psychometric dimensions, due to theirclose relation to psychometrics, we included user age and gender as additional classification tasksfor evaluating PyNDA and comparison methods. The health forum dataset was included due toits complementary nature to the AMT and Qualtrics datasets with respect to number of instances,dimensions, and response collection mechanism. Collectively, the testbed was comprised of adiverse array of datasets, tasks, and user content channels.
5 EVALUATION5.1 Experiment Results - Benchmark MethodsIn order to assess the performance of our PyNDA architecture, we conducted an extensive bench-mark evaluation in comparison with 16 text classification techniques, presented in Table 3. Thecomparison methods belong to five categories: feature-based classifiers, CNNs, LSTMs, hybrid deeplearning architectures, and multi-task deep learning methods. While the selected techniques are notan exhaustive list, they are representative of state-of-the-art approaches in each of the five categories.Included were well-established feature-based classifiers, such as the Multinomial Naive Bayes [43],Logistic Regression [28], FRN [3], FastText, and Linear SVM [48]. Also selected were widely-usedCNN architectures, such as CNNSent [35], CNNChar [60], VD-CNN [17], SWISSCHEESE [19],and SENSEI-LIF [42]. In order to further enrich the evaluation, we also built several custom CNNarchitectures, such as CNNWordRep which uses CNN to build word and representation embeddingsbefore inserting these into the dense layers for final classification, and CNNCombine which usesCNN to build word and representation embeddings simultaneously. Prominent LSTM architectureswere also selected, including the basic LSTM [39], LSTMWordRep [56], and LSTMCombine. TheLSTMsThenCNNs [15] method was included as a hybrid deep learning architecture.
For feature-based classifiers, consistent with prior work, we adopted unigram features with tfidfweighting since these yielded the best performance. Additionally, for multinomial Naive Bayes,we used Laplace smoothing, and we ran Logistic regression using the L2 penalty with LibLinearsolver with 100 maximum iterations. For SVM, we adopted the L2 penalty with squared hinge lossfunction, with 1000 maximum iterations. For all the deep learning benchmarking models as well as
, Vol. 1, No. 1, Article . Publication date: October 2018.
A Deep Learning Architecture for Psychometric Natural Language Processing 19
PyNDA, we tuned the settings and parameter values on a validation set. The text representationsfor all benchmarking deep learning models were those used in the original studies.
All methods were evaluated using 5-fold cross validation (with 80% training and 20% testing perfold). For PyNDA, hyper-parameters were tuned lightly on a validation subset within the trainingdata. For comparison methods, a more in-depth combination of grid and random search was used inorder to ensure a fair comparison, and that PyNDA’s performance lift was not simply attributableto parameter settings.Using this process, for Fasttext [43], a learning rate of 0.001 was used. For CNNSent [28], the
batch size was set to 6 and the number of dimensions for the word embedding were 128. ForSENSEI-LIF [23], 128 dimensional embeddings were utilized along with 64 filters in the CNN. TheLSTMsThenCNNs [57] was run with 1 layer for both CNN and LSTM, with 64 filters in the CNNand 128 nodes per layer in the LSTM. VeryDeepCNN [65] performed best using a 3 layer CNN with64 filters per layer. CNNChar [37] also performed best with 1 layer and 64 filters. SWISSCHEESE[42] was run with 2 layers and 128 dimensional embeddings. For all comparison methods withCNNs, we tried different kernel sizes (3,5,7,12) and found size=7 to typically work the best forbenchmark techniques.
The parameter settings for our proposed architecture were as follows. For the character embed-ding, we used one hot encoding - the CNN embedding consisted of two layers of 1d convolutionfilters followed by maxpooling layers. We used 128 filters for each layer with a kernel size of 7and maxpool size of 3. The BiLSTM layers for representation and demographic embedding usedtwo layers of bidirectional LSTMs with 128 units in each layer. Finally, the dense layers for all theembeddings consisted of two fully connected layers with 256 units, each. Regularization was doneusing a dropout value of 0.5. We used a batch size of 16, and 10 epochs.For parallel representations, n-grams up to n=4 were extracted for representations depicted in
Table 1. For GBS, the subsumption threshold t was set to 0.05, and the cross-category thresholds land p were each set to 0.95. For the SEM encoder, K was learned dynamically from the trainingdata for each fold of a given target psychometric dimension, and ranged between 2 and 8. For ourMTL method, we set λ and γ to 0.05 and 0.01 as done in [41].
Bifurcation was performed on each dataset to convert the continuous psychometric target classvariables into binary high/low classification variables. Consistent with prior studies, this was doneby only using instances from the end quartiles as the low and high class labels, respectively.
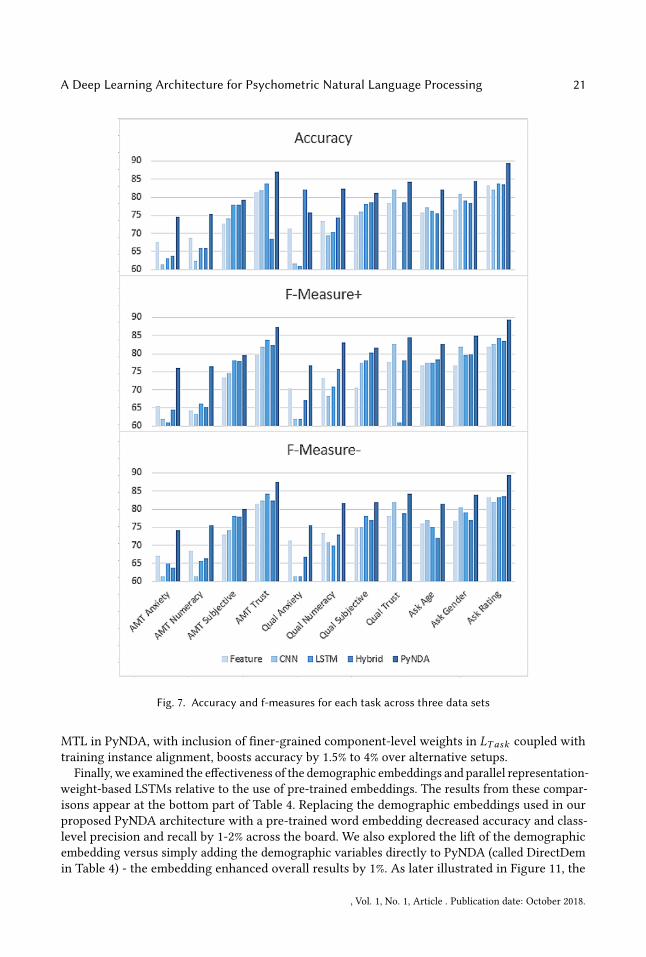
Table 3 presents the PyNDA results along with the 16 benchmarking methods, averaged acrossthe eleven datasets. PyNDA significantly outperformed the benchmarking methods across allevaluation metrics, including accuracy, precisions, recalls and receiver operating characteristiccurve area-under-the-curve (ROC). The overall accuracy, F-measures, and ROC for PyNDA were atleast 5 percent higher than the second best method. Among benchmarking methods, LSTM archi-tectures were better than CNN, underscoring the importance of capturing long-term dependenciesamong texts for more effective psychometric classification. CNNChar yielded the worst results,suggesting that morphological patterns may not be critical indicators for psychometric-relatedtexts. Instead, word or sentence level features may have more predictive power, as illustrated bythe relatively higher performance for CNNSent and CNNWord. Given the recent effectiveness ofCNN approaches in sentiment classification tasks (e.g., [42], [19]), the relative superiority of LSTMin our context reinforces previously stated notions of complexity of the nuanced psychometricdimensions examined in our study. Feature-based classifiers demonstrated reasonable performance,relative to alternative benchmarking methods.Figure 7 depicts the accuracy and F-measures of the best method for each category, broken
down by the eleven psychometric classification tasks across the three datasets. In general, PyNDAoutperformed the second- best methods on ten (out eleven) measures regarding accuracy, all
, Vol. 1, No. 1, Article . Publication date: October 2018.

20 F. Ahmad, A. Abbasi, J. Li, D.G. Dobolyi, R.G. Netemeyer, G.D.Clifford and H. Chen
Table 3. Summary of benchmark results
CategoryMethod Accuracy Precision
+HighPrecision-Low
Recall+High
Recall-Low
Fscore+High
Fscore-Low
ROCAUC
Feature
FastText [34] 73.9 73.4 74.4 74.9 72.9 74.2 73.6 73.9FRN [3] 74.9 73.0 75.0 74.3 74.8 73.7 74.9 74.9Linear SVM [48] 73.5 73.3 73.7 73.8 73.1 73.6 73.4 73.5LogisticRegression [28] 74.6 73.9 75.6 76.1 73.2 75.0 74.3 74.7Multinomial NB [43] 73.4 72.9 74.8 75.7 71.2 74.3 72.9 73.5
CNN
CNNSent [35] 74.4 73.4 76.4 77.9 70.8 75.6 73.5 74.4CNNChar [60] 66.6 66.2 68.0 69.4 63.7 67.8 65.8 66.6CNNWordRep 73.6 73.4 74.4 74.7 72.6 74.0 73.5 73.6CNNCombine 73.2 72.2 74.7 75.2 71.1 73.7 72.8 73.2SENSEI-LIF [42] 73.4 73.2 74.1 74.4 72.3 73.8 73.2 73.4SWISSCHEESE [19] 74.1 73.6 73.9 76.3 71.8 74.9 72.9 74.1VeryDeepCNN [17] 58.9 58.1 60.4 63.2 54.2 60.5 57.1 58.7
LSTMLSTM [39] 72.6 72.5 73.5 73.5 71.8 72.9 72.6 72.6LSTMCombine 74.8 74.8 75.1 75.5 74.1 75.2 74.6 74.8LSTMWordRep [56] 74.5 74.6 74.7 74.6 74.3 74.6 74.5 74.4
Hybrid LSTMsThenCNNs [15] 75.1 74.1 76.8 77.6 72.5 75.8 74.5 75.1PyNDA 81.1 80.2 82.1 82.7 79.4 81.4 80.7 81.0
measures in terms of F-measure for the positive class and ten measures for F-measure for negativeclass. Collectively, the results showcase the efficacy and utility of our proposed architecture. Theresults also suggest that the amalgamation of CNN, LSTM, and multi-task learning coupled withrich underlying embeddings and encoders offer robust classification performance across a myriadof data sets and psychometric classification tasks.
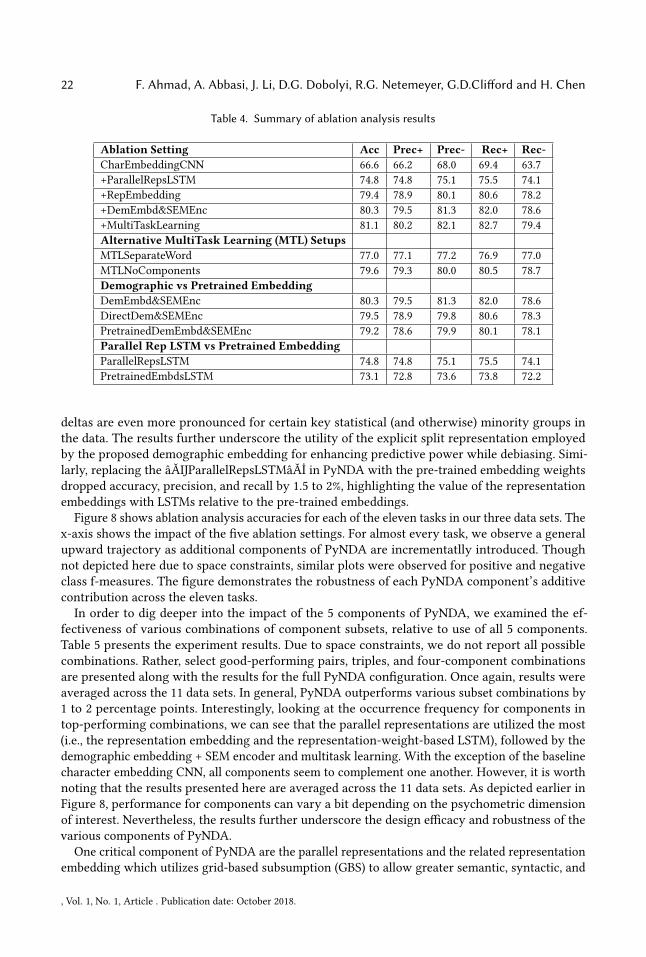
5.2 Experiment Results - Ablation AnalysisPyNDA encompasses novel embeddings, encoders, and a multi-task learning scheme. In order toexamine the additive impact of each component of the architecture, ablation analysis was performed.We compared the full PyNDA against a base version encompassing only the CNN with characterembedding. We then incrementally added the parallel representations with an LSTM, the fullrepresentation embedding using GBS, the demographic embedding and SEM encoder, and finally,multi-task learning.
The top half of Table 4 shows the summary (averaged) results across all eleven tasks associatedwith our three test beds. From the table, it is apparent that each additional component included inthe ablation analysis bolstered performance. For instance, including the parallel representationsover the base character embedding enhanced accuracy by eight percentage points. Inclusion ofthe full representation embedding added an additional four point lift. Similarly, the demographicembedding, SEM encoder, and MTL enhanced accuracy by about two percentage points, on average.Paired t-test results across the 5 folds of the 11 datasets (i.e., n=55) revealed that each additionalcomponent significantly enhanced performance over the prior ablation setting (all p-values < 0.05;df=54).
We also evaluated two alternative MTL setups. The first was a separate word embedding and sep-arate and shared LSTMs, exactly as proposed in [41], concatenated with the rest of our architecture.The second was our MTL with only the final concatenation layer (i.e., no embedding LSTM-levelweights). The results, depicted in the middle of Table 4, show that the more holistic application of
, Vol. 1, No. 1, Article . Publication date: October 2018.
A Deep Learning Architecture for Psychometric Natural Language Processing 21
Fig. 7. Accuracy and f-measures for each task across three data sets
MTL in PyNDA, with inclusion of finer-grained component-level weights in LTask coupled withtraining instance alignment, boosts accuracy by 1.5% to 4% over alternative setups.
Finally, we examined the effectiveness of the demographic embeddings and parallel representation-weight-based LSTMs relative to the use of pre-trained embeddings. The results from these compar-isons appear at the bottom part of Table 4. Replacing the demographic embeddings used in ourproposed PyNDA architecture with a pre-trained word embedding decreased accuracy and class-level precision and recall by 1-2% across the board. We also explored the lift of the demographicembedding versus simply adding the demographic variables directly to PyNDA (called DirectDemin Table 4) - the embedding enhanced overall results by 1%. As later illustrated in Figure 11, the
, Vol. 1, No. 1, Article . Publication date: October 2018.
22 F. Ahmad, A. Abbasi, J. Li, D.G. Dobolyi, R.G. Netemeyer, G.D.Clifford and H. Chen
Table 4. Summary of ablation analysis results
Ablation Setting Acc Prec+ Prec- Rec+ Rec-CharEmbeddingCNN 66.6 66.2 68.0 69.4 63.7+ParallelRepsLSTM 74.8 74.8 75.1 75.5 74.1+RepEmbedding 79.4 78.9 80.1 80.6 78.2+DemEmbd&SEMEnc 80.3 79.5 81.3 82.0 78.6+MultiTaskLearning 81.1 80.2 82.1 82.7 79.4Alternative MultiTask Learning (MTL) SetupsMTLSeparateWord 77.0 77.1 77.2 76.9 77.0MTLNoComponents 79.6 79.3 80.0 80.5 78.7Demographic vs Pretrained EmbeddingDemEmbd&SEMEnc 80.3 79.5 81.3 82.0 78.6DirectDem&SEMEnc 79.5 78.9 79.8 80.6 78.3PretrainedDemEmbd&SEMEnc 79.2 78.6 79.9 80.1 78.1Parallel Rep LSTM vs Pretrained EmbeddingParallelRepsLSTM 74.8 74.8 75.1 75.5 74.1PretrainedEmbdsLSTM 73.1 72.8 73.6 73.8 72.2
deltas are even more pronounced for certain key statistical (and otherwise) minority groups inthe data. The results further underscore the utility of the explicit split representation employedby the proposed demographic embedding for enhancing predictive power while debiasing. Simi-larly, replacing the âĂIJParallelRepsLSTMâĂİ in PyNDA with the pre-trained embedding weightsdropped accuracy, precision, and recall by 1.5 to 2%, highlighting the value of the representationembeddings with LSTMs relative to the pre-trained embeddings.
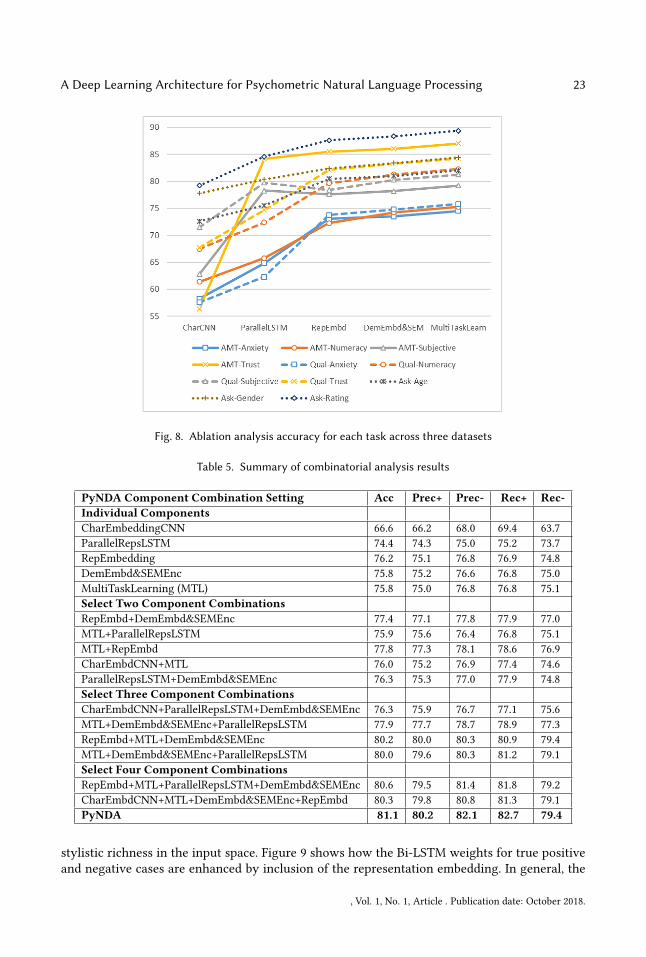
Figure 8 shows ablation analysis accuracies for each of the eleven tasks in our three data sets. Thex-axis shows the impact of the five ablation settings. For almost every task, we observe a generalupward trajectory as additional components of PyNDA are incrementatlly introduced. Thoughnot depicted here due to space constraints, similar plots were observed for positive and negativeclass f-measures. The figure demonstrates the robustness of each PyNDA component’s additivecontribution across the eleven tasks.In order to dig deeper into the impact of the 5 components of PyNDA, we examined the ef-
fectiveness of various combinations of component subsets, relative to use of all 5 components.Table 5 presents the experiment results. Due to space constraints, we do not report all possiblecombinations. Rather, select good-performing pairs, triples, and four-component combinationsare presented along with the results for the full PyNDA configuration. Once again, results wereaveraged across the 11 data sets. In general, PyNDA outperforms various subset combinations by1 to 2 percentage points. Interestingly, looking at the occurrence frequency for components intop-performing combinations, we can see that the parallel representations are utilized the most(i.e., the representation embedding and the representation-weight-based LSTM), followed by thedemographic embedding + SEM encoder and multitask learning. With the exception of the baselinecharacter embedding CNN, all components seem to complement one another. However, it is worthnoting that the results presented here are averaged across the 11 data sets. As depicted earlier inFigure 8, performance for components can vary a bit depending on the psychometric dimensionof interest. Nevertheless, the results further underscore the design efficacy and robustness of thevarious components of PyNDA.
One critical component of PyNDA are the parallel representations and the related representationembedding which utilizes grid-based subsumption (GBS) to allow greater semantic, syntactic, and
, Vol. 1, No. 1, Article . Publication date: October 2018.
A Deep Learning Architecture for Psychometric Natural Language Processing 23
Fig. 8. Ablation analysis accuracy for each task across three datasets
Table 5. Summary of combinatorial analysis results
PyNDA Component Combination Setting Acc Prec+ Prec- Rec+ Rec-Individual ComponentsCharEmbeddingCNN 66.6 66.2 68.0 69.4 63.7ParallelRepsLSTM 74.4 74.3 75.0 75.2 73.7RepEmbedding 76.2 75.1 76.8 76.9 74.8DemEmbd&SEMEnc 75.8 75.2 76.6 76.8 75.0MultiTaskLearning (MTL) 75.8 75.0 76.8 76.8 75.1Select Two Component CombinationsRepEmbd+DemEmbd&SEMEnc 77.4 77.1 77.8 77.9 77.0MTL+ParallelRepsLSTM 75.9 75.6 76.4 76.8 75.1MTL+RepEmbd 77.8 77.3 78.1 78.6 76.9CharEmbdCNN+MTL 76.0 75.2 76.9 77.4 74.6ParallelRepsLSTM+DemEmbd&SEMEnc 76.3 75.3 77.0 77.9 74.8Select Three Component CombinationsCharEmbdCNN+ParallelRepsLSTM+DemEmbd&SEMEnc 76.3 75.9 76.7 77.1 75.6MTL+DemEmbd&SEMEnc+ParallelRepsLSTM 77.9 77.7 78.7 78.9 77.3RepEmbd+MTL+DemEmbd&SEMEnc 80.2 80.0 80.3 80.9 79.4MTL+DemEmbd&SEMEnc+ParallelRepsLSTM 80.0 79.6 80.3 81.2 79.1Select Four Component CombinationsRepEmbd+MTL+ParallelRepsLSTM+DemEmbd&SEMEnc 80.6 79.5 81.4 81.8 79.2CharEmbdCNN+MTL+DemEmbd&SEMEnc+RepEmbd 80.3 79.8 80.8 81.3 79.1PyNDA 81.1 80.2 82.1 82.7 79.4
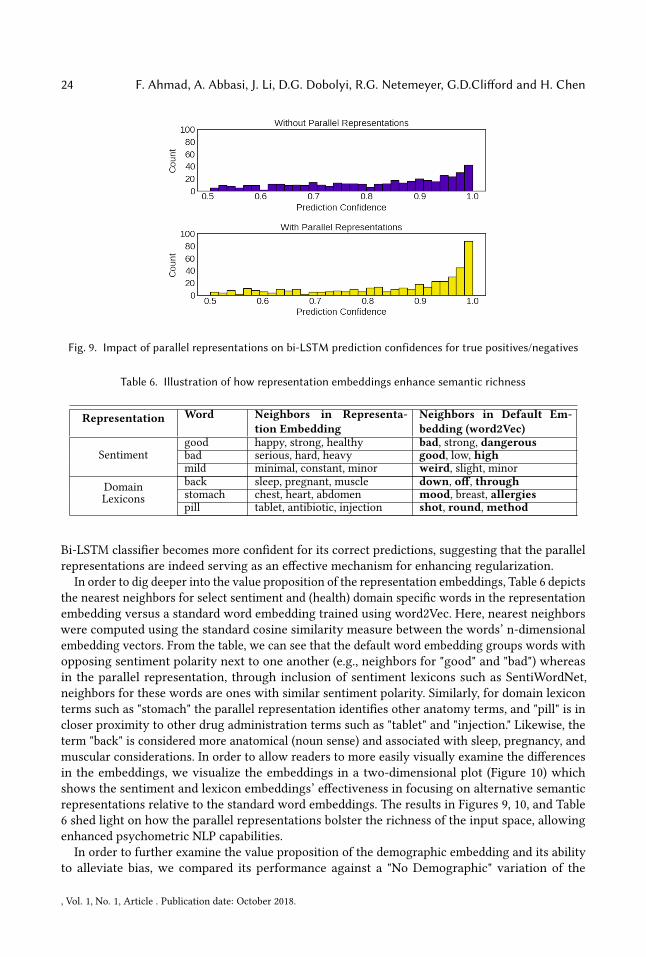
stylistic richness in the input space. Figure 9 shows how the Bi-LSTM weights for true positiveand negative cases are enhanced by inclusion of the representation embedding. In general, the
, Vol. 1, No. 1, Article . Publication date: October 2018.
24 F. Ahmad, A. Abbasi, J. Li, D.G. Dobolyi, R.G. Netemeyer, G.D.Clifford and H. Chen
Fig. 9. Impact of parallel representations on bi-LSTM prediction confidences for true positives/negatives
Table 6. Illustration of how representation embeddings enhance semantic richness
Representation Word Neighbors in Representa-tion Embedding
Neighbors in Default Em-bedding (word2Vec)
Sentimentgood happy, strong, healthy bad, strong, dangerousbad serious, hard, heavy good, low, highmild minimal, constant, minor weird, slight, minor
DomainLexicons
back sleep, pregnant, muscle down, off, throughstomach chest, heart, abdomen mood, breast, allergiespill tablet, antibiotic, injection shot, round,method
Bi-LSTM classifier becomes more confident for its correct predictions, suggesting that the parallelrepresentations are indeed serving as an effective mechanism for enhancing regularization.
In order to dig deeper into the value proposition of the representation embeddings, Table 6 depictsthe nearest neighbors for select sentiment and (health) domain specific words in the representationembedding versus a standard word embedding trained using word2Vec. Here, nearest neighborswere computed using the standard cosine similarity measure between the words’ n-dimensionalembedding vectors. From the table, we can see that the default word embedding groups words withopposing sentiment polarity next to one another (e.g., neighbors for "good" and "bad") whereasin the parallel representation, through inclusion of sentiment lexicons such as SentiWordNet,neighbors for these words are ones with similar sentiment polarity. Similarly, for domain lexiconterms such as "stomach" the parallel representation identifies other anatomy terms, and "pill" is incloser proximity to other drug administration terms such as "tablet" and "injection." Likewise, theterm "back" is considered more anatomical (noun sense) and associated with sleep, pregnancy, andmuscular considerations. In order to allow readers to more easily visually examine the differencesin the embeddings, we visualize the embeddings in a two-dimensional plot (Figure 10) whichshows the sentiment and lexicon embeddings’ effectiveness in focusing on alternative semanticrepresentations relative to the standard word embeddings. The results in Figures 9, 10, and Table6 shed light on how the parallel representations bolster the richness of the input space, allowingenhanced psychometric NLP capabilities.
In order to further examine the value proposition of the demographic embedding and its abilityto alleviate bias, we compared its performance against a "No Demographic" variation of the
, Vol. 1, No. 1, Article . Publication date: October 2018.

A Deep Learning Architecture for Psychometric Natural Language Processing 25
Fig. 10. Word neighborhoods in representation vs word2vec embeddings
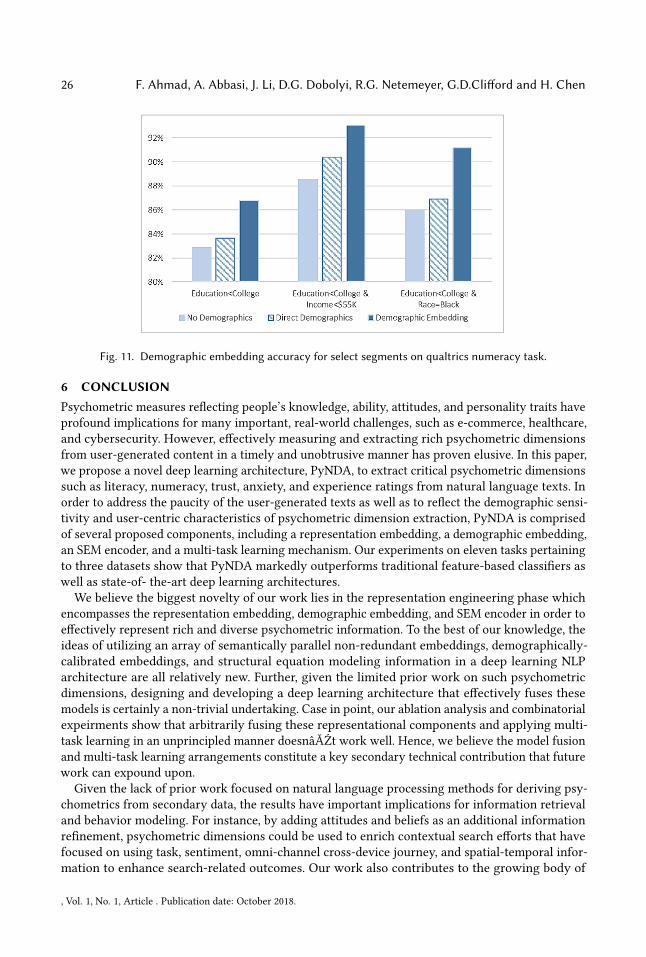
architecture comprising CharCNNEmbedding, ParallelRepLSTM, and the RepEmbedding, only.We also compared against the same architecture with the demographic variables concatenated tothe architecture via an artificial neural network, called "Direct Demographic." The demographicembeddings outperformed each comparison method by 1- 2% or more in average accuracy acrossthe eleven tasks. However, the performance deltas were especially pronounced on the demographicsegments identified by our demographic embedding method. As one illustration, Figure 11 depictsaccuracies for three related segments on the numeracy classification task, on the Qualtrics dataset.For those with without college education, income less than $55,000, and black racial affiliation, thedemographic embedding outperformed the no demographic and direct variable approaches by 3 to5 percentage points.
It is worth noting that the segment-specific embeddings such as these ones, each accounted forbetween 10% and 20% of all users in the dataset. Words weighted differently by the demographicembeddings for the numeracy task included "capable," "able," "interest," "understand," "capacity," and"complex." Similarly, words such as "anxious" and "worry" were weighted differently when utteredby such segments in the context of the anxiety classification task. The results reinforce the notionthat calibrating the psychometric discriminatory potential of utterances based on demographicconsiderations can alleviate bias and enhance classification accuracy. Collectively, the ablationanalysis results further underscore the robustness of the embeddings, encoder, and multi-tasklearning environment proposed in PyNDA.
, Vol. 1, No. 1, Article . Publication date: October 2018.
26 F. Ahmad, A. Abbasi, J. Li, D.G. Dobolyi, R.G. Netemeyer, G.D.Clifford and H. Chen
Fig. 11. Demographic embedding accuracy for select segments on qualtrics numeracy task.
6 CONCLUSIONPsychometric measures reflecting people’s knowledge, ability, attitudes, and personality traits haveprofound implications for many important, real-world challenges, such as e-commerce, healthcare,and cybersecurity. However, effectively measuring and extracting rich psychometric dimensionsfrom user-generated content in a timely and unobtrusive manner has proven elusive. In this paper,we propose a novel deep learning architecture, PyNDA, to extract critical psychometric dimensionssuch as literacy, numeracy, trust, anxiety, and experience ratings from natural language texts. Inorder to address the paucity of the user-generated texts as well as to reflect the demographic sensi-tivity and user-centric characteristics of psychometric dimension extraction, PyNDA is comprisedof several proposed components, including a representation embedding, a demographic embedding,an SEM encoder, and a multi-task learning mechanism. Our experiments on eleven tasks pertainingto three datasets show that PyNDA markedly outperforms traditional feature-based classifiers aswell as state-of- the-art deep learning architectures.
We believe the biggest novelty of our work lies in the representation engineering phase whichencompasses the representation embedding, demographic embedding, and SEM encoder in order toeffectively represent rich and diverse psychometric information. To the best of our knowledge, theideas of utilizing an array of semantically parallel non-redundant embeddings, demographically-calibrated embeddings, and structural equation modeling information in a deep learning NLParchitecture are all relatively new. Further, given the limited prior work on such psychometricdimensions, designing and developing a deep learning architecture that effectively fuses thesemodels is certainly a non-trivial undertaking. Case in point, our ablation analysis and combinatorialexpeirments show that arbitrarily fusing these representational components and applying multi-task learning in an unprincipled manner doesnâĂŹt work well. Hence, we believe the model fusionand multi-task learning arrangements constitute a key secondary technical contribution that futurework can expound upon.
Given the lack of prior work focused on natural language processing methods for deriving psy-chometrics from secondary data, the results have important implications for information retrievaland behavior modeling. For instance, by adding attitudes and beliefs as an additional informationrefinement, psychometric dimensions could be used to enrich contextual search efforts that havefocused on using task, sentiment, omni-channel cross-device journey, and spatial-temporal infor-mation to enhance search-related outcomes. Our work also contributes to the growing body of
, Vol. 1, No. 1, Article . Publication date: October 2018.

A Deep Learning Architecture for Psychometric Natural Language Processing 27
literature on user modeling by introducing demographically calibrated embeddings and structuralequation modeling concepts in text extraction and categorization contexts. Furthermore, PyNDAhas profound practical implications: for example, it could be used to infer users’ psychometricattitudes and beliefs, which drive key behaviors in various critical contexts such as health, cyberse-curity, and e-commerce. Within the health domain, such models could be deployed via mobile appsto help infer patients’ mental statuses related to chronic diseases in a timelier manner using mobilegenerated text, thereby helping physicians conduct informed decision-making and also allowingpatients to better self-regulate their health statuses. In the future, we hope to extend our modelto some of the other aforementioned application domains and also to deploy them in real-timesynchronous chat contexts. We believe that this present study constitutes an important initial steptowards these future real-world applications.
7 ACKNOWLEDGEMENTSThe authors wish to thank the U.S. National Science Foundation for their support under grantsNSF IIS-1816504, IIS-1553109, BDS-1636933, CCF-1629450, and Microsoft Research for its supportthrough CRM:0740129.
REFERENCES[1] Ahmed Abbasi. 2010. Intelligent feature selection for opinion classification. IEEE Intelligent Systems 25, 4 (2010), 75–79.[2] Ahmed Abbasi and Hsinchun Chen. 2008. Writeprints: A stylometric approach to identity-level identification and
similarity detection in cyberspace. ACM Transactions on Information Systems (TOIS) 26, 2 (2008), 7.[3] Ahmed Abbasi, Stephen France, Zhu Zhang, and Hsinchun Chen. 2011. Selecting attributes for sentiment classification
using feature relation networks. IEEE Transactions on Knowledge and Data Engineering 23, 3 (2011), 447–462.[4] Ahmed Abbasi, Raymond YK Lau, and Donald E Brown. 2015. Predicting behavior. IEEE Intelligent Systems 30, 3 (2015),
35–43.[5] Ahmed Abbasi, F Mariam Zahedi, and Yan Chen. 2016. Phishing susceptibility: The good, the bad, and the ugly. In
Intelligence and Security Informatics (ISI), 2016 IEEE Conference on. IEEE, 169–174.[6] Ahmed Abbasi, Yilu Zhou, Shasha Deng, and Pengzhu Zhang. 2018. Text Analytics to Support Sense-making in Social
Media: A Language-Action Perspective. MIS Quarterly 42, 2 (2018), 427–464.[7] Stefano Baccianella, Andrea Esuli, and Fabrizio Sebastiani. 2010. Sentiwordnet 3.0: an enhanced lexical resource for
sentiment analysis and opinion mining.. In Lrec, Vol. 10. 2200–2204.[8] Nancy D Berkman, Stacey L Sheridan, Katrina E Donahue, David J Halpern, and Karen Crotty. 2011. Low health
literacy and health outcomes: an updated systematic review. Annals of internal medicine 155, 2 (2011), 97–107.[9] Leo Breiman. 2001. Random forests. Machine learning 45, 1 (2001), 5–32.[10] Donald E Brown, Ahmed Abbasi, and Raymond YK Lau. 2015. Predictive analytics: predictive modeling at the micro
level. IEEE Intelligent Systems 30, 3 (2015), 6–8.[11] Erik Cambria, Bjorn Schuller, Yunqing Xia, and Catherine Havasi. 2013. New avenues in opinion mining and sentiment
analysis. IEEE Intelligent Systems 28, 2 (2013), 15–21.[12] Chao Che, Cao Xiao, Jian Liang, Bo Jin, Jiayu Zho, and Fei Wang. 2017. An RNN Architecture with Dynamic Temporal
Matching for Personalized Predictions of Parkinson’s Disease. In Proceedings of the 2017 SIAM International Conferenceon Data Mining. SIAM, 198–206.
[13] Kyunghyun Cho, Bart Van Merriënboer, Dzmitry Bahdanau, and Yoshua Bengio. 2014. On the properties of neuralmachine translation: Encoder-decoder approaches. arXiv preprint arXiv:1409.1259 (2014).
[14] Philip J Ciampa, Chandra Y Osborn, Neeraja B Peterson, and Russell L Rothman. 2010. Patient numeracy, perceptionsof provider communication, and colorectal cancer screening utilization. Journal of health communication 15, sup3(2010), 157–168.
[15] Ronan Collobert and JasonWeston. 2008. A unified architecture for natural language processing: Deep neural networkswith multitask learning. In Proceedings of the 25th international conference on Machine learning. ACM, 160–167.
[16] Ronan Collobert, Jason Weston, Léon Bottou, Michael Karlen, Koray Kavukcuoglu, and Pavel Kuksa. 2011. Naturallanguage processing (almost) from scratch. Journal of Machine Learning Research 12, Aug (2011), 2493–2537.
[17] Alexis Conneau, Holger Schwenk, Loïc Barrault, and Yann Lecun. 2016. Very deep convolutional networks for textclassification. arXiv preprint arXiv:1606.01781 (2016).
[18] Dianne Cyr. 2008. Modeling web site design across cultures: relationships to trust, satisfaction, and e-loyalty. Journalof Management Information Systems 24, 4 (2008), 47–72.
, Vol. 1, No. 1, Article . Publication date: October 2018.

28 F. Ahmad, A. Abbasi, J. Li, D.G. Dobolyi, R.G. Netemeyer, G.D.Clifford and H. Chen
[19] Jan Deriu, Maurice Gonzenbach, Fatih Uzdilli, Aurelien Lucchi, Valeria De Luca, and Martin Jaggi. 2016. Swisscheeseat semeval-2016 task 4: Sentiment classification using an ensemble of convolutional neural networks with distantsupervision. In Proceedings of the 10th international workshop on semantic evaluation. 1124–1128.
[20] Yuxiao Dong, Nitesh V Chawla, Jie Tang, Yang Yang, and Yang Yang. 2017. User Modeling on Demographic Attributesin Big Mobile Social Networks. ACM Transactions on Information Systems 34, 4 (2017), 35.
[21] Julia Dressel and Hany Farid. 2018. The accuracy, fairness, and limits of predicting recidivism. Science advances 4, 1(2018), eaao5580.
[22] Elizabeth Dugan, Felicia Trachtenberg, and Mark A Hall. 2005. Development of abbreviated measures to assess patienttrust in a physician, a health insurer, and the medical profession. BMC health services research 5, 1 (2005), 64.
[23] Jeffrey L Elman. 1990. Finding structure in time. Cognitive science 14, 2 (1990), 179–211.[24] Daniel Fernandes, John G Lynch Jr, and Richard G Netemeyer. 2014. Financial literacy, financial education, and
downstream financial behaviors. Management Science 60, 8 (2014), 1861–1883.[25] Tianjun Fu, Ahmed Abbasi, Daniel Zeng, and Hsinchun Chen. 2012. Sentimental Spidering: Leveraging Opinion
Information in Focused Crawlers. ACM Transactions on Information Systems 30, 4 (2012), 24.[26] Yaroslav Ganin and Victor Lempitsky. 2014. Unsupervised domain adaptation by backpropagation. arXiv preprint
arXiv:1409.7495 (2014).[27] David Gefen and Kai Larsen. 2017. Controlling for lexical closeness in survey research: A demonstration on the
technology acceptance model. Journal of the Association for Information Systems 18, 10 (2017), 727–757.[28] Alexander Genkin, David D Lewis, and David Madigan. 2007. Large-scale Bayesian logistic regression for text
categorization. Technometrics 49, 3 (2007), 291–304.[29] Lin Gong and Hongning Wang. 2018. When Sentiment Analysis Meets Social Network: A Holistic User Behavior
Modeling in Opinionated Data. (2018), 1455–1464.[30] Ian Goodfellow, Jean Pouget-Abadie, Mehdi Mirza, Bing Xu, David Warde-Farley, Sherjil Ozair, Aaron Courville, and
Yoshua Bengio. 2014. Generative adversarial nets. In Advances in neural information processing systems. 2672–2680.[31] Christophe Van Gysel, Maarten de Rijke, and Evangelos Kanoulas. 2018. Neural Vector Spaces for Unsupervised
Information Retrieval. ACM Transactions on Information Systems 36, 4, Article 38 (June 2018), 25 pages. https://doi.org/10.1145/3196826
[32] Sepp Hochreiter and Jürgen Schmidhuber. 1997. Long short-term memory. Neural computation 9, 8 (1997), 1735–1780.[33] Minlie Huang, Qiao Qian, and Xiaoyan Zhu. 2017. Encoding Syntactic Knowledge in Neural Networks for Sentiment
Classification. ACM Transactions on Information Systems 35, 3, Article 26 (June 2017), 27 pages. https://doi.org/10.1145/3052770
[34] Armand Joulin, Edouard Grave, Piotr Bojanowski, and Tomas Mikolov. 2016. Bag of tricks for efficient text classification.arXiv preprint arXiv:1607.01759 (2016).
[35] Yoon Kim. 2014. Convolutional neural networks for sentence classification. arXiv preprint arXiv:1408.5882 (2014).[36] Yann LeCun, Léon Bottou, Yoshua Bengio, and Patrick Haffner. 1998. Gradient-based learning applied to document
recognition. Proc. IEEE 86, 11 (1998), 2278–2324.[37] Chenliang Li, Yu Duan, Haoran Wang, Zhiqian Zhang, Aixin Sun, and Zongyang Ma. 2017. Enhancing Topic Modeling
for Short Texts with Auxiliary Word Embeddings. ACM Transactions on Information Systems 36, 2, Article 11 (Aug.2017), 30 pages. https://doi.org/10.1145/3091108
[38] Jingjing Li, Kai Larsen, and Ahmed Abbasi. 2020. TheoryOn: A Design Framework and System for Unlocking BehavioralKnowledge through Ontology Learning. MIS Quarterly (2020), 1–48.
[39] Jiwei Li, Minh-Thang Luong, Dan Jurafsky, and Eudard Hovy. 2015. When are tree structures necessary for deeplearning of representations? arXiv preprint arXiv:1503.00185 (2015).
[40] Pengfei Liu, Xipeng Qiu, and Xuanjing Huang. 2016. Recurrent neural network for text classification with multi-tasklearning. arXiv preprint arXiv:1605.05101 (2016).
[41] Pengfei Liu, Xipeng Qiu, and Xuanjing Huang. 2017. Adversarial multi-task learning for text classification. arXivpreprint arXiv:1704.05742 (2017).
[42] Christopher Manning, Mihai Surdeanu, John Bauer, Jenny Finkel, Steven Bethard, and David McClosky. 2014. TheStanford CoreNLP natural language processing toolkit. In Proceedings of 52nd annual meeting of the association forcomputational linguistics: system demonstrations. 55–60.
[43] Andrew McCallum, Kamal Nigam, et al. 1998. A comparison of event models for naive bayes text classification. InAAAI-98 workshop on learning for text categorization, Vol. 752. Citeseer, 41–48.
[44] George A Miller. 1995. WordNet: a lexical database for English. Commun. ACM 38, 11 (1995), 39–41.[45] Richard Netemeyer, David Dobolyi, Ahmed Abbasi, Gari Clifford, and Herman Taylor. 2020. Health Literacy, Health
Numeracy, and Trust in Doctor: Effects on Key Patient Health Outcomes. Journal of Consumer Affairs (2020), 1–40.[46] Richard H Osborne, Roy W Batterham, Gerald R Elsworth, Melanie Hawkins, and Rachelle Buchbinder. 2013. The
grounded psychometric development and initial validation of the Health Literacy Questionnaire (HLQ). BMC public
, Vol. 1, No. 1, Article . Publication date: October 2018.
A Deep Learning Architecture for Psychometric Natural Language Processing 29
health 13, 1 (2013), 658.[47] Sinno Jialin Pan, Zhiqiang Toh, and Jian Su. 2013. Transfer Joint Embedding for Cross-domainNamed Entity Recognition.
ACM Transactions on Information Systems 31, 2, Article 7 (May 2013), 27 pages. https://doi.org/10.1145/2457465.2457467[48] Bo Pang, Lillian Lee, and Shivakumar Vaithyanathan. 2002. Thumbs up?: sentiment classification using machine
learning techniques. In Proceedings of the ACL-02 conference on Empirical methods in natural language processing-Volume10. Association for Computational Linguistics, 79–86.
[49] Nanyun Peng and Mark Dredze. 2016. Multi-task multi-domain representation learning for sequence tagging. CoRR,abs/1608.02689 (2016).
[50] Ellen Riloff, Siddharth Patwardhan, and Janyce Wiebe. 2006. Feature subsumption for opinion analysis. In Proceedingsof the 2006 conference on empirical methods in natural language processing. Association for Computational Linguistics,440–448.
[51] Mickael Rouvier and Benoit Favre. 2016. SENSEI-LIF at SemEval-2016 Task 4: Polarity embedding fusion for robustsentiment analysis. In Proceedings of the 10th international workshop on semantic evaluation (SemEval-2016). 202–208.
[52] John Rust and Susan Golombok. 2014. Modern Psychometrics: The Science of Psychological Assessment. Routledge.[53] Marilyn M Schapira, Cindy M Walker, Tamara Miller, Kathlyn E Fletcher, Pamela S Ganschow, Elizabeth A Jacobs,
Diana Imbert, Maria O’Connell, and Joan M Neuner. 2014. Development and validation of the numeracy understandingin Medicine Instrument short form. Journal of health communication 19, sup2 (2014), 240–253.
[54] Charles Donald Spielberger. 1989. State-trait anxiety inventory: a comprehensive bibliography. Consulting PsychologistsPress.
[55] Carlo Strapparava, Alessandro Valitutti, et al. 2004. Wordnet affect: an affective extension of wordnet.. In Lrec, Vol. 4.Citeseer, 1083–1086.
[56] Peilu Wang, Yao Qian, Frank K Soong, Lei He, and Hai Zhao. 2015. A unified tagging solution: Bidirectional LSTMrecurrent neural network with word embedding. arXiv preprint arXiv:1511.00215 (2015).
[57] Lei Xu, Chunxiao Jiang, Yong Ren, and Hsiao-Hwa Chen. 2016. Microblog dimensionality reductionâĂŤa deep learningapproach. IEEE Transactions on Knowledge and Data Engineering 28, 7 (2016), 1779–1789.
[58] Zhilin Yang, Ruslan Salakhutdinov, and William Cohen. 2016. Multi-task cross-lingual sequence tagging from scratch.arXiv preprint arXiv:1603.06270 (2016).
[59] Zheng Yu, Haixun Wang, Xuemin Lin, and Min Wang. 2016. Understanding short texts through semantic enrichmentand hashing. IEEE Transactions on Knowledge and Data Engineering 28, 2 (2016), 566–579.
[60] Xiang Zhang, Junbo Zhao, and Yann LeCun. 2015. Character-level convolutional networks for text classification. InAdvances in neural information processing systems. 649–657.
[61] Yulei Zhang, Yan Dang, and Hsinchun Chen. 2011. Gender classification for web forums. IEEE Transactions on Systems,Man, and Cybernetics-Part A: Systems and Humans 41, 4 (2011), 668–677.
[62] Chunting Zhou, Chonglin Sun, Zhiyuan Liu, and Francis Lau. 2015. A C-LSTM neural network for text classification.arXiv preprint arXiv:1511.08630 (2015).
[63] Jiayu Zhou, Jianhui Chen, and Jieping Ye. 2011. Clustered multi-task learning via alternating structure optimization. InAdvances in neural information processing systems. 702–710.
[64] Jiayu Zhou, Jianhui Chen, and Jieping Ye. 2011. Malsar: Multi-task learning via structural regularization. Arizona StateUniversity 21 (2011).
[65] David Zimbra, Ahmed Abbasi, Daniel Zeng, and Hsinchun Chen. 2018. The State-of-the-Art in Twitter SentimentAnalysis: A Review and Benchmark Evaluation. ACM Transactions on Management Information Systems (TMIS) 9, 2(2018), 5.
, Vol. 1, No. 1, Article . Publication date: October 2018.