a departure function-based method to determine the effect
TRANSCRIPT

Purdue UniversityPurdue e-PubsInternational Refrigeration and Air ConditioningConference School of Mechanical Engineering
2012
A Departure Function-Based Method toDetermine the Effect of the Oil Circulation Ratioon the Performance of Vapor CompressionRefrigeration SystemsMoises Marcelino [email protected]
Jader Barbosa Jr.
Follow this and additional works at: http://docs.lib.purdue.edu/iracc
This document has been made available through Purdue e-Pubs, a service of the Purdue University Libraries. Please contact [email protected] foradditional information.Complete proceedings may be acquired in print and on CD-ROM directly from the Ray W. Herrick Laboratories at https://engineering.purdue.edu/Herrick/Events/orderlit.html
Marcelino Neto, Moises and Barbosa Jr., Jader, "A Departure Function-Based Method to Determine the Effect of the Oil CirculationRatio on the Performance of Vapor Compression Refrigeration Systems" (2012). International Refrigeration and Air ConditioningConference. Paper 1178.http://docs.lib.purdue.edu/iracc/1178

2141, Page 1
2141, Page 1
International Refrigeration and Air Conditioning Conference at Purdue, July 16-19, 2012
A Departure Function-Based Method to Determine the Effect of the Oil Circulation Ratio
on the Performance of Vapor Compression Refrigeration Systems
Moisés A. MARCELINO NETO, Jader R. BARBOSA Jr*
Polo – Research Laboratories for Emerging Technologies in Cooling and Thermophysics Department of Mechanical Engineering, Federal University of Santa Catarina,
Florianópolis, SC, 88040900, Brazil
* Corresponding Author. Phone/Fax: ++ 55 48 3234 5166, e-mail: [email protected]
ABSTRACT A method to estimate the performance of single-stage vapor compression refrigeration systems as a function of the oil circulation ratio is presented. The model is based on the Peng-Robinson equation of state and on the theory of departure functions to estimate the mixture enthalpy, entropy and specific volume as a function of pressure, temperature and mixture composition. The method is applied to a mixture of isobutane (R-600a) and alkyl benzene oil. Pressure-enthalpy diagrams are presented as a function of the oil circulation ratio. These are used in conjunction with a thermodynamic cycle analysis in which the behavior of overall performance parameters such as cooling capacity, compressor power and coefficient of performance are compared with those obtained for the baseline (i.e., pure refrigerant) condition.
1. INTRODUCTION In mechanical vapor compression refrigeration systems, the working fluid is generally a mixture of refrigerant and lubricant oil, which is used for sealing and reducing friction between sliding parts inside the compressor. Solubility of the oil in the refrigerant must be guaranteed to ensure the return of the former from the cycle components to the compressor sump. Although the oil is essential for assuring the compressor performance and reliability (Prata and Barbosa, 2009), oil migration from the compressor into the system is almost inevitable, and should be minimized. Refrigerant-oil mixing decreases the vapor pressure of the working fluid and is responsible for reducing the system cooling capacity and the coefficient of performance, COP. Therefore, a detailed knowledge of the phase equilibrium of refrigerant-oil mixtures and the effect of the oil solubility on the thermodynamic properties is critical for assessing the effect of the oil circulation ratio, OCR (defined as the oil mass fraction in the compressor mass flow rate), on the system performance parameters. Several authors have considered the influence of the oil on the thermodynamic properties of the refrigerant in their performance analyses of refrigeration systems (Spauschus, 1963; Cooper and Mount, 1972; Hughes et al., 1982; Youbi-Idrissi et al., 2001, 2003, 2004, 2008; Zhelezny et al., 2007, 2010). However, the majority of models available for calculating the thermodynamic properties are based on simplified relationships, such as empirical formulas for determining the solubility (Spauschus, 1963; Cooper and Mount, 1972; Hughes et al., 1982; Youbi-Idrissi et al., 2001, 2003) or on the assumption of ideal solution behavior for the liquid mixture (Cooper and Mount, 1972; Hughes et al., 1982; Youbi-Idrissi et al., 2001, 2003). This work proposes a calculation method for state properties (enthalpy, entropy, volume) of refrigerant-oil mixtures based on the theory of departure functions coupled with the Peng and Robinson (1976) equation of state (EoS). Although the method is, in principle, applicable to any refrigerant-oil system, a mixture of R-600a and an alkyl benzene lubricant oil (AB ISO 5) was evaluated in this study due to the availability of data on the phase equilibrium
2141, Page 2
2141, Page 2
International Refrigeration and Air Conditioning Conference at Purdue, July 16-19, 2012
and liquid phase mass density behavior (Marcelino Neto and Barbosa, 2010). A cycle analysis of a single-stage vapor compression refrigeration system was carried out to quantify the influence of the OCR on the thermodynamic performance. The proposed algorithm is based on the prescription of degrees of superheating and subcooling at the outlets of the evaporator and condenser and, therefore, does not impose any constraint on the evaporating and condensing pressures. Because of this, and due to the more rigourous approach to the calculation of the state properties, it is believed that the present method is more generally applicable than those currently available in the literature.
2. CALCULATION METHOD 2.1 Thermodynamic properties of refrigerant-oil mixtures The state properties of oil-refrigerant mixtures were calculated by means of departure functions, which are defined as the difference between the property of a real fluid and that of an ideal gas at the same temperature and pressure (Elliot and Lira, 1999). Relationships for the enthalpy and entropy departure functions can be obtained by expressing h and s in terms of T, v and w (composition) and integrating them isothermally and at constant composition from the ideal gas reference state. Thus,
11
,
−+⎥⎦
⎤⎢⎣
⎡−⎟
⎠
⎞⎜⎝
⎛∂∂
=−
∫∞
ZdvpTpT
RTRThh v
wv
gi (1)
∫∞
⎥⎦
⎤⎢⎣
⎡−⎟
⎠
⎞⎜⎝
⎛∂∂
+=+− v
wv
gi
dvvT
pR
Zpp
Rss 11lnln
,0
0 (2)
The p-v-T relationship needed to integrate Eqs. (1) and (2) was obtained from the Peng and Robinson (1976) EoS. The enthalpy and entropy departure functions are given by (Edmister and Lee, 1984),
⎥⎦
⎤⎢⎣
⎡
−−++
⎥⎦
⎤⎢⎣
⎡ −−−=−
BZBZ
dTda
aT
BAZ
RThh gi
)12()12(ln1
21 5.0
5.0
5.1 (3)
⎥⎦
⎤⎢⎣
⎡
−−++
⎥⎦
⎤⎢⎣
⎡ −−−=−
BZBZ
dTda
aT
BABZ
Rss gi
)12()12(ln1
2)ln( 5.0
5.0
5.10 (4)
With respect to a real fluid reference state (subscript R), the enthalpy and entropy can be written as a contribution of three parts as follows,
( ) ( ) RRgi
T
TppT
gi hhhdTchhhR
+−−+−= ∫, (5)
( ) ( ) RRgi
R
T
T
p
pTgi sss
ppRdT
Tc
sssR
+−−−+−= ∫ ln,
(6)
where the first term on the right hand side of Eq. (5) is the h departure function at the state defined by p and T, i.e., the actual state. The second term is the change in enthalpy of an ideal gas between the reference and the actual states. The third term is the h departure function at the reference state. In this work, the International Institute of Refrigeration (IIR) reference state was used. Thus, at 0ºC, the values of enthalpy and entropy of the saturated liquid are 200 kJ kg-1 and 1 kJ kg-1K-1, respectively.

2141, Page 3
2141, Page 3
International Refrigeration and Air Conditioning Conference at Purdue, July 16-19, 2012
As the vapor pressure of lubricant oils is negligible, the refrigerant mass fraction in the vapor phase is assumed equal to unity (pure refrigerant). At thermodynamic equilibrium, a specific property of a two-phase liquid-vapor mixture is given by, vl XX ψψψ +−= )1( (7) where ψ is a generic specific property (internal energy, enthalpy, entropy, volume). The enthalpy and the entropy of the liquid and vapor are calculated with Eqs. (5) and (6), respectively. The liquid and vapor specific volumes were computed using the Peng and Robinson (1976) EoS with the volume translation of Penéloux and Rauzy (1982). The vapor quality for a binary mixture can be obtained directly from vapor-liquid equilibrium (VLE) data, as illustrated in the diagram of Fig. 1(a). The dew point line can be disregarded because of the negligible vapor pressure of the lubricant oil. Thus,
11
2
1
11
11
11
11
11
1 wOCR
wz
wwz
wywz
BCABX
−−=
−−=
−
−=
−
−== (8)
where the subscripts 1 and 2 stand for the refrigerant and oil, respectively. z is the overall mass fraction, w is the mass fraction in the liquid phase (solubility) and y is the mass fraction in the vapor phase. In the cycle analysis, the OCR will be assumed equal to the oil overall mass composition, z2. Bubble point pressures for R-600a/AB ISO 5 mixture were calculated as a function of solubility and temperature via the Peng and Robinson (1976) EoS with the classical quadratic mixing rule using a binary interaction parameter (k12= – 0.02668) calculated from the experimental data of Marcelino Neto and Barbosa (2010), shown in Fig. 1(b).
(a) (b)
Figure 1: (a) Calculation of the vapor quality. (b) VLE data and predictions using the Peng and Robinson (1976) EoS for the R-600a/AB ISO 5 mixture (Marcelino Neto and Barbosa, 2010).
Table 1 presents a summary of the fluid properties. The critical point properties, acentric factor and ideal gas specific heat capacity of the lubricant oil were calculated using the group contribution method of Constantinou and Gani (1994). Pure refrigerant critical point data were obtained directly from the EES software (Klein, 2011). In Eqs. (5) and (6), the ideal gas specific heat capacity for the liquid mixture was calculated based on the weighted sum of the ideal gas specific heat capacity of the two components. 2.1 Refrigeration cycle analysis A thermodynamic analysis of an idealized vapor compression refrigeration cycle with an internal heat exchanger (Gosney, 1982) using the refrigerant-oil mixture as the working fluid was carried out. The compression process was assumed isentropic and the heat transfer processes in the evaporator and condenser were assumed isobaric. The fluid enthalpy at the outlet of the expansion device was assumed equal to that at the inlet. The OCR was varied from 0 to
0 0.2 0.4 0.6 0.8 10
2
4
6
8
10
12
14
w1 (kg kg-1)
p (b
ar)
23°C40°C60°C
80°CPR
2141, Page 4
2141, Page 4
International Refrigeration and Air Conditioning Conference at Purdue, July 16-19, 2012
2%, as this is considered a typical range in household vapor compression refrigeration systems. The cooling capacity, compressor power and condenser heat rejection rate are given by, )( 31 ʹ′−= hhmQe (9) sc hhmW )( 12 ʹ′−= (10) )( 32 hhmQc −= (11) where m is compressor mass flow rate and h1, h1´, h2, h3 and h3´ are the specific enthalpies corresponding to the evaporator outlet, compressor inlet, compressor discharge, condenser outlet and evaporator inlet, respectively. The coefficient of performance, COP, is given by,
sc
e
hhhh
WQCOP
)()(
12
31
ʹ′
ʹ′
−
−==
(12)
Table 1: Selected properties of the working fluids.
Component Tc (°C) pc (bar) ω (-) M (g mol-1) (20°C) (kJ kg-1 K-1)
R-600a 134.7 36.40 0.1853 58.12 1.663
AB ISO 5 675.9 20.60 0.9012 240 1.490
An algorithm was developed to calculate the condensing and evaporating pressures and the performance parameters in Eqs. (9)-(12) as a function of the following operating conditions and geometric variables: ambient temperature (Tenv), refrigerated compartment temperature (Tcold), overall thermal conductance of the condenser (UAcon) and evaporator (UAeva), apparent refrigerant superheating degree at the evaporator outlet (ΔTsup), apparent refrigerant subcooling degree at the condenser outlet (ΔTsub), oil circulation ratio (OCR), compressor clearance (% volume) (C), compressor displaced volume (VD) and compressor frequency (f). The apparent superheating degree (Cooper and Mount, 1972; Hughes et al., 1982) is defined as the difference between the working fluid (i.e., the refrigerant-oil mixture) temperature at the evaporator outlet and the saturation temperature of the pure refrigerant at the evaporating pressure. Analogously, the apparent subcooling degree is the difference between the working fluid temperature at the condenser outlet and the saturation temperature of the pure refrigerant at the condensing pressure. For a given set of values for the OCR and apparent subcooling and superheating degrees, the solution algorithm consists of the following steps:
1) Provide an initial estimate for the evaporating pressure, p1; 2) Calculate h1 = h(OCR, p1,T1) , where T1 =T sat+ΔTsup and Tsat is the saturation temperature of the pure
refrigerant at p1; 3) Calculate h !1 = h(OCR, p1,T !1 ) using the internal heat exchanger effectiveness, which is defined as the
ratio of the actual heat transfer rate and the maximum heat transfer rate as follows,
),(),(),(),(
1131
111́1
TphTphTphTph
vv
vv
−
−=ε (13)
4) Provide an initial estimate for the condensing pressure, p2; 5) Calculate the mass flow rate using the compressor model as follows,
cp,iig
2141, Page 5
2141, Page 5
International Refrigeration and Air Conditioning Conference at Purdue, July 16-19, 2012
vD
vfVm η1ʹ′
= (14)
where ),,( 111 ʹ′ʹ′ʹ′ = TpOCRvv is the specific volume at point 1’ (compressor inlet) and ηv is the ideal compressor volumetric efficiency.
6) Calculate the compressor power and the compressor discharge temperature. The compressor power is given by Eq. (10), where ),,( 122 ʹ′= spOCRhh and ),,( 111 ʹ′ʹ′ʹ′ʹ′ = TpOCRss . The compressor discharge temperature is given by ),,( 222 hpOCRTT = . This was calculated numerically via the bisection method.
7) Calculate the enthalpy at the condenser outlet, h3, from an energy balance as follows,
mTUAh
mQhh LMconc
Δ−=−= 223 (15)
where ΔTLM is the logarithmic mean temperature difference in the condenser.
8) If the apparent subcooling degree calculated with the estimated condensing pressure and with the calculated enthalpy at the condenser outlet is different from that specified in step 4 by an amount greater than a specified tolerance, the condensing pressure should be adjusted before returning to step 5. The process is repeated until convergence is obtained for the condensing pressure;
9) Determine the new evaporating pressure by the following procedure: i) calculate the enthalpy at the evaporator outlet from an energy balance in the evaporator,
mTUAh
mQhh LMevae
Δ−=−= ʹ′ʹ′ 331 (16)
where ΔTLM is the logarithmic mean temperature difference in the evaporator. ii) determine the evaporating pressure via an iterative process (for example, using the bisection method) for which
sup1111 )(),,( TpThpOCRT sat Δ=− ; iii) if the new p1 is different from that estimated in step 1 by a specified tolerance, update the value of p1 before returning to step 2 to obtain convergence.
The models presented in this section were implemented for the R-600a/AB ISO 5 mixture in the Engineering Equation Solver (EES) (Klein, 2011).
3. RESULTS AND DISCUSSIONS 3.1 Thermodynamic diagrams Pressure-enthalpy diagrams were prepared for the R-600a/AB ISO 5 mixture for values of OCR of 0.1%, 0.2% and 1% (see Figures 2-4). Figure 2 shows the p-h diagram for the 0.1% case, with lines of constant temperature and vapor quality. The saturated liquid (X=0) and vapor (X=1) lines for pure R-600a are also shown. The most noticeable effect associated with the presence of oil in the mixture is the disappearance of the saturated vapor line. This is because the oil does not evaporate. At very low overall oil mass fractions (such as the cases presented here), the mixture saturated liquid line practically coincides with that of the pure refrigerant. At high vapor qualities, the mixture isotherms (red lines) present a significant deviation with respect to the pure R-600a isotherms. This is due to the reduction of the bubble point pressure associated with the progressive evaporation of the volatile component at a constant temperature. The magnitudes of the temperature deviations decrease with temperature. Alternatively, the increase in saturation temperature with vapor quality at constant pressure is a consequence of the progressive increase in oil concentration in the liquid phase as the refrigerant evaporates.

2141, Page 6
2141, Page 6
International Refrigeration and Air Conditioning Conference at Purdue, July 16-19, 2012
If energy is added to the fluid at constant pressure at the maximum possible vapor mass quality, the vapor becomes superheated. However, it still is, in principle, in thermodynamic equilibrium with the lubricant oil. This region is represented by the dotted red lines in Fig. 2. On the left side of the saturated liquid line, the isotherms for the compressed liquid region are practically indifferent to the pressure.
Figure 2: R-600a/AB ISO 5 p-h diagram for an OCR of 0.1%.
Figure 3: R-600a/AB ISO 5 p-h diagram for an OCR of 0.2%.
100 200 300 400 500 600 70020
100
1000
5000
h (kJ kg-1)
p (k
Pa)
0.1 0.2 0.3 0.4 0.5 0.6 0.7 0.8 0.9
0.999-40°C
-20°C
0°C
20°C
40°C
60°C
80°C
100°C
Dew point curve (pure R-600a)
Bub
ble
poin
t cur
ve (
R-6
00a/
AB
ISO
5)
0.95
Bubble point curve (pure R-600a)
100 200 300 400 500 600 70020
100
1000
5000
h (kJ kg-1)
p (k
Pa)
0.1 0.2 0.3 0.4 0.5 0.6 0.7 0.8 0.9
0.998-40°C
-20°C
0°C
20°C
40°C
60°C
80°C
100°C
Dew point curve (pure R-600a)
Bub
ble
poin
t cur
ve (
R-6
00a/
AB
ISO
5)
0.95
Bubble point curve (pure R-600a)
2141, Page 7
2141, Page 7
International Refrigeration and Air Conditioning Conference at Purdue, July 16-19, 2012
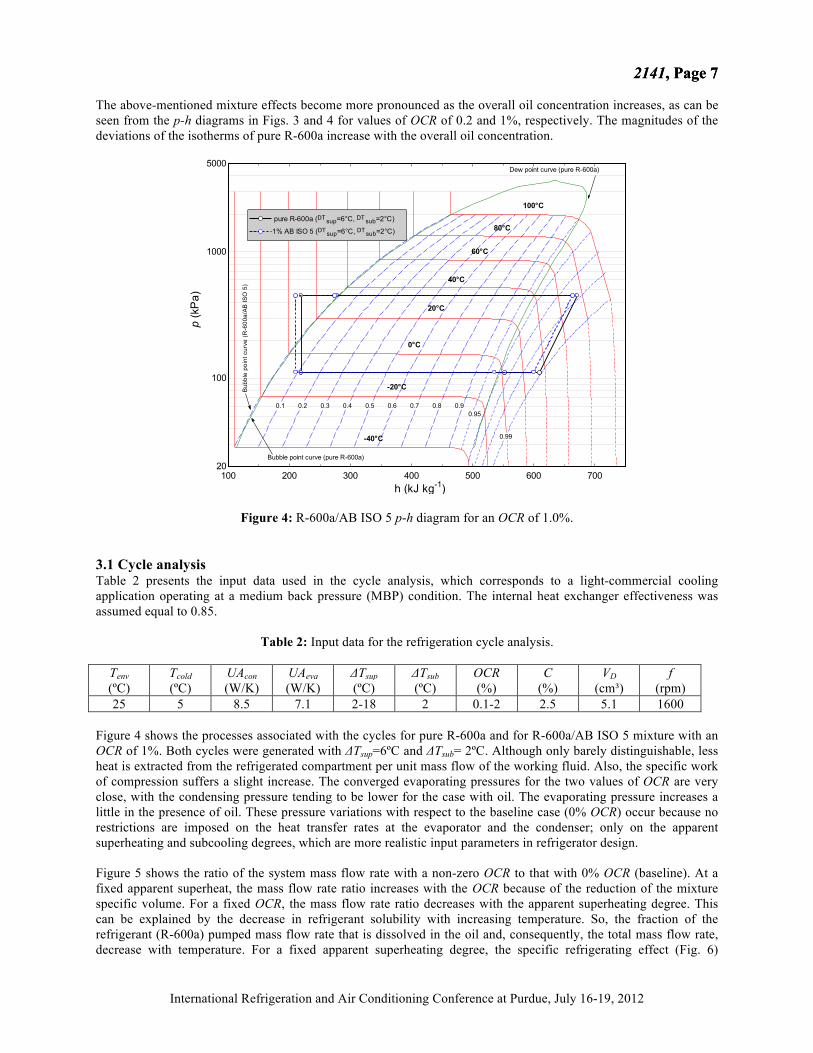
The above-mentioned mixture effects become more pronounced as the overall oil concentration increases, as can be seen from the p-h diagrams in Figs. 3 and 4 for values of OCR of 0.2 and 1%, respectively. The magnitudes of the deviations of the isotherms of pure R-600a increase with the overall oil concentration.
Figure 4: R-600a/AB ISO 5 p-h diagram for an OCR of 1.0%.
3.1 Cycle analysis Table 2 presents the input data used in the cycle analysis, which corresponds to a light-commercial cooling application operating at a medium back pressure (MBP) condition. The internal heat exchanger effectiveness was assumed equal to 0.85.
Table 2: Input data for the refrigeration cycle analysis.
Tenv Tcold UAcon UAeva ΔTsup ΔTsub OCR C VD f (ºC) (ºC) (W/K) (W/K) (ºC) (ºC) (%) (%) (cm³) (rpm) 25 5 8.5 7.1 2-18 2 0.1-2 2.5 5.1 1600
Figure 4 shows the processes associated with the cycles for pure R-600a and for R-600a/AB ISO 5 mixture with an OCR of 1%. Both cycles were generated with ΔTsup=6ºC and ΔTsub= 2ºC. Although only barely distinguishable, less heat is extracted from the refrigerated compartment per unit mass flow of the working fluid. Also, the specific work of compression suffers a slight increase. The converged evaporating pressures for the two values of OCR are very close, with the condensing pressure tending to be lower for the case with oil. The evaporating pressure increases a little in the presence of oil. These pressure variations with respect to the baseline case (0% OCR) occur because no restrictions are imposed on the heat transfer rates at the evaporator and the condenser; only on the apparent superheating and subcooling degrees, which are more realistic input parameters in refrigerator design. Figure 5 shows the ratio of the system mass flow rate with a non-zero OCR to that with 0% OCR (baseline). At a fixed apparent superheat, the mass flow rate ratio increases with the OCR because of the reduction of the mixture specific volume. For a fixed OCR, the mass flow rate ratio decreases with the apparent superheating degree. This can be explained by the decrease in refrigerant solubility with increasing temperature. So, the fraction of the refrigerant (R-600a) pumped mass flow rate that is dissolved in the oil and, consequently, the total mass flow rate, decrease with temperature. For a fixed apparent superheating degree, the specific refrigerating effect (Fig. 6)
100 200 300 400 500 600 70020
100
1000
5000
h (kJ kg-1)
p (k
Pa)
0.1 0.2 0.3 0.4 0.5 0.6 0.7 0.8 0.9
0.99-40°C
-20°C
0°C
20°C
40°C
60°C
80°C
100°C
Dew point curve (pure R-600a)
Bub
ble
poin
t cur
ve (
R-6
00a/
AB
ISO
5)
0.95
Bubble point curve (pure R-600a)
pure R-600a (DT sup=6°C, DT sub=2°C)
1% AB ISO 5 (DT sup=6°C, DT sub=2°C)

2141, Page 8
2141, Page 8
International Refrigeration and Air Conditioning Conference at Purdue, July 16-19, 2012
decreases with the OCR as a result of the larger amount of liquid R-600a that did not evaporate. As the temperature increases at a fixed OCR, the increase in refrigerating effect is, in relative terms, more pronounced for the higher OCRs because of the larger solubility variation.
Figure 5: Mass flow ratio as a function of OCR and ΔTsup.
Figure 6: Specific refrigerating effect as a function of OCR and ΔTsup.
Figure 7: Refrigeration capacity ratio as a function of OCR and ΔTsup.
Figure 8: Compression power ratio as a function of OCR and ΔTsup.
The cooling capacity ratio as a function of the apparent superheating degree and of the OCR is shown in Fig. 7. As can be seen, it remains practically constant over the whole range of conditions investigated, indicating that the changes in mass flow rate and specific refrigerating effect somewhat cancel each other out. Figure 8 presents the compressor power ratio as a function of the apparent superheating degree and OCR. The compressor power follows the behavior of the mass flow rate. By comparing the figures on the y-axis in Figs. 5 and 8, it is possible to see that the specific work of compression also increases with the OCR. Figure 9 shows the COP ratio, which provides a measure of the impact of the oil circulation ratio on the system thermodynamic performance. At high values of OCR, the COP reduction can be significant. However, due to the increase in the specific refrigerating effect and decrease in the specific work of compression, the COP increases with the apparent superheating degree. Figure 10 shows the behavior of the compression discharge temperature, which increases with the OCR and apparent superheat since an increase in both independent variables contributes to augmenting the refrigerant temperature at the compressor inlet.
2 4 6 8 10 12 14 16 181.00
1.01
1.02
1.03
1.04
1.05
1.06
1.07
1.08
DT sup (°C)
mm
/ m
r
0.2%
0.5%
1.0%
2.0%
0.1%
2 4 6 8 10 12 14 16 18300
310
320
330
340
350
DT (°C)
(h1
- h3)
(kJ/
kg)
0.1%
0.2%
1.0%
2.0%
0.0%
0 2 4 6 8 10 12 14 16 18 200.996
0.998
1.000
1.002
1.004
1.006
DT sup (°C)
Qe,
m /
Qe,
r
2.0%1.0%0.5%0.2%0.1%
2 4 6 8 10 12 14 16 181.00
1.02
1.04
1.06
1.08
1.10
DT sup (°C)
Wm
/ W
r
0.2%
0.5%
1.0%
2.0%
0.1%

2141, Page 9
2141, Page 9
International Refrigeration and Air Conditioning Conference at Purdue, July 16-19, 2012
Figure 9: COP ratio as a function of OCR and ΔTsup. Figure 10: Discharge temperature as a function of
OCR and ΔTsup.
4. CONCLUSIONS A comprehensive method was proposed to calculate the thermodynamic properties of refrigerant-oil mixtures based on the theory of departure functions combined with the Peng and Robinson (1976) EoS. The model was incorporated into a vapor compression cycle performance calculation method to quantify the effect of the oil circulation ratio on the performance of a refrigeration system that used a R-600a/AB ISO 5 mixture as the working fluid. It was verified that the oil degrades all performance parameters in the cycle. In addition, it was concluded that the apparent superheating degree, due to its effect on the mass of refrigerant dissolved in the oil at the evaporator outlet, is an important parameter in the analysis and design of real refrigeration systems. Further work is under way to develop more realistic models for the compressor and heat exchangers.
NOMENCLATURE
a molecular attraction parameter (J m3 mol-2) Subscripts and superscripts b molecular repulsion parameter (m3 mol-1) 1 refrigerant cp ideal gas specific heat capacity (kJ kg-1 K-1) 2 oil COP coefficient of performance (–) con condenser h specific enthalpy (kJ kg-1) eva evaporator OCR oil circulation ratio (–) ig ideal gas state p pressure (Pa) l liquid eQ cooling capacity (kW) R reference state
cQ condenser heat rejection (kW) sub subcooling s specific entropy (kJ kg-1 K-1) sup superheating T temperature (K) v vapor UA overall thermal conductance (W K-1) v specific volume (m³ kg-1) w liquid phase mass fraction (–) y vapor phase mass fraction (–) z overall mass fraction (–) Z compressibility factor (–)
2 4 6 8 10 12 14 16 180.91
0.92
0.93
0.94
0.95
0.96
0.97
0.98
0.99
1
DT sup (°C)
CO
Pm
/ C
OP
r
0.2%
0.5%
1.0%
2.0%
0.1%
2 4 6 8 10 12 14 16 1870
72
74
76
78
80
DT sup (°C)
T 2 (°
C)
0.2%
0.0%
0.5%
1.0%
2.0%
0.1%

2141, Page 10
2141, Page 10
International Refrigeration and Air Conditioning Conference at Purdue, July 16-19, 2012
REFERENCES
Constantinou, L., Gani, R.,1994, New group contribution method for estimating properties of pure compounds, American Institute of Chemical Engineers Journal, vol. 40: p.1697-1710.
Cooper, K.W., Mount, A.G., 1972, Oil circulation - its effect on compressor capacity, theory and experiment, Proc. in Purdue Compressor Technology Conference, Purdue-USA.
Edmister, W.C., Lee, B.I., 1984, Applied Hydrocarbon Thermodynamics, Gulf Publishing Company. Elliot, J.R., Lira, C.T., 1999, Introductory Chemical Engineering Thermodynamics, Prentice Hall International
Series in the Physical and Chemical Engineering Science. Gosney, W.B., 1982, Principles of Refrigeration, Cambridge University Press. Hughes, D.W., McMullan, J.T., Morgan, R., 1982, Determination of thermodynamic properties of refrigerant-oil
mixtures, Proc. in Purdue Compressor Technology Conference, Purdue-USA. Klein, S.A., 2011, Engineering Equation Solver (EES), Professional version V8.819. Marcelino Neto, M.A., Barbosa Jr., J.R., 2010, Solubility, density and viscosity of mixtures of isobutane (R-600a)
and a linear alkylbenzene lubricant oil, Fluid Phase Equilibria, vol. 292: p.7-12. Penéloux, A., Rauzy, E, 1982, A consistent correction for Redlich-Kwong-Soave volumes, Fluid Phase Equilibria,
vol. 8: p.7-23. Peng, D.Y., Robinson, D.B., 1976, A new two-constant equation of state, Industrial & Engineering Chemistry
Research, vol. 15: p.59-64. Prata, A.T., Barbosa Jr, J.R., 2009, Role of the thermodynamics, heat transfer, and fluid mechanics of lubricant oil in
hermetic reciprocating compressors, Heat Transfer Engineering, vol. 30: p.533-548. Spauschus, H.O., 1963, Thermodynamic properties of refrigerant-oil solutions: Dichlorodifluoromethane (R-12) and
petroleum oil, American Society of Heating, Refrigerating and Air-Conditioning Engineers Journal, vol. 5: p. 47-52.
Youbi-Idrissi, M., Bonjour, J., Meunier, F. 2001, Enthalpy calculation for a refrigerant-oil mixture: consequences on the evaporator performance working with R-407C and POE oil. Proceedings in IIR Conference on Thermophysical Properties and Transfer Properties of New Refrigerants , Paderborn-Germany.
Youbi-Idrissi, M., Bonjour, J., Marvillet, C., Meunier, F., 2003, Impact of refrigerant-oil solubility on an evaporator performances working with R-407C. International Journal of Refrigeration, vol. 26, p. 284-292.
Youbi-Idrissi, M., Bonjour, J., Terrier, M.F., Marvillet, C., Meunier, F., 2004, Oil presence in an evaporator: experimental validation of a refrigerant/oil mixture enthalpy calculation model, International Journal of Refrigeration, vol. 27: p. 215-224.
Youbi-Idrissi, M., Bonjour, J., 2008, The effect of oil in refrigeration: current research issues and critical review of thermodynamic aspects, International Journal of Refrigeration, vol. 31: p.165-179.
Zhelezny, P.V., Zhelezny, V.P., Procenko, D.A., Ancherbak, S.N., 2007, An experimental investigation and modeling of the thermodynamic properties of isobutane-compressor oil solutions: some aspects of experimental methodology, International Journal of Refrigeration, vol. 30: p.433-445.
Zhelezny, V.P., Nichenko, S.V., Semenyuk, Y.U., Skripov, P.V., 2010, Experimental investigation of the enthalpy of isobutane-compressor oil solutions, Journal of Chemical Engineering Data, vol. 55: p.1322-1326.
ACKNOWLEDGEMENTS
Financial support from CNPq through grant No. 573581/2008-8 (Instituto Nacional de Ciência e Tecnolgia em Refrigeração e Termofísica – INCT-RT) is duly acknowledged.