a difference in differences analysis of citizen perceptions
TRANSCRIPT

Did the UK’s Performance-Focused Health Reforms Work? A Difference in Differences Analysis of Citizen Perceptions
Abstract
The United Kingdom (UK) instituted a performance framework for the National Health Service (NHS) in
the late 1990s that, inspired by the new public management (NPM), employed performance measurement
and management in an effort to improve the quality of health services to citizens, in addition to realizing
efficiency goals. Using data from the 1996 and 2002 Eurobarometer and a difference in differences
approach, we evaluate the impacts of these performance reforms by comparing the UK to other European
Union countries in terms of overall citizen satisfaction with the health care system and perceptions of
how well the health care system performs. In general our results suggest that citizen satisfaction and
performance perceptions in the UK were more favorable after the reforms than what would have
occurred, absent the implementation of the reforms. The estimated improvement in satisfaction and
perceived performance is both statistically and substantively significant, and thus provides evidence that
the UK’s NPM-inspired performance framework did accomplish at least some of its goals.
Introduction
In the late-1990s, the United Kingdom instituted a performance framework for its National Health
Service (NHS) that, in addition to having the perennial efficiency and cost-saving goals, employed a new
public management (NPM) strategy to improve the quality of health care and the experiences of system
users. Indeed, these reforms have been viewed as a prime example of the performance measurement and
management movement in public administration (Pollitt & Bouckart, 2004). Using data from the 1996
and 2002 Eurobarometer, we attempt to evaluate the impacts of these performance reforms by comparing
the UK to other European Union countries in terms of overall citizen satisfaction with the health care
system and perceptions of how well the health care system performs. To preview our results, we find that
1

citizen satisfaction and performance perceptions in the UK were generally more favorable after the
reforms than what would have occurred, absent the implementation of the reforms. The estimated
improvement in satisfaction and perceived performance is both statistically and substantively significant,
and thus provides evidence that the UK’s performance framework accomplished at least some of its goals.
While there have been philosophical debates about the strengths and weaknesses of new public
management reforms, empirical studies can better inform researchers, policymakers, and practitioners
about which features of these reforms may influence different types of outcomes. Our results suggest that
the quality and customer-focused aspects of new public management that were applied through the UK’s
health system reforms seem to have worked in this case. Policymakers’ and practitioners’ efforts to
measure, report, and improve quality may have noticeable effects on citizens’ attitudes.
This study proceeds as follows. The next section provides an overview of the study’s context and
research question, with a focus on the UK’s National Health Service and especially the late 1990s
performance-oriented reforms inspired by the new public management. The following section details the
study’s data and methods. The results are presented next, including sensitivity analyses using different
groups of comparison countries. The final section concludes with a discussion of the findings and policy
implications.
Context and Research Question
The UK national health system was founded in 1948, following World War II, and is financed
largely through government taxation. Services are free at the point of use, except for prescriptions,
optical and dental care. Though services are financed publicly, health care is delivered through both
public and private hospitals (Green & Irvine 2001; Leichter 1979; Robinson & Dixon 1999; Emmerson,
Frayne, & Goodman 2002). Like the UK, some other European welfare states (Finland, Greece, Ireland,
Italy, Sweden and Spain) are financed through public taxation with some supplementary private voluntary
insurance and direct payments. Denmark and Portugal are tax-financed with some direct payments, but
no private voluntary insurance. Of these countries, the UK, Denmark, Finland, Ireland and Sweden are
2
classified by the World Health Organizaition (WHO) as well-established tax-financed systems, while the
others implemented public funding of health care later as a reform or in stages (Saltman & Figueras,
1997). In contrast, health systems in countries such as Austria, Belgium, France, Germany and
Luxembourg are financed through a system of compulsory social insurance, with supplemental funds
coming from public taxation, private voluntary insurance, and direct payments. The Netherlands has a
more mixed system, with health care financed primarily through compulsory social insurance and private
voluntary insurance, augmented by public taxation and direct payments (Directorate General for
Research, 1998). These different classifications of health care systems form the basis, in part, for the
countries chosen for comparison in our study.
Throughout the Conservative administrations of Prime Minister Margaret Thatcher and Prime
Minister John Major, health reforms focused on creating a competitive “internal market” for healthcare in
order to improve efficiency. In 1991, the government denied the need for monitoring the results of health
sector reforms and refused evaluation assistance from outside academics or others. This stance gradually
shifted as the lack of evidence of effectiveness became politically problematic. Although some outcomes
targets were set during this time, the real shift toward measuring performance came during the next
administration (Oliver, 2005; Robinson & Dixon, 1999).
When Tony Blair and the Labour Party came into power in 1997, the emphasis shifted away from
privatization and toward quality and performance. Health care became one of the top domestic priorities,
making it a relevant sector to evaluate during this time period (Pollitt and Bouckaert, 2004). A white
paper, The New NHS. Modern. Dependable, provided an overview of the reforms, which included the
creation of two new entities: the National Institute for Clinical Effectiveness, which sets performance
standards, and the Council for Health Improvements, responsible for enforcing them. A new Commission
for Health Improvement was established to support and oversee the quality of clinical services at the local
level, and to tackle shortcomings (NHS Executive, 1997, Section 3). Thirty-seven performance indicators
were developed in six areas of performance: health improvement, fair access, effective delivery of
appropriate healthcare, efficiency, patient/carer experience, and health outcomes of NHS care. In the area
3

of patient/carer experience, the government aimed to measure the way in which patients and carers
viewed the quality of treatment, in part through a new national patient survey. One of the six key
principles of the New NHS was “to shift the focus onto quality of care so that excellence is guaranteed to
all patients, and quality becomes the driving force for decision-making at every level of the service”
(NHS Executive, 1997, Section 2). Contrasting the reforms to those under the Conservative Government,
the white paper reads “Under the internal market, NHS Trusts' principal statutory duties were financial.
The Government will bring forward legislation to give them a new duty for the quality of care” (Section
6). The creation of these entities, the development of performance indicators, and the emphasis on patient
experience suggest that improved performance, quality and user satisfaction were goals of the reform and
pertinent outcome measures for our study.
As various public management scholars have noted (Pollitt, 2008; Walshe, 2002), these UK
reforms represent an important example of the new public management movement within the public
sector and its emphasis on performance measurement and management to improve the delivery of public
services. Although much has been written about the guiding assumptions and implementation challenges
of this performance movement in public management (Heinrich, 2007; Radin, 2006), less attention has
been paid to empirically evaluating the actual impacts of specific performance initiatives on the
perceptions of public services, especially on a large-scale such as the UK’s National Health Service. And
the evaluations that have been done have tended to focus more on output and efficiency measures
(Wollman, 2003). Few prior studies have tried to evaluate a large-scale, new public management-inspired
performance initiative in terms of its impacts on the satisfaction of citizens with the performance of public
services (an exception is Rieder & Lehmann, 2002).
Citizen satisfaction, moreover, is a germane outcome to consider when evaluating the impact of a
new public management, performance-oriented reform like the one tried in the UK. From its beginnings,
the performance movement in public administration has called for a renewed focus on customer service
and citizen satisfaction (Barzeley, 1992; Kettl, 2005; Osborne and Gabler, 1992). Books by Osborne and
Gaebler (1992) and Barzeley (1992) proposed strategies for making public organizations more customer-
4

focused. This call for a customer orientation in the public sector was subsequently picked up in the US by
Vice President Gore’s National Performance Review (Gore, 1993), which began in 1993. As Kettl
observes of this period in his review of new public management reforms worldwide (2005, p. 51): “The
concept of improving government’s service to citizens – and using this strategy to transform bureaucracy
– has been one of the most robust features of reform.” Indeed, the UK’s health reforms of the time were
an important example of this trend.
There are several ways in which emphasizing performance measurement in the health
care system may lead to greater citizen satisfaction. To begin with, health care providers may
have incentives to improve the quality of care, knowing that their performance will be measured
and reported. This increase in quality may in turn lead to an improvement in citizen satisfaction
with the health care system (Berwick, James, & Coye, 2003). Bevan & Hood (2006) discuss
how measuring performance in the NHS may have led to actual improvements in waiting times,
one important performance measure, but may also have led to the reporting of misleading
numbers. Another mechanism through which performance measurement and management may
boost citizen satisfaction is that citizens, given improved information, are better able to choose
doctors or hospitals that perform well and meet their needs. These citizens would then be more
satisfied, presumably, with the health care system. Finally, the publicity and rhetoric resulting
from the government’s push to measure and report on performance, conveyed by the media and
other sources, may itself have influenced citizens perceptions of the health care system.
Thus, our study addresses the following research question: Did the new public management-
inspired UK health reforms of the late 1990s realize their performance goals in the form of greater citizen
satisfaction with the health system and more positive perceptions of the system’s performance? As Jreisat
(2002) argues, “Only through the comparative method can questions be satisfactorily answered, such as
which reforms work, which do not, and under what conditions” (p. 157). Thus, we compare citizen
5

satisfaction and performance perceptions in the UK to the experiences of citizens in other EU countries
over the same time period, as explained in the next section.
Data and Method
To evaluate the late-1990s UK health reforms, this study uses data from the Eurobarometer and a
pooled cross-sections, difference in differences analytical strategy to compare changes in citizens’ views
of the health care system in their country between 1996 (Eurobarometer 44.3) and 2002 (Eurobarometer
57.2). The Eurobarometer is a face-to-face survey, representative of the population over age fifteen,
based on random samples of approximately 1000 individuals in each EU country. Established in 1973
and conducted by the Public Opinion Analysis Sector of the European Commission, the survey measures
attitudes over time in European Union member countries. Special modules in 1996 and 2002 asked a
number of questions about health related issues, allowing a comparison of attitudes before and after the
UK reforms on the late 1990s.
Difference in differences (diff-in-diffs, for short) is a statistical strategy that, in the case of pooled
cross-sections, compares change over the period in the UK to change over the same period in other
countries, with the set of comparison countries varied (as explained shortly) to assess the robustness of
the findings. Diffs-in-diffs models may use panel data or, as in this study, pooled cross-sections taken
before and after an intervention or event. In a regression framework, our model is as follows (based on
Remler & Van Ryzin, 2011):
Cj... C1)UK(UKˆcjc1intuk bbYRbYRbbaY yr ++×+++=
Where Y is the predicted outcome; UK is a dummy variable indicating a respondent from the UK (and
not one of the other EU comparison countries); YR is a dummy variable coded 0 for the pre-reform period
(1996) and 1 for the post-reform period (2002); UK × YR is an interaction term; and C1 through Cj are
various control variables added to the model (as discussed shortly). The slope estimates the
difference in outcome (Y) between the UK and comparison countries during the pre-reform period and is
ˆ
ukb
6

assumed constant over time. The slope estimates the difference in outcome (Y) between the pre- and
post-reform period for the comparison countries and is thus assumed to be the trend that would have
occurred in the UK, absent the reforms. Finally, the slope on the interaction estimates the difference
in differences, or the net difference (from the trend) in the outcome (Y) for the UK and is thus the
presumed causal effect of the reforms on the satisfaction and performance perceptions of UK citizens.
yrb
intb
Dependent variables
The dependent variables or outcomes (Y) in our analysis are two questions from the
Eurobarometer that asked about satisfaction with the health care system and perceptions of the system’s
performance in both 1996 and 2002. The satisfaction question asked respondents in both years:
Please tell me whether you are (1) not at all satisfied; (2) not very satisfied; (3) neither satisfied
nor dissatisfied; (4) fairly satisfied; or (5) very satisfied with the health care system in (our
country).
The perceived performance question asked respondents in 1996 and again in 2002 the following question:
Now I will read your four statements about the way the healthcare system runs in (Country).
Which one comes closest to your own point of view? (1) Health care system in (our country) runs
so badly that we need to rebuild it completely; (2) There are some good things in the way health
care in (our country) runs, but only fundamental changes would make it work better; (3) There
are some good things in the way health care in (our country) runs, and only minor changes would
make it work better; (4) On the whole, the health care system in (our country) runs quite well.
Because both variables are ordinal, we employ ordered logistical regression analysis, with responses
coded such that higher numbers reflect more satisfaction and more positive perceptions of system
performance. (Since the perceived performance question is not quite a traditional Likert-type item,
bivariate logistic regression was also tried to estimate the odds of responding that the health system “runs
7
quite well”. Results did not differ substantively from the ordered logistic regression analysis reported
here.)
Control variables
As indicated, our diff-in-diffs model includes a number of control variables to account for
individual characteristics that may influence attitudes toward government health services as well as trends
within countries in overall levels of satisfaction and perceived performance. Age is included as a control
variable because of its obvious relationship to health and health care utilization and because previous
research has found that older individuals give more positive ratings to government services (Van Ryzin,
Muzzio, & Immerwahr, 2004). We control for gender because women and men have different health care
needs and experiences and because some studies suggest that there are gender differences in satisfaction
with health care (Weisman, Rich, Rogers, Crawford, Grayson, & Henderson, 2000; Hall, Irish, Roter,
Ehrlich, & Miller, 1994). The Eurobarometer also asks individuals if they have any longstanding illness,
health problem or handicap that limits, to some extent or severely, their work or daily activities.
Responses to this question are included as a control variable because individuals with a condition
requiring frequent use of health care services might have different perceptions of the health care system
compared to relatively infrequent users.
Socioeconomic status is an obvious factor in attitudes toward government benefit programs and
the health care system in particular, given its high and rising costs, and thus we control for both income
(defined as being below, or above, the median for the country1) and employment status (defined as being
currently employed, or not). Countries with more unemployment tend to have greater stress on the
funding of their health systems, whether financed through insurance or taxation. Additionally, in some
countries people who are employed can purchase additional private health insurance (Saltman & Figueras,
1 Because many respondents did not report their incomes, we also include a dichotomous variable for missing income.
8

1997). For these reasons, employment status might affect citizens’ attitudes toward their country’s health
system. We also control for type of community (rural area, town, or large town) because it may affect
access to health care services and because studies have shown differences in satisfaction with government
services based on type of community (Montalvo 2009). In addition, we control for immigrant status
(defined as a respondent whose nationality is different from the country of residence) because it may
affect health care access and attitudes and because of rapid changes in immigration in some EU countries
over the study period.
Political ideology may be another factor influencing citizens’ satisfaction with the health care
system and perceived need for reform. Those in favor of the current government may be more likely to
express satisfaction with the health care system regardless of its actual quality, simply because of their
political preferences at the time of the survey. A ten-point scale measuring how far to the left or right
individuals place themselves on the political spectrum is thus used as a control variable to capture such
broader political preferences. Because previous research has found that attitudes toward the role of
government in health care provision also are related to satisfaction with public services
(Blekesaune & Quadagno, 2003; Hasenfeld & Rafferty ,1989; Gevers, Gelissen, Arts and
Muffels, 2000), we control for an agree-disagree question that reads: “The government should
only provide everyone with essential services such as care for serious diseases and encourage
people to provide for themselves in other respects.” Of the available questions in the
Eurobarometer, we judged this one to best capture general attitudes toward the role of
government in health care provision.2
Comparison countries
2 We used mean substitution for these two ideological/attitudinal questions to handle a disproportionate amount of missing data.
9

The European Union countries included in the Eurobarometer in both 1996 and 2002 are Austria,
Belgium, Denmark, Finland, France, Germany, Greece, Ireland, Italy, Luxembourg, the Netherlands,
Portugal, Spain, Sweden, and the United Kingdom. In addition to comparing the UK to this full set of
other countries available in the Eurobarometer, we also compare the UK to several subgroups of countries
that have health systems and populations most similar to the UK. The first subgroup consists of the four
other EU countries with well-established, tax-financed health care systems and mainly public health care
providers: Denmark, Finland, Ireland and Sweden (Emmerson, Frayne, & Goodman, 2002). The second
subgroup consists of the other four largest countries in the European Union by population and Gross
Domestic Product (GDP): UK, Germany, France, Spain, and Italy. These subgroups provide points of
comparison that may be more relevant for the UK and also provide a means of examining the robustness
of the findings across alternative definitions of the comparison group. It should be acknowledged that,
during the time period covered by our study, many of these countries undertook their own health care
reforms, some of which also emphasized performance measurement and quality improvement. As a
result, our models should be viewed as estimating the net effects of the UK’s performance-related health
reforms, above and beyond the effects of the various other reforms that happened in the comparison
countries.
Table 1 shows the minimum and maximum for the dependent variables and control variable as
well as their weighted means, in each year, for the UK and the various sets of comparison countries.
While the dependent variables have lower values in the UK than most of the comparison groups in both
years, as we discuss in the next section, the change in attitudes is the focus of our analysis rather than the
level of each dependent variable. In general, the control variables were comparable for the UK and
comparison groups with some minor differences. In both years, the average age in the UK was slightly
older, the likelihood of reporting an illness was higher, and the proportion of people living in large towns
was higher in the UK than the comparison countries. In 1996, the percentage of individuals employed
was slightly higher in the UK than in the other countries, while in 2002 this trend was reversed. Also in
1996, the percentage of those with high incomes was somewhat lower in the UK, while the percentage of
10
those who did not report income was higher. People in the UK were slightly more left-wing politically in
both years, except when compared to the four other largest countries. Compared to the other countries,
those in the UK were more likely to agree that the government should have a limited role in health
care in 1996, but slightly less likely to agree in 2002. In our statistical models, it should be pointed
out, we effectively hold constant all of these various changes across countries and over time in
the levels of these control variables.
Findings
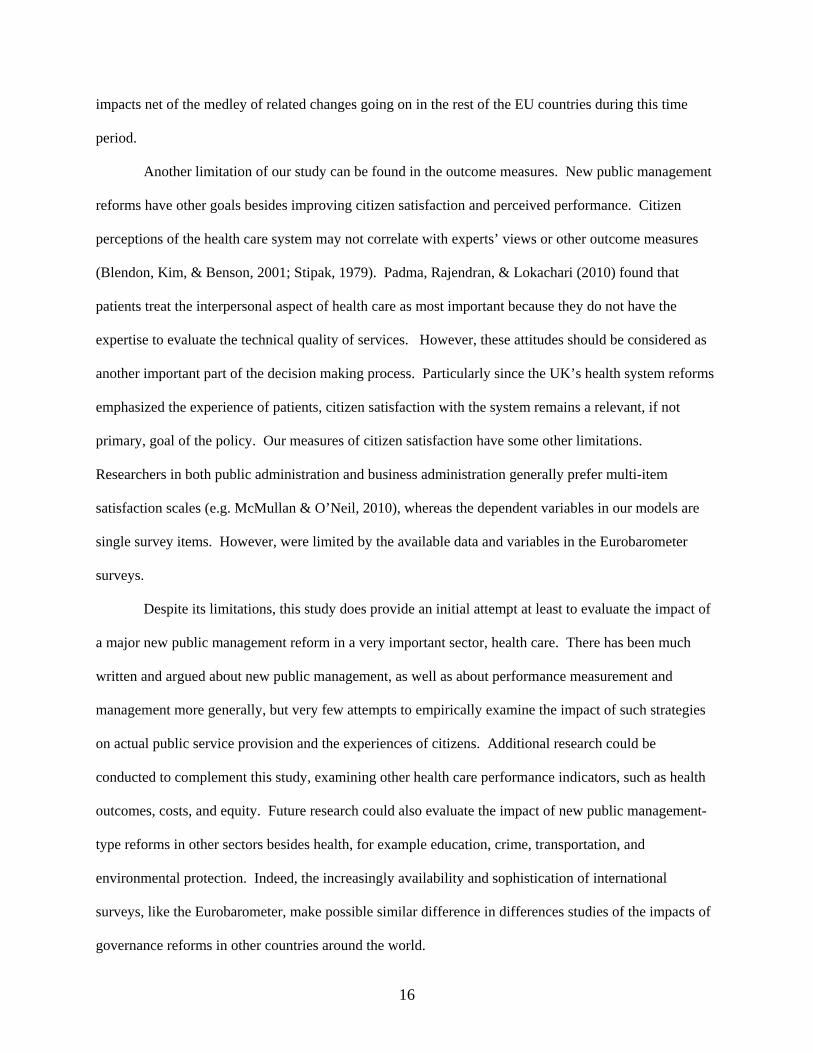
Table 2 presents the regression analysis of the estimated impact of the UK reforms on satisfaction
with the health care system. The coefficient on “year” indicates that, between 1996 and 2002, the trend in
satisfaction with the health care system was a negative one on average in all EU countries. But compared
to this average downward trend, satisfaction decreased less over the period in the UK, resulting in a net
positive difference in differences, as represented by the interaction (year x UK) coefficient. In other
words, citizens in the UK were more satisfied with their health care system after the reforms than they
would have been had they followed the trend evident in the other EU countries surveyed by the
Eurobarometer. This finding of a net positive effect also appears in the regression analysis based on the
comparison group consisting of the subset of four other countries with tax-financed health systems, as
represented by the significant and positive interaction term (year x UK). When the UK is compared to the
four other largest European countries by population and GDP, the interaction term is also positive but not
statistically significant.
Table 3 presents the regression analysis of the estimated impact of the UK reforms on perceived
performance of the health care system. The results indicate again that on average in all EU countries,
perceived performance decreased between 1996 and 2002. But compared to the average for other EU
countries, perceived performance decreased less over the period in the UK, as represented by the positive
interaction term (year x UK), which is statistically significant. When compared to the four other countries
11
with tax-funded health care, people in the UK viewed the health system as performing better, as evident
from the net positive, statistically significant interaction term (year x UK). And when comparing the UK
to the four other largest EU countries by population and GDP, the results again suggest a positive effect
but it is not statistically significant.
In sum, the results from these regression analyses do seem to indicate that citizen satisfaction
with health care and perceived performance of the health care system were higher in the UK, after the
reforms, than they would have been had the UK continued on the same trajectory as many other EU
countries during this time period (and controlling for potentially confounding variables). But the results
are less certain, it should be pointed out, when the UK is compared just with the four other largest EU
countries.
We have not said much about the magnitude of the regression coefficients and their policy
significance, largely because ordered logistic regression coefficients are not as intuitively interpretable as
ordinary regression coefficients. Thus, to address the substantive or policy significance of the regression
coefficients, Figures 1 and 2 present predicted probabilities with the control variables held constant at
their means and the “year” and “UK” variables fixed at 1. Then, to estimate the situation in the UK
without reform (the counterfactual), the interaction term (year x UK) is set at 0. And to estimate the
situation in the UK with the reforms (but holding the control variables constant relative to the comparison
countries), the interaction term is set at 1. As Figures 1 and 2 show, when compared to the 15 EU
countries in this dataset, the UK’s health system reforms led to an estimated 7.5% increase in the
probability of being satisfied or very satisfied with the health care system (95% confidence interval
[CI]=3.9%, 11.1%), and a 5.9% increase in the probability of perceiving the health system as running well
or needing only minor changes (95% CI = 2.3%, 9.5%). When compared to the four other EU countries
with well-established tax-financed health systems, the UK’s health system reforms led to an estimated
19.8% increase in the probability of being satisfied or very satisfied with the health care system (95% CI
= 16.6%, 23.1%), and a 15.6% increase in the probability of perceiving the health system as running well
or needing only minor changes (95% CI = 12.0%, 19.4%). When compared to the four other largest EU
12

countries, the UK’s health system reforms led to an estimated 2.5% increase in the probability of being
satisfied or very satisfied with the health care system (95% CI = -1.7%, 6.7%), and a 0.9% increase in the
probability of perceiving the health system as running well or needing only minor changes (95% CI = -
3.2%, 5.1%).
To put these percentages in even more meaningful policy terms, we can extrapolate them to the
adult population of the UK (about 48.6 million in 2002). Using the results from the EU 15 comparison
group, we estimate that there were about 3.6 million additional people in the UK who were satisfied or
very satisfied with the health care system than there would have been, absent the reforms. And we
estimate that there were about 2.9 million more people in the UK who perceived the health care system as
running well, or needing only minor changes, than there would have been, again absent the reforms.
Compared to the counterfactual based on the four other countries with tax-financed health care, we
estimate about 9.6 million more people in the UK after the reforms were satisfied or very satisfied with
the health system, and 7.6 million additional people perceived the health system as running well or
needing only minor changes. Given the least optimistic estimates, based on comparison with the four
other largest EU countries, about 1.2 million more people in the UK after the reforms were satisfied or
very satisfied with the health system, and about 400,000 more people perceived the health system as
running well or needing only minor changes than there would have been had the UK continued on the
same trajectory as these other countries. In sum, these various population projections indicate that the
estimated impacts of the reform were not trivial in magnitude.
Finally, it is worth commenting on some of the control variables in Tables 2 and 3. Although the
results are mixed across the six models, there are some broad patterns. Males and older citizens are
somewhat more positive about the health care system. However, those with an illness or health problem
view the health care system less favorably. Immigrants appear to be more satisfied in most of the models,
except in the models with the tax-financed countries (in which the relationship is negative). Employed
people are less positive about the health care system generally, but income has little consistent
relationship (although it is positive and statistically significant in the models involving all countries).
13

Compared to people living in rural areas (the reference category), those living in small towns tend to be
more positive while those living in large towns or cities seem appear more negative (except in the case of
the models involving the largest countries, which show a positive relationship). Finally, those who
identify themselves as politically conservative are slightly more satisfied is a few of the models, but the
relationships are not strong and mostly insignificant statistically. And those who prefer a limited role for
government in health care provision tend to view the health system more negatively. It is not our aim
here to make substantive interpretations of these relationships. Rather, we simply note that many of these
variables do have relationships with citizen satisfaction and perceived performance of the health system
but that, because we have controlled for these variables in our analysis, any changes over time in the
values of these variables across countries are not confounding our estimates of the impact of the UK
health reforms on satisfaction and perceived performance.
Discussion and Implications
Taken together, the results of our difference in differences analysis suggest that citizen
satisfaction and performance perceptions in the UK were more favorable after the reforms than what
would have occurred, absent the implementation of the reforms. The estimated improvement in
satisfaction and perceived performance is both statistically and substantively significant, as judged by the
estimated magnitude of the effect in the UK population. Thus our results provide some evidence that the
UK’s performance framework worked, at least somewhat, to improve the satisfaction of citizens with the
health care system. In this section, we discuss the implications of our results for policy and for research.
But first we must acknowledge certain limitations of our method and findings.
In a difference in differences analysis, any changes to the treatment group (in this case, citizens of
the UK), apart from what is accounted for by the trend in the comparison countries and the control
variables, is attributed to the intervention. Since we cannot control entirely for country-level factors, it is
possible that the changes in satisfaction and perceived performance may have been due to policies other
than the new public management-related reforms. In particular, research by Mossialos (1997) suggests a
14

generally positive relationship between per capita health expenditures and satisfaction with the health care
system using the 1996 Eurobarometer. Thus, change in satisfaction with the health care system in the UK
could be explained simply by increased spending in this sector. To address this possibility, Figure 3
shows the relationship between the change in a country’s health expenditures as a percentage of Gross
Domestic Product by the change in average citizen satisfaction with the health care system between 1996
and 2002. A positive relationship would be expected if spending rather than performance reforms made
the difference in satisfaction. As shown in the graph, there is no clear relationship. Some countries, such
as Sweden, increased spending on health care more than other countries between 1996 and 2002, yet
average satisfaction with the health system dropped considerably. Other countries, such as Spain,
decreased spending on health care but saw relatively smaller drops in average satisfaction with health
care. This lends more support to the finding that changes in citizen satisfaction with the health care
system in the UK were due to the performance reforms rather than to changes in health care spending.
Although we address the alternate explanation that health spending could explain differences in
citizen satisfaction with the health system, unobserved variables could still bias our estimations. For
example, another conceptual model for assessing satisfaction with public services is the expectation-
disconfirmation paradigm (Van Ryzin, 2004). This study does not control for expectations, which may
interact with quality to influence citizen perceptions (Carvalho, Brito, & Cabral, 2010). Additionally, our
study does not account for trends in country differences in satisfaction with public services. Results from
previous surveys have found that Greece, Italy, Portugal and Spain tended to have below-average
satisfaction, Austria, Luxemburg, Netherlands, Finland, and Denmark tended to have above-average
satisfaction, and Belgium, France, the UK, Germany, Ireland and Sweden tended to have close-to-average
satisfaction. (Clifton & Diaz-Fuentes, 2010). More broadly, many of the countries in the comparison
group were undergoing reform activities themselves during the period covered by this study, so that the
comparison groups (all 14 EU countries, the 4 tax-financed countries, and the 4 largest EU countries) are
not in any way a no-change comparison group. Thus, our estimates of the UK reforms represent the
15
impacts net of the medley of related changes going on in the rest of the EU countries during this time
period.
Another limitation of our study can be found in the outcome measures. New public management
reforms have other goals besides improving citizen satisfaction and perceived performance. Citizen
perceptions of the health care system may not correlate with experts’ views or other outcome measures
(Blendon, Kim, & Benson, 2001; Stipak, 1979). Padma, Rajendran, & Lokachari (2010) found that
patients treat the interpersonal aspect of health care as most important because they do not have the
expertise to evaluate the technical quality of services. However, these attitudes should be considered as
another important part of the decision making process. Particularly since the UK’s health system reforms
emphasized the experience of patients, citizen satisfaction with the system remains a relevant, if not
primary, goal of the policy. Our measures of citizen satisfaction have some other limitations.
Researchers in both public administration and business administration generally prefer multi-item
satisfaction scales (e.g. McMullan & O’Neil, 2010), whereas the dependent variables in our models are
single survey items. However, were limited by the available data and variables in the Eurobarometer
surveys.
Despite its limitations, this study does provide an initial attempt at least to evaluate the impact of
a major new public management reform in a very important sector, health care. There has been much
written and argued about new public management, as well as about performance measurement and
management more generally, but very few attempts to empirically examine the impact of such strategies
on actual public service provision and the experiences of citizens. Additional research could be
conducted to complement this study, examining other health care performance indicators, such as health
outcomes, costs, and equity. Future research could also evaluate the impact of new public management-
type reforms in other sectors besides health, for example education, crime, transportation, and
environmental protection. Indeed, the increasingly availability and sophistication of international
surveys, like the Eurobarometer, make possible similar difference in differences studies of the impacts of
governance reforms in other countries around the world.
16

While there have been philosophical debates about the strengths and weaknesses of new public
management reforms, empirical studies can better inform researchers, policymakers, and practitioners
about which features of these reforms may influence different types of outcomes. Our results suggest that
the quality and customer-focused aspects of new public management that were applied through the UK’s
health system reforms seem to have worked in this case. Policymakers’ and practitioners’ efforts to
measure, report, and improve quality may have noticeable effects on citizens’ attitudes.
17

References
Andrews, R., Boyne, G.A., Moon, J., & Walker, R.M. (2010). Assessing organizational performance: Exploring differences between internal and external measures. International Public Management Journal 13: 2.
Barzelay, M. (1992). Breaking through bureaucracy: A new vision for managing within government. Los Angeles: University of California Press.
Berwick, D.M., James, B., & Coye, M.J. (2003). Connections between quality measurement and improvement. Medical Care 41(1): I30-I38.
Bevan, G. (2010). Performance measurement of “knights” and “knaves”: Differences in approaches and impacts in British countries after devolution. Journal of Comparative Policy Analysis: Research and Practice 12(1-2): 33-56.
Bevan, G., & Hood, C. (2006). Have targets improved performance in the English NHS? British Medical Journal 332(7538): 419-422.
Bevan, G., & Hood, C. (2006). What’s measured is what matters: Targets and gaming in the English public health care system. Public Administration 84(3): 517-538.Blekesaune, M. & Quadagno, J. (2003). Public attitudes toward welfare state policies: A comparative analysis of 24 nations. European Sociological Review 19(5): 415-427.
Blendon, R.J., Kim, M., & Benson, J.M. (2001). The public versus the World Health Organization on health system performance. Health Affairs, 20(3): 10-20.
Carvalo, C., Brito, C., & Cabral, J.S. (2010). Towards a conceptual model for assessing the quality of public services. International Review of Public and Nonprofit Marketing 7(1): 69-86.
Clifton, J., & Diaz-Fuentes, D. (2010). Evaluating EU policies on public services: A citizens’ perspective. Annals of Public and Cooperative Economics 81(2): 281-311.
Directorate General for Research. (1998). Health care systems in the EU. A comparative study. Luxembourg: European Parliament.
Emmerson, C., Frayne, C. and Goodman, A. (2002). How much would it cost to increase UK health spending to the European average? IFS Briefing Notes , BN21.
Gevers, J., Gelissen, J., Arts, W., & Muffels, R. (2000). Public health care in the balance: Exploring popular support for health care systems in the European Union. International Journal of Social Welfare 9: 301-321.
Green, D.C., & Irvine, B. (2001). Health care in France and Germany: Lessons for the UK. London: Civitas.
Hall, J.A., Irish, J.T., Roter, D.L., Ehrlich, C.M., Miller, L.H. (1994). Satisfaction, gender, and communication in medical visits. Medical Care, 32: 1216-1231.
18

Hasenfeld, Y. & Rafferty, J.A. (1989). The determinants of public attitudes toward the welfare state. Social Forces 67(4): 1027-1048.
Heinrich, C.J. (2007). Evidence-based policy and performance management: Challenges and prospects in two parallel movements. American Review of Public Administration, 37(3): 255-277.
Howard, C. (2010). Are we being served? A critical perspective on Canada’s Citizens First satisfaction surveys. International Review of Administrative Sciences 76(1): 65-83.
Johnson, C., & Talbot, C. (2007). The UK Parliament and performance: Challenging or challenged? International Review of Administrative Sciences, 73: 113-131.
Jreisat, J.E. (2002). Comparative public administration and policy. Boulder, CO: Westview Press.
Kettl, D.F. (2005). The global public management revolution: A report on the transformation of governance. 2nd edition. Washington, DC: Brookings.
Lee, H.S., & Choi, Y.H. (2009). Determinants affecting user satisfaction with campus portal services in Korea. Journal of Internet Banking and Commerce 14(1): 1-18.
Leichter, H.M. (1979). A comparative approach to policy analysis. Health care policy in four nations. New York: Cambridge University Press.
McEldowney, J. (2003). Public management reform and administrative law in local public service in the UK. International Review of Administrative Sciences, 69: 69-82.
McKevitt, D., Millar, M., & Keogan, J.F. (2000). The role of the citizen-client in performance measurement: The case of the street-level public organization (SLPO). International Review of Administrative Sciences, 66: 619-636.
McMullan, R., & O’Neill, M. (2010). Towards a vald and reliable measure of visitor satisfaction. Journal of Vacation Marketing 16(1): 29-44.
Montalvo, D. (2009). Citizen satisfaction with municipal services. AmericasBarometer Insights, 14: 1-6.
Mossialos, E. (1997). Citizen’s views on health care systems in the 15 member states of the European Union. Health Economics, 6: 109-116.
NHS Executive. (1997). The new NHS. Modern. Dependable. London: Department of Health.
Oliver, A. (2005). The English National Health Service: 1979-2005. Health Economics, 14: S75-S99.
Organisation for Economic Co-operation and Development. OECD Health Data 2009, Paris: Organisation for Economic Co-operation and Development. URL: http://www.irdes.fr/ EcoSante/DownLoad/OECDHealthData_FrequentlyRequestedData.xls
Osborne, D., & Gaebler, T. (1992). Reinventing government: How the entrepreneurial spirit is transforming the public sector. Reading, MA: Addison-Wesley.
19

Padma, P., Rajendran, C., & Lokachari, P.S. (2010). Service quality and its impact on customer satisfaction in Indian hospitals: Perspectives of patients and their attendants. Benchmarking: An International Journal 17(6): 807-841.
Pollitt, C. (2008). Performance blight and the tyranny of the light? Accountability in advanced performance measurement regimes. Presented at the Kettering Seminar, Dayton, OH.
Pollitt, C. & Bouckaert, G. (2004). Public management reform: A comparative analysis. (2nd edition). New York: Oxford University Press.
Radin, B.A. (2006). Challenging the performance movement: Accountability, complexity, and democratic values. Washington, DC: Georgetown University Press.
Ravichandran, K., Mani, B.T., Kumar, S.A., & Prabhakaran, S. (2010). Influence of service quality on customer satisfaction. Application of Servqual model. International Journal of Business and Management 5(4): 117-124.
Rieder, S., & Lehmann, L. (2002). Evaluation of new public management reforms in Switzerland: Empirical results and reflections on methodology. International Public Management Review, 3(2): 25-43.
Robinson, R., & Dixon, A. (1999). Health care systems in transition: United Kingdom. Copenhagen: WHO Regional Office for Europe on behalf of the European Observatory on Health Systems and Policies.
Saltman, R.B., & Figueras, J., eds. (1997). European health care reform. Analysis of current strategies. Copenhagen: World Health Organization Regional Office for Europe.
Schachter, H.L. (2010). Objective and subjective performance measures. A note on terminology. Administration and Society 42(5): 550-567.
Stipak, B. (1979). Citizen satisfaction with urban services: Potential misuse as a performance indicator. Public Administration Review 39(1): 46-52.
Van Ryzin, G.G. 2004. Expectations, performance, and citizen satisfaction with urban services. Journal of Policy Analysis and Management 23(3): 433-448.
Van Ryzin, G.G., Immerwahr, S., & Altman, S. (2008). Measuring street cleanliness: A comparison of New York City’s scorecard and results from a citizen survey. Public Administration Review, 68(2): 295-303.
Walshe, K. (2002). The rise of regulation in the NHS. British Medical Journal, 324(7343): 967-970.
Weisman, C.S, Rich, D.E., Rogers, J., Crawford, K.G., Grayson, C.E., & Henderson, J.T. (2000). Gender and patient satisfaction with primary care: Tuning in to women in quality measurement. Journal of Women's Health & Gender-Based Medicine, 9(6): 657-665.
Wollman, H. (2003). Evaluation in public-sector reform: Concepts and practice in international perspective. Northampton, Massachusetts: Edward Elgar.
20

Table 1: Descriptive statistics 1996 2002
UK EU 14
Four Countries with Tax-Financed Systems
Four Largest
Countries UK EU 14
Four Countries with Tax-Financed Systems
Four Largest
Countries
Min Max Mean Mean Mean Mean Mean Mean Mean Mean Satisfaction with health care 1 5 3.00 3.40 3.80 3.26 2.72 2.43 2.80 2.86Perception of how well health system runs 1 4 2.43 2.83 3.09 2.72 2.24 2.49 2.51 2.52Male 0 1 0.48 0.48 0.49 0.48 0.48 0.48 0.49 0.48
Age 15 96 44.13 43.59 43.72 43.70 45.10 44.61 44.7
1 44.74Illness 1 3 1.30 1.27 1.29 1.27 1.34 1.29 1.32 1.26Immigrant 0 1 0.02 0.03 0.02 0.02 0.01 0.03 0.02 0.01Employed 0 1 0.62 0.52 0.49 0.53 0.45 0.51 0.53 0.51High income 0 1 0.35 0.38 0.41 0.38 0.35 0.33 0.41 0.31Missing income 0 1 0.29 0.25 0.19 0.26 0.37 0.31 0.28 0.32
Small town resident 0 1 0.42 0.39 0.43 0.44 0.40 0.39 0.45 0.43
Large town resident 0 1 0.39 0.26 0.27 0.26 0.31 0.28 0.30 0.28
Political ideology 1 10 5.09 5.20 5.53 4.95 5.04 5.22 5.44 5.01Role of gov in health care 1 5 3.98 3.55 3.61 3.60 3.57 3.65 3.69 3.69
21
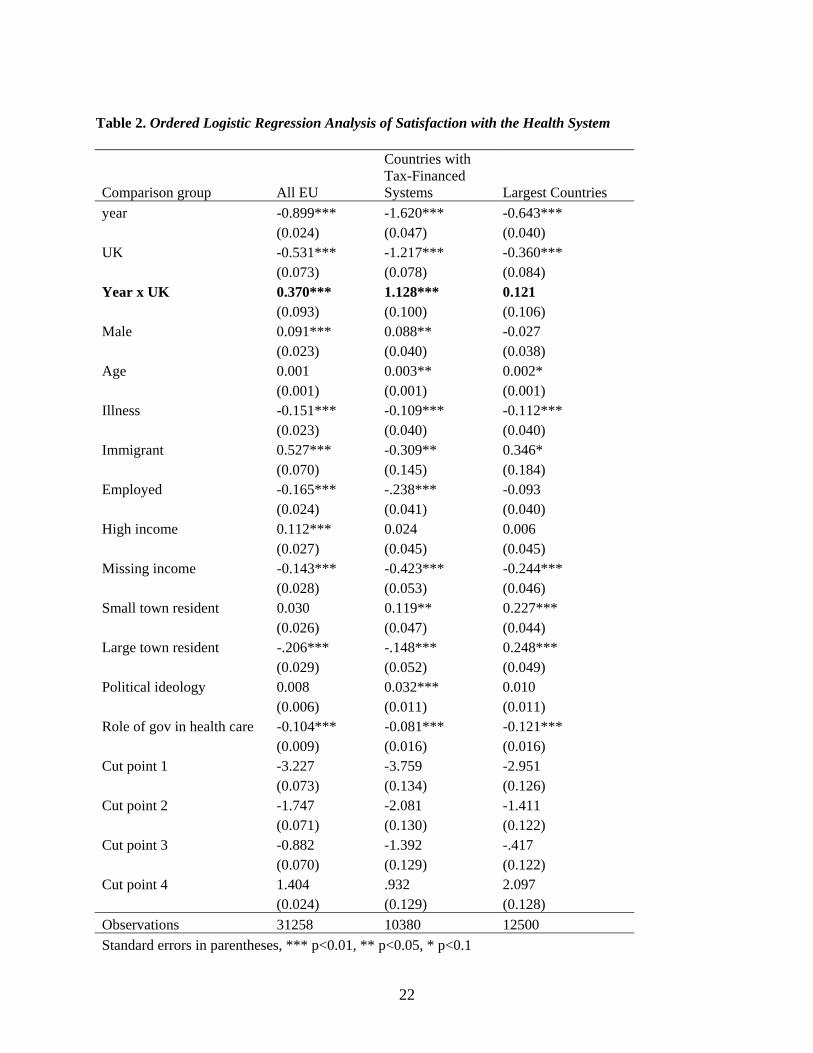
Table 2. Ordered Logistic Regression Analysis of Satisfaction with the Health System
Comparison group All EU
Countries with Tax-Financed Systems Largest Countries
year -0.899*** -1.620*** -0.643*** (0.024) (0.047) (0.040) UK -0.531*** -1.217*** -0.360*** (0.073) (0.078) (0.084) Year x UK 0.370*** 1.128*** 0.121 (0.093) (0.100) (0.106) Male 0.091*** 0.088** -0.027 (0.023) (0.040) (0.038) Age 0.001 0.003** 0.002* (0.001) (0.001) (0.001) Illness -0.151*** -0.109*** -0.112*** (0.023) (0.040) (0.040) Immigrant 0.527*** -0.309** 0.346* (0.070) (0.145) (0.184) Employed -0.165*** -.238*** -0.093 (0.024) (0.041) (0.040) High income 0.112*** 0.024 0.006 (0.027) (0.045) (0.045) Missing income -0.143*** -0.423*** -0.244*** (0.028) (0.053) (0.046) Small town resident 0.030 0.119** 0.227*** (0.026) (0.047) (0.044) Large town resident -.206*** -.148*** 0.248*** (0.029) (0.052) (0.049) Political ideology 0.008 0.032*** 0.010 (0.006) (0.011) (0.011) Role of gov in health care -0.104*** -0.081*** -0.121*** (0.009) (0.016) (0.016) Cut point 1 -3.227 -3.759 -2.951 (0.073) (0.134) (0.126) Cut point 2 -1.747 -2.081 -1.411 (0.071) (0.130) (0.122) Cut point 3 -0.882 -1.392 -.417 (0.070) (0.129) (0.122) Cut point 4 1.404 .932 2.097 (0.024) (0.129) (0.128) Observations 31258 10380 12500 Standard errors in parentheses, *** p<0.01, ** p<0.05, * p<0.1
22
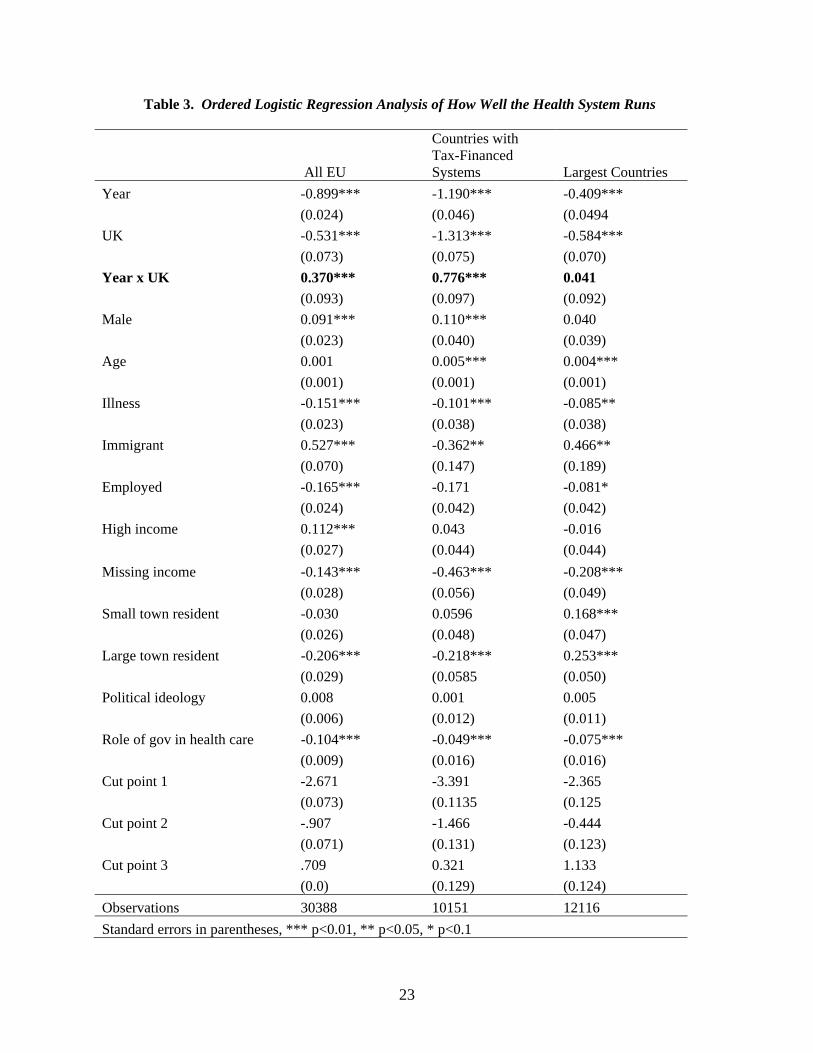
Table 3. Ordered Logistic Regression Analysis of How Well the Health System Runs
All EU
Countries with Tax-Financed Systems Largest Countries
Year -0.899*** -1.190*** -0.409*** (0.024) (0.046) (0.0494 UK -0.531*** -1.313*** -0.584*** (0.073) (0.075) (0.070) Year x UK 0.370*** 0.776*** 0.041 (0.093) (0.097) (0.092) Male 0.091*** 0.110*** 0.040 (0.023) (0.040) (0.039) Age 0.001 0.005*** 0.004*** (0.001) (0.001) (0.001) Illness -0.151*** -0.101*** -0.085** (0.023) (0.038) (0.038) Immigrant 0.527*** -0.362** 0.466** (0.070) (0.147) (0.189) Employed -0.165*** -0.171 -0.081* (0.024) (0.042) (0.042) High income 0.112*** 0.043 -0.016 (0.027) (0.044) (0.044) Missing income -0.143*** -0.463*** -0.208*** (0.028) (0.056) (0.049) Small town resident -0.030 0.0596 0.168*** (0.026) (0.048) (0.047) Large town resident -0.206*** -0.218*** 0.253*** (0.029) (0.0585 (0.050) Political ideology 0.008 0.001 0.005 (0.006) (0.012) (0.011) Role of gov in health care -0.104*** -0.049*** -0.075*** (0.009) (0.016) (0.016) Cut point 1 -2.671 -3.391 -2.365 (0.073) (0.1135 (0.125 Cut point 2 -.907 -1.466 -0.444 (0.071) (0.131) (0.123) Cut point 3 .709 0.321 1.133 (0.0) (0.129) (0.124) Observations 30388 10151 12116 Standard errors in parentheses, *** p<0.01, ** p<0.05, * p<0.1
23
34.2%
27.5%
14.4%
24.7%
32.2%30.0%
0%
5%
10%
15%
20%
25%
30%
35%
40%
All EU Countries withtax-financed
systems
Largestcountries
CounterfactualUK post-reform
Figure 1. Regression-adjusted change in predicted probabilities for being satisfied or very satisfied
with the health care system.
24

34.8%
21.1%
31.5%
37.4% 36.8% 35.7%
0%
5%
10%
15%
20%
25%
30%
35%
40%
All EU Countries withtax-financed
systems
Largestcountries
CounterfactualUK post-reform
Figure 2. Regression-adjusted change in predicted probabilities for perceiving the health system as running well or needing only minor changes.
25

FrUK
Ge
Be
De
IrFi
Gr
Ne
Po
Sw
Lu
AuIt
Sp
-1.4
-1.2
-1
-0.8
-0.6
-0.4
-0.2
0
0.2
-0.5 -0.3 -0.1 0.1 0.3 0.5 0.7 0.9 1.1 1.3
Figure 3. Change in satisfaction with the health care system by change in health expenditures as a
percentage of GDP, 1996-2002.
26