a disparity study for the commonwealth of virginia
TRANSCRIPT
A Disparity Study for the Commonwealth
of Virginia
Submitted to:
Mr Sam el Ha es
of Virginia
FINAL REPORTSubmitted by:
Mr. Samuel Hayes
Commonwealth of Virginia
1100 Bank Street, Suite 300
Richmond, VA 23219-3639
January 13, 2010

AA DDiissppaarr iitt yy SStt uuddyy ffoorr tt hhee
CCoommmmoonnwweeaalltt hh ooff VViirrggiinniiaa
FFIINNAALL RREEPPOORRTT
Submitted by:
2123 Centre Pointe Boulevard
Tallahassee, Florida 32308-4930
(850) 386-3191
January 13, 2010
TABLE OF CONTENTS
PAGE 1.0 INTRODUCTION ................................................................................................ 1-1 1.1 Technical Approach ................................................................................. 1-1 1.2 Report Organization ................................................................................. 1-2 2.0 LEGAL REVIEW ................................................................................................. 2-1
2.1 Introduction .............................................................................................. 2-1 2.2 Standards of Review for Race-Specific and Gender-Specific Programs .................................................................................................. 2-2 2.3 To Withstand Strict Scrutiny, an MBE Program Must Be Based on Thorough Evidence Showing a Compelling Governmental Interest ......... 2-5 2.4 Sufficiently Strong Evidence of Significant Statistical Disparities Between Qualified Minorities Available and Minorities Utilized Will Satisfy Strict Scrutiny and Justify a Narrowly Tailored M/WBE Program ................................................................................................... 2-7 2.5 The Governmental Entity or Agency Enacting an M/WBE Program Must Be Shown to Have Actively or Passively Perpetuated the Discrimination ......................................................................................... 2-13 2.6 To Withstand Strict Scrutiny, an M/WBE Program Must Be Narrowly Tailored to Remedy Identified Discrimination ......................................... 2-15 2.7 Small Business Procurement Preferences ............................................. 2-20 2.8 Conclusions ............................................................................................ 2-21
3.0 REVIEW OF REMEDIAL POLICIES .................................................................. 3-1 3.1 Methodology ............................................................................................. 3-1 3.2 Background .............................................................................................. 3-2 3.3 SWaM Outreach ....................................................................................... 3-4 3.4 SWaM Incentives ..................................................................................... 3-5 3.5 Disadvantaged Business Enterprise Program ......................................... 3-7 3.6 SWaM Reporting ...................................................................................... 3-7 3.7 Department of Minority Business Enterprise ............................................ 3-8 3.8 SWaM/DBE Certification .......................................................................... 3-9 3.9 Business Development Programs .......................................................... 3-10 3.10 Conclusions ............................................................................................ 3-13 4.0 UTILIZATION AND AVAILABILITY ANALYSIS .................................................. 4-1 4.1 Methodology ............................................................................................. 4-1 4.2 Utilization Data Collection and Management ........................................... 4-3 4.3 Availability Data ........................................................................................ 4-6 4.4 Results from the 2004 Procurement Disparity Study of the Commonwealth of Virginia ....................................................................... 4-8

TABLE OF CONTENTS (Continued)
PAGE
4.5 Prime Construction Utilization Analysis – Commonwealth Accounting Reporting System (CARS) .................................................... 4-9 4.6 Subcontractor Utilization (Construction) Analysis – Small, Women-,
and Minority-owned Business Program’s (SWaM) Dashboard, Analytics, and Reporting System ........................................................... 4-19
4.7 Availability Analysis – Prime and Subcontractor .................................... 4-25 4.8 Summary ................................................................................................ 4-30 5.0 DISPARITY ANALYSIS ...................................................................................... 5-1 5.1 Methodology ............................................................................................. 5-1 5.2 Disparity Indices ....................................................................................... 5-2 6.0 PRIVATE SECTOR ANALYSIS .......................................................................... 6-1 6.1 Introduction .............................................................................................. 6-3 6.2 Self-Employment Rates and Earnings as an Analog of Business Formation and Maintenance .................................................................... 6-4 6.3 Research Questions, Statistical Models, and Methods ............................ 6-5 6.4 Results of the Self-Employment Analysis ................................................ 6-7 6.5 Summary of Self-Employment Analysis Findings .................................. 6-13 7.0 FINDINGS AND RECOMMENDATIONS............................................................ 7-1 7.1 Findings for M/WBE Utilization and Availability ........................................ 7-1 7.2 Findings for the Commonwealth SWaM Program .................................... 7-6 7.3 Commendations and Recommendations ................................................. 7-7 7.4 Selected Best Practices ......................................................................... 7-14 APPENDICES: Appendix A: Commonwealth of Virginia CARS Chart of Accounts Appendix B: Prime Contractor Utilization Based on Commonwealth Accounting and
Reporting System (CARS) Includes Department of Transportation Appendix C: Prime Utilization and Disparity Analysis by Business Category and Self –
Reporting Universities Appendix D: D(a): Private Sector Commercial Construction Analysis D(b): Private Sector Commercial Construction Analysis, City of Richmond,
Virginia Commercial Permits Data Appendix E: Private Sector Commercial Construction Analysis - Reed Construction Data Appendix F: Private Sector Discussion Appendix G: Custom Census Survey Instrument

TABLE OF CONTENTS (Continued)
PAGE
APPENDICES (Continued) Appendix H: U.S. Census Survey of Business Owners Construction Services,
Construction-Related Services, and Architecture and Engineering Services - Special Tabulations
Appendix I: U.S. Census Survey of Business Owners Appendix J: Commonwealth of Virginia PUMS Regression Analysis Appendix K: Vendor Lists, Membership Lists, and Commercial Construction Permits
Data Request Appendix L: Vendor and Membership List Request/Commercial Construction Permits
List of Organizations and Jurisdictions Contacted Appendix M: Subcontractor Utilization by Functional Area Obtained from the
Commonwealth’s Small, Women-, and Minority-Owned Business Program’s Dashboard, Analytics, and Reporting System (Dashboard)
Appendix N: Prime Contractor Utilization Based on the Commonwealth Accounting and Reporting System (CARS) by Agency Name and Race/Ethnicity/Gender Classification (Excludes Department of Transportation)

1.0 INTRODUCTION
Page 1-1
1.0 INTRODUCTION
On November 5, 2009, the Commonwealth of Virginia (Commonwealth) contracted with MGT of America, Inc. (MGT), to conduct a two phase comprehensive update to their 2004 Procurement Disparity Study. The purpose of Phase I of the study was to analyze the use, through procurement transactions, of minority1- and nonminority women-owned business enterprises (M/WBEs) and nonminority male-owned business enterprises (non-M/WBEs) by agencies and institutions of the Commonwealth pursuant to the Commonwealth’s Request For Proposal # NCH-2009-0716.
Phase II of the study, if executed, would include the gathering of anecdotal evidence, such as, community outreach, business interviews, focus groups, etc., to determine whether underutilization of M/WBEs results from objective, nonbiased bidding and purchasing procedures or from discriminatory practices.
Governmental entities like the Commonwealth have authorized disparity studies in response to the City of Richmond v. J. A. Croson Co.2 (Croson) decision to determine whether there is a compelling interest for remedial procurement programs. Recommendations resulting from such studies are used to narrowly tailor any resulting programs to specifically address findings of underutilization attributable to unfair business practices. The findings, analyses, and recommendations of the Commonwealth’s update Disparity Study are presented in the chapters that follow. This chapter summarizes the technical approach, the major tasks undertaken, and provides an overview of the organization of the report.
1.1 Technical Approach In conducting the study and preparing recommendations, MGT followed a carefully designed work plan that allowed study team members to fully analyze availability, utilization, and disparity with regard to minority and nonminority women, and nonminority male-owned firms. MGT’s approach has been tested in over 127 jurisdictions, and proven reliable to meet the study’s objectives. The work plan consisted of, but was not limited to, the following major tasks:
Finalizing the work plan.
Conducting a legal review.
Reviewing policies, procedures, and programs.
Conducting data assessment and data collection.
Determining the availability of qualified firms.
1 Minority women were included in their respective minority business ownership classification.
2 City of Richmond v. J. A. Croson, Co., 488 U.S. 469 (1989).
Introduction
Page 1-2
Analyzing utilization and availability data for disparity and statistical significance.
Conducting disparity analyses of the relevant private market.
Reviewing race- and gender-neutral remedies.
Identifying narrowly tailored race- and gender-based and race- and gender-neutral remedies.
Preparing draft and final reports for this study.
1.2 Report Organization The following chapters of this report are designed to give the reader a comprehensive overview of the Commonwealth’s procurement practices; past and present patterns of minority, nonminority women, and nonminority male availability and utilization; and a broad understanding of the environment in which the Commonwealth, as well as agencies and institutions, operates. The study reviewed Commonwealth contract and procurement data from the period of July 1, 2005 through June 30, 2009. The overview of each chapter is as follows:
Chapter 2.0 presents an overview of controlling legal precedents that impact remedial procurement programs and guide disparity study methodology.
Chapter 3.0 presents a review of the Commonwealth’s procurement policies and procedures, and an analysis of its small, women-, and minority-owned businesses (SWaM) program and race- and gender-neutral efforts.
Chapter 4.0 presents the methodology employed in conducting and analyzing the utilization and availability of minority, women, and nonminority businesses in procurement.
Chapter 5.0 presents an analysis of the levels of disparity for minority, women, and nonminority prime contractors and subcontractors, and a review of the multivariate analysis used to determine levels of disparity.
Chapter 6.0 presents an analysis of private sector utilization and disparity and its effect on the ability of firms to win procurement contracts from the Commonwealth.
Chapter 7.0 presents a summary of the overall report, conclusions, and recommendations.3
Appendices A–N contains additional exhibits on utilization, availability, and disparity as well as additional statistical analysis and supporting documentation.
3 Chapter 7.0 is designed to provide a summary of the overall report, conclusions drawn from the study, and
MGT’s recommendations.

2.0 LEGAL REVIEW

Page 2-1
2.0 LEGAL REVIEW
2.1 Introduction
This chapter provides legal background for the study. The material that follows does not constitute legal advice to the Commonwealth of Virginia on minority and women business enterprise (M/WBE) programs, affirmative action, or any other matter. Instead, it provides a context for the statistical and anecdotal analysis that appears in subsequent chapters of this report. The focus of this chapter is on M/WBE programs.
The Supreme Court decisions in Richmond v. Croson Company (Croson),1 Adarand v. Peña (Adarand),2 and later cases have established and applied the constitutional standards for an affirmative action program. This chapter identifies and discusses those decisions, summarizing how courts evaluate the constitutionality of race-specific and gender-specific programs. Decisions of the Fourth Circuit offer the most directly binding authority; the Fourth Circuit has not directly addressed MWBE programs since the Croson decision. Consequently, this review considers decisions from other circuits.
By way of a preliminary outline, the courts have determined that an affirmative action program involving governmental procurement of goods or services must meet the following standards:
A remedial race-conscious program is subject to strict judicial scrutiny under the Equal Protection Clause of the Fourteenth Amendment to the United States Constitution.
Strict scrutiny has two basic components: a compelling governmental interest in the program and narrow tailoring of the program.
To survive the strict scrutiny standard, a remedial race-conscious program must be based on a compelling governmental interest.
“Compelling interest” means the government must prove past or present racial discrimination requiring remedial attention.
There must be a specific “strong basis in the evidence” for the compelling governmental interest.
Statistical evidence is preferred and possibly necessary as a practical matter; anecdotal evidence is permissible and can offer substantial support, but it probably cannot stand on its own.
Program(s) designed to address the compelling governmental interest must be narrowly tailored to remedy the identified discrimination.
“Narrow tailoring” means the remedy must fit the findings.
1 Richmond v. Croson, 488 U.S. 469 (1989).
2 Adarand v. Peña, 515 U.S. 200 (1995).

Legal Review
Page 2-2
The evidence showing compelling interest must guide the tailoring very closely.
Race-neutral alternatives must be considered first.
A lesser standard, intermediate judicial scrutiny, applies to programs that establish gender preferences.
To survive the intermediate scrutiny standard, the remedial gender-conscious program must serve important governmental objectives and be substantially related to the achievement of those objectives.
The evidence does not need to be as strong and the tailoring does not need to be as specific under the lesser standard.
2.2 Standards of Review for Race-Specific and Gender-Specific Programs
2.2.1 Race-Specific Programs: The Croson Decision
Croson established the framework for testing the validity of programs based on racial discrimination. In 1983, the Richmond City Council (Council) adopted a Minority Business Utilization Plan (the Plan) following a public hearing in which seven citizens testified about historical societal discrimination. In adopting the Plan, the Council also relied on a study indicating that “while the general population of Richmond was 50 percent African American, only 0.67 percent of the city’s prime construction contracts had been awarded to minority businesses in the five-year period from 1978 to 1983.”3
The evidence before the Council also established that a variety of state and local contractor associations had little or no minority business membership. The Council relied on statements by a Council member whose opinion was that “the general conduct of the construction industry in this area, the state, and around the nation, is one in which race discrimination and exclusion on the basis of race is widespread.”4 There was, however, no direct evidence of race discrimination on the part of the city in its contracting activities, and no evidence that the city’s prime contractors had discriminated against minority-owned subcontractors.5
The Plan required the city’s prime contractors to subcontract at least 30 percent of the dollar amount of each contract to one or more minority-owned business enterprises (MBEs). The Plan did not establish any geographic limits for eligibility. Therefore, an otherwise qualified MBE from anywhere in the United States could benefit from the 30 percent set-aside.
J.A. Croson Company, a non-MBE mechanical plumbing and heating contractor, filed a lawsuit against the city of Richmond alleging that the Plan was unconstitutional because it violated the Equal Protection Clause of the Fourteenth Amendment. After a considerable record of litigation and appeals, the Fourth Circuit struck down the Richmond Plan and the Supreme Court affirmed this decision.6 The Supreme Court determined that strict scrutiny
3 Id. at 479-80.
4 Id. at 480.
5 Id.
6 Id. at 511.

Legal Review
Page 2-3
was the appropriate standard of judicial review for MBE programs, so that a race-conscious program must be based on a compelling governmental interest and be narrowly tailored to achieve its objectives. This standard requires a firm evidentiary basis for concluding that the underutilization of minorities is a product of past discrimination.7
2.2.2 Gender-Specific Programs
The Supreme Court has not addressed the specific issue of a gender-based classification in the context of a woman-owned business enterprise (WBE) program. Croson was limited to the review of an MBE program. In evaluating gender-based classifications, the Court has used what some call “intermediate scrutiny,” a less stringent standard of review than the “strict scrutiny” applied to race-based classifications. Intermediate scrutiny requires that classifying persons on the basis of sex “must carry the burden of showing an exceedingly persuasive justification for the classification.”8 The classification meets this burden “only by showing at least that the classification serves important governmental objectives and that the discriminatory means employed are substantially related to the achievement of those objectives.”9
The Second Circuit has ruled in a post-Croson employment case that “intermediate scrutiny continues to apply to gender-based affirmative-action plans.”10 Several other federal circuit courts have applied intermediate scrutiny to WBE programs and yet have found the programs to be unconstitutional.11 Nevertheless, in Coral Construction v. King County (Coral Construction), the Ninth Circuit upheld a WBE program under the intermediate scrutiny standard.12 Even using intermediate scrutiny, the court in Coral Construction noted that some degree of discrimination must be demonstrated in a particular industry before a gender-specific remedy may be instituted in that industry. As the court stated, “The mere recitation of a benign, compensatory purpose will not automatically shield a gender-specific program from constitutional scrutiny.”13 Indeed, one court has questioned the concept that it might be easier to establish a WBE program than it is to establish an MBE program.14
The Tenth Circuit, on the second appeal in Concrete Works of Colorado v. City and County of Denver (Concrete Works IV),15 approved the constitutionality of a WBE program based on evidence comparable to that supporting an MBE program that the court also upheld in the same decision. Unlike Coral Construction, however, Concrete Works IV offered no independent guidance on the level of evidence required to support a WBE program.
7 Id. at 493.
8 Mississippi University for Women v. Hogan, 458 U.S. 718, 724 (1982) (quoting Kirchberg v. Feenstra, 450 U.S.
455, 461 (1981)); see also United States v. Virginia, 518 U. S. 515, 531 (1996), Nguyen v. U.S., 533 U.S. 53, 60 (2001). 9 Mississippi University for Women, supra, at 724 (quoting Wengler v. Druggists Mutual Insurance Company, 446
U.S. 142, 150 (1980)); see also Virginia, supra, at 533, Nguyen, supra, at 60. 10
Ramos v. Vernon, 353 F.3d 171 (2d Cir 2003). See also Contractors Ass'n v. City of Philadelphia, 6 F.3d
990, 1001 (3d Cir. 1993) (“We agree with the district court's choice of intermediate scrutiny to review the Ordinance's gender preference.”). 11
See, e.g., AUC v. Baltimore, 83 F.Supp.2d 613 (D. Md. 2000); Engineering Contractors v. Dade County, 122 F.3d 895 (11
th Cir. 1997); Builders Association v. County of Cook, 256 F.3d 642 (7
th Cir. 2001). The Fifth
Circuit did not address the application of intermediate scrutiny to WBE participation in Scott v. City of Jackson, 199 F.3d 206, 215 n.9 (5
th Cir. 1999).
12 Coral Construction v. King County, 941 F.2d 910 (9
th Cir. 1991), cert. denied, 502 U.S. 1033 (1992).
13 Id. at 932.
14 Builders Association, 256 F.3d at 644. See also Western State Paving v. Washington DOT, 407 F.3d 983,
991, n.6 (9th
Cir. 2005) (rejecting need for separate analysis of WBE program under intermediate scrutiny). 15
321 F.3d 950 (10th
Cir. 2003).

Legal Review
Page 2-4
2.2.3 An Overview of the Applicable Case Law
Croson did not find a compelling justification for a complete MBE program, and there are no post-Croson decisions of the Fourth Circuit on MBE programs. Croson found the city of Richmond’s evidence to be inadequate as a matter of law. Nevertheless, more recent cases in other federal circuits have addressed applications of the law that were not considered in Croson. Thus, it becomes necessary to look to the decisions of other federal circuits to predict the level of evidence that might be required to establish an affirmative action program.
The discussion in this review will also attend closely to the most relevant decisions in the area of government contracting. Justice O’Connor, distinguishing her majority opinion on affirmative action in law school admissions from her opinions in government contracting cases, wrote:
Context matters when reviewing race-based governmental action under the Equal Protection Clause. . . . Not every decision influenced by race is equally objectionable and strict scrutiny is designed to provide a framework for carefully examining the importance and the sincerity of the reasons advanced by the governmental decisionmaker for the use of race in that particular context.16
Further, some caution must be exercised in relying upon opinions of the federal district courts, which make both findings of fact and holdings of law. As to holdings of law, the district courts are ultimately subject to rulings by their circuit courts. As to matters of fact, their decisions depend heavily on the precise record before them, in these cases frequently including matters such as evaluations of the credibility and expertise of witnesses. Such findings are not binding precedents outside their districts, even if they may indicate the kind of evidence and arguments that might succeed elsewhere.
Finally, the ways in which state governments participate in national DBE programs is a specialized issue distinct from that of supporting state government programs, even if the same kinds of evidence and same levels of review apply. In Adarand, the Supreme Court did decide that federal DBE programs should be examined by the same strict scrutiny standard that Croson mandated for state and local programs. Nevertheless, cases considering national DBE programs have many important distinctions from cases considering municipal programs, particularly when it comes to finding a compelling governmental interest.17 The national DBE cases have somewhat more application in determining whether a local program is narrowly tailored, as discussed in Section 2.6 below.18 Thus, the majority of this review will be based on decisions of the federal circuit courts applying Croson to city or county programs designed to increase participation by M/WBEs in
16
Grutter v. Bollinger, 539 U.S. 306, 327 (2003). 17
See, e.g., Adarand v. Slater, 228 F.3d 1147 (10th
Cir. 2000), cert. granted in part sub nom. Adarand Constructors, Inc. v. Mineta, 532 U.S. 941 (2001); cert. dismissed as improvidently granted, 534 U.S. 103 (2001); Sherbrooke Turf v. Minnesota DOT, 345 F.3d 963 (8
th Cir. 2003).
18 The Ninth Circuit ruled in Western State Paving v. Washington DOT that specific evidence of discrimination
was necessary at a state level in order for the implementation of race-conscious goals to be narrowly tailored. Western State Paving v. Washington DOT, 407 F.3d 983 (9
th Cir. 2005). In Northern Contracting v. Illinois DOT,
the district court, while not striking down the program, also required the Illinois DOT to develop local evidence of discrimination sufficient to justify the imposition of race-conscious goals. In this sense, for these cases narrow tailoring still requires factual predicate information to support race-conscious program elements in a DBE program. Northern Contracting v. Illinois DOT, No. 00 4515 (ND IL 2004).
Legal Review
Page 2-5
government contracting, which is not a large body of case law. While other cases are useful as to particular points, only a handful of circuit court cases have reviewed strictly local M/WBE programs and given clear, specific, and binding guidance about the adequacy of a complete factual record including thorough, local disparity studies with at least some statistical analysis. Further, in one of the three directly applicable circuit court cases, the Third Circuit evaded the issue of compelling justification after lengthy discussion, holding that the Philadelphia M/WBE program was unconstitutional because it was not narrowly tailored.19
Ultimately, only two circuit court decisions since Croson have passed definitively on thorough, strictly local disparity studies: Engineering Contractors Association of South Florida, Inc.,20 and Concrete Works IV.21 In Engineering Contractors, the Eleventh Circuit ultimately upheld the district court finding that Dade County’s disparity studies were not adequate to support an M/WBE program, at least in the face of rebuttal evidence.22 By contrast, in Concrete Works IV, the Tenth Circuit, after holding that the district court had used an improper standard for weighing the evidence, went on to evaluate the evidence and determine that it was adequate as a matter of law to establish a compelling justification for Denver’s program. The Supreme Court refused to hear the appeal in Concrete Works IV,23 although the refusal in itself has no precedential effect. The dissent to that denial, written by Justice Scalia with the Chief Justice joining, argues that these cases may mark a split in approach among the circuits that will need to be reconciled.
2.3 To Withstand Strict Scrutiny, an MBE Program Must Be Based on Thorough Evidence Showing a Compelling Governmental Interest
For government contracting programs, courts have yet to find a compelling governmental interest for affirmative action other than remedying discrimination in the relevant marketplace. In other arenas, diversity has served as a compelling governmental interest for affirmative action. For example, the Ninth Circuit upheld race-based admission standards at an experimental elementary school in order to provide a more real world education experience.24 More recently, in Petit v. Chicago, the Seventh Circuit relied on Grutter v. Bollinger (Grutter) in stating that urban police departments had “an even more compelling need for diversity” than universities and upheld the Chicago program “under the Grutter standards.”25 The recent holding that other compelling interests may support affirmative action does not yet appear to have any application to public contracting.26
Croson identified two necessary factors for establishing racial discrimination sufficiently to demonstrate a compelling governmental interest in establishing an M/WBE program. First,
19
Contractors Association v. Philadelphia, 91 F.3d 586, 605 (3rd
Cir. 1996). 20
122 F.3d 895. 21
321 F.3d 950. 22
Compare Cone Corporation v. Hillsborough County, 908 F.2d 908 (11th
Cir. 1990), an earlier decision of the Eleventh Circuit reversing summary judgment against an MBE program where more limited statistical evidence was found adequate to require a trial on the merits in the face of a relatively weak challenge. 23
Concrete Works v. Denver, Scalia, J. dissenting, 124 S.Ct. 556, 557-60 (2003). 24
Hunter v. Regents of University of California, 190 F.3d 1061 (9th
Cir. 1999). 25
Petit v. Chicago, 352 F.3d 1111 (7th
Cir. 2003). 26
Grutter v. Bollinger, 539 U.S. 306 (2003). For an argument that other bases could serve as a compelling interest in public contracting, see Michael K. Fridkin, “The Permissibility of Non-Remedial Justifications for Racial Preferences in Public Contracting,” 24 N. Ill. U. L. Rev. 509 (Summer 2004).
Legal Review
Page 2-6
there needs to be identified discrimination in the relevant market.27 Second, “the governmental actor enacting the set-aside program must have somehow perpetuated the discrimination to be remedied by the program,”28 either actively or at least passively with “the infusion of tax dollars into a discriminatory industry.”29
Although the Supreme Court in Croson did not specifically define the methodology that should be used to establish the evidentiary basis required by strict scrutiny, the Court did outline governing principles. Lower courts have expanded the Supreme Court’s Croson guidelines and have applied or distinguished these principles when asked to decide the constitutionality of state, county, and city programs that seek to enhance opportunities for minorities and women.
2.3.1 Post-Enactment Evidence
The Supreme Court in Croson found pre-enactment evidence of discrimination insufficient to justify the program. The defendant in Croson did not seek to defend its program based on post-enactment evidence. However, following Croson, a number of circuits did defend the use of post-enactment evidence to support the establishment of a local public affirmative action program.30 Some cases required both pre-enactment and post-enactment evidence.31
The Supreme Court case of Shaw v. Hunt32 (Shaw) raised anew the issue of post-enactment evidence in defending local public sector affirmative action programs. Shaw involved the use of racial factors in drawing voting districts in North Carolina. In Shaw, the Supreme Court rejected the use of reports providing evidence of discrimination in North Carolina because the reports were not developed before the voting districts were designed. Thus, the critical issue was whether the legislative body believed that discrimination had existed before the districts were drafted.33 Following the Shaw decision, two districts courts rejected the use of post-enactment evidence in the evaluation of the constitutionality of local minority business programs.34 A federal circuit court decision, covering the federal small disadvantaged business enterprise program, stated that, “For evidence to be relevant in a strict scrutiny analysis of the constitutionality of a statute, it must be proven to have been before Congress prior to enactment of the racial classification.”35
2.3.2 Racial Classifications Subject to Strict Scrutiny
In Scott v. Jackson, the city argued that its disadvantaged business program was not a racial classification subject to strict scrutiny because (1) it was based upon disadvantage, not race, and (2) it was a goals program and not a quota. The Fifth Circuit disagreed with the claim that the Jackson program was not a racial classification because the city used the federal Section 8(d), which grants a rebuttable presumption of social and economic
27
Croson, 488 U.S. at 492, 509-10. 28
Coral Construction, 941 F.2d at 918. 29
Id. at 922. 30
See, e.g., Engineering Contractors v. Dade County, 122 F.3d 895 (11th
Cir. 1997); Contractors Association v. Philadelphia, 6 F.3d 990, 1009 n. 18 (3rd Cir. 1993); Concrete Works v. Denver, 36 F.3d 1513 (10
th Cir. 1994).
31 See, e.g., Coral Construction, 941 F.2d 910, 920.
32 Shaw v. Hunt, 517 U.S. 899 (1996).
33 Id. at 910.
34 AUC v. Baltimore, 83 F.Supp.2d 613, 620-22 (D.Md. 2000); West Tenn. ABC v. Memphis City Schools, 64
F.Supp.2d 714, 718-21 (W.D. Tenn. 1999). 35
Rothe v. U.S. Dept. of Defense, 413 F.3d 1327, 1328 (Fed Cir 2005).

Legal Review
Page 2-7
disadvantage to firms owned by minorities.36 Such a presumption is subject to strict scrutiny. The Fifth Circuit also noted that strict scrutiny applied not simply when race-conscious measures were required, but also when such measures were authorized or encouraged.37
2.4 Sufficiently Strong Evidence of Significant Statistical Disparities Between Qualified Minorities Available and Minorities Utilized Will Satisfy Strict Scrutiny and Justify a Narrowly Tailored M/WBE Program
The Supreme Court in Croson stated that “where gross statistical disparities can be shown, they alone in a proper case may constitute prima facie proof of a pattern or practice of discrimination.”38 But the statistics must go well beyond comparing the rate of minority presence in the general population to the rate of prime construction contracts awarded to MBEs. The Court in Croson objected to such a comparison, indicating that the proper statistical evaluation would compare the percentage of qualified MBEs in the relevant market with the percentage of total municipal construction dollars awarded to them.39
To meet this more precise requirement, courts have accepted the use of a disparity index.40
The Supreme Court in Croson recognized statistical measures of disparity that compared the number of qualified and available M/WBEs with the rate of state construction dollars actually awarded to M/WBEs in order to demonstrate discrimination in a local construction industry.41 The Fifth Circuit noted that “other courts considering equal protection challenges to minority-participation programs have looked to disparity indices, or to computation of disparity percentages, in determining whether Croson’s evidentiary burden is satisfied.”42 At the same time, the Fifth Circuit denied that it was attempting to “craft a precise mathematical formula to assess the quantum of evidence that rises to the Croson ‘strong basis in evidence’ benchmark.”43
2.4.1 Determining Availability
To perform proper disparity analysis, the government must determine “availability”—the number of qualified minority contractors willing and able to perform a particular service for the state and local government. In Croson, the Court stated, “Where there is a significant statistical disparity between the number of qualified minority contractors willing and able to perform a particular service and the number of such contractors actually engaged by the locality or the locality’s prime contractors, an inference of discriminatory exclusion could arise.”44
An accurate determination of availability also permits the government to meet the requirement that it “determine the precise scope of the injury it seeks to remedy” by its
36
Scott v. City of Jackson, 199 F.3d 206, 216-17 (5th
1999). 37
Id.at 215 (quoting Bras v. California Public Utilities Commission, 59 F.3d 869, 875 (9th
Cir. 1995)). 38
Croson, 488 U.S. at 501, quoting Hazelwood School Division v. United States, 433 U.S. 299, 307-308 (1977). 39
Id. at 501. 40
See, e.g., Engineering Contractors, 122 F.3d at 914; Concrete Works IV, 321 F.3d at 964-69. 41
Croson, 488 U.S. at 503-504. 42
Scott, 199 F.3d 206, 218. The Third Circuit discussed, but not comment on the validity of disparity indices in general in Contractors Association, 91 F.3d 586, 603-04. 43
Id. at 218, fn. 11. 44
Croson, 488 U.S. at 509 (emphasis added).
Legal Review
Page 2-8
program.45 Following Croson’s statements on availability, lower courts have considered how legislative bodies may determine the precise scope of the injury sought to be remedied by an MBE program. Nevertheless, the federal courts have not provided clear guidance on the best data sources or techniques for measuring M/WBE availability.
Different forms of data used to measure availability give rise to particular controversies. Census data have the benefit of being accessible, comprehensive, and objective in measuring availability. In Contractors Association, the Third Circuit, while noting some of the limitations of census data, acknowledged that such data could be of some value in disparity studies. In that case, the city of Philadelphia’s consultant calculated a disparity using data showing the total amount of contract dollars awarded by the city, the amount that went to MBEs, and the number of African American construction firms. The consultant combined these data with data from the Census Bureau on the number of construction firms in the Philadelphia Standard Metropolitan Statistical Area.46 Despite the district court’s reservations about mixing data sources, the Third Circuit appeared to have been prepared to accept such data had it ruled on the showing of a compelling interest.
At least one commentator has suggested using bidder data to measure M/WBE availability,47 but Croson does not require the use of bidder data to determine availability. In Concrete Works, in the context of plaintiffs’ complaint that the city of Denver had not used such information, the Tenth Circuit noted that bid information also has its limits. Firms that bid may not be qualified or able, and firms that do not bid may be qualified and able, to undertake agency contracts.48
2.4.2 Relevant Market Area
Another issue in availability analysis is the definition of the relevant market area. Specifically, the question is whether the relevant market area should be defined as the area from which a specific percentage of purchases are made, the area in which a specific percentage of willing and able contractors may be located, or the area determined by a fixed geopolitical boundary.
The Supreme Court has not yet established how the relevant market area should be defined, but some circuit courts have done so, including the Tenth Circuit in Concrete Works II, the first appeal in the city of Denver litigation.49 Concrete Works of Colorado, a non-M/WBE construction company, argued that Croson precluded consideration of discrimination evidence from the six-county Denver Metropolitan Statistical Area (MSA), so that Denver should use data only from within the city and county of Denver. The Tenth Circuit, interpreting Croson, concluded, “The relevant area in which to measure discrimination . . . is the local construction market, but that is not necessarily confined by jurisdictional boundaries.”50 The court further stated, “It is important that the pertinent data closely relate to the jurisdictional area of the municipality whose program we scrutinize, but
45
Id., 488 U.S. at 498. 46
Contractors Association, Inc., 91 F.3d at 604. 47
G. LaNoue, “Who Counts? Determining the Availability of Minority Businesses for Contracting After Croson,” 21 Harvard Journal of Law and Public Policy 793, 833 (1998). 48
Concrete Works II, 36 F.3d at 89-90; Concrete Works IV, 321 F.3d at 983-84. 49
Concrete Works IV, 36 F.3d at 1520. The Second and Third Circuits have not commented on relevant market calculations for factual predicate evidence for M/WBE programs. 50
Id.
Legal Review
Page 2-9
here Denver’s contracting activity, insofar as construction work is concerned, is closely related to the Denver MSA.”51
The Tenth Circuit ruled that since more than 80 percent of Denver Department of Public Works construction and design contracts were awarded to firms located within the Denver MSA, the appropriate market area should be the Denver MSA, not the city and county of Denver alone.52 Accordingly, data from the Denver MSA were “adequately particularized for strict scrutiny purposes.”53
2.4.3 Firm Qualifications
Another availability consideration is whether M/WBE firms are qualified to perform the required services. In Croson, the Supreme Court noted that although gross statistical disparities may demonstrate prima facie proof of discrimination, “when special qualifications are required to fill particular jobs, comparisons to the general population (rather than to the smaller group of individuals who possess the necessary qualifications) may have little probative value.”54 The Court, however, did not define the test for determining whether a firm is qualified. The Third Circuit provided some latitude on the issue of qualification and stated that, “The issue of qualifications can be approached at different levels of specificity, however, and some consideration of the practicality of various approaches is required. An analysis is not devoid of probative value simply because it may theoretically be possible to adopt a more refined approach.” 55
Considering firm qualifications is important not only to assess whether M/WBEs in the relevant market area can provide the goods and services required, but also to ensure proper comparison between the number of qualified M/WBEs and the total number of similarly qualified contractors in the marketplace.56 In short, proper comparisons ensure the required integrity and specificity of the statistical analysis. The Third and Fifth Circuits have also indicated that statistics about prime contracting disparity have little, if any, weight when the eventual M/WBE program offers its remedies solely to subcontractors.57
2.4.4 Willingness
Croson requires that an “available” firm must be not only qualified but also willing to provide the required services. In this context, it can be difficult to determine whether a business is willing. In Contractors Association, the Third Circuit explained, “In the absence of some reason to believe otherwise, one can normally assume that participants in a market with the ability to undertake gainful work will be ‘willing’ to undertake it.”58 The court went on to note:
Past discrimination in a marketplace may provide reason to believe the minorities who would otherwise be willing are discouraged from trying to secure the work. . . . [I]f there has been discrimination in City contracting, it is to be expected that African American firms may be discouraged from
51
Id. 52
Id. 53
Id. 54
Croson, 488 U.S. at 501, quoting Hazelwood School District v. United States, 433 U.S. 299, 308, n.13 (1977). 55
Contractors Association, 91 F.3d at 603. 56
See Hazelwood School District, 433 U.S. at 308; Contractors Association, 91 F.3d at 603. 57
Contractors Association, 91 F.3d at 599; Scott, 199 F.3d at 218. 58
Contractors Association, 91 F.3d at 603.
Legal Review
Page 2-10
applying, and the low numbers [of African American firms seeking to prequalify for City-funded contracts] may tend to corroborate the existence of discrimination rather than belie it.59
Courts have approved including businesses in the availability pool that may not be on the government’s certification list. In Concrete Works II, Denver’s availability analysis indicated that while most MBEs and WBEs had never participated in city contracts, “almost all firms contacted indicated that they were interested in municipal work.”60
2.4.5 Ability
Another availability consideration is whether the firms being considered are able to perform a particular service. Those who challenge affirmative action often question whether M/WBE firms have the “capacity” to perform particular services.
The Eleventh Circuit accepted a series of arguments that firm size has a strong impact on “ability” to enter contracts, that M/WBE firms tend to be smaller, and that this smaller size, not discrimination, explains the resulting disparity.61 This emphasis of factoring in business capacity was reinforced in a recent case in Federal Circuit, Rothe Development Corp v. Department of Defense, involving the Federal 1207 small, disadvantaged business (SDB) program. The Rothe decision criticized elements of factual predicate studies used to support the 1207 program that did not factor in capacity of firms and their ability to perform more than one project in evaluating disparity.62 The court did acknowledge that “minority-owned firms’ capacities and qualifications may themselves be affected by discrimination.”63 The Rothe court also pointed to regression analysis as one means of controlling for capacity.64
By contrast, the Tenth Circuit in Concrete Works II and IV recognized the shortcomings of this treatment of firm size.65 In Concrete Works IV the court noted that the small size of such firms can itself be a result of discrimination.66 The Tenth Circuit acknowledged the city of Denver’s argument that a small construction firm’s precise capacity can be highly elastic.67 Under this view, the relevance of firm size may be somewhat diminished. Further, the Eleventh Circuit was dealing with a statute which itself limited remedies to M/WBEs that were smaller firms by definition.68
2.4.6 Statistical Significance in Disparity Studies
While courts have indicated that anecdotal evidence may suffice without statistical evidence, no case without statistical evidence has been given serious consideration by any
59
Id. at 603-04. 60
Concrete Works II, 36 F.3d at 1529. 61
Engineering Contractors, at 917-18, 924. 62
Rothe Dev. Corp v. Dep’t of Defense, 545 F.3d 1023, 1043 (Fed Cir 2008). The studies in question were not produced to provide a factual predicate for the 1207 program, but studied state and local contracting. 63
Rothe Dev. Corp v. Dep’t of Defense, 545 at 1045. 64
Rothe Dev. Corp v. Dep’t of Defense, 545 at 1043.
65 Concrete Works II, 36 F.3d at 1528-29; Concrete Works IV, 321 F.3d at 980-92.
66 Concrete Works IV, 321 F.3d at 980-84.
67 Id. at 981
68 Engineering Contractors., 122 F.3d at 917.

Legal Review
Page 2-11
circuit court. In practical effect, courts require statistical evidence. Further, the statistical evidence needs to be held to appropriate professional standards.69
The Eighth Circuit has stated that “numbers must be statistically significant before one can properly conclude that any apparent racial disparity results from some factor other than random chance.”70 The Eleventh Circuit has addressed the role of statistical significance in assessing levels of disparity in public contracting. Generally, disparity indices of 80 percent or higher—indicating close to full participation—are not considered significant.71 The court referenced the Equal Employment Opportunity Commission’s disparate impact guidelines, which establish the 80 percent test as the threshold for determining a prima facie case of discrimination.72 According to the Eleventh Circuit, no circuit that has explicitly endorsed using disparity indices has held that an index of 80 percent or greater is probative of discrimination, but they have held that indices below 80 percent indicate “significant disparities.”73
In support of the use of standard deviation analyses to test the statistical significance of disparity indices, the Eleventh Circuit observed that “social scientists consider a finding of two standard deviations significant, meaning there is about one chance in 20 that the explanation for the deviation could be random and the deviation must be accounted for by some other factor than chance.”74 With standard deviation analyses, the reviewer can determine whether the disparities are substantial or statistically significant, lending further statistical support to a finding of discrimination. On the other hand, if such analyses can account for the apparent disparity, the study will have little if any weight as evidence of discrimination. Further, the interpretations of the studies must not assume discrimination has caused the disparities, but must account for alternative explanations of the statistical patterns.75
2.4.7 Anecdotal Evidence of Discrimination in Disparity Studies
Most disparity studies present anecdotal evidence along with statistical data. The Supreme Court in Croson discussed the relevance of anecdotal evidence and explained, “Evidence of a pattern of individual discriminatory acts can, if supported by appropriate statistical proof, lend support to a local government’s determination that broader remedial relief is justified.”76 Although Croson did not expressly consider the form or level of specificity required for anecdotal evidence, the Ninth Circuit has addressed both issues.
In Coral Construction, the Ninth Circuit addressed the use of anecdotal evidence alone to prove discrimination. Although King County’s anecdotal evidence was extensive, the court
69
Contractors Association, 91 F.3d at 599-601. 70
Kohlbeck v. Omaha, 447 F.3d 552, 557 (8th
Cir. 2006) (quoting Aiken v. Memphis, 37 F.3d 1155 (6th
Cir. 1994)). The Second and Third Circuits have not commented directly on the proper level of statistical significance in factual predicate studies for M/WBE programs. 71
Engineering Contractors,122 F.3d at 914. 72
Id. at 914 (citing 29 C.F.R. § 1607.4D concerning the disparate impact guidelines and threshold used in employment cases). 73
Engineering Contractors, 122 F.3d at 914 (referencing the first appeal in Contractors Association of Eastern Pennsylvania, Inc., 6 F.3d at 1005, crediting disparity index of 4 percent, and Concrete Works II, 36 F.3d at 1524, crediting disparity indices ranging from 0 percent to 3.8 percent). 74
Engineering Contractors, 122 F.3d at 914 (citing Peightal v. Metropolitan Dade County, 26 F.3d 1545, 1556 n.16 (11
th Cir. 1994) (quoting Waisome v. Port Authority, 948 F.2d 1370, 1376 (2
nd Cir. 1991)).
75 Engineering Contractors, at 922.
76 Croson, 488 U.S. at 509.

Legal Review
Page 2-12
noted the absence in the record of any statistical data in support of the program. Additionally, the court stated, “While anecdotal evidence may suffice to prove individual claims of discrimination, rarely, if ever, can such evidence show a systemic pattern of discrimination necessary for the adoption of an affirmative action plan.”77 The court concluded, by contrast, that “the combination of convincing anecdotal and statistical evidence is potent.”78
Regarding the appropriate form of anecdotal evidence, the Ninth Circuit in Coral Construction noted that the record provided by King County was “considerably more extensive than that compiled by the Richmond City Council in Croson.”79 The King County record contained affidavits of at least 57 minority or female contractors, each of whom complained in varying degrees of specificity about discrimination within the local construction industry. The Coral Construction court stated that the M/WBE affidavits “reflected a broad spectrum of the contracting community” and the affidavits “certainly suggested that ongoing discrimination may be occurring in much of the King County business community.”80
In Associated General Contractors v. Coalition for Economic Equity (AGCC II), the Ninth Circuit discussed the specificity of anecdotal evidence required by Croson.81 Seeking a preliminary injunction, the contractors contended that the evidence presented by the city of San Francisco lacked the specificity required both by an earlier appeal in that case82 and by Croson. The court held that the city’s findings were based on substantially more evidence than the anecdotes in the two prior cases, and were “clearly based upon dozens of specific instances of discrimination that are laid out with particularity in the record, as well as significant statistical disparities in the award of contracts.”83
The court also ruled that the city was under no burden to identify specific practices or policies that were discriminatory.84 Reiterating the city’s perspective, the court stated that the city “must simply demonstrate the existence of past discrimination with specificity; there is no requirement that the legislative findings specifically detail each and every instance that the legislative body had relied upon in support of its decision that affirmative action is necessary.”85
Not only have courts found that a state and local government does not have to specifically identify all the discriminatory practices impeding M/WBE utilization, but the Tenth Circuit in Concrete Works IV also held that anecdotal evidence collected by a municipality did not have to be verified. The court stated:
There is no merit to the [plaintiff’s] argument that witnesses’ accounts must be verified to provide support for Denver’s burden. Anecdotal evidence is nothing more than a witness’ narrative of an incident told from the witness’
77
Coral Construction, 941 F.2d at 919 (emphasis added). 78
Id. See also Associated General Contractors v. Coalition for Economic Equity, 950 F.2d at 1414. 79
Coral Construction, 941 F.2d at 917. 80
Id. at 917-18. 81
AGCC II, 950 F.2d at 1414. 82
AGCC I, 813 F.2d 922. 83
AGCC II, 950 F.2d. at 1416. This evidence came from 10 public hearings and “numerous written submissions from the public.” 84
Id. at 1410. 85
Id. at 1416.

Legal Review
Page 2-13
perspective and including the witness’ perceptions…Denver was not required to present corroborating evidence and [the plaintiff] was free to present its own witnesses to either refute the incidents described by Denver’s witnesses or to relate their own perceptions on discrimination in the Denver construction industry.86
2.5 The Governmental Entity or Agency Enacting an M/WBE Program Must Be Shown to Have Actively or Passively Perpetuated the Discrimination
In Croson, the Supreme Court stated, “It is beyond dispute that any public entity, state or federal, has a compelling interest in assuring that public dollars, drawn from the tax contributions of all citizens, do not serve to finance the evil of private prejudice.”87 Croson provided that the government “can use its spending powers to remedy private discrimination, if it identifies that discrimination with the particularity required by the Fourteenth Amendment.”88 The government agency’s active or passive participation in discriminatory practices in the marketplace may show the compelling interest. Defining passive participation, Croson stated, “Thus, if the city could show that it had essentially become a “passive participant” in a system of racial exclusion practiced by elements of the local construction industry, we think it clear that the city could take affirmative steps to dismantle such a system.”89
The Tenth Circuit decision in Adarand concluded that evidence of private sector discrimination provided a compelling interest for a DBE program.90 Later cases have reaffirmed that the government has a compelling interest in avoiding the financing of private discrimination with public dollars.91
Relying on this language in Croson, a number of local agencies have increased their emphasis on evidence of discrimination in the private sector. This strategy has not always succeeded. In the purest case, Cook County did not produce a disparity study but instead presented anecdotal evidence that M/WBEs were not solicited for bids in the private sector. Cook County lost the trial and the resulting appeal.92 Similarly, evidence of private sector discrimination presented in litigation was found inadequate in the Philadelphia and Dade County cases.93 The Third Circuit stated, in discussing low MBE participation in a local contractors association in the city of Philadelphia, that “racial discrimination can justify a race-based remedy only if the city has somehow participated in or supported that discrimination.”94 The Third Circuit also stated that very low MBE membership in trade
86
Concrete Works IV, 321 F.3d at 989. 87
Coral Construction, 941 F.2d at 922 (citing Croson, 488 U.S. at 492) (emphasis added). 88
See Croson; see generally I. Ayres and F. Vars, “When Does Private Discrimination Justify Public Affirmative Action?” 98 Columbia Law Review 1577 (1998). 89
Croson, 488 U.S. at 492. 90
Adarand v. Slater, 228 F.3d 1147 (10th
Cir. 2000). 91
Associated General Contractors v. Drabik, 214 F.3d 730, 734-35 (6th
Cir. 2000). See also Concrete Works II, 36 F.3d at 1529; Coral Construction, 941 F.2d at 916; AGC v. New Haven, 791 F.Supp. 941, 947 (D.Conn. 1992). 92
Builders Association v. County of Cook, 123 F. Supp.2d 1087 (ND IL 2000); 256 F.3d 642 (7th
Cir. 2001). 93
Contractors Association of Eastern Pennsylvania, Inc., 91 F.3d at 602; Engineering Contractors, 122 F.3d at 914. 94
Contractors Association, 91 F.3d at 602; see also Webster, 51 F. Supp. 2d 1354.

Legal Review
Page 2-14
associations was not enough to support a remedial M/WBE program.95
Nevertheless, in Concrete Works IV, the Tenth Circuit upheld the relevance of data from the private marketplace to establish a factual predicate for M/WBE programs.96 That is, courts mainly seek to ensure that M/WBE programs are based on findings of active or passive discrimination in the government contracting marketplace, and not simply attempts to remedy general societal discrimination.
Courts also seek to find a causal connection between a statistical disparity and actual underlying discrimination. The Third Circuit stated that a local government agency “has a compelling state interest that can justify race-based preferences only when it has acted to remedy identified present or past discrimination in which it engaged or was a “passive participant.”97 In Engineering Contractors, one component of the factual predicate was a study comparing entry rates into the construction business for M/WBEs and non-M/WBEs.98 The analysis provided statistically significant evidence that minorities and women entered the construction business at rates lower than would be expected, given their numerical presence in the population and human and financial capital variables. The study argued that those disparities persisting after the application of appropriate statistical controls were most likely the result of current and past discrimination. Even so, the Eleventh Circuit criticized this study for reliance on general census data and for the lack of particularized evidence of active or passive discrimination by Dade County, holding that the district court was entitled to find that the evidence did not show compelling justification for an M/WBE program.99 The Seventh Circuit has perhaps set a higher bar for connecting private discrimination with government action. The trial court in the Cook County case extensively considered evidence that prime contractors simply did not solicit M/WBEs as subcontractors and considered carefully whether this evidence on solicitation served as sufficient evidence of discrimination, or whether instead it was necessary to provide further evidence that there was discrimination in hiring M/WBE subcontractors.100 The Seventh Circuit held that this evidence was largely irrelevant.101 Beyond being anecdotal and partial, evidence that contractors failed to solicit M/WBEs on Cook County contracts was not the same as evidence that M/WBEs were denied the opportunity to bid.102 Furthermore, such activities on the part of contractors did not necessarily implicate the county as even a passive participant in such discrimination as might exist because there was no evidence the county knew about it.103
Interestingly, some courts have been willing to see capital market discrimination as part of the required nexus between private and public contracting discrimination, even if capital market discrimination could arguably be seen as simply part of broader societal discrimination. In Adarand v. Slater, the Tenth Circuit favorably cited evidence of capital market discrimination as relevant in establishing the factual predicate for the federal DBE program.104 The same court, in Concrete Works IV, found that barriers to business
95
Contractors Association, 91 F.3d 586, 601-02 (1996). 96
Concrete Works IV, 321 F.3d at 69. 97
Contractors Association, 91 F.3d at 596. 98
Engineering Contractors, 122 F.3d at 921-22. 99
Id. at 922. 100
Builders Association, 123 F.Supp. 1087 (ND IL 2000). 101
Builders Association of Greater Chicago, 256 F.3d at 645. 102
Id. 103
Id. 104
Adarand v. Slater, 228 F.3d at 1169-70.

Legal Review
Page 2-15
formation were relevant insofar as this evidence demonstrated that M/WBEs were “precluded from the outset from competing for public construction contracts.”105 Along related lines, the court also found a regression analysis of census data to be relevant evidence showing barriers to M/WBE formation.106 A recent district court case upheld the state of North Carolina M/WBE program in road construction based largely on similar private sector evidence supplemented by evidence from databases covering private sector commercial construction.107
Courts have come to different conclusions about the effects of M/WBE programs on the private sector evidence itself. For instance, is M/WBE participation in public sector projects higher than on private sector projects simply because the M/WBE program increases M/WBE participation in the public sector, or is such a pattern evidence of private sector discrimination? The Seventh Circuit raised the former concern in the Cook County litigation.108 Concrete Works IV, on the other hand, expressly cited as evidence of discrimination that M/WBE contractors used for business with the city of Denver were not used by the same prime contractors for private sector contracts.109
Finally, is evidence of a decline in M/WBE utilization following a change in or termination of an M/WBE program relevant and persuasive evidence of discrimination? The Eighth Circuit in Sherbrooke Turf Inc. v. Minnesota Department of Transportation and the Tenth Circuit in Concrete Works IV did find that such a decline in M/WBE utilization was evidence that prime contractors were not willing to use M/WBEs in the absence of legal requirements.110 Other lower courts have arrived at similar conclusions.111
2.6 To Withstand Strict Scrutiny, an M/WBE Program Must Be Narrowly Tailored to Remedy Identified Discrimination
The discussion of compelling interest in the court cases has been extensive, but narrow tailoring may be the more critical issue. Many courts have held that even if a compelling interest for the M/WBE program can be found, the program has not been narrowly tailored.112 Moreover, Concrete Works IV,113 a case that did find a compelling interest for a local M/WBE program, did not consider the issue of narrow tailoring. Instead, the Tenth Circuit held that the plaintiffs had waived any challenge to the original district court ruling that the program was narrowly tailored.114
Nevertheless, the federal courts have found that the DBE program established pursuant to federal regulations (49 CFR, Part 26) issued under the Transportation Equity Act (TEA-21)
105
Concrete Works IV, 321 F.2d at 977. The district court had rejected evidence of credit market discrimination as adequate to provide a factual predicate for an M/WBE program. Concrete Works v. City and County of Denver, 86 F.Supp.2d 1042 (D. Colo. 2000) (Concrete Works I). 106
Id. at 977. 107
H.B. Rowe v. North Carolina DOT, No. 5:03-CV-278-BO(3) (ED NC 2008). The court, however, was very brief in discussing what factors he study accounted for its ruling. 108
Builders Association of Greater Chicago, 256 F.3d at 645. 109
Concrete Works IV, 321 F.3d at 984-85. 110
Id. at 985; Sherbrooke Turf, 345 F.3d at 973. 111
See, e.g., Northern Contracting v. Illinois DOT, No. 00 4515 (ND IL 2004). 112
Contractors Association 91 F.3d at 605; Engineering Contractors, 122 F.3d at 926-929; Verdi v. DeKalb County School District, 135 Fed. Appx 262 , 2005 WL 38942 (11
th Cir. 2005).
113 Concrete Works IV, 321 F.3d at 992-93.
114 Concrete Works v. City and County of Denver, 823 F.Supp. 821 (D.Colo. 1993).
Legal Review
Page 2-16
(1998) has been narrowly tailored to serve a compelling interest.115 The federal courts had previously ruled that there was a factual predicate for the federal Department of Transportation (DOT) DBE program, but that in its earlier versions the program was not narrowly tailored.116 The more recent rulings provide some guidance as to what program configurations the courts will judge to be narrowly tailored. Following Supreme Court precedent, the circuit courts have identified the following elements of narrow tailoring: the efficacy of alternative remedies, the flexibility and duration of the race-conscious remedy, the relationship of the numerical goals to the relevant labor market, and the impact of the remedy on third parties.117 2.6.1 Race-Neutral Alternatives
Concerning race-neutral alternatives, the Supreme Court in Croson concluded that a governmental entity must demonstrate that it has evaluated the use of race-neutral means to increase minority business participation in contracting or purchasing activities. The Third Circuit noted in Contractors Association that, “No effort was made by the City, however, to identify barriers to entry in its procurement process.”118 The Third Circuit went on to say that,
The record provides ample support for the finding of the district court that alternatives to race-based preferences were available in November of 1982 which would have been either race neutral or, at least, less burdensome to non-minority contractors. The City could have lowered administrative barriers to entry, instituted a training and financial assistance program, and carried forward the OMO's certification of minority contractor qualifications. The record likewise provides ample support for the court's conclusion that the "City Council was not interested in considering race-neutral measures, and it did not do so." … To the extent the City failed to consider or adopt these alternatives, it failed to narrowly tailor its remedy to prior or existing discrimination against black contractors.119
In upholding the narrow tailoring of federal DBE regulations, the Eighth Circuit noted that those regulations “place strong emphasis on the use of race-neutral means to increase minority business participation in government contracting.”120 The Tenth Circuit had noted that the DBE regulations provided that “if a recipient can meet its overall goal through race-neutral means, it must implement its program without the use of race-conscious contracting measures, and enumerate a list of race-neutral measures.”121 Those measures included “helping overcome bonding and financing obstacles, providing technical assistance, [and] establishing programs to assist start-up firms.”122 Strict scrutiny does not mandate that every race-neutral measure be considered and found wanting. The Eighth Circuit also
115
Adarand v. Slater, 228 F.3d 1147; Sherbrooke Turf, 345 F.3d 963; Western States Paving v. Washington DOT, 407 F.3d 983 (9th Cir. 2005). 116
In 1998, in Sherbrooke I, the Minnesota district court had ruled that while there was a compelling interest for the DBE program, the program was not narrowly tailored. In 1996, before the new DBE regulations, the district court in Colorado, upon remand from the 1995 U.S. Supreme Court, had made a similar ruling in Adarand v. Peña. 117
See, e.g., Sherbrooke Turf, at 971 (citing U.S. v. Paradise, 480 U.S. 149, 171 (1987)). 118
Contractors Association, 91 F.3d at 608. 119
Id. at 609. 120
Sherbrooke Turf, at 972 (citing Adarand, 515 U.S. at 237-38). 121
Adarand v. Slater, 228 F.3d. at 1179. 122
Id.

Legal Review
Page 2-17
affirmed that “narrow tailoring does not require exhaustion of every conceivable race-neutral alternative,” but it does require “serious, good faith consideration of workable race-neutral alternatives.”123
2.6.2 Flexibility and Duration of the Remedy
The federal courts have also found that “the revised DBE program has substantial flexibility.”124
A State may obtain waivers or exemptions from any requirement and is not penalized for a good faith failure to meet its overall goal. In addition, the program limits preferences to small businesses falling beneath an earnings threshold, and any individual whose net worth exceeds $750,000 cannot qualify as economically disadvantaged.125
DBE and M/WBE programs achieve flexibility by using waivers and variable project goals to avoid merely setting a quota. Croson favorably mentioned the contract-by-contract waivers in the federal DOT DBE program.126 Virtually all successful MBE programs have this waiver feature in their enabling legislation. As for project goals, the approved DBE provisions set aspirational, not mandatory, goals; expressly forbid quotas; and use overall goals simply as a framework for setting local contract goals, if any, based on local data. All of these factors have impressed the courts that have upheld the constitutionality of the revised DOT DBE program. 127 In contrast, the Third Circuit observed in Contractors Association that, “As we have explained, the 15 percent participation goal and the system of presumptions, which in practice require non-black contractors to meet the goal on virtually every contract, result in a 15% set-aside for black contractors in the subcontracting market.”128 With respect to program duration, in Adarand v. Peña, the Supreme Court wrote that a program should be “appropriately limited such that it will not last longer than the discriminatory effects it is designed to eliminate.”129 The Eighth Circuit also noted the limits in the DBE program, stating that “the DBE program contains built-in durational limits,” in that a state “may terminate its DBE program if it meets its annual overall goal through race-neutral means for two consecutive years.”130 The federal courts have found durational limits in the fact that “TEA-21 is subject to periodic congressional reauthorization. Periodic legislative debate assures all citizens that the deviation from the norm of equal treatment of all racial and ethnic groups is a temporary matter, a measure taken in the service of the goal of equality itself.”131
Other appellate courts have noted possible mechanisms for limiting program duration: required termination if goals have been met132 and decertification of MBEs who achieve certain levels of success, or mandatory review of MBE certification at regular, relatively brief
123
Sherbrooke Turf, at 972 (citing Grutter, 123 S. Ct. at 2344-45). See also Coral Construction, 941 F.2d at 923; AGCC II, 950 F.2d at 1417. 124
Sherbrooke Turf, at 972. 125
Id. at 972 (citing 49 C.F.R. § 26.67(b)).
126 Croson, 488 U.S. at 489. Coral Construction, 941 F.2d at 925.
127 Id.
128 Contractors Association, 91 F.3d at 606.
129 Id., 515 U.S. at 238 (internal quotations and citations omitted).
130 Sherbrooke Turf, at 972 (citing 49 C.F.R. § 26.51(f)(3)).
131 Id. (citing Grutter, 123 S. Ct. at 2346).
132 Sherbrooke, 354 F.3d at 972.

Legal Review
Page 2-18
periods.133 Governments thus have some duty to ensure that they update their evidence of discrimination regularly enough to review the need for their programs and to revise programs by narrowly tailoring them to fit the fresh evidence.134 Whether all of these provisions are necessary in every case remains an open question.
2.6.3 Relationship of Goals to Availability
Narrow tailoring under the Croson standard requires that remedial goals be in line with measured availability. Merely setting percentages without a carefully selected basis in statistical studies, as the city of Richmond did in Croson itself, has played a strong part in decisions finding other programs unconstitutional.135
By contrast, the Eighth, Ninth, and Tenth Circuits have approved the goal-setting process for the DOT DBE program, as revised in 1999.136 The approved DOT DBE regulations require that goals be based on one of several methods for measuring DBE availability.137 The Eighth Circuit noted that the “DOT has tied the goals for DBE participation to the relevant labor markets,” insofar as the regulations “require grantee States to set overall goals based upon the likely number of minority contractors that would have received federally assisted highway contracts but for the effects of past discrimination.”138 The Eighth Circuit acknowledged that goal setting was not exact but also stated:
The exercise requires the States to focus on establishing realistic goals for DBE participation in the relevant contracting markets. This stands in stark contrast to the program struck down in Croson, which rested upon the completely unrealistic assumption that minorities will choose a particular trade in lockstep proportion to their representation in the local population.139
Moreover, the approved DBE regulations use built-in mechanisms to ensure that DBE goals are not set excessively high relative to DBE availability. For example, the approved DBE goals are to be set aside if the overall goal has been met for two consecutive years by race-neutral means. The approved DBE contract goals also must be reduced if overall goals have been exceeded with race-conscious means for two consecutive years. The Eighth Circuit found these provisions to be narrowly tailored, particularly when implemented according to local disparity studies that carefully calculate the applicable goals.140
2.6.4 Burden on Third Parties
Narrow tailoring also requires minimizing the burden of the program on third parties. The Eighth Circuit stated the following with respect to the revised DBE program:
133
Adarand v. Slater, 228 F.3d at 1179, 1180. 134
Rothe, 262 F.3d at 1324 (commenting on the possible staleness of information after 7, 12, and 17 years); see also Rothe 545 F.3d 1038. 135
Contractors Association, 91 F.3d at 607 (“The district court also found … that the … Ordinance offered only one reference point for the percentages selected for the various set-asides -- the percentages of minorities and women in the general population.”). See also Builders Association of Greater Chicago, 256 F.3d at 647. 136
Adarand v. Slater, 228 F.3d at 1182; Sherbrooke Turf, 345 F.3d at 972. Western States, 407 F.3d at 995. 137
49 CFR, Section 26, Part 45. 138
Sherbrooke Turf, at 972 (citing 49 C.F.R. § 26.45(c)-(d) (Steps 1 and 2)). 139
Id at 972 (citing Croson, 488 U.S. at 507).
140 Id. at 973, 974.
Legal Review
Page 2-19
Congress and DOT have taken significant steps to minimize the race-based nature of the DBE program. Its benefits are directed at all small businesses owned and controlled by the socially and economically disadvantaged. While TEA21 creates a rebuttable presumption that members of certain racial minorities fall within that class, the presumption is rebuttable, wealthy minority owners and wealthy minority-owned firms are excluded, and certification is available to persons who are not presumptively disadvantaged but can demonstrate actual social and economic disadvantage. Thus, race is made relevant in the program, but it is not a determinative factor.141
Waivers and good faith compliance are also tools that serve this purpose of reducing the burden on third parties.142 The DOT DBE regulations have also sought to reduce the program burden on non-DBEs by avoiding DBE concentration in certain specialty areas.143 These features have gained the approval of the only circuit court to have discussed them at length as measures of lowering impact on third parties.144
2.6.5 Over-inclusion Narrow tailoring also involves limiting the number and type of beneficiaries of the program. As noted above, there has to be evidence of discrimination to justify a group-based remedy, and over-inclusion of uninjured individuals or groups can endanger the entire program.145 Federal DBE programs have succeeded in part because regulations covering DBE certification do not provide blanket protection to minorities.146
Critically, the MBE program must be limited in its geographical scope to the boundaries of the enacting government’s marketplace. The Supreme Court indicated in Croson that a local agency has the power to address discrimination only within its own marketplace. One fault of the Richmond MBE program was that minority firms were certified from around the United States.147
In Coral Construction, the Ninth Circuit concluded that the King County MBE program failed this part of the narrow tailoring test because the definition of MBEs eligible to benefit from the program was overbroad. The definition included MBEs that had had no prior contact with King County if the MBE could demonstrate that discrimination occurred “in the particular geographic areas in which it operates.”148 This MBE definition suggested that the program was designed to eradicate discrimination not only in King County but also in the particular area in which a nonlocal MBE conducted business. In essence, King County’s program focused on the eradication of society-wide discrimination, which is outside the power of a state or local government. Since “the County’s interest is limited to the
141
See Grutter, 123 S. Ct. at 2345-46; Gratz v. Bollinger, 539 U.S. 244, 156 L. Ed. 2d 257, 123 S. Ct. 2411, 2429 (2003). 142
49 CFR, Section 26, Part 53. 143
49 CFR, Section 26, Part 33. 144
Adarand v. Slater, 228 F.3d at 1182. 145
Contractors Association, 91 F.3d at 607 (“until [the district court] invalidated [the MBE ordinance] in 1990, the 15 percent preference for MBEs was shared by an ‘amalgam of minorities’"). See also Builders Association of Greater Chicago, 256 F.3d at 647. 146
Sherbrooke Turf, 345 F.3d 963, 972-73. 147
Croson, 488 U.S. at 508. 148
Id.
Legal Review
Page 2-20
eradication of discrimination within King County, the only question that the County may ask is whether a business has been discriminated against in King County.”149
In clarifying an important aspect of the narrow tailoring requirement, the court defined the issue of eligibility for MBE programs as one of participation, not location. For an MBE to reap the benefits of an affirmative action program, the business must have been discriminated against in the jurisdiction that established the program.150 As a threshold matter, before a business can claim to have suffered discrimination, it must have attempted to do business with the governmental entity.151 It was found significant that “if the County successfully proves malignant discrimination within the King County business community, an MBE would be presumptively eligible for relief if it had previously sought to do business in the County.”152
To summarize, according to the Ninth Circuit, the presumptive rule requires that the enacting governmental agency establish that systemic discrimination exists within its jurisdiction and that the MBE is, or has attempted to become, an active participant in the agency's marketplace.153 Since King County’s definition of an MBE permitted participation by those with no prior contact with King County, its program was overbroad. By useful contrast, Concrete Works II held that the more extensive but still local designation of the entire Denver MSA constituted the marketplace to which the programs could apply.154
2.7 Small Business Procurement Preferences
Small business procurement preferences have existed since the 1940s. The first small business program had its origins in the Smaller War Plants Corporation (SWPC), established during World War II.155 The SWPC was created to channel war contracts to small business. In 1947, Congress passed the Armed Forces Procurement Act, declaring, “It is the policy of Congress that a fair proportion of the purchases and contracts under this chapter be placed with small business concerns.”156 Continuing this policy, the 1958 Small Business Act requires that government agencies award a “fair proportion” of procurement contracts to small business concerns.157 The regulations are designed to implement this general policy.158
Section 8(b)(11) of the Small Business Act authorizes the Small Business Administration (SBA) to set aside contracts for placement with small business concerns. The SBA has the power:
...to make studies and recommendations to the appropriate Federal agencies to insure that a fair proportion of the total purchases and contracts for property and services for the Government be placed with
149
Id. 150
Id. 151
Id. 152
Id. 153
Id. 154
Concrete Works II, 36 F.3d at 1520. 155
See, generally, Thomas J. Hasty III, “Minority Business Enterprise Development and the Small Business Administration’s 8(a) Program: Past, Present, and (Is There a) Future?” Military Law Review 145 (Summer 1994): 1-112. 156
10 U.S.C. § 2301 (1976). 157
15 USC 631(a). 158
See 32 C.F.R. §§ 1-701.1 to 1-707.7.

Legal Review
Page 2-21
small-business enterprises, to insure that a fair proportion of Government contracts for research and development be placed with small-business concerns, to insure that a fair proportion of the total sales of Government property be made to small-business concerns, and to insure a fair and equitable share materials, supplies, and equipment to small-business concerns.159
Every acquisition of goods and services anticipated to be between $2,500 and $100,000 is set aside exclusively for small business unless the contracting officer has a reasonable expectation of fewer than two bids by small businesses.160
There has been only one constitutional challenge to the long-standing federal SBE programs. In J.H. Rutter Rex Manufacturing v. United States,161 a federal vendor unsuccessfully challenged the Army’s small business set-aside as in violation of the due process clause of the Fifth Amendment to the U.S. Constitution, as well as the Administrative Procedures Act and the Armed Forces Procurement Act.162 The court held that classifying businesses as small was not a “suspect classification” subject to strict scrutiny. Instead, the court ruled:
Since no fundamental rights are implicated, we need only determine whether the contested socioeconomic legislation rationally relates to a legitimate governmental purpose… Our previous discussion adequately demonstrates that the procurement statutes and the regulations promulgated there under are rationally related to the sound legislative purpose of promoting small businesses in order to contribute to the security and economic health of this Nation.163
A large number of state and local governments have maintained small business preference programs for many years.164 No district court cases were found overturning a state and local small business preference program. One reason for the low level of litigation in this area is that there has been no significant organizational opposition to SBE programs. There are no reported cases of litigation against local SBE programs. The legal foundations that have typically sued M/WBE programs have actually promoted SBE procurement preference programs as a race-neutral substitute for M/WBE programs.
There has been one state court case in which an SBE program was struck down as unconstitutional. The Cincinnati SBE program called for maximum practical M/WBE participation and required bidders to use good faith effort requirements to contract with M/WBEs up to government-specified M/WBE availability. Failure to satisfy good faith effort requirements triggered an investigation of efforts to provide opportunities for M/WBE subcontractors. In Cleveland Construction v. Cincinnati,165 the state court ruled that the Cincinnati SBE program had race and gender preferences and had deprived the plaintiff of
159
15 U.S.C. § 637(b)(11). 160
Federal Acquisition Regulations 19.502-2. 161
706 F.2d 702 (5th
Cir. 1983), cert. denied, 464 U.S. 1008 (1983). 162
Administrative Procedures Act, 5 U.S.C. §§ 552(a)(1)(E) (1976) and the “fair proportion” language of the Armed Forces Procurement Act, 10 U.S.C. § 2301 et seq. (1976), and the Small Business Act, 15 U.S.C. § 631 et seq. (1976). 163
J. H. Rutter Rex Manufacturing, at 706 F.2d at 730 (emphasis added). See also Dandridge v. Williams, 397 U.S. 471 (1970). 164
For example, Florida started a small business preference program in 1985 (FL St Sec. 287); Minnesota, in 1979 (Mn Stat 137.31); New Jersey, in 1993 (N.J.S.A 52:32-17). 165
Cleveland Construction v. Cincinnati, Case No. A0402638 (Ct Comm Pleas, Hamilton County, Ohio 2005).

Legal Review
Page 2-22
constitutionally protected property interest without due process of law. The city acknowledged that it had not offered evidence to satisfy strict scrutiny because it felt that it had been operating a race-neutral program.
2.8 Conclusions As summarized earlier, when governments develop and implement a contracting program that is sensitive to race and gender, they must understand the case law that has developed in the federal courts. These cases establish specific requirements that must be addressed so that such programs can withstand judicial review for constitutionality and prove to be just and fair. Under the developing trends in the application of the law, local governments must engage in specific fact-finding processes to compile a thorough, accurate, and specific evidentiary foundation to determine whether there is, in fact, discrimination sufficient to justify an affirmative action plan. Further, state and local governments must continue to update this information and revise their programs accordingly.
While the Supreme Court has yet to return to this exact area of law to sort out some of the conflicts, the circuit courts have settled on the core standards. Though there are differences among the circuits in the level of deference granted to the finder of fact, these differences do not appear to be profound. The differences in the individual outcomes have been, overwhelmingly, due to differences in the level of evidence, mostly concerning the rigor with which disparity studies have been conducted and then used as the foundation for narrowly tailored remedies. Ultimately, MBE and WBE programs can withstand challenges if state and local governments comply with the requirements outlined by the courts.
3.0 REVIEW OF REMEDIAL POLICIES

Page 3-1
3.0 REVIEW OF REMEDIAL POLICIES
This chapter focuses on policies and procedures currently used by the Commonwealth of Virginia (Commonwealth) to assist small, woman, and minority (SWaM) businesses.1 The purpose of this chapter is to provide identification of programs in place to assist SWaMs utilization, provide background for the data analysis, and help lay the foundations for the report recommendations.
Section 3.1 describes the methodology used to conduct the review of contracting policies, procedures, and programs. Sections 3.2 through 3.8 cover programs and policies concerning SWaM businesses. Section 3.9 covers business development programs.
3.1 Methodology
This section will discuss the steps taken to analyze the Commonwealth’s race- and gender-based and race- and gender-neutral programs. The analysis included the following steps:
Collect and review Commonwealth contracting and purchasing policies currently in use. Discuss with managers the changes that contracting and purchasing policies have undergone during the FY 2006–FY 2009 time frame.
Develop questionnaires and conduct interviews of key Commonwealth contracting and purchasing staff and officials to determine how existing contracting and purchasing policies have been implemented. Interviews were conducted with Commonwealth management and staff regarding the application of policies, discretionary use of policies, exceptions to written policies and procedures, and the impact of policies on key users.
Review applicable Commonwealth rules, resolutions, and policies that guide the remedial programs. Discuss with appropriate personnel in the Commonwealth, as well as with program participants, the operations, policies, and procedures of the remedial programs. Discuss the changes over time of the remedial program.
In addition to the above methodology, MGT also collected and reviewed copies of previous disparity studies conducted in the geographic region and conducted a review of race- and gender-neutral programs implemented by the Commonwealth and other government agencies in Virginia.
Overall, eight interviews were conducted with Commonwealth staff. Commonwealth documents collected and reviewed for this portion of the study are shown in Exhibit 3-1.
1 Throughout this document the following acronyms refer as follows: SWaM – small, women, and minority
businesses; MBE – minority-owned business enterprises; WBE – woman-owned business enterprises; SBE – small business enterprises; and DBE – disadvantaged business enterprises.
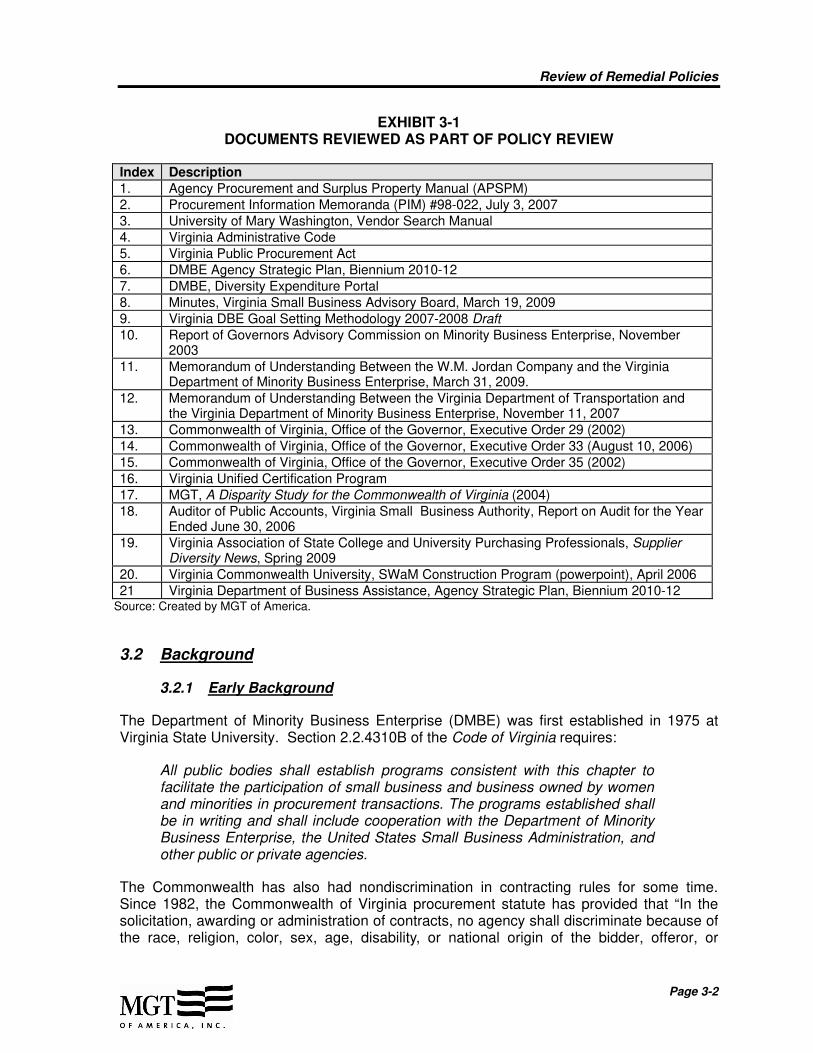
Review of Remedial Policies
Page 3-2
EXHIBIT 3-1 DOCUMENTS REVIEWED AS PART OF POLICY REVIEW
Index Description 1. Agency Procurement and Surplus Property Manual (APSPM) 2. Procurement Information Memoranda (PIM) #98-022, July 3, 2007 3. University of Mary Washington, Vendor Search Manual 4. Virginia Administrative Code 5. Virginia Public Procurement Act 6. DMBE Agency Strategic Plan, Biennium 2010-12 7. DMBE, Diversity Expenditure Portal 8. Minutes, Virginia Small Business Advisory Board, March 19, 2009 9. Virginia DBE Goal Setting Methodology 2007-2008 Draft 10. Report of Governors Advisory Commission on Minority Business Enterprise, November
2003 11. Memorandum of Understanding Between the W.M. Jordan Company and the Virginia
Department of Minority Business Enterprise, March 31, 2009. 12. Memorandum of Understanding Between the Virginia Department of Transportation and
the Virginia Department of Minority Business Enterprise, November 11, 2007 13. Commonwealth of Virginia, Office of the Governor, Executive Order 29 (2002) 14. Commonwealth of Virginia, Office of the Governor, Executive Order 33 (August 10, 2006) 15. Commonwealth of Virginia, Office of the Governor, Executive Order 35 (2002) 16. Virginia Unified Certification Program 17. MGT, A Disparity Study for the Commonwealth of Virginia (2004) 18. Auditor of Public Accounts, Virginia Small Business Authority, Report on Audit for the Year
Ended June 30, 2006 19. Virginia Association of State College and University Purchasing Professionals, Supplier
Diversity News, Spring 2009 20. Virginia Commonwealth University, SWaM Construction Program (powerpoint), April 2006 21 Virginia Department of Business Assistance, Agency Strategic Plan, Biennium 2010-12
Source: Created by MGT of America.
3.2 Background
3.2.1 Early Background
The Department of Minority Business Enterprise (DMBE) was first established in 1975 at Virginia State University. Section 2.2.4310B of the Code of Virginia requires:
All public bodies shall establish programs consistent with this chapter to facilitate the participation of small business and business owned by women and minorities in procurement transactions. The programs established shall be in writing and shall include cooperation with the Department of Minority Business Enterprise, the United States Small Business Administration, and other public or private agencies.
The Commonwealth has also had nondiscrimination in contracting rules for some time. Since 1982, the Commonwealth of Virginia procurement statute has provided that “In the solicitation, awarding or administration of contracts, no agency shall discriminate because of the race, religion, color, sex, age, disability, or national origin of the bidder, offeror, or

Review of Remedial Policies
Page 3-3
contractor.”2 The Commonwealth has not had race-conscious goals, set-asides, or price preferences outside of the Virginia Department of Transportation (VDOT) DBE program.
3.2.2 Executive Order 29
Executive Order 29, issued in 2002, required cabinet officials to establish supplier diversity plans for facilitating participation of SWaMs in Commonwealth purchasing. Executive Order 35, also issued in 2002, established the Governor’s Advisory Commission on Minority Business Enterprise. In response to Executive Order 35, the Governor’s Advisory Commission on Minority Business Enterprise convened and made recommendations, including the following:
Consolidate SWaM certification. Extend certification to three years. Publish a list of venture capital funds. Continue the PACE program. Increase the DMBE budget. Establish a permanent advisory board. Increase the DMBE budget. Elevate the DMBE status. Standardize reporting system. Ask for regular agency compliance with Executive Order 29. Survey vendors and buyers for procurement barriers. Eliminate adverse impact of bundling, prequalification and other measures. Review policies on joint ventures and taming. Establish a Small Business ombudsman. Establish a formal mentor-protégé program.3
3.2.3 2004 Commonwealth Disparity Study
In January 2004, a disparity study was completed for the Commonwealth which found the following:
M/WBEs won prime construction prime contracts for $12.4 million (1.49 percent of the total).
M/WBEs won construction subcontracts for $1.9 million (2.52 percent of the total).
M/WBEs won $4.7 million in architecture and engineering contracts (0.52 percent of the total).
M/WBEs won $13.1 million in professional contracts (0.70 percent of the total).
M/WBEs won other services contracts for $37.2 million (2.16 percent of the total).
2 Code of Virginia, § 2.2-4310A.
3 Report of Governors Advisory Commission on Minority Business Enterprise, November 2003.

Review of Remedial Policies
Page 3-4
M/WBEs won goods and supplies contracts for $40.3 million (1.23 percent of the total).4
A multi secretarial task force was established following the 2004 disparity study.
3.2.4 Executive Order 33
Executive Order 33 was issued in 2006 and was a significant turning point in the Commonwealth SWaM program. Executive Order 33 required a race-neutral goal setting program and small business goals in agency procurement plans. Most significantly, Executive Order 33 established a 40 percent goal for SWaM utilization. Executive Order 33 also required:
Including a SWaM participation component on prime contracts.
Producing SWaM subcontracting data.
Encouraging SWaM bidding on cooperative agreements.
Developing alternative dispute resolution mechanisms.
Revising SWaM purchasing regulations and guidelines.
Making construction mobilization payments where reasonable and feasible.
Identifying and removing barriers to SWaM participation at executive branch agencies and institutions.
Development by the Department of Business Assistance (DBA), in conjunction with the DMBE, VDOT, and Department of Planning and Budget, of a small business development program, which would address contract financing, mentor-protégé programs, and joint venture programs.
Establishing a SWaM contract mediation program.
3.3 SWaM Outreach
Virginia law has for some years provided for outreach to SWaM businesses. Agencies are required to establish written internal procedures to facilitate agency purchases from SWaM firms and to maintain a listing of SWaM firms for solicitation purposes and to solicit SWaMs for sealed bids or proposals.5 The APSPM suggests, “Special emphasis should be placed on including Virginia vendors and DMBE-certified small, women-owned and minority-owned businesses on all solicitation lists.”6 The APSPM also suggests that VDMBE and Virginia Minority Suppliers Development Council (VMSDC) be consulted as sources of supplies to supplement lists from the chambers of commerce.7
4 MGT, A Disparity Study for the Commonwealth of Virginia (2004), Exhibits 4-4, 4-9, 4-15, 4-21, 4-27 and 4-33.
5 Code of Virginia, § 2.2-4310A, B; APSPM § 3.10,10b.
6 APSPM § 2.3.
7 APSPM, § 2.6.

Review of Remedial Policies
Page 3-5
DMBE has instituted a number of partnerships to facilitate outreach to SWaMs. One example is the partnership with W.M. Jordan Company, a construction contractor. In the Memorandum of Understanding, Jordan agreed to look for subcontracting opportunities and provide information on upcoming events and subcontractor awards.8 DMBE also has a number of Memorandum of Understanding with local governments in the Commonwealth.
Virginia state colleges and universities also conduct SWaM outreach activities. The Virginia Association of State College and University Purchasing Professionals puts out a SWAM Newsletter, Supplier Diversity News, and has held five SWaMFest vendor fairs. Some universities have dedicated SWaM personnel, such as the University of Virginia Procurement Services which has four staff people assigned to SWaM initiatives. Virginia Commonwealth University’s SWaM Construction Program held monthly meetings with directors of the following organizations to discuss forthcoming opportunities: Greater Richmond Chamber of Commerce, Central Virginia Business and Construction Association, Greater Virginia Contractors Association, Metropolitan Business League, Asian American Assistance League, Virginia Hispanic Chamber of Commerce, and the VMSDC.
There are a number of procurement mechanisms facilitating vendor access to Commonwealth procurement opportunities:
eVA (“Electronic Virginia”) is the Commonwealths Internet procurement system. All Commonwealth agencies are required to use eVA. Since the institution of eVA, vendors seeking status as a regular bidder with the Commonwealth are required to register with eVA prior to award.9 Vendor eVA registration is $25 per year plus 1 percent of the value of all orders, up to $500 per order for certified SWaMs. DMBE has participated in a number of workshops to facilitate SWaM participation in eVA.
Virginia Business Opportunities (VBO) is a listing of Commonwealth bidding opportunities in electronic and hard-copy form, covering general and highway construction, data processing, equipment and supplies, and professional and non-professional services.
Ariba is a platform for one-stop shopping by state buyers using electronic catalogs on an eMall.
3.4 SWaM Incentives
3.4.1 Small Business Enterprise
The Commonwealth has had incentives for small business for some time. As noted above, the Code of Virginia requires all public bodies to establish programs that facilitate the
8 Memorandum of Understanding between the W.M. Jordan Company and the Virginia Department of Minority
Business Enterprise, March 31, 2009. 9 In addition to eVa registration, licensing requirements have also increased since the last disparity study. A
contractor needs license A if the contract is $120,000 or more, or if the contractor does $750,000 or more in business over a 12 month period. A contractor needs license B if the contract is $7,500 to $120,000 or more, or if the contractor does between $150,000 and $750,000 or more in business over a 12 month period. A contractor needs license C if the contract is $1,000 to $7,500 or more, or if the contractor does less than $150,000 in business over a 12 month period.

Review of Remedial Policies
Page 3-6
participation of SBEs as well as WBES and MBEs.10 Previously, SBEs in the Commonwealth self-certified, but there were multiple definitions of SBEs used by Commonwealth agencies. The definition of SBE for SWaM certification has evolved since the 2004 disparity study. Currently, a small business is defined as a firm with 250 or fewer employees or average gross receipts over the past three years of less than $10 million.11 The Commonwealth also includes service disabled veteran-owned businesses in its SWaM program.
3.4.2 Small Business Set Asides
The Commonwealth seeks to exclusively set aside procurements that are $50,000 or less to SWaMs.12 Procurements of less than $5,000 require prices to be fair and reasonable. Procurements from $5,000 to $50,000 are also to be exclusively set aside to SWaM firms if there is a reasonable expectation of at least two competitive bids from DMBE certified firms.13 SWaM set asides are allowed for procurements in excess of $50,000 if there is a reasonable expectation of at least two competitive bids from DMBE certified firms.14
3.4.3 Subcontractor Plans
Small Business Subcontracting Plans are required for procurements in excess of $100,000 unless there is a written determination as to why no subcontracting opportunities exist.15 Prime vendors are required to submit the following subcontractor information: firm name; firm telephone number; dollar amount of the subcontract; SBE, MBE, WBE status; and type of product/service performed and at what frequency. Final payment can be withheld until certification of this information is delivered.
3.4.4 Other SWaM Incentives
The APSPM allows for other incentives to further SWAM utilization, in particular:
The APSPM requires that Commonwealth agencies consider reducing the size of contracts as a means of encouraging SWaM utilization.16
Commonwealth agencies are to avoid the use of cooperative contracts when SWaMS are available to provide the goods or services at “fair and reasonable prices,” unless the cooperative vendor is a SWaM.17
10
Code of Virginia, § 2.2-4310B. 11
Code of Virginia, § 2.2-4310E Virginia Administrative Code, 7VAC10-21-100. 12
APSPM § 3.10.g. 13
APSPM § 3.10.g.2. 14
APSPM § 3.10.g.3. 15
APSPM § 3.10.h. Since 1991, the Commonwealth has had a policy promoting SWaM utilization in RFPs exceeding $100,000 in value over the term of the contract. Ruby Martin, Memorandum, Participation in Commonwealth Procurement Transactions by Small Businesses and Businesses Owned by Women and Minorities, August 12, 1991. APSPM § 3.10.d (September 1998). 16
APSPM § 3.10.c. 17
APSPM § 3.7.b.

Review of Remedial Policies
Page 3-7
3.5 Disadvantaged Business Enterprise Program
VDOT runs the federally mandated DBE program for the Commonwealth. The draft VDOT DBE goal for 2007-08 was 9.8 percent, of which 0.3 percent was proposed to be race-neutral.18 Commonwealth DBE utilization FY 2003 through March 2007 is shown in Exhibit 3-2 below. The exhibit shows that DBEs won over $165.6 million in contracts during the period, 13.05 percent of the total.
EXHIBIT 3-2 VIRGINIA DEPARTMENT OF TRANSPORTATION
DBE UTILIZATION FY 2003 THROUGH MARCH 2007
Fiscal Year DBE Utilization Percent DBE Utilization 2003-2004 $68,489,294 16.07% 2004-2005 $41,616,226 15.45% 2005-2006 $27,694,670 8.93% 2006-Mar. 07 $27,816,543 10.57% Total $165,616,733 13.05%
Source: Virginia DBE Goal Setting Methodology 2007-2008 Draft.
The VDOT DBE program is participating in unified DBE certification. VDOT and Washington Metropolitan Airport are the lead agencies, with participation from the Virginia Department of Rail and Public Transportation, the Virginia Port Authority, and the Virginia Aviation Department.
The DMBE office historically has provided technical services for the VDOT DBE program. DMBE has business development specialists working in Hampton Roads, Richmond, and Northern Virginia Lynchburg/Salem/Bristol/Staunton. VDOT has also established a Business Opportunity and Workforce Development program, part of a national U.S. DOT initiative, to furnish technical assistance to DBEs. The DBE certification program was transferred from VDOT to DMBE in 2005.
3.6 SWaM Reporting
Virginia law requires agencies to report spending with SWaMs and require DMBE to report to the Governor those agencies failing to report SWaM spending.19 The Commonwealth established the Dashboard system for SWaM utilization reporting in FY 2007. The Dashboard system reports SWaM spending by MBE, SBE and WBE status; by month, quarter, and year; by secretariat; by ethnicity; by functional area (transportation, professional services, IT, goods, A&E, finance, and construction); and by top vendors. In FY 2009, Dashboard reported that the Commonwealth spent $268.1 million (5.41 percent) with MBEs, $253.6 million (5.12 percent) with WBEs, and $1.5 billion (31.35 percent) with SBEs.20
18
Virginia DBE Goal Setting Methodology 2007-2008 Draft. 19
Code of Virginia, § 2.2-1405. 20
DMBE Diversity Expenditure Portal, https://swam.bfountain.com/virginia/dashboard/.
Review of Remedial Policies
Page 3-8
3.7 Department of Minority Business Enterprise
The DMBE was created by statute in the office of the governor.21 The stated mission of the DMBE is: “Working collaboratively with public and private industries, the Department of Minority Business Enterprise will aggressively pursue supplier diversity by creating contracting opportunities and promoting fairness in the state's procurement process for Small, Women-owned, and Minority-owned Businesses.”
Under the Code of Virginia the duties of DMBE include:
1. Coordinating the state government plans and programs that affect MBEs.
2. Promoting activities of state and local governments and other local organizations working on the growth of MBEs.
3. Collecting and disseminating information that will be helpful to the establishment and successful operation of minority business enterprises.
4. Providing technical and management assistance to minority business enterprises.
5. Managing the Capital Access Fund for Disadvantaged Businesses.22
DMBE has six agency goals:
1. Increase SWaM procurement opportunities and the proportion of Commonwealth dollars allocated to certified SWaM vendors.
2. Increase the number of certified SWaMS and DBEs.
3. Provide a uniform method of reporting SWaM data.
4. Conduct outreach.
5. Insure preparedness.
6. Maintain efficient administrative services.23
21
Code of Virginia, §2.2-1400. 22
Code of Virginia, §2.2-1402. 23 DMBE Agency Strategic Plan, 11/2/2009.

Review of Remedial Policies
Page 3-9
The DMBE office has the following service areas:
Certification Procurement Reporting and Coordination Outreach Division Administrative Service Division
DMBE has a strategic plan with baseline and target values, administrative measures, and productivity measures. The key productivity measures for DMBE are:
Contracting dollars spent with SWaMs. Number of contracts awarded to SWaMs. Number of certified SWaMs.24
The DMBE office had 22 full-time equivalent (FTEs) staff and a budget of about $2.26 million in FY 2009, two thirds of which came from non-general funds.25 There are 29 authorized positions at DMBE.
3.8 SWaM/DBE Certification
The DMBE office certifies SWaMs and DBEs. For purposes of SWaM certification, a minority individual is defined as “an individual who is a citizen of the United States or a legal resident alien and who satisfies one or more of the following definitions:
1. ‘African American’ means a person having origins in any of the original peoples of Africa and who is regarded as such by the community of which this person claims to be a part.
2. ‘Asian American’ means a person having origins in any of the original peoples of the Far East, Southeast Asia, the Indian subcontinent, or the Pacific Islands, including but not limited to Japan, China, Vietnam, Samoa, Laos, Cambodia, Taiwan, Northern Mariana, the Philippines, a U.S. territory of the Pacific, India, Pakistan, Bangladesh, or Sri Lanka and who is regarded as such by the community of which this person claims to be a part.
3. ‘Hispanic American’ means a person having origins in any of the Spanish-speaking peoples of Mexico, South or Central America, or the Caribbean Islands or other Spanish or Portuguese cultures and who is regarded as such by the community of which this person claims to be a part.
4. ‘Native American’ means a person having origins in any of the original peoples of North America and who is regarded as such by the community
24
DMBE Agency Strategic Plan, 11/2/2009. 25
DMBE Agency Strategic Plan, 11/2/2009, at 6.
Review of Remedial Policies
Page 3-10
of which this person claims to be a part or who is recognized by a tribal organization.”26
The definition of an eligible minority business is:
1. (i) It is at least 51% owned by one or more minority individuals who are U.S. citizens or noncitizens in full compliance with U.S. immigration law; or (ii) in the case of a corporation, partnership or limited liability company or other entity, at least 51% of the equity ownership interest in the corporation, partnership or limited liability company or entity is owned by one or more minority individuals; and
2. One or more of the minority owners controls both the management and daily business operations; and
3. The minority owner(s) is regarded as such by the community of which the person claims to be a part.27
There have been significant changes in DMBE certification since the last disparity study. Responsibility for DBE and WBE certification was transferred to DMBE in 2005 In May 2005 DMBE inaugurated an on-line certification service. In 2007 DMBE purged its certification database of outdated and duplicate files. The 2006 amendments to DMBE’s certification authority included changes that streamlined procedures for state certified businesses, and limited the ability of out of state firms to participate in Virginia’s SWaM program if their home state doesn’t accord Virginia firms the same opportunity.
Processing of certifications has increased significantly. DMBE processed 7,439 applications in FY 2006 and 13,469 in 2007.28 There were 19,345 certified SWaM vendors by the end of FY 2009.29
DMBE has created certification partnership arrangements with the following public and private entities: City of Norfolk, City of Virginia Beach, Fairfax County, the Richmond redevelopment Housing Authority, Dominion Resources, Neilson Builders, Skansa Inc, SB Ballard Construction Company, W.M. Jordan (contractor) and the VMSDC.
3.9 Business Development Programs
3.9.1 Virginia Department of Small Business Assistance
The Department of Business Assistance (DBA) was started in 1996 as part of the reorganization of the Virginia Department of Economic Development. The DBA is currently part of the secretary for commerce and trade. At the present time, the basic program areas of the DBA are Business Information Services, Virginia Jobs Investment, and the Virginia Small Business Investment Authority. Aspects of these programs are discussed under business development below.
26
Code of Virginia, § 2.2-4310. 27
Virginia Administrative Code, 7VAC10-21-120. 28
DMBE Agency Strategic Plan. Historically DMBE processed 8-900 applications per year. 29
DMBE, Agency Strategic Plan, Biennium 2010-2012.

Review of Remedial Policies
Page 3-11
3.9.1 Financial Assistance
There are a large number of programs assisting small firms with financing in and near the Commonwealth. A selection of these programs is discussed below.
PACE Program. DMBE has sponsored the PACE (Providing Access to Capital for Entrepreneurs) program since 2000. PACE has been administered by the Virginia Small Business Financing Authority since FY 2006. The PACE program was made up of two components: the Capital Access Fund for Disadvantaged Businesses and the Loan Guaranty Fund for Disadvantaged Businesses.
The PACE program provided loan guarantees of up to 90 percent of the principal on the loan, up to $50,000. The Capital Access Fund created loan loss reserve funds for banks made up of enrollment fees paid by borrowers and fees by DMBE. PACE partnered with Consolidated Bank & Trust, SunTrust Virginia, Wachovia Bank, James Monroe Bank, and First Community Bank for client financing. In FY 2006, PACE had approximately $315,000 in assets and $88,000 in liabilities.30 Currently, there is no funding for new PACE loans.
DBA Programs. The Virginia Small Business Financing Authority (VSBFA) is under the DBA and provides fixed asset financing and permanent working capital. The DBA provides several other loan programs, including:
Virginia Economic Development Loan Fund, providing direct loans of up to $1 million, or 40 percent of project value. The Fund is designed to fill the financing gap between private debt financing and private equity.
Loan Guaranty Program, providing a 75 percent loan guaranty of up to $300,000 on a line-of-credit or a loan.
The VSBFA administered $3 million in financing to 108 businesses and local industrial development authorities in FY 2009, resulting in an additional $16 million in financing.31
Basic balance sheet data on Commonwealth business loan programs is provided in Exhibit 3-3.
EXHIBIT 3-3 COMMONWEALTH OF VIRGINIA
LOAN PROGRAM ASSETS AND LIABILITIES FY 2006
Commonwealth Loan Programs Assets Liabilities Economic Development Loan Fund Program
$17,918,217 $2,023,141
Loan Guaranty Program $2,743,805 $45 Virginia Capital Access Program $2,421,882 $2,419,781
Source: Auditor of Public Accounts, Virginia Small Business Financing Authority, Report on Audit for the Year Ended June 30, 2006, at 2.
30
Auditor of Public Accounts, Virginia Small Business Authority, Report on Audit for the Year Ended June 30, 2006, at 2. 31
Virginia Department of Business Assistance, Agency Strategic Plan, Biennium 2010-12

Review of Remedial Policies
Page 3-12
Small Business Administration. The U.S. Small Business Administration (SBA) maintains the 504 Loan Program, the 7A Loan Guarantee Program, the SBA’s Community Express program, and the SBA’s Pre-qualification program. The 504 Program is for the acquisition of fixed assets only, such as real estate and equipment. SBA 504 loans range from $250,000 to $1.5 million. The 7A Loan Guaranty Program provides lines of credit or term loans for most business purposes. SBA 7A loans range from $50,000 to $2 million. The Community Express Program targets MBEs in low and moderate income neighborhoods with a high concentration of minority residents. The program provides an 85 percent guarantee for loans of less than $150,000 and a 75 percent guarantee for loans ranging from $150,000 to $250,000.
Other Financing Programs. Minority Economic Development through Assisted Lending (MEDAL) of Norfolk, Virginia, provides business training, technical assistance, micro-loans ($5,000-$25,000) and follow-up counseling. The average loan size has been $5,000-$10,000. The program was started in 1996.
The SBDCs provide a Pre-Qualification Loan program to assist firms with obtaining SBA loan guarantees. This program is for M/WBEs, veterans, and rural businesses. The loan funds can be used for working capital, debt payment, equipment and inventory purchases, construction, and real estate purchases.
3.9.2 Prompt Payment
Commonwealth law provides that interest begins to accrue on amounts owed by the Commonwealth to a contractor after seven days following the payment date and on amounts owed by a prime contractor to a subcontractor. A vendor must pay its subcontractors interest at a rate of 1 percent a month on the subcontractor’s proportionate share of the Commonwealth payments after seven days following the payment of the vendor by the Commonwealth. 32
3.9.3 Bonding Assistance
The Commonwealth does not maintain a bonding assistance program, although certified DBEs have access to the federal U.S. Department of Transportation bonding program through the VDOT DBE program.33 Under certain circumstances a certified check, cash escrow, personal bond, property bond, or bank or savings institution’s letter of credit may be accepted in lieu of a bid, payment, or performance bond.34
3.9.4 Management and Technical Assistance
The Commonwealth has continued to provide management and technical assistance to SWaMs. DMBE has provided some form of management and technical assistance to SWaMs since program inception. DMBE currently maintains a staff of five business development specialists located around the Commonwealth. The Virginia DBA has a number of business development programs, including Business Information Services (BIS), Entrepreneur Express program (part of BIS), Business Sales Growth Seminars, one-on-one counseling, and Business One Stop. 32
Code of Virginia, §§ 2.2-4347 through 2.2-4354. 33
Bid, payment, and performance bonds are required on construction contracts in excess of $100,000 and on transportation-related construction contracts in excess of $250,000. Code of Virginia, § 2.2-4336. 34
Code of Virginia, § 2.2-4338.
Review of Remedial Policies
Page 3-13
There are a number of business development programs in the Commonwealth, some of which are partners:
Overall, the SBDC network counsels in the areas of business start-ups, access to capital, business planning, financial analysis, marketing, accounting, and related business services. The Virginia SBDC network operates 29 centers at the present time. In 2008, the SBDC network assisted over 4,200 clients and sponsored training events attended by 10,100 individuals. Next Level (NxLevel) is an entrepreneurial training program supported by the Virginia SBDC Network. The U.S. Small Business Administration (SBA) and a variety of local business and academic organizations (and at one time the DBA) sponsor the SBDC Network NxLevel. The courses are for start-ups and existing businesses.
Community Business Partnership provides training, one-on-one technical assistance and counseling, computers and Internet access, virtual incubator, a resource library, networking opportunities, and marketing assistance. The Partnership also sponsors the Women’s Business Center of Northern Virginia. The program is funded by the SBA Fairfax County and George Mason University Enterprise Center and partners with the Virginia DBA.
The Procurement Technical Assistance Center (PTAC) was started in 1985 to assist businesses selling to the U.S. Department of Defense (DOD). PTAC assists with market research, identifying business codes, Web site registering, bid matching, specifications, and the federal acquisition regulations. PTAC also sponsors workshops on government contracting, contract administration, and GSA proposals. PTAC provides current bid listing, bid board, bid matching for prime contractors and subcontractors, electronic data interchange, assistance with bid preparation, identification of buyers and purchasing agents, training, and workshops. There are three PTACs in the Commonwealth. These are the Crater Planning District Commission in Petersburg, the George Mason University Procurement Technical Assistance Program in Fairfax, and the Southwest Virginia Community College Center for Economic Development in Richlands.
3.10 Conclusions
Overall, the Commonwealth has stepped up the programmatic incentives behind the SWaM program and the resource commitment to the SWaM program since Executive Order 33. There have also been significant improvements in the level of certification and the tracking of SWaM expenditure. While business development assistance to SWaMs has continued, lending assistance through PACE has been curtailed. Growth in SWaM expenditure is detailed in Chapter 4.0.

4.0 UTILIZATION AND AVAILABILITY ANALYSIS

Page 4-1
4.0 UTILIZATION AND AVAILABILITY ANALYSES
This chapter presents the results of MGT of America, Inc. (MGT) analysis of the Commonwealth of Virginia (Commonwealth) procurement activity occurring between the period of July 1, 2005, and June 30, 20091 (fiscal year 2006 through fiscal year 2009). This chapter analyzes the utilization of firms by the Commonwealth and self-reporting agencies2, such as universities, in comparison to the availability of firms to do business with those agencies. The results of the analyses ultimately determine whether minority, nonminority women (M/WBEs), or nonminority businesses (non-M/WBEs) were underutilized or overutilized. This chapter consists of the following sections:
4.1 Methodology
4.2 Utilization Data Collection and Management
4.3 Availability Data
4.4 Results from 2004 Procurement Disparity Study of the Commonwealth of Virginia
4.5 Prime Contractor Utilization Analysis – Commonwealth Accounting Reporting System (CARS)
4.6 Subcontractor Utilization (Construction) Analysis – Small, Women-, and Minority-owned Business Program’s (SWaM) Dashboard, Analytics, and Reporting System
4.7 Availability Analysis – Prime and Subcontractor
4.8 Summary
4.1 Methodology
4.1.1 Business Categories The Commonwealth’s utilization and availability of M/WBEs was analyzed for five business categories: construction, architecture and engineering, professional services, other services, and goods and supplies. Vendor payments and/or awards were grouped into one of the above categories using the account codes from the Commonwealth and the universities’ accounting systems. The object codes that fall into these business categories are contained in Appendix A. The definitions for the business categories are as follows.
1 Based on available data, subcontractor activity occurring between the period of July 1, 2006 and June 30,
20091 (fiscal year 2007 through fiscal year 2009) was analyzed.
2 For the purpose of this report, the self-reporting agencies include the following universities and colleges:
George Washington University, University of Mary Washington, James Madison University, University of Virginia, Radford University, Virginia Commonwealth University, Virginia Polytechnic Institute and State University, College of William and Mary in Virginia, and Old Dominion University. Other self-reporting agencies also include the Virginia Economic Development Partnership, Virginia Housing Development Authority, Virginia Tourism Authority, and the Virginia Port Authority.

Utilization and Availability Analysis
Page 4-2
Construction
Construction refers to any construction-related services, including but not limited to:
General building contractors engaged primarily in the construction of commercial buildings.
Light maintenance construction services such as carpentry work; electrical work; installation of carpeting; air-conditioning repair, maintenance, and installation; plumbing; and renovation.
Other related services such as water-lining and maintenance, asbestos abatement, drainage, dredging, grading, hauling, landscaping (for large construction projects such as boulevards and highways), paving, roofing, and toxic waste clean-up.
Architecture and Engineering
This business category encompasses all services performed by a:
State-licensed architect. Professional engineer. Firm owned by parties with such designations.
Professional Services
This business category includes:
Financial services. Legal services. Medical services. Educational services. Other professional services.
Other Services
Other services include:
Janitorial and maintenance services. Uniformed guard services. Computer services. Certain job shop services. Graphics, photographic services. Landscaping. Other nontechnical or unlicensed services
Goods and Supplies
This business category includes:
Office goods. Miscellaneous building materials. Commodities.

Utilization and Availability Analysis
Page 4-3
Equipment. Vehicles. Computer equipment.
4.1.2 M/WBE Classifications In this study, businesses (including corporations and partnerships) classified as M/WBEs are firms at least 51 percent owned and controlled by members of four groups which include: African Americans-, Hispanic Americans-, Asian Americans-, Native Americans-, and nonminority women-owned firms. This report follows the State policy and practice of defining those groups. This study defines non-M/WBEs to include firms owned by nonminority males and publicly traded corporations. This study uses the term M/WBE to refer to all minority- and nonminority women-owned firms, regardless of whether they were certified with the Commonwealth as a M/WBE or small business enterprise (SBE).
This section presents the methodology for the collection of data and analysis of utilization, of M/WBE and non-M/WBEs for this study.
4.2 Utilization Data Collection and Management
4.2.1 Collection and Management of the Data – Commonwealth and Self-Reporting Agencies
MGT conducted data assessment and interviews with key staff knowledgeable about the Commonwealth’s procurement process. The decision was made by the Commonwealth and MGT to use data obtained through the Commonwealth Reporting and Accounting System (CARS) as the primary utilization data source for the business categories analyzed in the study. Thus, electronic prime payment data within the study period for all business categories was collected from CARS. The data contained more than 1.1 million records. In addition to the payment data obtained from CARS, electronic procurement, bidder, and vendor data within the study period for all business categories was collected from the Commonwealth’s electronic procurement system (eVA). It was also agreed by the Commonwealth and MGT that electronic subcontractor data would be obtained from the Commonwealth’s Small, Women, and Minority (SWaM) Dashboard, Analytics, and Reporting System (Dashboard). Attempts were also made to collect electronic subcontractor data from the self-reporting agencies; however, due to limited electronic subcontractor data, Dashboard was used as the main subcontractor utilization data source. While all available electronic Dashboard subcontractor data for the study period was obtained, the study presents MGT’s findings for construction subcontracting activity based on firms located within the Commonwealth. In addition, the construction subcontractor findings exclude projects let by the Department of Transportation. Appendix M presents the subcontractor utilization findings by functional area (such as construction, professional services) and also presents findings which include projects let by the Department of Transportation. Self-reporting agencies were also requested to submit vendor data, prime data, subcontractor data, and bidder data in electronic format. Among the self-reporting
Utilization and Availability Analysis
Page 4-4
agencies, data was kept in several varying data formats. Of the self-reporting agencies, MGT obtained data from the following universities.
University of Virginia. Radford University. Virginia Commonwealth University. Virginia Polytechnic Institute and State University. The College of William and Mary in Virginia. Old Dominion University. James Madison University. George Mason University. University of Mary Washington.
It should be noted that University of Virginia, Radford University, Virginia Commonwealth University, Virginia Polytechnic Institute and State University, College of William and Mary in Virginia, and Old Dominion University were analyzed in the Commonwealth’s 2004 Procurement Disparity Study of the Commonwealth of Virginia. Please refer to Appendix C for the prime utilization analysis for these self-reporting universities and colleges. In addition to the self-reporting universities and colleges, data was also obtained from the Virginia Economic Development Partnership, Virginia Housing Development Authority, and Virginia Tourism Authority.3 The prime data studied for this report is comprehensive and includes procurements of all sizes. Some records were excluded as not relevant to the study. Examples of procurement activity excluded from analysis include duplicate procurement records; contract awards and payments out of the time frame of the study; contract awards and payments to nonprofits and government entities; contract awards and payments from the Virginia Department of Transportation; interfund transfers and utility payments such as water, gas, and electricity. The exclusions were consistent with the 2004 Commonwealth Disparity Study. Object codes were either completely included or excluded. The list of object codes for CARS is presented in Appendix A to this report. In addition, data on procurements made through Procurement Cards (P-Cards) was also collected by MGT; however, it is not presented in this report. 4.2.2 Utilization Methodology
For the purpose of this report, the prime analysis was based on payments made to M/WBE and non-M/WBE firms by the Commonwealth. Therefore, except for the exclusions (such as payments to nonprofits and government entities, etc.) previously mentioned, the prime utilization analysis includes all identified M/WBE and non-M/WBE firms who have done business with the Commonwealth and is therefore not limited to geographical location of the firms. The prime utilization analysis is based on activity occurring between July 1, 2005, and June 30, 2009. However, due to the lack of electronic subcontractor data between July 1, 2005, and June 30, 2006 (fiscal year 2006), the subcontractor utilization analysis is based on activity occurring between July 1, 2006 and June 30, 2009. In addition, whereas the prime analysis is based on all identified M/WBE and non-M/WBE firms, the subcontractor analysis is based on firms
3 Findings from the data provided by these self-reporting agencies are not presented in this report.
Utilization and Availability Analysis
Page 4-5
located in the Commonwealth that were reported as providing construction and construction-related services.
4.2.3 Collection and Management of the Data – Commercial Construction
Data
MGT selected two sources of data for its private sector analysis based on commercial construction data: (1) data provided by Reed Construction Data (RCD) Corporation and
(2) commercial construction permit data (such as building, electrical, plumbing)4
provided by the city of Richmond, Virginia for commercial construction projects. The value in examining commercial construction permits is that it offers the most complete and up-to-date record of actual construction activity undertaken in the Commonwealth. However, to corroborate findings, MGT also analyzed RCD, which gathers information on both general construction and civil engineering projects in a given market area at both the prime contractor and subcontractor level.5 In addition to the RCD collected, MGT’s subconsultant, Transformation Consulting, Inc. assisted with the collection of commercial construction permits data from the following jurisdictions. Appendix K presents a sample of the letter that was submitted to the various jurisdictions as well as organizations.
Henrico County, Virginia. City of Fairfax, Virginia. City of Norfolk, Virginia. City of Virginia Beach, Virginia. City of Charlottesville, Virginia. Chesterfield County, Virginia.
Commercial construction permits data was also requested from the city of Portsmouth, city of Martinsville, Loudon County, as well as other jurisdictions in Virginia. Appendix L presents a listing of jurisdictions and organizations contacted.
Appendix D and Appendix E present findings on two sets of analyses pertaining to minority- and women-owned business enterprise (M/WBE) utilization and availability in the Commonwealth of Virginia (Commonwealth) private sector marketplace. The analyses examined M/WBE utilization and availability in the Commonwealth based on city of Richmond (Richmond) and Reed Construction Data (RCD).6 This analysis presents disparities in M/WBE utilization at both the prime contractor and subcontractor level on the private commercial construction industry based on both data sources.
4 Appropriate permits are required for any building, construction, alteration, or repair involving new or
changed uses of property (other than ordinary repairs). Although in most instances, individual permits were issued for work on the same project, it was possible, in many cases, to identify subcontractors who were clearly providers of construction and other services to prime contractors, based on the type of work, since separate permits are required for building, electrical, heating, air conditioning, and plumbing. 5 RCD were also reviewed but proved to be incomplete for this analysis. Although RCD’s subcontractor data
was incomplete and unusable, RCD’s prime contracting data was sufficient for a prime contractor analysis. Results from the prime contractor analysis are summarized briefly in Appendix E. 6 The findings from the RCD analyses are presented in Appendix E of this report.
Utilization and Availability Analysis
Page 4-6
4.3 Availability Data
There is no single approach to estimating relative business availability that has been adopted by the post-Croson case law as a whole or by the Fifth Circuit in particular.7 In general the case law has emphasized firms being qualified, willing and able to pursue work with an agency. However, there is in general no single data source that captures all these features. The 2004 Commonwealth Disparity Study relied primarily on vendor and bidder data to estimate relative M/WBE availability. This study presents several measures of business availability, including census, vendor/bidder data and “custom census.”
4.3.1 Census Data
In this report, MGT presents availability estimates based on the Survey of Business Owners (SBO), which is a consolidation of two prior surveys, the Survey of Minority-Owned Business Enterprises (SMOBE) and Survey of Women-Owned Business Enterprises (SWOBE), and includes questions from a survey discontinued in 1992 on Characteristics of Business Owners (CBO).The SBO is part of the economic Census, which is conducted every five years. The SBO findings are based on the characteristics of U.S. businesses by ownership category, by geographic area; by 2-digit industry sector based on the 2002 North American Industry Classification System (NAICS); and by size of firm (employment and receipts). Additional SBO findings are presented in Appendix I of this report. A special data request (special tabulations) was submitted to the U.S. Census Bureau so that the census estimates more clearly match the Commonwealth procurement categories (such as architecture and engineering services) and to obtain more detailed availability estimates than were available in the published census data. The SBO special tabulation findings for architecture and engineering services (with paid employees) are presented later in this chapter. Additional SBO special tabulation findings are presented in Appendix H of this report.
The primary limits of the 2002 SBO for the purposes of this study are that: (1) the data is the least current of the availability sources, (2) SBO does not indicate whether the firm is interested in work with Commonwealth’s agencies, (3) SBO does not indicate whether a firm is primarily a subcontractor or prime contractor, and (4) SBO does not provide data on individual firms.
4.3.2 Bidder Data
Outside of the Commonwealth and a few other self-reporting agencies, the Commonwealth does not maintain electronic list of bidders. However, the data was obtained from the Commonwealth’s eVA procurement study. State agencies, colleges, universities and many local governments use eVA to announce bid opportunities, invite bidders, Request for Proposals (RFPs), receive quotes, and place orders for goods and services.
7 See for example, Scott v. City Of Jackson, 199 F.3d 206 (5
th Cir 1999).

Utilization and Availability Analysis
Page 4-7
4.3.3 Vendor Data
There is case law where studies estimating availability based on vendor data have been upheld in federal court.8 The vendor data obtained from eVA was the vendor database used by the Commonwealth, which presents firms that performed prime contract work for the Commonwealth, bid on prime contract work for the Commonwealth, or registered to do business with the Commonwealth.
While the eVA vendor data appears to be the natural starting point for estimating vendor availability, there are limits. First, many M/WBEs and SBEs are not registered with eVA. Second, eVA does not indicate whether a firm is primarily a subcontractor or prime contractor.
To provide additional estimates of vendor availability, that is, those firms that affirmatively took steps to work on Commonwealth projects, the vendor and bidder lists were combined to create an augmented vendor database9.
4.3.4 Custom Census
Some cases have allowed what is known as “custom census” as a source of business availability.10 Custom census essentially involves using Dun & Bradstreet as a source of business availability. Dun & Bradstreet has the advantage over SBO data in that the information is current and Dun & Bradstreet contains data on individual firms, including firm revenue, number of employees and specific areas of work. The limits of Dun & Bradstreet are that: (1) the race, ethnicity, and gender classification are weak, (2) Dun & Bradstreet does not indicate whether the firm is interested in work with the Commonwealth’s agencies, and (3) Dun & Bradstreet does not indicate whether a firm is primarily a subcontractor or prime contractor. This study addressed those deficiencies by conducting a short survey of a random sample of firms supplied by Dun & Bradstreet in construction.
The first step in the survey was to collect a random sample of firms from Dun & Bradstreet in this procurement category. Six digit NAICS codes were selected to eliminate procurement areas that were not used to solicit from for profit vendors by the Commonwealth agencies. These firms were then surveyed. The sample frame was a sample of 2,500 firms in the construction procurement category. There were over 400 completed surveys.
The firms were asked:
Race, ethnicity and gender classification.
Are they a for-profit construction firm.
Had they bid or considered bidding on projects by a Virginia agency or educational institution.
8 H.B.Rowe v. North Carolina DOT, 589 FSupp.2d 587 (ED NC 2008).
9 The preliminary findings from the augmented vendor database are not presented in this report.
10 Northern Contracting v. Illinois DOT, 2005 U.S. Dist. LEXIS 19868 (ND IL 2005).
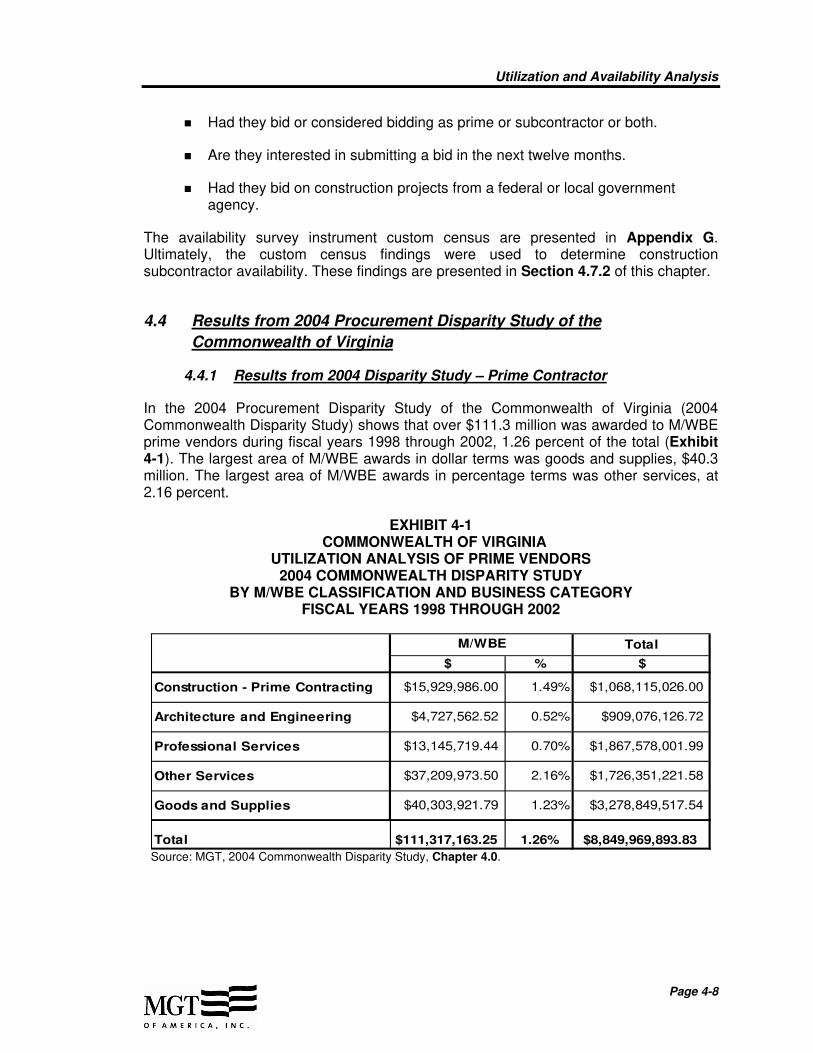
Utilization and Availability Analysis
Page 4-8
Had they bid or considered bidding as prime or subcontractor or both.
Are they interested in submitting a bid in the next twelve months.
Had they bid on construction projects from a federal or local government agency.
The availability survey instrument custom census are presented in Appendix G. Ultimately, the custom census findings were used to determine construction subcontractor availability. These findings are presented in Section 4.7.2 of this chapter.
4.4 Results from 2004 Procurement Disparity Study of the
Commonwealth of Virginia
4.4.1 Results from 2004 Disparity Study – Prime Contractor
In the 2004 Procurement Disparity Study of the Commonwealth of Virginia (2004 Commonwealth Disparity Study) shows that over $111.3 million was awarded to M/WBE prime vendors during fiscal years 1998 through 2002, 1.26 percent of the total (Exhibit 4-1). The largest area of M/WBE awards in dollar terms was goods and supplies, $40.3 million. The largest area of M/WBE awards in percentage terms was other services, at 2.16 percent.
EXHIBIT 4-1 COMMONWEALTH OF VIRGINIA
UTILIZATION ANALYSIS OF PRIME VENDORS 2004 COMMONWEALTH DISPARITY STUDY
BY M/WBE CLASSIFICATION AND BUSINESS CATEGORY FISCAL YEARS 1998 THROUGH 2002
Total
$ % $
Construction - Prime Contracting $15,929,986.00 1.49% $1,068,115,026.00
Architecture and Engineering $4,727,562.52 0.52% $909,076,126.72
Professional Services $13,145,719.44 0.70% $1,867,578,001.99
Other Services $37,209,973.50 2.16% $1,726,351,221.58
Goods and Supplies $40,303,921.79 1.23% $3,278,849,517.54
Total $111,317,163.25 1.26% $8,849,969,893.83
M/WBE
Source: MGT, 2004 Commonwealth Disparity Study, Chapter 4.0.

Utilization and Availability Analysis
Page 4-9
4.4.2 Results from 2004 Disparity Study - Subcontractor
In the 2004 Commonwealth Disparity Study shows that over $1.9 million was awarded with M/WBE construction subcontractors during fiscal years 1998 through 2002, 2.52 percent of the total (Exhibit 4-2).
EXHIBIT 4-2 COMMONWEALTH OF VIRGINIA
UTILIZATION ANALYSIS OF SUBCONTRACTORS 2004 COMMONWEALTH DISPARITY STUDY
BY M/WBE CLASSIFICATION AND BUSINESS CATEGORY FISCAL YEARS 1998 THROUGH 2002
Total
$ % $
Total Construction - Subcontracting $1,930,779.02 2.52% $76,503,347.84
M/WBE
Source: MGT, 2004 Commonwealth Disparity Study, Chapter 4.0.
4.5 Prime Contractor Utilization Analysis – Commonwealth Accounting Reporting System (CARS)
This section presents MGT’s analysis of the Commonwealth’s utilization in the construction business category based on the Commonwealth Accounting and Reporting System (CARS). As stated in Section 4.2.1, the prime analysis findings exclude dollars spent by the Virginia Department of Transportation. Appendix B presents prime analysis findings based on CARS data by business category, and also includes dollars spent by the Department of Transportation to M/WBE and non-M/WBE firms.
4.5.1 Construction – CARS
The following analyses were conducted:
Utilization analysis of all M/WBE and non-M/WBE prime contractors’ payments by year for the study period.
Utilization analysis of the number of unique prime contractors’ payments, according to race, ethnicity, and gender classification.
The utilization analysis of prime construction contractors is shown in Exhibit 4-3. M/WBEs were paid 1.87 percent of the total prime construction dollars expended by the Commonwealth during the review period. The Commonwealth paid over $1.53 billion for construction services during the study period. Hispanic American-owned firms received over $11 million, accounting for 0.75 percent of the 1.87 percent paid to M/WBEs. Among M/WBEs, African American-owned firms had the second highest share, receiving over $8 million, 0.58 percent of the total amount paid to firms.
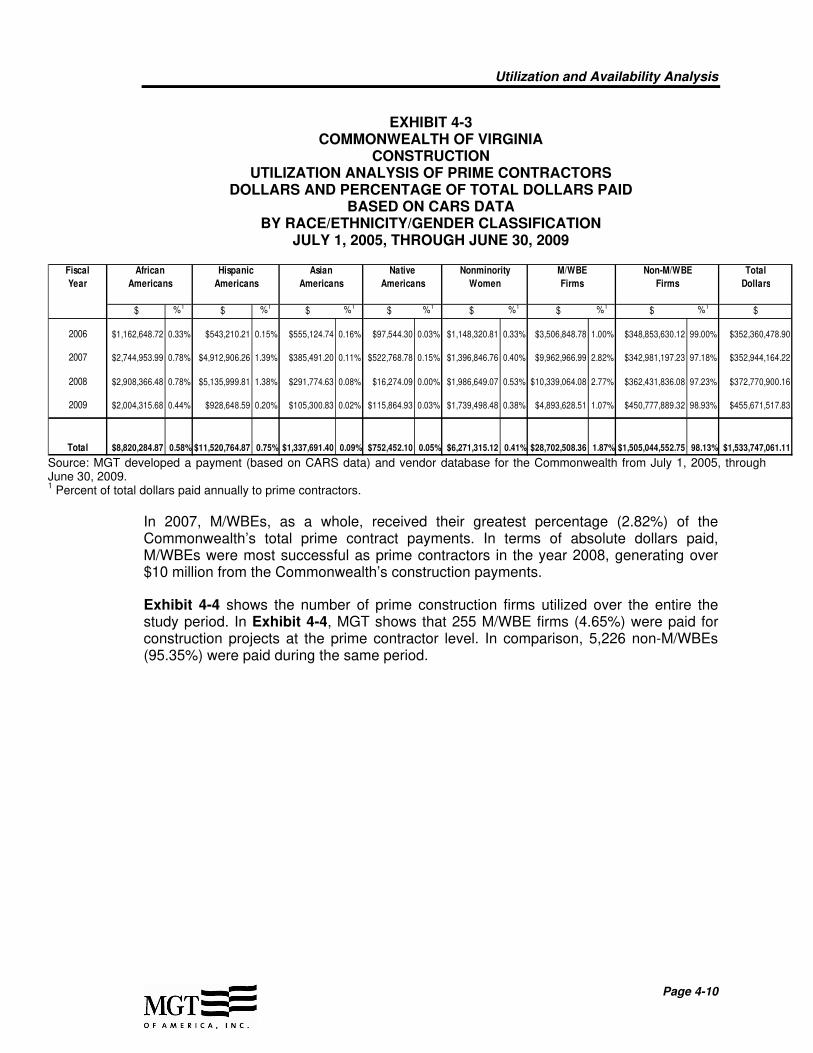
Utilization and Availability Analysis
Page 4-10
EXHIBIT 4-3 COMMONWEALTH OF VIRGINIA
CONSTRUCTION UTILIZATION ANALYSIS OF PRIME CONTRACTORS
DOLLARS AND PERCENTAGE OF TOTAL DOLLARS PAID BASED ON CARS DATA
BY RACE/ETHNICITY/GENDER CLASSIFICATION JULY 1, 2005, THROUGH JUNE 30, 2009
Fiscal African Hispanic Asian Native Nonminority M/WBE Non-M/WBE Total
Year Americans Americans Americans Americans Women Firms Firms Dollars
$ %1$ %1
$ %1$ %1
$ %1$ %1
$ %1$
2006 $1,162,648.72 0.33% $543,210.21 0.15% $555,124.74 0.16% $97,544.30 0.03% $1,148,320.81 0.33% $3,506,848.78 1.00% $348,853,630.12 99.00% $352,360,478.90
2007 $2,744,953.99 0.78% $4,912,906.26 1.39% $385,491.20 0.11% $522,768.78 0.15% $1,396,846.76 0.40% $9,962,966.99 2.82% $342,981,197.23 97.18% $352,944,164.22
2008 $2,908,366.48 0.78% $5,135,999.81 1.38% $291,774.63 0.08% $16,274.09 0.00% $1,986,649.07 0.53% $10,339,064.08 2.77% $362,431,836.08 97.23% $372,770,900.16
2009 $2,004,315.68 0.44% $928,648.59 0.20% $105,300.83 0.02% $115,864.93 0.03% $1,739,498.48 0.38% $4,893,628.51 1.07% $450,777,889.32 98.93% $455,671,517.83
Total $8,820,284.87 0.58% $11,520,764.87 0.75% $1,337,691.40 0.09% $752,452.10 0.05% $6,271,315.12 0.41% $28,702,508.36 1.87% $1,505,044,552.75 98.13% $1,533,747,061.11
Source: MGT developed a payment (based on CARS data) and vendor database for the Commonwealth from July 1, 2005, through June 30, 2009. 1 Percent of total dollars paid annually to prime contractors.
In 2007, M/WBEs, as a whole, received their greatest percentage (2.82%) of the Commonwealth’s total prime contract payments. In terms of absolute dollars paid, M/WBEs were most successful as prime contractors in the year 2008, generating over $10 million from the Commonwealth’s construction payments.
Exhibit 4-4 shows the number of prime construction firms utilized over the entire the study period. In Exhibit 4-4, MGT shows that 255 M/WBE firms (4.65%) were paid for construction projects at the prime contractor level. In comparison, 5,226 non-M/WBEs (95.35%) were paid during the same period.

Utilization and Availability Analysis
Page 4-11
EXHIBIT 4-4 COMMONWEALTH OF VIRGINIA
CONSTRUCTION NUMBER OF UTILIZED UNIQUE PRIME CONTRACTORS
BASED ON CARS DATA BY RACE/ETHNICITY/GENDER CLASSIFICATION
JULY 1, 2005, THROUGH JUNE 30, 2009
Fiscal African Hispanic Asian Native Nonminority M/WBE Non-M/WBE Total
Year Americans Americans Americans Americans Women Firms Firms Firms
# %1# %1
# %1# %1
# %1# %1
# %1#
2006 63 2.09% 10 0.33% 17 0.56% 9 0.30% 26 0.86% 125 4.14% 2,892 95.86% 3,017
2007 52 2.16% 9 0.37% 13 0.54% 11 0.46% 26 1.08% 111 4.62% 2,293 95.38% 2,404
2008 48 2.38% 6 0.30% 11 0.55% 5 0.25% 21 1.04% 91 4.51% 1,925 95.49% 2,016
2009 52 2.69% 11 0.57% 9 0.47% 8 0.41% 25 1.29% 105 5.43% 1,828 94.57% 1,933
123 2.24% 24 0.44% 26 0.47% 22 0.40% 60 1.09% 255 4.65% 5,226 95.35% 5,481
Unique Firms
Over Four
Years2
Source: MGT developed a payment (based on CARS data) and vendor database for the Commonwealth from July 1, 2005, through June 30, 2009. 1 Percentage of total firms.
2 “Unique Firms” counts a firm only once for each year it receives work. Since a firm could be used in multiple years, the
“Unique Firms” for the entire study period may not equal the sum of all years.
4.5.2 Architecture and Engineering Services – CARS
This section presents MGT’s analysis for the architecture and engineering business category. This analysis is based on CARS’s payments to firms for providing architecture and engineering services. In this section, the results of the utilization analysis of M/WBEs and non-M/WBEs as prime architecture and engineering consultants are shown. Based on CARS payment data, M/WBEs received 1.34 percent of the more than $473 million spent in architecture and engineering services. Exhibit 4-5 shows that nonminority women-owned firms received 0.88 percent, followed by Asian American-owned firms with 0.26 percent. African American- and Hispanic American-owned firms also received payments for providing architecture and engineering services to the Commonwealth, receiving 0.17 percent and 0.04 percent, respectively. Native American-owned firms received no payments during the study period.

Utilization and Availability Analysis
Page 4-12
EXHIBIT 4-5 COMMONWEALTH OF VIRGINIA
ARCHITECTURE AND ENGINEERING UTILIZATION ANALYSIS OF PRIME CONSULTANTS
DOLLARS AND PERCENTAGE OF TOTAL DOLLARS PAID BASED ON CARS DATA
BY RACE/ETHNICITY/GENDER CLASSIFICATION JULY 1, 2005, THROUGH JUNE 30, 2009
Fiscal African Hispanic Asian Native Nonminority M/WBE Non-M/WBE Total
Year Americans Americans Americans Americans Women Firms Firms Dollars
$ %1$ %1
$ %1$ %1
$ %1$ %1
$ %1$
2006 $201,226.87 0.15% $9,690.00 0.01% $363,383.00 0.27% $0.00 0.00% $476,962.37 0.35% $1,051,262.24 0.77% $134,810,242.93 99.23% $135,861,505.17
2007 $79,844.89 0.05% $8,300.00 0.01% $300,910.00 0.19% $0.00 0.00% $692,333.03 0.45% $1,081,387.92 0.70% $153,409,388.64 99.30% $154,490,776.56
2008 $264,314.90 0.27% $3,500.00 0.00% $242,560.91 0.24% $0.00 0.00% $1,454,040.27 1.47% $1,964,416.08 1.98% $97,229,562.98 98.02% $99,193,979.06
2009 $240,695.45 0.29% $144,239.32 0.17% $335,456.72 0.40% $0.00 0.00% $1,530,550.58 1.83% $2,250,942.07 2.69% $81,308,166.54 97.31% $83,559,108.61
Total $786,082.11 0.17% $165,729.32 0.04% $1,242,310.63 0.26% $0.00 0.00% $4,153,886.25 0.88% $6,348,008.31 1.34% $466,757,361.09 98.66% $473,105,369.40
Source: MGT developed a payment (based on CARS data) and vendor database for the Commonwealth from July 1, 2005, through June 30, 2009. 1 Percent of total dollars paid annually to prime consultants.
Exhibit 4-6 shows the distribution of unique architecture and engineering services prime level consultants that performed work for the Commonwealth during the study period. Non-M/WBE architecture and engineering service firms were utilized in greater proportions than M/WBEs and accounted for 95.37 percent of paid firms. The analysis of the number of firms utilized showed that African American-, Hispanic American-, Asian American-, Native American-, and nonminority women-owned firms accounted for 4.63 percent combined.

Utilization and Availability Analysis
Page 4-13
EXHIBIT 4-6 COMMONWEALTH OF VIRGINIA
ARCHITECTURE AND ENGINEERING NUMBER OF UNIQUE PRIME CONSULTANTS
BASED ON CARS DATA PAYMENTS BY RACE/ETHNICITY/GENDER CLASSIFICATION
JULY 1, 2005, THROUGH JUNE 30, 2009
Fiscal African Hispanic Asian Native Nonminority M/WBE Non-M/WBE Total
Year Americans Americans Americans Americans Women Firms Firms Firms
# %1# %1
# %1# %1
# %1# %1
# %1#
2006 4 1.30% 1 0.33% 4 1.30% 0 0.00% 3 0.98% 12 3.91% 295 96.09% 307
2007 6 2.08% 1 0.35% 4 1.39% 0 0.00% 3 1.04% 14 4.86% 274 95.14% 288
2008 8 3.10% 1 0.39% 2 0.78% 0 0.00% 4 1.55% 15 5.81% 243 94.19% 258
2009 9 3.09% 3 1.03% 3 1.03% 0 0.00% 4 1.37% 19 6.53% 272 93.47% 291
14 2.40% 3 0.51% 5 0.86% 0 0.00% 5 0.86% 27 4.63% 556 95.37% 583
Unique Firms
Over Four
Years2
Source: MGT developed a payment (based on CARS data) and vendor database for the Commonwealth from July 1, 2005, through June 30, 2009. 1 Percentage of Total Firms.
2 “Unique Firms counts a firm only once for each year it receives work. Since a firm could be used in multiple years, the
“Unique Firms” for the entire study period may not equal the sum of all years.
4.5.3 Professional Services – CARS
In this section, the results of the utilization analysis of M/WBEs and non-M/WBEs as prime professional service consultants are shown. Based on CARS payment data, M/WBEs received 2.33 percent of the over $3.20 billion spent in professional services. Exhibit 4-7 shows that African American-owned firms received 1.14 percent, followed by Asian American-owned firms with 0.92 percent. Hispanic American-, Native American-, and nonminority women-owned firms also received payments for providing professional services to the Commonwealth, each were less than 1 percent.
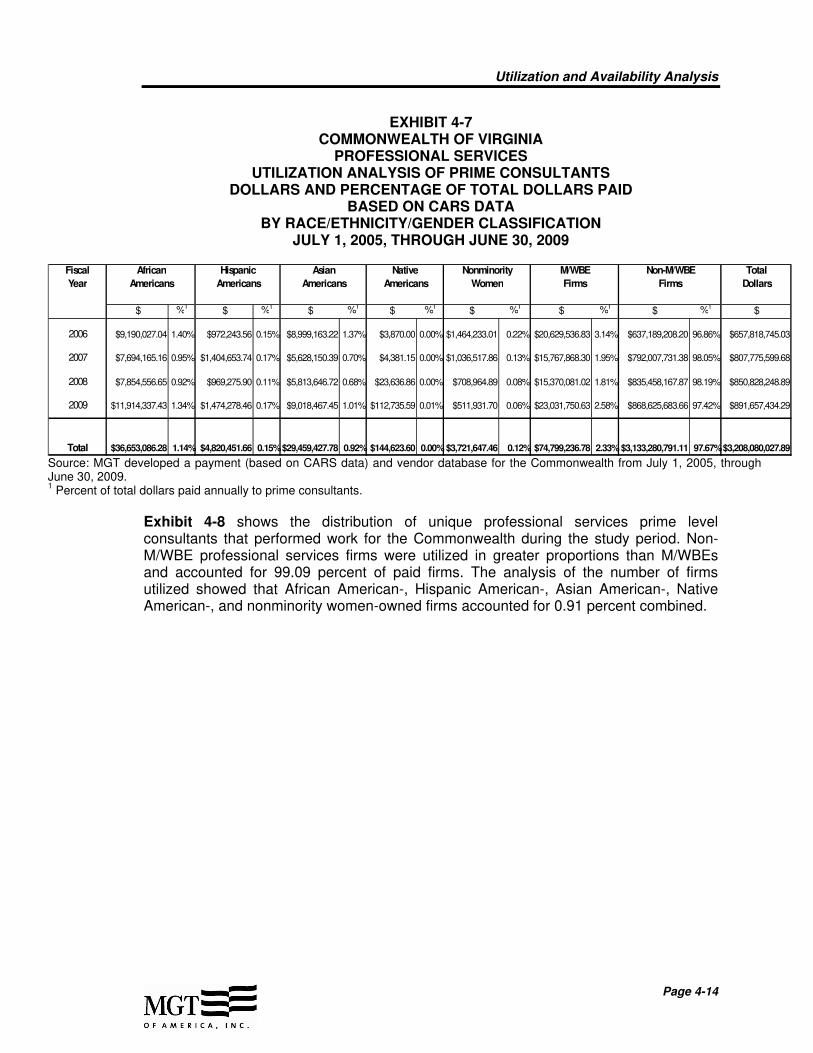
Utilization and Availability Analysis
Page 4-14
EXHIBIT 4-7 COMMONWEALTH OF VIRGINIA
PROFESSIONAL SERVICES UTILIZATION ANALYSIS OF PRIME CONSULTANTS
DOLLARS AND PERCENTAGE OF TOTAL DOLLARS PAID BASED ON CARS DATA
BY RACE/ETHNICITY/GENDER CLASSIFICATION JULY 1, 2005, THROUGH JUNE 30, 2009
Fiscal African Hispanic Asian Native Nonminority M/WBE Non-M/WBE Total
Year Americans Americans Americans Americans Women Firms Firms Dollars
$ %1$ %1
$ %1$ %1
$ %1$ %1
$ %1$
2006 $9,190,027.04 1.40% $972,243.56 0.15% $8,999,163.22 1.37% $3,870.00 0.00% $1,464,233.01 0.22% $20,629,536.83 3.14% $637,189,208.20 96.86% $657,818,745.03
2007 $7,694,165.16 0.95% $1,404,653.74 0.17% $5,628,150.39 0.70% $4,381.15 0.00% $1,036,517.86 0.13% $15,767,868.30 1.95% $792,007,731.38 98.05% $807,775,599.68
2008 $7,854,556.65 0.92% $969,275.90 0.11% $5,813,646.72 0.68% $23,636.86 0.00% $708,964.89 0.08% $15,370,081.02 1.81% $835,458,167.87 98.19% $850,828,248.89
2009 $11,914,337.43 1.34% $1,474,278.46 0.17% $9,018,467.45 1.01% $112,735.59 0.01% $511,931.70 0.06% $23,031,750.63 2.58% $868,625,683.66 97.42% $891,657,434.29
Total $36,653,086.28 1.14% $4,820,451.66 0.15%$29,459,427.78 0.92% $144,623.60 0.00% $3,721,647.46 0.12% $74,799,236.78 2.33% $3,133,280,791.11 97.67%$3,208,080,027.89 Source: MGT developed a payment (based on CARS data) and vendor database for the Commonwealth from July 1, 2005, through June 30, 2009. 1 Percent of total dollars paid annually to prime consultants.
Exhibit 4-8 shows the distribution of unique professional services prime level consultants that performed work for the Commonwealth during the study period. Non-M/WBE professional services firms were utilized in greater proportions than M/WBEs and accounted for 99.09 percent of paid firms. The analysis of the number of firms utilized showed that African American-, Hispanic American-, Asian American-, Native American-, and nonminority women-owned firms accounted for 0.91 percent combined.
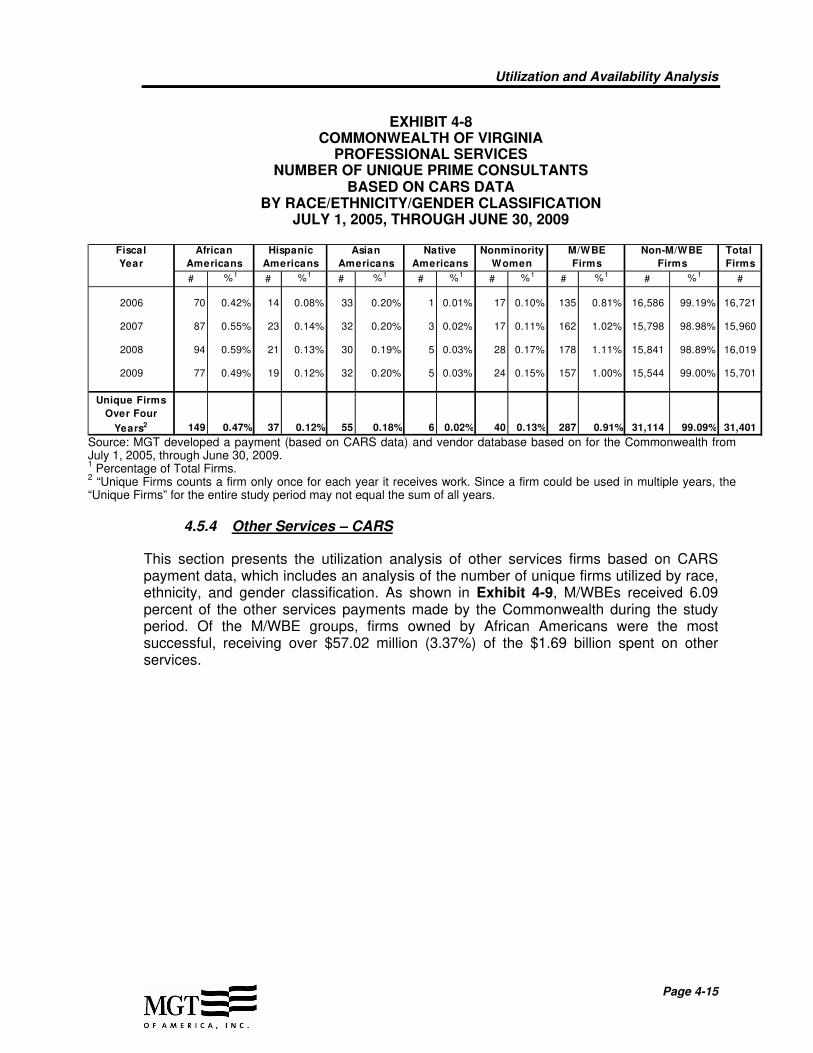
Utilization and Availability Analysis
Page 4-15
EXHIBIT 4-8 COMMONWEALTH OF VIRGINIA
PROFESSIONAL SERVICES NUMBER OF UNIQUE PRIME CONSULTANTS
BASED ON CARS DATA BY RACE/ETHNICITY/GENDER CLASSIFICATION
JULY 1, 2005, THROUGH JUNE 30, 2009
Fiscal African Hispanic Asian Native Nonminority M/WBE Non-M/WBE Total
Year Americans Americans Americans Americans Women Firms Firms Firms
# %1# %1
# %1# %1
# %1# %1
# %1#
2006 70 0.42% 14 0.08% 33 0.20% 1 0.01% 17 0.10% 135 0.81% 16,586 99.19% 16,721
2007 87 0.55% 23 0.14% 32 0.20% 3 0.02% 17 0.11% 162 1.02% 15,798 98.98% 15,960
2008 94 0.59% 21 0.13% 30 0.19% 5 0.03% 28 0.17% 178 1.11% 15,841 98.89% 16,019
2009 77 0.49% 19 0.12% 32 0.20% 5 0.03% 24 0.15% 157 1.00% 15,544 99.00% 15,701
149 0.47% 37 0.12% 55 0.18% 6 0.02% 40 0.13% 287 0.91% 31,114 99.09% 31,401
Unique Firms
Over Four
Years2
Source: MGT developed a payment (based on CARS data) and vendor database based on for the Commonwealth from July 1, 2005, through June 30, 2009. 1 Percentage of Total Firms.
2 “Unique Firms counts a firm only once for each year it receives work. Since a firm could be used in multiple years, the
“Unique Firms” for the entire study period may not equal the sum of all years.
4.5.4 Other Services – CARS
This section presents the utilization analysis of other services firms based on CARS payment data, which includes an analysis of the number of unique firms utilized by race, ethnicity, and gender classification. As shown in Exhibit 4-9, M/WBEs received 6.09 percent of the other services payments made by the Commonwealth during the study period. Of the M/WBE groups, firms owned by African Americans were the most successful, receiving over $57.02 million (3.37%) of the $1.69 billion spent on other services.

Utilization and Availability Analysis
Page 4-16
EXHIBIT 4-9 COMMONWEALTH OF VIRGINIA
OTHER SERVICES UTILIZATION ANALYSIS OF FIRMS
DOLLARS AND PERCENTAGE OF TOTAL DOLLARS PAID BASED ON CARS DATA
BY RACE/ETHNICITY/GENDER CLASSIFICATION JULY 1, 2005, THROUGH JUNE 30, 2009
Fiscal African Hispanic Asian Native Nonminority M/WBE Non-M/WBE Total
Year Americans Americans Americans Americans Women Firms Firms Dollars
$ %1$ %1
$ %1$ %1
$ %1$ %1
$ %1$
2006 $12,364,132.09 3.09% $3,408,225.27 0.85% $1,249,455.18 0.31% $3,836,745.30 0.96% $2,278,707.56 0.57% $23,137,265.40 5.78% $377,444,724.47 94.22% $400,581,989.87
2007 $13,828,148.54 3.18% $4,701,119.74 1.08% $1,111,423.75 0.26% $1,973,461.34 0.45% $2,532,863.58 0.58% $24,147,016.95 5.56% $410,201,679.97 94.44% $434,348,696.92
2008 $15,097,481.42 3.46% $5,024,168.49 1.15% $2,406,515.20 0.55% $1,679,543.75 0.38% $2,784,413.86 0.64% $26,992,122.72 6.18% $409,626,472.21 93.82% $436,618,594.93
2009 $15,739,551.08 3.75% $4,779,418.06 1.14% $1,397,160.97 0.33% $1,702,242.56 0.41% $5,052,532.89 1.20% $28,670,905.56 6.83% $390,993,265.37 93.17% $419,664,170.93
Total $57,029,313.13 3.37% $17,912,931.56 1.06% $6,164,555.10 0.36% $9,191,992.95 0.54%$12,648,517.89 0.75%$102,947,310.63 6.09% $1,588,266,142.02 93.91% $1,691,213,452.65 Source: MGT developed a payment (based on CARS data) and vendor database based on for the Commonwealth from July 1, 2005, through June 30, 2009. 1 Percent of total dollars paid annually to firms.
Exhibit 4-10 shows that there were 858 unique M/WBE firms utilized that provided other services to the Commonwealth. There were a total of 54,022 unique firms that provided other services to the Commonwealth.

Utilization and Availability Analysis
Page 4-17
EXHIBIT 4-10 COMMONWEALTH OF VIRGINIA
OTHER SERVICES NUMBER OF UNIQUE FIRMS
BASED ON CARS DATA BY RACE/ETHNICITY/GENDER CLASSIFICATION
JULY 1, 2005, THROUGH JUNE 30, 2009
Fiscal African Hispanic Asian Native Nonminority M/WBE Non-M/WBE Total
Year Americans Americans Americans Americans Women Firms Firms Firms
# %1# %1
# %1# %1
# %1# %1
# %1#
2006 192 0.87% 45 0.20% 47 0.21% 23 0.10% 67 0.30% 374 1.69% 21,742 98.31% 22,116
2007 222 1.06% 48 0.23% 50 0.24% 18 0.09% 63 0.30% 401 1.91% 20,608 98.09% 21,009
2008 230 1.34% 52 0.30% 57 0.33% 18 0.10% 64 0.37% 421 2.45% 16,787 97.55% 17,208
2009 239 1.53% 50 0.32% 60 0.38% 16 0.10% 62 0.40% 427 2.73% 15,221 97.27% 15,648
473 0.88% 99 0.18% 120 0.22% 37 0.07% 129 0.24% 858 1.59% 53,164 98.41% 54,022
Unique Firms
Over Four
Years2
Source: MGT developed a payment (based on CARS data) and vendor database based on for the Commonwealth from July 1, 2005, through June 30, 2009. 1 Percentage of total firms.
2 “Unique Firms counts a firm only once for each year it receives work. Since a firm could be used in multiple years, the
“Unique Firms” for the entire study period may not equal the sum of all years.
4.5.5 Goods and Supplies
This section presents the utilization analysis of goods and supplies services firms based on CARS payments data, which includes an analysis of the number of unique firms utilized by race, ethnicity, and gender classification. The utilization analysis of payments made is presented in Exhibit 4-11. As shown, M/WBEs received 2.96 percent of the goods and supplies payments made by the Commonwealth during the study period.
Of the M/WBE groups, firms owned by Asian Americans were the most successful, receiving over $53 million (2.14%) of the $2.52 billion spent on goods and supplies.

Utilization and Availability Analysis
Page 4-18
EXHIBIT 4-11 COMMONWEALTH OF VIRGINIA
GOODS AND SUPPLIES UTILIZATION ANALYSIS OF FIRMS
DOLLARS AND PERCENTAGE OF TOTAL DOLLARS PAID BASED ON CARS DATA
BY RACE/ETHNICITY/GENDER CLASSIFICATION JULY 1, 2005, THROUGH JUNE 30, 2009
Fiscal African Hispanic Asian Native Nonminority M/WBE Non-M/WBE Total
Year Americans Americans Americans Americans Women Firms Firms Dollars
$ %1$ %1
$ %1$ %1
$ %1$ %1
$ %1$
2006 $2,194,029.09 0.35% $837,978.15 0.13% $14,868,931.50 2.38% $35,479.11 0.01% $1,473,192.70 0.24% $19,409,610.55 3.11% $604,543,421.45 96.89% $623,953,032.00
2007 $2,738,316.74 0.44% $420,191.08 0.07% $14,356,533.20 2.31% $56,196.55 0.01% $1,762,967.03 0.28% $19,334,204.60 3.11% $602,477,922.63 96.89% $621,812,127.23
2008 $2,387,240.21 0.38% $576,350.00 0.09% $12,527,083.16 1.98% $94,514.21 0.01% $1,355,783.96 0.21% $16,940,971.54 2.67% $617,254,026.38 97.33% $634,194,997.92
2009 $2,996,501.84 0.47% $2,205,230.17 0.34% $12,114,514.11 1.89% $68,260.84 0.01% $1,472,786.91 0.23% $18,857,293.87 2.94% $622,883,364.88 97.06% $641,740,658.75
Total $10,316,087.88 0.41% $4,039,749.40 0.16%$53,867,061.97 2.14% $254,450.71 0.01% $6,064,730.60 0.24% $74,542,080.56 2.96%$2,447,158,735.34 97.04%$2,521,700,815.90 Source: MGT developed a payment (based on CARS data) and vendor database based on for the Commonwealth from July 1, 2005, through June 30, 2009. 1 Percent of total dollars paid annually to firms.
Exhibit 4-12 shows that there were 494 unique M/WBE firms utilized that provided goods and supplies to the Commonwealth. There were a total of 27,267 unique firms that provided goods and supplies to the Commonwealth.

Utilization and Availability Analysis
Page 4-19
EXHIBIT 4-12 COMMONWEALTH OF VIRGINIA
GOODS AND SUPPLIES NUMBER OF UNIQUE FIRMS
BASED ON CARS DATA BY RACE/ETHNICITY/GENDER CLASSIFICATION
JULY 1, 2005, THROUGH JUNE 30, 2009
Fiscal African Hispanic Asian Native Nonminority M/WBE Non-M/WBE Total
Year Americans Americans Americans Americans Women Firms Firms Firms
# %1# %1
# %1# %1
# %1# %1
# %1#
2006 81 0.55% 20 0.14% 49 0.34% 11 0.08% 57 0.39% 218 1.49% 14382 98.51% 14,600
2007 103 1.04% 17 0.17% 52 0.53% 8 0.08% 58 0.59% 238 2.41% 9635 97.59% 9,873
2008 85 0.85% 27 0.27% 43 0.43% 10 0.10% 54 0.54% 219 2.19% 9777 97.81% 9,996
2009 89 1.07% 24 0.29% 52 0.62% 9 0.11% 56 0.67% 230 2.76% 8105 97.24% 8,335
214 0.78% 48 0.18% 93 0.34% 21 0.08% 118 0.43% 494 1.81% 26773 98.19% 27,267
Unique Firms
Over Four
Years2
Source: MGT developed a payment (based on CARS data) and vendor database based on for the Commonwealth from July 1, 2005, through June 30, 2009. 1 Percentage of total firms.
2 “Unique Firms counts a firm only once for each year it receives work. Since a firm could be used in multiple years, the “Unique
Firms” for the entire study period may not equal the sum of all years.
4.6 Subcontractor Utilization (Construction) Analysis – Small, Women-, and Minority-owned Business Program’s (SWaM) Dashboard, Analytics, and Reporting System
The data presented in this section contains only construction subcontract data for firms located in the Commonwealth. The data was obtained from the Commonwealth’s Small, Women-, and Minority-owned Business Program’s (SWaM) Dashboard, Analytics, and Reporting System (Dashboard). This information was analyzed according to those construction subcontracts let to subcontractors by the Commonwealth that were properly recorded into the Dashboard database within the study period. However, there were data gaps for the 2007 and 2008 study periods resulting in low utilization dollar amounts. Furthermore, the exhibits reflect an increase in the utilization dollar amounts in the 2009 study period. This rise is due to increased record keeping efforts by the Commonwealth and self-reporting agencies. There were extremely limited, if any, electronic subcontractor data available for the 2006 fiscal year. While subcontractor data was still incomplete in the 2007 fiscal year, the analysis was conducted on fiscal years 2007, 2008, and 2009. By including the 2007 fiscal year, the subcontractor utilization analysis also shows the trend in the increased record keeping efforts of the entities. Thus, as the record keeping and reporting of subcontracting activity increased as the study period continued.

Utilization and Availability Analysis
Page 4-20
Dollar Utilization
During the study period, over $162.1 million in construction subcontracts was let on Commonwealth projects (Exhibit 4-13). M/WBE subcontractors were paid about $23.2 million, or over 14.3 percent of construction subcontract dollars reported.
When M/WBE subcontractors are stratified to the various ethnicity, race, and gender classification, nonminority women-owned construction subcontractors were the most successful with almost $8.6 million. Hispanic American-owned subcontractors were nearly as successful, with close to $8.5 million. As for non-MWBE subcontractors, more than $138.9 million was received in construction subcontract dollars, resulting in 85.7 percent of the overall construction subcontracting dollars.
EXHIBIT 4-13 COMMONWEALTH OF VIRGINIA
UTILIZATION OF CONSTRUCTION SUBCONTRACTORS SUBCONTRACT DOLLARS AND PERCENT OF TOTAL DOLLARS
IN THE COMMONWEALTH OF VIRGINIA BY ETHNICITY/RACE/GENDER
JULY 1, 2006, THROUGH JUNE 30, 2009
Fiscal African Hispanic Asian Native Nonminority MWBE Non-MWBE Total
Year Americans Americans Americans Americans Women Firms Firms Dollars
$ %1 $ %1 $ %1 $ %1 $ %1 $ %1 $ %1 $
2007 $0.00 0.00% $0.00 0.00% $0.00 0.00% $0.00 0.00% $58,938.00 85.26% $58,938.00 85.26% $10,190.12 14.74% $69,128
2008 $1,747,488.63 3.65% $162,121.00 0.34% $18,989.00 0.04% $133,500.00 0.28% $3,443,210.07 7.20% $5,505,308.70 11.51% $42,320,899.18 88.49% $47,826,208
2009 $2,132,033.00 1.87% $8,294,028.60 7.26% $2,188,985.59 1.92% $0.00 0.00% $5,056,162.77 4.43% $17,671,209.96 15.47% $96,578,196.92 84.53% $114,249,407
Total $3,879,521.63 2.39% $8,456,149.60 5.22% $2,207,974.59 1.36% $133,500.00 0.08% $8,558,310.84 5.28% $23,235,456.66 14.33% $138,909,286.22 85.67% $162,144,743
Source: MGT developed a contracting (based on Dashboard data) and vendor database for the Commonwealth from July 1, 2005, through June 30, 2009. 1
Percent of construction subcontract dollars annually to vendors.
4.6.1 Number of M/WBE Construction Subcontractors Awarded
There were 91 unique M/WBE construction subcontractors awarded a subcontract during the study period, as presented in Exhibit 4-14. Of the 370 total unique construction firms, there were 279 non-MWBE firms awarded construction subcontracts. Nonminority women were the highest awardees, 48, followed by 28 awarded firms owned by African Americans.
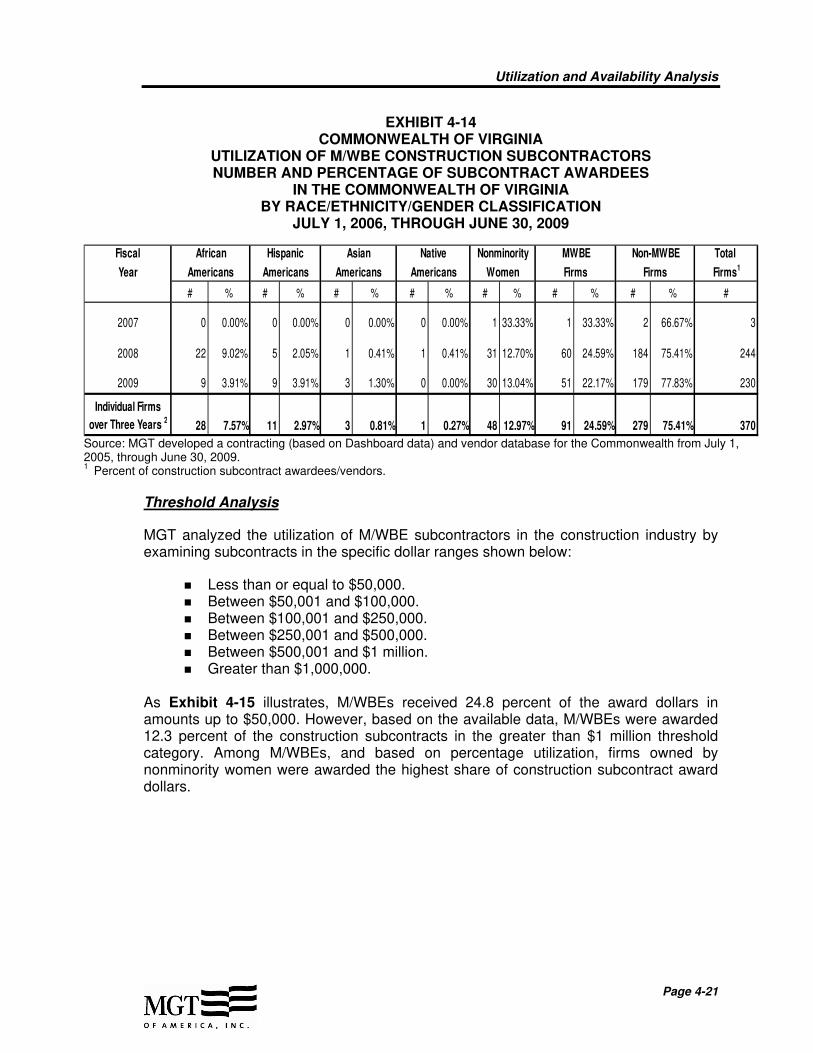
Utilization and Availability Analysis
Page 4-21
EXHIBIT 4-14 COMMONWEALTH OF VIRGINIA
UTILIZATION OF M/WBE CONSTRUCTION SUBCONTRACTORS NUMBER AND PERCENTAGE OF SUBCONTRACT AWARDEES
IN THE COMMONWEALTH OF VIRGINIA BY RACE/ETHNICITY/GENDER CLASSIFICATION
JULY 1, 2006, THROUGH JUNE 30, 2009
Fiscal African Hispanic Asian Native Nonminority MWBE Non-MWBE Total
Year Americans Americans Americans Americans Women Firms Firms Firms1
# % # % # % # % # % # % # % #
2007 0 0.00% 0 0.00% 0 0.00% 0 0.00% 1 33.33% 1 33.33% 2 66.67% 3
2008 22 9.02% 5 2.05% 1 0.41% 1 0.41% 31 12.70% 60 24.59% 184 75.41% 244
2009 9 3.91% 9 3.91% 3 1.30% 0 0.00% 30 13.04% 51 22.17% 179 77.83% 230
Individual Firms
over Three Years 2 28 7.57% 11 2.97% 3 0.81% 1 0.27% 48 12.97% 91 24.59% 279 75.41% 370
Source: MGT developed a contracting (based on Dashboard data) and vendor database for the Commonwealth from July 1, 2005, through June 30, 2009. 1
Percent of construction subcontract awardees/vendors.
Threshold Analysis
MGT analyzed the utilization of M/WBE subcontractors in the construction industry by examining subcontracts in the specific dollar ranges shown below:
Less than or equal to $50,000. Between $50,001 and $100,000. Between $100,001 and $250,000. Between $250,001 and $500,000. Between $500,001 and $1 million. Greater than $1,000,000.
As Exhibit 4-15 illustrates, M/WBEs received 24.8 percent of the award dollars in amounts up to $50,000. However, based on the available data, M/WBEs were awarded 12.3 percent of the construction subcontracts in the greater than $1 million threshold category. Among M/WBEs, and based on percentage utilization, firms owned by nonminority women were awarded the highest share of construction subcontract award dollars.

Utilization and Availability Analysis
Page 4-22
EXHIBIT 4-15 COMMONWEALTH OF VIRGINIA
CONSTRUCTION SUBCONTRACT AWARD AMOUNTS BY THRESHOLD LEVELS IN THE COMMONWEALTH OF VIRGINIA
BY RACE/ETHNICITY/GENDER CLASSIFICATION JULY 1, 2006 THROUGH JUNE 30, 2009
Thresholds Total
Dollars
$ %1$ %1
$ %1$ %1
$ %1$ %1
$ %1$
Up to $50,000 $1,040,574.65 8.88% $235,512.50 2.01% $93,647.09 0.80% $40,500.00 0.35% $1,497,974.27 12.78% $2,908,208.51 24.81% $8,852,651.18 75.53% $11,720,359.69
Between $50,001
and $100,000 $1,001,392.31 8.67% $269,437.50 2.33% $0.00 0.00% $93,000.00 0.80% $1,421,657.70 12.31% $2,785,487.51 24.11% $8,860,756.63 76.69% $11,553,244.14
Between $100,001
and $250,000 $1,293,738.67 4.15% $1,193,542.10 3.83% $213,037.50 0.68% $0.00 0.00% $1,613,846.03 5.18% $4,314,164.30 13.84% $26,861,688.87 86.16% $31,175,853.17
Between $250,001
and $500,000 $543,816.00 1.71% $1,907,246.00 5.99% $435,014.00 1.37% $0.00 0.00% $1,261,470.84 3.96% $4,147,546.84 13.04% $27,668,545.51 86.96% $31,816,092.35
Between $500,001
and $1,000,000 $0.00 0.00% $2,405,054.00 12.61% $1,466,276.00 7.69% $0.00 0.00% $2,763,362.00 14.48% $6,634,692.00 34.78% $12,443,781.56 65.22% $19,078,473.56
Greater than
$1,000,000 $5,040,968.00 8.17% $2,445,357.50 3.96% $0.00 0.00% $0.00 0.00% $0.00 0.00% $7,486,325.50 12.13% $54,221,862.47 87.87% $61,708,187.97
Total $8,920,489.63 5.34% $8,456,149.60 5.06% $2,207,974.59 1.32% $133,500.00 0.08% $8,558,310.84 5.12% $28,276,424.66 16.91% $138,909,286.22 83.09% $167,185,710.88
Non-MWBE
Firms
Native
Americans
Nonminority
Women
MWBE
Firms
African
Americans
Hispanic
Americans
Asian
Americans
Source: MGT developed a contracting (based on Dashboard data) and vendor database for the Commonwealth from
July 1, 2005, through June 30, 2009. 1 Percentage of construction subcontract dollars awarded by threshold.
Contracts $250,000 and Under
The Commonwealth and self-reporting agencies awarded 1,381 subcontracts between fiscal years 2007 and 2009 for construction subcontracts of $250,000 or under. The utilization of M/WBE and non-MWBE firms for each dollar range category is shown in Exhibit 4-16. As Exhibit 4-16 illustrates, M/WBEs received 314 of the subcontracts in this category. Nonminority women-owned firms were the most successful M/WBE group in this dollar range. However, non-M/WBEs were the most successful.
Contracts between $250,001 and $500,000
Ninety subcontracts were awarded for construction services between $250,001 and $500,000 in the three-year study period. M/WBEs received eleven construction subcontracts in this dollar range. Native American-owned firms did not receive an award for construction services in this dollar category. However, Hispanic Americans were the most successful M/WBE group. Non-M/WBE firms won 87.78 percent of these contracts.
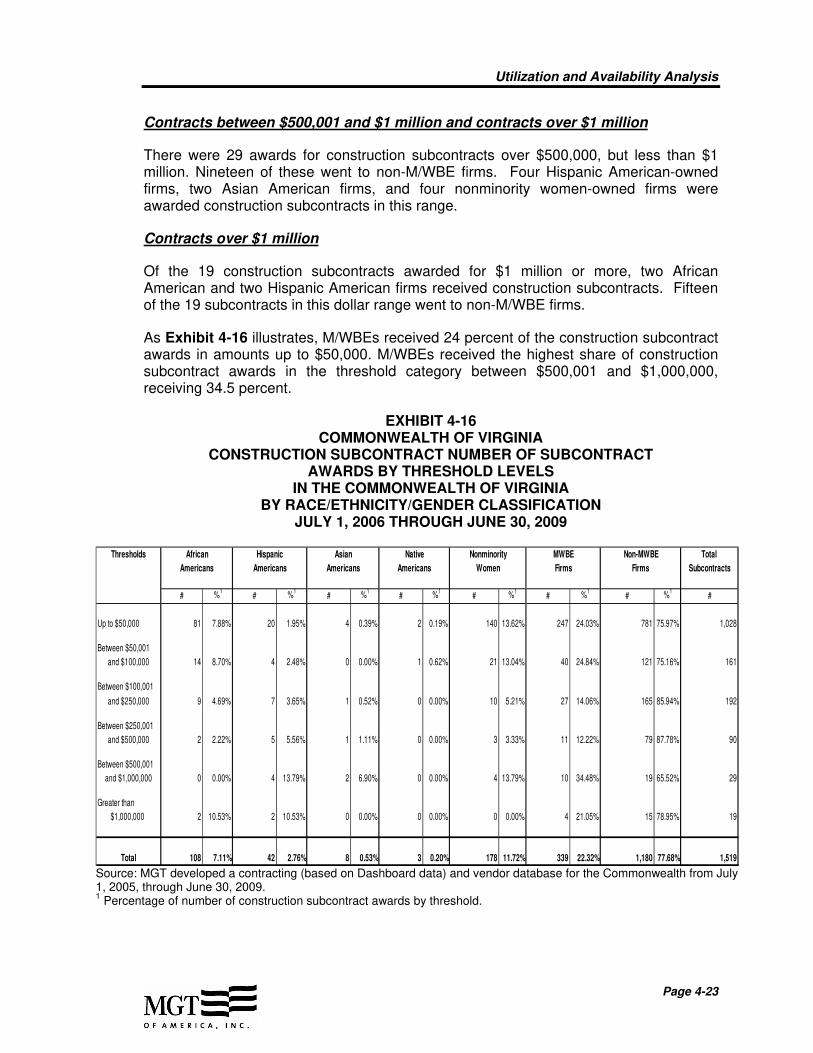
Utilization and Availability Analysis
Page 4-23
Contracts between $500,001 and $1 million and contracts over $1 million
There were 29 awards for construction subcontracts over $500,000, but less than $1 million. Nineteen of these went to non-M/WBE firms. Four Hispanic American-owned firms, two Asian American firms, and four nonminority women-owned firms were awarded construction subcontracts in this range.
Contracts over $1 million
Of the 19 construction subcontracts awarded for $1 million or more, two African American and two Hispanic American firms received construction subcontracts. Fifteen of the 19 subcontracts in this dollar range went to non-M/WBE firms.
As Exhibit 4-16 illustrates, M/WBEs received 24 percent of the construction subcontract awards in amounts up to $50,000. M/WBEs received the highest share of construction subcontract awards in the threshold category between $500,001 and $1,000,000, receiving 34.5 percent.
EXHIBIT 4-16 COMMONWEALTH OF VIRGINIA
CONSTRUCTION SUBCONTRACT NUMBER OF SUBCONTRACT AWARDS BY THRESHOLD LEVELS
IN THE COMMONWEALTH OF VIRGINIA BY RACE/ETHNICITY/GENDER CLASSIFICATION
JULY 1, 2006 THROUGH JUNE 30, 2009
Thresholds African Hispanic Asian Native Nonminority MWBE Non-MWBE Total
Americans Americans Americans Americans Women Firms Firms Subcontracts
# %1# %1
# %1# %1
# %1# %1
# %1#
Up to $50,000 81 7.88% 20 1.95% 4 0.39% 2 0.19% 140 13.62% 247 24.03% 781 75.97% 1,028
Between $50,001
and $100,000 14 8.70% 4 2.48% 0 0.00% 1 0.62% 21 13.04% 40 24.84% 121 75.16% 161
Between $100,001
and $250,000 9 4.69% 7 3.65% 1 0.52% 0 0.00% 10 5.21% 27 14.06% 165 85.94% 192
Between $250,001
and $500,000 2 2.22% 5 5.56% 1 1.11% 0 0.00% 3 3.33% 11 12.22% 79 87.78% 90
Between $500,001
and $1,000,000 0 0.00% 4 13.79% 2 6.90% 0 0.00% 4 13.79% 10 34.48% 19 65.52% 29
Greater than
$1,000,000 2 10.53% 2 10.53% 0 0.00% 0 0.00% 0 0.00% 4 21.05% 15 78.95% 19
Total 108 7.11% 42 2.76% 8 0.53% 3 0.20% 178 11.72% 339 22.32% 1,180 77.68% 1,519
Source: MGT developed a contracting (based on Dashboard data) and vendor database for the Commonwealth from July 1, 2005, through June 30, 2009. 1 Percentage of number of construction subcontract awards by threshold.

Utilization and Availability Analysis
Page 4-24
Construction Subcontract dollar ranges
When all construction subcontract dollar groups are compared, a pattern is revealed. M/WBEs tend to win 17 percent of all construction subcontracts on average. Exhibit 4-17 shows a comparison graph of the dollar ranges for the utilization of M/WBEs and illustrates how M/WBE firms fared as construction subcontract dollars rose. For construction subcontracts valued at $250,001 to $500,000, 12.2 percent of the subcontracts were awarded to M/WBEs. M/WBEs were most successful in the $500,001 to $1 million range, receiving 34.5 percent of the construction subcontracts. Most construction subcontracts greater than $1 million were contracted to non-M/WBE firms, winning approximately 78.95 percent of the subcontracts.
EXHIBIT 4-17 COMMONWEALTH OF VIRGINIA
UTILIZATION OF CONSTRUCTION M/WBE SUBCONTRACTORS BY THRESHOLD LEVELS
IN THE COMMONWEALTH OF VIRGINIA JULY 1, 2006, THROUGH JUNE 30, 2009
0.00%
5.00%
10.00%
15.00%
20.00%
25.00%
30.00%
35.00%
Up to $50,000 Between $50,001 and $100,000
Between $100,001 and $250,000
Between $250,001 and $500,000
Between $500,001 and $1,000,000
More than $1,000,000
M/WBE Percentage 24.03% 24.84% 14.06% 12.22% 34.48% 21.05%
Source: MGT developed a contracting (based on Dashboard data) and vendor database for the Commonwealth from July 1, 2005, through June 30, 2009.

Utilization and Availability Analysis
Page 4-25
4.7 Availability Analysis – Prime and Subcontractor
4.7.1 Census Availability – Prime Contractor Exhibits 4-18(a)-(f) shows U.S. Bureau of Census data based on the 2002 Survey of Business Owners (SBO) for firms with paid employees only for the Commonwealth. As noted previously, SBO census has special tabulations for NAICS code 236 – Construction of Buildings, NAICS code 237 – Heavy Construction and Civil Engineering, and NAICS code 238 – Special Trade Contractors. Appendix H presents the availability of firms for the Commonwealth based on these special tabulations. Furthermore, special tabulations were also conducted for architecture and engineering. The special tabulation was based on the sum of NAICS codes 541310 – Architectural Services, 541320 – Landscape Architectural Services, 541330 – Engineering Services, 541340 – Drafting Services, 541350 – Building Inspection Services, and 541370 – Surveying and Mapping (except Geophysical) Services. These special tabulations were based on architecture and engineering firms with and without paid employees. The availability of architecture and engineering firms with paid employees only is discussed further in this section.
Appendix I also presents the availability of firms with and without paid employees for the Commonwealth, for the business categories of construction, architecture and engineering, professional services, other services, and goods and supplies.
The following exhibits show prime contractor availability for the Commonwealth. As noted previously, these availability estimates were based on SBO census data for firms located in the Commonwealth with paid employees only. There are several observations about the following exhibits:
Exhibit 4-18(a) shows that based on NAICS code 23 – Construction SBO census data for firms with paid employees only, M/WBEs were 15.16 percent of the available construction firms for the Commonwealth.
Exhibit 4-18(b) shows that based on the SBO census special tabulation11 data for firms with paid employees only, M/WBEs were 19.49 percent of the available architecture and engineering firms for the Commonwealth.
Exhibit 4-18(c) shows that based on NAICS code 54 – Professional Services SBO census data for firms with paid employees only, M/WBEs were 34.82 percent of the available professional services firms for the Commonwealth.
Exhibit 4-18(d) shows that based on NAICS code 56– Administrative/Support/ Waste Management and Remediation Services and NAICS code 81 – Other Services SBO census data for firms with paid employees only, M/WBEs were 38.59 percent of the available other services firms for the Commonwealth.
Exhibit 4-18(e) shows that based on NAICS code 42 – Wholesale Trade and NAICS codes 44 and 45 – Retail Trade SBO census data for firms with paid
11
The SBO census special tabulation data for firms specializing in architecture and engineering services is the sum of NAICS codes 541310 – Architectural Services, 541320 – Landscape Architectural Services, 541330 – Engineering Services, 541340 – Drafting Services, 541350 – Building Inspection Services, and 541370 – Surveying and Mapping (except Geophysical) Services.
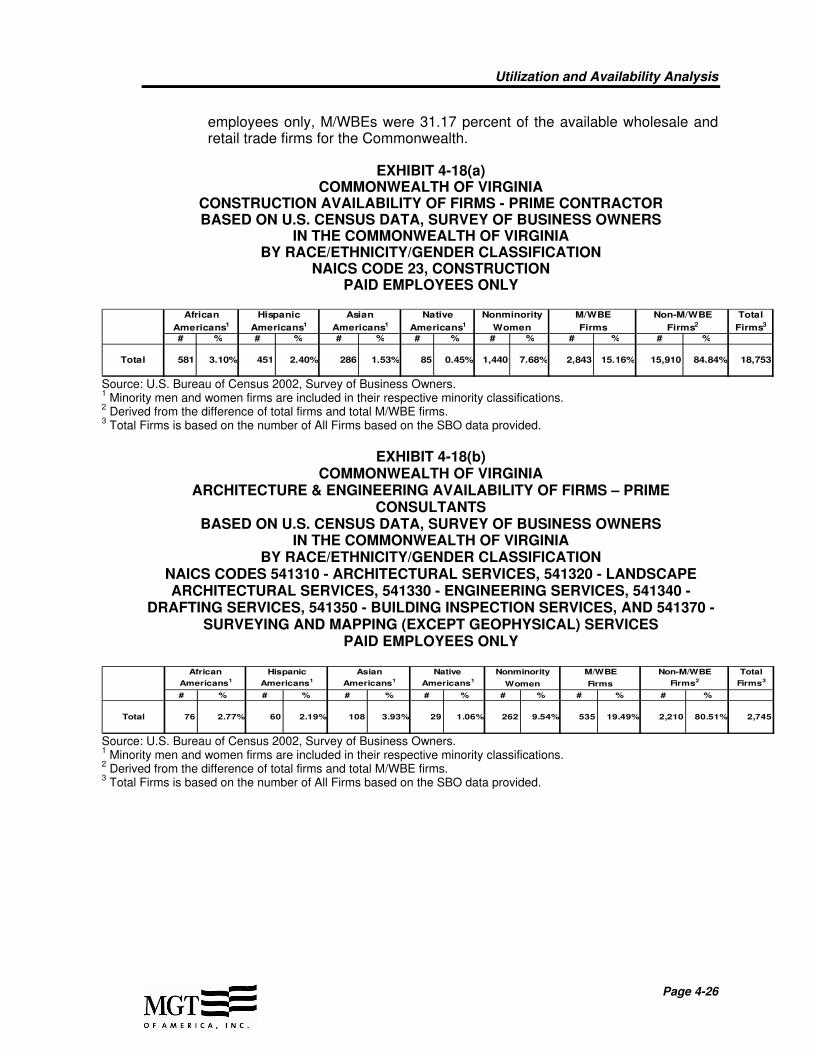
Utilization and Availability Analysis
Page 4-26
employees only, M/WBEs were 31.17 percent of the available wholesale and retail trade firms for the Commonwealth.
EXHIBIT 4-18(a) COMMONWEALTH OF VIRGINIA
CONSTRUCTION AVAILABILITY OF FIRMS - PRIME CONTRACTOR BASED ON U.S. CENSUS DATA, SURVEY OF BUSINESS OWNERS
IN THE COMMONWEALTH OF VIRGINIA BY RACE/ETHNICITY/GENDER CLASSIFICATION
NAICS CODE 23, CONSTRUCTION PAID EMPLOYEES ONLY
African Hispanic Asian Native Nonminority M/WBE Non-M/WBE Total
Americans1 Americans1 Americans1 Americans1 Women Firms Firms2 Firms3
# % # % # % # % # % # % # %
Total 581 3.10% 451 2.40% 286 1.53% 85 0.45% 1,440 7.68% 2,843 15.16% 15,910 84.84% 18,753
Source: U.S. Bureau of Census 2002, Survey of Business Owners. 1 Minority men and women firms are included in their respective minority classifications.
2 Derived from the difference of total firms and total M/WBE firms.
3 Total Firms is based on the number of All Firms based on the SBO data provided.
EXHIBIT 4-18(b) COMMONWEALTH OF VIRGINIA
ARCHITECTURE & ENGINEERING AVAILABILITY OF FIRMS – PRIME CONSULTANTS
BASED ON U.S. CENSUS DATA, SURVEY OF BUSINESS OWNERS IN THE COMMONWEALTH OF VIRGINIA
BY RACE/ETHNICITY/GENDER CLASSIFICATION NAICS CODES 541310 - ARCHITECTURAL SERVICES, 541320 - LANDSCAPE ARCHITECTURAL SERVICES, 541330 - ENGINEERING SERVICES, 541340 -
DRAFTING SERVICES, 541350 - BUILDING INSPECTION SERVICES, AND 541370 - SURVEYING AND MAPPING (EXCEPT GEOPHYSICAL) SERVICES
PAID EMPLOYEES ONLY
African Hispanic Asian Native Nonminority M/WBE Non-M/WBE Total
Americans1 Americans1 Americans1 Americans1Women Firms Firms2 Firms3
# % # % # % # % # % # % # %
Total 76 2.77% 60 2.19% 108 3.93% 29 1.06% 262 9.54% 535 19.49% 2,210 80.51% 2,745
Source: U.S. Bureau of Census 2002, Survey of Business Owners. 1 Minority men and women firms are included in their respective minority classifications.
2 Derived from the difference of total firms and total M/WBE firms.
3 Total Firms is based on the number of All Firms based on the SBO data provided.
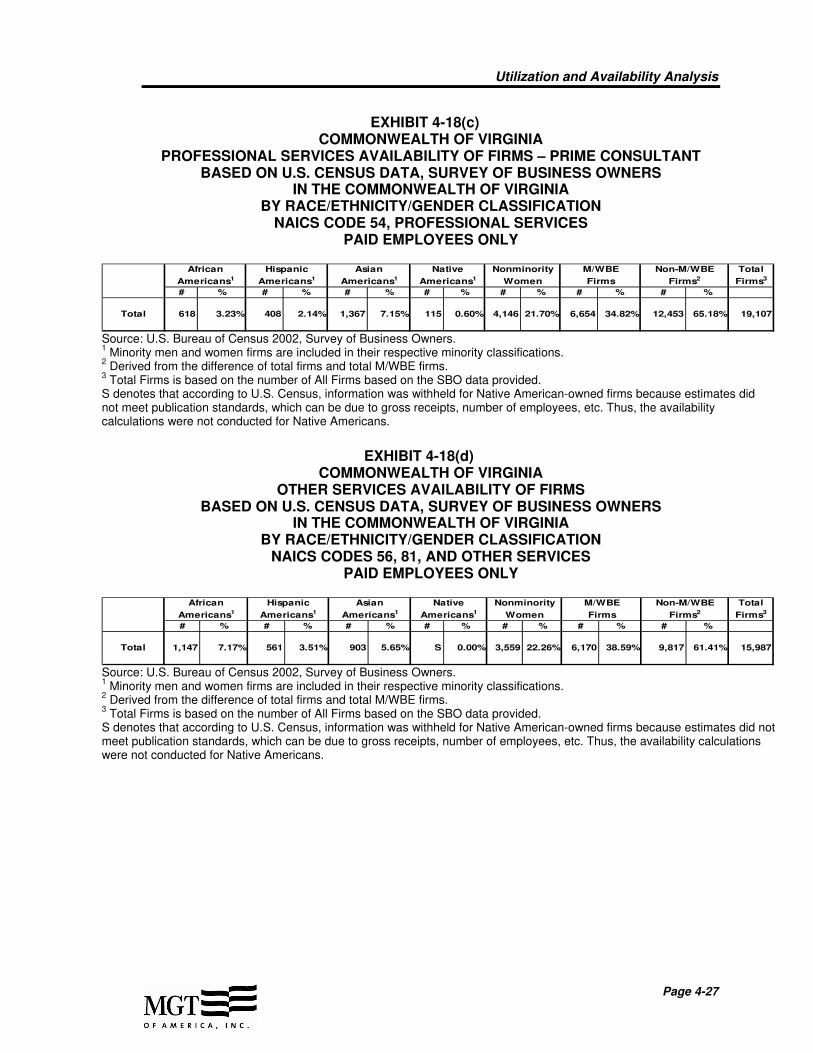
Utilization and Availability Analysis
Page 4-27
EXHIBIT 4-18(c) COMMONWEALTH OF VIRGINIA
PROFESSIONAL SERVICES AVAILABILITY OF FIRMS – PRIME CONSULTANT BASED ON U.S. CENSUS DATA, SURVEY OF BUSINESS OWNERS
IN THE COMMONWEALTH OF VIRGINIA BY RACE/ETHNICITY/GENDER CLASSIFICATION
NAICS CODE 54, PROFESSIONAL SERVICES PAID EMPLOYEES ONLY
African Hispanic Asian Native Nonminority M/WBE Non-M/WBE Total
Americans1 Americans1 Americans1 Americans1 Women Firms Firms2 Firms3
# % # % # % # % # % # % # %
Total 618 3.23% 408 2.14% 1,367 7.15% 115 0.60% 4,146 21.70% 6,654 34.82% 12,453 65.18% 19,107
Source: U.S. Bureau of Census 2002, Survey of Business Owners. 1 Minority men and women firms are included in their respective minority classifications.
2 Derived from the difference of total firms and total M/WBE firms.
3 Total Firms is based on the number of All Firms based on the SBO data provided.
S denotes that according to U.S. Census, information was withheld for Native American-owned firms because estimates did not meet publication standards, which can be due to gross receipts, number of employees, etc. Thus, the availability calculations were not conducted for Native Americans.
EXHIBIT 4-18(d) COMMONWEALTH OF VIRGINIA
OTHER SERVICES AVAILABILITY OF FIRMS BASED ON U.S. CENSUS DATA, SURVEY OF BUSINESS OWNERS
IN THE COMMONWEALTH OF VIRGINIA BY RACE/ETHNICITY/GENDER CLASSIFICATION
NAICS CODES 56, 81, AND OTHER SERVICES PAID EMPLOYEES ONLY
African Hispanic Asian Native Nonminority M/WBE Non-M/WBE Total
Americans1 Americans1 Americans1 Americans1 Women Firms Firms2 Firms3
# % # % # % # % # % # % # %
Total 1,147 7.17% 561 3.51% 903 5.65% S 0.00% 3,559 22.26% 6,170 38.59% 9,817 61.41% 15,987
Source: U.S. Bureau of Census 2002, Survey of Business Owners. 1 Minority men and women firms are included in their respective minority classifications.
2 Derived from the difference of total firms and total M/WBE firms.
3 Total Firms is based on the number of All Firms based on the SBO data provided.
S denotes that according to U.S. Census, information was withheld for Native American-owned firms because estimates did not meet publication standards, which can be due to gross receipts, number of employees, etc. Thus, the availability calculations were not conducted for Native Americans.
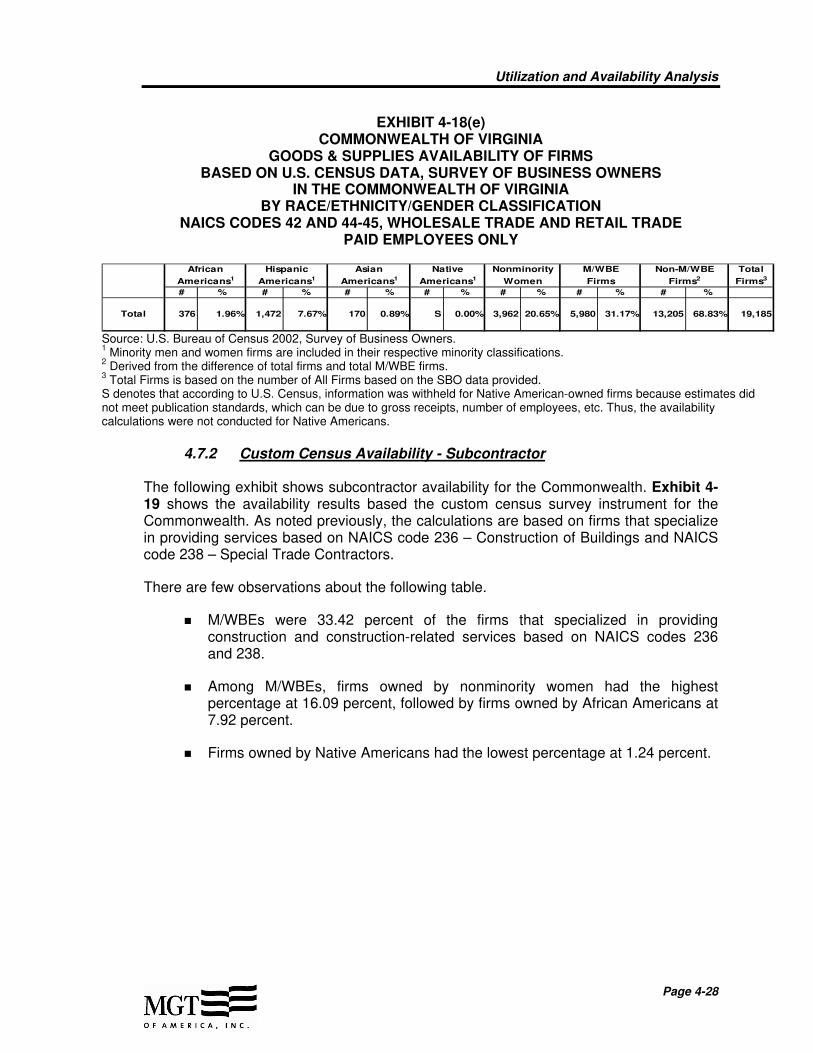
Utilization and Availability Analysis
Page 4-28
EXHIBIT 4-18(e) COMMONWEALTH OF VIRGINIA
GOODS & SUPPLIES AVAILABILITY OF FIRMS BASED ON U.S. CENSUS DATA, SURVEY OF BUSINESS OWNERS
IN THE COMMONWEALTH OF VIRGINIA BY RACE/ETHNICITY/GENDER CLASSIFICATION
NAICS CODES 42 AND 44-45, WHOLESALE TRADE AND RETAIL TRADE PAID EMPLOYEES ONLY
African Hispanic Asian Native Nonminority M/WBE Non-M/WBE Total
Americans1 Americans1 Americans1 Americans1 Women Firms Firms2 Firms3
# % # % # % # % # % # % # %
Total 376 1.96% 1,472 7.67% 170 0.89% S 0.00% 3,962 20.65% 5,980 31.17% 13,205 68.83% 19,185
Source: U.S. Bureau of Census 2002, Survey of Business Owners. 1 Minority men and women firms are included in their respective minority classifications.
2 Derived from the difference of total firms and total M/WBE firms.
3 Total Firms is based on the number of All Firms based on the SBO data provided.
S denotes that according to U.S. Census, information was withheld for Native American-owned firms because estimates did not meet publication standards, which can be due to gross receipts, number of employees, etc. Thus, the availability calculations were not conducted for Native Americans.
4.7.2 Custom Census Availability - Subcontractor The following exhibit shows subcontractor availability for the Commonwealth. Exhibit 4-19 shows the availability results based the custom census survey instrument for the Commonwealth. As noted previously, the calculations are based on firms that specialize in providing services based on NAICS code 236 – Construction of Buildings and NAICS code 238 – Special Trade Contractors.
There are few observations about the following table.
M/WBEs were 33.42 percent of the firms that specialized in providing construction and construction-related services based on NAICS codes 236 and 238.
Among M/WBEs, firms owned by nonminority women had the highest percentage at 16.09 percent, followed by firms owned by African Americans at 7.92 percent.
Firms owned by Native Americans had the lowest percentage at 1.24 percent.

Utilization and Availability Analysis
Page 4-29
EXHIBIT 4-19 COMMONWEALTH OF VIRGINIA
CONSTRUCTION AVAILABILITY OF FIRMS – SUBCONTRACTORS IN THE COMMONWEALTH OF VIRGINIA
BY RACE/ETHNICITY/GENDER CLASSIFICATION BASED ON NAICS CODES 236 AND 238, BUILDING CONSTRUCTION AND
SPECIAL TRADE CONTRACTORS
African Hispanic Asian Native Nonminority M/WBE Non-M/WBE Total
Americans1 Americans1 Americans1 Americans1Women Firms Firms Firms2
# % # % # % # % # % # % # %
Total 32 7.92% 24 5.94% 9 2.23% 5 1.24% 65 16.09% 135 33.42% 269 66.58% 404
Source: MGT developed a database of firms based on Dunn & Bradstreet data and telephone survey respondents in order to conduct a custom census availability analyses for the Commonwealth. 1 Minority men and women firms are included in their respective minority classifications.
2 Derived from the total of M/WBE and non-M/WBE respondents specializing in NAICS codes 236 and 238.

Utilization and Availability Analysis
Page 4-30
4.8 Summary
Exhibit 4-20 summarizes the prime analysis results presented in this chapter.
EXHIBIT 4-20 COMMONWEALTH OF VIRGINIA
SUMMARY OF M/WBE PRIME UTILIZATION AND AVAILABILITY BY PROCUREMENT CATEGORY
JULY 1, 2006, THROUGH JUNE 30, 2009
Business CategoryAfrican
American
Hispanic
American
Asian
American
Native
American
Nonminority
WomenTotal M/WBE
Construction Prime Contractors
Utilization Dollars $8,820,285 $11,520,765 $1,337,691 $752,452 $6,271,315 $28,702,508
Utilization Percent 0.58% 0.75% 0.09% 0.05% 0.41% 1.87%
Availability Percent 3.10% 2.40% 1.53% 0.45% 7.68% 15.16%
Architecture & Engineering Prime
Consultants
Utilization Dollars $786,082 $165,729 $1,242,311 $0 $4,153,886 $6,348,008
Utilization Percent 0.17% 0.04% 0.26% 0.00% 0.88% 1.34%
Availability Percent 2.77% 2.19% 3.93% 1.06% 9.54% 19.49%
Professional Services Prime
Consultants
Utilization Dollars $36,653,086 $4,820,452 $29,459,428 $144,624 $3,721,647 $74,799,237
Utilization Percent 1.14% 0.15% 0.92% 0.00% 0.12% 2.33%
Availability Percent 3.23% 2.14% 7.15% 0.60% 21.70% 34.82%
Other Services Firms
Utilization Dollars $57,029,313 $17,912,932 $6,164,555 $9,191,993 $12,648,518 $102,947,311
Utilization Percent 3.37% 1.06% 0.36% 0.54% 0.75% 6.09%
Availability Percent 7.17% 3.51% 5.65% S 22.26% 38.59%
Goods and Supplies Vendors
Utilization Dollars $10,316,088 $4,039,749 $53,867,062 $254,451 $6,064,731 $74,542,081
Utilization Percent 0.41% 0.16% 2.14% 0.01% 0.24% 2.96%
Availability Percent 1.96% 7.67% 0.89% S 20.65% 31.17%
Source: Chapter 4.0, Analysis Results. S denotes that according to U.S. Census, information was withheld for Native American-owned firms because estimates did not meet publication standards, which can be due to gross receipts, number of employees, etc. Thus, the availability calculations were not conducted for Native Americans.

Utilization and Availability Analysis
Page 4-31
Exhibit 4-21 summarizes the analysis results presented in this chapter for construction subcontracting based on the Commonwealth’s SWaM Program Dashboard data.
EXHIBIT 4-21 COMMONWEALTH OF VIRGINIA
SUMMARY OF M/WBE CONSTRUCTION SUBCONTRACTOR UTILIZATION AND AVAILABILITY
IN THE COMMONWEALTH OF VIRGINIA JULY 1, 2006 THROUGH JUNE 30, 2009
Business CategoryAfrican
American
Hispanic
American
Asian
American
Native
American
Nonminority
WomenTotal M/WBE
Construction Subcontractors
Utilization Dollars $3,879,522 $8,456,150 $2,207,975 $133,500 $8,558,311 $23,235,457
Utilization Percent 2.39% 5.22% 1.36% 0.08% 5.28% 14.33%
Availability Percent 7.92% 5.94% 2.23% 1.24% 16.09% 33.42%
Source: Chapter 4.0, Analysis Results.
5.0 DISPARITY ANALYSIS
Page 5-1
5.0 DISPARITY ANALYSIS
This chapter examines the issue of disparity within vertical construction. Disparity, in this context, is the analysis of the differences between the utilization of minority- and nonminority women-owned business enterprises (M/WBEs) and the availability of those firms. Accordingly, MGT of America, Inc. (MGT), used disparity indices to examine whether M/WBEs received a proportional share of dollars based on the availability of M/WBEs in the relevant market area1.
This chapter consists of the following sections:
Section 5.1 describes the methodology used by MGT to test for the presence or absence of disparity in each of the business categories analyzed.
Section 5.2 applies the disparity indices to business categories and determines the presence or absence of statistically significant disparity in the Commonwealth’s and self-reporting agencies’ procurement activity.
5.1 Methodology
MGT used the availability and utilization information presented in Chapter 4.0 of this report as the basis to determine if M/WBEs received a proportional share of payments and awards by the Commonwealth and self-reporting agencies. This determination is made primarily through the disparity index calculation which compares the availability of firms with the utilization of those firms. The disparity index also provides a value that can be given a commonly accepted substantive interpretation. 5.1.1 Disparity Index
MGT pioneered the use of disparity indices as a means of quantifying the disparity in utilization relative to availability. The use of a disparity index for such calculations is supported by several post-Croson cases, most notably Contractors Association of Eastern Pennsylvania v. City of Philadelphia.2 Although a variety of similar indices could be utilized, MGT’s standard for choosing its particular index methodology is that it must yield a value that is easily calculable, understandable in its interpretation, and universally comparable such that a disparity in utilization within M/WBE categories can be assessed with reference to the utilization of non-M/WBEs.
1 As stated in Chapter 4.0, the prime utilization analysis is not limited to the geographical location of firms
and was based on all identified M/WBE and non-M/WBE firms. However, the subcontractor utilization analysis was based on those firms that are located in the Commonwealth and provided construction and construction-related services to prime contractors. 2 Contractors Association of Eastern Pennsylvania, Inc. v. City of Philadelphia, 91 F 3d at 603.

Disparity Analysis
Page 5-2
For this study, the ratio of the percentage of utilization3 to the percentage of availability multiplied by 100 serves as the measure of choice, as shown in the formula:
%Um1p1
(1) Disparity Index = X 100
%Am1p1
Where: Um1p1 = utilization of M/WBE1 for procurement1
Am1p1 = availability of M/WBE1 for procurement1
Due to the mathematical properties involved in the calculations, a disparity index value of 0.00 for a given race, ethnicity, or gender classification of firm indicates absolutely no utilization and, therefore, absolute disparity. An index of 100 indicates that vendor utilization is perfectly proportionate to availability for a particular group in a given business category, indicating the absence of disparity—that is, the proportion of utilization relative to availability one would expect, all things being equal. In general, firms within a business category are considered underutilized if the disparity indices are less than 100, and overutilized if the indices are above 100. Since there is no standardized measurement to evaluate the levels of underutilization or overutilization within a procurement context, MGT has appropriated the Equal Employment Opportunity Commission’s (EEOC) “80 percent rule” in Uniform Guidelines on Employee Selection Procedures. In context of employment discrimination, an employment disparity ratio below 80 indicates a “substantial disparity” in employment. The Supreme Court has accepted the use of the 80 percent rule in Connecticut v. Teal (Teal), 457 U.S. 440 (1982), and in Teal and other affirmative action cases, the terms “adverse impact,” “disparate impact,” and “discriminatory impact” are used interchangeably to characterize values of 80 and below.
5.2 Disparity Indices
Tables showing disparity indices results for the business categories are analyzed in this section. As mentioned before, the tables are based on the utilization and availability of M/WBEs and non-M/WBEs as shown in Chapter 4.0. Section 5.2.1 to Section 5.2.5 presents indices results based on the Commonwealth Accounting and Reporting System (CARS). Section 5.2.6 presents indices results based on construction subcontract data obtained from the Commonwealth’s Small, Women-, and Minority-owned businesses (SWaM) Dashboard, Analytics, and Reporting System (Dashboard). The disparity indices by business category for the self-reporting universities are presented in Appendix C.
5.2.1 Construction Prime Contractors
Exhibit 5-1 shows the disparity indices for prime construction based on CARS’s payments data. Over the study period for Commonwealth, non-M/WBE firms were overutilized from fiscal years 2006 to 2009, resulting in overall overutilization with a disparity index of 115.66. Based on construction prime payments, firms owned by
3 Percentage of utilization is based on procurement dollars and the percentage of availability is based on the
number of firms.
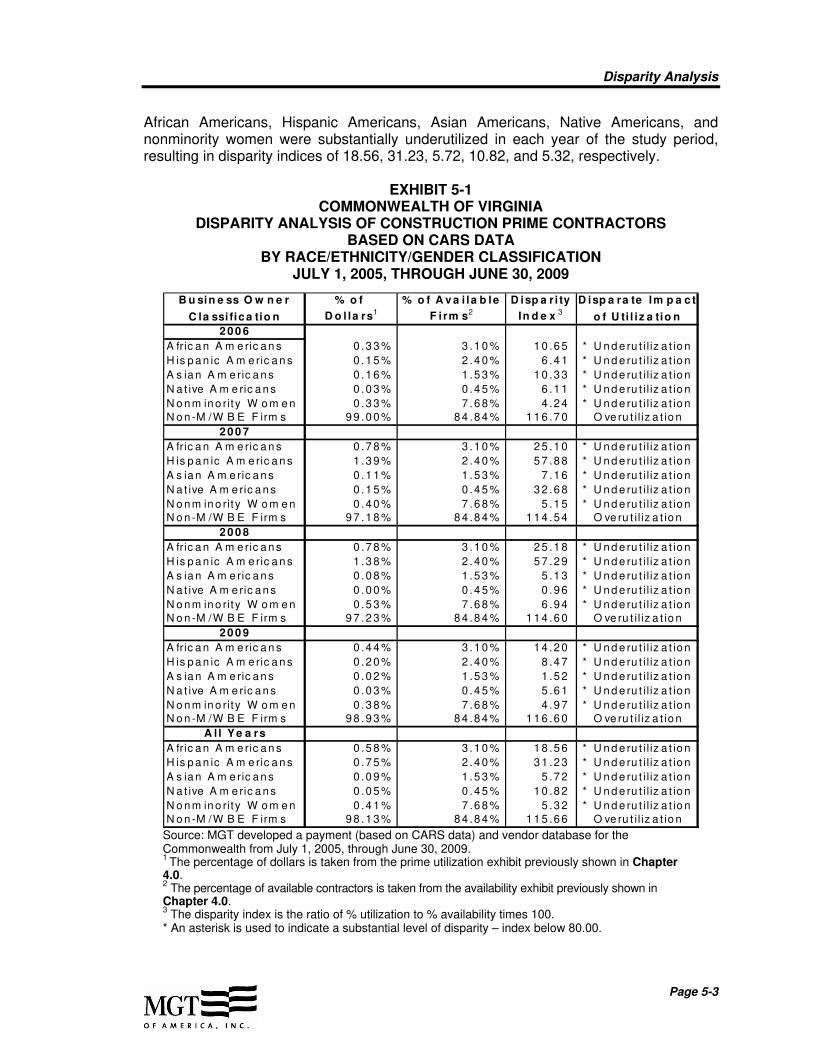
Disparity Analysis
Page 5-3
African Americans, Hispanic Americans, Asian Americans, Native Americans, and nonminority women were substantially underutilized in each year of the study period, resulting in disparity indices of 18.56, 31.23, 5.72, 10.82, and 5.32, respectively.
EXHIBIT 5-1
COMMONWEALTH OF VIRGINIA DISPARITY ANALYSIS OF CONSTRUCTION PRIME CONTRACTORS
BASED ON CARS DATA BY RACE/ETHNICITY/GENDER CLASSIFICATION
JULY 1, 2005, THROUGH JUNE 30, 2009
B u sin e ss O w n e r % o f % o f A v a i la b le D isp a ri ty D isp a ra te Im p a c t
C la ssi fic a tio n D o l la rs1 F i rm s2 In d e x 3o f U ti l i z a tio n
2 0 0 6
A fric a n A m e ric a n s 0 .3 3 % 3 .1 0 % 1 0 .6 5 * U n d e ru t il iz a t io n
H is p a n ic A m e ric a n s 0 .1 5 % 2 .4 0 % 6 .4 1 * U n d e ru t il iz a t io n
A s ia n A m e ric a n s 0 .1 6 % 1 .5 3 % 1 0 .3 3 * U n d e ru t il iz a t io n
N a t ive A m e ric a n s 0 .0 3 % 0 .4 5 % 6 .1 1 * U n d e ru t il iz a t io n
N o n m in o rit y W o m e n 0 .3 3 % 7 .6 8 % 4 .2 4 * U n d e ru t il iz a t io n
N o n -M /W B E F irm s 9 9 .0 0 % 8 4 .8 4 % 1 1 6 .7 0 O ve ru t il iz a t io n
2 0 0 7
A fric a n A m e ric a n s 0 .7 8 % 3 .1 0 % 2 5 .1 0 * U n d e ru t il iz a t io n
H is p a n ic A m e ric a n s 1 .3 9 % 2 .4 0 % 5 7 .8 8 * U n d e ru t il iz a t io n
A s ia n A m e ric a n s 0 .1 1 % 1 .5 3 % 7 .1 6 * U n d e ru t il iz a t io n
N a t ive A m e ric a n s 0 .1 5 % 0 .4 5 % 3 2 .6 8 * U n d e ru t il iz a t io n
N o n m in o rit y W o m e n 0 .4 0 % 7 .6 8 % 5 .1 5 * U n d e ru t il iz a t io nN o n -M /W B E F irm s 9 7 .1 8 % 8 4 .8 4 % 1 1 4 .5 4 O ve ru t il iz a t io n
2 0 0 8
A fric a n A m e ric a n s 0 .7 8 % 3 .1 0 % 2 5 .1 8 * U n d e ru t il iz a t io n
H is p a n ic A m e ric a n s 1 .3 8 % 2 .4 0 % 5 7 .2 9 * U n d e ru t il iz a t io n
A s ia n A m e ric a n s 0 .0 8 % 1 .5 3 % 5 .1 3 * U n d e ru t il iz a t io n
N a t ive A m e ric a n s 0 .0 0 % 0 .4 5 % 0 .9 6 * U n d e ru t il iz a t io n
N o n m in o rit y W o m e n 0 .5 3 % 7 .6 8 % 6 .9 4 * U n d e ru t il iz a t io n
N o n -M /W B E F irm s 9 7 .2 3 % 8 4 .8 4 % 1 1 4 .6 0 O ve ru t il iz a t io n
2 0 0 9
A fric a n A m e ric a n s 0 .4 4 % 3 .1 0 % 1 4 .2 0 * U n d e ru t il iz a t io n
H is p a n ic A m e ric a n s 0 .2 0 % 2 .4 0 % 8 .4 7 * U n d e ru t il iz a t io n
A s ia n A m e ric a n s 0 .0 2 % 1 .5 3 % 1 .5 2 * U n d e ru t il iz a t io n
N a t ive A m e ric a n s 0 .0 3 % 0 .4 5 % 5 .6 1 * U n d e ru t il iz a t io n
N o n m in o rit y W o m e n 0 .3 8 % 7 .6 8 % 4 .9 7 * U n d e ru t il iz a t io nN o n -M /W B E F irm s 9 8 .9 3 % 8 4 .8 4 % 1 1 6 .6 0 O ve ru t il iz a t io n
A l l Y e a rs
A fric a n A m e ric a n s 0 .5 8 % 3 .1 0 % 1 8 .5 6 * U n d e ru t il iz a t io n
H is p a n ic A m e ric a n s 0 .7 5 % 2 .4 0 % 3 1 .2 3 * U n d e ru t il iz a t io n
A s ia n A m e ric a n s 0 .0 9 % 1 .5 3 % 5 .7 2 * U n d e ru t il iz a t io n
N a t ive A m e ric a n s 0 .0 5 % 0 .4 5 % 1 0 .8 2 * U n d e ru t il iz a t io n
N o n m in o rit y W o m e n 0 .4 1 % 7 .6 8 % 5 .3 2 * U n d e ru t il iz a t io n
N o n -M /W B E F irm s 9 8 .1 3 % 8 4 .8 4 % 1 1 5 .6 6 O ve ru t il iz a t io n Source: MGT developed a payment (based on CARS data) and vendor database for the Commonwealth from July 1, 2005, through June 30, 2009. 1 The percentage of dollars is taken from the prime utilization exhibit previously shown in Chapter
4.0. 2 The percentage of available contractors is taken from the availability exhibit previously shown in
Chapter 4.0. 3 The disparity index is the ratio of % utilization to % availability times 100.
* An asterisk is used to indicate a substantial level of disparity – index below 80.00.
Disparity Analysis
Page 5-4
5.2.2 Architecture and Engineering Prime Consultants
In Exhibit 5-3, the analysis shows that based on architecture and engineering prime payments, firms owned by African Americans, Hispanic Americans, Asian Americans, Native Americans, and nonminority women were substantially underutilized in each year of the study period, resulting in disparity indices of 6.00, 1.60, 6.67, 0.00, and 9.20, respectively.
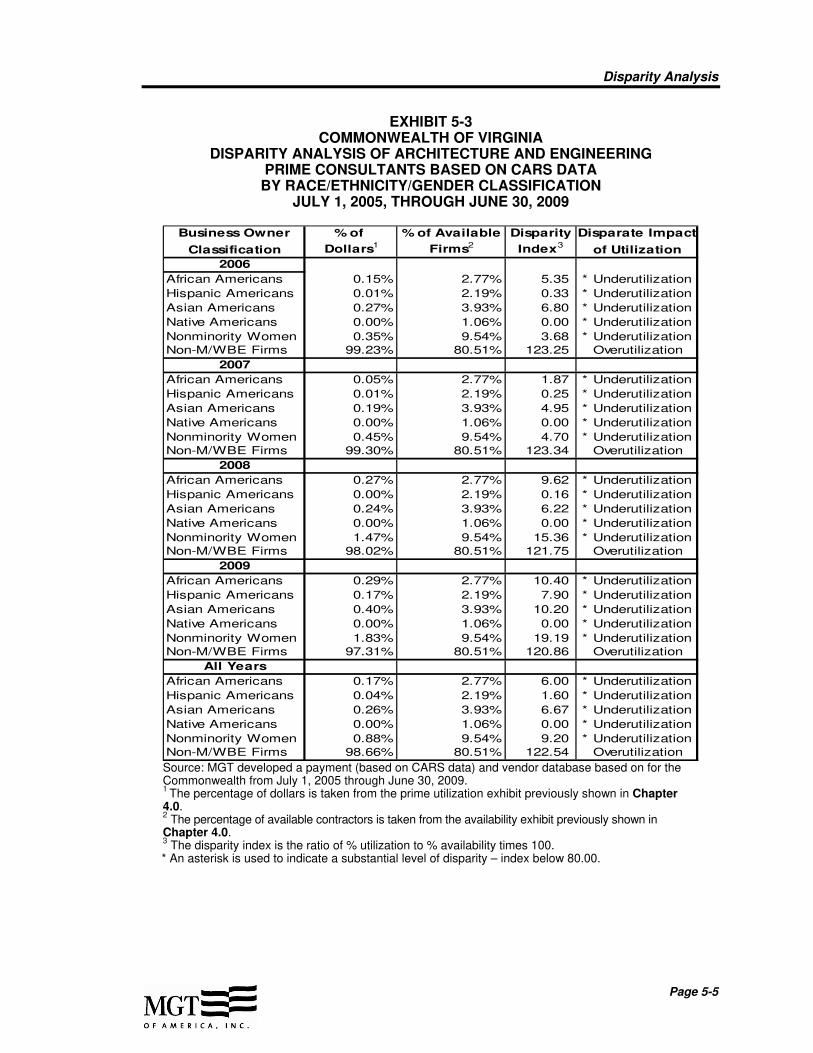
Disparity Analysis
Page 5-5
EXHIBIT 5-3 COMMONWEALTH OF VIRGINIA
DISPARITY ANALYSIS OF ARCHITECTURE AND ENGINEERING PRIME CONSULTANTS BASED ON CARS DATA
BY RACE/ETHNICITY/GENDER CLASSIFICATION JULY 1, 2005, THROUGH JUNE 30, 2009
Business Owner % of % of Available Disparity Disparate Impact
Classification Dollars1 Firms2 Index3of Utilization
2006
African Americans 0.15% 2.77% 5.35 * Underutilization
Hispanic Americans 0.01% 2.19% 0.33 * Underutilization
Asian Americans 0.27% 3.93% 6.80 * Underutilization
Native Americans 0.00% 1.06% 0.00 * Underutilization
Nonminority Women 0.35% 9.54% 3.68 * UnderutilizationNon-M/WBE Firms 99.23% 80.51% 123.25 Overutilization
2007
African Americans 0.05% 2.77% 1.87 * Underutilization
Hispanic Americans 0.01% 2.19% 0.25 * Underutilization
Asian Americans 0.19% 3.93% 4.95 * Underutilization
Native Americans 0.00% 1.06% 0.00 * Underutilization
Nonminority Women 0.45% 9.54% 4.70 * Underutilization
Non-M/WBE Firms 99.30% 80.51% 123.34 Overutilization
2008
African Americans 0.27% 2.77% 9.62 * Underutilization
Hispanic Americans 0.00% 2.19% 0.16 * Underutilization
Asian Americans 0.24% 3.93% 6.22 * Underutilization
Native Americans 0.00% 1.06% 0.00 * Underutilization
Nonminority Women 1.47% 9.54% 15.36 * UnderutilizationNon-M/WBE Firms 98.02% 80.51% 121.75 Overutilization
2009
African Americans 0.29% 2.77% 10.40 * Underutilization
Hispanic Americans 0.17% 2.19% 7.90 * Underutilization
Asian Americans 0.40% 3.93% 10.20 * Underutilization
Native Americans 0.00% 1.06% 0.00 * Underutilization
Nonminority Women 1.83% 9.54% 19.19 * UnderutilizationNon-M/WBE Firms 97.31% 80.51% 120.86 Overutilization
All Years
African Americans 0.17% 2.77% 6.00 * Underutilization
Hispanic Americans 0.04% 2.19% 1.60 * Underutilization
Asian Americans 0.26% 3.93% 6.67 * Underutilization
Native Americans 0.00% 1.06% 0.00 * Underutilization
Nonminority Women 0.88% 9.54% 9.20 * Underutilization
Non-M/WBE Firms 98.66% 80.51% 122.54 Overutilization
Source: MGT developed a payment (based on CARS data) and vendor database based on for the Commonwealth from July 1, 2005 through June 30, 2009. 1 The percentage of dollars is taken from the prime utilization exhibit previously shown in Chapter
4.0. 2 The percentage of available contractors is taken from the availability exhibit previously shown in
Chapter 4.0. 3 The disparity index is the ratio of % utilization to % availability times 100.
* An asterisk is used to indicate a substantial level of disparity – index below 80.00.

Disparity Analysis
Page 5-6
5.2.3 Professional Services Prime Contractors
In Exhibit 5-4, the analysis shows that based on professional services prime payments, firms owned by African Americans, Hispanic Americans, Asian Americans, Native Americans, and nonminority women were substantially underutilized in each year of the study period, resulting in disparity indices of 35.32, 7.04, 12.84, 0.75, and 0.53, respectively.

Disparity Analysis
Page 5-7
EXHIBIT 5-4 COMMONWEALTH OF VIRGINIA
DISPARITY ANALYSIS OF PROFESSIONAL SERVICES PRIME CONSULTANTS BASED ON CARS DATA
BY RACE/ETHNICITY/GENDER CLASSIFICATION JULY 1, 2005, THROUGH JUNE 30, 2009
B u sin e ss O w n e r % o f % o f A v a i la b le D isp a ri ty D isp a ra te Im p a c t
C la ssi fic a tio n D o l la rs1 F i rm s2 In d e x 3o f U ti l i z a tio n
2 0 0 6
A fric a n A m e ric a n s 1 .4 0 % 3 .2 3 % 4 3 .1 9 * U n d e ru t il iz a t io n
H is p a n ic A m e ric a n s 0 .1 5 % 2 .1 4 % 6 .9 2 * U n d e ru t il iz a t io n
A s ia n A m e ric a n s 1 .3 7 % 7 .1 5 % 1 9 .1 2 * U n d e ru t il iz a t io n
N a t ive A m e ric a n s 0 .0 0 % 0 .6 0 % 0 .1 0 * U n d e ru t il iz a t io n
N o n m in o rit y W o m e n 0 .2 2 % 2 1 .7 0 % 1 .0 3 * U n d e ru t il iz a t io n
N o n -M /W B E F irm s 9 6 .8 6 % 6 5 .1 8 % 1 4 8 .6 2 O ve ru t il iz a t io n
2 0 0 7
A fric a n A m e ric a n s 0 .9 5 % 3 .2 3 % 2 9 .4 5 * U n d e ru t il iz a t io n
H is p a n ic A m e ric a n s 0 .1 7 % 2 .1 4 % 8 .1 4 * U n d e ru t il iz a t io n
A s ia n A m e ric a n s 0 .7 0 % 7 .1 5 % 9 .7 4 * U n d e ru t il iz a t io n
N a t ive A m e ric a n s 0 .0 0 % 0 .6 0 % 0 .0 9 * U n d e ru t il iz a t io n
N o n m in o rit y W o m e n 0 .1 3 % 2 1 .7 0 % 0 .5 9 * U n d e ru t il iz a t io nN o n -M /W B E F irm s 9 8 .0 5 % 6 5 .1 8 % 1 5 0 .4 4 O ve ru t il iz a t io n
2 0 0 8
A fric a n A m e ric a n s 0 .9 2 % 3 .2 3 % 2 8 .5 4 * U n d e ru t il iz a t io n
H is p a n ic A m e ric a n s 0 .1 1 % 2 .1 4 % 5 .3 4 * U n d e ru t il iz a t io n
A s ia n A m e ric a n s 0 .6 8 % 7 .1 5 % 9 .5 5 * U n d e ru t il iz a t io n
N a t ive A m e ric a n s 0 .0 0 % 0 .6 0 % 0 .4 6 * U n d e ru t il iz a t io n
N o n m in o rit y W o m e n 0 .0 8 % 2 1 .7 0 % 0 .3 8 * U n d e ru t il iz a t io n
N o n -M /W B E F irm s 9 8 .1 9 % 6 5 .1 8 % 1 5 0 .6 6 O ve ru t il iz a t io n
2 0 0 9
A fric a n A m e ric a n s 1 .3 4 % 3 .2 3 % 4 1 .3 1 * U n d e ru t il iz a t io n
H is p a n ic A m e ric a n s 0 .1 7 % 2 .1 4 % 7 .7 4 * U n d e ru t il iz a t io n
A s ia n A m e ric a n s 1 .0 1 % 7 .1 5 % 1 4 .1 4 * U n d e ru t il iz a t io n
N a t ive A m e ric a n s 0 .0 1 % 0 .6 0 % 2 .1 0 * U n d e ru t il iz a t io n
N o n m in o rit y W o m e n 0 .0 6 % 2 1 .7 0 % 0 .2 6 * U n d e ru t il iz a t io nN o n -M /W B E F irm s 9 7 .4 2 % 6 5 .1 8 % 1 4 9 .4 7 O ve ru t il iz a t io n
A l l Y e a rs
A fric a n A m e ric a n s 1 .1 4 % 3 .2 3 % 3 5 .3 2 * U n d e ru t il iz a t io n
H is p a n ic A m e ric a n s 0 .1 5 % 2 .1 4 % 7 .0 4 * U n d e ru t il iz a t io n
A s ia n A m e ric a n s 0 .9 2 % 7 .1 5 % 1 2 .8 4 * U n d e ru t il iz a t io n
N a t ive A m e ric a n s 0 .0 0 % 0 .6 0 % 0 .7 5 * U n d e ru t il iz a t io n
N o n m in o rit y W o m e n 0 .1 2 % 2 1 .7 0 % 0 .5 3 * U n d e ru t il iz a t io n
N o n -M /W B E F irm s 9 7 .6 7 % 6 5 .1 8 % 1 4 9 .8 6 O ve ru t il iz a t io n Source: MGT developed a payment (based on CARS data) and vendor database for the Commonwealth from July 1, 2005, through June 30, 2009. 1 The percentage of dollars is taken from the prime utilization exhibit previously shown in Chapter
4.0. 2 The percentage of available contractors is taken from the availability exhibit previously shown in
Chapter 4.0. 3 The disparity index is the ratio of % utilization to % availability times 100.
* An asterisk is used to indicate a substantial level of disparity – index below 80.00.
Disparity Analysis
Page 5-8
5.2.4 Other Services Prime Contractors
In Exhibit 5-5, the analysis shows that based on other services prime payments, firms owned by African Americans, Hispanic American, Asian Americans, and nonminority women were substantially underutilized in each year of the study period, resulting in disparity indices of 47.00, 30.18, 6.45, and 3.36, respectively.

Disparity Analysis
Page 5-9
EXHIBIT 5-5 COMMONWEALTH OF VIRGINIA
DISPARITY ANALYSIS OF OTHER SERVICES PRIME CONTRACTORS BASED ON CARS DATA
BY RACE/ETHNICITY/GENDER CLASSIFICATION JULY 1, 2005, THROUGH JUNE 30, 2009
B u sin e ss O w n e r % o f % o f A v a i la b le D isp a ri ty D isp a ra te Im p a c t
C la ssi fic a tio n D o l la rs1 F i rm s2 In d e x 3o f U ti l i z a tio n
2 0 0 6
A fric a n A m e ric a n s 3 .0 9 % 7 .1 7 % 4 3 .0 2 * U n d e ru t il iz a t io n
H is p a n ic A m e ric a n s 0 .8 5 % 3 .5 1 % 2 4 .2 5 * U n d e ru t il iz a t io n
A s ia n A m e ric a n s 0 .3 1 % 5 .6 5 % 5 .5 2 * U n d e ru t il iz a t io n
N a t ive A m e ric a n s 0 .9 6 % S N /A N /A
N o n m in o rit y W o m e n 0 .5 7 % 2 2 .2 6 % 2 .5 6 * U n d e ru t il iz a t io n
N o n -M /W B E F irm s 9 4 .2 2 % 6 1 .4 1 % 1 5 3 .4 4 O ve ru t il iz a t io n
2 0 0 7
A fric a n A m e ric a n s 3 .1 8 % 7 .1 7 % 4 4 .3 7 * U n d e ru t il iz a t io n
H is p a n ic A m e ric a n s 1 .0 8 % 3 .5 1 % 3 0 .8 4 * U n d e ru t il iz a t io n
A s ia n A m e ric a n s 0 .2 6 % 5 .6 5 % 4 .5 3 * U n d e ru t il iz a t io n
N a t ive A m e ric a n s 0 .4 5 % S N /A N /A
N o n m in o rit y W o m e n 0 .5 8 % 2 2 .2 6 % 2 .6 2 * U n d e ru t il iz a t io nN o n -M /W B E F irm s 9 4 .4 4 % 6 1 .4 1 % 1 5 3 .8 0 O ve ru t il iz a t io n
2 0 0 8
A fric a n A m e ric a n s 3 .4 6 % 7 .1 7 % 4 8 .2 0 * U n d e ru t il iz a t io n
H is p a n ic A m e ric a n s 1 .1 5 % 3 .5 1 % 3 2 .7 9 * U n d e ru t il iz a t io n
A s ia n A m e ric a n s 0 .5 5 % 5 .6 5 % 9 .7 6 * U n d e ru t il iz a t io n
N a t ive A m e ric a n s 0 .3 8 % S N /A N /A
N o n m in o rit y W o m e n 0 .6 4 % 2 2 .2 6 % 2 .8 6 * U n d e ru t il iz a t io n
N o n -M /W B E F irm s 9 3 .8 2 % 6 1 .4 1 % 1 5 2 .7 8 O ve ru t il iz a t io n
2 0 0 9
A fric a n A m e ric a n s 3 .7 5 % 7 .1 7 % 5 2 .2 7 * U n d e ru t il iz a t io n
H is p a n ic A m e ric a n s 1 .1 4 % 3 .5 1 % 3 2 .4 5 * U n d e ru t il iz a t io n
A s ia n A m e ric a n s 0 .3 3 % 5 .6 5 % 5 .8 9 * U n d e ru t il iz a t io n
N a t ive A m e ric a n s 0 .4 1 % S N /A N /A
N o n m in o rit y W o m e n 1 .2 0 % 2 2 .2 6 % 5 .4 1 * U n d e ru t il iz a t io nN o n -M /W B E F irm s 9 3 .1 7 % 6 1 .4 1 % 1 5 1 .7 2 O ve ru t il iz a t io n
A l l Y e a rs
A fric a n A m e ric a n s 3 .3 7 % 7 .1 7 % 4 7 .0 0 * U n d e ru t il iz a t io n
H is p a n ic A m e ric a n s 1 .0 6 % 3 .5 1 % 3 0 .1 8 * U n d e ru t il iz a t io n
A s ia n A m e ric a n s 0 .3 6 % 5 .6 5 % 6 .4 5 * U n d e ru t il iz a t io n
N a t ive A m e ric a n s 0 .5 4 % S N /A N /A
N o n m in o rit y W o m e n 0 .7 5 % 2 2 .2 6 % 3 .3 6 * U n d e ru t il iz a t io n
N o n -M /W B E F irm s 9 3 .9 1 % 6 1 .4 1 % 1 5 2 .9 4 O ve ru t il iz a t io n Source: MGT developed a payment (based on CARS data) and vendor database for the Commonwealth from July 1, 2005, through June 30, 2009. 1 The percentage of dollars is taken from the prime utilization exhibit previously shown in Chapter
4.0. 2 The percentage of available contractors is taken from the availability exhibit previously shown in
Chapter 4.0. 3 The disparity index is the ratio of % utilization to % availability times 100.
* An asterisk is used to indicate a substantial level of disparity – index below 80.00. S denotes that findings were withheld because estimates did not meet U.S. Census publication standards. N/A data not available.

Disparity Analysis
Page 5-10
5.2.5 Goods and Supplies Prime Contractors
In Exhibit 5-6, the analysis shows that based on goods and supplies prime payments, firms owned by African Americans, Hispanic Americans, and nonminority women were substantially underutilized in each year of the study period, resulting in disparity indices of 20.87, 2.09, and 1.16, respectively. Asian American-owned firms were overutilized overall.

Disparity Analysis
Page 5-11
EXHIBIT 5-6 COMMONWEALTH OF VIRGINIA
DISPARITY ANALYSIS OF GOODS AND SUPPLIES PRIME CONTRACTORS BASED ON CARS DATA
BY RACE/ETHNICITY/GENDER CLASSIFICATION JULY 1, 2005, THROUGH JUNE 30, 2009
B u sin e ss O w n e r % o f % o f A v a i la b le D isp a ri ty D isp a ra te Im p a c t
C la ssi fic a tio n D o l la rs1 F i rm s2 In d e x 3o f U ti l i z a tio n
2 0 0 6
A fric a n A m e ric a n s 0 .3 5 % 1 .9 6 % 1 7 .9 4 * U n d e ru t il iz a t io n
H is p a n ic A m e ric a n s 0 .1 3 % 7 .6 7 % 1 .7 5 * U n d e ru t il iz a t io n
A s ia n A m e ric a n s 2 .3 8 % 0 .8 9 % 2 6 8 .9 3 O ve ru t il iz a t io n
N a t ive A m e ric a n s 0 .0 1 % S N /A N /A
N o n m in o rit y W o m e n 0 .2 4 % 2 0 .6 5 % 1 .1 4 * U n d e ru t il iz a t io n
N o n -M /W B E F irm s 9 6 .8 9 % 6 8 .8 3 % 1 4 0 .7 7 O ve ru t il iz a t io n
2 0 0 7
A fric a n A m e ric a n s 0 .4 4 % 1 .9 6 % 2 2 .4 7 * U n d e ru t il iz a t io n
H is p a n ic A m e ric a n s 0 .0 7 % 7 .6 7 % 0 .8 8 * U n d e ru t il iz a t io n
A s ia n A m e ric a n s 2 .3 1 % 0 .8 9 % 2 6 0 .5 6 O ve ru t il iz a t io n
N a t ive A m e ric a n s 0 .0 1 % S N /A N /A
N o n m in o rit y W o m e n 0 .2 8 % 2 0 .6 5 % 1 .3 7 * U n d e ru t il iz a t io nN o n -M /W B E F irm s 9 6 .8 9 % 6 8 .8 3 % 1 4 0 .7 7 O ve ru t il iz a t io n
2 0 0 8
A fric a n A m e ric a n s 0 .3 8 % 1 .9 6 % 1 9 .2 1 * U n d e ru t il iz a t io n
H is p a n ic A m e ric a n s 0 .0 9 % 7 .6 7 % 1 .1 8 * U n d e ru t il iz a t io n
A s ia n A m e ric a n s 1 .9 8 % 0 .8 9 % 2 2 2 .9 2 O ve ru t il iz a t io n
N a t ive A m e ric a n s 0 .0 1 % S N /A N /A
N o n m in o rit y W o m e n 0 .2 1 % 2 0 .6 5 % 1 .0 4 * U n d e ru t il iz a t io n
N o n -M /W B E F irm s 9 7 .3 3 % 6 8 .8 3 % 1 4 1 .4 0 O ve ru t il iz a t io n
2 0 0 9
A fric a n A m e ric a n s 0 .4 7 % 1 .9 6 % 2 3 .8 2 * U n d e ru t il iz a t io n
H is p a n ic A m e ric a n s 0 .3 4 % 7 .6 7 % 4 .4 8 * U n d e ru t il iz a t io n
A s ia n A m e ric a n s 1 .8 9 % 0 .8 9 % 2 1 3 .0 4 O ve ru t il iz a t io n
N a t ive A m e ric a n s 0 .0 1 % S N /A N /A
N o n m in o rit y W o m e n 0 .2 3 % 2 0 .6 5 % 1 .1 1 * U n d e ru t il iz a t io nN o n -M /W B E F irm s 9 7 .0 6 % 6 8 .8 3 % 1 4 1 .0 2 O ve ru t il iz a t io n
A l l Y e a rs
A fric a n A m e ric a n s 0 .4 1 % 1 .9 6 % 2 0 .8 7 * U n d e ru t il iz a t io n
H is p a n ic A m e ric a n s 0 .1 6 % 7 .6 7 % 2 .0 9 * U n d e ru t il iz a t io n
A s ia n A m e ric a n s 2 .1 4 % 0 .8 9 % 2 4 1 .0 7 O ve ru t il iz a t io n
N a t ive A m e ric a n s 0 .0 1 % S N /A N /A
N o n m in o rit y W o m e n 0 .2 4 % 2 0 .6 5 % 1 .1 6 * U n d e ru t il iz a t io n
N o n -M /W B E F irm s 9 7 .0 4 % 6 8 .8 3 % 1 4 0 .9 9 O ve ru t il iz a t io n Source: MGT developed a payment (based on CARS data) and vendor database based on for the Commonwealth from July 1, 2005 through June 30, 2009. 1 The percentage of dollars is taken from the prime utilization exhibit previously shown in Chapter
4.0. 2 The percentage of available contractors is taken from the availability exhibit previously shown in
Chapter 4.0. 3 The disparity index is the ratio of % utilization to % availability times 100.
* An asterisk is used to indicate a substantial level of disparity – index below 80.00. S denotes that findings were withheld because estimates did not meet U.S. Census publication standards. N/A data not available.
Disparity Analysis
Page 5-12
5.2.6 Construction Subcontractors
Exhibit 5-7 shows the disparity indices for construction subcontractors based on available electronic subcontract data obtained from the Commonwealth’s Dashboard System. Over the study period for the Commonwealth, non-M/WBE firms were substantially underutilized in 2007, and overutilized in fiscal years 2008 and 2009, resulting in overall overutilization with a disparity index of 128.66. However, as mentioned in Chapter 4.0, there was incomplete electronic subcontractor data available for fiscal years 2007 and 2008. Based on M/WBE construction subcontractor data, each MBE group was underutilized or substantially underutilized during each fiscal year of the study period, expect for firms owned by Hispanic Americans, which were overutilized in fiscal year 2009. Based on this data, the overall disparity indices resulted in 30.21 for African Americans, 87.79 for Hispanic Americans, 61.13 for Asian Americans, 6.65 for Native Americans, and 32.81 for nonminority women, ultimately resulting in underutilization or substantial underutilization for each MBE group.
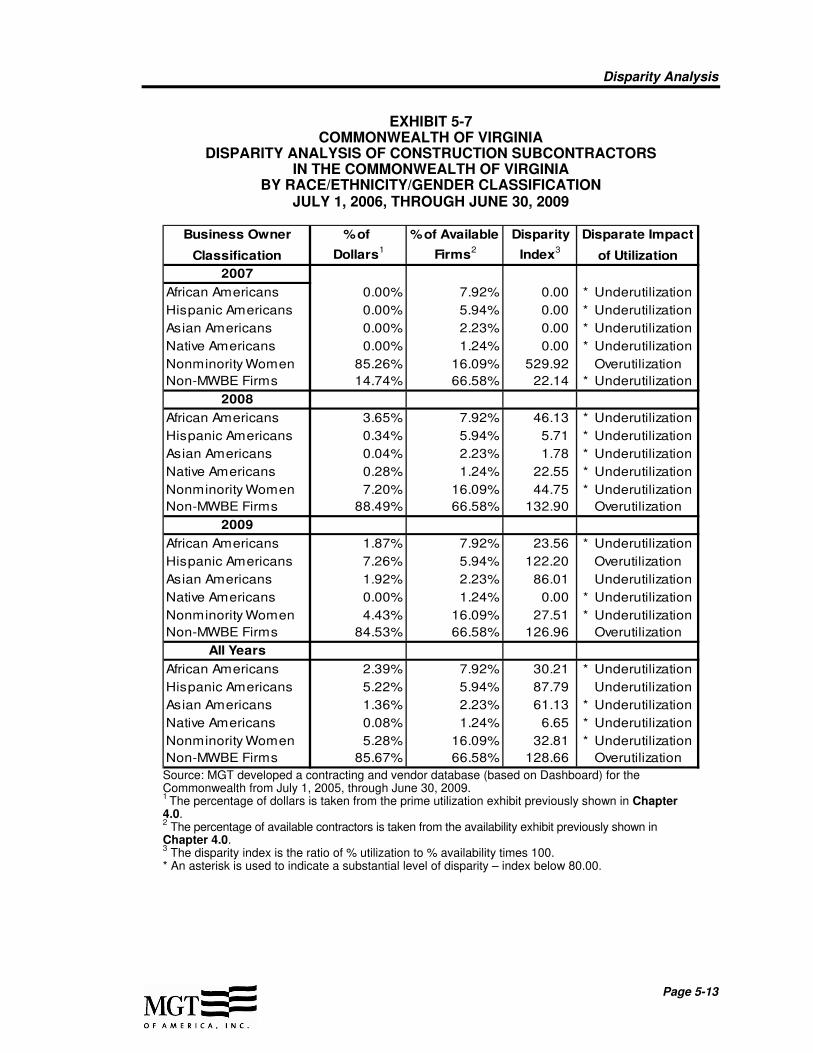
Disparity Analysis
Page 5-13
EXHIBIT 5-7 COMMONWEALTH OF VIRGINIA
DISPARITY ANALYSIS OF CONSTRUCTION SUBCONTRACTORS IN THE COMMONWEALTH OF VIRGINIA
BY RACE/ETHNICITY/GENDER CLASSIFICATION JULY 1, 2006, THROUGH JUNE 30, 2009
Business Owner % of % of Available Disparity Disparate Impact
Classification Dollars1
Firms2
Index3
of Utilization
2007
African Americans 0.00% 7.92% 0.00 * Underutilization
Hispanic Americans 0.00% 5.94% 0.00 * Underutilization
Asian Americans 0.00% 2.23% 0.00 * Underutilization
Native Americans 0.00% 1.24% 0.00 * Underutilization
Nonminority Women 85.26% 16.09% 529.92 Overutilization
Non-MWBE Firms 14.74% 66.58% 22.14 * Underutilization
2008
African Americans 3.65% 7.92% 46.13 * Underutilization
Hispanic Americans 0.34% 5.94% 5.71 * Underutilization
Asian Americans 0.04% 2.23% 1.78 * Underutilization
Native Americans 0.28% 1.24% 22.55 * Underutilization
Nonminority Women 7.20% 16.09% 44.75 * Underutilization
Non-MWBE Firms 88.49% 66.58% 132.90 Overutilization
2009
African Americans 1.87% 7.92% 23.56 * Underutilization
Hispanic Americans 7.26% 5.94% 122.20 Overutilization
Asian Americans 1.92% 2.23% 86.01 Underutilization
Native Americans 0.00% 1.24% 0.00 * Underutilization
Nonminority Women 4.43% 16.09% 27.51 * Underutilization
Non-MWBE Firms 84.53% 66.58% 126.96 Overutilization
All Years
African Americans 2.39% 7.92% 30.21 * Underutilization
Hispanic Americans 5.22% 5.94% 87.79 Underutilization
Asian Americans 1.36% 2.23% 61.13 * Underutilization
Native Americans 0.08% 1.24% 6.65 * Underutilization
Nonminority Women 5.28% 16.09% 32.81 * Underutilization
Non-MWBE Firms 85.67% 66.58% 128.66 Overutilization
Source: MGT developed a contracting and vendor database (based on Dashboard) for the Commonwealth from July 1, 2005, through June 30, 2009. 1 The percentage of dollars is taken from the prime utilization exhibit previously shown in Chapter
4.0. 2 The percentage of available contractors is taken from the availability exhibit previously shown in
Chapter 4.0. 3 The disparity index is the ratio of % utilization to % availability times 100.
* An asterisk is used to indicate a substantial level of disparity – index below 80.00.

Disparity Analysis
Page 5-14
5.2.7 Conclusions based on Disparity Indices
This chapter used disparity indices to compare the availability and utilization findings from Chapter 4.0. The disparity indices indicate whether disparity exists for each ethnic or gender group. Exhibits 5-8 and 5-9 summarize the findings of M/WBE underutilization based on CARS data for prime contracting and Dashboard data for construction subcontracting, respectively. Appendix C presents the summary of findings by business category for the self-reporting universities.
EXHIBIT 5-8 COMMONWEALTH OF VIRGINIA
SUMMARY OF PRIME M/WBE UNDERUTILIZATION BASED ON CARS DATA
Business Category
Construction Prime Contractors YES * YES * YES * YES * YES *
Architecture & Engineering Prime
ConsultantsYES * YES * YES * YES * YES *
Professional Services Prime
Consultants YES * YES * YES * YES * YES *
Other Services Firms YES * YES * YES * N/A YES *
Goods and Supplies Vendors YES * YES * NO N/A YES *
African
American
Hispanic
American
Asian
American
Native
American
Nonminority
Women
* An asterisk is used to indicate a substantial level of disparity – index below 80.00. N/A data not available.
EXHIBIT 5-9
COMMONWEALTH OF VIRGINIA SUMMARY OF M/WBE UNDERUTILIZATION ON THE CONSTRUCTION
SUBCONTRACT LEVEL IN THE COMMONWEALTH OF VIRGINIA
BASED ON DASHBOARD DATA
Business Category
Construction Subcontractors YES * YES YES * YES * YES *
African
American
Hispanic
American
Asian
American
Native
American
Nonminority
Women
* An asterisk is used to indicate a substantial level of disparity – index below 80.00. N/A data not available.

6.0 PRIVATE SECTOR ANALYSIS

Page 6-1
6.0 PRIVATE SECTOR ANALYSIS
The purpose of this analysis is to examine the effects of race and gender, along with other individual economic and demographic characteristics, on individuals’ participation in the private sector as self-employed business operators, and on their earnings as a result of their participation in five categories of private sector business activity in the Commonwealth of Virginia. Findings for minority business enterprises are compared to the self-employment participation and earnings record of nonminority male business owners to determine if a disparity in self-employment rates and earnings exists, and if it is attributable to differences in race, gender, or ethnicity. Adopting the methodology and variables employed by a City of Denver disparity study (see Concrete Works v. City and County of Denver 1), we use Public Use Microdata Samples (PUMS) data derived from the 2008 American Community Survey (ACS) of Population and Housing, to which we apply appropriate regression statistics to draw conclusions. To guide this investigation, three general research questions were posed. Questions and variables used to respond to each, followed by a report of findings, are reported below:
1. Are racial, ethnic and gender minority groups less likely than nonminority males to be self-employed?
This analysis examined the statistical effects of the following variables on the likelihood of being self-employed in the study market area: Race, ethnicity, and gender of business owner (African American, Asian American, Hispanic American, Native American, nonminority women, nonminority men), marital status, age, self-reported health-related disabilities, availability of capital (household property value, monthly total mortgage payments, unearned income) and other characteristics (number of individuals over the age of 65 living in household, number of children under the age of 18 living in household) and level of education.
2. Does race, ethnicity, and gender status have an impact on individual’s self-employment earnings?
This analysis examined the statistical effects of the following variables on income from self-employment for business owners in the market area: Race, ethnicity, and gender of business owner (African American, Asian American, Hispanic American, Native American, nonminority women, nonminority men), marital status, age, self-reported health-related disabilities, and availability of capital (household property value, monthly total mortgage payments, unearned income) and level of education.
3. If minority and nonminority women business enterprises (M/WBEs) and nonminority males (non-M/WBEs) shared similar traits and marketplace “conditions” (i.e., similar “rewards” in terms of capital and asset accrual), what would be the effect on rates of self-employment by race, ethnicity and gender?
Derived from a similar model employed by a City of Denver disparity study, MGT created a model that leveraged statistical findings in response to the first two
1 Concrete Works v. City and County of Denver, 321 F.3 950 (10
th Cir. 2003).
Private Sector Analysis
Page 6-2
questions to determine if race, gender, and ethnic effects derived from those findings would persist if nonminority male demographic and economic characteristics were combined with M/WBE self-employment data. More precisely, in contrast to Question 1, which permitted a comparison of self-employment rates based on demographic and economic characteristics reported by the 2008 ACS for individual M/WBE categories and nonminority males, respectively, this analysis posed the question, “How would M/WBE rates change, if M/WBE’s operated in a nonminority male business world and how much of this change is attributable to race, gender or ethnicity?”
Findings:
1. Are racial, ethnic and gender minority groups less likely than nonminority males to be self-employed?
In all industries in the Commonwealth of Virginia, nonminority males were nearly one and a half as likely to be self-employed as African Americans, Hispanic Americans, and nonminority women.2
In the Commonwealth of Virginia, nonminority males were three times as likely as African Americans and nonminority women to be self-employed in professional services.
In the Commonwealth of Virginia, nonminority males were nearly three times as likely as nonminority women to be self-employed in the construction industry.
The most egregious effect on self-employment potential was found in the goods and supplies industry for African Americans. In the goods and supplies industry, nonminority males were over three times as likely as African Americans to be self-employed.
2. Does race/gender/ethnic status have an impact on an individual’s self-employment earnings?
In the Commonwealth of Virginia, African Americans, Hispanic Americans, Native American, and nonminority women reported significantly lower earnings in all business type categories.
In the construction industry, African Americans reported significantly lower earnings than nonminority males in the Commonwealth of Virginia: 27.7 percent.
The most egregious effect on earnings elasticities was found in the goods and supplies industry for Native Americans. In the goods and supplies industry, Native Americans earned 132.8 percent less than nonminority males.
2 These ”likelihood” characteristics were derived from Exhibit 1 by calculating the inverse of the reported
odds ratios.

Private Sector Analysis
Page 6-3
3. If M/WBEs and nonminority males shared similar traits and marketplace “conditions” (i.e., similar “rewards” in terms of capital and asset accrual), what would be the effect on rates of self-employment by race, ethnicity, and gender?
Overall, comparing self-employed nonminority males with self-employed African Americans in the Commonwealth of Virginia, 82.75 percent of the disparity in self-employment rates was attributable to race differences.
Overall, comparing self-employed nonminority males with self-employed Hispanic Americans in the Commonwealth of Virginia, over 58 percent of the disparity in self-employment rates was attributable to race differences.
Comparing self-employed nonminority males with self-employed Hispanic Americans in the Commonwealth of Virginia construction industry, 24 percent of the disparity in self-employment rates was attributable to race differences.
Comparing self-employed nonminority males with self-employed African Americans in the Commonwealth of Virginia goods and supplies industry, over 87 percent of the disparity in self-employment rates was attributable to gender differences.
6.1 Introduction
This chapter analyzes the availability of minority, nonminority women, and nonminority male firms in five categories of private sector business activity in the Commonwealth of Virginia. The goal of this investigation is to examine the effects of race and gender, along with other individual economic and demographic characteristics, on individuals’ participation in the private sector as self-employed business operators, and on their earnings as a result of their participation. Ultimately, we will compare these findings to the self-employment participation and earnings record of nonminority male business owners to determine if a disparity in self-employment rates and earnings exists and if it is attributable to racial or gender discrimination in the marketplace. Data for this investigation are provided by the Public Use Microdata Samples (PUMS) data derived from the 2008 American Community Survey of Population and Housing, to which we apply appropriate regression statistics to draw conclusions. Exhibit 6-1 presents a general picture of self-employment rates by race, median earnings, and sample sizes (n’s) in the Commonwealth of Virginia, calculated from the five percent PUMS ACS sample.
The next section will discuss the research basis for this examination to lay the groundwork for a description of the models and methodologies to be employed. This will be followed by a presentation of findings regarding minority status effects on self-employment rates, self-employment earnings, and attributions of these differences to discrimination, per se.
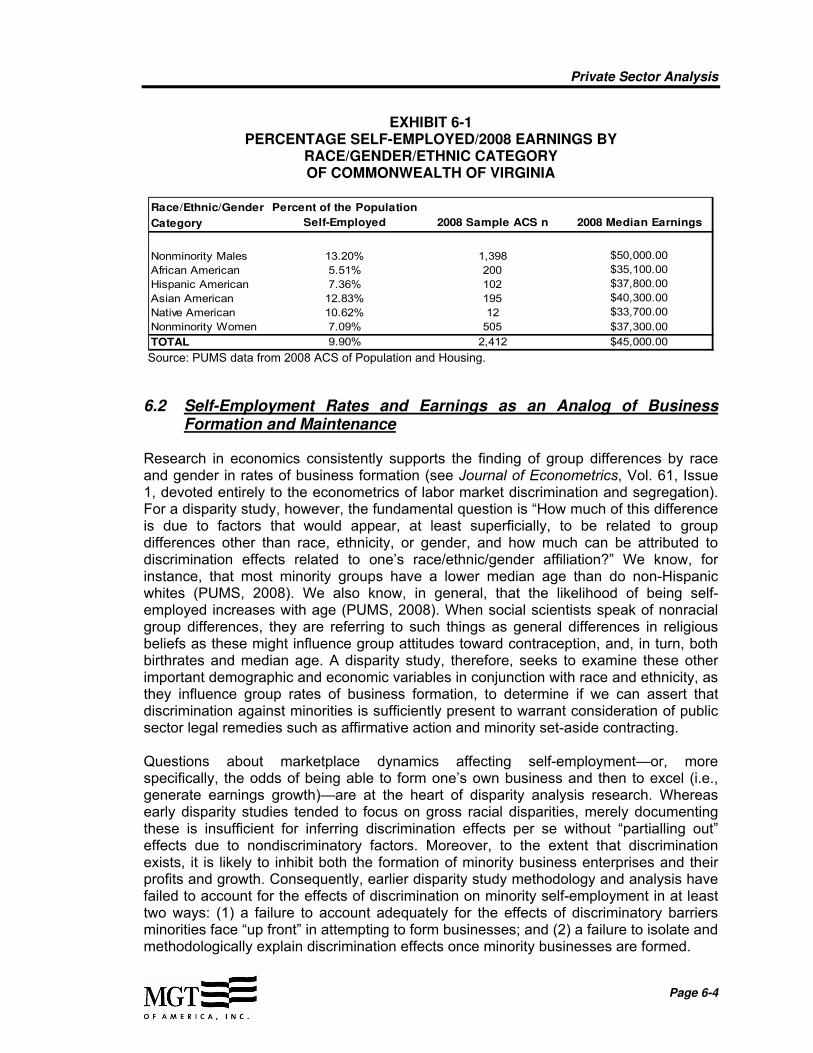
Private Sector Analysis
Page 6-4
EXHIBIT 6-1 PERCENTAGE SELF-EMPLOYED/2008 EARNINGS BY
RACE/GENDER/ETHNIC CATEGORY OF COMMONWEALTH OF VIRGINIA
Race/Ethnic/Gender
Category
Nonminority Males
African American
Hispanic American
Asian American
Native American
Nonminority Women
TOTAL $45,000.00
$37,800.00
$40,300.00
$33,700.00
$37,300.00
$50,000.00
$35,100.00
7.09%
195
12
505
2,412
1,398
200
102
9.90%
7.36%
12.83%
10.62%
Percent of the Population
Self-Employed 2008 Median Earnings2008 Sample ACS n
13.20%
5.51%
Source: PUMS data from 2008 ACS of Population and Housing.
6.2 Self-Employment Rates and Earnings as an Analog of Business Formation and Maintenance
Research in economics consistently supports the finding of group differences by race and gender in rates of business formation (see Journal of Econometrics, Vol. 61, Issue 1, devoted entirely to the econometrics of labor market discrimination and segregation). For a disparity study, however, the fundamental question is “How much of this difference is due to factors that would appear, at least superficially, to be related to group differences other than race, ethnicity, or gender, and how much can be attributed to discrimination effects related to one’s race/ethnic/gender affiliation?” We know, for instance, that most minority groups have a lower median age than do non-Hispanic whites (PUMS, 2008). We also know, in general, that the likelihood of being self-employed increases with age (PUMS, 2008). When social scientists speak of nonracial group differences, they are referring to such things as general differences in religious beliefs as these might influence group attitudes toward contraception, and, in turn, both birthrates and median age. A disparity study, therefore, seeks to examine these other important demographic and economic variables in conjunction with race and ethnicity, as they influence group rates of business formation, to determine if we can assert that discrimination against minorities is sufficiently present to warrant consideration of public sector legal remedies such as affirmative action and minority set-aside contracting. Questions about marketplace dynamics affecting self-employment—or, more specifically, the odds of being able to form one’s own business and then to excel (i.e., generate earnings growth)—are at the heart of disparity analysis research. Whereas early disparity studies tended to focus on gross racial disparities, merely documenting these is insufficient for inferring discrimination effects per se without “partialling out” effects due to nondiscriminatory factors. Moreover, to the extent that discrimination exists, it is likely to inhibit both the formation of minority business enterprises and their profits and growth. Consequently, earlier disparity study methodology and analysis have failed to account for the effects of discrimination on minority self-employment in at least two ways: (1) a failure to account adequately for the effects of discriminatory barriers minorities face “up front” in attempting to form businesses; and (2) a failure to isolate and methodologically explain discrimination effects once minority businesses are formed.

Private Sector Analysis
Page 6-5
The next section addresses these shortcomings, utilizing PUMS data derived from the 2008 U.S. ACS to answer research questions about the effects of discrimination on self-employment and self-employment earnings using multiple regression statistics.
6.3 Research Questions, Statistical Models, and Methods
Two general research questions were posed in the initial analysis:
Are racial, ethnic, and gender minority groups less likely than nonminority males to be self-employed?
Does race/gender/ethnic status have an impact on individuals’ earnings?
A third question, to be addressed later—How much does race/ethnic/gender discrimination influence the probability of being self-employed?—draws conclusions based on findings from questions one and two. To answer the first two questions, we employed two multivariate regression techniques, respectively: logistic regression and linear regression. To understand the appropriate application of these regression techniques, it is helpful to explore in greater detail the questions we are trying to answer. The dependent variables in questions I and II—that is, the phenomena to be explained by influences such as age, race, gender, and disability status, for example (the independent or “explanatory” variables)—are, respectively: the probability of self-employment status (a binary, categorical variable based on two possible values: 0 = not self-employed/1 = self-employed) and 2008 earnings from self-employment (a continuous variable). In our analysis, the choice of regression approach was based on the scale of the dependent variable (in question I, a categorical scale with only two possible values, and in question II, a continuous scale with many possible values). Because binary logistic regression is capable of performing an analysis in which the dependent variable is categorical, it was employed for the analysis of question I.3 To analyze question II, in which the dependent variable is continuous, we used simple linear regression. 6.3.1 Deriving the Logistic Regression Model from the Simple Linear Model
The logistic regression model can be derived with reference to the simple linear regression model expressed mathematically as:
Y = 0 + I XI + 2 X2 + 3 X3 + 4 X4 + 5 X5 + … +
3 Logistical regression, or logit, models generate predicted probabilities that are almost identical to those
calculated by a probit procedure, used in Concrete Works v. City and County of Denver case. Logit, however, has the added advantage of dealing more effectively with observations at the extremes of a distribution. For a complete explanation, see Interpreting Probability Models (T.F. Liao, Text 101 in the Sage University series).

Private Sector Analysis
Page 6-6
Where: Y = a continuous variable (e.g., 2008 earnings from self-employment)
0 = the constant, representing the value of Y when XI = 0 I = coefficient representing the magnitude of XI’s effect on Y
XI = the independent variables, such as age, human capital (e.g., level of education), availability of capital, race/ethnicity/gender, etc.
ε = the error term, representing the variance in Y unexplained by XI
This equation may be summarized as:
k
K
kk
xYE
1
)(
in which Y is the dependent variable and represents the expected values of Y as a
result of the effects of β, the explanatory variables. When we study a random distribution of Y using the linear model, we specify its expected values as a linear combination of K unknown parameters and the covariates or explanatory variables. When this model is applied to data in the analysis, we are able to find the statistical link between the dependent variable and the explanatory or independent variables. Suppose we introduce a new term, , into the linear model such that:
k
K
kk
x
1
When the data are randomly distributed, the link between and is linear, and a simple
linear regression can be used. However, to answer the first question, the categorical dependent variable was binomially distributed. Therefore, the link between and
became )]1/(log[ and logistic regression was utilized to determine the
relationship between the dependent variable and the explanatory variables, calculated as a probability value (e.g., the probability of being self-employed when one is African American). The logistic regression model is expressed mathematically as:
ni X)]1(1/log[
Where:
(/1-) = the probability of being self-employed
= a constant value
i = coefficient corresponding to independent variables
nX = selected individual characteristic variables, such as age,
marital status, education, race, and gender
= error term, representing the variance in Y unexplained by XI
This model can now be used to determine the relationship between a single categorical variable (0 = not self-employed/1 = self-employed) and a set of characteristics hypothesized

Private Sector Analysis
Page 6-7
to influence the probability of finding a 0 or 1 value for the categorical variable. The result of this analysis illustrates not only the extent to which a characteristic can increase or decrease the likelihood that the categorical variable will be a 0 or a 1, but also whether the effect of the influencing characteristics is positive or negative in relation to being self-employed.
6.4 Results of the Self-Employment Analysis
6.4.1 Question I: Are Racial, Ethnic, and Gender Minority Groups Less Likely than Nonminority Males to Be Self-Employed?
To derive a set of variables known to predict employment status (self-employed/not self-employed), we used the 5 percent PUMS data from ACS 2008. Binary logistic regression was used to calculate the probability of being self-employed, the dependent variable, with respect to socioeconomic and demographic characteristics selected for their potential to influence the likelihood of self-employment. The sample for the analysis was limited to labor force participants who met to the following criteria:
Resident of the Commonwealth of Virginia
Self-employed in construction, professional services, other services, architecture and engineering,4 or goods and supplies
Employed full-time (more than 35 hours a week)
18 years of age or older
Employed in the private sector
Next, we derived the following variables hypothesized as predictors of employment status:
Race and Sex: African American, Asian American, Hispanic American, Native American, nonminority woman, nonminority male
Availability of Capital: Homeownership, home value, mortgage rate, unearned income, residual income
Marital Status
Ability to Speak English Well
Disability Status: From individuals’ reports of health-related disabilities
Age and Age Squared: Squaring the age variable acknowledges the positive, curvilinear relationship between each year of age and earnings.
4 Due to inadequate sample numbers for all races in the Architecture and Engineering PUMS 2008
data, Architecture and Engineering was merged with the Professional Services category.
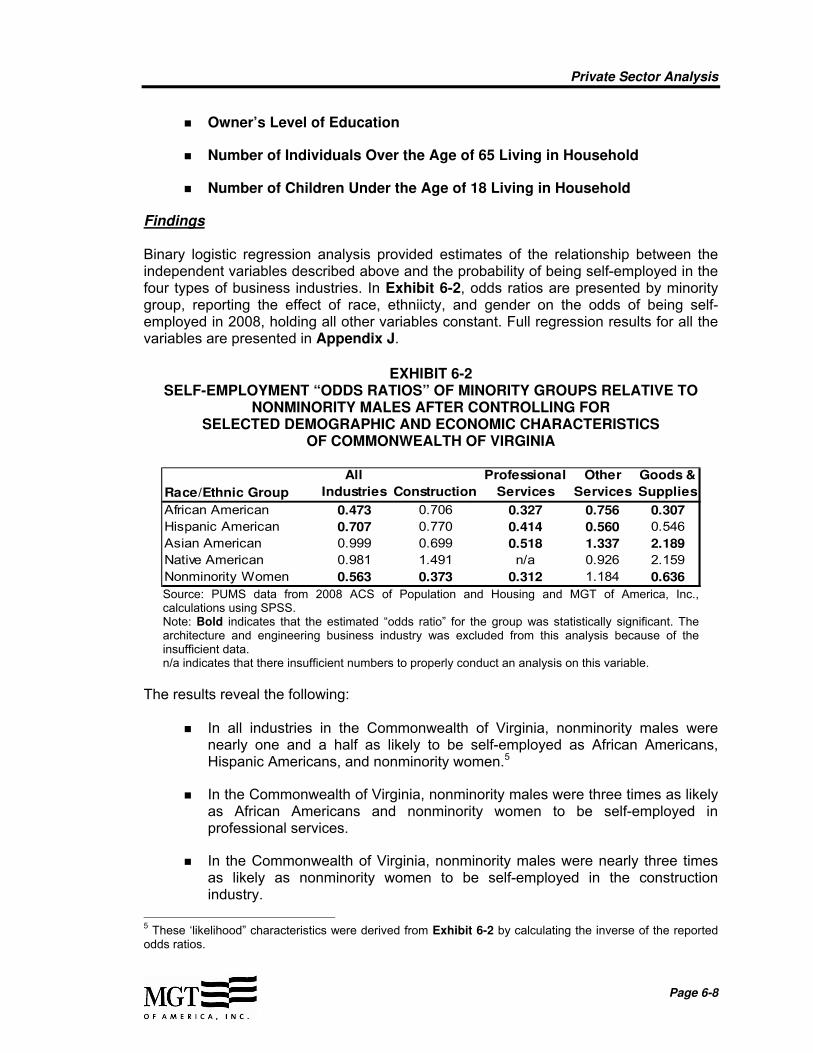
Private Sector Analysis
Page 6-8
Owner’s Level of Education
Number of Individuals Over the Age of 65 Living in Household
Number of Children Under the Age of 18 Living in Household
Findings
Binary logistic regression analysis provided estimates of the relationship between the independent variables described above and the probability of being self-employed in the four types of business industries. In Exhibit 6-2, odds ratios are presented by minority group, reporting the effect of race, ethniicty, and gender on the odds of being self-employed in 2008, holding all other variables constant. Full regression results for all the variables are presented in Appendix J.
EXHIBIT 6-2
SELF-EMPLOYMENT “ODDS RATIOS” OF MINORITY GROUPS RELATIVE TO NONMINORITY MALES AFTER CONTROLLING FOR
SELECTED DEMOGRAPHIC AND ECONOMIC CHARACTERISTICS OF COMMONWEALTH OF VIRGINIA
Race/Ethnic Group
All
Industries Construction
Professional
Services
Other
Services
Goods &
Supplies
African American 0.473 0.706 0.327 0.756 0.307
Hispanic American 0.707 0.770 0.414 0.560 0.546
Asian American 0.999 0.699 0.518 1.337 2.189
Native American 0.981 1.491 n/a 0.926 2.159
Nonminority Women 0.563 0.373 0.312 1.184 0.636
Source: PUMS data from 2008 ACS of Population and Housing and MGT of America, Inc., calculations using SPSS. Note: Bold indicates that the estimated “odds ratio” for the group was statistically significant. The architecture and engineering business industry was excluded from this analysis because of the insufficient data. n/a indicates that there insufficient numbers to properly conduct an analysis on this variable.
The results reveal the following:
In all industries in the Commonwealth of Virginia, nonminority males were nearly one and a half as likely to be self-employed as African Americans, Hispanic Americans, and nonminority women.5
In the Commonwealth of Virginia, nonminority males were three times as likely as African Americans and nonminority women to be self-employed in professional services.
In the Commonwealth of Virginia, nonminority males were nearly three times as likely as nonminority women to be self-employed in the construction industry.
5 These ‘likelihood” characteristics were derived from Exhibit 6-2 by calculating the inverse of the reported
odds ratios.
Private Sector Analysis
Page 6-9
The most egregious effect on self-employment potential was found in the goods and supplies industry for African Americans. In the goods and supplies industry, nonminority males were over three times as likely as African Americans to self-employed.
6.4.2 Question II: Does Race/Gender/Ethnic Status Have an Impact on Individuals’ Earnings?
To answer this question, we compared self-employed, minority, and women entrepreneurs’ earnings to those of nonminority males in the Commonwealth of Virginia, when the effect of other demographic and economic characteristics was controlled or “neutralized.” That is, we were able to examine the earnings of self-employed individuals of similar education levels, ages, etc., to permit earnings comparisons by race/gender/ethnicity. To derive a set of variables known to predict earnings, the dependent variable, we used 2008 wages from employment for self-employed individuals, as reported in the 5 percent PUMS data. These included:
Race and Sex: African American, Asian American, Hispanic American, Native American, nonminority woman, nonminority males
Availability of Capital: Homeownership, home value, mortgage rate, unearned income, residual income
Marital Status
Ability to Speak English Well
Disability Status: From individuals’ reports of health-related disabilities
Age and Age Squared: Squaring the age variable acknowledges the positive, curvilinear relationship between each year of age and earnings.
Owner’s Level of Education
Findings
Exhibit 6-3 presents the results of the linear regression model estimating the effects of selected demographic and economic variables on self-employment earnings. Each number (i.e., coefficient) in the exhibit represents a percent change in earnings. For example, the corresponding number for an African American in all industries is -.626, meaning that an African American will earn 62.6 percent less than a nonminority male when the statistical effects of the other variables in the equation are “controlled for.” Full regression results for all the variables are presented in Appendix J.

Private Sector Analysis
Page 6-10
EXHIBIT 6-3 EARNINGS ELASTICITIES OF MINORITY GROUPS RELATIVE TO NONMINORITY
MALES AFTER CONTROLLING FOR SELECTED DEMOGRAPHIC AND ECONOMIC CHARACTERISTICS
CITY OF COMMONWEALTH OF VIRGINIA
Race/Ethnic Group
All
Industries Construction
Professional
Services
Other
Services
Goods &
Supplies
African American -0.387 -0.277 -0.692 -0.324 -0.610
Hispanic American -0.250 -0.286 -0.262 0.094 -0.125
Asian American -0.163 0.217 -0.332 -0.077 -0.325
Native American -0.807 -0.126 n/a -0.606 -1.328
Nonminority Women -0.394 -0.271 -0.578 -0.341 -0.472
Source: PUMS data from 2008 ACS of Population and Housing and MGT of America, Inc., calculations using SPSS. Note: Bold indicates that the estimated “elasticities” for the group were statistically significant. The architecture and engineering business industry was excluded from this analysis because of insufficient data. n/a indicates that there were no variables associated with this ethnicity or racial group.
The results reveal the following:
In the Commonwealth of Virginia, African Americans, Hispanic Americans, Native American, and nonminority women reported significantly lower earnings in all business type categories.
In the construction industry, African Americans reported significantly lower earnings than nonminority males in the Commonwealth of Virginia: 27.7 percent.
The most egregious effect on earnings elasticities was found in the goods and supplies industry for Native Americans. In the goods and supplies industry, Native Americans earned 132.8 percent less than nonminority males.
6.4.3 Disparities in Rates of Self-Employment: How Much Can Be Attributed to Discrimination?
Results of the analyses of self-employment rates and 2008 self-employment earnings revealed general disparities between minority and nonminority self-employed individuals whose businesses were located in the Commonwealth of Virginia. Exhibit 6-4 presents the results of these analyses. Column A reports observed employment rates for each race/gender group, calculated directly from the PUMS 2008 data. To obtain values in columns B and C, we calculated two predicted self-employment rates using the following equation:

Private Sector Analysis
Page 6-11
)1/()1(Pr1
kkkk xK
k
xeeyob
Where: )1(Pr yob = represents the probability of being self-employed
k = coefficient corresponding to the independent variables used in
the logistic regression analysis of self-employment probabilities
kx = the mean values of these same variables
The first of these predicted self-employment rate calculations (in column B) presents
nonminority male self-employment rates as they would be if their characteristics (i.e., kx ,
or mean values for the independent variables) were applied to minority market structures
(represented for each race by their k or odds coefficient values). The second self-
employment rate calculation (in column C) presents minority self-employment rates as they would be if minorities were rewarded in a similar manner as nonminority males in the nonminority male market structure: that is, by multiplying the minority means (i.e., characteristics) by the estimated nonminority coefficients for both race and the other independent variables.

Private Sector Analysis
Page 6-12
EXHIBIT 6-4 OBSERVED AND PREDICTED SELF-EMPLOYMENT RATES
Business/Race Group
Observed
Self-
Employment
Rates
White
Characteristics
and Own Market
Structure
Own Characteristics and
White Market Structure
Disparity Ratio (column A
divided by column C)
Portion of Difference
Due to Discrimination
(A) (B) (C) (D) (E)
Overall
Nonminority Males 0.1320 0.1320 0.1320 1.000
African American 0.0551 0.0786 0.1188 0.4638 82.75%
Hispanic American 0.0736 0.1131 0.1080 0.6820 58.81%
Asian American 0.1283 0.1526 0.1629 0.7876 n/d
Native American 0.1062 0.1502 0.1278 0.8308 83.73%
Nonminority Women 0.0709 0.0922 0.1460 0.4856 n/d
Construction
Nonminority Males 0.2416 0.2416 0.2416 1.000
African American 0.1850 0.1656 0.1930 0.9585 14.16%
Hispanic American 0.1368 0.1780 0.1619 0.8446 24.00%
Asian American 0.2549 0.1642 0.2721 0.9369 n/d
Natvie American 0.3333 0.2954 0.2376 1.4030 n/d
Nonminority Women 0.1390 0.0950 0.2539 0.5476 n/d
Professional Services
Nonminority Males 0.1427 0.1427 0.1427 1.000
African American 0.0346 0.0838 0.1488 0.2323 n/d
Hispanic American 0.0465 0.1038 0.1543 0.3014 n/d
Asian American 0.0741 0.1264 0.2119 0.3496 n/d
Natvie American 0.0000 0.0000 0.0018 0.0000 1.26%
Nonminority Women 0.0412 0.0803 0.1688 0.2440 n/d
Other Services
Nonminority Males 0.1477 0.1477 0.1477 1.0000
African American 0.0972 0.1331 0.1319 0.7367 68.82%
Hispanic American 0.0705 0.1022 0.1574 0.4481 n/d
Asian American 0.1801 0.2136 0.1771 1.0169 9.22%
Natvie American 0.1190 0.1583 0.1727 0.6895 n/d
Nonminority Women 0.1491 0.1938 0.1618 0.9215 n/d
Goods & Supplies
Nonminority Males 0.0879 0.0879 0.0879 1.000
African American 0.0161 0.0420 0.0792 0.2027 87.87%
Hispanic American 0.0311 0.0724 0.0462 0.6716 26.71%
Asian American 0.1610 0.2384 0.1015 1.5856 81.37%
Natvie American 0.1053 0.2358 0.0359 2.9303 n/d
Nonminority Women 0.0474 0.0833 0.1253 0.3784 n/d
COMMONWEALTH OF VIRGINIA
Source: PUMS data from 2008 ACS of Population and Housing and MGT of America, Inc., calculations using SPSS and Microsoft Excel. n/d: No discrimination was found.
Using these calculations, we were able to determine a percentage of the disparities in self-employment between minorities and nonminority males attributable to discrimination by dividing the observed self-employment rate for a particular minority group (column A) by the predicted self-employment rate as it would be if minority groups faced the same market structure as nonminority males (column C). Next, we calculated the difference between the predicted self-employment rate as it would be if minority groups faced the same market structure as nonminority males and the observed self-employment rate for that minority group, and divided this value by the difference between the observed self-

Private Sector Analysis
Page 6-13
employment rate for nonminority males and the self-employment rate for a particular minority group. In the absence of discrimination, this number is zero, which means disparities in self-employment rates between minority groups and nonminority males can be attributed to differences in group characteristics not associated with discrimination. Conversely, as this value approaches 1.0, we are able to attribute disparities increasingly to discrimination in the marketplace. Findings
Examining the results reported in Exhibit 6-4, we found the following:
Overall, comparing self-employed nonminority males with self-employed African Americans in the Commonwealth of Virginia, 82.75 percent of the disparity in self-employment rates was attributable to race differences.
Overall, comparing self-employed nonminority males with self-employed Hispanic Americans in the Commonwealth of Virginia, over 58 percent of the disparity in self-employment rates was attributable to race differences.
Comparing self-employed nonminority males with self-employed Hispanic Americans in the Commonwealth of Virginia construction industry, 24 percent of the disparity in self-employment rates was attributable to race differences.
Comparing self-employed nonminority males with self-employed African Americans in the Commonwealth of Virginia goods and supplies industry, over 87 percent of the disparity in self-employment rates was attributable to gender differences.
6.5 Summary of Self-Employment Analysis Findings
In general, findings from the PUMS 2008 data indicate that minorities were significantly less likely than nonminority males to be self-employed and, if they were self-employed, they earned significantly less in 2008 than did self-employed nonminority males. When self-employment rates were stratified by race and by business type, trends varied within individual race-by-type cells, but disparities persisted, in general, for African Americans, Hispanic Americans, and nonminority women. When group self-employment rates were submitted to MGT’s disparity-due-to-minority-status analysis, findings supported the conclusion that disparities for these three groups (of adequate sample size to permit interpretation) were likely the result of differences in the marketplace due to race, gender, and ethnicity.6
6 Appendix J reports self-employment rates and earnings in greater detail by race/gender/ethnicity and
business type.

7.0 FINDINGS AND RECOMMENDATIONS
Page 7-1
7.0 FINDINGS AND RECOMMENDATIONS
In November 2009, MGT of America, Inc. (MGT), was retained to conduct a minority and women business enterprise update disparity study for the Commonwealth of Virginia (Commonwealth) to determine whether there was a compelling interest to establish a narrowly-tailored minority- and women-owned business enterprise (M/WBE) program for the Commonwealth. The study consisted of fact-finding to examine the extent to which race- and gender-conscious and race- and gender-neutral remedial efforts had effectively eliminated ongoing effects of any past discrimination affecting the Commonwealth’s relevant marketplace; to analyze the Commonwealth procurement trends and practices for the study period between July 1, 2005, and June 30, 2009 and to evaluate various options for future program development.
The results of this study and conclusions drawn are presented in detail in Chapters 2.0 through 6.0 of this report. The following sections summarize each of the study’s findings, which are followed by related major recommendations. Commendations are also noted in those instances in which the Commonwealth already has procedures, programs, and policies in place that respond to findings. Selected best practices are described at the end of this chapter. These best practices expand on the findings and recommendations that are marked with an asterisk (*).
7.1 Findings for M/WBE Utilization and Availability
FINDING 7-1: Historical M/WBE Prime Utilization
In the 2004 Procurement Disparity Study of the Commonwealth of Virginia, (2004 Commonwealth Disparity Study) M/WBEs had the following prime utilization:
M/WBEs won prime construction contracts for $12.4 million (1.49 percent of the total).
M/WBEs won architecture and engineering contracts for $4.7 million (0.52 percent of the total).
M/WBEs won professional services contracts for $13.1 million (0.70 percent of the total).
M/WBEs won other services contracts for $37.2 million (2.16 percent of the total).
M/WBEs won goods and supplies contracts for $40.3 million (1.23 percent of the total).
FINDING 7-2: M/WBE Prime Utilization, Availability, and Disparity
The dollar value of M/WBE prime utilization by the Commonwealth over the study period is shown in Exhibit 7-1:
M/WBEs won prime construction contracts for $28.7 million (1.87 percent of the total). There was substantial disparity for all M/WBE groups.
Findings and Recommendations
Page 7-2
M/WBEs won architecture and engineering contracts for $6.3 million (1.34 percent of the total). There was substantial disparity for all M/WBE groups.
M/WBEs won professional services contracts for $74.7 million (2.33 percent of the total). There was substantial disparity for all M/WBE groups.
M/WBEs won other services contracts for $102.9 million (6.09 percent of the total). There was substantial disparity for all M/WBE groups, except Native Americans.
M/WBEs won goods and supplies contracts for $74.5 million (2.96 percent of the total). There was substantial disparity for all MWBE groups, except Native Americans.
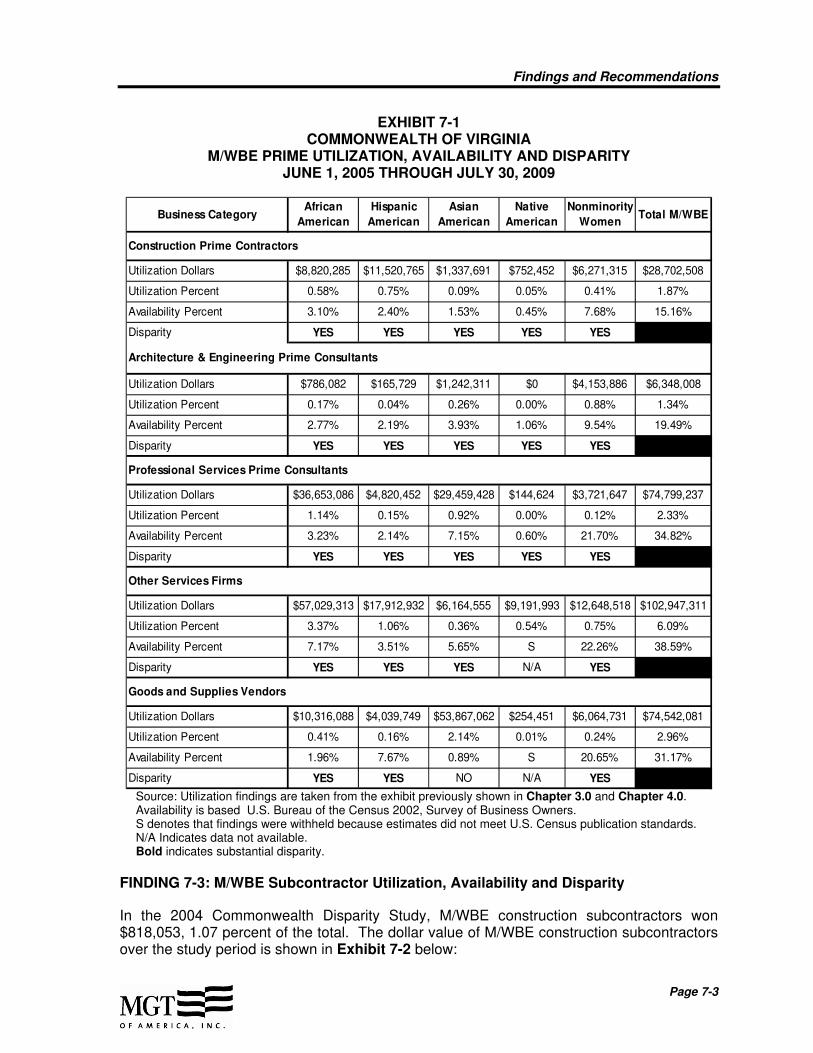
Findings and Recommendations
Page 7-3
EXHIBIT 7-1 COMMONWEALTH OF VIRGINIA
M/WBE PRIME UTILIZATION, AVAILABILITY AND DISPARITY JUNE 1, 2005 THROUGH JULY 30, 2009
Business CategoryAfrican
American
Hispanic
American
Asian
American
Native
American
Nonminority
WomenTotal M/WBE
Utilization Dollars $8,820,285 $11,520,765 $1,337,691 $752,452 $6,271,315 $28,702,508
Utilization Percent 0.58% 0.75% 0.09% 0.05% 0.41% 1.87%
Availability Percent 3.10% 2.40% 1.53% 0.45% 7.68% 15.16%
Disparity YES YES YES YES YES
Utilization Dollars $786,082 $165,729 $1,242,311 $0 $4,153,886 $6,348,008
Utilization Percent 0.17% 0.04% 0.26% 0.00% 0.88% 1.34%
Availability Percent 2.77% 2.19% 3.93% 1.06% 9.54% 19.49%
Disparity YES YES YES YES YES
Utilization Dollars $36,653,086 $4,820,452 $29,459,428 $144,624 $3,721,647 $74,799,237
Utilization Percent 1.14% 0.15% 0.92% 0.00% 0.12% 2.33%
Availability Percent 3.23% 2.14% 7.15% 0.60% 21.70% 34.82%
Disparity YES YES YES YES YES
Other Services Firms
Utilization Dollars $57,029,313 $17,912,932 $6,164,555 $9,191,993 $12,648,518 $102,947,311
Utilization Percent 3.37% 1.06% 0.36% 0.54% 0.75% 6.09%
Availability Percent 7.17% 3.51% 5.65% S 22.26% 38.59%
Disparity YES YES YES N/A YES
Goods and Supplies Vendors
Utilization Dollars $10,316,088 $4,039,749 $53,867,062 $254,451 $6,064,731 $74,542,081
Utilization Percent 0.41% 0.16% 2.14% 0.01% 0.24% 2.96%
Availability Percent 1.96% 7.67% 0.89% S 20.65% 31.17%
Disparity YES YES NO N/A YES
Construction Prime Contractors
Architecture & Engineering Prime Consultants
Professional Services Prime Consultants
Source: Utilization findings are taken from the exhibit previously shown in Chapter 3.0 and Chapter 4.0. Availability is based U.S. Bureau of the Census 2002, Survey of Business Owners. S denotes that findings were withheld because estimates did not meet U.S. Census publication standards. N/A Indicates data not available. Bold indicates substantial disparity.
FINDING 7-3: M/WBE Subcontractor Utilization, Availability and Disparity
In the 2004 Commonwealth Disparity Study, M/WBE construction subcontractors won $818,053, 1.07 percent of the total. The dollar value of M/WBE construction subcontractors over the study period is shown in Exhibit 7-2 below:

Findings and Recommendations
Page 7-4
M/WBEs won construction subcontracts for $23.2 million (14.33 percent of the total).
There was substantial disparity in the utilization of available African American, Asian American, Native American, and nonminority women construction subcontractors.
EXHIBIT 7-2 COMMONWEALTH OF VIRGINIA
M/WBE CONSTRUCTION SUBCONTRACTOR IN THE COMMONWEALTH OF VIRGINIA
UTILIZATION, AVAILABILITY AND DISPARITY JULY 1, 2006 THROUGH JUNE 30, 2009
Business CategoryAfrican
American
Hispanic
American
Asian
American
Native
American
Nonminority
WomenTotal M/WBE
Construction Subcontractors
Utilization Dollars $3,879,522 $8,456,150 $2,207,975 $133,500 $8,558,311 $23,235,457
Utilization Percent 2.39% 5.22% 1.36% 0.08% 5.28% 14.33%
Availability Percent 7.92% 5.94% 2.23% 1.24% 16.09% 33.42%
Disparity YES YES YES YES YES
Source: Subcontractor; Utilization and disparity findings are taken from the exhibit previously shown in Chapters 4.0 and 5.0. Availability is based on custom census. Bold substantial disparity
FINDING 7-4: M/WBE Prime Utilization, Availability, and Disparity for Universities
The findings based self-reported universities data is presented below:
Construction. M/WBE firms received $25.1 million (1.73 percent of the total prime construction dollars reported by the universities). In terms of absolute dollars, nonminority women-owned firms were most successful receiving more $15.9 million (1.10%) of the construction dollars, followed by firms owned by African Americans receiving more than $4.8 million (.34%). Based on the universities self-reported data, there was overall substantial disparity in the utilization of all M/WBE groups, except by George Mason University and Virginia Commonwealth Universities where there was overutilization of available Hispanic American- and nonminority women-owned firms, respectively.
Architecture and Engineering. M/WBE firms received $5.5 million (2.60 percent of the total prime architecture and engineering dollars reported by the universities). In terms of absolute dollars, nonminority women-owned firms were most successful receiving more $4.8 million (2.23%) of the dollars, followed by firms owned by Asian Americans receiving less than $414,000 (.19%). Based on the universities self-reported data, there was overall substantial disparity in the utilization of all M/WBE groups, except by George Mason University where there was overutilization of available African American-owned firms.

Findings and Recommendations
Page 7-5
Professional Services. M/WBE firms received $8.1 million (2.71 percent of the total prime professional services dollars reported by the universities). In terms of absolute dollars, nonminority women-owned firms were most successful receiving slightly more than $4.4 million (1.51%)of the dollars, followed by firms owned by Asian Americans receiving less than $2 million (.68%). Based on the universities self-reported data, there was overall substantial disparity in the utilization of all M/WBE groups, except by Old Dominion University where there was overutilization of available Hispanic American-owned firms.
Other Services. M/WBE firms received $38.9 million (6.83 percent of the total prime other services dollars reported by the universities). In terms of absolute dollars, nonminority women-owned firms were most successful receiving more than $21.4 million (3.76%) of the dollars, followed by firms owned by Asian Americans receiving more than $11.9 million (2.10%). Based on the universities self-reported data, there was overall substantial disparity in the utilization of all M/WBE groups, except by George Mason University where there was overutilization of available Asian American-owned firms.
Goods and Supplies. M/WBE firms received $58.4 million (4.79 percent of the total prime goods and supplies dollars reported by the universities). In terms of absolute dollars, nonminority women-owned firms were most successful receiving more than $41 million (3.37%) of the dollars, followed by firms owned by Asian Americans receiving more than $11.4 million (.94%). Based on the universities self-reported data, there was overall substantial disparity in the utilization of all M/WBE groups, except by , the College of William and Mary, George Mason University, Old Dominion University, and Virginia Polytechnic Institute and State University (Virginia Tech) where there was overutilization of available Asian American-owned firms. There was also overutilization of available African American-owned firms by Old Dominion University.
FINDING 7-5: Self-Employment Evidence An analysis of American Community Survey data from 2007 found statistically significant disparities in earnings from and entry into self employment for women and minorities in the Commonwealth after controlling for education, age, wealth, and other variables as compared to nonminority males. The percentage of the self-employed nonminority males was close to two times that of self-employed African Americans, Hispanic Americans, and women. After controlling for education, age, wealth, and other determinants of self-employment, there were generally statistically significant differences for entry into self-employment for African Americans, Hispanic Americans, Asian Americans, and women for all industries except construction.
FINDING 7-6: Private Sector Commercial Construction Evidence MGT collected data on private sector commercial construction from major cities in the Commonwealth. From the available evidence, there was a significant difference in absolute and percentage terms between M/WBE subcontractor utilization on Commonwealth projects and in private sector commercial construction, where there is no SWaM program. M/WBE subcontractor utilization was about 14 percent on Commonwealth projects as compared to

Findings and Recommendations
Page 7-6
less than 0.25 percent on private sector commercial projects. M/WBE prime utilization in Reed Construction Data (RCD) for commercial construction projects was 0.51 percent.
FINDING 7-7: Disparities in the Survey of Business Owners Data
There was evidence of disparities based on the 2002 Survey of Business Owners from the U.S. Census Bureau for the Commonwealth:
Construction Firms. Minority-owned firms had 3.1 percent of sales in the Commonwealth, and revenue per firm was 47.2 percent of the market place average.1
Professional Services Firms. Minority-owned firms had 9.1 percent of sales in the Commonwealth, and revenue per firm was 77.4 percent of the market place average. Nonminority women-owned firms had 4.3 percent of sales, and revenue per firm was 23.2 percent of the market place average.
Other Services Firms. Minority-owned firms had 7.3 percent of sales in the Commonwealth, and revenue per firm was 47.6 percent of the market place average. Nonminority women-owned firms had 11.8 percent of sales, and revenue per firm was 64.8 percent of the market place average.
7.2 Findings for the Commonwealth SWaM Program
FINDING 7-8: SWaM Policy
The Commonwealth has a 40 percent aspirational goal for SWaM utilization. The primary Commonwealth preferences are SWaM set asides contracts under $50,000 and SWaM subcontracting plans for contracts in excess of $100,000. In addition, the Commonwealth discourages purchases off of cooperative contracts if there are SWaM vendors available with reasonable prices, and encourages breaking up large contracts to facilitate SWaM utilization.
FINDING 7-9: SWaM Program Data
The SWaM Program’s Dashboard, Analytics, and Reporting System (Dashboard) reports SWaM spending by minority-owned, women-owned, and small business enterprises (MBE, WBE, and SBE) status; by month, quarter, and year; by secretariat; by ethnicity; by functional area (transportation, professional services, information technology, goods, architecture and engineering, finance, and construction); and by top vendors.
FINDING 7-10: Business Development
The Commonwealth has a number of relationships with business development efforts, including five DMBE business development specialists, Virginia Department of Business Assistance business development programs, and partnerships with local business development organizations.
1 Data was not available in the 2002 census on the sales on construction firms owned by nonminority females in
Virginia.

Findings and Recommendations
Page 7-7
FINDING 7-11: Access to Capital Assistance
The Virginia Small Business Financing Authority has a number of small business finance programs. The PACE program, which targeted disadvantaged entrepreneurs, is no longer funding new loans.
FINDING 7-12: Commercial Anti-discrimination Rules
The Commonwealth has a business anti-discrimination statute.2
7.3 Commendations and Recommendations
Commendations and Recommendations for Race-Neutral Alternatives
COMMENDATION 7-1: Outreach*
The Commonwealth should be commended for its outreach efforts, including sponsoring workshops around the state; Memoranda of Understanding with local governments and private businesses, partnerships with business development organizations, posting opportunities on the Web, and SWaM Fest.
RECOMMENDATION 7-2: Vendor Rotation*
The Commonwealth should consider the selective use of vendor rotation to expand utilization of underutilized M/WBE groups. Some political jurisdictions use vendor rotation arrangements to limit habitual repetitive purchases from incumbent nonminority firms and to ensure that S/M/WBEs have an opportunity to bid along with nonminority firms. Generally, a diverse team of firms are prequalified for work and then alternate undertaking projects. A number of agencies, including the city of Indianapolis, Indiana; Fairfax County, Virginia; and Miami-Dade County, Florida, use vendor rotation to encourage utilization of underutilized M/WBE groups, particularly in professional services.
COMMENDATION AND RECOMMENDATION 7-3: SWaM Program for Prime Contracts*
The Commonwealth should be commended for having a small business enterprise (SBE) program. A strong small business program is central to maintaining a narrowly tailored program to promote M/WBE utilization. In particular, the Commonwealth should continue to focus on increasing M/WBE utilization through the SBE program. The Commonwealth does not face constitutional restrictions on its SBE program, only those procurement restrictions imposed by Commonwealth law. Specific suggestions for the Commonwealth’s SBE program can be found in features of other small business programs around the United States, including:
Setting aside construction projects up to $500,000 (North Carolina Department of Transportation).
Setting aside small financial consulting projects (Port Authority of New York and New Jersey SBE Program).
2 Code of Virginia, § 2.2-4310A.
Findings and Recommendations
Page 7-8
Providing bid preferences to SBEs in bidding on contracts (Miami-Dade County, Florida, Community SBE Program; Port Authority of New York and New Jersey SBE Program; East Bay Municipal Utility District Contract Equity Program, Port of Portland).3
Setting SBE goals on formal and informal contracts (City of Charlotte, North Carolina, SBE Program).
Setting department goals for SBE utilization (City of Charlotte, North Carolina, SBE Program).
Access to low cost insurance on small projects (City of San Diego, California, Minor Construction Program).
Reducing bonding requirements on construction contracts under $500,000 (North Carolina Department of Transportation).
Providing bid preferences to SBEs on tax-assisted projects (City of Oakland, California, Local Small Business Enterprise Program, and Port of Portland Emerging Small Business Program).
Mentor-protégé programs for small businesses (Port of Portland Emerging Small Business Program).
COMMENDATION 7-4: SBE Program for Subcontracts
The Commonwealth should be commended for having a statute allowing for SWaM subcontractor goals.
RECOMMENDATION 7-5: Geographical Preferences and HUBZones
The federal HUBZone program is another variant of an SBE program that provides incentives for SBEs located in distressed areas. For example, under the 1997 Small Business Reauthorization Act, the federal government started the federal HUBZone program. To qualify as a HUBZone firm, a small business must meet the following criteria: (1) it must be owned and controlled by U.S. citizens; (2) at least 35 percent of its employees must reside in a HUBZone; and (3) its principal place of business must be located in a HUBZone.4 The same preferences that can be given to SBEs can be given to HUBZone firms, such as contract set-asides.
HUBZone programs can serve as a vehicle for encouraging M/WBE contract utilization. In the Commonwealth, there are 197 women- and minority-owned HUBZone firms, representing 52.4 percent of total HUBZone firms.5 Over 85 percent of Virginia M/WBE HUBZone firms had revenue in excess of $5 million. Two-thirds of the Virginia M/WBE HUBZone construction firms had bonding levels in excess of $1 million.
3 The Port of Portland found that 10 percent bid preferences were more effective than 5 percent bid preferences.
4 13 C.F.R. 126.200 (1999).
5 Based on the SBA pro-net database located at http://dsbs.sba.gov/dsbs/search/dsp_dsbs.cfm.

Findings and Recommendations
Page 7-9
COMMENDATION AND RECOMMENDATION 7-6: Commercial Anti-discrimination Rules* The Commonwealth should be commended for having a commercial anti-discrimination policy. Some courts have noted that establishing anti-discrimination rules is an important component of race-neutral alternatives. Features of a complete anti-discrimination policy selected from other entities include:
Submission of a business utilization report on M/WBE subcontractor utilization.
Review of the business utilization report for evidence of discrimination.
A mechanism whereby complaints may be filed against firms that have discriminated in the marketplace.
Due process, in terms of an investigation by agency staff.
A hearing process before an independent hearing examiner.
An appeals process to the agency manager and, ultimately, to a court.
Imposition of sanctions, including:
Disqualification from bidding with the agency for up to five years. Termination of all existing contracts. Referral for prosecution for fraud.
COMMENDATION AND RECOMMENDATION 7-7: Business Development Assistance* The Commonwealth should be commended for its business development initiatives. The Commonwealth should evaluate the impact of these initiatives on SWaM utilization. the Commonwealth should follow the example of the Port Authority of New York and New Jersey, for which management and technical assistance contracts have been structured to include incentives for producing results, such as increasing the number of M/WBEs being registered as qualified vendors with the port, and increasing the number of M/WBEs graduating from subcontract work to prime contracting. M/WBE Policy Commendations and Recommendations
RECOMMENDATION 7-8: Narrowly Tailored S/M/WBE Program
This study provides evidence to support the establishment of a moderate program to promote M/WBE utilization. This conclusion is based primarily on statistical disparities in current M/WBE utilization, particularly in subcontracting; substantial disparities in the private marketplace, evidence of discrimination in business formation, and revenue earned from self-employment; and some evidence of passive participation in private sector disparities. The factual predicate evidence would be more complete with more anecdotal evidence of discrimination, if any. The Commonwealth should tailor its women and minority participation policy to remedy each of these specific disparities.
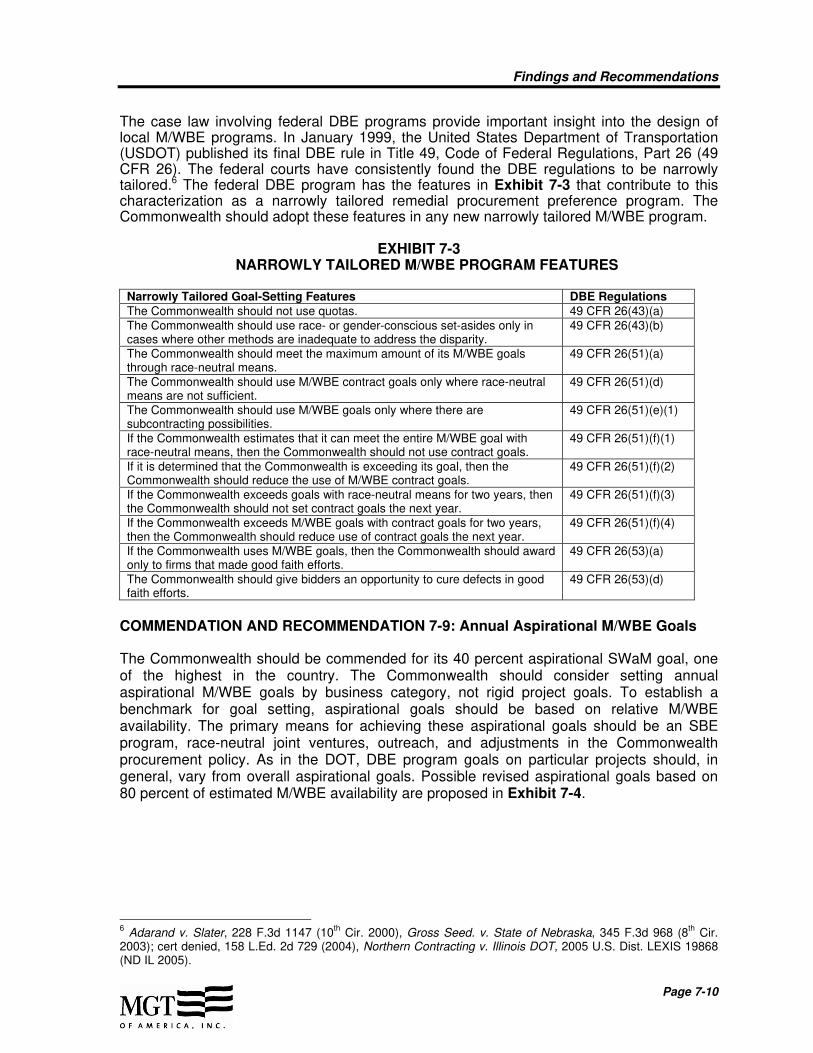
Findings and Recommendations
Page 7-10
The case law involving federal DBE programs provide important insight into the design of local M/WBE programs. In January 1999, the United States Department of Transportation (USDOT) published its final DBE rule in Title 49, Code of Federal Regulations, Part 26 (49 CFR 26). The federal courts have consistently found the DBE regulations to be narrowly tailored.6 The federal DBE program has the features in Exhibit 7-3 that contribute to this characterization as a narrowly tailored remedial procurement preference program. The Commonwealth should adopt these features in any new narrowly tailored M/WBE program.
EXHIBIT 7-3 NARROWLY TAILORED M/WBE PROGRAM FEATURES
Narrowly Tailored Goal-Setting Features DBE RegulationsThe Commonwealth should not use quotas. 49 CFR 26(43)(a) The Commonwealth should use race- or gender-conscious set-asides only in cases where other methods are inadequate to address the disparity.
49 CFR 26(43)(b)
The Commonwealth should meet the maximum amount of its M/WBE goals through race-neutral means.
49 CFR 26(51)(a)
The Commonwealth should use M/WBE contract goals only where race-neutral means are not sufficient.
49 CFR 26(51)(d)
The Commonwealth should use M/WBE goals only where there are subcontracting possibilities.
49 CFR 26(51)(e)(1)
If the Commonwealth estimates that it can meet the entire M/WBE goal with race-neutral means, then the Commonwealth should not use contract goals.
49 CFR 26(51)(f)(1)
If it is determined that the Commonwealth is exceeding its goal, then the Commonwealth should reduce the use of M/WBE contract goals.
49 CFR 26(51)(f)(2)
If the Commonwealth exceeds goals with race-neutral means for two years, then the Commonwealth should not set contract goals the next year.
49 CFR 26(51)(f)(3)
If the Commonwealth exceeds M/WBE goals with contract goals for two years, then the Commonwealth should reduce use of contract goals the next year.
49 CFR 26(51)(f)(4)
If the Commonwealth uses M/WBE goals, then the Commonwealth should award only to firms that made good faith efforts.
49 CFR 26(53)(a)
The Commonwealth should give bidders an opportunity to cure defects in good faith efforts.
49 CFR 26(53)(d)
COMMENDATION AND RECOMMENDATION 7-9: Annual Aspirational M/WBE Goals
The Commonwealth should be commended for its 40 percent aspirational SWaM goal, one of the highest in the country. The Commonwealth should consider setting annual aspirational M/WBE goals by business category, not rigid project goals. To establish a benchmark for goal setting, aspirational goals should be based on relative M/WBE availability. The primary means for achieving these aspirational goals should be an SBE program, race-neutral joint ventures, outreach, and adjustments in the Commonwealth procurement policy. As in the DOT, DBE program goals on particular projects should, in general, vary from overall aspirational goals. Possible revised aspirational goals based on 80 percent of estimated M/WBE availability are proposed in Exhibit 7-4.
6 Adarand v. Slater, 228 F.3d 1147 (10
th Cir. 2000), Gross Seed. v. State of Nebraska, 345 F.3d 968 (8
th Cir.
2003); cert denied, 158 L.Ed. 2d 729 (2004), Northern Contracting v. Illinois DOT, 2005 U.S. Dist. LEXIS 19868 (ND IL 2005).

Findings and Recommendations
Page 7-11
EXHIBIT 7-4 PROPOSED M/WBE ASPIRATIONAL GOALS
COMMONWEALTH OF VIRGINIA BY PROCUREMENT CATEGORY
Business Category % of Utilization % of Available Aspirational
by M/WBE Classification Dollars Firms Goals (%)
Construction Prime Contractors
African Americans 0.58% 3.10% 2.00%
Hispanic Americans 0.75% 2.40% 2.00%
Asian Americans 0.09% 1.53% 1.00%
Native Americans 0.05% 0.45% 0.00%
Nonminority Women 0.41% 7.68% 6.00%
Construction Subcontractors*
African Americans 2.39% 7.92% 6.00%
Hispanic Americans 5.22% 5.94% 5.00%
Asian Americans 1.36% 2.23% 2.00%
Native Americans 0.08% 1.24% 1.00%
Nonminority Women 5.28% 16.09% 13.00%
Architecture & Engineering Prime
Consultants
African Americans 0.17% 2.77% 2.00%
Hispanic Americans 0.04% 2.19% 2.00%
Asian Americans 0.26% 3.93% 3.00%
Native Americans 0.00% 1.06% 1.00%
Nonminority Women 0.88% 9.54% 8.00%
Professional Services Consultants
African Americans 1.14% 3.23% 3.00%
Hispanic Americans 0.15% 2.14% 2.00%
Asian Americans 0.92% 7.15% 6.00%
Native Americans 0.00% 0.60% 0.00%
Nonminority Women 0.12% 21.70% 17.00%
Other Services Vendors
African Americans 3.37% 7.17% 6.00%
Hispanic Americans 1.06% 3.51% 3.00%
Asian Americans 0.36% 5.65% 5.00%
Native Americans 0.54% S N/A
Nonminority Women 0.75% 22.26% 18.00%
Goods and Supplies Vendors
African Americans 0.41% 1.96% 2.00%
Hispanic Americans 0.16% 7.67% 6.00%
Asian Americans 2.14% 0.89% 1.00%
Native Americans 0.01% S N/A
Nonminority Women 0.24% 20.65% 17.00% Source: Availability estimates are based on census data. *of total subcontract dollar value

Findings and Recommendations
Page 7-12
RECOMMENDATION 7-10: Joint Ventures The Commonwealth should consider adopting a joint venture policy similar to the one implemented by the city of Atlanta, Georgia. The city of Atlanta requires establishment of joint ventures on large projects of over $10 million.7 Primes are required to joint venture with a firm from a different ethnic/gender group in order to ensure prime contracting opportunities for all businesses. This rule applies to women- and minority-owned firms as well as nonminority-owned firms. This rule has resulted in tens of millions of dollars in contract awards to women- and minority-owned firms.
RECOMMENDATION 7-11: M/WBE Subcontractor Plans*
The Commonwealth should consider establishing the M/WBE good faith effort goal requirements in its contracts. The basis for good faith efforts requirements is significant disparities in construction subcontracting, the very low utilization in private sector commercial construction, and other evidence of private sector disparities, even after controlling for capacity and other race-neutral variables. The core theme should be that prime contractors should document their outreach efforts and the reasons why they may have rejected qualified M/WBEs that were the low-bidding subcontractors. Accordingly, the following narrow tailoring elements should be considered:
1. Good faith effort requirements should apply to both M/WBE and nonminority prime contractors.
2. Projects goals should vary by project and reflect realistic M/WBE availability for particular projects.
3. A documented excessive subcontractor bid can be a basis for not subcontracting with an M/WBE.
4. A documented record of poor performance can be a basis for not subcontracting with an M/WBE.8
RECOMMENDATION 7-12: RFP Language*
The Commonwealth should consider putting in its RFPs, particularly for large projects, language asking proposers about their strategies for M/WBE inclusion on the project. A number of agencies, including the Port Authority of New York and New Jersey, have had success in soliciting creative responses to these requests, even in areas such as large-scale insurance contracts.
RECOMMENDATION 7-13: Economic Development* The Commonwealth should consider extending the SWaM program to economic development projects. Jersey City, New Jersey, and the city of Saint Paul, Minnesota, have established offices that focus on employment and SWaM utilization on economic development projects. San Antonio, Texas, and Bexar County, Texas, also have very active SWaM initiatives for development projects that receive tax subsidies.
7 City of Atlanta Ordinance Sec. 2-1450 and Sec. 2-1451.
8 The last two elements were adopted by the North Carolina Department of Transportation (NCDOT). 19A NCAC
02D.1110(7).

Findings and Recommendations
Page 7-13
COMMENDATION AND RECOMMENDATION 7-14: Certification* DMBE should be commended for its joint certification efforts with local jurisdictions in the Commonwealth and the significant increase in productivity and efficiency in SWaM certification. The Commonwealth should also be commended for developing uniform size standards for SBEs. Two-Tier Size Standards. The federal case law points to the use of size standards and net worth requirements as one factor in the narrow tailoring of remedial procurement programs. At present, the Commonwealth uses its own size standard. Size standards for remedial procurement programs still face a dilemma. If the size standard is placed too high, large firms crowd out new firms. If the size standard is placed too low, too many experienced firms lose the advantages of the remedial program. One solution to this dilemma is to adopt a two-tier standard for M/WBE and SBE certification. The states of Oregon and New Jersey and the federal government use a two-tier size standard. Thus, for example, contracts could be set aside for small and very small firms and goals that included very large S/M/WBEs could be established on large projects. A standard approach is to use the SBA size standard for small firms and a percentage of the SBA size standard (for example, 25 or 50 percent) for very small firms.
Socially and Economically Disadvantaged Firms. The Commonwealth should consider adding socially and economically disadvantaged firms to its definition of Targeted Groups. The North Carolina M/WBE program has this feature. Program Participation Limits. Another graduation provision is to restrict the overall amount of dollars a program participant can receive. For example, the city of New York graduates firms that have received more than $15 million in prime contracts within the past three years.9
COMMENDATION AND RECOMMENDATION 7-15: SWaM Program Data Management
The Commonwealth has made significant strides in improving data capture of SWaM utilization since the last disparity study through the Dashboard, the Commonwealth’s Accounting and Reporting System (CARS) system, and Commonwealth’s DMBE certification vendor list. Some work still remains to be done in the completeness of the subcontracting data by functional area. The Commonwealth needs better tracking of subcontractor data outside of construction. It is important for the Commonwealth to closely monitor the utilization of all businesses by race, ethnicity, and gender, and by prime and subcontractor utilization, over time to determine whether the Commonwealth’s SWaM policy has the potential to eliminate race and gender disparities without applying specific race and gender goals.
COMMENDATION AND RECOMMENDATION 7-16: Performance Measures* The Commonwealth should be commended for adopting performance measures throughout its SWAM program and as part of its agency strategic plan. Some suggested additional measures come from the Florida Department of Transportation’s Small Business Initiative (discussed in the best practices section of this chapter). The Commonwealth should develop 9 Local Laws of New York, Section 6-1292 (c) (17).

Findings and Recommendations
Page 7-14
additional measures to gauge the effectiveness of its efforts. Possible other measures include:
Growth in the number of SWaMs winning their first award from the Commonwealth.
Growth in percentage of SWaM utilization by the Commonwealth.
Growth in SWaM prime contracting.
Growth in number SWaM subcontractors becoming prime contractors.
Number of SWaMs that receive bonding.
Number of SWaMs that successfully graduate from the program.
Number of graduated firms that successfully win Commonwealth projects.
Percentage of SWaM utilization for contracts not subject to competitive bidding requirements.
Growth in the number of SWaMs utilized by the Commonwealth.
Number of joint ventures involving SWaMs.
Largest contract won by an SWaM.
Comparability in annual growth rates and median sales for SWaMs and non-SWaMs in Commonwealth contracts.
7.4 Selected Best Practices
7.4.1 SBE Set-Asides North Carolina Department of Transportation (NCDOT). In the NCDOT program, small contractors are defined as firms with less than $1.5 million in revenue. There is a small contractor goal of $2 million for each of the 14 NCDOT divisions. The current cap on project size for small contractors is $500,000. For contracts less than $500,000, NCDOT can solicit three informal bids from small business enterprises.10 North Carolina law permits the waiving of bonds and licensing requirements for these small contracts let to SBEs.11 In 2002, M/WBEs won over 35 percent of SBE contract awards. 12
7.4.2 Other SBE Prime Contractors Assistance
North Carolina Department of Transportation Fully Operated Rental Agreements. Under these arrangements, a firm may bid an hourly rate for using certain equipment and the necessary staff. In these field-let contracts, engineers select the firm with the appropriate
10
NCGS § 136-28.10(a). 11
NCGS § 136-28.10(b. 12
NCDOT, Small Business Enterprise Program (April 1, 2002).
Findings and Recommendations
Page 7-15
equipment and the lowest bid rate. If that firm is not available, the engineers select the next lowest hourly rate. This rental agreement technique is used primarily to supplement NCDOT equipment in the event of NCDOT equipment failure or peak demand for NCDOT services. The rental agreement technique is attractive to small contractors because the typical small firm has much better knowledge of its own hourly costs than it does of the costs to complete an entire project.
Florida Department of Transportation (Florida DOT) Business Development Initiative. The Florida DOT has just undertaken a stepped-up small business initiative with the following principle components:
Reserving certain construction, maintenance, and professional services contracts for small businesses.
Providing bid preference points to small businesses, and to firms offering subcontracts to small businesses on professional services contracts.
Waiving performance and bid bond requirements for contracts under $250,000.
Using a modified pre-qualification process for certain construction and maintenance projects.
Port Authority of New York and New Jersey Financial Advisors Program. The Port Authority has encouraged the use of M/WBEs in finance through its financial advisory call-in program which targets small firms to serve as a pool of advisors for the Port Authority Chief Financial Officer. The financial advisors address debt issuance, financial advisory services, real estate transactions, and green initiatives. There are three to four firms in each of these categories in the financial advisory call-in program.
7.4.3 DBE Programs Following the federal model, some agencies have added disadvantaged business enterprise (DBE) programs.13 SBE programs focus on the disadvantage of the business, HUBZone programs focus on the disadvantage of the business location, and DBE programs focus on the disadvantage of the individual operating the business. State of North Carolina. The state of North Carolina changed the definition of minority used in the state minority construction program to include socially and economically disadvantaged individuals, as defined in the federal rules.14 Socially disadvantaged individuals are those who have been subjected to racial or ethnic prejudice or cultural bias because of their identity as a member of a group without regard to their individual qualities.15 Economically disadvantaged individuals are those socially disadvantaged individuals whose ability to compete in the free enterprise system has been impaired due to diminished capital and credit opportunities as compared to others in the same business area that are not socially disadvantaged.16 This rule permits firms certified under the federal 8(a), DBE, and small disadvantaged business enterprise (S/DBE) programs to be certified as a minority firm
13
DBE programs and Airport Concession Disadvantaged Enterprise (ACDBE) programs are required to be developed and implemented as a part of the federal funding process. 14
NC GS § 143-128.2(g). 15
15 USC 637(a)(5). 16
15 USC 637(a)(6)(A).

Findings and Recommendations
Page 7-16
in North Carolina. This rule also implies that firms owned by majority males are eligible for the program as there are firms owned by majority males that qualify for the 8(a), DBE, and S/DBE programs by making an individual showing of their social and economic disadvantage.
Milwaukee Emerging Business Enterprise Program. The city of Milwaukee, Wisconsin, defines disadvantage along six dimensions:
Disadvantage with respect to education.
Disadvantage with respect to location.
Disadvantage with respect to employment.
Social disadvantage (lack of traditional family structure, impoverished background, and related issues).
Lack of business training.
Economic disadvantage (credit issues, inability to win contracts, and related issues).
The city of Milwaukee defines an emerging business as a business owned by an individual satisfying the sixth dimension of disadvantage and three out of the five other dimensions of disadvantage.17 The city of Milwaukee has set a goal of 18 percent spending with emerging businesses, including both prime contracting and subcontracting.
7.4.4 Bidder Rotation Some political jurisdictions use bidder rotation schemes to limit habit purchases from majority firms and to ensure that M/WBEs have an opportunity to bid along with majority firms. A number of agencies, including the city of Indianapolis, Indiana; Fairfax County, Virginia; the Port Authority of New York and New Jersey; and Miami-Dade County, Florida, use bid rotation to encourage M/WBE utilization, particularly in architecture and engineering. Some examples of bidder rotation from other agencies include:
Miami-Dade County, Florida. Miami-Dade County uses small purchase orders for the Community Business Enterprise program and rotates on that basis. In addition, Miami-Dade County utilizes an Equitable Distribution Program, whereby a pool of qualified architecture and engineering professionals are rotated awards of county miscellaneous architecture and engineering services as prime contractors and subcontractors.
DeKalb County, Georgia. DeKalb County has used a form of bidder rotation called a bidder box system to promote M/WBE utilization. This system selects a group of bidders from the list of county registered vendors to participate in open market procurements. Under the bidder rotation system, the buyer identifies the commodity or service by entering an item box number. Using this item box, the computer selects five to six firms. The lowest responsible bidder is awarded the contract. M/WBEs were afforded an increased number of bid opportunities than would ordinarily be the case with a sequential selection process.
17
Milwaukee Ordinance, Emerging Business Enterprise Program, 360-01 (12).
Findings and Recommendations
Page 7-17
7.4.5 Contract Sizing The United States’ Office of Management and Budget (OMB) Contract Bundling Report advocates limiting the use of contract bundling to those instances where there are considerable and measurable benefits such as decreased time in acquisition, at least 10 percent in cost savings, or improved contract terms and conditions.18
7.4.6 Race-Neutral Joint Ventures
Atlanta, Georgia. The city of Atlanta requires establishment of joint ventures on large projects of over $10 million.19 Primes are required to create a joint venture with a firm from a different ethnic/gender group in order to ensure prime contracting opportunities for all businesses. This rule applies to women- and minority-owned firms as well as nonminority firms. This rule has resulted in tens of millions of dollars in contract awards to women- and minority-owned firms.
Washington Suburban Sanitation Commission (WSSC). The WSSC Competitive Business Demonstration Project requires joint ventures between a local SBE and an established firm in procurement areas that do not generate enough bids.
7.4.7 Project Goal Setting
North Carolina Department of Transportation. The NCDOT regulations emphasize that goals should be set on projects “determined appropriate by the Department [of Transportation].”20 Individual goals are set based on a project’s geographic location, characteristics of the project, the percentage of that type of work that is typically performed by M/WBEs, the areas in which M/WBEs are known to provide services, and the goals set by the North Carolina General Assembly.21 The NCDOT M/WBE regulations specify (although they do not limit to) particular areas for M/WBE goals: clearing and grubbing, hauling and trucking, storm drainage, concrete and masonry construction, guardrail, landscaping, erosion control, reinforcing steel, utility construction, and pavement marking.
The NCDOT goal setting process begins with an engineering estimate of the project to determine what items might reasonably be subcontracted out. Next, estimates of the percentage of work that could be potentially performed by DBEs and M/WBEs are developed.22 These estimates are confidential and made available only to the estimator (and staff), the provisions engineer in the proposals and contracts section (and staff), and members of the M/W/DBE committee at the M/W/DBE committee meetings. Next, NCDOT looks at whether there are M/WBEs available based on the NCDOT M/W/DBE directory and the location of the project. The NCDOT directory is a searchable database that classifies firms by location, prime contractor/subcontractor status, and six-digit
18
Office of Management and Budget, "Contract Bundling—A Strategy for Increasing Federal Contracting Opportunities for Small Business" (October 2002). 19
City of Atlanta Ordinance Sec. 2-1450 and Sec. 2-1451. 20
19A NCAC 02D.1108(a). 21
19A NCAC 02D.1108(a). 22
NCDOT, Division of Highways, Roadway Design and Design Services Unit, Policy and Procedure Manual, Chapter 10, at 4.

Findings and Recommendations
Page 7-18
work type.23 The Goal Setting Committee is assisted in this process by Equal Employment Opportunity (EEO) Compliance staff in the Office of Civil Rights.
Prime contractors then submit documentation of good faith efforts to achieve the individual project goal. A statement of how they will make efforts to achieve the goal satisfies the good faith effort requirements.
The NCDOT Goal Setting Committee (in collaboration with the EEO Compliance staff) seeks to set goals relative to where there is interest, availability, and capacity, beyond mere looking at the certification lists. NCDOT relies on the EEO Compliance staff to provide input on whether existing businesses are fully occupied. However, if EEO Compliance says M/WBEs are not fully occupied, but prime contractors submit evidence that M/WBEs are fully occupied (for example, with invoices), then NCDOT accepts those explanations.
As part of goal setting, NCDOT regulations provide that:
A documented excessive subcontractor bid constitutes a basis for not subcontracting with an M/WBE.
A documented record of poor experience constitutes a basis for not subcontracting with an M/WBE.24
In addition, a review of NCDOT DBE and M/WBE goals has been a regular topic at the Associated General Contractors (AGC)-DOT Joint Cooperative Committee meetings.25
Brokerage and Investment Management Services – The state of Maryland, in its new Use of Minority Enterprises law, requires several publicly funded entities—the State Treasurer, the Maryland Automobile Insurance Fund (MAIF), the Injured Workers’ Insurance Fund (IWFI), and the State Retirement and Pensions System (SRPS)—to utilize M/WBEs for investment management and brokerage services for a percentage of their $40 billion in assets. 7.4.8 Subcontractor Disclosure and Substitution
State of Oregon. Under Oregon law, bidders are required to disclose first-tier subcontractors that will be furnishing labor for the project and have a contract value greater than or equal to 5 percent of the bid or $15,000 (whichever is greater), or $350,000 regardless of the percentage of the total project.26 First-tier subcontractor disclosure does not apply to contracts below $100,000, or contracts exempt from competitive bidding requirements.27 Bidders are not required to disclose the race or gender of the first-tier subcontractors.
Bidders are allowed to substitute subcontractors.28 The subcontractor substitution statute provides standards sufficient for cause regarding subcontractor substitution, including subcontractor bankruptcy, poor performance, inability to meet bonding requirement,
23
http://apps.dot.state.nc.us/constructionunit/directory/. 24
The last two elements are adopted by the North Carolina DOT. 19A NCAC 02D.1110(7). 25
AGC-DOT Joint Cooperative Committee Meeting Minutes, February 2001 through August 2003. 26
ORS § 279C.370(1)(a)(A),(B). 27
ORS § 279C.370(1)(c),(d). 28
ORS § 279C.370(5), ORS § 279C.585.

Findings and Recommendations
Page 7-19
licensing deficiencies, ineligibility to work based upon applicable statutes, and for “good cause” as defined by the Construction Contractors Board.29 The statute provides a process by which subcontractors can issue complaints about substitutions. Violation of subcontractor substitution rules may result in civil penalties.30
7.4.9 Economic Development Projects
A number of cities (including Atlanta, Georgia; Jersey City, New Jersey; and Saint Paul, Minnesota) have encouraged private sector M/WBE utilization by one of two methods: (1) asking prospective bidders to report their private sector M/WBE utilization, and (2) setting aspirational goals for private sector projects with significant city tax incentives, such as tax allocation districts and community improvement districts. The city of Oakland, California, Local Small Business Enterprise Program also provides bid preferences to SBEs on tax-assisted projects. Saint Paul and Jersey City have separate offices negotiating, tracking, and managing M/WBE participation on development projects. Bexar County Tax Phase-In Agreements. S/M/WBE participation was added to the county tax incentive policy in 2004. The county currently considers tax abatements of up to 40 percent on qualified real property improvements and new personal property investment.31 Property taxes are 80 percent of county revenue. The county considers an increased property tax abatement of up to 80 percent based on other project criteria. This criteria includes hiring 25 percent of positions created with county residents, hiring 25 percent economically disadvantaged or dislocated individuals, practicing sound environmental practices, and dividing work to the extent practical to assist S/M/WBEs in obtaining contracts. Applicants are encouraged to award 20 percent of projects to M/WBEs and 30 percent to certified small businesses.32 Currently, there are no similar S/M/WBE policies for tax increment financing (TIFs).33 In the Tax Phase-In Agreement for Lowe’s Home Centers, Lowe’s agreed to:
Use good faith efforts to include certified M/WBEs. Work in good faith to set construction and operational services goals for M/WBEs
based on M/WBE availability. Establish a mutually agreed upon M/WBE reporting format.
The agreement acknowledged that although Lowe’s still has national contracts it must comply with, and retained the right to choose any vendor, they have agreed to explore subcontracting opportunities.34
29
ORS § 279C.585. 30
ORS § 279C.590. 31
The County Tax Phase-In Policy is currently being revised. 32
Bexar County Economic Development & Special Programs Office, Tax Phase-In Guidelines for Bexar County and the City of San Antonio, Effective June 15, 2006 through June 14, 2008, adopted February 28, 2006. Not all agreements include S/M/WBE objectives. For examples, the Kautex Tax Phase In Agreement did not address S/M/WBE policy. See Bexar County, Tax Phase-In Agreement (Kautex), December 20, 2005. 33
Bexar County, Texas, Tax Increment Financing and Reinvestment Zone (TIF/TIRZ), Guidelines and Criteria, Commissioner’s Court Amended and Approved: August 23, 2005. 34
Bexar County, Tax Phase-In Agreement (Lowe’s), June 27, 2006, Exhibit E.
Findings and Recommendations
Page 7-20
In the HEB Grocery Tax Phase-In Agreement, HEB Grocery committed to 20 percent M/WBE participation and 10 percent SBE participation.35 This was in addition to agreeing to hire 25 percent from Bexar County and 25 percent from economically disadvantaged or dislocated workers. 7.4.10 Insurance A number of agencies use wrap up insurance on construction projects to lower insurance costs for contractors.
Port Authority of New York and New Jersey. The Port Authority uses a Contractor Insurance Program (CIP), a form of wrap-up insurance under which the Port Authority provides various insurance coverages to approved onsite contractors and subcontractors for construction contracts. In particular, the Port Authority buys and pays the premiums on public liability insurance ($25 million per occurrence), builders’ risk insurance, and workers’ compensation and employers’ liability insurance. In general, the CIP can reduce an owner’s project costs by an average of 1 to 2 percent compared to traditional contractor procured insurance programs. The Port Authority CIP does help alleviate overcoming barriers of insurance costs to M/WBE participation in Port Authority construction projects.
Port of Portland, Oregon. The port has made noteworthy efforts to address barriers to small firms from insurance requirements. A Port Process Management sub-group met on insurance barriers and issued a white paper in August of 2003. The sub-group identified insurance barriers in the areas of insurance in excess of associated risk, complex language, difficulties in small firms obtaining blanket insurance certificates, and additional costs for on-call contractors. The sub-group identified low risk consultant areas that did not require insurance, simplified insurance language, altered some blanket insurance coverage requirements, clarified what could be met with primary and excess insurance, proposed simplifying the port indemnity, and proposed sending appropriate insurance requirements in sample contracts attached to RFPs and Requests for Quotations (RFQs). The port also looked at a cooperative insurance program for small business although there was not much success with this initiative. 7.4.11 Size Standards for Certification State of Oregon. The state of Oregon has a two-tier system for small business certification. A tier one firm employs fewer than 20 full-time equivalent employees and has average annual gross receipts for the last three years that do not exceed $1.5 million for construction, or $600,000 for non-construction. A tier two firm employs fewer than 30 full-time equivalent employees and has average annual gross receipts for the last three years that do not exceed $3 million for construction, or $1 million for non-construction. 36 An emerging small business cannot be a subsidiary or a franchise. In 2006, small business program participation was extended from seven to 12 years.37 State of New Jersey. For the state of New Jersey, there are separate size standards for small businesses and emerging small businesses. For large projects, the state of New Jersey carves out portions of the contract for both tiers of small business. Thus, a single
35
Bexar County, Tax Phase-In Agreement (HEB Grocery), March 11, 2003, Section 5.01(c). 36
OAR 445-050-0115. 37
OAR 445-050-0135.
Findings and Recommendations
Page 7-21
solicitation requires that the prime spend a certain percentage of the contract with small firms and another percentage with emerging small firms. Along related lines, the federal government sets aside contracts for bidding only amongst small firms, and other contracts may be set aside for bidding only by emerging small firms.
Federal Government. The federal government has the additional categories:
Emerging Small Business, defined as being 50 percent of the SBA size standards.
Very Small Business, defined as fewer than 15 employees and less than $1 million in revenue.
7.4.12 M/WBE Program Data Management Many agencies issue M/WBE annual utilization reports. Some important additional elements of program data management employed by other agencies include:
Separate Reporting of M/WBE Prime Contractor and Subcontractor Utilization. Orange County, Florida; Charlotte, North Carolina; Port Authority of New York and New Jersey.
Tracking M/WBE and Non-M/WBE Subcontractor Utilization. City of Charlotte, North Carolina.
Tracking M/WBE Utilization in the SBE Program. Charlotte, North Carolina; Port Authority of New York and New Jersey; Los Angeles Unified School District, California; and Phoenix, Arizona.
Oregon Department of Transportation. The Oregon Department of Transportation has a very complete reporting system for DBEs in construction, with 105 tables, and includes coverage of DBE utilization at the subcontract and prime contract levels, bidders, small business utilization, prompt payment, commercially useful function review, complaints against prime contractors, on-the-job training, and labor compliance. The system is updated daily. State of North Carolina. Under North Carolina General Statues, any state or local government agency that receives state funds for construction, renovation, or remolding must report Historically Underutilized Business (HUB) prime and subcontractor participation. HUB participation dollar are updated in HUBSCO, a Web-based system administrated by the State Construction Office and accessed by state and local government agencies. Prime and subcontractor participation is entered into HUBSCO for formal and informal contracts. HUBSCO also tracks good faith efforts requirements.
7.4.13 Performance Measures Florida Department of Transportation. The Evaluation Plan for the Florida DOT Small Business Initiative has the following performance measures:
1. What specific action(s) were identified that the Florida DOT could implement or continue to help small businesses increase their capacity to bid as a prime?

Findings and Recommendations
Page 7-22
2. Which of the identified strategies resulted in new businesses becoming interested in a long-term partnership with the Florida DOT as a prime?
3. What are the success stories?
4. How many businesses that were identified have the desire and ability to grow from a subcontractor to a prime?
5. How many businesses are bidding on reserved contracts compared to those that are not reserved?
6. How many businesses that have never bid as primes are now bidding on reserved contracts as primes?
7. How many businesses that were subcontractors or subconsultants have been awarded contracts as a prime?
8. How many businesses, awarded a reserved contract, bid on contracts that were not reserved?
9. How many businesses were able to take advantage of the waiver of the bonding requirements? What is the size of the businesses that took advantage of the waiver?
10. How many contracts resulted in a default? What was the dispute?
11. How many “problem” contracts adversely affected the end product? What was the issue, (such as product, time or cost)?
12. How many protests were filed? What was the protest issue?

APPENDICES

APPENDIX A:COMMONWEALTH OF VIRGINIA
CARS CHART OF ACCOUNTS

APPENDIX A
COMMONWEALTH OF VIRGINIACARS CHART OF ACCOUNTS
Expenditure/
Object CodeExpenditure/Object Text Description
Architecture &
EngineeringConstruction
Goods &
Supplies
Other
Services
Professional
ServicesMarked for Exclusion
1111Employer Retirement Contributions - VRS Defined Benefits Program: Include expenditures for payments made to the retirement system trust fund for a defined benefit program for salaried State employees. See 1119 for Defined Contribution expenditures.
OPERATING EXP - PERSONAL SERVICES SUCH AS WAGES SALARIES BENEFITS
1112Federal Old-Age Insurance for Salaried State Employees (Social Security and Medicare): Include expenditures of Contribution Fund for old-age and survivors' benefits for salaried State employees (social security). For related expenditures, see 1133.
OPERATING EXP - PERSONAL SERVICES SUCH AS WAGES SALARIES BENEFITS
1113Federal Old-Age Insurance for Wage-Earning State Employees (Wage Social Security): Include expenditures of Contribution Fund for old-age and survivors' benefits for wage-earning State employees.
OPERATING EXP - PERSONAL SERVICES SUCH AS WAGES SALARIES BENEFITS
1114Group Life Insurance: Include expenditures of group life insurance program provided for the benefit of State employees. For related expenditures, see 1133.
OPERATING EXP - PERSONAL SERVICES SUCH AS WAGES SALARIES BENEFITS
1115Medical/Hospitalization Insurance (Annual Employer Health Insurance Premium): Include expenditures of group medical/hospitalization insurance program provided for the benefit of State employees.
OPERATING EXP - PERSONAL SERVICES SUCH AS WAGES SALARIES BENEFITS
1116Retiree Health Medical/Hospitalization Insurance Credit: Include expenditures for payments to the Retiree Health Insurance Fund.
OPERATING EXP - PERSONAL SERVICES SUCH AS WAGES SALARIES BENEFITS
1117VSDB Long-term Disability Insurance: Includes expenditures of the long-term disability program provided for the benefit of state employees.
OPERATING EXP - PERSONAL SERVICES SUCH AS WAGES SALARIES BENEFITS
1118 Teachers Insurance and Annuity: Include expenditures for payments made to Teachers Insurance Annuity Fund.OPERATING EXP - PERSONAL SERVICES SUCH AS WAGES SALARIES BENEFITS
1119Employer Retirement Contributions – Defined Contribution Program: Include expenditures for payments made to an employee’s defined contribution account. See 1111 for Defined Benefits expenditures.
OPERATING EXP - PERSONAL SERVICES SUCH AS WAGES SALARIES BENEFITS
1122Salaries, Appointed Officials: Include expenditures for compensation, severance pay, and incentive awards to persons who are appointed to their position and are paid at a yearly rate specified in Part 4 (General Provisions) of the Appropriation Act.
OPERATING EXP - PERSONAL SERVICES SUCH AS WAGES SALARIES BENEFITS
1123Salaries, Classified: Include expenditures for compensation and severance pay to persons who are paid at an established yearly rate in positions which are covered by the Virginia Personnel Act. Do not include final compensation to employees for annual, si
OPERATING EXP - PERSONAL SERVICES SUCH AS WAGES SALARIES BENEFITS
1124Salaries, Other Officials: Include expenditures for compensation, severance pay, and incentive awards to persons who are paid at a yearly rate and are in positions which are exempt from the Virginia Personnel Act and whose salaries are not specified in Pa
OPERATING EXP - PERSONAL SERVICES SUCH AS WAGES SALARIES BENEFITS
1125Salaries, Overtime: Include expenditures for compensation to persons who are paid at an established yearly rate, for hours worked in excess of their normal workweek.
OPERATING EXP - PERSONAL SERVICES SUCH AS WAGES SALARIES BENEFITS
1126Salaries, Teaching and Research: Include expenditures for compensation to persons for professional services rendered on a full-time (temporary, restricted or permanent) basis or a permanent, part-time basis in research and teaching positions in institutio
OPERATING EXP - PERSONAL SERVICES SUCH AS WAGES SALARIES BENEFITS
1127Salaries, Virginia Law Officers’ Retirement System Participants: Include expenditures for compensation and severance pay for persons participating in the Virginia Law Officers’ Retirement System (VALORS).
OPERATING EXP - PERSONAL SERVICES SUCH AS WAGES SALARIES BENEFITS
1128Salaries, Information Technology Employees: Include salary expenditures for employees performing a role in information technology who would otherwise have salary expenditures coded in subobjects 1121 through 1125.
OPERATING EXP - PERSONAL SERVICES SUCH AS WAGES SALARIES BENEFITS
1129Salaries, Overtime for Information Technology Employees: Include expenditures for compensation to persons performing a role in information technology who are paid at an established yearly rate, for hours worked in excess of their normal workweek. This exp
OPERATING EXP - PERSONAL SERVICES SUCH AS WAGES SALARIES BENEFITS
1131 Bonuses and Incentives: Include expenditures for payment of bonuses and incentives to state employees.OPERATING EXP - PERSONAL SERVICES SUCH AS WAGES SALARIES BENEFITS
1132Salaries, Active Military Supplement: Include expenditures for supplemental pay based on the difference between the state employee’s base salary and the gross military pay plus allowances paid to the employee for service in the armed forces of the United
OPERATING EXP - PERSONAL SERVICES SUCH AS WAGES SALARIES BENEFITS
1133Overseas Differential Compensation: Include expenditures for cost of living adjustments, fringe benefits, monetary changes, pay differentials, and salaries for non-classified employees who work in the State's foreign offices.
OPERATING EXP - PERSONAL SERVICES SUCH AS WAGES SALARIES BENEFITS
1134Specified Per Diem Payments: Include expenditures for per diem services provided by persons who are members of a legislative committee, representatives of the General Assembly, members of a study commission, members of a governing board of a State agency,
OPERATING EXP - PERSONAL SERVICES SUCH AS WAGES SALARIES BENEFITS
1135Wages and Allowances: Include expenditures for wages and per diem allowances to offenders, patients and similar wards of the State.
OPERATING EXP - PERSONAL SERVICES SUCH AS WAGES SALARIES BENEFITS
Page A-1

CARS Chart of Accounts
Expenditure/
Object CodeExpenditure/Object Text Description
Architecture &
EngineeringConstruction
Goods &
Supplies
Other
Services
Professional
ServicesMarked for Exclusion
1136Work Programs: Include expenditures for compensation to individuals who participate in federal work training programs, e.g., CETA, YACC, YCC, which are targeted for unemployed youth and other hard-to-employ persons.
OPERATING EXP - PERSONAL SERVICES SUCH AS WAGES SALARIES BENEFITS
1137Employee Suggestion Awards: Include expenditures for payments of Employee Suggestion Program cash awards to employees or former employees.
OPERATING EXP - PERSONAL SERVICES SUCH AS WAGES SALARIES BENEFITS
1138Deferred Compensation Match Payments: Includes expenditures for employer match of the state employee deferred compensation program (The subobject code, entitled Early Retirement Incentive Payments, was relocated to 1161.)
OPERATING EXP - PERSONAL SERVICES SUCH AS WAGES SALARIES BENEFITS
1139Special Payments for Academic Services: Include expenditures for one-time payments made by institutions of higher education to cooperating teachers in public or private schools or other individuals who perform noninstructional or nonresearch academic serv
OPERATING EXP - PERSONAL SERVICES SUCH AS WAGES SALARIES BENEFITS
1141 Wages, General: Include expenditures for compensation to persons who are paid at an hourly rate.OPERATING EXP - PERSONAL SERVICES SUCH AS WAGES SALARIES BENEFITS
1142Wages, Graduate Assistant: Include expenditures for compensation made by institutions of higher education to persons, without faculty appointment, for teaching and research activities.
OPERATING EXP - PERSONAL SERVICES SUCH AS WAGES SALARIES BENEFITS
1143Wages, Overtime: Include expenditures for compensation to persons who are paid at an hourly rate for hours worked in excess of 40 hours per week.
OPERATING EXP - PERSONAL SERVICES SUCH AS WAGES SALARIES BENEFITS
1144Wages, Student: Include expenditures for compensation made by institutions of higher education to graduate and undergraduate students for all services other than those included in 1142 and 1145. Include expenditures for overtime payments.
OPERATING EXP - PERSONAL SERVICES SUCH AS WAGES SALARIES BENEFITS
1145Wages, Teaching and Research Part-Time: Include expenditures for compensation to persons for professional services rendered in research and instructional positions in institutions of higher education other than those described in 1126. Include compensatio
OPERATING EXP - PERSONAL SERVICES SUCH AS WAGES SALARIES BENEFITS
1146Wages, Federal Work Study Student: Include expenditures for compensation to students participating in federal work study programs.
OPERATING EXP - PERSONAL SERVICES SUCH AS WAGES SALARIES BENEFITS
1147Wages, Substitute Judges: Include expenditures for payments to substitute judges and for payments to retired justices and judges temporarily recalled to perform judicial duties.
OPERATING EXP - PERSONAL SERVICES SUCH AS WAGES SALARIES BENEFITS
1148Wages, State Work Study Student: Include expenditures for compensation to students participating in State work study programs.
OPERATING EXP - PERSONAL SERVICES SUCH AS WAGES SALARIES BENEFITS
1149Wages, Information Technology Employees: Include expenditures for compensation to persons paid an hourly rate and whose actual job duties involve information technology.
OPERATING EXP - PERSONAL SERVICES SUCH AS WAGES SALARIES BENEFITS
1151Workers’ Compensation Awards: Include expenditures for workers’ compensation awards to state employees under the Virginia Workers’ Compensation Act or the short-term or long-term disability benefit program.
OPERATING EXP - PERSONAL SERVICES SUCH AS WAGES SALARIES BENEFITS
1152Supplemental Workers’ Compensation Awards: Include expenditures for supplemental workers’ compensation awards to state employees who are not participating in the short-term disability program.
OPERATING EXP - PERSONAL SERVICES SUCH AS WAGES SALARIES BENEFITS
1153Short-term Disability Benefits: Include expenditures for the payment of short-term disability payments to state employees under the Sickness and Disability Program.
OPERATING EXP - PERSONAL SERVICES SUCH AS WAGES SALARIES BENEFITS
1154Supplemental Disability Benefits: Include expenditures for supplemental workers’ compensation award payments to state employees under the Sickness and Disability Program.
OPERATING EXP - PERSONAL SERVICES SUCH AS WAGES SALARIES BENEFITS
1158Recoveries for Workers’ Compensation Awards: Reimbursement to agency from Department of Human Resource Management for workers’ compensation awards under the Virginia Workers’ Compensation Act or the short-term or long-term disability benefit program.
OPERATING EXP - PERSONAL SERVICES SUCH AS WAGES SALARIES BENEFITS
1161Early Retirement Incentive Payments: Include expenditures for special payments to persons in teaching positions in institutions of higher education that receive early retirement payments under an approved early retirement incentive plan.
OPERATING EXP - PERSONAL SERVICES SUCH AS WAGES SALARIES BENEFITS
1162Salaries, Annual Leave Balances: Include expenditures for final compensation to eligible employees for their annual leave balances.
OPERATING EXP - PERSONAL SERVICES SUCH AS WAGES SALARIES BENEFITS
1163Salaries, Sick Leave Balances: Include expenditures for final compensation to eligible employees for their sick leave balances up to the specified limit. Include the payout of disability credits for employees participating in the Virginia Sickness and Dis
OPERATING EXP - PERSONAL SERVICES SUCH AS WAGES SALARIES BENEFITS
1164Salaries, Compensatory Leave Balances: Include expenditures for final compensation to eligible employees for their compensatory time earned but not taken.
OPERATING EXP - PERSONAL SERVICES SUCH AS WAGES SALARIES BENEFITS
1171WTA - Payments for Transitional Severance Benefits: Include expenditures for payments of severance to employees eligible for severance benefits allowed under §2.2-3203 of the Virginia Code. Charge expenditures for WTA related retirement to 1175.
OPERATING EXP - PERSONAL SERVICES SUCH AS WAGES SALARIES BENEFITS
Page A-2

CARS Chart of Accounts
Expenditure/
Object CodeExpenditure/Object Text Description
Architecture &
EngineeringConstruction
Goods &
Supplies
Other
Services
Professional
ServicesMarked for Exclusion
1172WTA - Federal Old-Age Insurance for Salaried State Employees: Include expenditures of Contribution Fund for old-age and survivors' benefits for salaried state employees (Social Security) provided for the severance benefit of employees involuntarily separa
OPERATING EXP - PERSONAL SERVICES SUCH AS WAGES SALARIES BENEFITS
1173WTA - Medical/Hospitalization Insurance: Include expenditures of group medical/hospitalization insurance program provided for the benefit of employees involuntarily separated under the WTA Act of 1995.
OPERATING EXP - PERSONAL SERVICES SUCH AS WAGES SALARIES BENEFITS
1174WTA - Group Life Insurance: Include expenditures of group life insurance program provided for the benefit of employees involuntarily separated under the WTA Act of 1995.
OPERATING EXP - PERSONAL SERVICES SUCH AS WAGES SALARIES BENEFITS
1175WTA - Early Retirement Payments: Include expenditures for special payments for employees eligible for retirement allowed under §2.2-3204 of the Virginia Code
OPERATING EXP - PERSONAL SERVICES SUCH AS WAGES SALARIES BENEFITS
1176WTA - Salaries, Annual Leave Balances: Include expenditures for final compensation to eligible employees participating in the WTA Act of 1995 for their annual leave balances.
OPERATING EXP - PERSONAL SERVICES SUCH AS WAGES SALARIES BENEFITS
1177Salaries, Sick Leave Balances: Include expenditures for final compensation to eligible employees participating in the WTA Act of 1995 for their sick leave balances up to the specified limit. Include the payout of disability credits for employees participa
OPERATING EXP - PERSONAL SERVICES SUCH AS WAGES SALARIES BENEFITS
1178WTA - Salaries, Compensatory Leave Balances: Include expenditures for final compensation to eligible employees participating in the WTA Act of 1995 for their compensatory time earned but not taken.
OPERATING EXP - PERSONAL SERVICES SUCH AS WAGES SALARIES BENEFITS
1179WTA - Unemployment Compensation Awards: Include expenditures for unemployment compensation payments (insurance and claims) to employees participating in the WTA Act of 1995.
OPERATING EXP - PERSONAL SERVICES SUCH AS WAGES SALARIES BENEFITS
1182Unfunded Vacant Positions: Used to record unfunded vacant authorized positions in excess of the positions recorded in subobjects 1192 or 1195.
OPERATING EXP - PERSONAL SERVICES SUCH AS WAGES SALARIES BENEFITS
1184FTE, Undistributed Amended Legislative Appropriation: Used only to identify FTE legislative amended positions in the budget as amended in the odd year session. Agencies are to incorporate these positions into operating plans. Expenditures cannot be charge
OPERATING EXP - PERSONAL SERVICES SUCH AS WAGES SALARIES BENEFITS
1185FTE Undistributed Legislative Appropriation: Used only to transmit legislative adjustments in positions to agencies for incorporating into operating plans. Expenditures cannot be charged to this code.
OPERATING EXP - PERSONAL SERVICES SUCH AS WAGES SALARIES BENEFITS
1186Undistributed Regrade Funds: Used only to transmit lump-sum regrade amounts to agencies for distribution to appropriate programs and service areas. Expenditures cannot be charged to this code.
OPERATING EXP - PERSONAL SERVICES SUCH AS WAGES SALARIES BENEFITS
1187Nongeneral Fund “G” Transaction Supplement: Used to identify nongeneral fund additional revenue appropriations (transaction type “G” in FATS) used to support personal service adjustments in development of the FY 1998 operating plan. Dollars are shown as a
OPERATING EXP - PERSONAL SERVICES SUCH AS WAGES SALARIES BENEFITS
1188Unallotted Personal Services: Used if an agency does not wish to indicate specific subobject codes for personal services for an allotment adjustment when creating or changing an operating plan. Expenditures cannot be charged to this code.
OPERATING EXP - PERSONAL SERVICES SUCH AS WAGES SALARIES BENEFITS
1189Unallotted Personal Services/2% Reductions: Used to record the unallotment of personal services amounts related to the FY 90 2% general fund reduction. Expenditures cannot be charged to this code.
OPERATING EXP - PERSONAL SERVICES SUCH AS WAGES SALARIES BENEFITS
1191Undistributed Personal Services Recoveries : Used only during budget development by agencies designated by DPB to record undistributed budget amounts for personal services recoveries. Cannot be used for expenditures.
OPERATING EXP - PERSONAL SERVICES SUCH AS WAGES SALARIES BENEFITS
1192Turnover/Vacancy Faculty Salaries: Used only during budget development to record turnover and vacancy amounts. Cannot be used for expenditures.
OPERATING EXP - PERSONAL SERVICES SUCH AS WAGES SALARIES BENEFITS
1193Turnover/Vacancy Fringe Benefits: Used only during budget development to record turnover and vacancy amounts. Cannot be used for expenditures.
OPERATING EXP - PERSONAL SERVICES SUCH AS WAGES SALARIES BENEFITS
1194Turnover/Vacancy Medical/Hospital Insurance: Used only during budget development to record turnover and vacancy amounts. Cannot be used for expenditures.
OPERATING EXP - PERSONAL SERVICES SUCH AS WAGES SALARIES BENEFITS
1195Turnover/Vacancy Classified Salaries: Used only during budget development to record turnover and vacancy amounts. Cannot be used for expenditures.
OPERATING EXP - PERSONAL SERVICES SUCH AS WAGES SALARIES BENEFITS
1196Indirect Cost Recoveries from Auxiliary Programs for Personal Services: Include only the required recovery of indirect costs of personal services from Auxiliary Enterprise service areas. (This code may be used only by institutions of higher education.)
OPERATING EXP - PERSONAL SERVICES SUCH AS WAGES SALARIES BENEFITS
1197Indirect Cost Recoveries from Sponsored Programs for Personal Services: Include only the required recovery of indirect costs for personal services from the Sponsored Programs service area. (This code may be used only by institutions of higher education.)
OPERATING EXP - PERSONAL SERVICES SUCH AS WAGES SALARIES BENEFITS
1198Inter-Agency Recoveries for Personal Services: Recovery of the cost of personal services incurred by programs or service areas for services provided to other agencies within the same fiscal year. For recovery of expenditures from the prior fiscal year, se
OPERATING EXP - PERSONAL SERVICES SUCH AS WAGES SALARIES BENEFITS
Page A-3
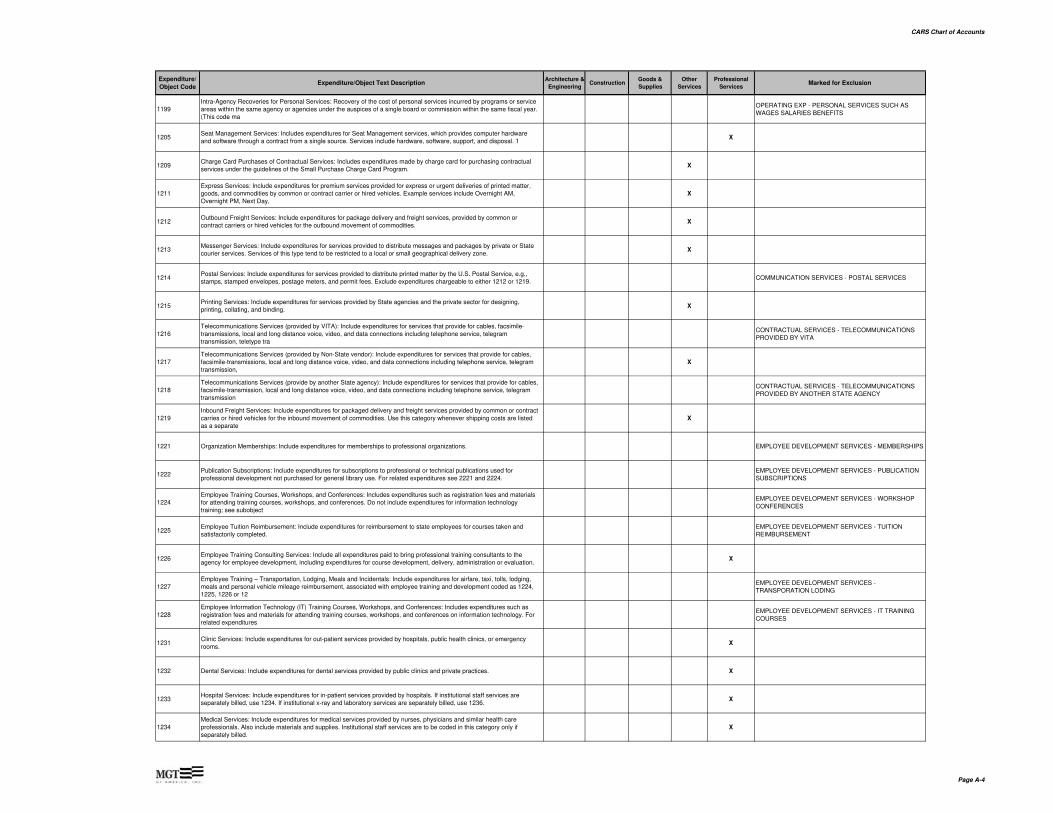
CARS Chart of Accounts
Expenditure/
Object CodeExpenditure/Object Text Description
Architecture &
EngineeringConstruction
Goods &
Supplies
Other
Services
Professional
ServicesMarked for Exclusion
1199Intra-Agency Recoveries for Personal Services: Recovery of the cost of personal services incurred by programs or service areas within the same agency or agencies under the auspices of a single board or commission within the same fiscal year. (This code ma
OPERATING EXP - PERSONAL SERVICES SUCH AS WAGES SALARIES BENEFITS
1205Seat Management Services: Includes expenditures for Seat Management services, which provides computer hardware and software through a contract from a single source. Services include hardware, software, support, and disposal. 1
X
1209Charge Card Purchases of Contractual Services: Includes expenditures made by charge card for purchasing contractual services under the guidelines of the Small Purchase Charge Card Program.
X
1211Express Services: Include expenditures for premium services provided for express or urgent deliveries of printed matter, goods, and commodities by common or contract carrier or hired vehicles. Example services include Overnight AM, Overnight PM, Next Day,
X
1212Outbound Freight Services: Include expenditures for package delivery and freight services, provided by common or contract carriers or hired vehicles for the outbound movement of commodities.
X
1213Messenger Services: Include expenditures for services provided to distribute messages and packages by private or State courier services. Services of this type tend to be restricted to a local or small geographical delivery zone.
X
1214Postal Services: Include expenditures for services provided to distribute printed matter by the U.S. Postal Service, e.g., stamps, stamped envelopes, postage meters, and permit fees. Exclude expenditures chargeable to either 1212 or 1219.
COMMUNICATION SERVICES - POSTAL SERVICES
1215Printing Services: Include expenditures for services provided by State agencies and the private sector for designing, printing, collating, and binding.
X
1216Telecommunications Services (provided by VITA): Include expenditures for services that provide for cables, facsimile-transmissions, local and long distance voice, video, and data connections including telephone service, telegram transmission, teletype tra
CONTRACTUAL SERVICES - TELECOMMUNICATIONS PROVIDED BY VITA
1217Telecommunications Services (provided by Non-State vendor): Include expenditures for services that provide for cables, facsimile-transmissions, local and long distance voice, video, and data connections including telephone service, telegram transmission,
X
1218Telecommunications Services (provide by another State agency): Include expenditures for services that provide for cables, facsimile-transmission, local and long distance voice, video, and data connections including telephone service, telegram transmission
CONTRACTUAL SERVICES - TELECOMMUNICATIONS PROVIDED BY ANOTHER STATE AGENCY
1219Inbound Freight Services: Include expenditures for packaged delivery and freight services provided by common or contract carries or hired vehicles for the inbound movement of commodities. Use this category whenever shipping costs are listed as a separate
X
1221 Organization Memberships: Include expenditures for memberships to professional organizations. EMPLOYEE DEVELOPMENT SERVICES - MEMBERSHIPS
1222Publication Subscriptions: Include expenditures for subscriptions to professional or technical publications used for professional development not purchased for general library use. For related expenditures see 2221 and 2224.
EMPLOYEE DEVELOPMENT SERVICES - PUBLICATION SUBSCRIPTIONS
1224Employee Training Courses, Workshops, and Conferences: Includes expenditures such as registration fees and materials for attending training courses, workshops, and conferences. Do not include expenditures for information technology training; see subobject
EMPLOYEE DEVELOPMENT SERVICES - WORKSHOP CONFERENCES
1225Employee Tuition Reimbursement: Include expenditures for reimbursement to state employees for courses taken and satisfactorily completed.
EMPLOYEE DEVELOPMENT SERVICES - TUITION REIMBURSEMENT
1226Employee Training Consulting Services: Include all expenditures paid to bring professional training consultants to the agency for employee development, including expenditures for course development, delivery, administration or evaluation.
X
1227Employee Training – Transportation, Lodging, Meals and Incidentals: Include expenditures for airfare, taxi, tolls, lodging, meals and personal vehicle mileage reimbursement, associated with employee training and development coded as 1224, 1225, 1226 or 12
EMPLOYEE DEVELOPMENT SERVICES - TRANSPORATION LODING
1228Employee Information Technology (IT) Training Courses, Workshops, and Conferences: Includes expenditures such as registration fees and materials for attending training courses, workshops, and conferences on information technology. For related expenditures
EMPLOYEE DEVELOPMENT SERVICES - IT TRAINING COURSES
1231Clinic Services: Include expenditures for out-patient services provided by hospitals, public health clinics, or emergency rooms.
X
1232 Dental Services: Include expenditures for dental services provided by public clinics and private practices. X
1233Hospital Services: Include expenditures for in-patient services provided by hospitals. If institutional staff services are separately billed, use 1234. If institutional x-ray and laboratory services are separately billed, use 1236.
X
1234Medical Services: Include expenditures for medical services provided by nurses, physicians and similar health care professionals. Also include materials and supplies. Institutional staff services are to be coded in this category only if separately billed.
X
Page A-4
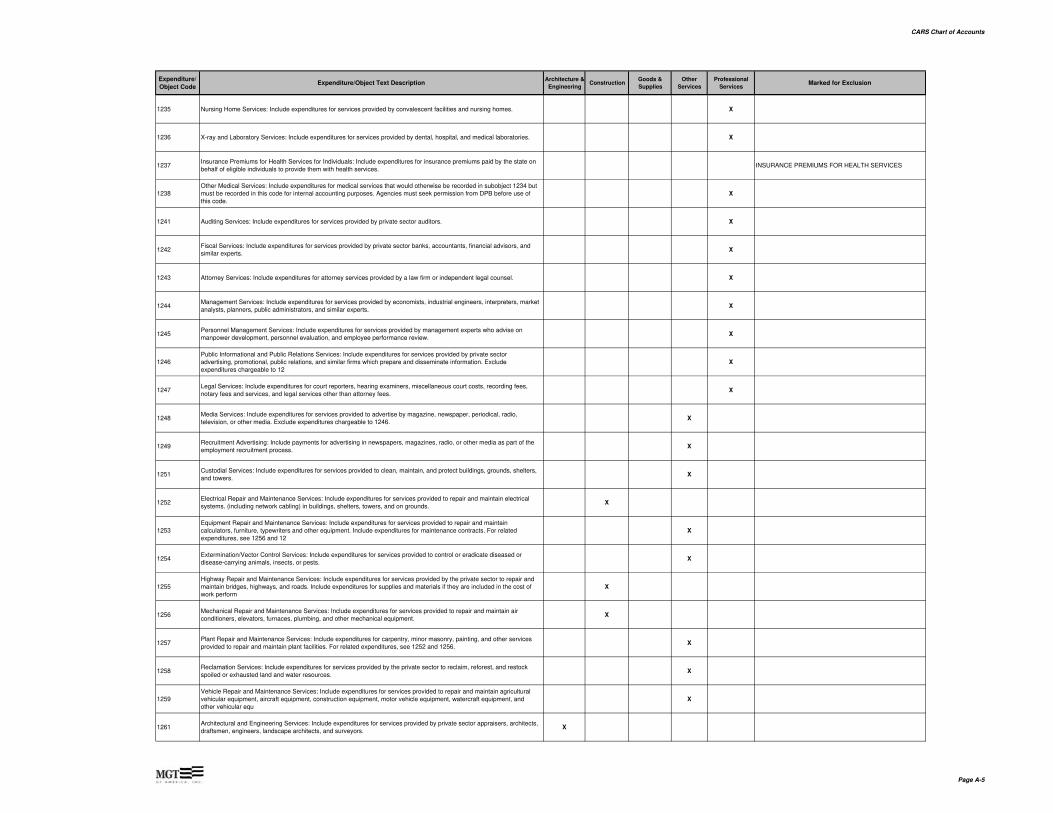
CARS Chart of Accounts
Expenditure/
Object CodeExpenditure/Object Text Description
Architecture &
EngineeringConstruction
Goods &
Supplies
Other
Services
Professional
ServicesMarked for Exclusion
1235 Nursing Home Services: Include expenditures for services provided by convalescent facilities and nursing homes. X
1236 X-ray and Laboratory Services: Include expenditures for services provided by dental, hospital, and medical laboratories. X
1237Insurance Premiums for Health Services for Individuals: Include expenditures for insurance premiums paid by the state on behalf of eligible individuals to provide them with health services.
INSURANCE PREMIUMS FOR HEALTH SERVICES
1238Other Medical Services: Include expenditures for medical services that would otherwise be recorded in subobject 1234 but must be recorded in this code for internal accounting purposes. Agencies must seek permission from DPB before use of this code.
X
1241 Auditing Services: Include expenditures for services provided by private sector auditors. X
1242Fiscal Services: Include expenditures for services provided by private sector banks, accountants, financial advisors, and similar experts.
X
1243 Attorney Services: Include expenditures for attorney services provided by a law firm or independent legal counsel. X
1244Management Services: Include expenditures for services provided by economists, industrial engineers, interpreters, market analysts, planners, public administrators, and similar experts.
X
1245Personnel Management Services: Include expenditures for services provided by management experts who advise on manpower development, personnel evaluation, and employee performance review.
X
1246Public Informational and Public Relations Services: Include expenditures for services provided by private sector advertising, promotional, public relations, and similar firms which prepare and disseminate information. Exclude expenditures chargeable to 12
X
1247Legal Services: Include expenditures for court reporters, hearing examiners, miscellaneous court costs, recording fees, notary fees and services, and legal services other than attorney fees.
X
1248Media Services: Include expenditures for services provided to advertise by magazine, newspaper, periodical, radio, television, or other media. Exclude expenditures chargeable to 1246.
X
1249Recruitment Advertising: Include payments for advertising in newspapers, magazines, radio, or other media as part of the employment recruitment process.
X
1251Custodial Services: Include expenditures for services provided to clean, maintain, and protect buildings, grounds, shelters, and towers.
X
1252Electrical Repair and Maintenance Services: Include expenditures for services provided to repair and maintain electrical systems. (including network cabling) in buildings, shelters, towers, and on grounds.
X
1253Equipment Repair and Maintenance Services: Include expenditures for services provided to repair and maintain calculators, furniture, typewriters and other equipment. Include expenditures for maintenance contracts. For related expenditures, see 1256 and 12
X
1254Extermination/Vector Control Services: Include expenditures for services provided to control or eradicate diseased or disease-carrying animals, insects, or pests.
X
1255Highway Repair and Maintenance Services: Include expenditures for services provided by the private sector to repair and maintain bridges, highways, and roads. Include expenditures for supplies and materials if they are included in the cost of work perform
X
1256Mechanical Repair and Maintenance Services: Include expenditures for services provided to repair and maintain air conditioners, elevators, furnaces, plumbing, and other mechanical equipment.
X
1257Plant Repair and Maintenance Services: Include expenditures for carpentry, minor masonry, painting, and other services provided to repair and maintain plant facilities. For related expenditures, see 1252 and 1256.
X
1258Reclamation Services: Include expenditures for services provided by the private sector to reclaim, reforest, and restock spoiled or exhausted land and water resources.
X
1259Vehicle Repair and Maintenance Services: Include expenditures for services provided to repair and maintain agricultural vehicular equipment, aircraft equipment, construction equipment, motor vehicle equipment, watercraft equipment, and other vehicular equ
X
1261Architectural and Engineering Services: Include expenditures for services provided by private sector appraisers, architects, draftsmen, engineers, landscape architects, and surveyors.
X
Page A-5

CARS Chart of Accounts
Expenditure/
Object CodeExpenditure/Object Text Description
Architecture &
EngineeringConstruction
Goods &
Supplies
Other
Services
Professional
ServicesMarked for Exclusion
1262Aviation Services: Include expenditures for aviation services (rotary and fixed wing) provided by the private sector for enforcement, monitoring, survey activities.
X
1263Clerical Services: Include expenditures for services provided by private sector typing, data entry, word processing, filing, secretarial, stenographic, and similar clerical firms.
X
1264Food and Dietary Services: Include expenditures for services provided by State agencies or the private sector to provide meals and food on a one-time or a continuing basis.
X
1265Laundry and Linen Services: Include expenditures for services provided by another State agency or commercial establishment for laundry and linen. Include payment of claims for damaged laundry and dry cleaning.
X
1266Manual Labor Services: Include expenditures for services provided by State agencies or the private sector for manual and unskilled laborers.
X
1267Production Services: Include expenditures for services provided by State agencies or the private sector to develop, manufacture, or produce goods or materials (e.g., film processing).
X
1268Skilled Services: Include expenditures for services provided by artisans, chemists, interior designers, laboratory technicians, referees, and similar skilled and technical workers.
X
1271Information Management Design and Development Services (provided by VITA): Include expenditures for services provided by the Virginia Information Technologies Agency (VITA) computer system analysts, programmers, and other technical and management personne
TECHNICAL SERVICES - INFORMATION TECHNOLOGY SERVICES PROVIDED BY VITA
1272VITA Pass Thru Charges: Include expenses for pass through charges for goods and services procured through VITA/NG partnership and billed by VITA such as agency specific software maintenance renewals and other software not included in the VITA rate structu
TECHNICAL SERVICES - VITA PASS THRU CHARGES
1273Information Management Design and Development Services (provided by another State agency (not VITA) or vendor): Include expenditures for services provided by state employed (other than VITA) or private sector computer systems analysts, programmers, and ot
X
1274Computer Hardware Maintenance Services: Include expenditures for services to repair and maintain computer and computer peripheral hardware. Use 1205 for seat management services.
X
1275 Computer Software Maintenance Services: Include expenditures for services provided to maintain computer software. X
1276Computer Operating Services (provided by VITA): Include expenditures for services provided though VITA for computer operations and other costs associated with the operation of computer hardware.
TECHNICAL SERVICES - COMPUTER OPERATING SERVICES PROVIDED BY VITA
1277Computer Operating Services (provided by another State agency (not VITA) or vendor): Include expenditures for services provided by state employed (other than VITA) or private sector computer operations personnel and other costs associated with the operati
X
1278VITA Information Technology Infrastructure Services (provided by VITA): Include expenditures for services provided through VITA for agency infrastructure and other costs associated with the provision of infrastructure services activities. See VITA directi
TECHNICAL SERVICES - VITA EXPENDITURES
1279Computer Software Development Services: Include expenditures for consulting services to custom develop software or modify or customize existing software or Commercial off the Shelf Software (COTS). See also 2218 for software purchases (and a definition of
X
1281Moving and Relocation Services: Include expenditures for services provided for relocating an employee's family and household, incidental to a new place of employment. Use this code, also, for the expenditures of a newly-employed person when appropriately
TRANSPORATION SERVICES SUCH AS MOVING PERSONAL VEHICLES
1282Travel, Personal Vehicle: Include expenditures for transportation by personal vehicle. Exclude parking fees and tolls. Travel cost associated with attending courses should be charged to 1227.
TRANSPORATION SERVICES SUCH AS MOVING PERSONAL VEHICLES
1283Travel, Public Carriers: Include expenditures for individual travel by aircraft (State and private sector), airport limousine, bus, leased vehicle, taxi, train, and watercraft. Include parking fees and tolls. Travel cost associated with attending courses
TRANSPORATION SERVICES SUCH AS MOVING PERSONAL VEHICLES
1284Travel, State Owned or Leased Vehicles: Include expenditures for transportation by State vehicles such as the Commonwealth’s centralized fleet of vehicles managed by the DGS, Office of Fleet Management Services. Exclude parking fees and tolls. Travel cost
TRANSPORATION SERVICES SUCH AS MOVING PERSONAL VEHICLES
1285Travel, Subsistence and Lodging: Include expenditures for gratuities, lodging, and similar subsistence and for parking fees and tolls related to 1282 and 1284. Travel cost associated with attending courses should be charged to 1227.
TRANSPORATION SERVICES SUCH AS MOVING PERSONAL VEHICLES
1286Travel, Supplements and Aid: Include expenditures for individual transportation by any means and subsistence for persons receiving medical or rehabilitative services or for persons in the care or custody (including the extradition of prisoners) of a State
TRANSPORATION SERVICES SUCH AS MOVING PERSONAL VEHICLES
1287Travel, Meal Reimbursements - Reportable to the IRS: Include reimbursements for meal expenditures incurred during trips or work assignments which did not require overnight lodging or rest. (Meals which are part of a training or education package and are n
TRANSPORATION SERVICES SUCH AS MOVING PERSONAL VEHICLES
Page A-6

CARS Chart of Accounts
Expenditure/
Object CodeExpenditure/Object Text Description
Architecture &
EngineeringConstruction
Goods &
Supplies
Other
Services
Professional
ServicesMarked for Exclusion
1288Travel, Meal Reimbursements - Not Reportable to the IRS: Include reimbursements for meal expenditures which were incurred during trips which required overnight lodging or rest or for special work assignments, such as business luncheons, recruiting or inte
TRANSPORATION SERVICES SUCH AS MOVING PERSONAL VEHICLES
1291Undistributed Contractual Services Recoveries: Used only during budget development by agencies designated by DPB to record undistributed budget amounts for contractual services recoveries. Cannot be used for expenditures.
CONTRACTUAL SERVICES - UNDISTRIBUTED CONTRACTUAL SERVICES RECOVERIES
1295Undistributed Contractual Services: Used only to aggregate budget amounts for contractual services in Major Object 12. Expenditures cannot be charged to this code.
CONTRACTUAL SERVICES - UNDISTRIBUTED CONTRACTUAL SERVICES
1296Indirect Cost Recoveries from Auxiliary Programs for Contractual Services: Include only the required recovery of indirect costs of contractual services from Auxiliary Enterprise service areas. (This code may be used only by institutions of higher educatio
INDIRECT COST RECOVERIES
1297Late Payment Penalties for Contractual Services: Include expenditures for charges assessed by vendors for the late payment of invoices for contractual services pursuant to the Prompt Payment Act.
LATE PAYMENT PENALTIES
1298Inter-Agency Recoveries for Contractual Services: Recovery of the cost of contractual services incurred by programs or service areas for services provided to other agencies within the same fiscal year. For recovery of expenditures from the prior fiscal ye
INTER AGENCY RECOVERIES
1299Intra-Agency Recoveries for Contractual Services: Recovery of the cost of contractual services incurred by programs or service areas within the same agency or agencies under the auspices of a single board or commission. (This code may be used only with th
INTER AGENCY RECOVERIES
1309Charge Card Purchases of Supplies and Materials: Includes expenditures made by charge card for purchasing supplies and materials under the guidelines of the Small Purchase Charge Card Program.
X
1311Apparel Supplies: Include expenditures for uniforms, protective gear, and similar apparel items for State employees who are furnished apparel by the State.
X
1312Office Supplies: Include expenditures for binders, clips, file folders, ribbons (all types), small batteries, tape (all types), writing utensils, and similar office items.
X
1313Stationery and Forms: Include expenditures for carbon paper, employment application forms, ledger sheets, letter sheets, mailing envelopes, other informational and record forms, other paper, and similar stationery items.
X
1321Coal: Include expenditures for coal or coke consumed in transportation, heating, and/or power generating plants. Include the cost of transporting the coal.
X
1322Gas: Include expenditures for natural and manufactured gas consumed for cooking, heating, power generating plants, and laboratories.
X
1323Gasoline: Include expenditures for diesel fuel, gasoline, or similar fuel consumed in the engines and motors of aircraft, motor vehicles, power equipment, and watercraft.
X
1324Oil: Include expenditures for fuel oil, oil, and oil derivatives consumed in heating, and/or power generating plants. Include the cost of transporting the oil.
X
1325Steam: Include expenditures for steam consumed in heating and/or power generating plants purchased from a second party.
X
1326Wood Fuels: Include expenditures for wood products used for fuel for heating and power generating plants, to include such items as round wood, chips, sawdust, and bark. Include transportation costs.
X
1331Alcoholic Beverages: Include expenditures for purchases of alcoholic beverages which are used strictly for resale purposes.
ALCOHOLIC BEVERAGES
1332 License Tags: Include expenditures for decals and motor vehicle license tags.MANUFACTURING AND MERCHANDISING SUPPLIES - LICENSE TAGS
1333Manufacturing Supplies: Include expenditures for fabrics and leather goods, metals, paints, plastic and synthetic/processed materials, and wood and wood products.
X
1334Merchandise: Include expenditures for materials, supplies, and equipment purchased for resale in substantially the same form as purchased.
X
1335Packaging and Shipping Supplies: Include expenditures for boxes, cartons, containers, packing materials, and similar items.
X
1341Laboratory Supplies: Include expenditures for animals used in research, blood or blood components used in analysis, chemicals, gases, reagents, specimen slides, test tubes, and similar laboratory supplies.
X
Page A-7

CARS Chart of Accounts
Expenditure/
Object CodeExpenditure/Object Text Description
Architecture &
EngineeringConstruction
Goods &
Supplies
Other
Services
Professional
ServicesMarked for Exclusion
1342Medical and Dental Supplies: Include expenditures for bandages, biologics, braces, chemicals, contraceptive devices, crutches, eyeglasses, hearing aids, prosthesis, surgical blades, and similar medical and dental supplies.
X
1343Field Supplies: Include expenditures for items such as sample bottles, chart paper and ink, and similar supplies designed for use in or with field testing and monitoring equipment.
X
1344 Pharmaceutical Drugs: Include expenditures for pharmaceutical drugs. X
1351Building Repair and Maintenance Materials: Include expenditures for bricks, cement, concrete, lumber, mortar, pitch, plasterboard, tar, and similar materials not included in the cost of work performed under contract in the repair and maintenance of struct
X
1352Custodial Repair and Maintenance Materials: Include expenditures for brushes, brooms, chemicals for air conditioning, cleaning preparations, disinfectants, electric bulbs, fluorescent tubes, pesticides, toilet tissue, waxes, water purification and treatme
X
1353Electrical Repair and Maintenance Materials: Include expenditures for circuit breakers, circuits, electrical tape, fuses, plugs, tubes, wiring, and similar electrical repair and maintenance materials not included in the cost of the work performed under co
X
1354Mechanical Repair and Maintenance Materials: Include expenditures for bolts, cable, gears, nuts, pipe screws, solder, and similar mechanical repair and maintenance materials not included in the cost of work performed under contract.
X
1355Vehicle Repair and Maintenance Materials: Include expenditures for automatic transmission fluid, batteries, brake fluid, engine oil, grease, hoses, hub cap, points and plugs, tires, and similar vehicle repair and maintenance materials not included in the
X
1356Highway Repair and Maintenance Materials: Include expenditures for calcium, stone, sand, straw, marking paint, steel brooms, and similar maintenance supplies used in the repair and maintenance of roadways.
X
1361Clothing Supplies: Include expenditures for clothing (buttons, cloth, thread, zippers, and similar articles used in the making of clothing) to be worn by offenders, patients, and other wards of the State.
X
1362 Food and Dietary Supplies: Include expenditures for items of food and drink. X
1363Food Service Supplies: Include expenditures for cutlery, dishes, glasses, paper cups, paper dishes, paper napkins, table cloths, tableware, and similar food service supplies used in preparing, cooking, and serving food.
X
1364Laundry and Linen Supplies: Include expenditures for bedspreads, blankets, diapers, pillows, pillowcases, pillow covers, towels, washcloths, and similar linen supplies. Also include expenditures for bluing, cleansing agents, deodorants, disinfectants, sma
X
1365Personal Care Supplies: Include expenditures for combs, hairbrushes, shampoo, soap, toothbrushes, toothpaste, and similar supplies used for personal hygiene.
X
1371Agricultural Supplies: Include expenditures for animal foods, bulbs, fertilizers, insecticides, seeds, and similar agricultural supply items.
X
1372Architectural and Engineering Supplies: Include expenditures for blue print paper, drafting paper and vellum, inks, transfer letters, and similar supplies. For related expenditures, see 1312 and 1313.
X
1373Computer Operating Supplies: Include expenditures for paper, bar cards, disposable media (e.g., tapes and disks), and other computer operating supplies.
X
1374Educational Supplies: Include expenditures for blank audiotapes, blank phonograph records, blank videotapes, chalk, erasers, and similar educational supplies.
X
1375Fish and Wildlife Supplies: Include expenditures for fish and other marine life, and fowl and game in order to expand, improve, or maintain fish and wildlife populations. Include materials used in habitat reparation and development.
X
1376Law Enforcement Supplies: Include expenditures for ammunition, flares, smoke bombs, tear gas, temporarily disabling liquids, and similar law enforcement supplies.
X
1377 Photographic Supplies: Include expenditures for chemicals, film, digital media, and similar photographic supplies. X
1378Recreational Supplies: Include expenditures for balls, bases, bats, nets, racquets, and similar indoor and outdoor recreational supplies.
X
1379Highway Emergency Operations Materials: Include expenditures for salt, abrasives, and similar materials used in the maintenance of highways during emergency operations.
X
Page A-8

CARS Chart of Accounts
Expenditure/
Object CodeExpenditure/Object Text Description
Architecture &
EngineeringConstruction
Goods &
Supplies
Other
Services
Professional
ServicesMarked for Exclusion
1391Undistributed Supplies and Materials Recoveries: Used only during budget development by agencies designated by DPB to record undistributed budget amounts for supplies and materials recoveries. Cannot be used for expenditures.
MANUFACTURING AND MERCHANDISING SUPPLIES - UNDISTRIBUTED SUPPLIES AND MATERIALS RECOVERIES
1395Undistributed Supplies and Materials Services: Used only to aggregate budget amounts for supplies and materials in Major Object 13. Expenditures cannot be charged to this code.
MANUFACTURING AND MERCHANDISING SUPPLIES - UNDISTRIBUTED SUPPLIES AND MATERIALS
1396Indirect Cost Recoveries from Auxiliary Programs for Supplies and Materials: Include only the required recovery of indirect costs of supplies and materials from Auxiliary Enterprise service areas. (This code may be used only by institutions of higher educ
MANUFACTURING AND MERCHANDISING SUPPLIES - Indirect Cost Recoveries from Auxiliary Programs for Supplies and Materials
1397Late Payment Penalties for Supplies and Materials: Include expenditures for charges assessed by vendors for the late payment of invoices for supplies and materials pursuant to the Prompt Payment Act.
MANUFACTURING AND MERCHANDISING SUPPLIES - Late Payment Penalties for Supplies and Materials
1398Inter-Agency Recoveries for Supplies and Materials: Recovery of the cost of supplies and materials incurred by programs or service areas for services provided to other agencies within the same fiscal year. For recovery of expenditures from the prior fisca
MANUFACTURING AND MERCHANDISING SUPPLIES - Inter-Agency Recoveries for Supplies and Materials
1399Intra-Agency Recoveries for Supplies and Materials: Recovery of the cost of supplies and materials incurred by programs or service areas within the same agency or agencies under the auspices of a single board or commission. (This code may be used only wit
MANUFACTURING AND MERCHANDISING SUPPLIES - Intra-Agency Recoveries for Supplies and Materials
1411Individual Claims and Settlements: Include expenditures for compensation to individuals for information on criminal activities and for personal injuries, property damages, and similar claims and settlements.
Awards, Contributions, and Claims - Individual Claims and Settlements
1412Workers’ Compensation Awards: Includes expenditures of the Workers’ Compensation commission for workers’ compensation payments to individuals. (This subobject code is for the use by the Workers’ Compensation Commission only; other state agencies must use
Awards, Contributions, and Claims - Workers’ Compensation Awards
1413 Premiums: Include expenditures for awards, honorariums, and prizes to individuals and organizations. Awards, Contributions, and Claims - Premiums
1414Unemployment Compensation Awards: Include expenditures for unemployment compensation payments (insurance and claims) to individuals. (Note: This code is used by the VEC to make payments. Other agencies should use 1415.)
Awards, Contributions, and Claims - Unemployment Compensation Awards
1415Unemployment Compensation Reimbursements: Include expenditures for reimbursements made by State agencies to the Trust Fund for benefits provided to former State employees. (Note: This code is used by state agencies to make payments to the VEC.)
Awards, Contributions, and Claims - Unemployment Compensation Reimbursements
1416Payments on Behalf of Individuals: Include payments to third parties for goods or services that are performed for individuals such as payments for victims of crime.
Awards, Contributions, and Claims - Payments on Behalf of Individuals
1417Income Assistance Payments: Include expenditures to individuals for continuing and temporary income supplement programs.
Awards, Contributions, and Claims - Income Assistance Payments
1418Incentives: Include payments to individuals and organizations for incentives to participate in State sponsored programs and activities (such as reforestation projects).
Awards, Contributions, and Claims - Incentives
1421 Graduate Scholarships and Fellowships: Include expenditures for awards to graduate students.Educational and Training Assistance - Graduate Scholarships and Fellowships
1422Student Loans: Include expenditures for payments into the principal of student loan funds in institutions of higher education.
Educational and Training Assistance - Student Loans
1423 Tuition and Training Aids: Include expenditures for special education and rehabilitation training for disabled persons.Educational and Training Assistance - Tuition and Training Aids
1424Tuition Waiver: Include expenditures for costs incurred by institutions of higher education for waiving tuition in part or in whole in conformance with State law and regulations.
Educational and Training Assistance - Tuition Waiver
1425 Undergraduate Scholarships: Include expenditures for awards to undergraduate students.Educational and Training Assistance - Undergraduate Scholarships
1431Categorical Aid to Local Governments and Constitutional Officers (Not Technology): Include expenditures for aid to and dedicated shared revenues with local governments for which the Commonwealth has designated specific use by the local government: such as
Grants and Aid to Local Governments - Categorical Aid to Local Governments and Constitutional Officers
1432Payments in Lieu of Taxes: Include expenditures for payments in lieu of taxes made directly to localities for providing such services as police and fire protection and collection and disposal of refuse, for payments to cities and counties for their share
Grants and Aid to Local Governments - Payments in Lieu of Taxes
1433General Revenue Sharing: Include expenditures for the following non-categorical aid to local governments: ABC Profits; Wine Taxes; Boxing and Wrestling Fees; Rolling Stock Taxes; Mobile Home Taxes; and that portion of H.B. 599 monies designated for locali
Grants and Aid to Local Governments - General Revenue Sharing
1434Disaster Recovery Categorical Aid to Local Governments: Include disaster recovery costs for administrative expenditures. (This code may be used only by the Virginia Department of Emergency Services and only when a presidential disaster is declared.)
Grants and Aid to Local Governments - Disaster Recovery Categorical Aid to Local Governments
Page A-9

CARS Chart of Accounts
Expenditure/
Object CodeExpenditure/Object Text Description
Architecture &
EngineeringConstruction
Goods &
Supplies
Other
Services
Professional
ServicesMarked for Exclusion
1435Special Payments to Localities: Include payments to localities for administrative costs incurred by the localities in implementing car tax relief.
Grants and Aid to Local Governments - Special Payments to Localities
1436Categorical Aid to Local Governments and Constitutional Officers for Technology: Include expenditures for aid to and dedicated shared revenues with local governments for which the Commonwealth has designated specific technology use by the local government
Grants and Aid to Local Governments - Categorical Aid to Local Governments and Constitutional Officers for Technology
1441Payments to Substate Entities: Include payments to substate entities formed pursuant to the Code of Virginia (such as Boards, Commissions, Districts, Authorities, and Community Action Agencies).
Payments on Behalf of Local Governments - Payments to Substate Entities
1442Payments to Individuals: Include expenditures for payments to individuals (such as Aid to Families with Dependent Children) made on behalf of local governments.
Payments on Behalf of Local Governments - Payments to Individuals
1451Grants to Intergovernmental Organizations: Include expenditures for grants and assistance to intergovernmental organizations at the State and substate levels not specifically created by the Code of Virginia (such as interstate compacts which are not desig
Grants to Other Organizations - Grants to Intergovernmental Organizations
1452Grants to Nongovernmental Organizations: Include expenditures for grants and assistance to nongovernmental organizations including profit-making organizations (such as local businesses), not-for-profit organizations (such as local rescue squads), and orga
Grants to Other Organizations - Grants to Nongovernmental Organizations
1453Out-of-State Political Entities: Include transfer payments to political entities outside the Commonwealth, including the federal government, other states, and political subdivisions and substate entities of other states.
Grants to Other Organizations - Out-of-State Political Entities
1455Disaster Recovery Grants to Other State Agencies: Include disaster recovery costs for administrative expenditures. (This code may be used only by the Department of Emergency Management and only when a presidential disaster is declared.)
Grants to Other Organizations - Disaster Recovery Grants to Other State Agencies
1456Disaster Recovery Grants to Nongovernmental Organizations: Include disaster recovery costs for administrative expenditures. (This code may be used only by the Department of Emergency Management and only when a presidential disaster is declared.)
Grants to Other Organizations - Disaster Recovery Grants to Nongovernmental Organizations
1461Administrative Costs/Local Programs: Include expenditures for administrative costs of the political subdivision health insurance programs.
Payments for Local Employees Health Insurance Programs - Administrative Costs/Local Programs
1462 Cost Containment/Local Programs: Include expenditures for cost containment programs for local employees.Payments for Local Employees Health Insurance Programs - Cost Containment/Local Programs
1463 Health Care Claims/Local Programs: Include expenditures for health care claims for local employees.Payments for Local Employees Health Insurance Programs - Health Care Claims/Local Programs
1464Health Maintenance Organizations (HMO) Costs/Local Programs: Include expenditures for Health Maintenance Organizations (HMOs) on behalf of political subdivision employees.
Payments for Local Employees Health Insurance Programs - Health Maintenance Organizations (HMO) Costs/Local Programs
1465Consulting Costs/Local Programs: Include expenditures for consulting contracts for health insurance program for local employees.
Payments for Local Employees Health Insurance Programs - Consulting Costs/Local Programs
1481Statewide Indirect Cost Recoveries: Record recoveries of statewide indirect costs that are eligible for recovery from federal grants and contracts.
Indirect Cost Recoveries - Statewide Indirect Cost Recoveries
1482Agency Indirect Cost Recoveries: Record recoveries of agency indirect costs that are eligible for recovery from federal grants and contracts.
Indirect Cost Recoveries - Agency Indirect Cost Recoveries
1491Undistributed Transfer Payment Recoveries: Used only during budget development by agencies designated by DPB to record undistributed budget amounts for transfer payment recoveries. Cannot be used for expenditures.
Undistributed Transfer Payment Recoveries
1495Undistributed Transfer Payments: Used only to aggregate budget amounts for transfer payments in Major Object 14. Expenditures cannot be charged to this code.
Undistributed Transfer Payments
1496Indirect Cost Recoveries from Auxiliary Programs for Transfer Payments: Include only the required recovery of indirect costs of transfer payments from Auxiliary Enterprise service areas. (This code may be used only by institutions of higher education.)
Indirect Cost Recoveries from Auxiliary Programs for Transfer Payments
1498Inter-Agency Recoveries for Transfer Payments: Recovery of the cost of transfer payments incurred by programs or service areas for services provided to other agencies within the same fiscal year. For recovery of expenditures from the prior fiscal year, se
Inter-Agency Recoveries for Transfer Payments
1499Intra-Agency Recoveries for Transfer Payments: Recovery of the cost of transfer payments incurred by programs or service areas within the same agency or agencies under the auspices of a single board or commission. (This code may be used only with the prio
Intra-Agency Recoveries for Transfer Payments
1511 Aircraft Insurance: Include expenditures to cover damages to aircraft, life, and property. Insurance-Fixed Assets - Aircraft Insurance
1512Automobile Liability: Include expenditures to cover the liability caused by the automobile, the physical damage to the automobile, injury to driver and passengers, and uninsured motorists.
Insurance-Fixed Assets - Automobile Liability
Page A-10
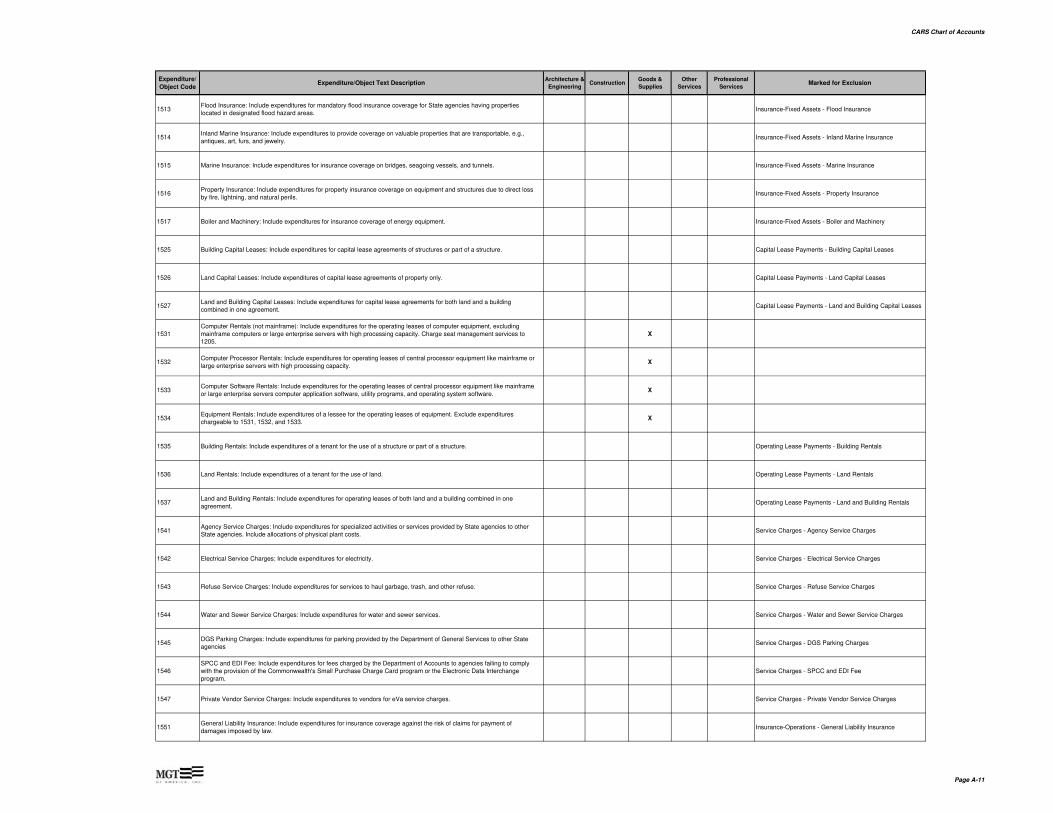
CARS Chart of Accounts
Expenditure/
Object CodeExpenditure/Object Text Description
Architecture &
EngineeringConstruction
Goods &
Supplies
Other
Services
Professional
ServicesMarked for Exclusion
1513Flood Insurance: Include expenditures for mandatory flood insurance coverage for State agencies having properties located in designated flood hazard areas.
Insurance-Fixed Assets - Flood Insurance
1514Inland Marine Insurance: Include expenditures to provide coverage on valuable properties that are transportable, e.g., antiques, art, furs, and jewelry.
Insurance-Fixed Assets - Inland Marine Insurance
1515 Marine Insurance: Include expenditures for insurance coverage on bridges, seagoing vessels, and tunnels. Insurance-Fixed Assets - Marine Insurance
1516Property Insurance: Include expenditures for property insurance coverage on equipment and structures due to direct loss by fire, lightning, and natural perils.
Insurance-Fixed Assets - Property Insurance
1517 Boiler and Machinery: Include expenditures for insurance coverage of energy equipment. Insurance-Fixed Assets - Boiler and Machinery
1525 Building Capital Leases: Include expenditures for capital lease agreements of structures or part of a structure. Capital Lease Payments - Building Capital Leases
1526 Land Capital Leases: Include expenditures of capital lease agreements of property only. Capital Lease Payments - Land Capital Leases
1527Land and Building Capital Leases: Include expenditures for capital lease agreements for both land and a building combined in one agreement.
Capital Lease Payments - Land and Building Capital Leases
1531Computer Rentals (not mainframe): Include expenditures for the operating leases of computer equipment, excluding mainframe computers or large enterprise servers with high processing capacity. Charge seat management services to 1205.
X
1532Computer Processor Rentals: Include expenditures for operating leases of central processor equipment like mainframe or large enterprise servers with high processing capacity.
X
1533Computer Software Rentals: Include expenditures for the operating leases of central processor equipment like mainframe or large enterprise servers computer application software, utility programs, and operating system software.
X
1534Equipment Rentals: Include expenditures of a lessee for the operating leases of equipment. Exclude expenditures chargeable to 1531, 1532, and 1533.
X
1535 Building Rentals: Include expenditures of a tenant for the use of a structure or part of a structure. Operating Lease Payments - Building Rentals
1536 Land Rentals: Include expenditures of a tenant for the use of land. Operating Lease Payments - Land Rentals
1537Land and Building Rentals: Include expenditures for operating leases of both land and a building combined in one agreement.
Operating Lease Payments - Land and Building Rentals
1541Agency Service Charges: Include expenditures for specialized activities or services provided by State agencies to other State agencies. Include allocations of physical plant costs.
Service Charges - Agency Service Charges
1542 Electrical Service Charges: Include expenditures for electricity. Service Charges - Electrical Service Charges
1543 Refuse Service Charges: Include expenditures for services to haul garbage, trash, and other refuse. Service Charges - Refuse Service Charges
1544 Water and Sewer Service Charges: Include expenditures for water and sewer services. Service Charges - Water and Sewer Service Charges
1545DGS Parking Charges: Include expenditures for parking provided by the Department of General Services to other State agencies
Service Charges - DGS Parking Charges
1546SPCC and EDI Fee: Include expenditures for fees charged by the Department of Accounts to agencies failing to comply with the provision of the Commonwealth's Small Purchase Charge Card program or the Electronic Data Interchange program.
Service Charges - SPCC and EDI Fee
1547 Private Vendor Service Charges: Include expenditures to vendors for eVa service charges. Service Charges - Private Vendor Service Charges
1551General Liability Insurance: Include expenditures for insurance coverage against the risk of claims for payment of damages imposed by law.
Insurance-Operations - General Liability Insurance
Page A-11
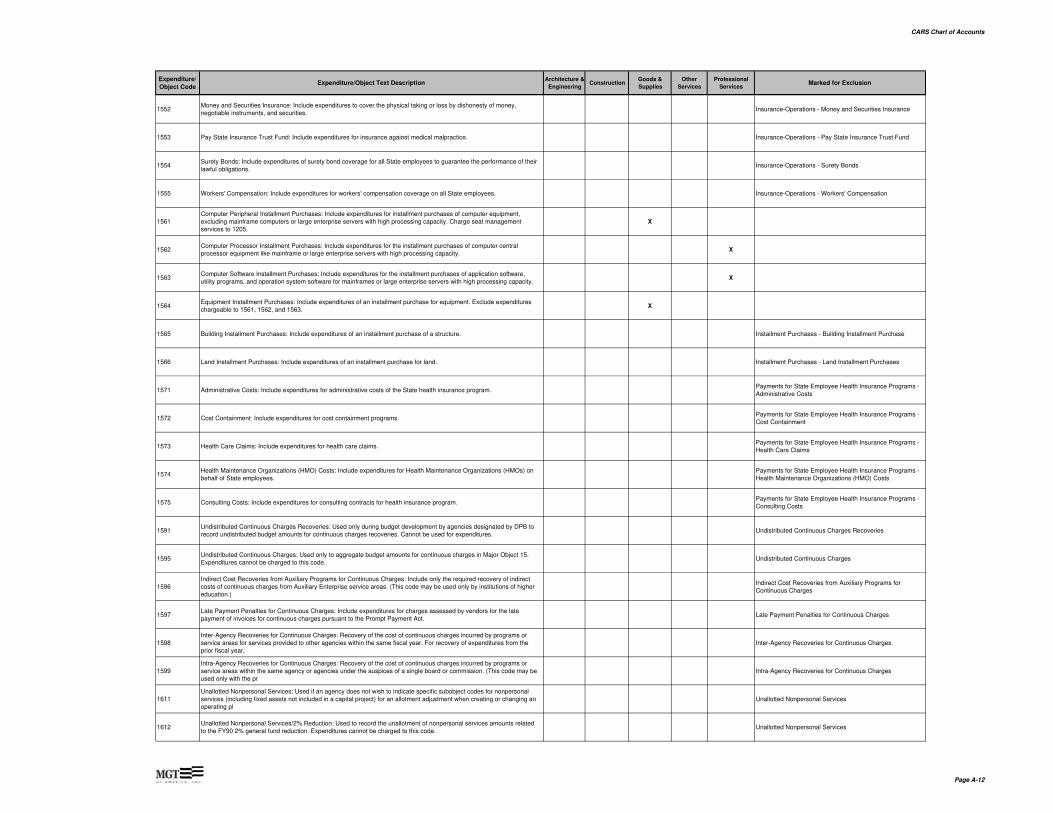
CARS Chart of Accounts
Expenditure/
Object CodeExpenditure/Object Text Description
Architecture &
EngineeringConstruction
Goods &
Supplies
Other
Services
Professional
ServicesMarked for Exclusion
1552Money and Securities Insurance: Include expenditures to cover the physical taking or loss by dishonesty of money, negotiable instruments, and securities.
Insurance-Operations - Money and Securities Insurance
1553 Pay State Insurance Trust Fund: Include expenditures for insurance against medical malpractice. Insurance-Operations - Pay State Insurance Trust Fund
1554Surety Bonds: Include expenditures of surety bond coverage for all State employees to guarantee the performance of their lawful obligations.
Insurance-Operations - Surety Bonds
1555 Workers' Compensation: Include expenditures for workers' compensation coverage on all State employees. Insurance-Operations - Workers' Compensation
1561Computer Peripheral Installment Purchases: Include expenditures for installment purchases of computer equipment, excluding mainframe computers or large enterprise servers with high processing capacity. Charge seat management services to 1205.
X
1562Computer Processor Installment Purchases: Include expenditures for the installment purchases of computer central processor equipment like mainframe or large enterprise servers with high processing capacity.
X
1563Computer Software Installment Purchases: Include expenditures for the installment purchases of application software, utility programs, and operation system software for mainframes or large enterprise servers with high processing capacity.
X
1564Equipment Installment Purchases: Include expenditures of an installment purchase for equipment. Exclude expenditures chargeable to 1561, 1562, and 1563.
X
1565 Building Installment Purchases: Include expenditures of an installment purchase of a structure. Installment Purchases - Building Installment Purchase
1566 Land Installment Purchases: Include expenditures of an installment purchase for land. Installment Purchases - Land Installment Purchases
1571 Administrative Costs: Include expenditures for administrative costs of the State health insurance program.Payments for State Employee Health Insurance Programs - Administrative Costs
1572 Cost Containment: Include expenditures for cost containment programs.Payments for State Employee Health Insurance Programs - Cost Containment
1573 Health Care Claims: Include expenditures for health care claims.Payments for State Employee Health Insurance Programs - Health Care Claims
1574Health Maintenance Organizations (HMO) Costs: Include expenditures for Health Maintenance Organizations (HMOs) on behalf of State employees.
Payments for State Employee Health Insurance Programs - Health Maintenance Organizations (HMO) Costs
1575 Consulting Costs: Include expenditures for consulting contracts for health insurance program.Payments for State Employee Health Insurance Programs - Consulting Costs
1591Undistributed Continuous Charges Recoveries: Used only during budget development by agencies designated by DPB to record undistributed budget amounts for continuous charges recoveries. Cannot be used for expenditures.
Undistributed Continuous Charges Recoveries
1595Undistributed Continuous Charges: Used only to aggregate budget amounts for continuous charges in Major Object 15. Expenditures cannot be charged to this code.
Undistributed Continuous Charges
1596Indirect Cost Recoveries from Auxiliary Programs for Continuous Charges: Include only the required recovery of indirect costs of continuous charges from Auxiliary Enterprise service areas. (This code may be used only by institutions of higher education.)
Indirect Cost Recoveries from Auxiliary Programs for Continuous Charges
1597Late Payment Penalties for Continuous Charges: Include expenditures for charges assessed by vendors for the late payment of invoices for continuous charges pursuant to the Prompt Payment Act.
Late Payment Penalties for Continuous Charges
1598Inter-Agency Recoveries for Continuous Charges: Recovery of the cost of continuous charges incurred by programs or service areas for services provided to other agencies within the same fiscal year. For recovery of expenditures from the prior fiscal year,
Inter-Agency Recoveries for Continuous Charges
1599Intra-Agency Recoveries for Continuous Charges: Recovery of the cost of continuous charges incurred by programs or service areas within the same agency or agencies under the auspices of a single board or commission. (This code may be used only with the pr
Intra-Agency Recoveries for Continuous Charges
1611Unallotted Nonpersonal Services: Used if an agency does not wish to indicate specific subobject codes for nonpersonal services (including fixed assets not included in a capital project) for an allotment adjustment when creating or changing an operating pl
Unallotted Nonpersonal Services
1612Unallotted Nonpersonal Services/2% Reduction: Used to record the unallotment of nonpersonal services amounts related to the FY90 2% general fund reduction. Expenditures cannot be charged to this code.
Unallotted Nonpersonal Services
Page A-12
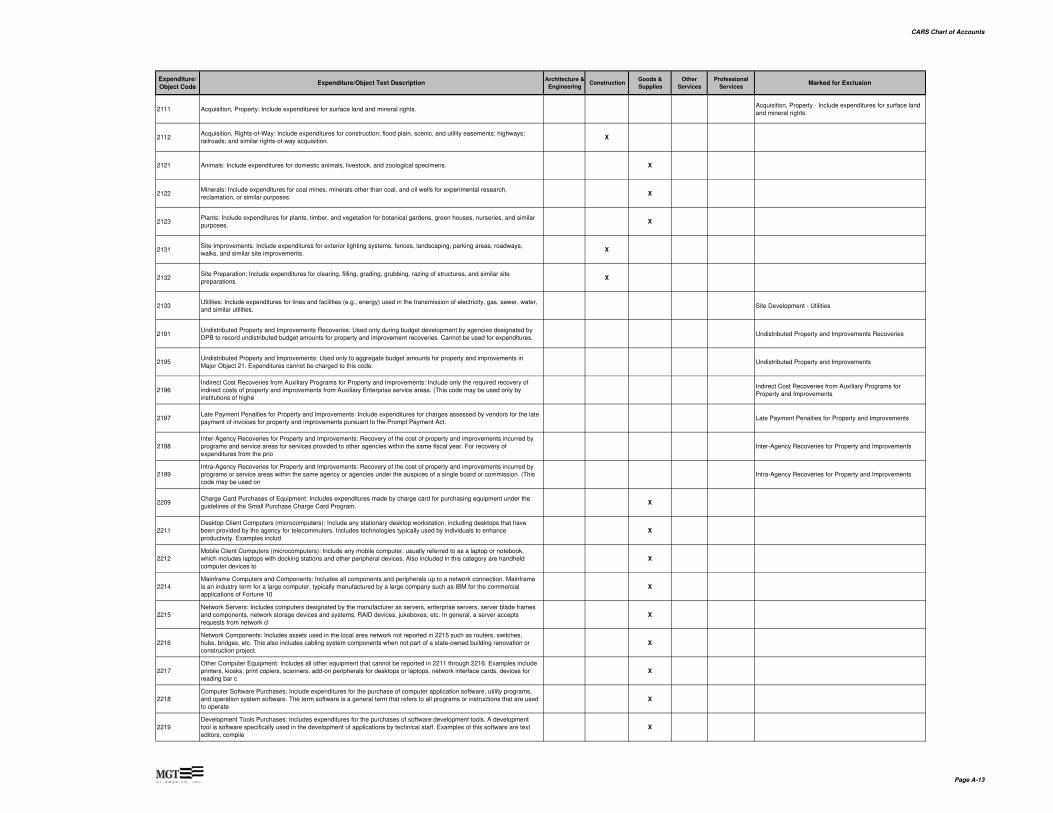
CARS Chart of Accounts
Expenditure/
Object CodeExpenditure/Object Text Description
Architecture &
EngineeringConstruction
Goods &
Supplies
Other
Services
Professional
ServicesMarked for Exclusion
2111 Acquisition, Property: Include expenditures for surface land and mineral rights.Acquisition, Property - Include expenditures for surface land and mineral rights.
2112Acquisition, Rights-of-Way: Include expenditures for construction; flood plain, scenic, and utility easements; highways; railroads; and similar rights-of-way acquisition.
X
2121 Animals: Include expenditures for domestic animals, livestock, and zoological specimens. X
2122Minerals: Include expenditures for coal mines, minerals other than coal, and oil wells for experimental research, reclamation, or similar purposes.
X
2123Plants: Include expenditures for plants, timber, and vegetation for botanical gardens, green houses, nurseries, and similar purposes.
X
2131Site Improvements: Include expenditures for exterior lighting systems, fences, landscaping, parking areas, roadways, walks, and similar site improvements.
X
2132Site Preparation: Include expenditures for clearing, filling, grading, grubbing, razing of structures, and similar site preparations.
X
2133Utilities: Include expenditures for lines and facilities (e.g., energy) used in the transmission of electricity, gas, sewer, water, and similar utilities.
Site Development - Utilities
2191Undistributed Property and Improvements Recoveries: Used only during budget development by agencies designated by DPB to record undistributed budget amounts for property and improvement recoveries. Cannot be used for expenditures.
Undistributed Property and Improvements Recoveries
2195Undistributed Property and Improvements: Used only to aggregate budget amounts for property and improvements in Major Object 21. Expenditures cannot be charged to this code.
Undistributed Property and Improvements
2196Indirect Cost Recoveries from Auxiliary Programs for Property and Improvements: Include only the required recovery of indirect costs of property and improvements from Auxiliary Enterprise service areas. (This code may be used only by institutions of highe
Indirect Cost Recoveries from Auxiliary Programs for Property and Improvements
2197Late Payment Penalties for Property and Improvements: Include expenditures for charges assessed by vendors for the late payment of invoices for property and improvements pursuant to the Prompt Payment Act.
Late Payment Penalties for Property and Improvements
2198Inter-Agency Recoveries for Property and Improvements: Recovery of the cost of property and improvements incurred by programs and service areas for services provided to other agencies within the same fiscal year. For recovery of expenditures from the prio
Inter-Agency Recoveries for Property and Improvements
2199Intra-Agency Recoveries for Property and Improvements: Recovery of the cost of property and improvements incurred by programs or service areas within the same agency or agencies under the auspices of a single board or commission. (This code may be used on
Intra-Agency Recoveries for Property and Improvements
2209Charge Card Purchases of Equipment: Includes expenditures made by charge card for purchasing equipment under the guidelines of the Small Purchase Charge Card Program.
X
2211Desktop Client Computers (microcomputers): Include any stationary desktop workstation, including desktops that have been provided by the agency for telecommuters. Includes technologies typically used by individuals to enhance productivity. Examples includ
X
2212Mobile Client Computers (microcomputers): Include any mobile computer, usually referred to as a laptop or notebook, which includes laptops with docking stations and other peripheral devices. Also included in this category are handheld computer devices to
X
2214Mainframe Computers and Components: Includes all components and peripherals up to a network connection. Mainframe is an industry term for a large computer, typically manufactured by a large company such as IBM for the commercial applications of Fortune 10
X
2215Network Servers: Includes computers designated by the manufacturer as servers, enterprise servers, server blade frames and components, network storage devices and systems, RAID devices, jukeboxes, etc. In general, a server accepts requests from network cl
X
2216Network Components: Includes assets used in the local area network not reported in 2215 such as routers, switches, hubs, bridges, etc. This also includes cabling system components when not part of a state-owned building renovation or construction project.
X
2217Other Computer Equipment: Includes all other equipment that cannot be reported in 2211 through 2216. Examples include printers, kiosks, print copiers, scanners, add-on peripherals for desktops or laptops, network interface cards, devices for reading bar c
X
2218Computer Software Purchases: Include expenditures for the purchase of computer application software, utility programs, and operation system software. The term software is a general term that refers to all programs or instructions that are used to operate
X
2219Development Tools Purchases: Includes expenditures for the purchases of software development tools. A development tool is software specifically used in the development of applications by technical staff. Examples of this software are text editors, compile
X
Page A-13

CARS Chart of Accounts
Expenditure/
Object CodeExpenditure/Object Text Description
Architecture &
EngineeringConstruction
Goods &
Supplies
Other
Services
Professional
ServicesMarked for Exclusion
2221College Library Books: Include expenditures for books, microfiche, periodicals, and similar equipment used in libraries of institutions of higher education.
X
2222Educational Equipment: Include expenditures for auditorium seating, chalkboards, classroom furniture, and similar equipment.
X
2223Exhibit Equipment: Include expenditures for artifacts, artworks, scientific paraphernalia, and similar museum materials and equipment.
X
2224Reference Equipment: Include expenditures for books not used in libraries of institutions of higher education, card catalogs, carrels, library desks, microfilm readers, and similar reference equipment.
X
2228Educational and Cultural Equipment Improvements: Include expenditures for restorations of and additions or modifications to existing educational and cultural equipment which expands capability or capacity, or improves performance.
X
2231Electronic Equipment: Include expenditures for intercommunication systems, radar, radios, televisions, and similar electronic equipment.
X
2232Photographic Equipment: Include expenditures for blueprint equipment, cameras, enlargers, lenses, overhead viewers, projectors, screens, splicers, tripods, and similar photographic equipment.
X
2233Voice and Data Transmission Equipment: Include expenditures for facsimile-transmitters, switchboards, telephones, teletypewriters, and similar equipment.
X
2238Electronic and Photographic Equipment Improvements: Include expenditures for restorations of and additions or modifications to existing communications and photographic equipment which expands capability or capacity, or improves performance.
X
2241Laboratory Equipment: Include expenditures for blood gas analyzers, Bunsen burners, centrifuges, freezing point depression instruments, gas chromatographs, incubators, microscopes, spectrophotometers, and similar equipment.
X
2242Medical and Dental Equipment: Include expenditures for anesthesia and respiratory therapy equipment, dental equipment, diagnostic apparatus, electrotherapeutic equipment, examining room furniture, fracture and orthopedic equipment, hospital and medical li
X
2243Field Equipment: Include expenditures for portable and/or permanent nondisposable equipment, such as automatic samplers and ambient air/water meters or analyzers, designed and purchased primarily for use in non-laboratory settings.
X
2248Medical and Laboratory Equipment Improvements: Include expenditures for restorations of and additions or modifications to existing medical and laboratory and field equipment which expands capability or capacity, or improves performance.
X
2251Agricultural Vehicular Equipment: Include expenditures for planting, seeding and harvesting devices; silage cutters; threshing machines; tractors; wagons; and similar agricultural equipment.
X
2252 Aircraft Equipment: Include expenditures for airplanes, helicopters, and similar aircraft equipment. X
2253Construction Equipment: Include expenditures for air hammers, backhoes, bulldozers, cranes, graders, portable generators, pumps, and similar equipment.
X
2254Motor Vehicle Equipment: Include expenditures for automobiles, buses, forklifts, mopeds, motorcycles, trucks, and similar equipment.
X
2255Power Repair and Maintenance Equipment: Include expenditures for power hedge clippers, power mowers, small power drills, small power sanders, small power saws, routers, and similar power repair and maintenance equipment.
X
2256Watercraft Equipment: Include expenditures for amphibious craft, boats, diving bells, rafts, ships, and similar watercraft equipment.
X
2258Motorized Equipment Improvements: Include expenditures for restorations of and additions or modifications to existing vehicular equipment which expands the capability or capacity, or improves performance.
X
2261Office Appurtenances: Include expenditures for blinds, carpets, draperies, plants, rugs, shades, wall decorations, and similar office appurtenances.
X
2262Office Furniture: Include expenditures for bookcases, desks, chairs, file cabinets, lamps, racks, storage cabinets, tables, and similar office furniture.
X
2263Office Incidentals: Include expenditures for ashtrays, compasses, date stamps, desk organizers, file boxes, letter openers, rulers, scissors, staplers, T-squares, and similar "desk top" office equipment.
X
Page A-14

CARS Chart of Accounts
Expenditure/
Object CodeExpenditure/Object Text Description
Architecture &
EngineeringConstruction
Goods &
Supplies
Other
Services
Professional
ServicesMarked for Exclusion
2264Office Machines: Include expenditures for adding machines, bookkeeping machines, calculators, drafting machines, duplicating and photocopying machines, posting machines, transcribing and dictating machines, typewriters, weight scales, and similar equipmen
X
2268Office Equipment Improvements: Include expenditures for restorations of and additions or modifications to existing office equipment which expands capability or capacity, or improves performance.
X
2271Household Equipment: Include expenditures for beds, bureaus, chairs, dressers, heaters, mattresses, refrigerators, stoves, tables, portable fire extinguishers, and similar equipment.
X
2272Law Enforcement Equipment: Include expenditures for clubs, firearms, helmets, shields, surveillance apparatus, and similar law enforcement use equipment.
X
2273Manufacturing Equipment: Include expenditures for drills, lathes, looms, presses, saws, stampers, and similar manufacturing use equipment.
X
2274Non-Power Repair and Maintenance Equipment: Include expenditures for files, hammers, manual drills, manual hedge clippers, manual lawn mowers, saws, screwdrivers, wrenches, and similar non-power repair and maintenance.
X
2275Recreational Equipment: Include expenditures for gymnasium, park, playground, recreational center, and similar apparatus and equipment.
X
2276Traffic Control Equipment: Include expenditures for traffic cones, barrels, sign stands, signs and similar items used during maintenance operations on roadways.
X
2277Firearms Equipment: Include expenditures for firearms such as handguns, rifles, and shotguns. Use 2272 for expenditures such as ammunition or for ancillary equipment such as holsters, belts, and cases purchased separately from the firearm.
X
2278Specific Use Equipment Improvements: Include expenditures for restorations of and additions or modifications to exiting specific use equipment which expands capability or capacity, or improves performance.
X
2281Built-in Equipment: Include expenditures for benches, laboratory tables, platforms, shelving, stages, wall cabinets, and similar built-in equipment normally included during construction as special stationary features.
X
2282Fixtures: Include expenditures for electrical; heating, lighting, plumbing, and similar fixtures normally affixed to walls, floors, and ceilings.
X
2283Mechanical Equipment: Include expenditures for air conditioners, boilers, elevators, switching, and similar mechanical equipment normally included in a structure at time of construction.
X
2288Stationary Equipment Improvements: Include expenditures for restorations of and additions or modifications to existing stationary equipment which expands the capability or capacity, or improves performance.
X
2291Undistributed Equipment Recoveries: Used only during budget development by agencies designated by DPB to record undistributed budget amounts for equipment recoveries. Cannot be used for expenditures.
Undistributed Equipment Recoveries
2295Undistributed Equipment: Used only to aggregate budget amounts for equipment in Major Object 22. Expenditures cannot be charged to this code.
Undistributed Equipment
2296Indirect Cost Recoveries from Auxiliary Programs for Equipment: Include only the required recovery of indirect costs of equipment from Auxiliary Enterprise service areas. (This code may be used only by institutions of higher education.)
Indirect Cost Recoveries from Auxiliary Programs for Equipment
2297Late Payment Penalties for Equipment: Include expenditures for charges assessed by vendors for the late payment of invoices for equipment pursuant to the Prompt Payment Act.
Late Payment Penalties for Equipment
2298Inter-Agency Recoveries for Equipment: Recovery of the cost of equipment incurred by programs or service areas for services provided to other agencies within the same fiscal
Inter-Agency Recoveries for Equipment
2299Intra-Agency Recoveries for Equipment: Recovery of the cost of equipment incurred by program or service areas within the same agency or agencies under the auspices of a single board or commission. (This code may be used only with the prior written approva
Intra-Agency Recoveries for Equipment
2311 Acquisition, Bridges: Include expenditures for purchase or condemnation of bridges, causeways, and tunnels. X
2312 Acquisition, Buildings: Include expenditures for purchase or condemnation of buildings, shelters, and towers. X
2313 Acquisition, Highways: Include expenditures for purchase or condemnation of alleys, highways, roadways, and streets. X
Page A-15
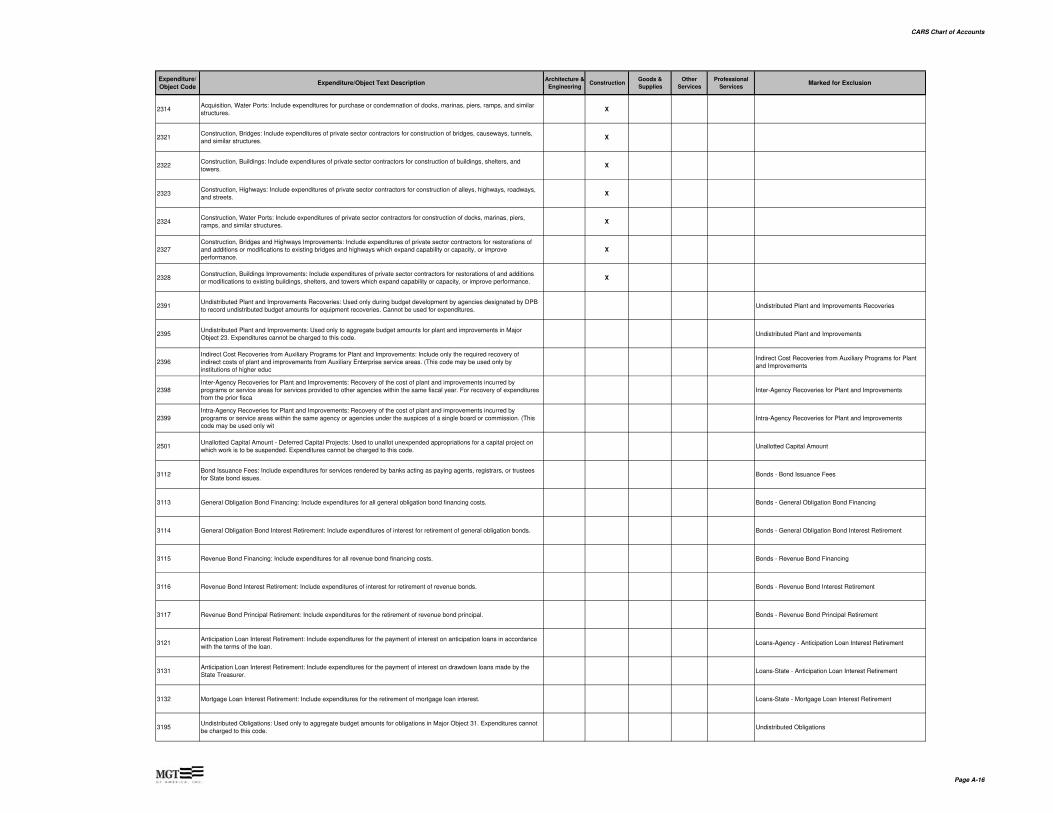
CARS Chart of Accounts
Expenditure/
Object CodeExpenditure/Object Text Description
Architecture &
EngineeringConstruction
Goods &
Supplies
Other
Services
Professional
ServicesMarked for Exclusion
2314Acquisition, Water Ports: Include expenditures for purchase or condemnation of docks, marinas, piers, ramps, and similar structures.
X
2321Construction, Bridges: Include expenditures of private sector contractors for construction of bridges, causeways, tunnels, and similar structures.
X
2322Construction, Buildings: Include expenditures of private sector contractors for construction of buildings, shelters, and towers.
X
2323Construction, Highways: Include expenditures of private sector contractors for construction of alleys, highways, roadways, and streets.
X
2324Construction, Water Ports: Include expenditures of private sector contractors for construction of docks, marinas, piers, ramps, and similar structures.
X
2327Construction, Bridges and Highways Improvements: Include expenditures of private sector contractors for restorations of and additions or modifications to existing bridges and highways which expand capability or capacity, or improve performance.
X
2328Construction, Buildings Improvements: Include expenditures of private sector contractors for restorations of and additions or modifications to existing buildings, shelters, and towers which expand capability or capacity, or improve performance.
X
2391Undistributed Plant and Improvements Recoveries: Used only during budget development by agencies designated by DPB to record undistributed budget amounts for equipment recoveries. Cannot be used for expenditures.
Undistributed Plant and Improvements Recoveries
2395Undistributed Plant and Improvements: Used only to aggregate budget amounts for plant and improvements in Major Object 23. Expenditures cannot be charged to this code.
Undistributed Plant and Improvements
2396Indirect Cost Recoveries from Auxiliary Programs for Plant and Improvements: Include only the required recovery of indirect costs of plant and improvements from Auxiliary Enterprise service areas. (This code may be used only by institutions of higher educ
Indirect Cost Recoveries from Auxiliary Programs for Plant and Improvements
2398Inter-Agency Recoveries for Plant and Improvements: Recovery of the cost of plant and improvements incurred by programs or service areas for services provided to other agencies within the same fiscal year. For recovery of expenditures from the prior fisca
Inter-Agency Recoveries for Plant and Improvements
2399Intra-Agency Recoveries for Plant and Improvements: Recovery of the cost of plant and improvements incurred by programs or service areas within the same agency or agencies under the auspices of a single board or commission. (This code may be used only wit
Intra-Agency Recoveries for Plant and Improvements
2501Unallotted Capital Amount - Deferred Capital Projects: Used to unallot unexpended appropriations for a capital project on which work is to be suspended. Expenditures cannot be charged to this code.
Unallotted Capital Amount
3112Bond Issuance Fees: Include expenditures for services rendered by banks acting as paying agents, registrars, or trustees for State bond issues.
Bonds - Bond Issuance Fees
3113 General Obligation Bond Financing: Include expenditures for all general obligation bond financing costs. Bonds - General Obligation Bond Financing
3114 General Obligation Bond Interest Retirement: Include expenditures of interest for retirement of general obligation bonds. Bonds - General Obligation Bond Interest Retirement
3115 Revenue Bond Financing: Include expenditures for all revenue bond financing costs. Bonds - Revenue Bond Financing
3116 Revenue Bond Interest Retirement: Include expenditures of interest for retirement of revenue bonds. Bonds - Revenue Bond Interest Retirement
3117 Revenue Bond Principal Retirement: Include expenditures for the retirement of revenue bond principal. Bonds - Revenue Bond Principal Retirement
3121Anticipation Loan Interest Retirement: Include expenditures for the payment of interest on anticipation loans in accordance with the terms of the loan.
Loans-Agency - Anticipation Loan Interest Retirement
3131Anticipation Loan Interest Retirement: Include expenditures for the payment of interest on drawdown loans made by the State Treasurer.
Loans-State - Anticipation Loan Interest Retirement
3132 Mortgage Loan Interest Retirement: Include expenditures for the retirement of mortgage loan interest. Loans-State - Mortgage Loan Interest Retirement
3195Undistributed Obligations: Used only to aggregate budget amounts for obligations in Major Object 31. Expenditures cannot be charged to this code.
Undistributed Obligations
Page A-16

CARS Chart of Accounts
Expenditure/
Object CodeExpenditure/Object Text Description
Architecture &
EngineeringConstruction
Goods &
Supplies
Other
Services
Professional
ServicesMarked for Exclusion
3196Indirect Cost Recoveries from Auxiliary Programs for Obligations: Include only the required recovery of indirect costs of obligations from Auxiliary Enterprise service areas. (This code may be used only by institutions of higher education.)
Indirect Cost Recoveries from Auxiliary Programs for Obligations
3198Inter-Agency Recoveries for Obligations: Recovery of the cost of obligations incurred by programs or service areas for services provided to other agencies within the same fiscal year. For recovery of expenditures from the prior fiscal year, see memo from
Inter-Agency Recoveries for Obligations
3199Intra-Agency Recoveries for Obligations: Recovery of the cost of obligations incurred by programs or service areas within the same agency or agencies under the auspices of single board or commission. (This code may be used only with the prior written appr
Intra-Agency Recoveries for Obligations
4101 Sum Sufficient Recovery: Used to cost out activities for sum sufficient operations. Sum Sufficient Recovery
5101Undistributed Saving Amounts/Non-General Fund: Used to record nongeneral fund portion of undistributed budget reduction amounts. Expenditures cannot be charged to this code.
Undistributed Saving Amounts/Non-General Fund
Page A-17

APPENDIX B:PRIME CONTRACTOR
UTILIZATION BASED ON COMMONWEALTH ACCOUNTING
AND REPORTING SYSTEM (CARS) INCLUDES DEPARTMENT
OF TRANSPORTATION
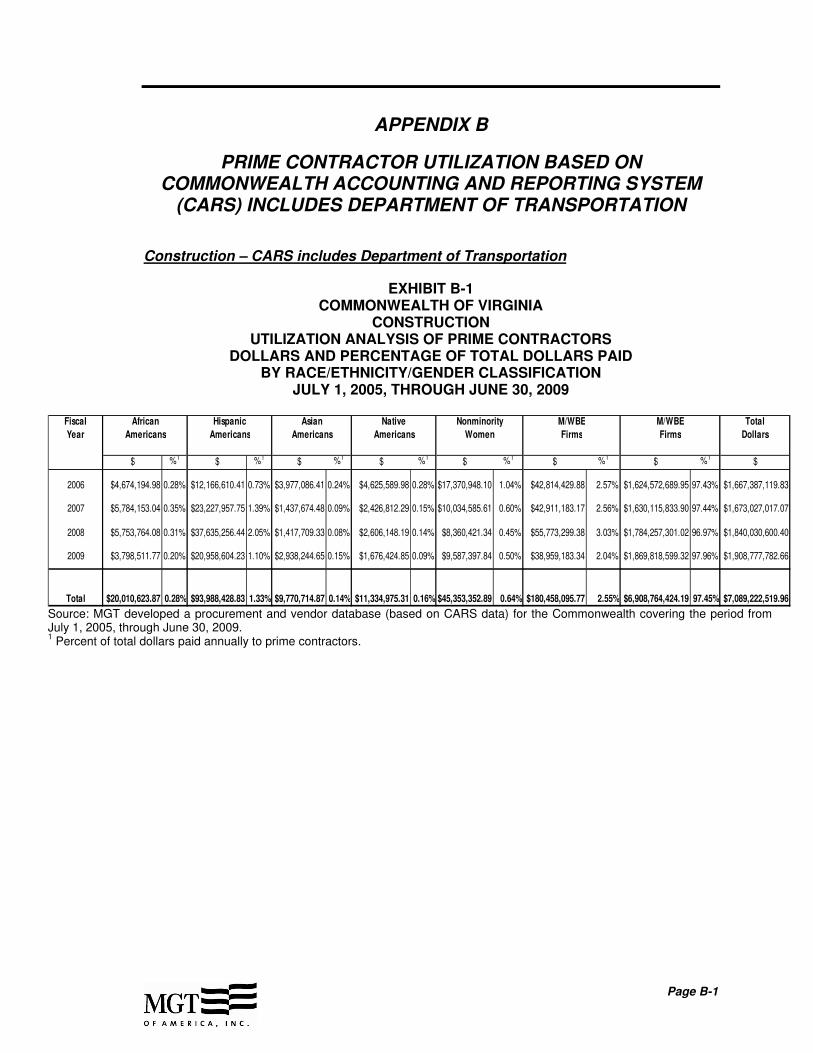
Page B-1
APPENDIX B
PRIME CONTRACTOR UTILIZATION BASED ON COMMONWEALTH ACCOUNTING AND REPORTING SYSTEM
(CARS) INCLUDES DEPARTMENT OF TRANSPORTATION
Construction – CARS includes Department of Transportation
EXHIBIT B-1 COMMONWEALTH OF VIRGINIA
CONSTRUCTION UTILIZATION ANALYSIS OF PRIME CONTRACTORS
DOLLARS AND PERCENTAGE OF TOTAL DOLLARS PAID BY RACE/ETHNICITY/GENDER CLASSIFICATION
JULY 1, 2005, THROUGH JUNE 30, 2009
Fiscal African Hispanic Asian Native Nonminority M/WBE M/WBE Total
Year Americans Americans Americans Americans Women Firms Firms Dollars
$ %1$ %1
$ %1$ %1
$ %1$ %1
$ %1$
2006 $4,674,194.98 0.28% $12,166,610.41 0.73% $3,977,086.41 0.24% $4,625,589.98 0.28% $17,370,948.10 1.04% $42,814,429.88 2.57% $1,624,572,689.95 97.43% $1,667,387,119.83
2007 $5,784,153.04 0.35% $23,227,957.75 1.39% $1,437,674.48 0.09% $2,426,812.29 0.15% $10,034,585.61 0.60% $42,911,183.17 2.56% $1,630,115,833.90 97.44% $1,673,027,017.07
2008 $5,753,764.08 0.31% $37,635,256.44 2.05% $1,417,709.33 0.08% $2,606,148.19 0.14% $8,360,421.34 0.45% $55,773,299.38 3.03% $1,784,257,301.02 96.97% $1,840,030,600.40
2009 $3,798,511.77 0.20% $20,958,604.23 1.10% $2,938,244.65 0.15% $1,676,424.85 0.09% $9,587,397.84 0.50% $38,959,183.34 2.04% $1,869,818,599.32 97.96% $1,908,777,782.66
Total $20,010,623.87 0.28% $93,988,428.83 1.33% $9,770,714.87 0.14% $11,334,975.31 0.16% $45,353,352.89 0.64% $180,458,095.77 2.55% $6,908,764,424.19 97.45% $7,089,222,519.96
Source: MGT developed a procurement and vendor database (based on CARS data) for the Commonwealth covering the period from July 1, 2005, through June 30, 2009. 1 Percent of total dollars paid annually to prime contractors.

Prime Contractor Utilization Based on CARS (includes Department of Transportation)
Page B-2
EXHIBIT B-2 COMMONWEALTH OF VIRGINIA
CONSTRUCTION NUMBER OF UTILIZED UNIQUE PRIME CONTRACTORS
BY RACE/ETHNICITY/GENDER CLASSIFICATION JULY 1, 2005, THROUGH JUNE 30, 2009
Fiscal African Hispanic Asian Native Nonminority M/WBE Non-M/WBE Total
Year Americans Americans Americans Americans Women Firms Firms Firms
# %1# %1
# %1# %1
# %1# %1
# %1#
2006 103 1.76% 42 0.72% 28 0.48% 12 0.21% 45 0.77% 230 3.94% 5,606 96.06% 5,836
2007 95 1.94% 46 0.94% 28 0.57% 13 0.26% 46 0.94% 228 4.65% 4,678 95.35% 4,906
2008 90 2.13% 60 1.42% 21 0.50% 8 0.19% 43 1.02% 222 5.26% 3,995 94.74% 4,217
2009 119 2.45% 70 1.44% 21 0.43% 13 0.27% 47 0.97% 270 5.56% 4,588 94.44% 4,858
230 1.90% 97 0.80% 50 0.41% 28 0.23% 89 0.74% 494 4.09% 11,594 95.91% 12,088
Unique Firms
Over Four
Years2
Source: MGT developed a procurement and vendor database (based on CARS data) for the Commonwealth covering the period from July 1, 2005, through June 30, 2009. 1 Percentage of total firms.
2 “Unique Firms” counts a firm only once for each year it receives work. Since a firm could be used in multiple years, the
“Unique Firms” for the entire study period may not equal the sum of all years.
Architecture and Engineering Services – CARS includes Department of Transportation
EXHIBIT B-3
COMMONWEALTH OF VIRGINIA ARCHITECTURE AND ENGINEERING
UTILIZATION ANALYSIS OF PRIME CONSULTANTS BY RACE/ETHNICITY/GENDER CLASSIFICATION
JULY 1, 2005, THROUGH JUNE 30, 2009
Fiscal African Hispanic Asian Native Nonminority M/WBE M/WBE Total
Year Americans Americans Americans Americans Women Firms Firms Dollars
$ %1$ %1
$ %1$ %1
$ %1$ %1
$ %1$
2006 $201,400.19 0.06% $514,378.92 0.15% $365,097.87 0.11% $0.00 0.00% $510,708.43 0.15% $1,591,585.41 0.46% $344,863,287.53 99.54% $346,454,872.94
2007 $694,672.63 0.21% $1,344,470.00 0.41% $487,153.86 0.15% $0.00 0.00% $1,106,307.17 0.34% $3,632,603.66 1.11% $323,816,288.98 98.89% $327,448,892.64
2008 $4,280,949.49 1.68% $1,081,963.32 0.42% $679,519.85 0.27% $0.00 0.00% $2,098,191.04 0.82% $8,140,623.70 3.19% $247,117,464.78 96.81% $255,258,088.48
2009 $258,372.21 0.11% $1,715,682.76 0.70% $611,845.14 0.25% $543,193.59 0.22% $2,357,076.19 0.97% $5,486,169.89 2.25% $238,032,197.95 97.75% $243,518,367.84
Total $5,435,394.52 0.46% $4,656,495.00 0.40% $2,143,616.72 0.18% $543,193.59 0.05% $6,072,282.83 0.52% $18,850,982.66 1.61% $1,153,829,239.24 98.39% $1,172,680,221.90
Source: MGT developed a procurement and vendor database (based on CARS data) for the Commonwealth covering the period from July 1, 2005, through June 30, 2009. 1 Percent of total dollars paid annually to prime consultants.

Prime Contractor Utilization Based on CARS (includes Department of Transportation)
Page B-3
EXHIBIT B-4 COMMONWEALTH OF VIRGINIA
ARCHITECTURE AND ENGINEERING NUMBER OF UNIQUE PRIME CONSULTANTS
BY RACE/ETHNICITY/GENDER CLASSIFICATION JULY 1, 2005, THROUGH JUNE 30, 2009
Fiscal African Hispanic Asian Native Nonminority M/WBE M/WBE Total
Year Americans Americans Americans Americans Women Firms Firms Firms
# %1# %1
# %1# %1
# %1# %1
# %1#
2006 5 0.98% 3 0.59% 5 0.98% 0 0.00% 3 0.59% 16 3.15% 492 96.85% 508
2007 9 1.79% 3 0.60% 5 1.00% 0 0.00% 3 0.60% 20 3.98% 482 96.02% 502
2008 13 2.90% 2 0.45% 2 0.45% 0 0.00% 4 0.89% 21 4.69% 427 95.31% 448
2009 11 2.24% 4 0.81% 3 0.61% 1 0.20% 4 0.81% 23 4.67% 469 95.33% 492
21 2.16% 5 0.52% 7 0.72% 1 0.10% 5 0.52% 39 4.02% 931 95.98% 970
Unique Firms
Over Four
Years2
Source: MGT developed a procurement and vendor database (based on CARS data) for the Commonwealth covering the period from July 1, 2005, through June 30, 2009. 1 Percentage of Total Firms.
2 “Unique Firms counts a firm only once for each year it receives work. Since a firm could be used in multiple years, the
“Unique Firms” for the entire study period may not equal the sum of all years.
Professional Services – CARS includes Department of Transportation
EXHIBIT B-5 COMMONWEALTH OF VIRGINIA
PROFESSIONAL SERVICES UTILIZATION ANALYSIS OF PRIME CONSULTANTS
BY RACE/ETHNICITY/GENDER CLASSIFICATION JULY 1, 2005, THROUGH JUNE 30, 2009
Fiscal African Hispanic Asian Native Nonminority M/WBE M/WBE Total
Year Americans Americans Americans Americans Women Firms Firms Dollars
$ %1$ %1
$ %1$ %1
$ %1$ %1
$ %1$
2006 $10,079,454.60 1.40% $2,705,079.86 0.37% $9,542,733.06 1.32% $11,370.00 0.00% $1,742,293.34 0.24% $24,080,930.86 3.34% $697,904,321.34 96.66% $721,985,252.20
2007 $8,634,070.35 0.99% $3,199,765.95 0.37% $6,233,342.91 0.72% $5,041.15 0.00% $1,156,585.93 0.13% $19,228,806.29 2.21% $852,400,613.10 97.79% $871,629,419.39
2008 $8,884,739.66 0.96% $3,012,195.66 0.33% $5,860,576.88 0.63% $27,651.86 0.00% $710,964.89 0.08% $18,496,128.95 2.00% $907,575,303.32 98.00% $926,071,432.27
2009 $13,222,778.05 1.37% $2,497,604.51 0.26% $9,094,581.01 0.94% $114,954.59 0.01% $514,215.70 0.05% $25,444,133.86 2.63% $940,424,083.51 97.37% $965,868,217.37
Total $40,821,042.66 1.17% $11,414,645.98 0.33% $30,731,233.86 0.88% $159,017.60 0.00% $4,124,059.86 0.12% $87,249,999.96 2.50% $3,398,304,321.27 97.50% $3,485,554,321.23
Source: MGT developed a procurement and vendor database (based on CARS data) for the Commonwealth covering the period from July 1, 2005, through June 30, 2009. 1 Percent of total dollars paid annually to prime consultants.

Prime Contractor Utilization Based on CARS (includes Department of Transportation)
Page B-4
EXHIBIT B-6 COMMONWEALTH OF VIRGINIA
PROFESSIONAL SERVICES (INCLUDING ARCHITECTURE AND ENGINEERING) NUMBER OF UNIQUE PRIME CONSULTANTS IN THE
BY RACE/ETHNICITY/GENDER CLASSIFICATION JULY 1, 2005, THROUGH JUNE 30, 2009
Fiscal African Hispanic Asian Native Nonminority M/WBE Non-M/WBE Total
Year Americans Americans Americans Americans Women Firms Firms Firms
# %1# %1
# %1# %1
# %1# %1
# %1#
2006 78 0.46% 16 0.09% 36 0.21% 2 0.01% 18 0.11% 150 0.88% 16,909 99.12% 17,059
2007 95 0.58% 24 0.15% 35 0.22% 3 0.02% 18 0.11% 175 1.08% 16,089 98.92% 16,264
2008 109 0.67% 23 0.14% 31 0.19% 5 0.03% 29 0.18% 197 1.21% 16,119 98.79% 16,316
2009 99 0.62% 20 0.13% 38 0.24% 5 0.03% 24 0.15% 186 1.16% 15,812 98.84% 15,998
185 0.58% 39 0.12% 65 0.20% 7 0.02% 43 0.13% 339 1.06% 31,771 98.94% 32,110
Unique Firms
Over Four
Years2
Source: MGT developed a procurement and vendor database (based on CARS data) for the Commonwealth covering the period from July 1, 2005, through June 30, 2009. 1 Percentage of Total Firms.
2 “Unique Firms counts a firm only once for each year it receives work. Since a firm could be used in multiple years, the
“Unique Firms” for the entire study period may not equal the sum of all years.
Other Services – CARS includes Department of Transportation
EXHIBIT B-7 COMMONWEALTH OF VIRGINIA
OTHER SERVICES UTILIZATION ANALYSIS OF FIRMS
PAYMENTS AND PERCENTAGE OF TOTAL DOLLARS BY RACE/ETHNICITY/GENDER CLASSIFICATION
JULY 1, 2005, THROUGH JUNE 30, 2009
Fiscal African Hispanic Asian Native Nonminority M/WBE M/WBE Total
Year Americans Americans Americans Americans Women Firms Firms Dollars
$ %1$ %1
$ %1$ %1
$ %1$ %1
$ %1$
2006 $13,850,904.34 2.97% $5,356,252.11 1.15% $1,716,037.59 0.37% $3,847,214.10 0.83% $2,873,591.26 0.62% $27,643,999.40 5.94% $437,987,890.75 94.06% $465,631,890.15
2007 $14,580,735.13 2.93% $7,926,207.91 1.59% $1,194,148.45 0.24% $1,985,851.55 0.40% $3,181,899.27 0.64% $28,868,842.31 5.80% $469,115,202.27 94.20% $497,984,044.58
2008 $16,142,084.79 3.12% $9,019,578.69 1.74% $2,431,054.61 0.47% $1,690,106.30 0.33% $3,746,525.28 0.72% $33,029,349.67 6.37% $485,106,568.75 93.63% $518,135,918.42
2009 $17,086,377.66 3.39% $8,550,646.67 1.69% $1,433,161.58 0.28% $1,704,809.56 0.34% $6,490,931.99 1.29% $35,265,927.46 6.99% $469,404,959.83 93.01% $504,670,887.29
Total $61,660,101.92 3.10% $30,852,685.38 1.55% $6,774,402.23 0.34% $9,227,981.51 0.46% $16,292,947.80 0.82% $124,808,118.84 6.28% $1,861,614,621.60 93.72% $1,986,422,740.44
Source: MGT developed a procurement and vendor database (based on CARS data) for the Commonwealth covering the period from July 1, 2005, through June 30, 2009. 1 Percent of total dollars paid annually to firms.

Prime Contractor Utilization Based on CARS (includes Department of Transportation)
Page B-5
EXHIBIT B-8 COMMONWEALTH OF VIRGINIA
OTHER SERVICES NUMBER OF UNIQUE FIRMS
PAYMENTS BY RACE/ETHNICITY/GENDER CLASSIFICATION JULY 1, 2005 THROUGH JUNE 30, 2009
Fiscal African Hispanic Asian Native Nonminority M/WBE Non-M/WBE Total
Year Americans Americans Americans Americans Women Firms Firms Firms
# %1# %1
# %1# %1
# %1# %1
# %1#
2006 225 0.97% 57 0.25% 55 0.24% 25 0.11% 78 0.34% 440 1.89% 22,800 98.11% 23,240
2007 243 1.11% 51 0.23% 55 0.25% 21 0.10% 74 0.34% 444 2.03% 21,433 97.97% 21,877
2008 256 1.42% 58 0.32% 61 0.34% 20 0.11% 82 0.46% 477 2.65% 17,495 97.35% 17,972
2009 268 1.64% 58 0.35% 68 0.42% 17 0.10% 74 0.45% 485 2.97% 15,861 97.03% 16,346
520 0.93% 113 0.20% 136 0.24% 40 0.07% 149 0.27% 958 1.72% 54,773 98.28% 55,731
Unique Firms
Over Four
Years2
Source: MGT developed a procurement and vendor database (based on CARS data) for the Commonwealth covering the period from July 1, 2005 through June 30, 2009. 1 Percentage of total firms.
2 “Unique Firms counts a firm only once for each year it receives work. Since a firm could be used in multiple years, the
“Unique Firms” for the entire study period may not equal the sum of all years.
Goods and Supplies includes Department of Transportation
EXHIBIT B-9 COMMONWEALTH OF VIRGINIA
GOODS AND SUPPLIES UTILIZATION ANALYSIS OF FIRMS
PAYMENTS AND PERCENTAGE OF TOTAL DOLLARS BY RACE/ETHNICITY/GENDER CLASSIFICATION
JULY 1, 2005 THROUGH JUNE 30, 2009
Fiscal African Hispanic Asian Native Nonminority M/WBE M/WBE Total
Year Americans Americans Americans Americans Women Firms Firms Dollars
$ %1$ %1
$ %1$ %1
$ %1$ %1
$ %1$
2006 $2,642,672.75 0.34% $2,332,974.77 0.30% $15,089,341.66 1.96% $59,621.01 0.01% $2,154,168.39 0.28% $22,278,778.58 2.89% $748,767,926.25 97.11% $771,046,704.83
2007 $3,053,831.51 0.40% $496,218.54 0.07% $14,924,030.97 1.97% $80,508.02 0.01% $2,106,709.26 0.28% $20,661,298.30 2.73% $735,392,792.50 97.27% $756,054,090.80
2008 $2,512,995.80 0.31% $817,594.54 0.10% $12,662,944.72 1.56% $103,291.32 0.01% $1,801,630.35 0.22% $17,898,456.73 2.21% $793,365,454.32 97.79% $811,263,911.05
2009 $3,197,628.16 0.41% $2,208,292.79 0.29% $12,351,296.09 1.60% $68,475.84 0.01% $1,897,402.45 0.25% $19,723,095.33 2.55% $753,095,783.42 97.45% $772,818,878.75
Total $11,407,128.22 0.37% $5,855,080.64 0.19% $55,027,613.44 1.77% $311,896.19 0.01% $7,959,910.45 0.26% $80,561,628.94 2.59% $3,030,621,956.49 97.41% $3,111,183,585.43
Source: MGT developed a procurement and vendor database (based on CARS data) for the Commonwealth covering the period from July 1, 2005 through June 30, 2009. 1 Percent of total dollars paid annually to firms.
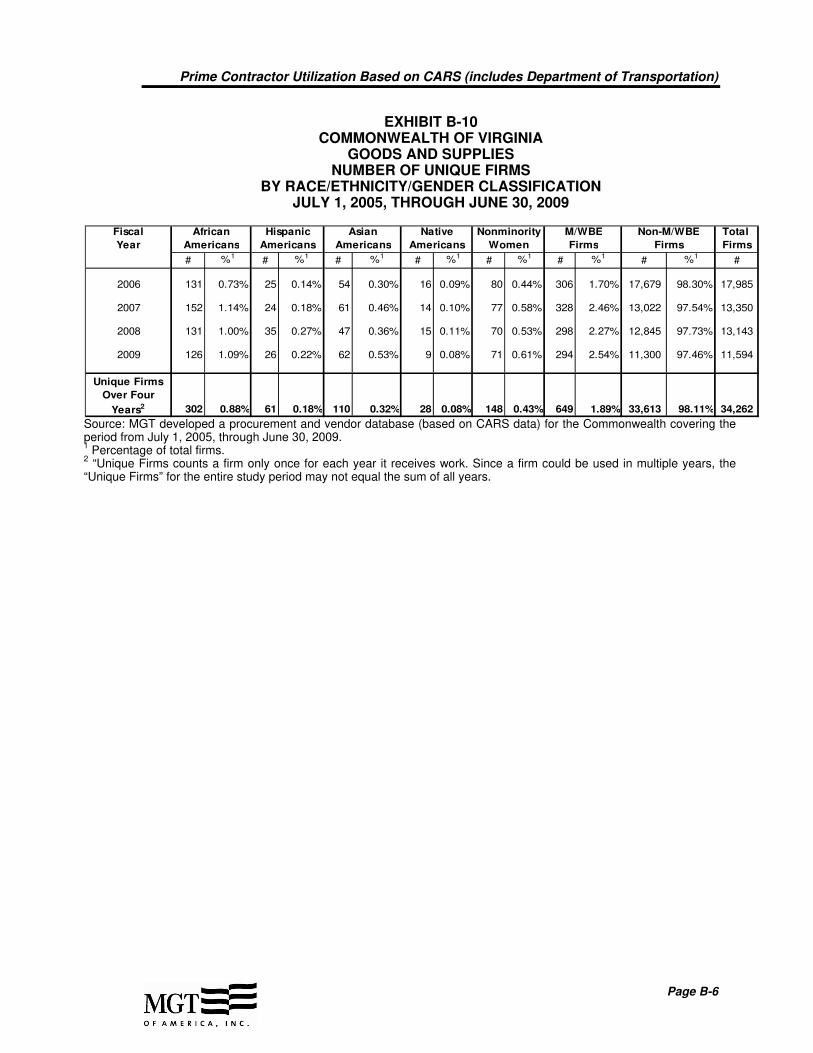
Prime Contractor Utilization Based on CARS (includes Department of Transportation)
Page B-6
EXHIBIT B-10 COMMONWEALTH OF VIRGINIA
GOODS AND SUPPLIES NUMBER OF UNIQUE FIRMS
BY RACE/ETHNICITY/GENDER CLASSIFICATION JULY 1, 2005, THROUGH JUNE 30, 2009
Fiscal African Hispanic Asian Native Nonminority M/WBE Non-M/WBE Total
Year Americans Americans Americans Americans Women Firms Firms Firms
# %1# %1
# %1# %1
# %1# %1
# %1#
2006 131 0.73% 25 0.14% 54 0.30% 16 0.09% 80 0.44% 306 1.70% 17,679 98.30% 17,985
2007 152 1.14% 24 0.18% 61 0.46% 14 0.10% 77 0.58% 328 2.46% 13,022 97.54% 13,350
2008 131 1.00% 35 0.27% 47 0.36% 15 0.11% 70 0.53% 298 2.27% 12,845 97.73% 13,143
2009 126 1.09% 26 0.22% 62 0.53% 9 0.08% 71 0.61% 294 2.54% 11,300 97.46% 11,594
302 0.88% 61 0.18% 110 0.32% 28 0.08% 148 0.43% 649 1.89% 33,613 98.11% 34,262
Unique Firms
Over Four
Years2
Source: MGT developed a procurement and vendor database (based on CARS data) for the Commonwealth covering the period from July 1, 2005, through June 30, 2009. 1 Percentage of total firms.
2 “Unique Firms counts a firm only once for each year it receives work. Since a firm could be used in multiple years, the
“Unique Firms” for the entire study period may not equal the sum of all years.

APPENDIX C:PRIME UTILIZATION AND DISPARITY ANALYSIS BY
BUSINESS CATEGORY AND SELF-REPORTING UNIVERSITIES

Page C-1
APPENDIX C
PRIME UTILIZATION AND DISPARITY ANALYSIS BY BUSINESS CATEGORY AND SELF –REPORTING UNIVERSITIES
Overall – Construction
EXHIBIT C-1 COMMONWEALTH OF VIRGINIA
CONSTRUCTION UTILIZATION ANALYSIS OF PRIME CONTRACTOR
DOLLARS AND PERCENTAGE OF TOTAL DOLLARS BY UNIVERSITY AND RACE/ETHNICITY/GENDER CLASSIFICATION
JULY 1, 2005, THROUGH JUNE 30, 2009
Universities African Hispanic Asian Native Nonminority M/WBE Non-M/WBE Total
or Colleges Americans Americans Americans Americans Women Firms Firms Dollars
$ %1 $ %1 $ %1 $ %1 $ %1 $ %1 $ %1 $
College of William and Mary $1,571,555.29 0.59% $99,664.66 0.04% $189,431.34 0.07% $157,210.20 0.06% $1,852,574.52 0.70% $3,870,436.01 1.45% $262,442,137.36 98.55% $266,312,573.37
George Mason University $240,917.28 0.33% $1,876,449.04 2.56% $334,952.76 0.46% $24,744.00 0.03% $3,986,601.49 5.43% $6,463,664.57 8.81% $66,930,496.90 91.19% $73,394,161.47
James Madison University $15,831.28 0.01% $21,294.76 0.01% $32,522.94 0.02% $0.00 0.00% $2,432,718.59 1.35% $2,502,367.57 1.39% $177,488,207.86 98.61% $179,990,575.43
Old Dominion University $330,720.99 0.18% $12,169.40 0.01% $1,915.00 0.00% $18,602.28 0.01% $81,483.47 0.04% $444,891.14 0.24% $183,326,064.17 99.76% $183,770,955.31
Radford University $0.00 0.00% $0.00 0.00% $0.00 0.00% $0.00 0.00% $468.00 0.00% $468.00 0.00% $57,009,053.00 100.00% $57,009,521.00
University of Mary Washington $0.00 0.00% $0.00 0.00% $0.00 0.00% $0.00 0.00% $0.00 0.00% $0.00 0.00% $106,762.00 100.00% $106,762.00
University of Virginia $2,729,051.75 0.62% $0.00 0.00% $1,119,301.83 0.26% $5,049.56 0.00% $51,588.90 0.01% $3,904,992.04 0.89% $433,379,589.89 99.11% $437,284,581.93
Virginia Commonwealth University $0.00 0.00% $0.00 0.00% $0.00 0.00% $0.00 0.00% $27,521.28 13.31% $27,521.28 13.31% $179,210.18 86.69% $206,731.46
Virginia Polytechnic Institute and
State University - Virginia Tech $0.00 0.00% $259,492.01 0.10% $107,319.02 0.04% $8,293.53 0.00% $7,555,070.31 2.92% $7,930,174.87 3.07% $250,790,453.70 96.93% $258,720,628.57
Total $4,888,076.59 0.34% $2,269,069.87 0.16% $1,785,442.89 0.12% $213,899.57 0.01% $15,988,026.56 1.10% $25,144,515.48 1.73% $1,431,651,975.06 98.27% $1,456,796,490.54
Source: MGT developed a procurement and vendor database (based on self-reporting data) for the Commonwealth covering the period from July 1, 2005, through June 30, 2009.. 1
Percent of prime contract dollars annually to vendors.

Prime Utilization and Disparity Analysis
Page C-2
EXHIBIT C-2 COMMONWEALTH OF VIRGINIA
CONSTRUCTION AVAILABILITY OF FIRMS - PRIME CONTRACTOR BASED ON U.S. CENSUS DATA, SURVEY OF BUSINESS OWNERS
IN THE COMMONWEALTH OF VIRGINIA BY RACE/ETHNICITY/GENDER CLASSIFICATION
NAICS CODE 23, CONSTRUCTION PAID EMPLOYEES ONLY
African Hispanic Asian Native Nonminority M/WBE Non-M/WBE Total
Americans1 Americans1 Americans1 Americans1Women Firms Firms2 Firms3
# % # % # % # % # % # % # %
Total 581 3.10% 451 2.40% 286 1.53% 85 0.45% 1,440 7.68% 2,843 15.16% 15,910 84.84% 18,753
Source: U.S. Bureau of the Census 2002, Survey of Business Owners. 1 Minority men and women firms are included in their respective minority classifications.
2 Derived from the difference of total firms and total M/WBE firms.
3 Total Firms is based on the number of All Firms based on the SBO data provided.
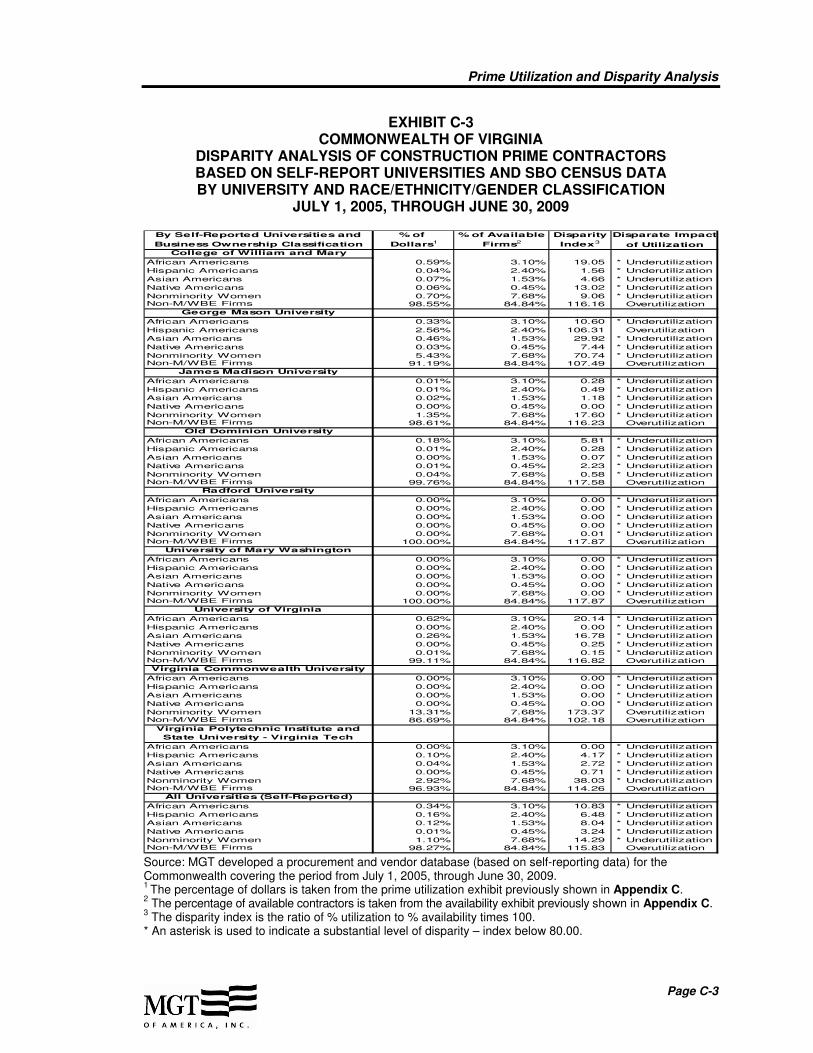
Prime Utilization and Disparity Analysis
Page C-3
EXHIBIT C-3 COMMONWEALTH OF VIRGINIA
DISPARITY ANALYSIS OF CONSTRUCTION PRIME CONTRACTORS BASED ON SELF-REPORT UNIVERSITIES AND SBO CENSUS DATA BY UNIVERSITY AND RACE/ETHNICITY/GENDER CLASSIFICATION
JULY 1, 2005, THROUGH JUNE 30, 2009
By Self-Reported Universities and % of % of Available Disparity Disparate Impact
Business Ownership Classification Dollars1 Firms2 Index3of Utilization
College of William and Mary
African Americans 0.59% 3.10% 19.05 * Underutilization
Hispanic Americans 0.04% 2.40% 1.56 * Underutilization
Asian Americans 0.07% 1.53% 4.66 * Underutilization
Native Americans 0.06% 0.45% 13.02 * Underutilization
Nonminority Women 0.70% 7.68% 9.06 * UnderutilizationNon-M/WBE Firms 98.55% 84.84% 116.16 Overutilization
George Mason University
African Americans 0.33% 3.10% 10.60 * Underutilization
Hispanic Americans 2.56% 2.40% 106.31 Overutilization
Asian Americans 0.46% 1.53% 29.92 * Underutilization
Native Americans 0.03% 0.45% 7.44 * Underutilization
Nonminority Women 5.43% 7.68% 70.74 * UnderutilizationNon-M/WBE Firms 91.19% 84.84% 107.49 Overutilization
James Madison University
African Americans 0.01% 3.10% 0.28 * Underutilization
Hispanic Americans 0.01% 2.40% 0.49 * Underutilization
Asian Americans 0.02% 1.53% 1.18 * Underutilization
Native Americans 0.00% 0.45% 0.00 * Underutilization
Nonminority Women 1.35% 7.68% 17.60 * UnderutilizationNon-M/WBE Firms 98.61% 84.84% 116.23 Overutilization
Old Dominion University
African Americans 0.18% 3.10% 5.81 * Underutilization
Hispanic Americans 0.01% 2.40% 0.28 * Underutilization
Asian Americans 0.00% 1.53% 0.07 * Underutilization
Native Americans 0.01% 0.45% 2.23 * Underutilization
Nonminority Women 0.04% 7.68% 0.58 * UnderutilizationNon-M/WBE Firms 99.76% 84.84% 117.58 Overutilization
Radford University
African Americans 0.00% 3.10% 0.00 * Underutilization
Hispanic Americans 0.00% 2.40% 0.00 * Underutilization
Asian Americans 0.00% 1.53% 0.00 * Underutilization
Native Americans 0.00% 0.45% 0.00 * Underutilization
Nonminority Women 0.00% 7.68% 0.01 * UnderutilizationNon-M/WBE Firms 100.00% 84.84% 117.87 Overutilization
University of Mary Washington
African Americans 0.00% 3.10% 0.00 * Underutilization
Hispanic Americans 0.00% 2.40% 0.00 * Underutilization
Asian Americans 0.00% 1.53% 0.00 * Underutilization
Native Americans 0.00% 0.45% 0.00 * Underutilization
Nonminority Women 0.00% 7.68% 0.00 * UnderutilizationNon-M/WBE Firms 100.00% 84.84% 117.87 Overutilization
University of Virginia
African Americans 0.62% 3.10% 20.14 * Underutilization
Hispanic Americans 0.00% 2.40% 0.00 * Underutilization
Asian Americans 0.26% 1.53% 16.78 * Underutilization
Native Americans 0.00% 0.45% 0.25 * Underutilization
Nonminority Women 0.01% 7.68% 0.15 * UnderutilizationNon-M/WBE Firms 99.11% 84.84% 116.82 Overutilization
Virginia Commonwealth University
African Americans 0.00% 3.10% 0.00 * Underutilization
Hispanic Americans 0.00% 2.40% 0.00 * Underutilization
Asian Americans 0.00% 1.53% 0.00 * Underutilization
Native Americans 0.00% 0.45% 0.00 * Underutilization
Nonminority Women 13.31% 7.68% 173.37 OverutilizationNon-M/WBE Firms 86.69% 84.84% 102.18 Overutilization
Virginia Polytechnic Institute and
State University - Virginia Tech
African Americans 0.00% 3.10% 0.00 * Underutilization
Hispanic Americans 0.10% 2.40% 4.17 * Underutilization
Asian Americans 0.04% 1.53% 2.72 * Underutilization
Native Americans 0.00% 0.45% 0.71 * Underutilization
Nonminority Women 2.92% 7.68% 38.03 * UnderutilizationNon-M/WBE Firms 96.93% 84.84% 114.26 Overutilization
All Universities (Self-Reported)
African Americans 0.34% 3.10% 10.83 * Underutilization
Hispanic Americans 0.16% 2.40% 6.48 * Underutilization
Asian Americans 0.12% 1.53% 8.04 * Underutilization
Native Americans 0.01% 0.45% 3.24 * Underutilization
Nonminority Women 1.10% 7.68% 14.29 * UnderutilizationNon-M/WBE Firms 98.27% 84.84% 115.83 Overutilization
Source: MGT developed a procurement and vendor database (based on self-reporting data) for the Commonwealth covering the period from July 1, 2005, through June 30, 2009. 1 The percentage of dollars is taken from the prime utilization exhibit previously shown in Appendix C.
2 The percentage of available contractors is taken from the availability exhibit previously shown in Appendix C.
3 The disparity index is the ratio of % utilization to % availability times 100.
* An asterisk is used to indicate a substantial level of disparity – index below 80.00.

Prime Utilization and Disparity Analysis
Page C-4
Overall – Architecture and Engineering
EXHIBIT C-4 COMMONWEALTH OF VIRGINIA
ARCHITECTURE AND ENGINEERING UTILIZATION ANALYSIS OF PRIME CONSULTANTS DOLLARS AND PERCENTAGE OF TOTAL DOLLARS
BY UNIVERSITY AND RACE/ETHNICITY/GENDER CLASSIFICATION JULY 1, 2005, THROUGH JUNE 30, 2009
Universities African Hispanic Asian Native Nonminority M/WBE Non-M/WBE Total
or Colleges Americans Americans Americans Americans Women Firms Firms Dollars
$ %1 $ %1 $ %1 $ %1 $ %1 $ %1 $ %1 $
College of William and Mary $0.00 0.00% $0.00 0.00% $0.00 0.00% $0.00 0.00% $133,460.47 0.62% $133,460.47 0.62% $21,263,334.82 99.38% $21,396,795.29
George Mason University $126,928.00 5.04% $0.00 0.00% $28,400.00 1.13% $0.00 0.00% $0.00 0.00% $155,328.00 6.17% $2,363,662.13 93.83% $2,518,990.13
James Madison University $0.00 0.00% $0.00 0.00% $151,862.26 0.66% $0.00 0.00% $288,451.13 1.26% $440,313.39 1.92% $22,516,402.15 98.08% $22,956,715.54
Old Dominion University $73,150.85 0.45% $36,444.96 0.23% $0.00 0.00% $0.00 0.00% $185,935.03 1.15% $295,530.84 1.84% $15,808,835.74 98.16% $16,104,366.58
Radford University $0.00 0.00% $0.00 0.00% $0.00 0.00% $0.00 0.00% $0.00 0.00% $0.00 0.00% $4,501,546.58 100.00% $4,501,546.58
University of Mary Washington $0.00 0.00% $0.00 0.00% $0.00 0.00% $0.00 0.00% $378,000.00 3.88% $378,000.00 3.88% $9,351,923.52 96.12% $9,729,923.52
University of Virginia $43,177.42 0.05% $0.00 0.00% $0.00 0.00% $0.00 0.00% $443,586.49 0.50% $486,763.91 0.55% $88,294,275.53 99.45% $88,781,039.44
Virginia Commonwealth University $0.00 0.00% $0.00 0.00% $0.00 0.00% $0.00 0.00% $0.00 0.00% $0.00 0.00% $381,948.88 100.00% $381,948.88
Virginia Polytechnic Institute and
State University - Virginia Tech $91,515.20 0.20% $2,863.77 0.01% $233,656.65 0.50% $0.00 0.00% $3,331,296.54 7.12% $3,659,332.16 7.82% $43,129,413.22 92.18% $46,788,745.38
Total $334,771.47 0.16% $39,308.73 0.02% $413,918.91 0.19% $0.00 0.00% $4,760,729.66 2.23% $5,548,728.77 2.60% $207,611,342.57 97.40% $213,160,071.34
Source: MGT developed a procurement and vendor database (based on self-reporting data) for the Commonwealth covering the period from July 1, 2005, through June 30, 2009.. 1
Percent of prime contract dollars annually to vendors.

Prime Utilization and Disparity Analysis
Page C-5
EXHIBIT C-5 COMMONWEALTH OF VIRGINIA
ARCHITECTURE & ENGINEERING AVAILABILITY OF FIRMS – PRIME CONSULTANTS
BASED ON U.S. CENSUS DATA, SURVEY OF BUSINESS OWNERS IN THE COMMONWEALTH OF VIRGINIA
BY RACE/ETHNICITY/GENDER CLASSIFICATION NAICS CODES 541310 - ARCHITECTURAL SERVICES, 541320 - LANDSCAPE ARCHITECTURAL SERVICES, 541330 - ENGINEERING SERVICES, 541340 -
DRAFTING SERVICES, 541350 - BUILDING INSPECTION SERVICES, AND 541370 - SURVEYING AND MAPPING (EXCEPT GEOPHYSICAL) SERVICES
PAID EMPLOYEES ONLY
African Hispanic Asian Native Nonminority M/WBE Non-M/WBE Total
Americans1 Americans1 Americans1 Americans1Women Firms Firms2 Firms3
# % # % # % # % # % # % # %
Total 76 2.77% 60 2.19% 108 3.93% 29 1.06% 262 9.54% 535 19.49% 2,210 80.51% 2,745
Source: U.S. Bureau of the Census 2002, Survey of Business Owners. 1 Minority men and women firms are included in their respective minority classifications.
2 Derived from the difference of total firms and total M/WBE firms.
3 Total Firms is based on the number of All Firms based on the SBO data provided.
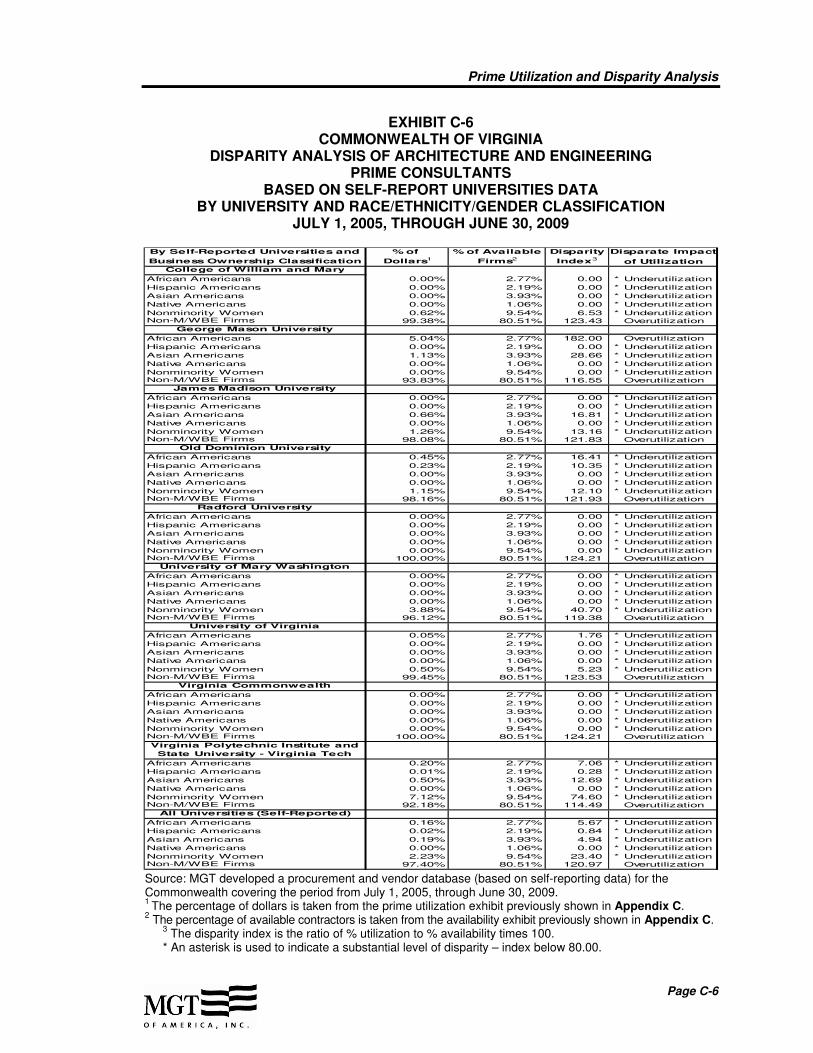
Prime Utilization and Disparity Analysis
Page C-6
EXHIBIT C-6 COMMONWEALTH OF VIRGINIA
DISPARITY ANALYSIS OF ARCHITECTURE AND ENGINEERING PRIME CONSULTANTS
BASED ON SELF-REPORT UNIVERSITIES DATA BY UNIVERSITY AND RACE/ETHNICITY/GENDER CLASSIFICATION
JULY 1, 2005, THROUGH JUNE 30, 2009
By Self-Reported Universities and % of % of Available Disparity Disparate Impact
Business Ownership Classification Dollars1 Firms2 Index3of Utilization
College of William and Mary
African Americans 0.00% 2.77% 0.00 * Underutilization
Hispanic Americans 0.00% 2.19% 0.00 * Underutilization
Asian Americans 0.00% 3.93% 0.00 * Underutilization
Native Americans 0.00% 1.06% 0.00 * Underutilization
Nonminority Women 0.62% 9.54% 6.53 * UnderutilizationNon-M/WBE Firms 99.38% 80.51% 123.43 Overutilization
George Mason University
African Americans 5.04% 2.77% 182.00 Overutilization
Hispanic Americans 0.00% 2.19% 0.00 * Underutilization
Asian Americans 1.13% 3.93% 28.66 * Underutilization
Native Americans 0.00% 1.06% 0.00 * Underutilization
Nonminority Women 0.00% 9.54% 0.00 * UnderutilizationNon-M/WBE Firms 93.83% 80.51% 116.55 Overutilization
James Madison University
African Americans 0.00% 2.77% 0.00 * Underutilization
Hispanic Americans 0.00% 2.19% 0.00 * Underutilization
Asian Americans 0.66% 3.93% 16.81 * Underutilization
Native Americans 0.00% 1.06% 0.00 * Underutilization
Nonminority Women 1.26% 9.54% 13.16 * UnderutilizationNon-M/WBE Firms 98.08% 80.51% 121.83 Overutilization
Old Dominion University
African Americans 0.45% 2.77% 16.41 * Underutilization
Hispanic Americans 0.23% 2.19% 10.35 * Underutilization
Asian Americans 0.00% 3.93% 0.00 * Underutilization
Native Americans 0.00% 1.06% 0.00 * Underutilization
Nonminority Women 1.15% 9.54% 12.10 * UnderutilizationNon-M/WBE Firms 98.16% 80.51% 121.93 Overutilization
Radford University
African Americans 0.00% 2.77% 0.00 * Underutilization
Hispanic Americans 0.00% 2.19% 0.00 * Underutilization
Asian Americans 0.00% 3.93% 0.00 * Underutilization
Native Americans 0.00% 1.06% 0.00 * Underutilization
Nonminority Women 0.00% 9.54% 0.00 * UnderutilizationNon-M/WBE Firms 100.00% 80.51% 124.21 Overutilization
University of Mary Washington
African Americans 0.00% 2.77% 0.00 * Underutilization
Hispanic Americans 0.00% 2.19% 0.00 * Underutilization
Asian Americans 0.00% 3.93% 0.00 * Underutilization
Native Americans 0.00% 1.06% 0.00 * Underutilization
Nonminority Women 3.88% 9.54% 40.70 * UnderutilizationNon-M/WBE Firms 96.12% 80.51% 119.38 Overutilization
University of Virginia
African Americans 0.05% 2.77% 1.76 * Underutilization
Hispanic Americans 0.00% 2.19% 0.00 * Underutilization
Asian Americans 0.00% 3.93% 0.00 * Underutilization
Native Americans 0.00% 1.06% 0.00 * Underutilization
Nonminority Women 0.50% 9.54% 5.23 * UnderutilizationNon-M/WBE Firms 99.45% 80.51% 123.53 Overutilization
Virginia Commonwealth
African Americans 0.00% 2.77% 0.00 * Underutilization
Hispanic Americans 0.00% 2.19% 0.00 * Underutilization
Asian Americans 0.00% 3.93% 0.00 * Underutilization
Native Americans 0.00% 1.06% 0.00 * Underutilization
Nonminority Women 0.00% 9.54% 0.00 * UnderutilizationNon-M/WBE Firms 100.00% 80.51% 124.21 Overutilization
Virginia Polytechnic Institute and
State University - Virginia Tech
African Americans 0.20% 2.77% 7.06 * Underutilization
Hispanic Americans 0.01% 2.19% 0.28 * Underutilization
Asian Americans 0.50% 3.93% 12.69 * Underutilization
Native Americans 0.00% 1.06% 0.00 * Underutilization
Nonminority Women 7.12% 9.54% 74.60 * UnderutilizationNon-M/WBE Firms 92.18% 80.51% 114.49 Overutilization
All Universities (Self-Reported)
African Americans 0.16% 2.77% 5.67 * Underutilization
Hispanic Americans 0.02% 2.19% 0.84 * Underutilization
Asian Americans 0.19% 3.93% 4.94 * Underutilization
Native Americans 0.00% 1.06% 0.00 * Underutilization
Nonminority Women 2.23% 9.54% 23.40 * UnderutilizationNon-M/WBE Firms 97.40% 80.51% 120.97 Overutilization
Source: MGT developed a procurement and vendor database (based on self-reporting data) for the Commonwealth covering the period from July 1, 2005, through June 30, 2009. 1 The percentage of dollars is taken from the prime utilization exhibit previously shown in Appendix C.
2 The percentage of available contractors is taken from the availability exhibit previously shown in Appendix C.
3 The disparity index is the ratio of % utilization to % availability times 100.
* An asterisk is used to indicate a substantial level of disparity – index below 80.00.

Prime Utilization and Disparity Analysis
Page C-7
Overall – Professional Services
EXHIBIT C-7 COMMONWEALTH OF VIRGINIA
PROFESSIONAL SERVICES UTILIZATION ANALYSIS OF PRIME CONSULTANTS DOLLARS AND PERCENTAGE OF TOTAL DOLLARS
BY UNIVERSITY AND RACE/ETHNICITY/GENDER CLASSIFICATION JULY 1, 2005, THROUGH JUNE 30, 2009
Universities African Hispanic Asian Native Nonminority M/WBE Non-M/WBE Total
or Colleges Americans Americans Americans Americans Women Firms Firms Dollars
$ %1 $ %1 $ %1 $ %1 $ %1 $ %1 $ %1 $
College of William and Mary $49,868.68 0.53% $5,270.00 0.06% $241,098.56 2.56% $0.00 0.00% $61,863.08 0.66% $358,100.32 3.81% $9,041,694.43 96.19% $9,399,794.75
George Mason University $136,529.40 0.30% $239,138.95 0.53% $910,756.48 2.01% $1,612.00 0.00% $2,150,916.89 4.75% $3,438,953.72 7.59% $41,854,045.26 92.41% $45,292,998.98
James Madison University $0.00 0.00% $0.00 0.00% $1,247.73 0.01% $0.00 0.00% $219,412.98 2.14% $220,660.71 2.15% $10,039,687.37 97.85% $10,260,348.08
Old Dominion University $4,773.32 0.03% $692,494.82 5.02% $512,865.65 3.72% $0.00 0.00% $191,260.91 1.39% $1,401,394.70 10.16% $12,392,931.34 89.84% $13,794,326.04
Radford University $0.00 0.00% $18,000.00 0.16% $0.00 0.00% $0.00 0.00% $28,478.59 0.25% $46,478.59 0.40% $11,480,358.81 99.60% $11,526,837.40
University of Mary Washington $0.00 0.00% $15,908.00 0.01% $28,507.29 0.03% $0.00 0.00% $151,006.50 0.14% $195,421.79 0.18% $106,617,327.12 99.82% $106,812,748.91
University of Virginia $9,010.00 0.02% $5,675.00 0.01% $2,623.65 0.00% $0.00 0.00% $194,596.36 0.36% $211,905.01 0.40% $53,154,140.23 99.60% $53,366,045.24
Virginia Commonwealth University $3,906.50 0.09% $0.00 0.00% $140,430.00 3.33% $0.00 0.00% $33,904.10 0.80% $178,240.60 4.22% $4,044,579.54 95.78% $4,222,820.14
Virginia Polytechnic Institute and
State University - Virginia Tech $82,902.95 0.19% $276,942.54 0.65% $179,286.03 0.42% $11,498.13 0.03% $1,454,911.96 3.42% $2,005,541.61 4.71% $40,589,771.35 95.29% $42,595,312.96
Total $286,990.85 0.10% $1,253,429.31 0.42% $2,016,815.39 0.68% $13,110.13 0.00% $4,486,351.37 1.51% $8,056,697.05 2.71% $289,214,535.45 97.29% $297,271,232.50
Source: MGT developed a procurement and vendor database (based on self-reporting data) for the Commonwealth covering the period from July 1, 2005, through June 30, 2009.. 1
Percent of prime contract dollars annually to vendors.
EXHIBIT C-8
COMMONWEALTH OF VIRGINIA PROFESSIONAL SERVICES AVAILABILITY OF FIRMS – PRIME CONSULTANT
BASED ON U.S. CENSUS DATA, SURVEY OF BUSINESS OWNERS IN THE COMMONWEALTH OF VIRGINIA
BY RACE/ETHNICITY/GENDER CLASSIFICATION NAICS CODE 54, PROFESSIONAL SERVICES
PAID EMPLOYEES ONLY
African Hispanic Asian Native Nonminority M/WBE Non-M/WBE Total
Americans1 Americans1 Americans1 Americans1Women Firms Firms2 Firms3
# % # % # % # % # % # % # %
Total 618 3.23% 408 2.14% 1,367 7.15% 115 0.60% 4,146 21.70% 6,654 34.82% 12,453 65.18% 19,107
Source: U.S. Bureau of the Census 2002, Survey of Business Owners. 1 Minority men and women firms are included in their respective minority classifications.
2 Derived from the difference of total firms and total M/WBE firms.
3 Total Firms is based on the number of All Firms based on the SBO data provided.
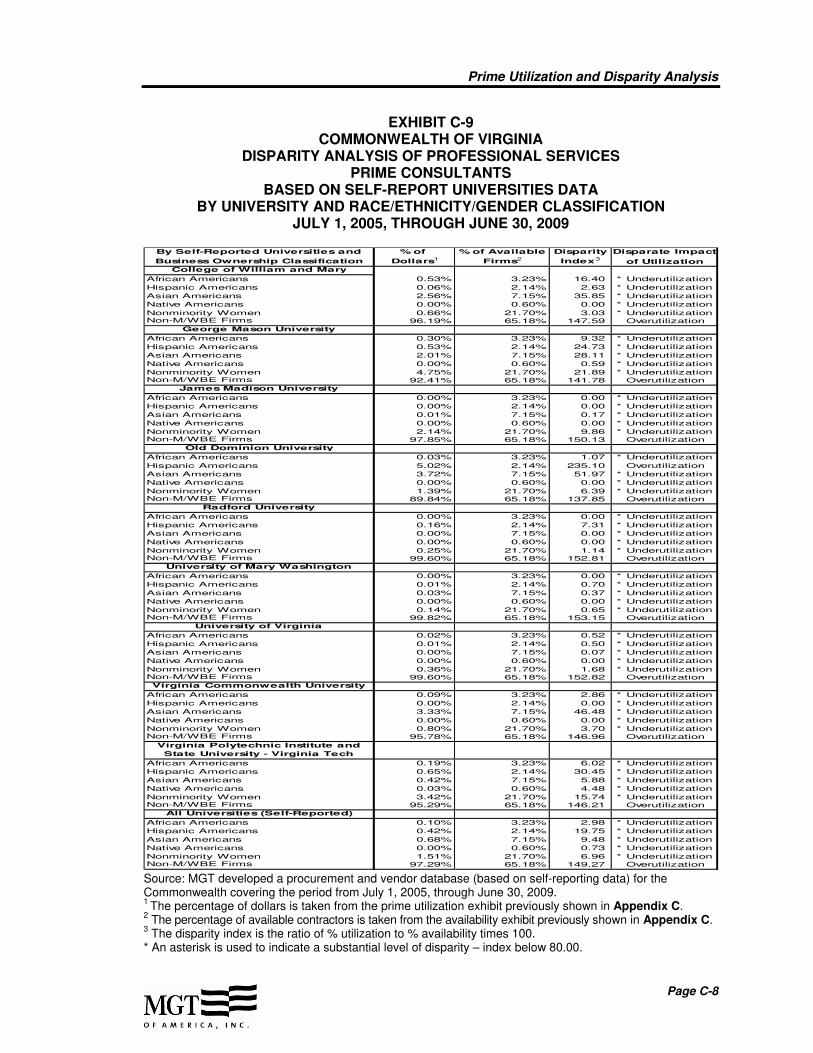
Prime Utilization and Disparity Analysis
Page C-8
EXHIBIT C-9 COMMONWEALTH OF VIRGINIA
DISPARITY ANALYSIS OF PROFESSIONAL SERVICES PRIME CONSULTANTS
BASED ON SELF-REPORT UNIVERSITIES DATA BY UNIVERSITY AND RACE/ETHNICITY/GENDER CLASSIFICATION
JULY 1, 2005, THROUGH JUNE 30, 2009
By Self-Reported Universities and % of % of Available Disparity Disparate Impact
Business Ownership Classification Dollars1 Firms2 Index3of Utilization
College of William and Mary
African Americans 0.53% 3.23% 16.40 * Underutilization
Hispanic Americans 0.06% 2.14% 2.63 * Underutilization
Asian Americans 2.56% 7.15% 35.85 * Underutilization
Native Americans 0.00% 0.60% 0.00 * Underutilization
Nonminority Women 0.66% 21.70% 3.03 * UnderutilizationNon-M/WBE Firms 96.19% 65.18% 147.59 Overutilization
George Mason University
African Americans 0.30% 3.23% 9.32 * Underutilization
Hispanic Americans 0.53% 2.14% 24.73 * Underutilization
Asian Americans 2.01% 7.15% 28.11 * Underutilization
Native Americans 0.00% 0.60% 0.59 * Underutilization
Nonminority Women 4.75% 21.70% 21.89 * UnderutilizationNon-M/WBE Firms 92.41% 65.18% 141.78 Overutilization
James Madison University
African Americans 0.00% 3.23% 0.00 * Underutilization
Hispanic Americans 0.00% 2.14% 0.00 * Underutilization
Asian Americans 0.01% 7.15% 0.17 * Underutilization
Native Americans 0.00% 0.60% 0.00 * Underutilization
Nonminority Women 2.14% 21.70% 9.86 * UnderutilizationNon-M/WBE Firms 97.85% 65.18% 150.13 Overutilization
Old Dominion University
African Americans 0.03% 3.23% 1.07 * Underutilization
Hispanic Americans 5.02% 2.14% 235.10 Overutilization
Asian Americans 3.72% 7.15% 51.97 * Underutilization
Native Americans 0.00% 0.60% 0.00 * Underutilization
Nonminority Women 1.39% 21.70% 6.39 * UnderutilizationNon-M/WBE Firms 89.84% 65.18% 137.85 Overutilization
Radford University
African Americans 0.00% 3.23% 0.00 * Underutilization
Hispanic Americans 0.16% 2.14% 7.31 * Underutilization
Asian Americans 0.00% 7.15% 0.00 * Underutilization
Native Americans 0.00% 0.60% 0.00 * Underutilization
Nonminority Women 0.25% 21.70% 1.14 * UnderutilizationNon-M/WBE Firms 99.60% 65.18% 152.81 Overutilization
University of Mary Washington
African Americans 0.00% 3.23% 0.00 * Underutilization
Hispanic Americans 0.01% 2.14% 0.70 * Underutilization
Asian Americans 0.03% 7.15% 0.37 * Underutilization
Native Americans 0.00% 0.60% 0.00 * Underutilization
Nonminority Women 0.14% 21.70% 0.65 * UnderutilizationNon-M/WBE Firms 99.82% 65.18% 153.15 Overutilization
University of Virginia
African Americans 0.02% 3.23% 0.52 * Underutilization
Hispanic Americans 0.01% 2.14% 0.50 * Underutilization
Asian Americans 0.00% 7.15% 0.07 * Underutilization
Native Americans 0.00% 0.60% 0.00 * Underutilization
Nonminority Women 0.36% 21.70% 1.68 * UnderutilizationNon-M/WBE Firms 99.60% 65.18% 152.82 Overutilization
Virginia Commonwealth University
African Americans 0.09% 3.23% 2.86 * Underutilization
Hispanic Americans 0.00% 2.14% 0.00 * Underutilization
Asian Americans 3.33% 7.15% 46.48 * Underutilization
Native Americans 0.00% 0.60% 0.00 * Underutilization
Nonminority Women 0.80% 21.70% 3.70 * UnderutilizationNon-M/WBE Firms 95.78% 65.18% 146.96 Overutilization
Virginia Polytechnic Institute and
State University - Virginia Tech
African Americans 0.19% 3.23% 6.02 * Underutilization
Hispanic Americans 0.65% 2.14% 30.45 * Underutilization
Asian Americans 0.42% 7.15% 5.88 * Underutilization
Native Americans 0.03% 0.60% 4.48 * Underutilization
Nonminority Women 3.42% 21.70% 15.74 * UnderutilizationNon-M/WBE Firms 95.29% 65.18% 146.21 Overutilization
All Universities (Self-Reported)
African Americans 0.10% 3.23% 2.98 * Underutilization
Hispanic Americans 0.42% 2.14% 19.75 * Underutilization
Asian Americans 0.68% 7.15% 9.48 * Underutilization
Native Americans 0.00% 0.60% 0.73 * Underutilization
Nonminority Women 1.51% 21.70% 6.96 * UnderutilizationNon-M/WBE Firms 97.29% 65.18% 149.27 Overutilization
Source: MGT developed a procurement and vendor database (based on self-reporting data) for the Commonwealth covering the period from July 1, 2005, through June 30, 2009. 1 The percentage of dollars is taken from the prime utilization exhibit previously shown in Appendix C.
2 The percentage of available contractors is taken from the availability exhibit previously shown in Appendix C.
3 The disparity index is the ratio of % utilization to % availability times 100.
* An asterisk is used to indicate a substantial level of disparity – index below 80.00.
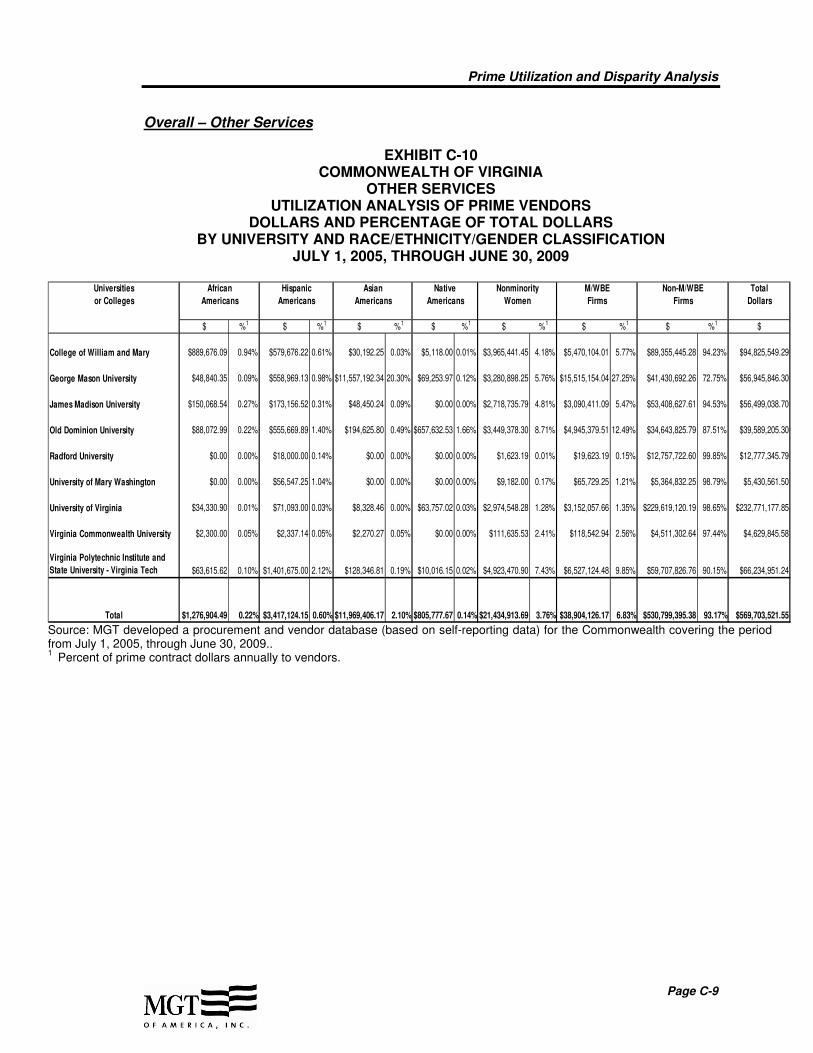
Prime Utilization and Disparity Analysis
Page C-9
Overall – Other Services
EXHIBIT C-10 COMMONWEALTH OF VIRGINIA
OTHER SERVICES UTILIZATION ANALYSIS OF PRIME VENDORS
DOLLARS AND PERCENTAGE OF TOTAL DOLLARS BY UNIVERSITY AND RACE/ETHNICITY/GENDER CLASSIFICATION
JULY 1, 2005, THROUGH JUNE 30, 2009
Universities African Hispanic Asian Native Nonminority M/WBE Non-M/WBE Total
or Colleges Americans Americans Americans Americans Women Firms Firms Dollars
$ %1 $ %1 $ %1 $ %1 $ %1 $ %1 $ %1 $
College of William and Mary $889,676.09 0.94% $579,676.22 0.61% $30,192.25 0.03% $5,118.00 0.01% $3,965,441.45 4.18% $5,470,104.01 5.77% $89,355,445.28 94.23% $94,825,549.29
George Mason University $48,840.35 0.09% $558,969.13 0.98% $11,557,192.34 20.30% $69,253.97 0.12% $3,280,898.25 5.76% $15,515,154.04 27.25% $41,430,692.26 72.75% $56,945,846.30
James Madison University $150,068.54 0.27% $173,156.52 0.31% $48,450.24 0.09% $0.00 0.00% $2,718,735.79 4.81% $3,090,411.09 5.47% $53,408,627.61 94.53% $56,499,038.70
Old Dominion University $88,072.99 0.22% $555,669.89 1.40% $194,625.80 0.49% $657,632.53 1.66% $3,449,378.30 8.71% $4,945,379.51 12.49% $34,643,825.79 87.51% $39,589,205.30
Radford University $0.00 0.00% $18,000.00 0.14% $0.00 0.00% $0.00 0.00% $1,623.19 0.01% $19,623.19 0.15% $12,757,722.60 99.85% $12,777,345.79
University of Mary Washington $0.00 0.00% $56,547.25 1.04% $0.00 0.00% $0.00 0.00% $9,182.00 0.17% $65,729.25 1.21% $5,364,832.25 98.79% $5,430,561.50
University of Virginia $34,330.90 0.01% $71,093.00 0.03% $8,328.46 0.00% $63,757.02 0.03% $2,974,548.28 1.28% $3,152,057.66 1.35% $229,619,120.19 98.65% $232,771,177.85
Virginia Commonwealth University $2,300.00 0.05% $2,337.14 0.05% $2,270.27 0.05% $0.00 0.00% $111,635.53 2.41% $118,542.94 2.56% $4,511,302.64 97.44% $4,629,845.58
Virginia Polytechnic Institute and
State University - Virginia Tech $63,615.62 0.10% $1,401,675.00 2.12% $128,346.81 0.19% $10,016.15 0.02% $4,923,470.90 7.43% $6,527,124.48 9.85% $59,707,826.76 90.15% $66,234,951.24
Total $1,276,904.49 0.22% $3,417,124.15 0.60% $11,969,406.17 2.10% $805,777.67 0.14% $21,434,913.69 3.76% $38,904,126.17 6.83% $530,799,395.38 93.17% $569,703,521.55
Source: MGT developed a procurement and vendor database (based on self-reporting data) for the Commonwealth covering the period from July 1, 2005, through June 30, 2009.. 1
Percent of prime contract dollars annually to vendors.
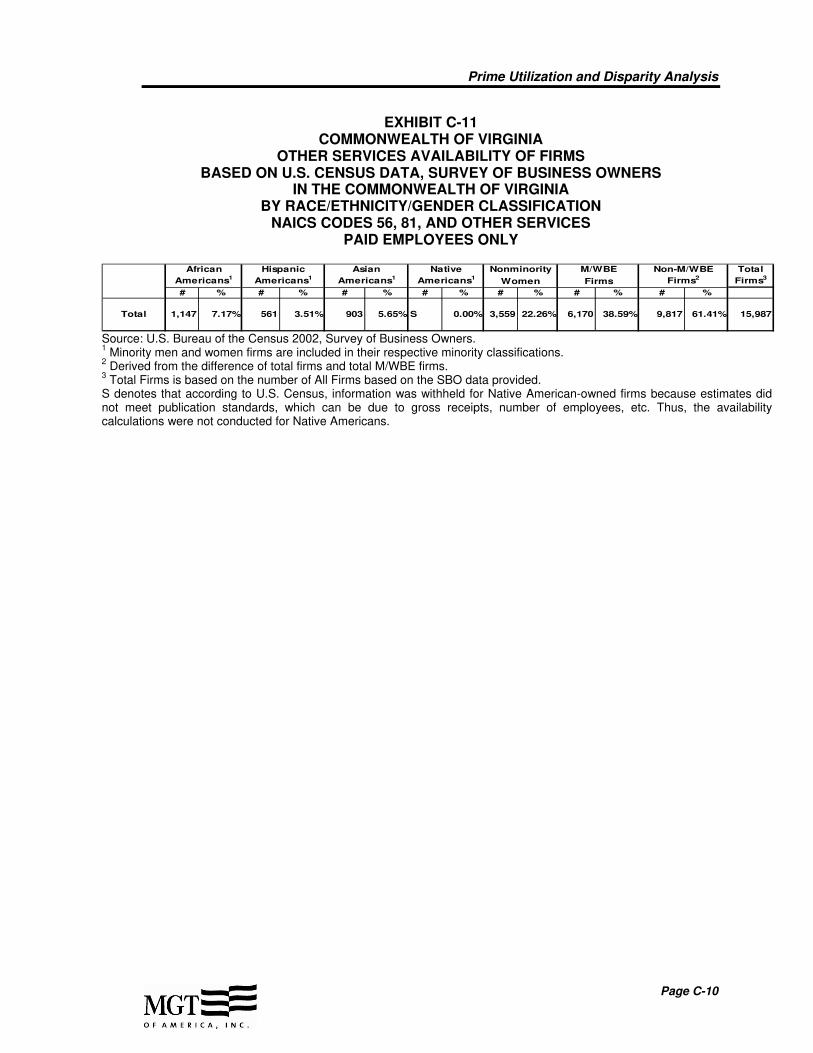
Prime Utilization and Disparity Analysis
Page C-10
EXHIBIT C-11 COMMONWEALTH OF VIRGINIA
OTHER SERVICES AVAILABILITY OF FIRMS BASED ON U.S. CENSUS DATA, SURVEY OF BUSINESS OWNERS
IN THE COMMONWEALTH OF VIRGINIA BY RACE/ETHNICITY/GENDER CLASSIFICATION
NAICS CODES 56, 81, AND OTHER SERVICES PAID EMPLOYEES ONLY
African Hispanic Asian Native Nonminority M/WBE Non-M/WBE Total
Americans1 Americans1 Americans1 Americans1Women Firms Firms2 Firms3
# % # % # % # % # % # % # %
Total 1,147 7.17% 561 3.51% 903 5.65% S 0.00% 3,559 22.26% 6,170 38.59% 9,817 61.41% 15,987
Source: U.S. Bureau of the Census 2002, Survey of Business Owners. 1 Minority men and women firms are included in their respective minority classifications.
2 Derived from the difference of total firms and total M/WBE firms.
3 Total Firms is based on the number of All Firms based on the SBO data provided.
S denotes that according to U.S. Census, information was withheld for Native American-owned firms because estimates did not meet publication standards, which can be due to gross receipts, number of employees, etc. Thus, the availability calculations were not conducted for Native Americans.

Prime Utilization and Disparity Analysis
Page C-11
EXHIBIT C-12 COMMONWEALTH OF VIRGINIA
DISPARITY ANALYSIS OF OTHER SERVICES PRIME VENDORS
BASED ON SELF-REPORT UNIVERSITIES DATA BY UNIVERSITY AND RACE/ETHNICITY/GENDER CLASSIFICATION
JULY 1, 2005, THROUGH JUNE 30, 2009
By Self-Reporting Universities and % of % of Available Disparity Disparate Impact
Business Ownership Classification Dollars1 Firms2 Index3of Utilization
College of William and Mary
African Americans 0.94% 7.17% 13.08 * Underutilization
Hispanic Americans 0.61% 3.51% 17.42 * Underutilization
Asian Americans 0.03% 5.65% 0.56 * Underutilization
Native Americans 0.01% S N/A N/A
Nonminority Women 4.18% 22.26% 18.78 * UnderutilizationNon-M/WBE Firms 94.23% 61.41% 153.46 Overutilization
George Mason University
African Americans 0.09% 7.17% 1.20 * Underutilization
Hispanic Americans 0.98% 3.51% 27.97 * Underutilization
Asian Americans 20.30% 5.65% 359.31 Overutilization
Native Americans 0.12% S N/A N/A
Nonminority Women 5.76% 22.26% 25.88 * UnderutilizationNon-M/WBE Firms 72.75% 61.41% 118.48 Overutilization
James Madison University
African Americans 0.27% 7.17% 3.70 * Underutilization
Hispanic Americans 0.31% 3.51% 8.73 * Underutilization
Asian Americans 0.09% 5.65% 1.52 * Underutilization
Native Americans 0.00% S N/A N/A
Nonminority Women 4.81% 22.26% 21.62 * UnderutilizationNon-M/WBE Firms 94.53% 61.41% 153.94 Overutilization
Old Dominion University
African Americans 0.22% 7.17% 3.10 * Underutilization
Hispanic Americans 1.40% 3.51% 40.00 * Underutilization
Asian Americans 0.49% 5.65% 8.70 * Underutilization
Native Americans 1.66% S N/A N/A
Nonminority Women 8.71% 22.26% 39.14 * UnderutilizationNon-M/WBE Firms 87.51% 61.41% 142.51 Overutilization
Radford University
African Americans 0.00% 7.17% 0.00 * Underutilization
Hispanic Americans 0.14% 3.51% 4.01 * Underutilization
Asian Americans 0.00% 5.65% 0.00 * Underutilization
Native Americans 0.00% S N/A N/A
Nonminority Women 0.01% 22.26% 0.06 * UnderutilizationNon-M/WBE Firms 99.85% 61.41% 162.60 Overutilization
University of Mary Washington
African Americans 0.00% 7.17% 0.00 * Underutilization
Hispanic Americans 1.04% 3.51% 29.67 * Underutilization
Asian Americans 0.00% 5.65% 0.00 * Underutilization
Native Americans 0.00% S N/A N/A
Nonminority Women 0.17% 22.26% 0.76 * UnderutilizationNon-M/WBE Firms 98.79% 61.41% 160.88 Overutilization
University of Virginia
African Americans 0.01% 7.17% 0.21 * Underutilization
Hispanic Americans 0.03% 3.51% 0.87 * Underutilization
Asian Americans 0.00% 5.65% 0.06 * Underutilization
Native Americans 0.03% S N/A N/A
Nonminority Women 1.28% 22.26% 5.74 * UnderutilizationNon-M/WBE Firms 98.65% 61.41% 160.64 Overutilization
Virginia Commonwealth University
African Americans 0.05% 7.17% 0.69 * Underutilization
Hispanic Americans 0.05% 3.51% 1.44 * Underutilization
Asian Americans 0.05% 5.65% 0.87 * Underutilization
Native Americans 0.00% S N/A N/A
Nonminority Women 2.41% 22.26% 10.83 * UnderutilizationNon-M/WBE Firms 97.44% 61.41% 158.68 Overutilization
Virginia Polytechnic Institute and
State University - Virginia Tech
African Americans 0.10% 7.17% 1.34 * Underutilization
Hispanic Americans 2.12% 3.51% 60.31 * Underutilization
Asian Americans 0.19% 5.65% 3.43 * Underutilization
Native Americans 0.02% S N/A N/A
Nonminority Women 7.43% 22.26% 33.39 * UnderutilizationNon-M/WBE Firms 90.15% 61.41% 146.80 Overutilization
All Universities (Self-Reported)
African Americans 0.22% 7.17% 3.12 * Underutilization
Hispanic Americans 0.60% 3.51% 17.09 * Underutilization
Asian Americans 2.10% 5.65% 37.20 * Underutilization
Native Americans 0.14% S N/A N/A
Nonminority Women 3.76% 22.26% 16.90 * UnderutilizationNon-M/WBE Firms 93.17% 61.41% 151.73 Overutilization
Source: MGT developed a procurement and vendor database (based on self-reporting data) for the Commonwealth covering the period from July 1, 2005, through June 30, 2009. 1 The percentage of dollars is taken from the prime utilization exhibit previously shown in Appendix C.
2 The percentage of available contractors is taken from the availability exhibit previously shown in Appendix C.
3 The disparity index is the ratio of % utilization to % availability times 100.
* An asterisk is used to indicate a substantial level of disparity – index below 80.00. S denotes that according to U.S. Census, information was withheld for Native American-owned firms because estimates did not meet publication standards, which can be due to gross receipts, number of employees, etc. Thus, the availability calculations were not conducted for Native Americans.
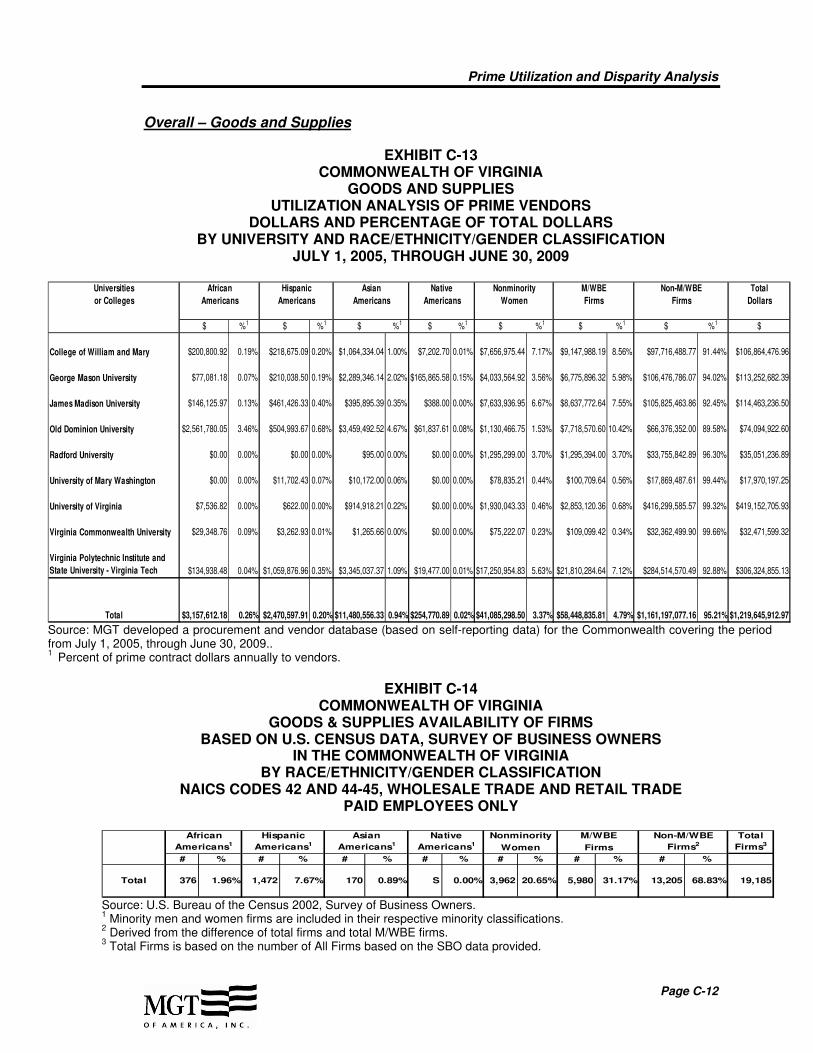
Prime Utilization and Disparity Analysis
Page C-12
Overall – Goods and Supplies
EXHIBIT C-13 COMMONWEALTH OF VIRGINIA
GOODS AND SUPPLIES UTILIZATION ANALYSIS OF PRIME VENDORS
DOLLARS AND PERCENTAGE OF TOTAL DOLLARS BY UNIVERSITY AND RACE/ETHNICITY/GENDER CLASSIFICATION
JULY 1, 2005, THROUGH JUNE 30, 2009
Universities African Hispanic Asian Native Nonminority M/WBE Non-M/WBE Total
or Colleges Americans Americans Americans Americans Women Firms Firms Dollars
$ %1 $ %1 $ %1 $ %1 $ %1 $ %1 $ %1 $
College of William and Mary $200,800.92 0.19% $218,675.09 0.20% $1,064,334.04 1.00% $7,202.70 0.01% $7,656,975.44 7.17% $9,147,988.19 8.56% $97,716,488.77 91.44% $106,864,476.96
George Mason University $77,081.18 0.07% $210,038.50 0.19% $2,289,346.14 2.02% $165,865.58 0.15% $4,033,564.92 3.56% $6,775,896.32 5.98% $106,476,786.07 94.02% $113,252,682.39
James Madison University $146,125.97 0.13% $461,426.33 0.40% $395,895.39 0.35% $388.00 0.00% $7,633,936.95 6.67% $8,637,772.64 7.55% $105,825,463.86 92.45% $114,463,236.50
Old Dominion University $2,561,780.05 3.46% $504,993.67 0.68% $3,459,492.52 4.67% $61,837.61 0.08% $1,130,466.75 1.53% $7,718,570.60 10.42% $66,376,352.00 89.58% $74,094,922.60
Radford University $0.00 0.00% $0.00 0.00% $95.00 0.00% $0.00 0.00% $1,295,299.00 3.70% $1,295,394.00 3.70% $33,755,842.89 96.30% $35,051,236.89
University of Mary Washington $0.00 0.00% $11,702.43 0.07% $10,172.00 0.06% $0.00 0.00% $78,835.21 0.44% $100,709.64 0.56% $17,869,487.61 99.44% $17,970,197.25
University of Virginia $7,536.82 0.00% $622.00 0.00% $914,918.21 0.22% $0.00 0.00% $1,930,043.33 0.46% $2,853,120.36 0.68% $416,299,585.57 99.32% $419,152,705.93
Virginia Commonwealth University $29,348.76 0.09% $3,262.93 0.01% $1,265.66 0.00% $0.00 0.00% $75,222.07 0.23% $109,099.42 0.34% $32,362,499.90 99.66% $32,471,599.32
Virginia Polytechnic Institute and
State University - Virginia Tech $134,938.48 0.04% $1,059,876.96 0.35% $3,345,037.37 1.09% $19,477.00 0.01% $17,250,954.83 5.63% $21,810,284.64 7.12% $284,514,570.49 92.88% $306,324,855.13
Total $3,157,612.18 0.26% $2,470,597.91 0.20% $11,480,556.33 0.94% $254,770.89 0.02% $41,085,298.50 3.37% $58,448,835.81 4.79% $1,161,197,077.16 95.21% $1,219,645,912.97
Source: MGT developed a procurement and vendor database (based on self-reporting data) for the Commonwealth covering the period from July 1, 2005, through June 30, 2009.. 1
Percent of prime contract dollars annually to vendors.
EXHIBIT C-14 COMMONWEALTH OF VIRGINIA
GOODS & SUPPLIES AVAILABILITY OF FIRMS BASED ON U.S. CENSUS DATA, SURVEY OF BUSINESS OWNERS
IN THE COMMONWEALTH OF VIRGINIA BY RACE/ETHNICITY/GENDER CLASSIFICATION
NAICS CODES 42 AND 44-45, WHOLESALE TRADE AND RETAIL TRADE PAID EMPLOYEES ONLY
African Hispanic Asian Native Nonminority M/WBE Non-M/WBE Total
Americans1 Americans1 Americans1 Americans1Women Firms Firms2 Firms3
# % # % # % # % # % # % # %
Total 376 1.96% 1,472 7.67% 170 0.89% S 0.00% 3,962 20.65% 5,980 31.17% 13,205 68.83% 19,185
Source: U.S. Bureau of the Census 2002, Survey of Business Owners. 1 Minority men and women firms are included in their respective minority classifications.
2 Derived from the difference of total firms and total M/WBE firms.
3 Total Firms is based on the number of All Firms based on the SBO data provided.

Prime Utilization and Disparity Analysis
Page C-13
EXHIBIT C-15 COMMONWEALTH OF VIRGINIA
DISPARITY ANALYSIS OF GOODS AND SUPPLIES PRIME VENDORS
BASED ON SELF-REPORT UNIVERSITIES DATA BY UNIVERSITY AND RACE/ETHNICITY/GENDER CLASSIFICATION
JULY 1, 2005, THROUGH JUNE 30, 2009
By Self-Reporting Universities and % of % of Available Disparity Disparate Impact
Business Ownership Classification Dollars1 Firms2 Index3of Utilization
College of William and Mary
African Americans 0.19% 1.96% 9.59 * Underutilization
Hispanic Americans 0.20% 7.67% 2.67 * Underutilization
Asian Americans 1.00% 0.89% 112.40 Overutilization
Native Americans 0.01% S N/A N/A
Nonminority Women 7.17% 20.65% 34.70 * UnderutilizationNon-M/WBE Firms 91.44% 68.83% 132.85 Overutilization
George Mason University
African Americans 0.07% 1.96% 3.47 * Underutilization
Hispanic Americans 0.19% 7.67% 2.42 * Underutilization
Asian Americans 2.02% 0.89% 228.13 Overutilization
Native Americans 0.15% S N/A N/A
Nonminority Women 3.56% 20.65% 17.25 * UnderutilizationNon-M/WBE Firms 94.02% 68.83% 136.59 Overutilization
James Madison University
African Americans 0.13% 1.96% 6.51 * Underutilization
Hispanic Americans 0.40% 7.67% 5.25 * Underutilization
Asian Americans 0.35% 0.89% 39.03 * Underutilization
Native Americans 0.00% S N/A N/A
Nonminority Women 6.67% 20.65% 32.29 * UnderutilizationNon-M/WBE Firms 92.45% 68.83% 134.32 Overutilization
Old Dominion University
African Americans 3.46% 1.96% 176.41 Overutilization
Hispanic Americans 0.68% 7.67% 8.88 * Underutilization
Asian Americans 4.67% 0.89% 526.91 Overutilization
Native Americans 0.08% S N/A N/A
Nonminority Women 1.53% 20.65% 7.39 * UnderutilizationNon-M/WBE Firms 89.58% 68.83% 130.15 Overutilization
Radford University
African Americans 0.00% 1.96% 0.00 * Underutilization
Hispanic Americans 0.00% 7.67% 0.00 * Underutilization
Asian Americans 0.00% 0.89% 0.03 * Underutilization
Native Americans 0.00% S N/A N/A
Nonminority Women 3.70% 20.65% 17.89 * UnderutilizationNon-M/WBE Firms 96.30% 68.83% 139.92 Overutilization
University of Mary Washington
African Americans 0.00% 1.96% 0.00 * Underutilization
Hispanic Americans 0.07% 7.67% 0.85 * Underutilization
Asian Americans 0.06% 0.89% 6.39 * Underutilization
Native Americans 0.00% S N/A N/A
Nonminority Women 0.44% 20.65% 2.12 * UnderutilizationNon-M/WBE Firms 99.44% 68.83% 144.47 Overutilization
University of Virginia
African Americans 0.00% 1.96% 0.09 * Underutilization
Hispanic Americans 0.00% 7.67% 0.00 * Underutilization
Asian Americans 0.22% 0.89% 24.63 * Underutilization
Native Americans 0.00% S N/A N/A
Nonminority Women 0.46% 20.65% 2.23 * UnderutilizationNon-M/WBE Firms 99.32% 68.83% 144.30 Overutilization
Virginia Commonwealth University
African Americans 0.09% 1.96% 4.61 * Underutilization
Hispanic Americans 0.01% 7.67% 0.13 * Underutilization
Asian Americans 0.00% 0.89% 0.44 * Underutilization
Native Americans 0.00% S N/A N/A
Nonminority Women 0.23% 20.65% 1.12 * UnderutilizationNon-M/WBE Firms 99.66% 68.83% 144.80 Overutilization
Virginia Polytechnic Institute and
State University - Virginia Tech
African Americans 0.04% 1.96% 2.25 * Underutilization
Hispanic Americans 0.35% 7.67% 4.51 * Underutilization
Asian Americans 1.09% 0.89% 123.23 Overutilization
Native Americans 0.01% S N/A N/A
Nonminority Women 5.63% 20.65% 27.27 * UnderutilizationNon-M/WBE Firms 92.88% 68.83% 134.94 Overutilization
All Universities (Self-Reported)
African Americans 0.26% 1.96% 13.21 * Underutilization
Hispanic Americans 0.20% 7.67% 2.64 * Underutilization
Asian Americans 0.94% 0.89% 106.23 Overutilization
Native Americans 0.02% S N/A N/A
Nonminority Women 3.37% 20.65% 16.31 * UnderutilizationNon-M/WBE Firms 95.21% 68.83% 138.32 Overutilization
Source: MGT developed a procurement and vendor database (based on self-reporting data) for the Commonwealth covering the period from July 1, 2005, through June 30, 2009. 1 The percentage of dollars is taken from the prime utilization exhibit previously shown in Appendix C.
2 The percentage of available contractors is taken from the availability exhibit previously shown in Appendix C.
3 The disparity index is the ratio of % utilization to % availability times 100.
* An asterisk is used to indicate a substantial level of disparity – index below 80.00. S denotes that according to U.S. Census, information was withheld for Native American-owned firms because estimates did not meet publication standards, which can be due to gross receipts, number of employees, etc. Thus, the availability calculations were not conducted for Native Americans.

APPENDIX D:D(a): PRIVATE SECTOR
COMMERCIAL CONSTRUCTION ANALYSIS
D(b): PRIVATE SECTOR COMMERCIAL CONSTRUCTION ANALYSIS CITY OF RICHMOND
VIRGINIA COMMERCIAL PERMITS DATA

Page D(a)-1
APPENDIX D(a)
PRIVATE SECTOR COMMERCIAL CONSTRUCTION ANALYSIS
This chapter reports two sets of analyses pertaining to minority- and women-owned business enterprise (M/WBE) utilization and availability in the Commonwealth of Virginia (Commonwealth) private sector marketplace. The analyses examined M/WBE utilization and availability in the Commonwealth market area, city of Richmond (Richmond), and Reed Construction Data (RCD)1, private commercial construction industry to determine disparities in M/WBE utilization at both the prime contractor and subcontractor level. Once the record of private sector utilization was established, MGT was also able to compare the rates of M/WBE, and non-M/WBE utilization in the private sector to their utilization by the Commonwealth for public sector construction procurement. The presentation of Appendix D is organized as follows:
D(a).1 Methodology – Private Sector Commercial Construction Analysis
D(a).2 Collection and Management of Data
D(b).1 Private Sector Utilization Analysis (Based on Richmond Commercial Construction Permit Data) by Race/Ethnicity/Gender of Business Ownership for Construction Prime Contractors and Subcontractors
D(b).2 Private Sector Availability Analysis by Race/Ethnicity/Gender of Business Ownership for Construction Contractors
D(b).3 Analysis of Disparities in Private Sector Utilization by Race/Ethnicity/Gender of Business Ownership for Construction Prime Contractors and Subcontractors based on City of Richmond Commercial Construction Permit Data
D(a).1 Methodology – Private Sector Commercial Construction Analysis
This section describes MGT’s methodology for the collection of data and the calculation of the Commonwealth and Richmond market area as the basis for MGT’s analysis of private sector utilization of minority-, women-, and nonminority-owned firms and their availability. D(a).1.1 Private Sector Analysis – Rationale
In City of Richmond v J.A. Croson (Croson), the Court established that a “municipality has a compelling government interest in redressing not only discrimination committed by the municipality itself, but also discrimination committed by private parties within the municipality’s legislative jurisdiction, so long as the municipality in some way participated
1 The findings from the RCD analyses are presented in Appendix E of this report.
Private Sector Utilization and Disparity Analyses
Page D(a)-2
in the discrimination to be remedied by the program.”2 This argument was reinforced by the Court of Appeals decision in Adarand Construction, Inc. v Rodney Slater, concluding that there was a compelling interest for a government disadvantaged business enterprise (DBE) program, based primarily on evidence of private sector discrimination.3 According to this argument, discriminatory practices found in the private sector marketplace may be indicative of government’s passive or, in some cases, active participation in local discrimination. To remedy such discrimination, Croson provided that government “can use its spending powers to remedy private discrimination, if it identifies that discrimination with the particularity required by the Fourteenth Amendment.”4 The purpose of a private sector analysis is to evaluate the presence or absence of discrimination in the private sector marketplace. Passive discrimination was examined in a disparity analysis of the utilization of M/WBE construction subcontractors by majority prime contractors on projects funded in the Commonwealth construction market. A comparison of public sector M/WBE utilization with private sector utilization enables an assessment of the extent to which majority prime contractors have tended to hire M/WBE subcontractors only to satisfy public sector requirements. Thus, the following questions are addressed:
Are there disparities in utilization of M/WBEs as prime contractors for commercial private sector construction projects relative to their availability in the Commonwealth market area?
Are there disparities in utilization of M/WBEs as subcontractors for commercial private sector construction projects relative to their availability in the Commonwealth market area?
D(a).2 Collection and Management of Data
MGT selected three sources of data for its private sector analysis: (1) data provided by Reed Construction Data (RCD) Corporation, (2) permit data (such as building, electrical, plumbing)5 provided by Richmond for commercial construction projects permitted between July 1, 2005, and June 30, 2009. The value in examining permits is that it offers the most complete and up-to-date record of actual construction activity undertaken in these market areas. However, to corroborate findings, MGT also analyzed RCD, which gathers information on both general construction and civil engineering projects in a given market area at both the prime contractor and subcontractor level.6 D(a).2.1 M/WBE Classifications and Business Categories
2 Croson, 488 U.S. 46, 109 S.Ct. at 720-21, 744-45.
3 Adarand v. Slater, 228 F.3d 1147 (10
th Cir. 2000).
4 See Richmond v. Croson, 488 U.S. 492 (1989).
5 Appropriate permits are required for any building, construction, alteration, or repair involving new or
changed uses of property (other than ordinary repairs). Although in most instances, individual permits were issued for work on the same project, it was possible, in many cases, to identify subcontractors who were clearly providers of construction and other services to prime contractors, based on the type of work, since separate permits are required for building, electrical, heating, air conditioning, and plumbing. 6 RCD were also reviewed but proved to be incomplete for this analysis. Although RCD’s subcontractor data
was incomplete and unusable, RCD’s prime contracting data was sufficient for a prime contractor analysis. Results from the prime contractor analysis are summarized briefly in this chapter.
Private Sector Utilization and Disparity Analyses
Page D(a)-3
In Chapter 4.0, the five M/WBE classifications described—African American, Hispanic American, Asian American, Native American, and nonminority women—were used as the basis of MGT’s private sector analysis of utilization and disparity. Since neither permit data nor RCD contain contractor race, ethnic, and gender information (race, ethnicity, and gender classification), MGT was able to appropriate information contained in various vendor lists obtained from the Commonwealth, trade associations, and business organizations to conduct a vendor match procedure. This procedure allowed MGT to further identify ethnic, gender, and racial classifications of firms by identifying vendors in the permit and RCD databases and assigning M/WBE categories. In order to obtain the greatest number of potential match combinations, a conservative manual match was conducted. For the business category analysis, findings reported in this chapter deal only with private sector construction for two reasons: (1) permit data, by its nature, pertains only to construction activities, which is also the category for which data tends to be most extensive and reliable, and (2) in the courts, historically, construction activity in a given jurisdiction has been scrutinized more than any other business category because, in both public and private sector business activity, it tends to be the most financially lucrative in terms of its impact on a local economy. The courts have asserted that jurisdictions have a “compelling interest” to advance M/WBE business interests in their local markets. Accordingly, for the analysis, the data were classified according to two categories of construction contractor—prime contractors and subcontractors—based on the permit type data field, or level of work. D(a).2.2 Market Area Methodology
The private sector analysis for Richmond commercial permit data and RCD is based on commercial construction which was located in the Commonwealth. D(a).2.3 Availability Data Collection
Once counties and states had been identified, MGT ascertained which firms were classified as M/WBEs within the Commonwealth MGT utilized several sources, such as 2002 U.S. Census Bureau, Survey of Business Owners (SBO) data and custom census, to determine prime contractor and subcontractor availability in order to develop the appropriate availability estimates. There are no vendor lists or bidder lists for the private sector construction. Consequently, SBO data was used as the measure of construction firm availability. Given that a more restricted set of firms pursue and bid on public sector contracts, census is overly broad as an estimate of public sector availability. Therefore, SBO7 data based on North American Industry Classification System (NAICS) code 23, construction and construction-related services were used for the availability analyses in private sector.
7 According to U.S. Census, information was withheld for African American-, Native American-, Asian
American-, and non-minority women-owned firms because estimates did not meet publication standards, which can be due to gross receipts, number of employees, etc. Thus, the availability calculations were not conducted for these groups.

Page D(b)-1
APPENDIX D(b)
PRIVATE SECTOR COMMERCIAL CONSTRUCTION ANALYSIS, CITY OF RICHMOND, VIRGINIA COMMERCIAL PERMITS DATA
D(b).1 Private Sector Utilization Analysis (Based on Richmond, Virginia, Commercial Permit Data) by Race/Ethnicity/Gender of Business Ownership for Construction Prime Contractors
Section D(b).1 reports findings from the analysis of the utilization of minority- and women-owned business enterprises (M/WBEs) and non-M/WBE firms in the city of Richmond (Richmond) private sector commercial construction market. D(b).1.1 Prime Contracts – Richmond Private Commercial Building Permits
This section presents the utilization of M/WBE and non-M/WBE firms for private commercial building permit information within the Commonwealth of Virginia (Commonwealth) based on Richmond commercial construction permit data. Exhibit D(b)-1 reports firm utilization based on the representative sample of all identified private commercial building permits issued between July 2005 and June 2009.
EXHIBIT D(B)-1 CITY OF RICHMOND, VIRGINIA
PRIVATE COMMERCIAL BUILDING PERMITS UTILIZATION ANALYSIS OF PRIME CONTRACTORS
IN THE COMMONWEALTH OF VIRGINIA BY RACE/ETHNIC/GENDER CLASSIFICATION
JULY 1, 2005 THROUGH JUNE 30, 2009
Fiscal African Hispanic Nonminority M/WBE Non-M/WBE Total
Year American American American Firms Firms Project
Value
$ %1 $ %1 $ %1 $ %1 $ %1 $ %1 $ %1 $
2006 $0 0.00% $0 0.00% $0 0.00% $0 0.00% $0 0.00% $0 0.00% $60,958,534 100.00% $60,958,534
2007 $0 0.00% $0 0.00% $0 0.00% $0 0.00% $0 0.00% $0 0.00% $107,976,497 100.00% $107,976,497
2008 $0 0.00% $0 0.00% $0 0.00% $0 0.00% $0 0.00% $0 0.00% $440,644,858 100.00% $440,644,858
2009 $150,000 0.13% $55,231 0.05% $7,000 0.01% $0 0.00% $0 0.00% $212,231 0.18% $117,101,024 99.82% $117,313,255
Total $150,000 0.02% $55,231 0.01% $7,000 0.00% $0 0.00% $0 0.00% $212,231 0.03% $726,680,913 99.97% $726,893,144
Asian Native
American Women
Source: MGT developed a vendor and permits database based on city of Richmond commercial construction permits (such as building, electrical) issued between July 2005 and June 2009. 1 Percentage of total project valuation dollars awarded annually to contractors.

Private Sector Utilization and Disparity Analyses
Page D(b)-2
Exhibit D(b)-2 reports private commercial M/WBE prime contractor utilization by number of permits and number of unique (unduplicated) firms receiving permits.
EXHIBIT D(B)-2 CITY OF RICHMOND, VIRGINIA
PRIVATE COMMERCIAL BUILDING PERMITS UTILIZATION ANALYSIS OF PRIME CONTRACTORS
IN THE COMMONWEALTH OF VIRGINIA BY RACE/ETHNIC/GENDER CLASSIFICATION
JULY 1, 2005 THROUGH JUNE 30, 2009
NUMBER OF BUILDING PERMITS ISSUED BY RACE/ETHNIC/GENDER CLASSIFICATION
Fiscal African Hispanic Asian Native Nonminority M/WBE Non-M/WBE Total
Year Americans Americans Americans Americans Firms Firms Projects
# %1 # %1 # %1 # %1 # %1 # %1 # %1 #
2006 0 0.00% 0 0.00% 0 0.00% 0 0 0 0.00% 0 0.00% 265 100.00% 265
2007 0 0.00% 0 0.00% 0 0.00% 0 0 0 0.00% 0 0.00% 235 100.00% 235
2008 0 0.00% 0 0.00% 0 0.00% 0 0 0 0.00% 0 0.00% 305 100.00% 305
2009 1 0.31% 5 1.55% 5 1.55% 0 0 0 0.00% 11 3.42% 311 96.58% 322
Total 1 0.09% 5 0.44% 5 0.44% 0 0.00% 0 0.00% 11 0.98% 1,116 99.02% 1,127
Women
NUMBER OF FIRMS
BY RACE/ETHNIC/GENDER CLASSIFICATION
Fiscal African Hispanic Asian Native Nonminority M/WBE Non-M/WBE Total
Year Americans Americans Americans Americans Firms Firms Firms
# % # % # % # % # % # % # % #
2006 0 0.00% 0 0.00% 0 0.00% 0 0.00% 0 0.00% 0 0.00% 212 100.00% 212
2007 0 0.00% 0 0.00% 0 0.00% 0 0.00% 0 0.00% 0 0.00% 187 100.00% 187
2008 0 0.00% 0 0.00% 0 0.00% 0 0.00% 0 0.00% 0 0.00% 237 100.00% 237
2009 1 0.50% 2 1.00% 1 0.00% 0 0.00% 0 0.00% 4 1.99% 197 98.01% 201
Total
Unique Firms21 0.14% 2 0.27% 1 0.14% 0 0.00% 0 0.00% 4 0.54% 733 99.46% 737
Women
Source: MGT developed a vendor and permits database based on city of Richmond commercial construction permits (such as building, electrical) issued between July 2005 and June 2009. 1 Percentage of total building permits.
2 The Total Unique Firms counts a firm only once for each year the firm receives work. Since a firm could be used in
multiple years, the Total Unique Firms for the entire study period may not equal the sum of all years.
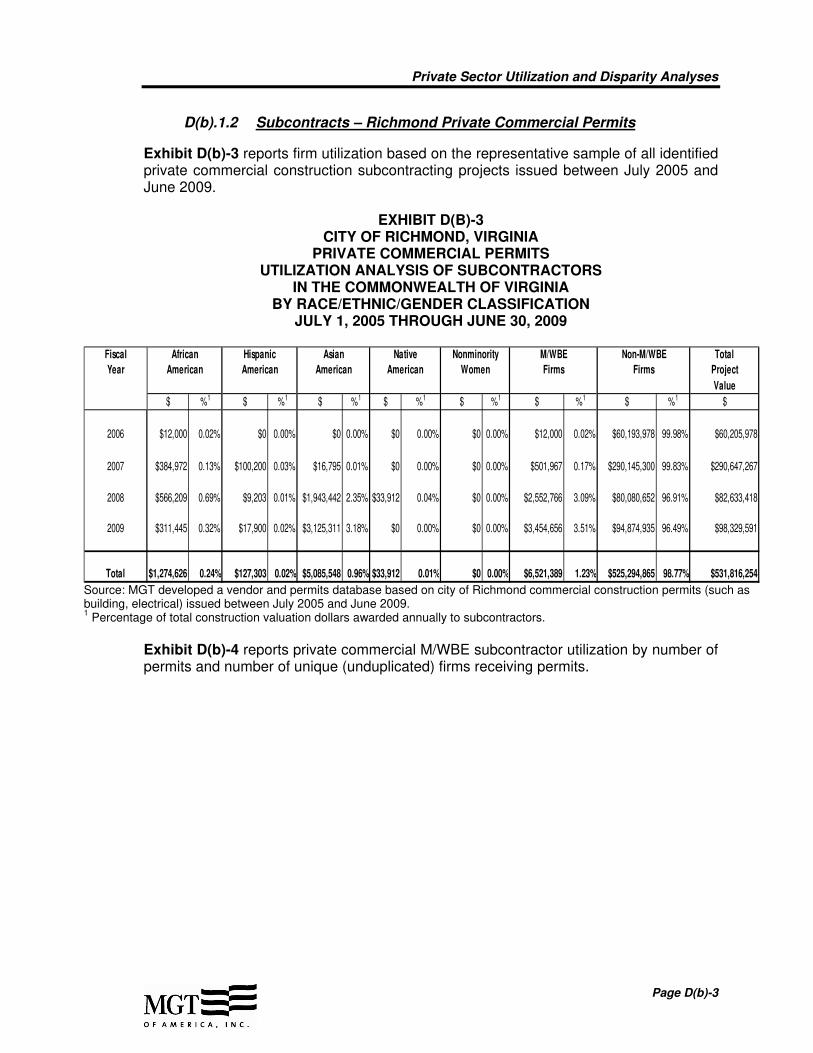
Private Sector Utilization and Disparity Analyses
Page D(b)-3
D(b).1.2 Subcontracts – Richmond Private Commercial Permits
Exhibit D(b)-3 reports firm utilization based on the representative sample of all identified private commercial construction subcontracting projects issued between July 2005 and June 2009.
EXHIBIT D(B)-3 CITY OF RICHMOND, VIRGINIA
PRIVATE COMMERCIAL PERMITS UTILIZATION ANALYSIS OF SUBCONTRACTORS
IN THE COMMONWEALTH OF VIRGINIA BY RACE/ETHNIC/GENDER CLASSIFICATION
JULY 1, 2005 THROUGH JUNE 30, 2009
Fiscal African Hispanic Nonminority M/WBE Non-M/WBE Total
Year American American American Firms Firms Project
Value
$ %1 $ %1 $ %1 $ %1 $ %1 $ %1 $ %1 $
2006 $12,000 0.02% $0 0.00% $0 0.00% $0 0.00% $0 0.00% $12,000 0.02% $60,193,978 99.98% $60,205,978
2007 $384,972 0.13% $100,200 0.03% $16,795 0.01% $0 0.00% $0 0.00% $501,967 0.17% $290,145,300 99.83% $290,647,267
2008 $566,209 0.69% $9,203 0.01% $1,943,442 2.35% $33,912 0.04% $0 0.00% $2,552,766 3.09% $80,080,652 96.91% $82,633,418
2009 $311,445 0.32% $17,900 0.02% $3,125,311 3.18% $0 0.00% $0 0.00% $3,454,656 3.51% $94,874,935 96.49% $98,329,591
Total $1,274,626 0.24% $127,303 0.02% $5,085,548 0.96% $33,912 0.01% $0 0.00% $6,521,389 1.23% $525,294,865 98.77% $531,816,254
Asian Native
American Women
Source: MGT developed a vendor and permits database based on city of Richmond commercial construction permits (such as building, electrical) issued between July 2005 and June 2009. 1 Percentage of total construction valuation dollars awarded annually to subcontractors.
Exhibit D(b)-4 reports private commercial M/WBE subcontractor utilization by number of permits and number of unique (unduplicated) firms receiving permits.
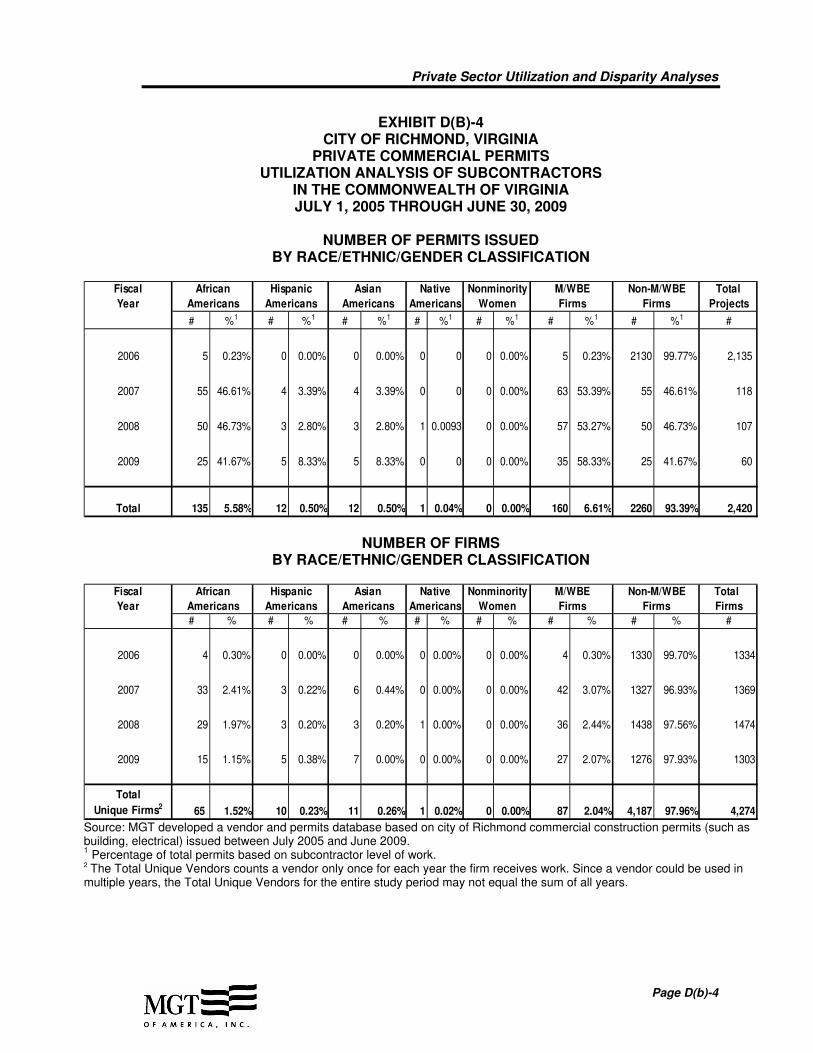
Private Sector Utilization and Disparity Analyses
Page D(b)-4
EXHIBIT D(B)-4 CITY OF RICHMOND, VIRGINIA
PRIVATE COMMERCIAL PERMITS UTILIZATION ANALYSIS OF SUBCONTRACTORS
IN THE COMMONWEALTH OF VIRGINIA JULY 1, 2005 THROUGH JUNE 30, 2009
NUMBER OF PERMITS ISSUED
BY RACE/ETHNIC/GENDER CLASSIFICATION
Fiscal African Hispanic Asian Native Nonminority M/WBE Non-M/WBE Total
Year Americans Americans Americans Americans Firms Firms Projects
# %1 # %1 # %1 # %1 # %1 # %1 # %1 #
2006 5 0.23% 0 0.00% 0 0.00% 0 0 0 0.00% 5 0.23% 2130 99.77% 2,135
2007 55 46.61% 4 3.39% 4 3.39% 0 0 0 0.00% 63 53.39% 55 46.61% 118
2008 50 46.73% 3 2.80% 3 2.80% 1 0.0093 0 0.00% 57 53.27% 50 46.73% 107
2009 25 41.67% 5 8.33% 5 8.33% 0 0 0 0.00% 35 58.33% 25 41.67% 60
Total 135 5.58% 12 0.50% 12 0.50% 1 0.04% 0 0.00% 160 6.61% 2260 93.39% 2,420
Women
NUMBER OF FIRMS
BY RACE/ETHNIC/GENDER CLASSIFICATION
Fiscal African Hispanic Asian Native Nonminority M/WBE Non-M/WBE Total
Year Americans Americans Americans Americans Firms Firms Firms
# % # % # % # % # % # % # % #
2006 4 0.30% 0 0.00% 0 0.00% 0 0.00% 0 0.00% 4 0.30% 1330 99.70% 1334
2007 33 2.41% 3 0.22% 6 0.44% 0 0.00% 0 0.00% 42 3.07% 1327 96.93% 1369
2008 29 1.97% 3 0.20% 3 0.20% 1 0.00% 0 0.00% 36 2.44% 1438 97.56% 1474
2009 15 1.15% 5 0.38% 7 0.00% 0 0.00% 0 0.00% 27 2.07% 1276 97.93% 1303
Total
Unique Firms265 1.52% 10 0.23% 11 0.26% 1 0.02% 0 0.00% 87 2.04% 4,187 97.96% 4,274
Women
Source: MGT developed a vendor and permits database based on city of Richmond commercial construction permits (such as building, electrical) issued between July 2005 and June 2009. 1 Percentage of total permits based on subcontractor level of work.
2 The Total Unique Vendors counts a vendor only once for each year the firm receives work. Since a vendor could be used in
multiple years, the Total Unique Vendors for the entire study period may not equal the sum of all years.

Private Sector Utilization and Disparity Analyses
Page D(b)-5
D(b).2 Private Sector Availability Analysis by Race/Ethnic/Gender of Business Ownership for Construction Contractors
Exhibits D(b)-5 and D(b)-6 report findings based on U.S. Census SBO data for the population of available contractors in the Commonwealth by racial/ethnic/gender category. The availability for construction was derived from those firms that have construction or construction-related services based on NAICS Code 23.8
D(b).2.1 Construction Prime Availability
The availability of M/WBE and non-M/WBE prime contractors in the Commonwealth is displayed in Exhibit D(b)-5.
EXHIBIT D(B)-5 AVAILABILITY OF CONTRACTORS
IN THE COMMONWEALTH OF VIRGINIA BY RACE/ETHNIC/GENDER CLASSIFICATION BASED ON CENSUS DATA USING NAICS 23
NUMBER OF FIRMS WITH PAID EMPLOYEES ONLY
African Hispanic Asian Native Nonminority M/WBE Non-M/WBE Total
Americans1 Americans1 Americans1 Americans1 Firms Firms2 Firms3
# % # % # % # % # % # % # %
Total 581 3.10% 451 2.40% 286 1.53% 85 0.45% 1,440 7.68% 2,843 15.16% 15,910 84.84% 18,753
Women
Source: U.S. Census Bureau 2002, SBO, based on firms with paid employees only. 1
Minority woman-owned firms are included in their respective minority classifications. 2
Number of non-M/WBE firms derived by subtracting all M/WBE firms from total firms. 3 Total firms derived from the U.S. Census Bureau, SBO.
S denotes that according to U.S. Census, information was withheld for Asian American-owned firms because estimates did not meet publication standards, which can be due to gross receipts, number of employees, etc. Thus, the availability calculations were not conducted for this group.
D(b).2.2 Construction Subcontractor Availability
Exhibit D(b)-6 displays census availability percentages for subcontractors.
8 NAICS Code 23 includes subsector 236, construction of buildings, comprises establishments of the
general contractor type and operative builders involved in the construction of buildings.; subsector 237, heavy and civil engineering construction, comprises establishments involved in the construction of engineering projects; and subsector 238, specialty trade contractors, comprises establishments engaged in specialty trade activities generally needed in the construction of all types of buildings.

Private Sector Utilization and Disparity Analyses
Page D(b)-6
EXHIBIT D(B)-6 AVAILABILITY OF SUBCONTRACTORS IN THE COMMONWEALTH OF VIRGINIA
BY RACE/ETHNIC/GENDER CLASSIFICATION BASED ON CENSUS DATA USING NAICS 23
NUMBER OF FIRMS WITH PAID AND WITHOUT PAID EMPLOYEES
African Hispanic Asian Native Nonminority M/WBE Non-M/WBE Total
Americans1 Americans1 Americans1 Americans1 Firms Firms2 Firms3
# % # % # % # % # % # % # %
Total 2,853 4.19% 5,039 7.40% 2,198 3.23% 520 0.76% 4,052 5.95% 14,662 21.52% 53,457 78.48% 68,119
Women
Source: U.S. Census Bureau 2002, SBO, based on firms with paid and without paid employees. 1
Minority woman-owned firms are included in their respective minority classifications. 2
Number of non-M/WBE firms derived by subtracting all M/WBE firms from total firms. 3 Total firms derived from the U.S. Census Bureau, SBO.
D(b).3 Analysis of Disparities in Private Sector Utilization by Race/Ethnicity/ Gender of Business Ownership for Construction Prime Contractors and Subcontractors
Once the record of vendor utilization was calculated from permit data for each race/ethnic/gender category, it could be compared to the Commonwealth’s market area vendor availability in these categories to derive an index of disparity in private sector utilization for a given M/WBE prime contractor and subcontractor category. Findings are reported in Section D(b).3.1 and D(b).3.2. Egregious disparity between M/WBE and non-M/WBE utilization is apparent, even without formal statistical analysis. D(b).3.1 Permits-Prime Contracts
City of Richmond Commercial Permits-Prime Contracts
This section reports disparity indices for Richmond private commercial permits based on census availability of firms within the race, ethnicity, and gender categories for firms with paid employees only. Exhibit D(b)-7 shows that based on available data, there was no utilization of M/WBE firms for prime contractor level of work between fiscal year 2006 and 2008, resulting in substantial underutilization for these groups. Due to low levels of utilization in the subsequent year compared to the availability of firms, these M/WBE groups were substantially underutilized for commercial construction projects at a prime contractor level. Conversely, non-M/WBE firms were overutilized.

Private Sector Utilization and Disparity Analyses
Page D(b)-7
EXHIBIT D(b)-7 CITY OF RICHMOND, VIRGINIA
DISPARITY ANALYSIS OF PRIVATE SECTOR PRIME CONTRACTORS IN THE COMMONWEALTH OF VIRGINIA
BASED ON U.S. CENSUS SURVEY OF BUSINESS OWNERS DATA PAID EMPLOYEES ONLY AND RICHMOND PRIVATE COMMERCIAL PERMIT DATA
Business Owner % of % of Available Disparity
Classification Dollars1 Firms2 Index3
Fiscal Year 2006
African American 0.00% 3.10% 0.00 Underutilization *
Hispanic American 0.00% 2.40% 0.00 Underutilization *
Asian American 0.00% 1.53% 0.00 Underutilization *
Native American 0.00% 0.45% 0.00 Underutilization *
Nonminority Women 0.00% 7.68% 0.00 Underutilization *
Non-M/WBE Firms 100.00% 84.84% 117.87 Overutilization
Fiscal Year 2007
African American 0.00% 3.10% 0.00 Underutilization *
Hispanic American 0.00% 2.40% 0.00 Underutilization *
Asian American 0.00% 1.53% 0.00 Underutilization *
Native American 0.00% 0.45% 0.00 Underutilization *
Nonminority Women 0.00% 7.68% 0.00 Underutilization *
Non-M/WBE Firms 100.00% 84.84% 117.87 Overutilization
Fiscal Year 2008
African American 0.00% 3.10% 0.00 Underutilization *
Hispanic American 0.00% 2.40% 0.00 Underutilization *
Asian American 0.00% 1.53% 0.00 Underutilization *
Native American 0.00% 0.45% 0.00 Underutilization *
Nonminority Women 0.00% 7.68% 0.00 Underutilization *
Non-M/WBE Firms 100.00% 84.84% 117.87 Overutilization
Fiscal Year 2009
African American 0.13% 3.10% 4.13 Underutilization *
Hispanic American 0.05% 2.40% 1.96 Underutilization *
Asian American 0.01% 1.53% 0.39 Underutilization *
Native American 0.00% 0.45% 0.00 Underutilization *
Nonminority Women 0.00% 7.68% 0.00 Underutilization *
Non-M/WBE Firms 99.82% 84.84% 117.66 Overutilization
All Fiscal Years
African American 0.02% 3.10% 0.67 Underutilization *
Hispanic American 0.01% 2.40% 0.32 Underutilization *
Asian American 0.00% 1.53% 0.06 Underutilization *
Native American 0.00% 0.45% 0.00 Underutilization *
Nonminority Women 0.00% 7.68% 0.00 Underutilization *
Non-M/WBE Firms 99.97% 84.84% 117.83 Overutilization
Disparate Impact
of Utilization
Source: MGT developed a vendor and permits database based on city of Richmond commercial construction permits (such as building, electrical) issued between July 2005 and June 2009. 1
The percentage of construction valuation dollars is taken from the prime utilization exhibit shown in Appendix D(b). 2
The percentage of available contractors is taken from the availability exhibit shown in Appendix D(b). 3 The disparity index is the ratio of percent utilization to percent availability times 100.
* An asterisk is used to indicate a substantial level of disparity (index below 80.00).
D(b).3.2 Subcontracts
City of Richmond Commercial Permits-Subcontracts
Exhibit D(b)-8 indicates disparities in utilization of construction subcontractors by race, ethnicity, and gender category.

Private Sector Utilization and Disparity Analyses
Page D(b)-8
EXHIBIT D(b)-8 CITY OF RICHMOND, VIRGINIA
DISPARITY ANALYSIS OF PRIVATE SECTOR SUBCONTRACTORS IN THE COMMONWEALTH OF VIRGINIA
BASED ON U.S. CENSUS SURVEY OF BUSINESS OWNERS DATA PAID AND WIITHOUT PAID EMPLOYEES AND RICHMOND PRIVATE COMMERCIAL
PERMIT DATA
Business Owner % of % of Available Disparity
Classification Dollars1 Firms2 Index3
Fiscal Year 2006
African American 0.02% 4.19% 0.48 Underutilization *
Hispanic American 0.00% 7.40% 0.00 Underutilization *
Asian American 0.00% 3.23% 0.00 Underutilization *
Native American 0.00% 0.76% 0.00 Underutilization *
Nonminority Women 0.00% 5.95% 0.00 Underutilization *Non-M/WBE Firms 99.98% 78.48% 127.40 Overutilization
Fiscal Year 2007
African American 0.13% 4.19% 3.16 Underutilization *
Hispanic American 0.03% 7.40% 0.47 Underutilization *
Asian American 0.01% 3.23% 0.18 Underutilization *
Native American 0.00% 0.76% 0.00 Underutilization *
Nonminority Women 0.00% 5.95% 0.00 Underutilization *Non-M/WBE Firms 99.83% 78.48% 127.21 Overutilization
Fiscal Year 2008
African American 0.69% 4.19% 16.36 Underutilization *
Hispanic American 0.01% 7.40% 0.15 Underutilization *
Asian American 2.35% 3.23% 72.89 Underutilization *
Native American 0.04% 0.76% 5.38 Underutilization *
Nonminority Women 0.00% 5.95% 0.00 Underutilization *Non-M/WBE Firms 96.91% 78.48% 123.49 Overutilization
Fiscal Year 2009
African American 0.32% 4.19% 7.56 Underutilization *
Hispanic American 0.02% 7.40% 0.25 Underutilization *
Asian American 3.18% 3.23% 98.50 Underutilization
Native American 0.00% 0.76% 0.00 Underutilization *
Nonminority Women 0.00% 5.95% 0.00 Underutilization *Non-M/WBE Firms 96.49% 78.48% 122.95 Overutilization
All Fiscal Years
African American 0.24% 4.19% 5.72 Underutilization *
Hispanic American 0.02% 7.40% 0.32 Underutilization *
Asian American 0.96% 3.23% 29.64 Underutilization *
Native American 0.01% 0.76% 0.84 Underutilization *
Nonminority Women 0.00% 5.95% 0.00 Underutilization *Non-M/WBE Firms 98.77% 78.48% 125.87 Overutilization
Disparate Impact
of Utilization
Source: MGT developed a vendor and permits database based on city of Richmond commercial construction permits (such as building, electrical) issued between July 2005 and June 2009. 1
The percentage of construction valuation dollars is taken from the subcontractor utilization exhibit shown in Appendix D(b). 2
The percentage of available contractors is taken from the availability exhibit shown in Appendix D(b). 3 The disparity index is the ratio of percent utilization to percent availability times 100.
* An asterisk is used to indicate a substantial level of disparity (index below 80.00).

APPENDIX E:PRIVATE SECTOR COMMERCIAL
CONSTRUCTION ANALYSIS - REED CONSTRUCTION DATA

Page E-1
APPENDIX E
PRIVATE SECTOR COMMERCIAL CONSTRUCTION ANALYSIS REED CONSTRUCTION DATA
E.1 Reed Construction Data – Private Sector Utilization Analysis by Race/ Ethnicity/Gender of Business Ownership for Construction Contractors
This appendix reports findings from the analysis of the utilization of M/WBE and non-M/WBE firms in the Commonwealth of Virginia’s (Commonwealth) private sector commercial construction market based on Reed Construction Data (RCD).
EXHIBIT E-1 COMMONWEALTH OF VIRGINIA
REED CONSTRUCTION DATA (RCD) PRIVATE SECTOR UTILIZATION ANALYSIS OF PRIME CONTRACTORS WITH AND WITHOUT
DOLLARS ASSOCIATED EXCLUDES NOT FOR PROFITS
DOLLARS AND PERCENTAGE OF TOTAL DOLLARS BY RACE/ETHNICITY/GENDER CLASSIFICATION
Fiscal African Hispanic Nonminority M/WBE Non-M/WBE Total
Year American American American Firms Firms Project
Value
$ %1 $ %1 $ %1 $ %1 $ %1 $ %1 $ %1 $
2006 $4,724,727 0.02% $54,353,000 0.26% $7,652,630 0.04% $198,250 0.00% $0 0.00% $66,928,607 0.33% $20,458,728,521 99.67% $20,525,657,128
2007 $1,500,000 0.01% $40,700,000 0.37% $57,500,000 0.53% $0 0.00% $0 0.00% $99,700,000 0.91% $10,827,669,931 99.09% $10,927,369,931
2008 $0 0.00% $323,000 0.00% $11,900,000 0.13% $0 0.00% $31,000,000 0.35% $43,223,000 0.49% $8,867,963,889 99.51% $8,911,186,889
2009 $0 0.00% $532,159 0.02% $0 0.00% $0 0.00% $0 0.00% $532,159 0.02% $2,356,247,104 99.98% $2,356,779,263
Total $6,224,727 0.01% $95,908,159 0.22% $77,052,630 0.18% $198,250 0.00% $31,000,000 0.07% $210,383,766 0.49% $42,510,609,445 99.51% $42,720,993,211
Asian Native
American Women
Source: MGT developed a database which contains RCD for the Commonwealth of Virginia. 1 Percentage of total dollars awarded annually to prime contractors, excluding private commercial not-for-profit construction
projects based on RCD.

Private Sector Commercial Construction Analysis - Reed Construction Data
Page E-2
EXHIBIT E-2 COMMONWEALTH OF VIRGINIA
REED CONSTRUCTION DATA (RCD) PRIVATE SECTOR UTILIZATION ANALYSIS OF PROJECTS WITHOUT DOLLARS ASSOCIATED
NUMBER OF PROJECTS AND UNIQUE CONTRACTORS EXCLUDES NOT FOR PROFITS
NUMBER OF PROJECTS ISSUED
BY RACE/ETHNICITY/GENDER CLASSIFICATION
Fiscal African Hispanic Asian Native Nonminority M/WBE Non-M/WBE Total
Year Americans Americans Americans Americans Firms Firms Projects
# %1 # %1 # %1 # %1 # %1 # %1 # %1 #
2006 6 0.16% 7 0.19% 5 0.13% 1 0.03% 0 0.00% 19 0.51% 3,687 99.49% 3,706
2007 1 0.05% 2 0.09% 2 0.09% 0 0.00% 0 0.00% 5 0.23% 2,206 99.77% 2,211
2008 0 0.00% 1 0.05% 1 0.05% 0 0.00% 1 0.05% 3 0.14% 2,151 99.86% 2,154
2009 0 0.00% 1 0.13% 1 0.13% 0 0.00% 0 0.00% 2 0.26% 770 99.74% 772
Total 7 0.08% 11 0.12% 9 0.10% 1 0.01% 1 0.01% 29 0.33% 8,814 99.67% 8,843
Women
NUMBER OF FIRMS
BY RACE/ETHNICITY/GENDER CLASSIFICATION
Fiscal African Hispanic Asian Native Nonminority M/WBE Non-M/WBE Total
Year Americans Americans Americans Americans Firms Firms Firms
# % # % # % # % # % # % # % #
2006 4 0.22% 3 0.16% 2 0.11% 1 0.00% 0 0.00% 10 0.54% 1,845 99.46% 1,855
2007 1 0.10% 2 0.19% 1 0.10% 0 0.00% 0 0.00% 4 0.38% 1,045 99.62% 1,049
2008 0 0.00% 1 0.09% 2 0.18% 0 0.00% 1 0.09% 4 0.36% 1,109 99.64% 1,113
2009 0 0.00% 1 0.19% 0 0.00% 0 0.00% 0 0.00% 1 0.19% 513 99.81% 514
Total
Unique Firms25 0.16% 6 0.19% 3 0.10% 1 0.03% 1 0.03% 16 0.51% 3,100 99.49% 3,116
Women
Source: MGT developed a database which contains RCD for the Commonwealth of Virginia. 1 Percentage of total commerical construction projects based on RCD.
2 The Total Individual Firms counts a vendor only once for each year the firm receives work. Since a firm could be used in multiple
years, the Total Individual Firms for the entire study period may not equal the sum of all years.

Private Sector Commercial Construction Analysis - Reed Construction Data
Page E-3
E.2 Private Sector Availability Analysis by Race/Ethnicity/Gender of Business Ownership for Construction Contractors
Exhibit E-3 reports findings based on U.S. Census SBO data for the population of available contractors in the Commonwealth by racial/ethnic/gender category. The availability for construction was derived from those firms that have construction or construction-related services based on NAICS Code 23.1
E.2.1 Construction Prime Availability
EXHIBIT E-3 COMMONWEALTH OF VIRGINIA
CONSTRUCTION CENSUS VENDORS NAICS 23 – CONSTRUCTION AVAILABILITY OF CONTRACTORS
TOTAL NUMBER OF FIRMS – BASED ON PAID EMPLOYEES ONLY
African Hispanic Asian Native Nonminority M/WBE Non-M/WBE Total
Americans1 Americans1 Americans1 Americans1 Firms Firms2 Firms3
# % # % # % # % # % # % # %
Total 581 3.10% 451 2.40% 286 1.53% 85 0.45% 1,440 7.68% 2,843 15.16% 15,910 84.84% 18,753
Women
Source: U.S. Census Bureau 2002, SBO, based on firms with paid employees only. 1
Minority woman-owned firms are included in their respective minority classifications. 2
Number of non-M/WBE firms derived by subtracting all M/WBE firms from total firms. 3 Total firms derived from the U.S. Census Bureau, SBO.
E.3 Analysis of Disparities in Private Sector Utilization by Race/Ethnicity/ Gender of Business Ownership for Construction Prime Contractors and Subcontractors
Once the record of vendor utilization was calculated from permit data for each racial, ethnic, and gender categories, it could be compared to the Commonwealth market area vendor availability in these categories to derive an index of disparity in private sector utilization for a given M/WBE prime contractor category. Egregious disparity between M/WBE and non-M/WBE utilization is apparent, even without formal statistical analysis. Reed Construction Data Commercial Projects-Prime Contracts
This section reports disparity indices for private commercial RCD based on census availability of firms within the racial, ethnic, and gender categories for firms with paid employees only.
1 NAICS Code 23 includes subsector 236, construction of buildings, comprises establishments of the
general contractor type and operative builders involved in the construction of buildings.; subsector 237, heavy and civil engineering construction, comprises establishments involved in the construction of engineering projects; and subsector 238, specialty trade contractors, comprises establishments engaged in specialty trade activities generally needed in the construction of all types of buildings.

Private Sector Commercial Construction Analysis - Reed Construction Data
Page E-4
EXHIBIT E-4 COMMONWEALTH OF VIRGINIA
DISPARITY ANALYSIS OF PRIVATE SECTOR PRIME CONTRACTORS EXCLUDES NOT FOR PROFITS
BASED ON RCD AND U.S. CENSUS JULY 1, 2005, THROUGH JUNE 30, 2009
Business Owner % of % of Available Disparity
Classification Dollars1 Firms2 Index3
Fiscal Year 2006
African American 0.02% 3.10% 0.74 Underutilization *
Hispanic American 0.26% 2.40% 11.01 Underutilization *
Asian American 0.04% 1.53% 2.44 Underutilization *
Native American 0.00% 0.45% 0.21 Underutilization *
Nonminority Women 0.00% 7.68% 0.00 Underutilization *Non-M/WBE Firms 99.67% 84.84% 117.48 Overutilization
Fiscal Year 2007
African American 0.01% 3.10% 0.44 Underutilization *
Hispanic American 0.37% 2.40% 15.49 Underutilization *
Asian American 0.53% 1.53% 34.50 Underutilization *
Native American 0.00% 0.45% 0.00 Underutilization *
Nonminority Women 0.00% 7.68% 0.00 Underutilization *
Non-M/WBE Firms 99.09% 84.84% 116.79 Overutilization
Fiscal Year 2008
African American 0.00% 3.10% 0.00 Underutilization *
Hispanic American 0.00% 2.40% 0.15 Underutilization *
Asian American 0.13% 1.53% 8.76 Underutilization *
Native American 0.00% 0.45% 0.00 Underutilization *
Nonminority Women 0.35% 7.68% 4.53 Underutilization *Non-M/WBE Firms 99.51% 84.84% 117.30 Overutilization
Fiscal Year 2009
African American 0.00% 3.10% 0.00 Underutilization *
Hispanic American 0.02% 2.40% 0.94 Underutilization *
Asian American 0.00% 1.53% 0.00 Underutilization *
Native American 0.00% 0.45% 0.00 Underutilization *
Nonminority Women 0.00% 7.68% 0.00 Underutilization *
Non-M/WBE Firms 99.98% 84.84% 117.84 Overutilization
All Fiscal Years
African American 0.01% 3.10% 0.47 Underutilization *
Hispanic American 0.22% 2.40% 9.33 Underutilization *
Asian American 0.18% 1.53% 11.83 Underutilization *
Native American 0.00% 0.45% 0.10 Underutilization *
Nonminority Women 0.07% 7.68% 0.94 Underutilization *Non-M/WBE Firms 99.51% 84.84% 117.29 Overutilization
Disparate Impact
of Utilization
Source: MGT developed an RCD and vendor database for the Commonwealth of Virginia covering the period between 2005 and 2009. 1 The percentage of construction valuation dollars is taken from the prime utilization exhibit shown in
Chapter 6.0. 2 The percentage of available contractors is taken from the availability exhibit shown in Chapter 6.0.
3 The disparity index is the ratio of percent utilization to percent availability times 100.
* An asterisk is used to indicate a substantial level of disparity (index below 80.00).

APPENDIX F:PRIVATE SECTOR DISCUSSION

Page F-1
APPENDIX F
PRIVATE SECTOR DISCUSSION
Based on the U.S. Bureau of Census, 2002 Survey of Business Owners (SBO) there remains a significant gap between the market share of minority- and women-owned business enterprises (M/WBEs) and their share of the Commonwealth of Virginia (Commonwealth) market area business population.
For all construction firms the results are shown in Exhibit F-1 below, there were 21,464 construction firms in the Commonwealth market area in 2002, of which 6.5 percent were owned minority -owned firms and 6.7 percent by nonminority women-owned firms. Minorities’ share of market revenue was 47.2 percent. Minorities averaged $752,754 per firm. Exhibit F-1 also shows
African American-owned firms were 2.7 percent of firms, 0.9 percent of sales, with $518,792 in average revenue per firm, and 32.6 percent of the market place average.
Hispanic-owned firms were 2.1 percent of firms, 1.4 percent of sales, with $1,065,809 in average revenue per firm, and 66.9 percent of the market place average.
Asian American-owned firms were 1.3 percent of firms, 0.6 percent of sales, with $719,713 in average revenue per firm, and 45.2 percent of the market place average.
Native American-owned firms were 0.4 percent of firms, 0.2 percent of sales, with $797,824 in average revenue per firm, and 50.1 percent of the market place average.
Complete data on nonminority women-owned firms was not available.

Private Sector Discussion
Page F-2
EXHIBIT F-1 U.S. BUREAU CENSUS 2002
SURVEY OF BUSINESS OWNERS CENSUS MEASURE OF AVAILABILITY AND UTILIZATION IN THE COMMONWEALTH OF VIRGINIA MARKET PLACE
ALL CONSTRUCTION FIRMS
# Firms Sales Sales Per Firm
All Firms 21,464 34,202,380,000$ 1,593,477$
African American 581 301,418,000$ 518,792$
Hispanic American 451 480,680,000$ 1,065,809$
Asian American 275 197,921,000$ 719,713$
Native American 85 67,815,000$ 797,824$
Minority Firms 1,392 1,047,834,000$ 752,754$
Nonminority Women 1,440 N/A N/A
Firms Sales
Sales Per Firm
Compared to the
Market Average
African American 2.7% 0.9% 32.6%
Hispanic American 2.1% 1.4% 66.9%
Asian American 1.3% 0.6% 45.2%
Native American 0.4% 0.2% 50.1%
Minority Firms 6.5% 3.1% 47.2%
Nonminority Women 6.7% N/A N/A
(ratio of sales to firms)
African American 32.6
Hispanic American 66.9
Asian American 45.2
Native American 50.1
Nonminority Women N/A
Percentage of Marketplace
Disparity Index
Source: U.S. Bureau of the Census 2002, Survey of Business Owners, Based On All Firms Specializing in Construction.
Exhibit F-2 below shows that based on all firms there were 21,250 businesses specializing in professional services in the Commonwealth market area in 2002, of which 11.8 percent were owned by minorities and 19.5 percent by nonminority women-owned firms. Minorities’ share of market revenue was 77.4 percent. Minorities averaged $1,513,857 per firm. Exhibit F-2 also shows that the following,
African American-owned firms were 2.9 percent of firms, 2.3 percent of sales, with $1,565,777 in average revenue per firm, and 80.1 percent of the market place average.
Asian American-owned firms were 6.4 percent of firms, 5.0 percent of sales, with $1,527,247 in average revenue per firm, and 78.1 percent of the market place average.

Private Sector Discussion
Page F-3
Hispanic American-owned firms were 1.9 percent of firms, 1.6 percent of sales, with $1,617,882 in average revenue per firm, and 82.7 percent of the market place average.
Nonminority women-owned firms were 19.5 percent of firms, 4.5 percent of sales, with $452,873 in average revenue per firm, and 23.2 percent of the market place average.
Native American-owned firms were 0.5 percent of firms, 0.2 percent of sales, with $706,617 in average revenue per firm, and 36.1 percent of the market place average.

Private Sector Discussion
Page F-4
EXHIBIT F-2 U.S. BUREAU CENSUS 2002
SURVEY OF BUSINESS OWNERS CENSUS MEASURE OF AVAILABILITY AND UTILIZATION IN THE COMMONWEALTH OF VIRGINIA MARKET PLACE
ALL PROFESSIONAL SERVICES FIRMS
# Firms Sales Sales Per Firm
All Firms 21,250 41,557,130,000$ 1,955,630$
African American 618 967,650,000$ 1,565,777$
Hispanic American 408 660,096,000$ 1,617,882$
Asian American 1,367 2,087,747,000$ 1,527,247$
Native American 115 81,261,000$ 706,617$
Minority Firms 2,508 3,796,754,000$ 1,513,857$
Nonminority Women 4,146 1,877,611,000$ 452,873$
Firms Sales
Sales Per Firm
Compared to the
Market Average
African American 2.9% 2.3% 80.1%
Hispanic American 1.9% 1.6% 82.7%
Asian American 6.4% 5.0% 78.1%
Native American 0.5% 0.2% 36.1%
Minority Firms 11.8% 9.1% 77.4%
Nonminority Women 19.5% 4.5% 23.2%
(ratio of sales to firms)
African American 80.1
Hispanic American 82.7
Asian American 78.1
Native American 36.1
Nonminority Women 23.2
Percentage of Marketplace
Disparity Index
Source: U.S. Bureau of the Census 2002, Survey Of Business Owners, Based On All Firms Specializing in Professional Services.
Exhibit F-3 below shows that based on all firms there were 10,344 businesses specializing in other services in the Commonwealth market area in 2002, of which 15.3 percent were owned by minorities and 18.1 percent by nonminority women-owned firms. Minorities’ share of market revenue was 47.6 percent. Minorities averaged $241,466 per firm. Exhibit F-3 also shows that the following,
African American-owned firms were 4.7 percent of firms, 2.3 percent of sales, with $249,877 in average revenue per firm, and 49.2 percent of the market place average.
Hispanic American-owned firms were 1.9 percent of firms, 0.8 percent of sales, with $228,328 in average revenue per firm, and 45.0 percent of the market place average.

Private Sector Discussion
Page F-5
Asian American-owned firms were 8.7 percent of firms, 4.1 percent of sales, with $239,704 in average revenue per firm, and 47.2 percent of the market place average.
Nonminority women-owned firms were 18.1 percent of firms, 11.8 percent of sales, with $329,212 in average revenue per firm, 64.8 percent of the market place average.
The data was incomplete for Native American-owned firms.
EXHIBIT F-3 U.S. BUREAU CENSUS 2002
SURVEY OF BUSINESS OWNERS CENSUS MEASURE OF AVAILABILITY AND UTILIZATION IN THE COMMONWEALTH OF VIRGINIA MARKET PLACE
ALL OTHER SERVICES FIRMS
# Firms Sales Sales Per Firm
All Firms 10,344 5,252,659,000$ 507,798$
African American 489 122,190,000$ 249,877$
Hispanic American 192 43,839,000$ 228,328$
Asian American 903 216,453,000$ 239,704$
Native American N/A N/A N/A
Minority Firms 1,584 382,482,000$ 241,466$
Nonminority Women 1,876 617,601,000$ 329,212$
Firms Sales
Sales Per Firm
Compared to the
Market Average
African American 4.7% 2.3% 49.2%
Hispanic American 1.9% 0.8% 45.0%
Asian American 8.7% 4.1% 47.2%
Native American N/A N/A N/A
Minority Firms 15.3% 7.3% 47.6%
Nonminority Women 18.1% 11.8% 64.8%
(ratio of sales to firms)
African American 49.2
Hispanic American 45.0
Asian American 47.2
Native American N/A
Nonminority Women 64.8
Percentage of Marketplace
Disparity Index
Source: U.S. Bureau of the Census 2002, Survey Of Business Owners, Based On All Firms Specializing in Other Services
All groups exhibited disparity to substantial disparity in the marketplace where data was available. Disparity indices for the overall market place are presented at the bottom of Exhibits F-1, F-2, and F-3.
APPENDIX G:CUSTOM CENSUS SURVEY
INSTRUMENT

Page G-1
APPENDIX G
CUSTOM CENSUS SURVEY INSTRUMENT
MGT Commonwealth of Virginia Construction Contractors Survey Instrument Hello. My name is ______ and I am calling from ________________ on behalf of the Commonwealth of Virginia (Commonwealth or State). We are conducting a very brief survey of 10 questions to determine the availability of construction contracting in the Commonwealth of Virginia. Is this ___________________ (Company's name)? IF YES, CONTINUE Have I reached (VERIFY TELEPHONE NUMBER)? __________? IF YES, CONTINUE; IF NO, TERMINATE May I speak with the owner please? IF OWNER IS PUT ON THE LINE: CONTINUE WITH INTRODUCTION IF TRANSFERRED TO ANOTHER PARTY (CEO, MANAGER, ETC):
Are you able to answer questions concerning ownership? IF YES, CONTINUE
IF NO, SCHEDULE A CALL BACK WHEN THE OWNER OR CEO MAY BE AVAILABLE AND LEAVE TELEPHONE NUMBER. IF NOBODY IS AVAILABLE TO ANSWER QUESTIONS: SCHEDULE CALL BACK DATE AND TIME: _______________________________________ We have been asked by the Commonwealth of Virginia to contact area construction contracting businesses to get their opinions about the business climate in Virginia. Your company's name and phone number has been provided to us from Dun & Bradstreet. The purpose of the survey is to help the state learn more about statewide construction businesses. Your opinions are important to us, and all of your responses will be kept confidential. This call may be monitored to evaluate my performance. Q.1 What is your title? [REQUIRE ANSWER] (5)
Owner/CEO/President 1 Manager/Financial Officer 2 Other 3

Custom Census Survey Instrument
Page G-2
[A - IF THE ANSWER TO QUESTION 1 IS NOT 3, THEN SKIP TO QUESTION 3] Q.2 POSITION TITLE: [REQUIRE ANSWER] _______________________________________ (6-35) [A - IF THE ANSWER TO QUESTION 1 IS NOT 3, THEN SKIP TO QUESTION 4] Q.3 May I have your name or initials just in case we have any further questions? [REQUIRE ANSWER] _______________________________________ (36-65) Q.4 Let me confirm that, based on information we have from Dun & Bradstreet, this is a
for-profit construction business? [REQUIRE ANSWER] (66)
Yes 1 No 2 DK/NA 3
[S - IF THE ANSWER TO QUESTION 4 IS NOT 1, THEN SKIP TO QUESTION 14] Q.5 Can you confirm that your company does the following type of work:
READ FIELD FROM TOP OF SCREEN
[REQUIRE ANSWER] (67)
Yes 1 No 2 DK/NA 3
[A - IF THE ANSWER TO QUESTION 5 IS 1, THEN SKIP TO QUESTION 7] Q.6 How would you classify the type of work that your company does? [REQUIRE ANSWER] _______________________________________ (106-135)
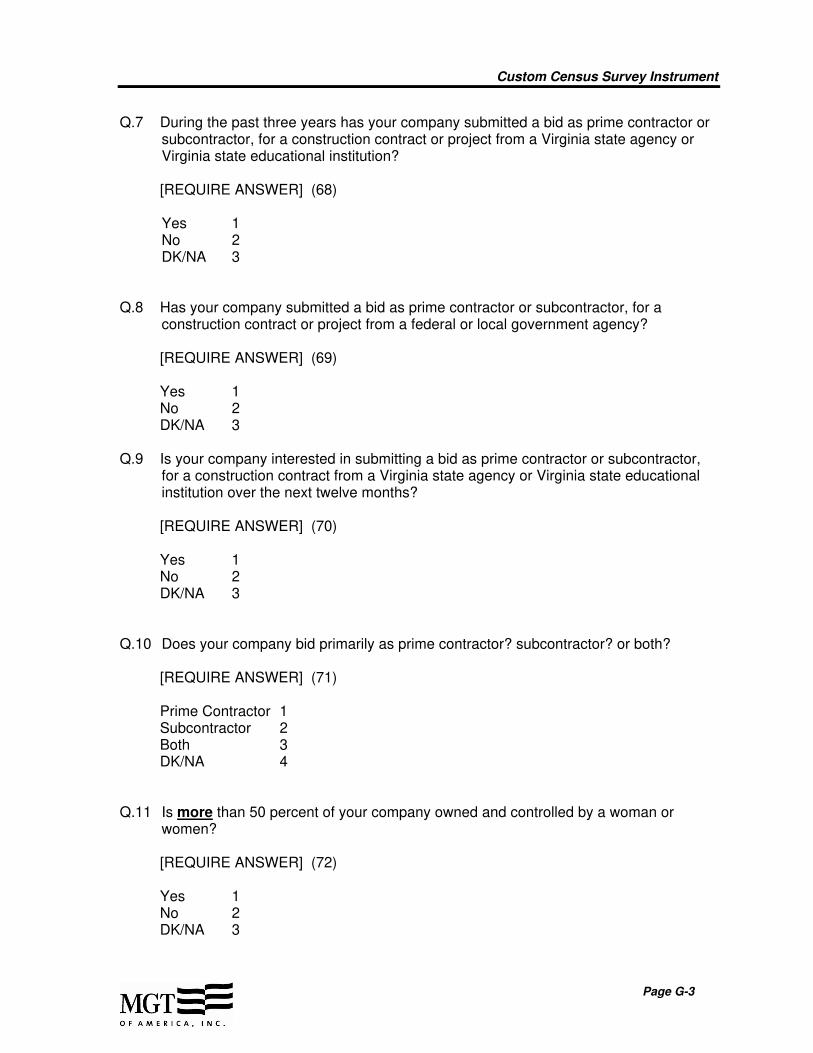
Custom Census Survey Instrument
Page G-3
Q.7 During the past three years has your company submitted a bid as prime contractor or subcontractor, for a construction contract or project from a Virginia state agency or Virginia state educational institution?
[REQUIRE ANSWER] (68)
Yes 1 No 2 DK/NA 3
Q.8 Has your company submitted a bid as prime contractor or subcontractor, for a
construction contract or project from a federal or local government agency? [REQUIRE ANSWER] (69) Yes 1 No 2 DK/NA 3 Q.9 Is your company interested in submitting a bid as prime contractor or subcontractor,
for a construction contract from a Virginia state agency or Virginia state educational institution over the next twelve months?
[REQUIRE ANSWER] (70) Yes 1 No 2 DK/NA 3 Q.10 Does your company bid primarily as prime contractor? subcontractor? or both? [REQUIRE ANSWER] (71) Prime Contractor 1 Subcontractor 2 Both 3 DK/NA 4 Q.11 Is more than 50 percent of your company owned and controlled by a woman or
women? [REQUIRE ANSWER] (72) Yes 1 No 2 DK/NA 3

Custom Census Survey Instrument
Page G-4
Q.12 Is more than 50 percent of your company owned and controlled by someone of any of the following ethnic or racial origin: READ CHOICES, CHOOSE ONE
[REQUIRE ANSWER] (73) Anglo/Caucasian 1 African American 2 Asian or Pacific Islander 3 Hispanic American 4 Native American/Alaskan Native 5 Other 6 DK/NA 7 [A - IF THE ANSWER TO QUESTION 12 IS NOT 6, THEN SKIP TO QUESTION 14] Q.13 In what other way would you specify the ethnic or racial origin for the person or
people that own or control more than 50 percent of your company? [REQUIRE ANSWER] _________________________________________ (74-103) Q.14 That completes our interview. Thank you for your participation and have a nice day!
Interviewer ID#: [REQUIRE ANSWER] _____________________________ (104-105)

APPENDIX H:U.S. CENSUS SURVEY OF
BUSINESS OWNERS CONSTRUCTION SERVICES,
CONSTRUCTION RELATED SERVICES, AND ARCHITECTURE AND ENGINEERING SERVICES -
SPECIAL TABULATIONS
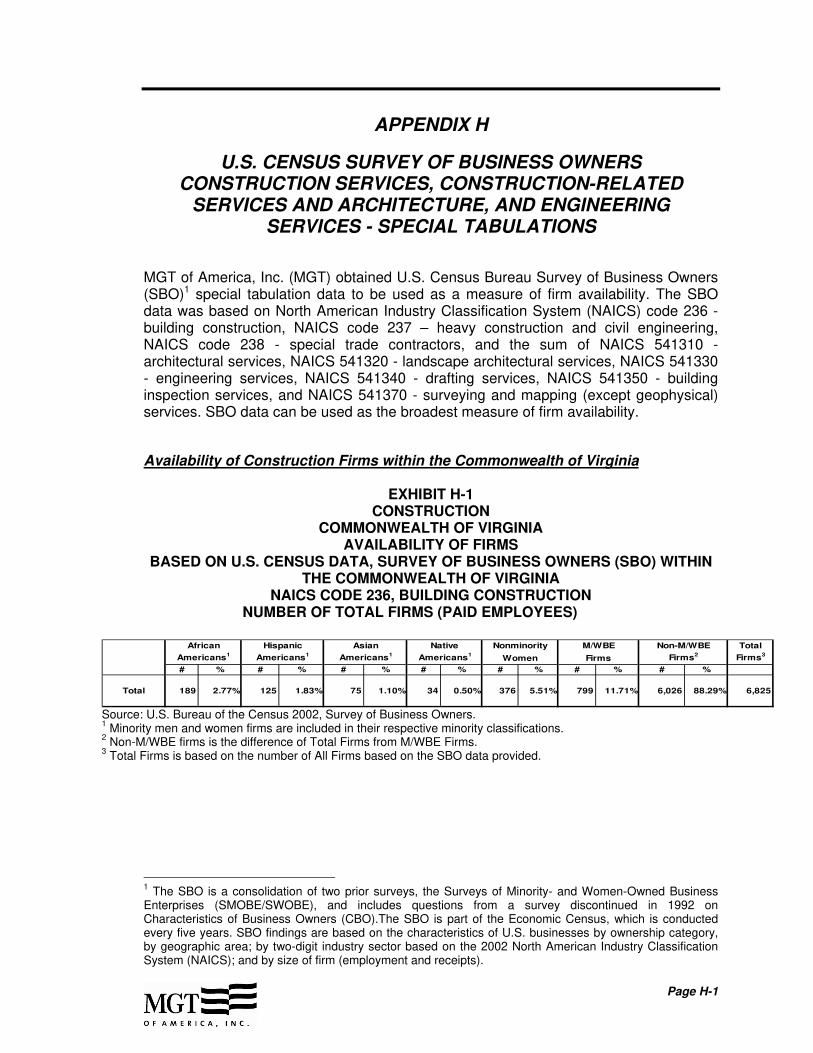
Page H-1
APPENDIX H
U.S. CENSUS SURVEY OF BUSINESS OWNERS CONSTRUCTION SERVICES, CONSTRUCTION-RELATED
SERVICES AND ARCHITECTURE, AND ENGINEERING SERVICES - SPECIAL TABULATIONS
MGT of America, Inc. (MGT) obtained U.S. Census Bureau Survey of Business Owners (SBO)1 special tabulation data to be used as a measure of firm availability. The SBO data was based on North American Industry Classification System (NAICS) code 236 - building construction, NAICS code 237 – heavy construction and civil engineering, NAICS code 238 - special trade contractors, and the sum of NAICS 541310 - architectural services, NAICS 541320 - landscape architectural services, NAICS 541330 - engineering services, NAICS 541340 - drafting services, NAICS 541350 - building inspection services, and NAICS 541370 - surveying and mapping (except geophysical) services. SBO data can be used as the broadest measure of firm availability.
Availability of Construction Firms within the Commonwealth of Virginia
EXHIBIT H-1 CONSTRUCTION
COMMONWEALTH OF VIRGINIA AVAILABILITY OF FIRMS
BASED ON U.S. CENSUS DATA, SURVEY OF BUSINESS OWNERS (SBO) WITHIN THE COMMONWEALTH OF VIRGINIA
NAICS CODE 236, BUILDING CONSTRUCTION NUMBER OF TOTAL FIRMS (PAID EMPLOYEES)
African Hispanic Asian Native Nonminority M/WBE Non-M/WBE Total
Americans1 Americans1 Americans1 Americans1Women Firms Firms2 Firms3
# % # % # % # % # % # % # %
Total 189 2.77% 125 1.83% 75 1.10% 34 0.50% 376 5.51% 799 11.71% 6,026 88.29% 6,825
Source: U.S. Bureau of the Census 2002, Survey of Business Owners. 1 Minority men and women firms are included in their respective minority classifications.
2 Non-M/WBE firms is the difference of Total Firms from M/WBE Firms.
3 Total Firms is based on the number of All Firms based on the SBO data provided.
1 The SBO is a consolidation of two prior surveys, the Surveys of Minority- and Women-Owned Business
Enterprises (SMOBE/SWOBE), and includes questions from a survey discontinued in 1992 on Characteristics of Business Owners (CBO).The SBO is part of the Economic Census, which is conducted every five years. SBO findings are based on the characteristics of U.S. businesses by ownership category, by geographic area; by two-digit industry sector based on the 2002 North American Industry Classification System (NAICS); and by size of firm (employment and receipts).

U.S. Census, Survey of Business Owners - Special Tabulations
Page H-2
EXHIBIT H-2 CONSTRUCTION
COMMONWEALTH OF VIRGINIA AVAILABILITY OF FIRMS
BASED ON U.S. CENSUS DATA, SURVEY OF BUSINESS OWNERS (SBO) WITHIN THE COMMONWEALTH OF VIRGINIA
NAICS CODE 236, BUILDING CONSTRUCTION NUMBER OF TOTAL FIRMS (PAID AND WITHOUT PAID EMPLOYEES)
African Hispanic Asian Native Nonminority M/WBE Non-M/WBE Total
Americans1 Americans1 Americans1 Americans1 Women Firms Firms2 Firms3
# % # % # % # % # % # % # %
Total 554 3.37% 632 3.85% 267 1.63% 134 0.82% 672 4.09% 2,259 13.76% 14,156 86.24% 16,415
Source: U.S. Bureau of the Census 2002, Survey of Business Owners. 1 Minority men and women firms are included in their respective minority classifications.
2 Non-M/WBE firms is the difference of Total Firms from M/WBE Firms.
3 Total Firms is based on the number of All Firms based on the SBO data provided.
EXHIBIT H-3 CONSTRUCTION
COMMONWEALTH OF VIRGINIA AVAILABILITY OF FIRMS
BASED ON U.S. CENSUS DATA, SURVEY OF BUSINESS OWNERS (SBO) WITHIN THE COMMONWEALTH OF VIRGINIA
NAICS CODE 237, HEAVY CONSTRUCTION AND CIVIL ENGINEERING NUMBER OF TOTAL FIRMS (PAID EMPLOYEES)
African Hispanic Asian Native Nonminority M/WBE Non-M/WBE Total
Americans1 Americans1 Americans1 Americans1 Women Firms Firms2 Firms3
# % # % # % # % # % # % # %
Total 39 2.59% 7 0.46% 8 0.53% 0 0.00% 136 9.02% 190 12.61% 1,317 87.39% 1,507
Source: U.S. Bureau of the Census 2002, Survey of Business Owners. 1 Minority men and women firms are included in their respective minority classifications.
2 Non-M/WBE firms is the difference of Total Firms from M/WBE Firms.
3 Total Firms is based on the number of All Firms based on the SBO data provided.
EXHIBIT H-4
CONSTRUCTION COMMONWEALTH OF VIRGINIA
AVAILABILITY OF FIRMS BASED ON U.S. CENSUS DATA, SURVEY OF BUSINESS OWNERS (SBO) WITHIN
THE COMMONWEALTH OF VIRGINIA NAICS CODE 237, HEAVY CONSTRUCTION AND CIVIL ENGINEERING
NUMBER OF TOTAL FIRMS (PAID AND WITHOUT PAID EMPLOYEES)
African Hispanic Asian Native Nonminority M/WBE Non-M/WBE Total
Americans1 Americans1 Americans1 Americans1Women Firms Firms2 Firms3
# % # % # % # % # % # % # %
Total 96 3.14% 195 6.37% 20 0.65% 1 0.03% 182 5.95% 494 16.15% 2,565 83.85% 3,059
Source: U.S. Bureau of the Census 2002, Survey of Business Owners. 1 Minority men and women firms are included in their respective minority classifications.
2 Non-M/WBE firms is the difference of Total Firms from M/WBE Firms.
3 Total Firms is based on the number of All Firms based on the SBO data provided.
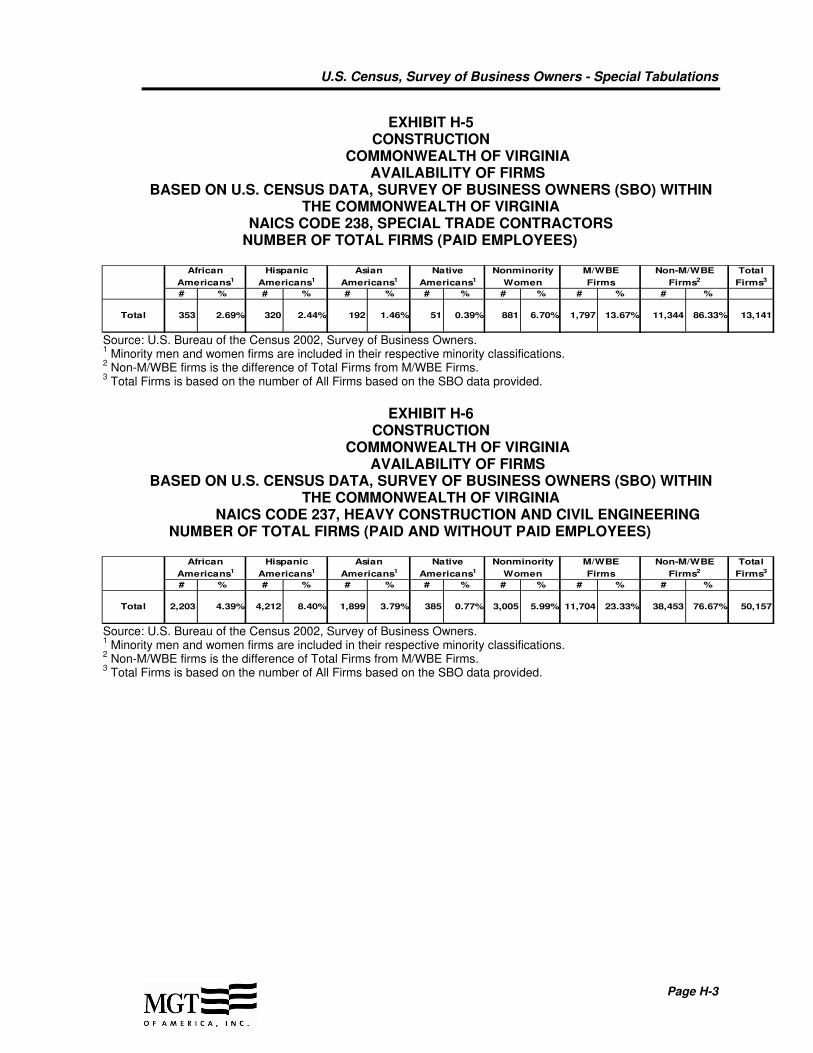
U.S. Census, Survey of Business Owners - Special Tabulations
Page H-3
EXHIBIT H-5 CONSTRUCTION
COMMONWEALTH OF VIRGINIA AVAILABILITY OF FIRMS
BASED ON U.S. CENSUS DATA, SURVEY OF BUSINESS OWNERS (SBO) WITHIN THE COMMONWEALTH OF VIRGINIA
NAICS CODE 238, SPECIAL TRADE CONTRACTORS NUMBER OF TOTAL FIRMS (PAID EMPLOYEES)
African Hispanic Asian Native Nonminority M/WBE Non-M/WBE Total
Americans1 Americans1 Americans1 Americans1 Women Firms Firms2 Firms3
# % # % # % # % # % # % # %
Total 353 2.69% 320 2.44% 192 1.46% 51 0.39% 881 6.70% 1,797 13.67% 11,344 86.33% 13,141
Source: U.S. Bureau of the Census 2002, Survey of Business Owners. 1 Minority men and women firms are included in their respective minority classifications.
2 Non-M/WBE firms is the difference of Total Firms from M/WBE Firms.
3 Total Firms is based on the number of All Firms based on the SBO data provided.
EXHIBIT H-6
CONSTRUCTION COMMONWEALTH OF VIRGINIA
AVAILABILITY OF FIRMS BASED ON U.S. CENSUS DATA, SURVEY OF BUSINESS OWNERS (SBO) WITHIN
THE COMMONWEALTH OF VIRGINIA NAICS CODE 237, HEAVY CONSTRUCTION AND CIVIL ENGINEERING
NUMBER OF TOTAL FIRMS (PAID AND WITHOUT PAID EMPLOYEES)
African Hispanic Asian Native Nonminority M/WBE Non-M/WBE Total
Americans1 Americans1 Americans1 Americans1 Women Firms Firms2 Firms3
# % # % # % # % # % # % # %
Total 2,203 4.39% 4,212 8.40% 1,899 3.79% 385 0.77% 3,005 5.99% 11,704 23.33% 38,453 76.67% 50,157
Source: U.S. Bureau of the Census 2002, Survey of Business Owners. 1 Minority men and women firms are included in their respective minority classifications.
2 Non-M/WBE firms is the difference of Total Firms from M/WBE Firms.
3 Total Firms is based on the number of All Firms based on the SBO data provided.

U.S. Census, Survey of Business Owners - Special Tabulations
Page H-4
Availability of Architecture and Engineering Firms within the Commonwealth of Virginia
EXHIBIT H-7
ARCHITECTURE AND ENGINEERING COMMONWEALTH OF VIRGINIA
AVAILABILITY OF FIRMS BASED ON U.S. CENSUS DATA, SURVEY OF BUSINESS OWNERS (SBO) WITHIN
THE COMMONWEALTH OF VIRGINIA THE SUM OF: NAICS 541310 - ARCHITECTURAL SERVICES, NAICS 541320 - LANDSCAPE ARCHITECTURAL SERVICES, NAICS 541330 - ENGINEERING
SERVICES, NAICS 541340 - DRAFTING SERVICES, NAICS 541350 - BUILDING INSPECTION SERVICES, NAICS 541370 - SURVEYING AND MAPPING (EXCEPT
GEOPHYSICAL) SERVICES NUMBER OF TOTAL FIRMS (PAID EMPLOYEES)
African Hispanic Asian Native Nonminority M/WBE Non-M/WBE Total
Americans1 Americans1 Americans1 Americans1 Women Firms Firms2 Firms3
# % # % # % # % # % # % # %
Total 76 2.77% 60 2.19% 108 3.93% 29 1.06% 262 9.54% 535 19.49% 2,210 80.51% 2,745
Source: U.S. Bureau of the Census 2002, Survey of Business Owners. 1 Minority men and women firms are included in their respective minority classifications.
2 Non-M/WBE firms is the difference of Total Firms from M/WBE Firms.
3 Total Firms is based on the number of All Firms based on the SBO data provided.
EXHIBIT H-8
ARCHITECTURE AND ENGINEERING COMMONWEALTH OF VIRGINIA
AVAILABILITY OF FIRMS BASED ON U.S. CENSUS DATA, SURVEY OF BUSINESS OWNERS (SBO) WITHIN
THE COMMONWEALTH OF VIRGINIA THE SUM OF: NAICS 541310 - ARCHITECTURAL SERVICES, NAICS 541320 - LANDSCAPE ARCHITECTURAL SERVICES, NAICS 541330 - ENGINEERING
SERVICES, NAICS 541340 - DRAFTING SERVICES, NAICS 541350 - BUILDING INSPECTION SERVICES, NAICS 541370 - SURVEYING AND MAPPING (EXCEPT
GEOPHYSICAL) SERVICES NUMBER OF TOTAL FIRMS (PAID AND WITHOUT PAID EMPLOYEES)
African Hispanic Asian Native Nonminority M/WBE Non-M/WBE Total
Americans1 Americans1 Americans1 Americans1 Women Firms Firms2 Firms3
# % # % # % # % # % # % # %
Total 320 4.42% 179 2.47% 366 5.05% 69 0.95% 833 11.50% 1,767 24.39% 5,479 75.61% 7,246
Source: U.S. Bureau of the Census 2002, Survey of Business Owners. 1 Minority men and women firms are included in their respective minority classifications.
2 Non-M/WBE firms is the difference of Total Firms from M/WBE Firms.
3 Total Firms is based on the number of All Firms based on the SBO data provided.

APPENDIX I:U.S. CENSUS SURVEY OF
BUSINESS OWNERS

Page I-1
APPENDIX I
U.S. CENSUS SURVEY OF BUSINESS OWNERS
MGT of America, Inc. (MGT) obtained U.S. Census Bureau Survey of Business Owners (SBO)1 data to be used as a measure of firm availability in the private sector. The SBO data was based on North American Industry Classification System (NAICS) code 23, classified as construction and construction-related services; NAICS code 54, classified as professional services; NAICS codes 56 and 81, classified as other services; and NAICS codes 44 to 45 and 42, goods and supplies. SBO data can be used as the broadest measure of firm availability. Please refer to Chapter 4.0 for number of total firms based on firms with paid employees only for NAICS codes 23 and 54.
Availability of Construction Firms within the Commonwealth of Virginia
EXHIBIT I-1 CONSTRUCTION
COMMONWEALTH OF VIRGINIA AVAILABILITY OF FIRMS
BASED ON U.S. CENSUS DATA, SURVEY OF BUSINESS OWNERS (SBO) WITHIN THE COMMONWEALTH OF VIRGINIA
NAICS CODE 23, CONSTRUCTION NUMBER OF TOTAL FIRMS (PAID AND WITHOUT PAID EMPLOYEES)
African Hispanic Asian Native Nonminority M/WBE Non-M/WBE Total
Americans1 Americans1 Americans1 Americans1Women Firms Firms2 Firms3
# % # % # % # % # % # % # %
Total 2,853 4.19% 5,039 7.40% 2,198 3.23% 520 0.76% 4,052 5.95% 14,662 21.52% 53,457 78.48% 68,119
Source: U.S. Bureau of the Census 2002, Survey of Business Owners. 1 Minority men and women firms are included in their respective minority classifications.
2 Non-M/WBE firms is the difference of Total Firms from M/WBE Firms.
3 Total Firms is based on the number of All Firms based on the SBO data provided.
1 The SBO is a consolidation of two prior surveys, the Surveys of Minority- and Women-Owned Business
Enterprises (SMOBE/SWOBE), and includes questions from a survey discontinued in 1992 on Characteristics of Business Owners (CBO).The SBO is part of the Economic Census, which is conducted every five years. SBO findings are based on the characteristics of U.S. businesses by ownership category, by geographic area; by two-digit industry sector based on the 2002 North American Industry Classification System (NAICS); and by size of firm (employment and receipts).

U.S. Census Survey of Business Owners
Page I-2
Availability of Professional Services Firms within the Commonwealth of Virginia
EXHIBIT I-2 PROFESSIONAL SERVICES
COMMONWEALTH OF VIRGINIA AVAILABILITY OF FIRMS
BASED ON U.S. CENSUS DATA, SURVEY OF BUSINESS OWNERS (SBO) WITHIN THE COMMONWEALTH OF VIRGINIA
NAICS CODES 54, PROFESSIONAL SERVICES NUMBER OF TOTAL FIRMS (PAID AND WITHOUT PAID EMPLOYEES)
African Hispanic Asian Native Nonminority M/WBE Non-M/WBE Total
Americans1 Americans1 Americans1 Americans1Women Firms Firms2 Firms3
# % # % # % # % # % # % # %
Total 4,135 5.06% 2,027 2.48% 4,861 5.95% S 0.00% 23,261 28.48% 34,284 41.97% 47,401 58.03% 81,685
Source: U.S. Bureau of the Census 2002, Survey of Business Owners. 1 Minority men and women firms are included in their respective minority classifications.
2 Non-M/WBE firms is the difference of Total Firms from M/WBE Firms.
3 Total Firms is based on the number of All Firms based on the SBO data provided.
S denotes that findings were withheld because estimates did not meet U.S. Census publication standards.
Availability of Other Services Firms within the Commonwealth of Virginia
EXHIBIT I-3
OTHER SERVICES COMMONWEALTH OF VIRGINIA
AVAILABILITY OF FIRMS BASED ON U.S. CENSUS DATA, SURVEY OF BUSINESS OWNERS (SBO) WITHIN
THE COMMONWEALTH OF VIRGINIA NAICS CODES 56 AND 81, OTHER SERVICES
NUMBER OF TOTAL FIRMS (PAID AND WITHOUT PAID EMPLOYEES)
African Hispanic Asian Native Nonminority M/WBE Non-M/WBE Total
Americans1 Americans1 Americans1 Americans1Women Firms Firms2 Firms3
# % # % # % # % # % # % # %
Total 12,329 13.46% 5,214 5.69% 7,906 8.63% 527 0.58% 28,430 31.03% 54,406 59.39% 37,207 40.61% 91,613
Source: U.S. Bureau of the Census 2002, Survey of Business Owners. 1 Minority men and women firms are included in their respective minority classifications.
2 Non-M/WBE firms is the difference of Total Firms from M/WBE Firms.
3 Total Firms is based on the number of All Firms based on the SBO data provided.

U.S. Census Survey of Business Owners
Page I-3
Availability of Goods & Supplies Firms within the Commonwealth of Virginia
EXHIBIT I-4 GOODS & SUPPLIES
COMMONWEALTH OF VIRGINIA AVAILABILITY OF FIRMS
BASED ON U.S. CENSUS DATA, SURVEY OF BUSINESS OWNERS (SBO) WITHIN THE COMMONWEALTH OF VIRGINIA
NAICS CODES 44, 45, AND 42, RETAIL TRADE AND WHOLESALE TRADE NUMBER OF TOTAL FIRMS (PAID AND WITHOUT PAID EMPLOYEES)
African Hispanic Asian Native Nonminority M/WBE Non-M/WBE Total
Americans1 Americans1 Americans1 Americans1Women Firms Firms2 Firms3
# % # % # % # % # % # % # %
Total 4,097 6.52% 3,736 5.95% 1,208 1.92% 257 0.41% 24,162 38.46% 33,460 53.26% 29,358 46.74% 62,818
Source: U.S. Bureau of the Census 2002, Survey of Business Owners. 1 Minority men and women firms are included in their respective minority classifications.
2 Non-M/WBE firms is the difference of Total Firms from M/WBE Firms.
3 Total Firms is based on the number of All Firms based on the SBO data provided.
APPENDIX J:COMMONWEALTH OF VIRGINIA PUMS REGRESSION ANALYSIS

Page J-1
APPENDIX J
COMMONWEALTH OF VIRGINIA PUMS REGRESSION ANALYSIS
EXHIBIT J-A RESULTS OF LOGISTIC REGRESSION
EXPLANATION OF RESULTS AND VARIABLES LOGISTIC REGRESSION OUTPUT
Below, variable names and operational definitions are provided. When interpreting Exhibits J-1 to J-5, the third column— Exp (B) — is the most informative index with regard to the influence of the independent variables on the likelihood of being self-employed. From the inverse of this value, we can interpret a likelihood value of its effect on self-employment. For example the Exp (B) for an African American is .473, from Exhibit J-1, the inverse of this is 2.11. This means that a nonminority male is 2.11 times more likely to be self-employed than an African American. Columns A and B are reported as a matter of convention to give the reader another indicator of both the magnitude of the variable’s effect and the direction of the effect (“-“ suggests the greater the negative B value the more it depresses the likelihood of being self-employed, and vice versa for a positive B value. It is noteworthy that theoretically “race-neutral” variables (e.g., marital status) tend to impact the likelihood of self-employment positively and that the race/ethnicity/gender variables, in general, tend to have a negative effect on self-employment. Variables Race, ethnicity, and gender indicator variables: African American
Asian American Hispanic American Native American Sex: Nonminority woman or not
Other indicator variables:
Marital Status: Married or not Age Age2: age squared. Used to acknowledge the positive, curvilinear relationship between each year of age and self-employment. Disability: Individuals self-reported health-related disabilities. Tenure: Owns their own home Value: Household property value. Mortgage: Monthly total mortgage payments. Unearn: Unearned income, such as interests and dividends. Resdinc: Household income less individuals’ personal income. P65: Number of individuals over the age of 65 living in the household. P18: Number of children under the age of 18 living in the household. Some College: Some college education College Graduate: College degree More than College: Professional or graduate degree
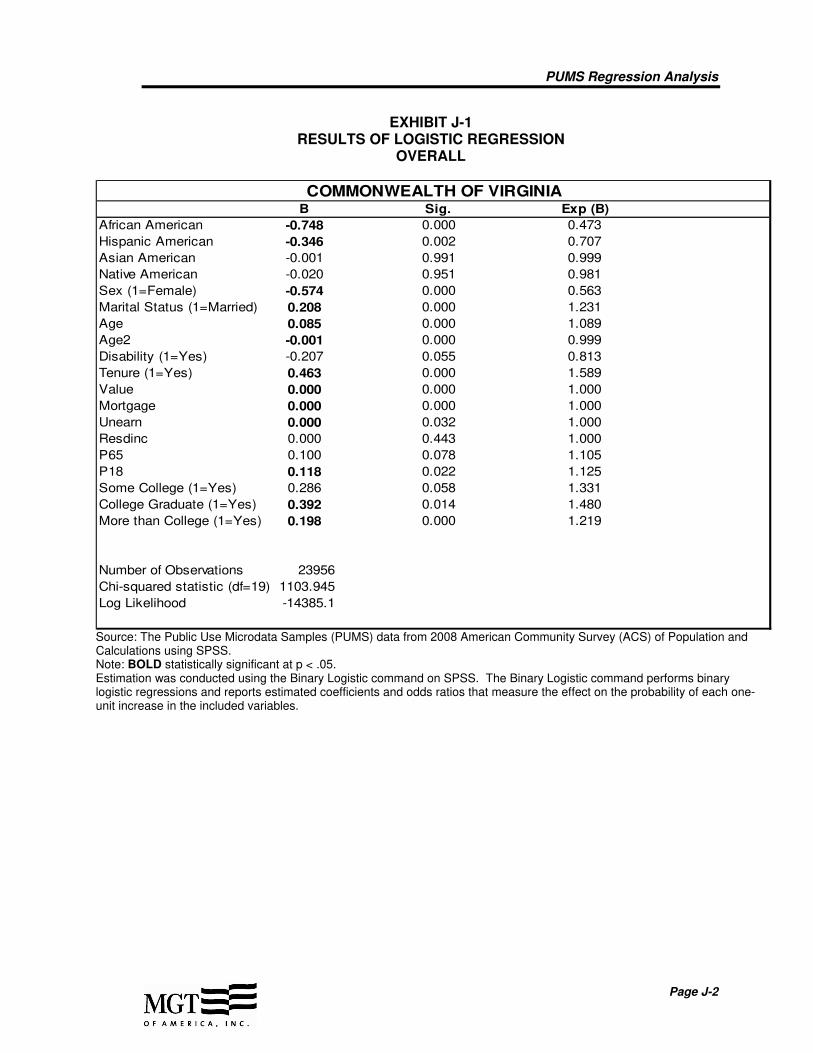
PUMS Regression Analysis
Page J-2
EXHIBIT J-1 RESULTS OF LOGISTIC REGRESSION
OVERALL
B Sig. Exp (B)
African American -0.748 0.000 0.473
Hispanic American -0.346 0.002 0.707
Asian American -0.001 0.991 0.999
Native American -0.020 0.951 0.981
Sex (1=Female) -0.574 0.000 0.563
Marital Status (1=Married) 0.208 0.000 1.231
Age 0.085 0.000 1.089
Age2 -0.001 0.000 0.999
Disability (1=Yes) -0.207 0.055 0.813
Tenure (1=Yes) 0.463 0.000 1.589
Value 0.000 0.000 1.000
Mortgage 0.000 0.000 1.000
Unearn 0.000 0.032 1.000
Resdinc 0.000 0.443 1.000
P65 0.100 0.078 1.105
P18 0.118 0.022 1.125
Some College (1=Yes) 0.286 0.058 1.331
College Graduate (1=Yes) 0.392 0.014 1.480
More than College (1=Yes) 0.198 0.000 1.219
Number of Observations 23956
Chi-squared statistic (df=19) 1103.945
Log Likelihood -14385.1
COMMONWEALTH OF VIRGINIA
Source: The Public Use Microdata Samples (PUMS) data from 2008 American Community Survey (ACS) of Population and Calculations using SPSS. Note: BOLD statistically significant at p < .05. Estimation was conducted using the Binary Logistic command on SPSS. The Binary Logistic command performs binary logistic regressions and reports estimated coefficients and odds ratios that measure the effect on the probability of each one-unit increase in the included variables.
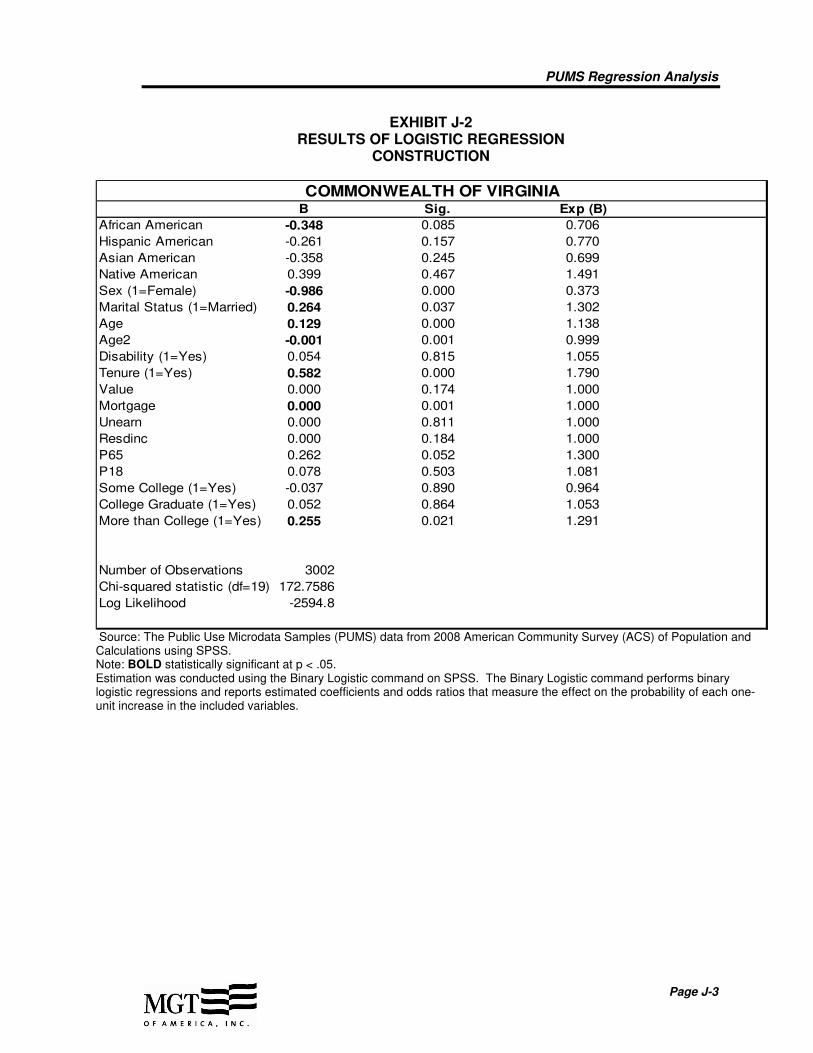
PUMS Regression Analysis
Page J-3
EXHIBIT J-2 RESULTS OF LOGISTIC REGRESSION
CONSTRUCTION
B Sig. Exp (B)
African American -0.348 0.085 0.706
Hispanic American -0.261 0.157 0.770
Asian American -0.358 0.245 0.699
Native American 0.399 0.467 1.491
Sex (1=Female) -0.986 0.000 0.373
Marital Status (1=Married) 0.264 0.037 1.302
Age 0.129 0.000 1.138
Age2 -0.001 0.001 0.999
Disability (1=Yes) 0.054 0.815 1.055
Tenure (1=Yes) 0.582 0.000 1.790
Value 0.000 0.174 1.000
Mortgage 0.000 0.001 1.000
Unearn 0.000 0.811 1.000
Resdinc 0.000 0.184 1.000
P65 0.262 0.052 1.300
P18 0.078 0.503 1.081
Some College (1=Yes) -0.037 0.890 0.964
College Graduate (1=Yes) 0.052 0.864 1.053
More than College (1=Yes) 0.255 0.021 1.291
Number of Observations 3002
Chi-squared statistic (df=19) 172.7586
Log Likelihood -2594.8
COMMONWEALTH OF VIRGINIA
Source: The Public Use Microdata Samples (PUMS) data from 2008 American Community Survey (ACS) of Population and Calculations using SPSS. Note: BOLD statistically significant at p < .05. Estimation was conducted using the Binary Logistic command on SPSS. The Binary Logistic command performs binary logistic regressions and reports estimated coefficients and odds ratios that measure the effect on the probability of each one-unit increase in the included variables.

PUMS Regression Analysis
Page J-4
EXHIBIT J-3 RESULTS OF LOGISTIC REGRESSION
PROFESSIONAL SERVICES
B Sig. Exp (B)
African American -1.117 0.000 0.327
Hispanic American -0.881 0.010 0.414
Asian American -0.659 0.001 0.518
Native American -18.658 0.998 0.000
Sex (1=Female) -1.164 0.000 0.312
Marital Status (1=Married) 0.234 0.095 1.263
Age 0.067 0.044 1.070
Age2 0.000 0.596 1.000
Disability (1=Yes) -0.883 0.028 0.413
Tenure (1=Yes) 0.311 0.098 1.365
Value 0.000 0.000 1.000
Mortgage 0.000 0.000 1.000
Unearn 0.000 0.972 1.000
Resdinc 0.000 0.066 1.000
P65 0.039 0.770 1.039
P18 0.228 0.058 1.256
Some College (1=Yes) -0.460 0.656 0.631
College Graduate (1=Yes) -0.530 0.609 0.588
More than College (1=Yes) -0.645 0.005 0.525
Number of Observations 6002
Chi-squared statistic (df=19) 519.1421
Log Likelihood -2787.19
COMMONWEALTH OF VIRGINIA
Source: The Public Use Microdata Samples (PUMS) data from 2008 American Community Survey (ACS) of Population and Calculations using SPSS. Note: BOLD statistically significant at p < .05. Estimation was conducted using the Binary Logistic command on SPSS. The Binary Logistic command performs binary logistic regressions and reports estimated coefficients and odds ratios that measure the effect on the probability of each one-unit increase in the included variables.

PUMS Regression Analysis
Page J-5
EXHIBIT J-4 RESULTS OF LOGISTIC REGRESSION
OTHER SERVICES
B Sig. Exp (B)
African American -0.280 0.021 0.756
Hispanic American -0.580 0.003 0.560
Asian American 0.291 0.023 1.337
Native American -0.077 0.876 0.926
Sex (1=Female) 0.169 0.064 1.184
Marital Status (1=Married) 0.288 0.001 1.333
Age 0.111 0.000 1.118
Age2 -0.001 0.001 0.999
Disability (1=Yes) -0.201 0.246 0.818
Tenure (1=Yes) 0.414 0.001 1.512
Value 0.000 0.040 1.000
Mortgage 0.000 0.000 1.000
Unearn 0.000 0.249 1.000
Resdinc 0.000 0.041 1.000
P65 0.077 0.418 1.080
P18 0.114 0.168 1.121
Some College (1=Yes) 0.087 0.737 1.091
College Graduate (1=Yes) 0.444 0.079 1.559
More than College (1=Yes) 0.207 0.019 1.229
Number of Observations 6551
Chi-squared statistic (df=19) 347.0285
Log Likelihood -4921.86
COMMONWEALTH OF VIRGINIA
Source: The Public Use Microdata Samples (PUMS) data from 2008 American Community Survey (ACS) of Population and Calculations using SPSS. Note: BOLD statistically significant at p < .05. Estimation was conducted using the Binary Logistic command on SPSS. The Binary Logistic command performs binary logistic regressions and reports estimated coefficients and odds ratios that measure the effect on the probability of each one-unit increase in the included variables.
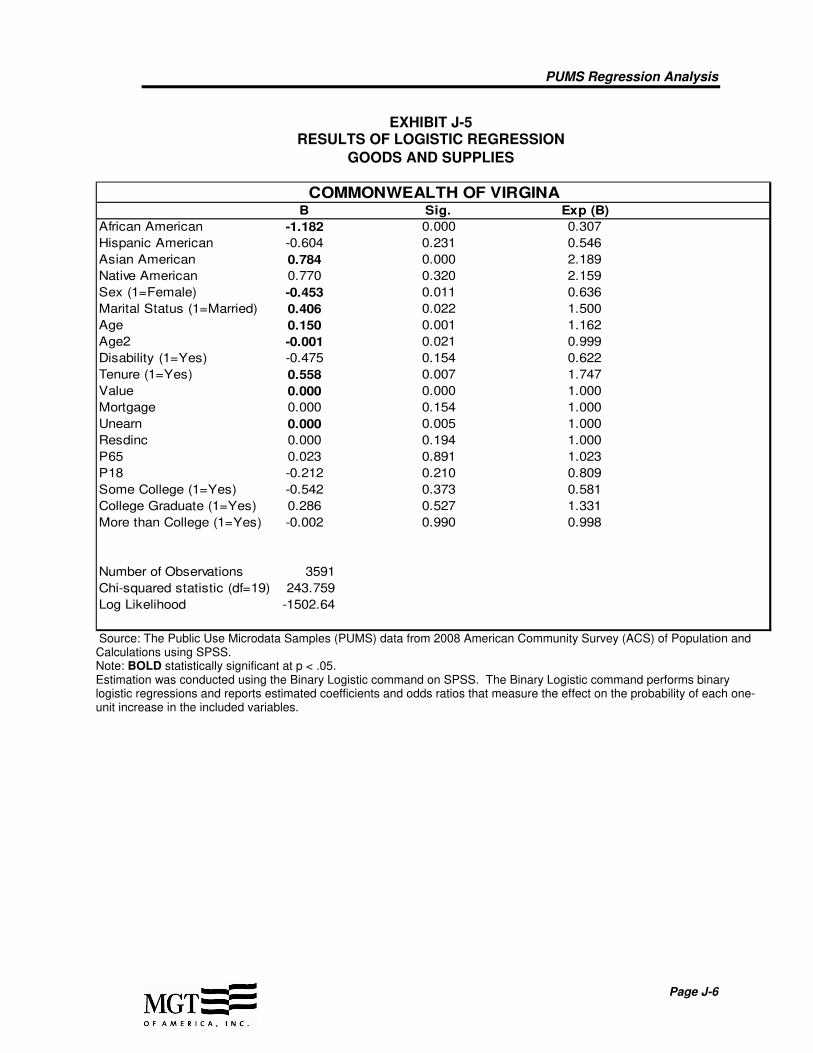
PUMS Regression Analysis
Page J-6
EXHIBIT J-5 RESULTS OF LOGISTIC REGRESSION
GOODS AND SUPPLIES
B Sig. Exp (B)
African American -1.182 0.000 0.307
Hispanic American -0.604 0.231 0.546
Asian American 0.784 0.000 2.189
Native American 0.770 0.320 2.159
Sex (1=Female) -0.453 0.011 0.636
Marital Status (1=Married) 0.406 0.022 1.500
Age 0.150 0.001 1.162
Age2 -0.001 0.021 0.999
Disability (1=Yes) -0.475 0.154 0.622
Tenure (1=Yes) 0.558 0.007 1.747
Value 0.000 0.000 1.000
Mortgage 0.000 0.154 1.000
Unearn 0.000 0.005 1.000
Resdinc 0.000 0.194 1.000
P65 0.023 0.891 1.023
P18 -0.212 0.210 0.809
Some College (1=Yes) -0.542 0.373 0.581
College Graduate (1=Yes) 0.286 0.527 1.331
More than College (1=Yes) -0.002 0.990 0.998
Number of Observations 3591
Chi-squared statistic (df=19) 243.759
Log Likelihood -1502.64
COMMONWEALTH OF VIRGINA
Source: The Public Use Microdata Samples (PUMS) data from 2008 American Community Survey (ACS) of Population and Calculations using SPSS. Note: BOLD statistically significant at p < .05. Estimation was conducted using the Binary Logistic command on SPSS. The Binary Logistic command performs binary logistic regressions and reports estimated coefficients and odds ratios that measure the effect on the probability of each one-unit increase in the included variables.

PUMS Regression Analysis
Page J-7
EXHIBIT J-B RESULTS OF LINEAR REGRESSION
EXPLANATION OF RESULTS AND VARIABLES LINEAR REGRESSION OUTPUT
Below, variable names and operational definitions are provided. When interpreting the linear regression Exhibits J-6 to J-10, the first column— Unstandardized B — is the most informative index with regard to the influence of the independent variables on the earnings of a self-employed individual. Each number in this column represents a percent change in earnings. For example the corresponding number for an African American is -.387, from Exhibit J-6, meaning that an African American will earn 38.7 percent less than a nonminority male. The other four columns are reported in order to give the reader another indicator of both the magnitude of the variable’s effect and the direction of the effect. Std. Error reports the standard deviation in the sampling distribution. Standardized B reports the standard deviation change in the dependent variable from on standard deviation increase in the independent variable. The t and Sig. columns simply report the level and strength of a variable’s significance.
Variables
Race, ethnicity and gender indicator variables: African American Asian American Hispanic American Native American Nonminority Woman
Other indicator variables:
Marital Status: Married or not Disability: Individuals self-reported health-related disabilities. Age Age2: age squared. Used to acknowledge the positive, curvilinear relationship between each year of age and self-employment.
Speaks English Well: Person’s ability to speak English if not a native speaker. Some College: Some college education College Graduate: College degree More than College: Professional or graduate degree
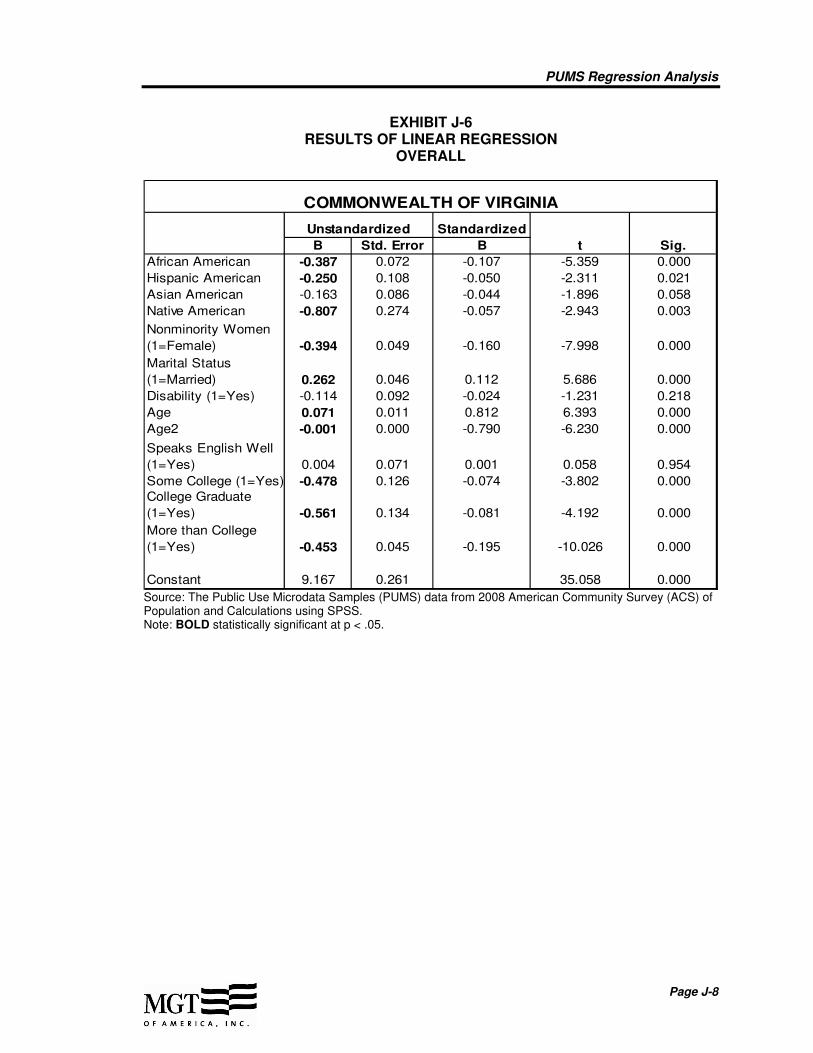
PUMS Regression Analysis
Page J-8
EXHIBIT J-6 RESULTS OF LINEAR REGRESSION
OVERALL
Standardized
B Std. Error B t Sig.
African American -0.387 0.072 -0.107 -5.359 0.000
Hispanic American -0.250 0.108 -0.050 -2.311 0.021
Asian American -0.163 0.086 -0.044 -1.896 0.058
Native American -0.807 0.274 -0.057 -2.943 0.003
-0.394 0.049 -0.160 -7.998 0.000
0.262 0.046 0.112 5.686 0.000
Disability (1=Yes) -0.114 0.092 -0.024 -1.231 0.218
Age 0.071 0.011 0.812 6.393 0.000
Age2 -0.001 0.000 -0.790 -6.230 0.000
0.004 0.071 0.001 0.058 0.954
Some College (1=Yes) -0.478 0.126 -0.074 -3.802 0.000
-0.561 0.134 -0.081 -4.192 0.000
-0.453 0.045 -0.195 -10.026 0.000
Constant 9.167 0.261 35.058 0.000
COMMONWEALTH OF VIRGINIA
More than College
(1=Yes)
Unstandardized
Nonminority Women
(1=Female)
Marital Status
(1=Married)
Speaks English Well
(1=Yes)
College Graduate
(1=Yes)
Source: The Public Use Microdata Samples (PUMS) data from 2008 American Community Survey (ACS) of Population and Calculations using SPSS. Note: BOLD statistically significant at p < .05.

PUMS Regression Analysis
Page J-9
EXHIBIT J-7 RESULTS OF LINEAR REGRESSION
CONSTRUCTION
Standardized
B Std. Error B t Sig.
African American -0.277 0.138 -0.087 -2.003 0.046
Hispanic American -0.286 0.174 -0.092 -1.643 0.101
Asian American 0.217 0.238 0.040 0.914 0.361
Native American -0.126 0.379 -0.014 -0.331 0.741
-0.271 0.167 -0.068 -1.620 0.106
0.180 0.085 0.093 2.125 0.034
Disability (1=Yes) 0.264 0.154 0.075 1.708 0.088
Age 0.055 0.019 0.746 2.853 0.005
Age2 -0.001 0.000 -0.659 -2.526 0.012
0.094 0.163 0.032 0.577 0.564
Some College (1=Yes) -0.255 0.185 -0.060 -1.376 0.169
-0.353 0.208 -0.073 -1.699 0.090
-0.074 0.078 -0.041 -0.958 0.339
Constant 9.159 0.450 20.376 0.000
COMMONWEALTH OF VIRGINIA
More than College
(1=Yes)
Unstandardized
Nonminority Women
(1=Female)
Marital Status
(1=Married)
Speaks English Well
(1=Yes)
College Graduate
(1=Yes)
Source: The Public Use Microdata Samples (PUMS) data from 2008 American Community Survey (ACS) of Population and Calculations using SPSS. Note: BOLD statistically significant at p < .05.

PUMS Regression Analysis
Page J-10
EXHIBIT J-8 RESULTS OF LINEAR REGRESSION
PROFESSIONAL SERVICES
Standardized
B Std. Error B t Sig.
African American -0.692 0.191 -0.161 -3.626 0.000
Hispanic American -0.262 0.351 -0.036 -0.746 0.456
Asian American -0.332 0.205 -0.081 -1.616 0.107
-0.578 0.108 -0.241 -5.344 0.000
0.210 0.121 0.076 1.730 0.084
Disability (1=Yes) -0.199 0.401 -0.023 -0.496 0.620
Age 0.161 0.029 1.719 5.574 0.000
Age2 -0.002 0.000 -1.789 -5.798 0.000
0.166 0.178 0.049 0.932 0.352
Some College (1=Yes) -1.364 1.058 -0.060 -1.289 0.198
-0.672 0.975 -0.029 -0.690 0.491
-0.500 0.213 -0.102 -2.344 0.019
Constant 7.743 0.717 10.796 0.000
COMMONWEALTH OF VIRGINIA
More than College
(1=Yes)
Unstandardized
Nonminority Women
(1=Female)
Marital Status
(1=Married)
Speaks English Well
(1=Yes)
College Graduate
(1=Yes)
Source: The Public Use Microdata Samples (PUMS) data from 2008 American Community Survey (ACS) of Population and Calculations using SPSS. Note: BOLD statistically significant at p < .05.

PUMS Regression Analysis
Page J-11
EXHIBIT J-9 RESULTS OF LINEAR REGRESSION
OTHER SERVICES
Standardized
B Std. Error B t Sig.
African American -0.324 0.098 -0.114 -3.308 0.001
Hispanic American 0.094 0.175 0.019 0.535 0.593
Asian American -0.077 0.121 -0.026 -0.637 0.524
Native American -0.606 0.408 -0.048 -1.485 0.138
-0.341 0.072 -0.165 -4.749 0.000
0.133 0.068 0.064 1.949 0.052
Disability (1=Yes) 0.003 0.142 0.001 0.018 0.986
Age 0.048 0.017 0.587 2.758 0.006
Age2 -0.001 0.000 -0.620 -2.906 0.004
-0.052 0.100 -0.022 -0.516 0.606
Some College (1=Yes) -0.315 0.210 -0.048 -1.504 0.133
-0.470 0.200 -0.076 -2.346 0.019
-0.396 0.069 -0.185 -5.720 0.000
Constant 9.706 0.411 23.605 0.000
COMMONWEALTH OF VIRGINIA
More than College
(1=Yes)
Unstandardized
Nonminority Women
(1=Female)
Marital Status
(1=Married)
Speaks English Well
(1=Yes)
College Graduate
(1=Yes)
Source: The Public Use Microdata Samples (PUMS) data from 2008 American Community Survey (ACS) of Population and Calculations using SPSS. Note: BOLD statistically significant at p < .05.

PUMS Regression Analysis
Page J-12
EXHIBIT J-10 RESULTS OF LINEAR REGRESSION
GOODS AND SUPPLIES
Standardized
B Std. Error B t Sig.
African American -0.610 0.290 -0.135 -2.103 0.037
Hispanic American -0.125 0.418 -0.020 -0.299 0.765
Asian American -0.325 0.213 -0.124 -1.529 0.128
Native American -1.328 0.624 -0.134 -2.128 0.034
-0.472 0.143 -0.215 -3.291 0.001
0.362 0.140 0.168 2.588 0.010
Disability (1=Yes) -0.393 0.272 -0.091 -1.448 0.149
Age 0.015 0.037 0.185 0.416 0.678
Age2 0.000 0.000 -0.100 -0.227 0.821
0.155 0.195 0.064 0.796 0.427
Some College (1=Yes) -0.648 0.517 -0.080 -1.252 0.212
-0.317 0.364 -0.055 -0.871 0.385
-0.278 0.125 -0.141 -2.228 0.027
Constant 10.057 0.877 11.461 0.000
COMMONWEALTH OF VIRGINIA
More than College
(1=Yes)
Unstandardized
Nonminority Women
(1=Female)
Marital Status
(1=Married)
Speaks English Well
(1=Yes)
College Graduate
(1=Yes)
Source: The Public Use Microdata Samples (PUMS) data from 2008 American Community Survey (ACS) of Population and Calculations using SPSS. Note: BOLD statistically significant at p < .05.
APPENDIX K:VENDOR LISTS, MEMBERSHIP
LISTS, AND COMMERCIAL CONSTRUCTION PERMITS DATA
REQUEST

Page K-1
APPENDIX K
VENDOR LISTS, MEMBERSHIP LISTS, AND COMMERCIAL CONSTRUCTION PERMITS DATA REQUEST
MGT of America, Inc.’s (MGT) subconsultant, Transformation Consulting, Inc. collected vendor lists, membership lists, and commercial construction permits data from organizations and jurisdictions that were identified as potential sources that would (1) have additional race, ethnicity, and gender information on firms located in the Commonwealth of Virginia (Commonwealth) market area or (2) available commercial construction permits data. The following is the letter that was submitted requesting organizations and jurisdictions provide these lists and data. Please refer to Appendix L for the list of organizations and jurisdictions that were contacted.
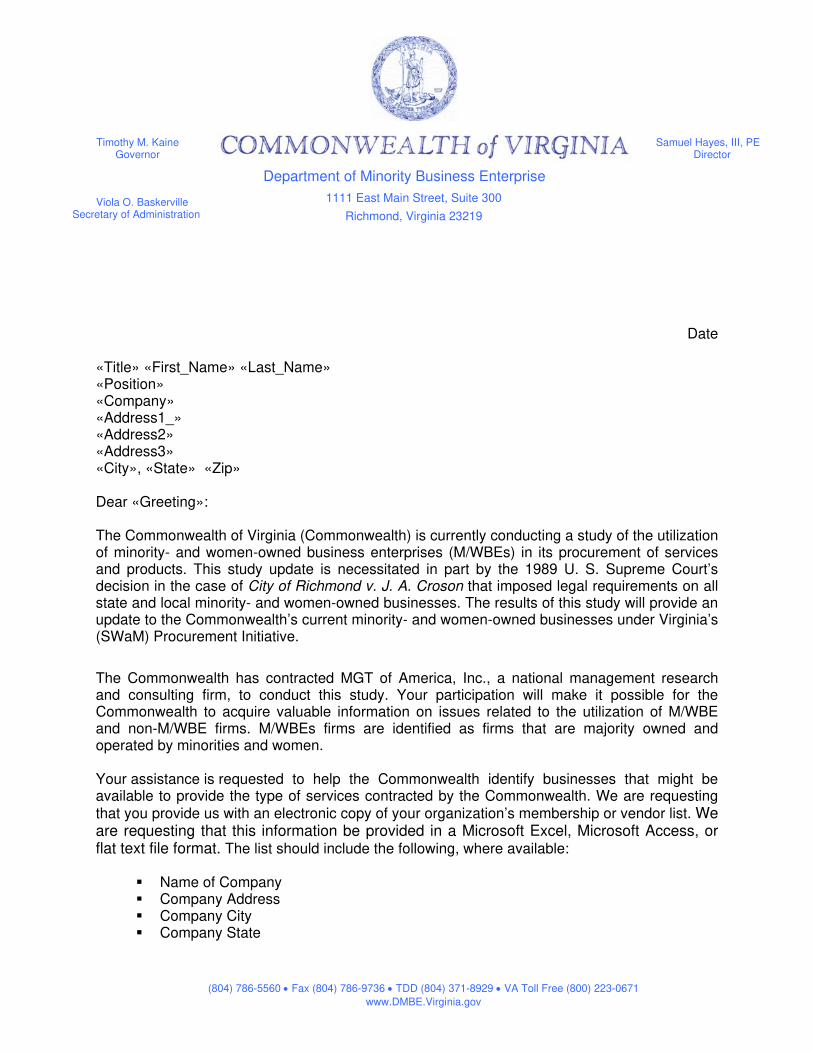
Department of Minority Business Enterprise
1111 East Main Street, Suite 300
Richmond, Virginia 23219
(804) 786-5560 Fax (804) 786-9736 TDD (804) 371-8929 VA Toll Free (800) 223-0671
www.DMBE.Virginia.gov
Timothy M. Kaine Governor
Viola O. Baskerville Secretary of Administration
Samuel Hayes, III, PE Director
Date «Title» «First_Name» «Last_Name» «Position» «Company» «Address1_» «Address2» «Address3» «City», «State» «Zip» Dear «Greeting»: The Commonwealth of Virginia (Commonwealth) is currently conducting a study of the utilization of minority- and women-owned business enterprises (M/WBEs) in its procurement of services and products. This study update is necessitated in part by the 1989 U. S. Supreme Court’s decision in the case of City of Richmond v. J. A. Croson that imposed legal requirements on all state and local minority- and women-owned businesses. The results of this study will provide an update to the Commonwealth’s current minority- and women-owned businesses under Virginia’s (SWaM) Procurement Initiative.
The Commonwealth has contracted MGT of America, Inc., a national management research and consulting firm, to conduct this study. Your participation will make it possible for the Commonwealth to acquire valuable information on issues related to the utilization of M/WBE and non-M/WBE firms. M/WBEs firms are identified as firms that are majority owned and operated by minorities and women. Your assistance is re quested to help the Commonwealth identify businesses that might be available to provide the type of services contracted by the Commonwealth. We are requesting that you provide us with an electronic copy of your organization’s membership or vendor list. We are requesting that this information be provided in a Microsoft Excel, Microsoft Access, or flat text file format. The list should include the following, where available:
Name of Company Company Address Company City Company State

Company Zip Code Contact Name Contact Title Company Telephone Phone Number Company Facsimile Number Company E-mail Address Gender of Owner (if available) Ethnicity of Owner (if available) Description of Work Type / Business Certification Type (if applicable)
MGT has contracted with Transformation Consulting, LLC to work as a local subconsultant on this study. They are responsible for obtaining these lists. We request that your membership or vendor list be submitted to Transformation Consulting, LLC office by Monday, November 30, 2009. Please send to (contact name) with Transformation Consulting, LLC at [email protected] . If you prefer to submit your membership or vendor list on a CD, mail it to Transformation Consulting, LLC, P.O. Box 45 24 Westhampton Way, Richmond VA. 23173 attn Lee Brazzell. If you have any questions, or would like to obtain more information about the study, please contact Reginald Smith at MGT at (850) 386-3191 or Ms. Angela Chiang, Director of Operations, Virginia Department of Minority Business Enterprise at (804) 786-1087. We greatly appreciate your assistance in this matter. Sincerely, Samuel Hayes, III Director, Virginia Department of Minority Business Enterprise Enclosure
APPENDIX L:VENDOR AND MEMBERSHIP LIST
REQUEST/COMMERCIAL CONSTRUCTION PERMITS
LIST OF ORGANIZATION AND JURISDICTIONS CONTACTED

Page L-1
APPENDIX L
VENDOR AND MEMBERSHIP LIST REQUEST/COMMERCIAL CONSTRUCTION PERMITS
LIST OF ORGANIZATIONS AND JURISDICTIONS CONTACTED
As stated in Appendix K, MGT of America, Inc.’s (MGT) subconsultant, Transformation Consulting, Inc., collected vendor and membership lists from organizations and jurisdictions that were identified as potential sources that would have additional race, ethnicity, and gender information on firms located in the Commonwealth of Virginia (Commonwealth) market area. In addition, some of these jurisdictions were contacted in order to obtain commercial construction permits data (such as building, electrical, and plumbing). The following is a sample of some of the organizations or jurisdictions that were contacted.
Jurisdictions
City of Alexandria, Virginia City of Charlottesville, Virginia City of Chesapeake, Virginia City of Fairfax, Virginia City of Hampton, Virginia City of Martinsville, Virginia City of Norfolk, Virginia City of Petersburg, Virginia City of Portsmouth, Virginia City of Richmond, Virginia City of Virginia Beach, Virginia County of Chesterfield, Virginia County of Fairfax, Virginia County of Henrico, Virginia County of Loudoun, Virginia County of Roanoke, Virginia
Associations and Organizations
REDC Community Capital Group, Inc.V American Indian Chamber of Commerce Association of General Contractors Capital Source, formerly the Virginia Community Development Loan Fund City of Richmond - Department of Economic Development Greater Richmond Partnership Greater Virginia Contractors' Association Harris InfoSource Metropolitan Business League National Association of Women Business Owners National Indian Business Association

Vendor and Membership List Request/Commercial Construction Permits
Page L-2
Associations and Organizations (continued)
REDC Community Capital Group, Incorporated Richmond Chamber of Commerce Small Business Administration (Virginia) Virginia Asian Chamber of Commerce Virginia Chamber of Commerce Virginia Hispanic Chamber of Commerce Virginia Regional Minority Supplier Development Council Women’s President Educational Organization
APPENDIX M:SUBCONTRACTOR UTILIZATION
BY FUNCTIONAL AREA OBTAINED FROM THE
COMMONWEALTH’S SMALL, WOMEN-, AND MINORITY-
OWNED BUSINESS PROGRAM’S DASHBOARD, ANALYTICS, AND
REPORTING SYSTEM (DASHBOARD)
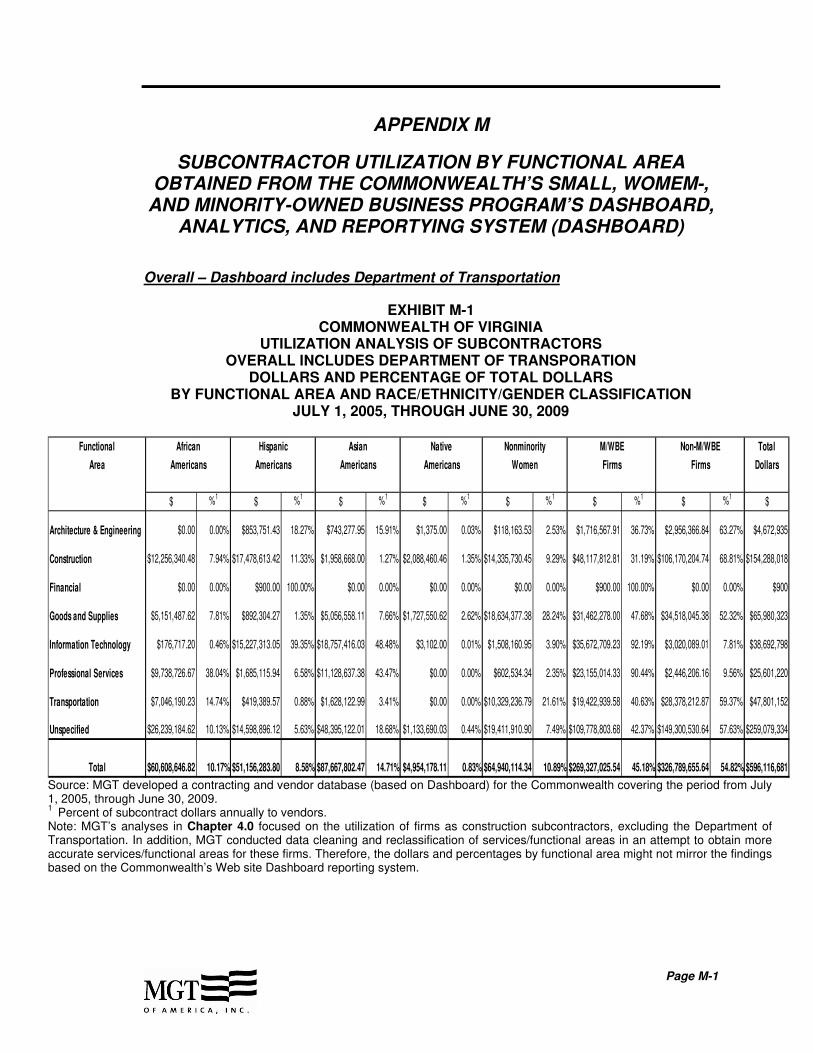
Page M-1
APPENDIX M
SUBCONTRACTOR UTILIZATION BY FUNCTIONAL AREA OBTAINED FROM THE COMMONWEALTH’S SMALL, WOMEM-,
AND MINORITY-OWNED BUSINESS PROGRAM’S DASHBOARD, ANALYTICS, AND REPORTYING SYSTEM (DASHBOARD)
Overall – Dashboard includes Department of Transportation
EXHIBIT M-1 COMMONWEALTH OF VIRGINIA
UTILIZATION ANALYSIS OF SUBCONTRACTORS OVERALL INCLUDES DEPARTMENT OF TRANSPORATION
DOLLARS AND PERCENTAGE OF TOTAL DOLLARS BY FUNCTIONAL AREA AND RACE/ETHNICITY/GENDER CLASSIFICATION
JULY 1, 2005, THROUGH JUNE 30, 2009
Functional African Hispanic Asian Native Nonminority M/WBE Non-M/WBE Total
Area Americans Americans Americans Americans Women Firms Firms Dollars
$ %1$ %1
$ %1$ %1
$ %1$ %1
$ %1$
Architecture & Engineering $0.00 0.00% $853,751.43 18.27% $743,277.95 15.91% $1,375.00 0.03% $118,163.53 2.53% $1,716,567.91 36.73% $2,956,366.84 63.27% $4,672,935
Construction $12,256,340.48 7.94% $17,478,613.42 11.33% $1,958,668.00 1.27% $2,088,460.46 1.35% $14,335,730.45 9.29% $48,117,812.81 31.19% $106,170,204.74 68.81% $154,288,018
Financial $0.00 0.00% $900.00 100.00% $0.00 0.00% $0.00 0.00% $0.00 0.00% $900.00 100.00% $0.00 0.00% $900
Goods and Supplies $5,151,487.62 7.81% $892,304.27 1.35% $5,056,558.11 7.66% $1,727,550.62 2.62% $18,634,377.38 28.24% $31,462,278.00 47.68% $34,518,045.38 52.32% $65,980,323
Information Technology $176,717.20 0.46% $15,227,313.05 39.35% $18,757,416.03 48.48% $3,102.00 0.01% $1,508,160.95 3.90% $35,672,709.23 92.19% $3,020,089.01 7.81% $38,692,798
Professional Services $9,738,726.67 38.04% $1,685,115.94 6.58% $11,128,637.38 43.47% $0.00 0.00% $602,534.34 2.35% $23,155,014.33 90.44% $2,446,206.16 9.56% $25,601,220
Transportation $7,046,190.23 14.74% $419,389.57 0.88% $1,628,122.99 3.41% $0.00 0.00% $10,329,236.79 21.61% $19,422,939.58 40.63% $28,378,212.87 59.37% $47,801,152
Unspecified $26,239,184.62 10.13% $14,598,896.12 5.63% $48,395,122.01 18.68% $1,133,690.03 0.44% $19,411,910.90 7.49% $109,778,803.68 42.37% $149,300,530.64 57.63% $259,079,334
Total $60,608,646.82 10.17% $51,156,283.80 8.58% $87,667,802.47 14.71% $4,954,178.11 0.83% $64,940,114.34 10.89% $269,327,025.54 45.18% $326,789,655.64 54.82% $596,116,681
Source: MGT developed a contracting and vendor database (based on Dashboard) for the Commonwealth covering the period from July 1, 2005, through June 30, 2009. 1
Percent of subcontract dollars annually to vendors. Note: MGT’s analyses in Chapter 4.0 focused on the utilization of firms as construction subcontractors, excluding the Department of Transportation. In addition, MGT conducted data cleaning and reclassification of services/functional areas in an attempt to obtain more accurate services/functional areas for these firms. Therefore, the dollars and percentages by functional area might not mirror the findings based on the Commonwealth’s Web site Dashboard reporting system.
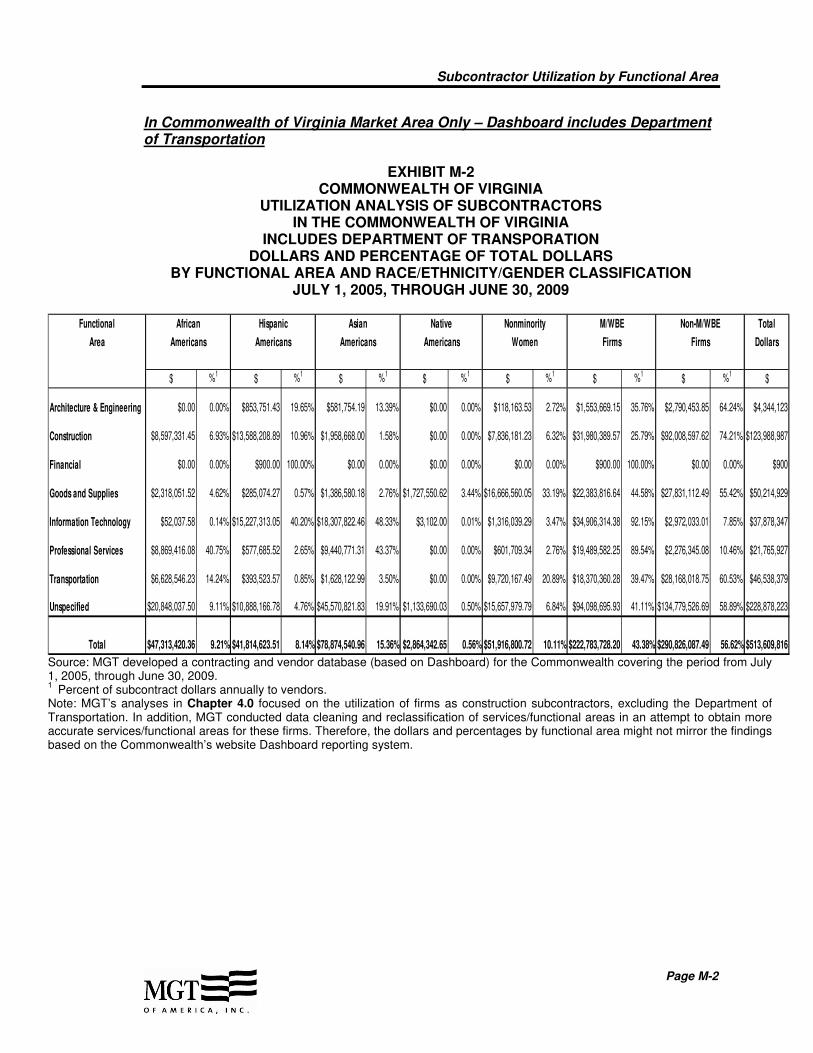
Subcontractor Utilization by Functional Area
Page M-2
In Commonwealth of Virginia Market Area Only – Dashboard includes Department of Transportation
EXHIBIT M-2 COMMONWEALTH OF VIRGINIA
UTILIZATION ANALYSIS OF SUBCONTRACTORS IN THE COMMONWEALTH OF VIRGINIA
INCLUDES DEPARTMENT OF TRANSPORATION DOLLARS AND PERCENTAGE OF TOTAL DOLLARS
BY FUNCTIONAL AREA AND RACE/ETHNICITY/GENDER CLASSIFICATION JULY 1, 2005, THROUGH JUNE 30, 2009
Functional African Hispanic Asian Native Nonminority M/WBE Non-M/WBE Total
Area Americans Americans Americans Americans Women Firms Firms Dollars
$ %1$ %1
$ %1$ %1
$ %1$ %1
$ %1$
Architecture & Engineering $0.00 0.00% $853,751.43 19.65% $581,754.19 13.39% $0.00 0.00% $118,163.53 2.72% $1,553,669.15 35.76% $2,790,453.85 64.24% $4,344,123
Construction $8,597,331.45 6.93% $13,588,208.89 10.96% $1,958,668.00 1.58% $0.00 0.00% $7,836,181.23 6.32% $31,980,389.57 25.79% $92,008,597.62 74.21% $123,988,987
Financial $0.00 0.00% $900.00 100.00% $0.00 0.00% $0.00 0.00% $0.00 0.00% $900.00 100.00% $0.00 0.00% $900
Goods and Supplies $2,318,051.52 4.62% $285,074.27 0.57% $1,386,580.18 2.76% $1,727,550.62 3.44% $16,666,560.05 33.19% $22,383,816.64 44.58% $27,831,112.49 55.42% $50,214,929
Information Technology $52,037.58 0.14% $15,227,313.05 40.20% $18,307,822.46 48.33% $3,102.00 0.01% $1,316,039.29 3.47% $34,906,314.38 92.15% $2,972,033.01 7.85% $37,878,347
Professional Services $8,869,416.08 40.75% $577,685.52 2.65% $9,440,771.31 43.37% $0.00 0.00% $601,709.34 2.76% $19,489,582.25 89.54% $2,276,345.08 10.46% $21,765,927
Transportation $6,628,546.23 14.24% $393,523.57 0.85% $1,628,122.99 3.50% $0.00 0.00% $9,720,167.49 20.89% $18,370,360.28 39.47% $28,168,018.75 60.53% $46,538,379
Unspecified $20,848,037.50 9.11% $10,888,166.78 4.76% $45,570,821.83 19.91% $1,133,690.03 0.50% $15,657,979.79 6.84% $94,098,695.93 41.11% $134,779,526.69 58.89% $228,878,223
Total $47,313,420.36 9.21% $41,814,623.51 8.14% $78,874,540.96 15.36% $2,864,342.65 0.56% $51,916,800.72 10.11% $222,783,728.20 43.38% $290,826,087.49 56.62% $513,609,816
Source: MGT developed a contracting and vendor database (based on Dashboard) for the Commonwealth covering the period from July 1, 2005, through June 30, 2009. 1
Percent of subcontract dollars annually to vendors. Note: MGT’s analyses in Chapter 4.0 focused on the utilization of firms as construction subcontractors, excluding the Department of Transportation. In addition, MGT conducted data cleaning and reclassification of services/functional areas in an attempt to obtain more accurate services/functional areas for these firms. Therefore, the dollars and percentages by functional area might not mirror the findings based on the Commonwealth’s website Dashboard reporting system.
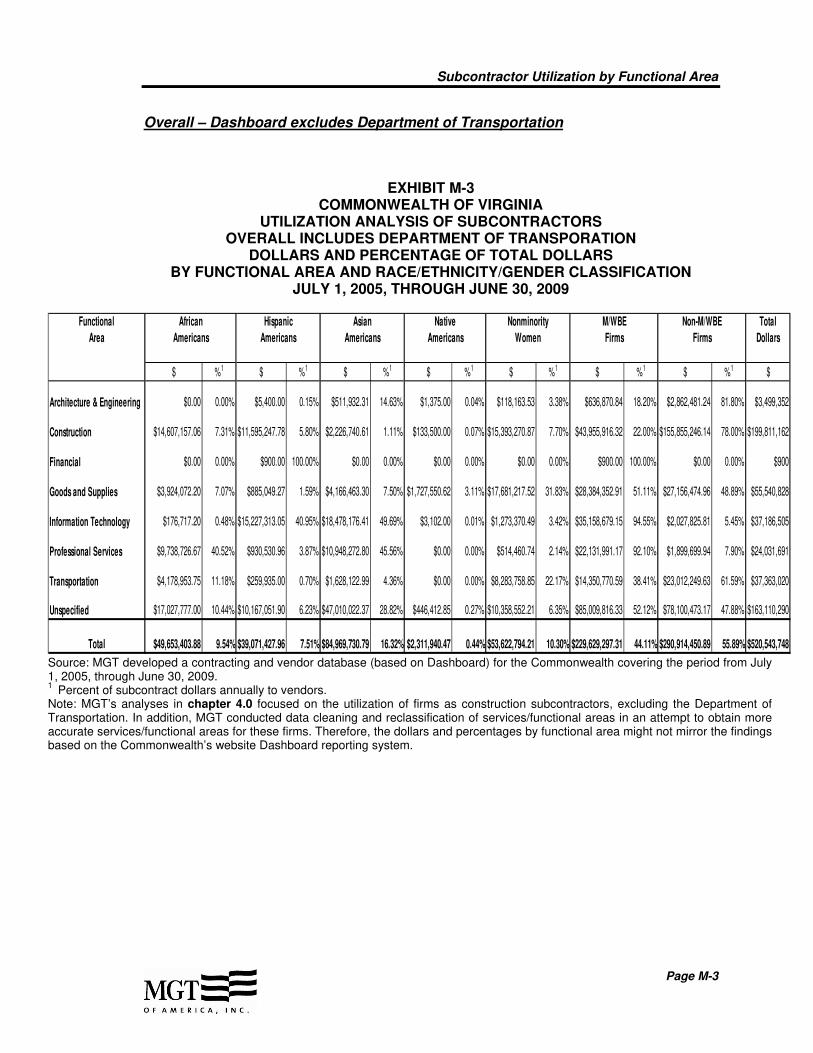
Subcontractor Utilization by Functional Area
Page M-3
Overall – Dashboard excludes Department of Transportation
EXHIBIT M-3 COMMONWEALTH OF VIRGINIA
UTILIZATION ANALYSIS OF SUBCONTRACTORS OVERALL INCLUDES DEPARTMENT OF TRANSPORATION
DOLLARS AND PERCENTAGE OF TOTAL DOLLARS BY FUNCTIONAL AREA AND RACE/ETHNICITY/GENDER CLASSIFICATION
JULY 1, 2005, THROUGH JUNE 30, 2009
Functional African Hispanic Asian Native Nonminority M/WBE Non-M/WBE Total
Area Americans Americans Americans Americans Women Firms Firms Dollars
$ %1 $ %1 $ %1 $ %1 $ %1 $ %1 $ %1 $
Architecture & Engineering $0.00 0.00% $5,400.00 0.15% $511,932.31 14.63% $1,375.00 0.04% $118,163.53 3.38% $636,870.84 18.20% $2,862,481.24 81.80% $3,499,352
Construction $14,607,157.06 7.31% $11,595,247.78 5.80% $2,226,740.61 1.11% $133,500.00 0.07% $15,393,270.87 7.70% $43,955,916.32 22.00% $155,855,246.14 78.00% $199,811,162
Financial $0.00 0.00% $900.00 100.00% $0.00 0.00% $0.00 0.00% $0.00 0.00% $900.00 100.00% $0.00 0.00% $900
Goods and Supplies $3,924,072.20 7.07% $885,049.27 1.59% $4,166,463.30 7.50% $1,727,550.62 3.11% $17,681,217.52 31.83% $28,384,352.91 51.11% $27,156,474.96 48.89% $55,540,828
Information Technology $176,717.20 0.48% $15,227,313.05 40.95% $18,478,176.41 49.69% $3,102.00 0.01% $1,273,370.49 3.42% $35,158,679.15 94.55% $2,027,825.81 5.45% $37,186,505
Professional Services $9,738,726.67 40.52% $930,530.96 3.87% $10,948,272.80 45.56% $0.00 0.00% $514,460.74 2.14% $22,131,991.17 92.10% $1,899,699.94 7.90% $24,031,691
Transportation $4,178,953.75 11.18% $259,935.00 0.70% $1,628,122.99 4.36% $0.00 0.00% $8,283,758.85 22.17% $14,350,770.59 38.41% $23,012,249.63 61.59% $37,363,020
Unspecified $17,027,777.00 10.44% $10,167,051.90 6.23% $47,010,022.37 28.82% $446,412.85 0.27% $10,358,552.21 6.35% $85,009,816.33 52.12% $78,100,473.17 47.88% $163,110,290
Total $49,653,403.88 9.54% $39,071,427.96 7.51% $84,969,730.79 16.32% $2,311,940.47 0.44% $53,622,794.21 10.30% $229,629,297.31 44.11% $290,914,450.89 55.89% $520,543,748
Source: MGT developed a contracting and vendor database (based on Dashboard) for the Commonwealth covering the period from July 1, 2005, through June 30, 2009. 1
Percent of subcontract dollars annually to vendors. Note: MGT’s analyses in chapter 4.0 focused on the utilization of firms as construction subcontractors, excluding the Department of Transportation. In addition, MGT conducted data cleaning and reclassification of services/functional areas in an attempt to obtain more accurate services/functional areas for these firms. Therefore, the dollars and percentages by functional area might not mirror the findings based on the Commonwealth’s website Dashboard reporting system.

Subcontractor Utilization by Functional Area
Page M-4
In Commonwealth of Virginia Market Area Only – Dashboard excludes Department of Transportation
EXHIBIT M-4 COMMONWEALTH OF VIRGINIA
UTILIZATION ANALYSIS OF SUBCONTRACTORS IN THE COMMONWEALTH OF VIRGINIA
INCLUDES DEPARTMENT OF TRANSPORATION DOLLARS AND PERCENTAGE OF TOTAL DOLLARS
BY FUNCTIONAL AREA AND RACE/ETHNICITY/GENDER CLASSIFICATION JULY 1, 2005, THROUGH JUNE 30, 2009
Functional African Hispanic Asian Native Nonminority M/WBE Non-M/WBE Total
Area Americans Americans Americans Americans Women Firms Firms Dollars
$ %1 $ %1 $ %1 $ %1 $ %1 $ %1 $ %1 $
Architecture & Engineering $0.00 0.00% $5,400.00 0.16% $511,932.31 15.35% $0.00 0.00% $118,163.53 3.54% $635,495.84 19.06% $2,698,498.25 80.94% $3,333,994
Construction $3,879,521.63 2.39% $8,456,149.60 5.22% $2,207,974.59 1.36% $133,500.00 0.08% $8,558,310.84 5.28% $23,235,456.66 14.33% $138,909,286.22 85.67% $162,144,743
Financial $0.00 0.00% $900.00 100.00% $0.00 0.00% $0.00 0.00% $0.00 0.00% $900.00 100.00% $0.00 0.00% $900
Goods and Supplies $1,346,950.48 3.24% $277,819.27 0.67% $719,371.69 1.73% $1,727,550.62 4.16% $16,075,228.23 38.70% $20,146,920.29 48.50% $21,394,365.64 51.50% $41,541,286
Information Technology $52,037.58 0.14% $15,227,313.05 41.83% $18,056,024.60 49.61% $3,102.00 0.01% $1,081,248.83 2.97% $34,419,726.06 94.56% $1,979,769.81 5.44% $36,399,496
Professional Services $8,869,416.08 42.33% $577,685.52 2.76% $9,260,406.73 44.20% $0.00 0.00% $513,635.74 2.45% $19,221,144.07 91.74% $1,729,838.86 8.26% $20,950,983
Transportation $3,761,309.75 10.36% $259,935.00 0.72% $1,628,122.99 4.48% $0.00 0.00% $7,676,683.16 21.14% $13,326,050.90 36.69% $22,994,793.19 63.31% $36,320,844
Unspecified $16,370,768.07 10.70% $8,863,166.03 5.79% $44,650,787.99 29.18% $579,912.85 0.38% $12,333,900.05 8.06% $82,798,534.99 54.11% $70,223,206.94 45.89% $153,021,742
Total $34,280,003.59 7.56% $33,668,368.47 7.42% $77,034,620.90 16.98% $2,444,065.47 0.54% $46,357,170.38 10.22% $193,784,228.81 42.71% $259,929,758.91 57.29% $453,713,988
Source: MGT developed a contracting and vendor database (based on Dashboard) for the Commonwealth covering the period from July 1, 2005, through June 30, 2009. 1
Percent of subcontract dollars annually to vendors. Note: MGT’s analyses in chapter 4.0 focused on the utilization of firms as construction subcontractors, excluding the Department of Transportation. In addition, MGT conducted data cleaning and reclassification of services/functional areas in an attempt to obtain more accurate services/functional areas for these firms. Therefore, the dollars and percentages by functional area might not mirror the findings based on the Commonwealth’s website Dashboard reporting system.
APPENDIX N:PRIME CONTRACTOR
UTILIZATION BASED ON THE COMMONWEALTH ACCOUNTING
AND REPORTING SYSTEM (CARS) BY AGENCY NAME AND
RACE/ETHNICITY/GENDER CLASSIFICATION (EXCLUDED
DEPARTMENT OF TRANSPORTATION)
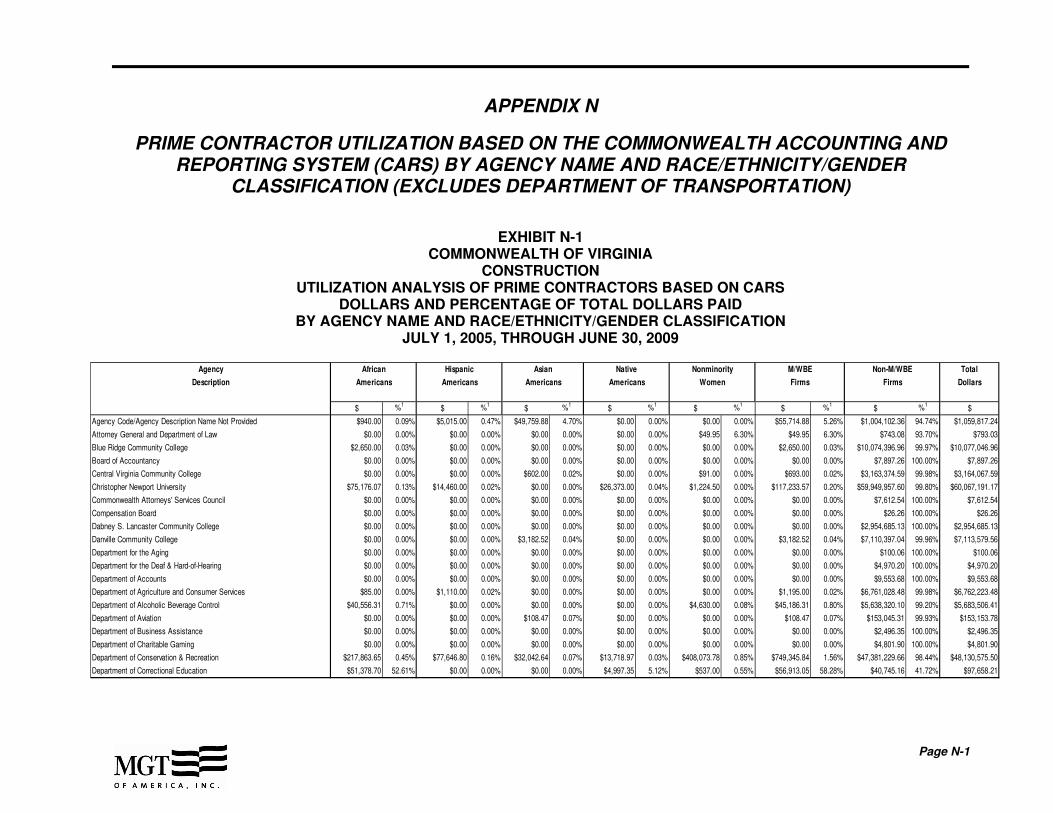
Page N-1
APPENDIX N
PRIME CONTRACTOR UTILIZATION BASED ON THE COMMONWEALTH ACCOUNTING AND REPORTING SYSTEM (CARS) BY AGENCY NAME AND RACE/ETHNICITY/GENDER
CLASSIFICATION (EXCLUDES DEPARTMENT OF TRANSPORTATION)
EXHIBIT N-1 COMMONWEALTH OF VIRGINIA
CONSTRUCTION UTILIZATION ANALYSIS OF PRIME CONTRACTORS BASED ON CARS
DOLLARS AND PERCENTAGE OF TOTAL DOLLARS PAID BY AGENCY NAME AND RACE/ETHNICITY/GENDER CLASSIFICATION
JULY 1, 2005, THROUGH JUNE 30, 2009
Agency African Hispanic Asian Native Nonminority M/WBE Non-M/WBE Total
Description Americans Americans Americans Americans Women Firms Firms Dollars
$ %1$ %1
$ %1$ %1
$ %1$ %1
$ %1$
Agency Code/Agency Description Name Not Provided $940.00 0.09% $5,015.00 0.47% $49,759.88 4.70% $0.00 0.00% $0.00 0.00% $55,714.88 5.26% $1,004,102.36 94.74% $1,059,817.24
Attorney General and Department of Law $0.00 0.00% $0.00 0.00% $0.00 0.00% $0.00 0.00% $49.95 6.30% $49.95 6.30% $743.08 93.70% $793.03
Blue Ridge Community College $2,650.00 0.03% $0.00 0.00% $0.00 0.00% $0.00 0.00% $0.00 0.00% $2,650.00 0.03% $10,074,396.96 99.97% $10,077,046.96
Board of Accountancy $0.00 0.00% $0.00 0.00% $0.00 0.00% $0.00 0.00% $0.00 0.00% $0.00 0.00% $7,897.26 100.00% $7,897.26
Central Virginia Community College $0.00 0.00% $0.00 0.00% $602.00 0.02% $0.00 0.00% $91.00 0.00% $693.00 0.02% $3,163,374.59 99.98% $3,164,067.59
Christopher Newport University $75,176.07 0.13% $14,460.00 0.02% $0.00 0.00% $26,373.00 0.04% $1,224.50 0.00% $117,233.57 0.20% $59,949,957.60 99.80% $60,067,191.17
Commonwealth Attorneys' Services Council $0.00 0.00% $0.00 0.00% $0.00 0.00% $0.00 0.00% $0.00 0.00% $0.00 0.00% $7,612.54 100.00% $7,612.54
Compensation Board $0.00 0.00% $0.00 0.00% $0.00 0.00% $0.00 0.00% $0.00 0.00% $0.00 0.00% $26.26 100.00% $26.26
Dabney S. Lancaster Community College $0.00 0.00% $0.00 0.00% $0.00 0.00% $0.00 0.00% $0.00 0.00% $0.00 0.00% $2,954,685.13 100.00% $2,954,685.13
Danville Community College $0.00 0.00% $0.00 0.00% $3,182.52 0.04% $0.00 0.00% $0.00 0.00% $3,182.52 0.04% $7,110,397.04 99.96% $7,113,579.56
Department for the Aging $0.00 0.00% $0.00 0.00% $0.00 0.00% $0.00 0.00% $0.00 0.00% $0.00 0.00% $100.06 100.00% $100.06
Department for the Deaf & Hard-of-Hearing $0.00 0.00% $0.00 0.00% $0.00 0.00% $0.00 0.00% $0.00 0.00% $0.00 0.00% $4,970.20 100.00% $4,970.20
Department of Accounts $0.00 0.00% $0.00 0.00% $0.00 0.00% $0.00 0.00% $0.00 0.00% $0.00 0.00% $9,553.68 100.00% $9,553.68
Department of Agriculture and Consumer Services $85.00 0.00% $1,110.00 0.02% $0.00 0.00% $0.00 0.00% $0.00 0.00% $1,195.00 0.02% $6,761,028.48 99.98% $6,762,223.48
Department of Alcoholic Beverage Control $40,556.31 0.71% $0.00 0.00% $0.00 0.00% $0.00 0.00% $4,630.00 0.08% $45,186.31 0.80% $5,638,320.10 99.20% $5,683,506.41
Department of Aviation $0.00 0.00% $0.00 0.00% $108.47 0.07% $0.00 0.00% $0.00 0.00% $108.47 0.07% $153,045.31 99.93% $153,153.78
Department of Business Assistance $0.00 0.00% $0.00 0.00% $0.00 0.00% $0.00 0.00% $0.00 0.00% $0.00 0.00% $2,496.35 100.00% $2,496.35
Department of Charitable Gaming $0.00 0.00% $0.00 0.00% $0.00 0.00% $0.00 0.00% $0.00 0.00% $0.00 0.00% $4,801.90 100.00% $4,801.90
Department of Conservation & Recreation $217,863.65 0.45% $77,646.80 0.16% $32,042.64 0.07% $13,718.97 0.03% $408,073.78 0.85% $749,345.84 1.56% $47,381,229.66 98.44% $48,130,575.50
Department of Correctional Education $51,378.70 52.61% $0.00 0.00% $0.00 0.00% $4,997.35 5.12% $537.00 0.55% $56,913.05 58.28% $40,745.16 41.72% $97,658.21
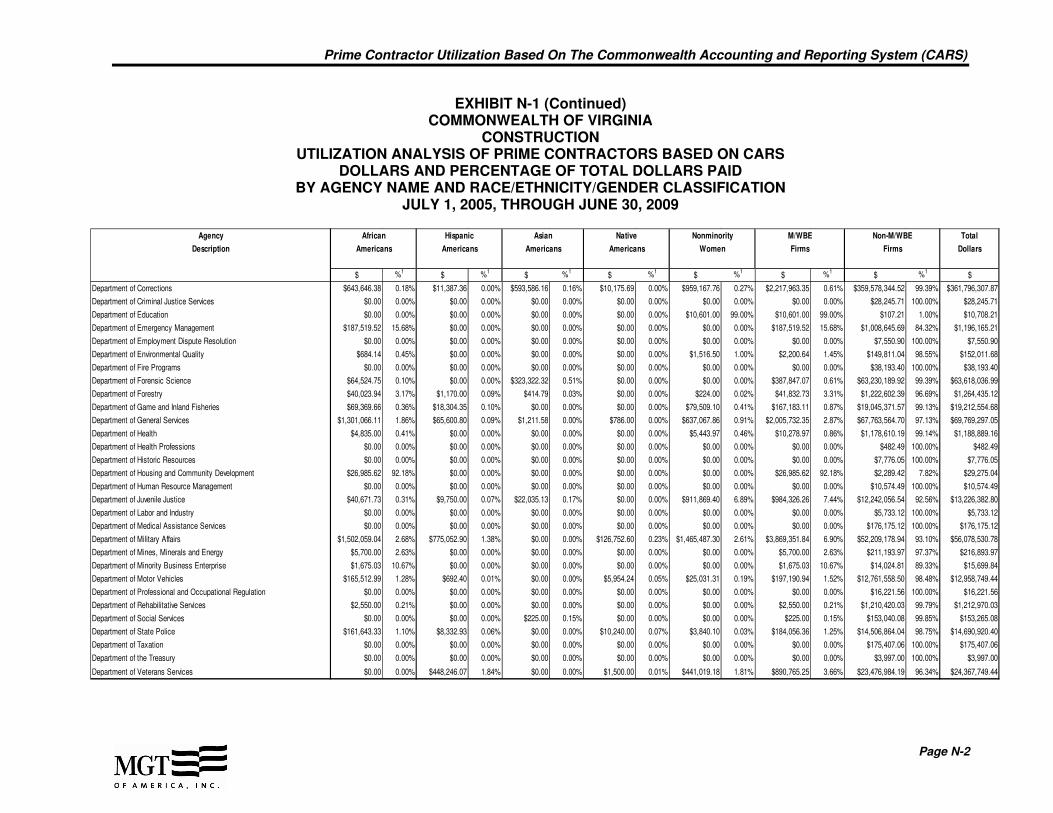
Prime Contractor Utilization Based On The Commonwealth Accounting and Reporting System (CARS)
Page N-2
EXHIBIT N-1 (Continued) COMMONWEALTH OF VIRGINIA
CONSTRUCTION UTILIZATION ANALYSIS OF PRIME CONTRACTORS BASED ON CARS
DOLLARS AND PERCENTAGE OF TOTAL DOLLARS PAID BY AGENCY NAME AND RACE/ETHNICITY/GENDER CLASSIFICATION
JULY 1, 2005, THROUGH JUNE 30, 2009
Agency African Hispanic Asian Native Nonminority M/WBE Non-M/WBE Total
Description Americans Americans Americans Americans Women Firms Firms Dollars
$ %1$ %1
$ %1$ %1
$ %1$ %1
$ %1$
Department of Corrections $643,646.38 0.18% $11,387.36 0.00% $593,586.16 0.16% $10,175.69 0.00% $959,167.76 0.27% $2,217,963.35 0.61% $359,578,344.52 99.39% $361,796,307.87
Department of Criminal Justice Services $0.00 0.00% $0.00 0.00% $0.00 0.00% $0.00 0.00% $0.00 0.00% $0.00 0.00% $28,245.71 100.00% $28,245.71
Department of Education $0.00 0.00% $0.00 0.00% $0.00 0.00% $0.00 0.00% $10,601.00 99.00% $10,601.00 99.00% $107.21 1.00% $10,708.21
Department of Emergency Management $187,519.52 15.68% $0.00 0.00% $0.00 0.00% $0.00 0.00% $0.00 0.00% $187,519.52 15.68% $1,008,645.69 84.32% $1,196,165.21
Department of Employment Dispute Resolution $0.00 0.00% $0.00 0.00% $0.00 0.00% $0.00 0.00% $0.00 0.00% $0.00 0.00% $7,550.90 100.00% $7,550.90
Department of Environmental Quality $684.14 0.45% $0.00 0.00% $0.00 0.00% $0.00 0.00% $1,516.50 1.00% $2,200.64 1.45% $149,811.04 98.55% $152,011.68
Department of Fire Programs $0.00 0.00% $0.00 0.00% $0.00 0.00% $0.00 0.00% $0.00 0.00% $0.00 0.00% $38,193.40 100.00% $38,193.40
Department of Forensic Science $64,524.75 0.10% $0.00 0.00% $323,322.32 0.51% $0.00 0.00% $0.00 0.00% $387,847.07 0.61% $63,230,189.92 99.39% $63,618,036.99
Department of Forestry $40,023.94 3.17% $1,170.00 0.09% $414.79 0.03% $0.00 0.00% $224.00 0.02% $41,832.73 3.31% $1,222,602.39 96.69% $1,264,435.12
Department of Game and Inland Fisheries $69,369.66 0.36% $18,304.35 0.10% $0.00 0.00% $0.00 0.00% $79,509.10 0.41% $167,183.11 0.87% $19,045,371.57 99.13% $19,212,554.68
Department of General Services $1,301,066.11 1.86% $65,600.80 0.09% $1,211.58 0.00% $786.00 0.00% $637,067.86 0.91% $2,005,732.35 2.87% $67,763,564.70 97.13% $69,769,297.05
Department of Health $4,835.00 0.41% $0.00 0.00% $0.00 0.00% $0.00 0.00% $5,443.97 0.46% $10,278.97 0.86% $1,178,610.19 99.14% $1,188,889.16
Department of Health Professions $0.00 0.00% $0.00 0.00% $0.00 0.00% $0.00 0.00% $0.00 0.00% $0.00 0.00% $482.49 100.00% $482.49
Department of Historic Resources $0.00 0.00% $0.00 0.00% $0.00 0.00% $0.00 0.00% $0.00 0.00% $0.00 0.00% $7,776.05 100.00% $7,776.05
Department of Housing and Community Development $26,985.62 92.18% $0.00 0.00% $0.00 0.00% $0.00 0.00% $0.00 0.00% $26,985.62 92.18% $2,289.42 7.82% $29,275.04
Department of Human Resource Management $0.00 0.00% $0.00 0.00% $0.00 0.00% $0.00 0.00% $0.00 0.00% $0.00 0.00% $10,574.49 100.00% $10,574.49
Department of Juvenile Justice $40,671.73 0.31% $9,750.00 0.07% $22,035.13 0.17% $0.00 0.00% $911,869.40 6.89% $984,326.26 7.44% $12,242,056.54 92.56% $13,226,382.80
Department of Labor and Industry $0.00 0.00% $0.00 0.00% $0.00 0.00% $0.00 0.00% $0.00 0.00% $0.00 0.00% $5,733.12 100.00% $5,733.12
Department of Medical Assistance Services $0.00 0.00% $0.00 0.00% $0.00 0.00% $0.00 0.00% $0.00 0.00% $0.00 0.00% $176,175.12 100.00% $176,175.12
Department of Military Affairs $1,502,059.04 2.68% $775,052.90 1.38% $0.00 0.00% $126,752.60 0.23% $1,465,487.30 2.61% $3,869,351.84 6.90% $52,209,178.94 93.10% $56,078,530.78
Department of Mines, Minerals and Energy $5,700.00 2.63% $0.00 0.00% $0.00 0.00% $0.00 0.00% $0.00 0.00% $5,700.00 2.63% $211,193.97 97.37% $216,893.97
Department of Minority Business Enterprise $1,675.03 10.67% $0.00 0.00% $0.00 0.00% $0.00 0.00% $0.00 0.00% $1,675.03 10.67% $14,024.81 89.33% $15,699.84
Department of Motor Vehicles $165,512.99 1.28% $692.40 0.01% $0.00 0.00% $5,954.24 0.05% $25,031.31 0.19% $197,190.94 1.52% $12,761,558.50 98.48% $12,958,749.44
Department of Professional and Occupational Regulation $0.00 0.00% $0.00 0.00% $0.00 0.00% $0.00 0.00% $0.00 0.00% $0.00 0.00% $16,221.56 100.00% $16,221.56
Department of Rehabilitative Services $2,550.00 0.21% $0.00 0.00% $0.00 0.00% $0.00 0.00% $0.00 0.00% $2,550.00 0.21% $1,210,420.03 99.79% $1,212,970.03
Department of Social Services $0.00 0.00% $0.00 0.00% $225.00 0.15% $0.00 0.00% $0.00 0.00% $225.00 0.15% $153,040.08 99.85% $153,265.08
Department of State Police $161,643.33 1.10% $8,332.93 0.06% $0.00 0.00% $10,240.00 0.07% $3,840.10 0.03% $184,056.36 1.25% $14,506,864.04 98.75% $14,690,920.40
Department of Taxation $0.00 0.00% $0.00 0.00% $0.00 0.00% $0.00 0.00% $0.00 0.00% $0.00 0.00% $175,407.06 100.00% $175,407.06
Department of the Treasury $0.00 0.00% $0.00 0.00% $0.00 0.00% $0.00 0.00% $0.00 0.00% $0.00 0.00% $3,997.00 100.00% $3,997.00
Department of Veterans Services $0.00 0.00% $448,246.07 1.84% $0.00 0.00% $1,500.00 0.01% $441,019.18 1.81% $890,765.25 3.66% $23,476,984.19 96.34% $24,367,749.44

Prime Contractor Utilization Based On The Commonwealth Accounting and Reporting System (CARS)
Page N-3
EXHIBIT N-1 (Continued) COMMONWEALTH OF VIRGINIA
CONSTRUCTION UTILIZATION ANALYSIS OF PRIME CONTRACTORS BASED ON CARS
DOLLARS AND PERCENTAGE OF TOTAL DOLLARS PAID BY AGENCY NAME AND RACE/ETHNICITY/GENDER CLASSIFICATION
JULY 1, 2005, THROUGH JUNE 30, 2009
Agency African Hispanic Asian Native Nonminority M/WBE Non-M/WBE Total
Description Americans Americans Americans Americans Women Firms Firms Dollars
$ %1$ %1
$ %1$ %1
$ %1$ %1
$ %1$
Dept. of Mental Health, Mental Retardation and Substance Abuse Services $42,643.11 0.03% $6,779.94 0.00% $16,405.06 0.01% $45,378.64 0.03% $48,644.22 0.03% $159,850.97 0.10% $159,993,372.54 99.90% $160,153,223.51
Eastern Shore Community College $0.00 0.00% $0.00 0.00% $0.00 0.00% $1,179.70 0.02% $0.00 0.00% $1,179.70 0.02% $6,307,037.41 99.98% $6,308,217.11
Frontier Culture Museum of Virginia $0.00 0.00% $0.00 0.00% $0.00 0.00% $0.00 0.00% $0.00 0.00% $0.00 0.00% $2,304,430.71 100.00% $2,304,430.71
Germanna Community College $4,950.00 0.10% $525.00 0.01% $0.00 0.00% $0.00 0.00% $0.00 0.00% $5,475.00 0.11% $4,834,120.23 99.89% $4,839,595.23
Gunston Hall $0.00 0.00% $0.00 0.00% $0.00 0.00% $0.00 0.00% $0.00 0.00% $0.00 0.00% $453,878.33 100.00% $453,878.33
J. Sargeant Reynolds Community College $17,206.71 0.09% $0.00 0.00% $354.90 0.00% $0.00 0.00% $37,669.05 0.20% $55,230.66 0.30% $18,382,501.08 99.70% $18,437,731.74
Jamestown-Yorktown Foundation $138,207.00 1.38% $0.00 0.00% $0.00 0.00% $0.00 0.00% $0.00 0.00% $138,207.00 1.38% $9,868,407.32 98.62% $10,006,614.32
John Tyler Community College $597,526.12 2.74% $0.00 0.00% $68.50 0.00% $0.00 0.00% $126.00 0.00% $597,720.62 2.74% $21,206,020.94 97.26% $21,803,741.56
Longwood University $380,281.00 0.58% $220.00 0.00% $703.21 0.00% $0.00 0.00% $0.00 0.00% $381,204.21 0.58% $65,347,015.02 99.42% $65,728,219.23
Lord Fairfax Community College $1,530.00 0.01% $0.00 0.00% $5,949.28 0.05% $0.00 0.00% $0.00 0.00% $7,479.28 0.06% $11,888,202.69 99.94% $11,895,681.97
Marine Resources Commission $0.00 0.00% $0.00 0.00% $0.00 0.00% $0.00 0.00% $0.00 0.00% $0.00 0.00% $105,299.82 100.00% $105,299.82
Motor Vehicle Dealer Board $0.00 0.00% $0.00 0.00% $0.00 0.00% $0.00 0.00% $0.00 0.00% $0.00 0.00% $506.63 100.00% $506.63
Mountain Empire Community College $0.00 0.00% $0.00 0.00% $0.00 0.00% $0.00 0.00% $0.00 0.00% $0.00 0.00% $346,636.51 100.00% $346,636.51
New River Community College $0.00 0.00% $0.00 0.00% $318.75 0.02% $0.00 0.00% $0.00 0.00% $318.75 0.02% $1,440,313.78 99.98% $1,440,632.53
Norfolk State University $1,825,417.38 2.46% $4,299,078.92 5.78% $23,055.62 0.03% $14,572.04 0.02% $23,678.39 0.03% $6,185,802.35 8.32% $68,163,999.87 91.68% $74,349,802.22
Northern Virginia Community College $512,426.34 0.87% $453,443.97 0.77% $6,016.90 0.01% $483,351.86 0.82% $0.00 0.00% $1,455,239.07 2.47% $57,457,304.26 97.53% $58,912,543.33
Patrick Henry Community College $0.00 0.00% $0.00 0.00% $0.00 0.00% $0.00 0.00% $40.00 0.00% $40.00 0.00% $5,014,155.85 100.00% $5,014,195.85
Paul D. Camp Community College $0.00 0.00% $10,533.00 17.34% $0.00 0.00% $0.00 0.00% $4,451.40 7.33% $14,984.40 24.67% $45,745.26 75.33% $60,729.66
Piedmont Virginia Community College $0.00 0.00% $0.00 0.00% $0.00 0.00% $0.00 0.00% $3,550.08 0.05% $3,550.08 0.05% $6,994,522.15 99.95% $6,998,072.23
Rappahannock Community College $5,908.90 0.75% $0.00 0.00% $0.00 0.00% $0.00 0.00% $0.00 0.00% $5,908.90 0.75% $778,889.86 99.25% $784,798.76
Richard Bland College $65,024.00 1.00% $0.00 0.00% $0.00 0.00% $0.00 0.00% $0.00 0.00% $65,024.00 1.00% $6,407,883.94 99.00% $6,472,907.94
Southern Virginia Higher Eduation Center $0.00 0.00% $0.00 0.00% $0.00 0.00% $0.00 0.00% $0.00 0.00% $0.00 0.00% $4,874.75 100.00% $4,874.75
Southside Virginia Community College $3,432.00 0.15% $0.00 0.00% $0.00 0.00% $0.00 0.00% $0.00 0.00% $3,432.00 0.15% $2,317,926.16 99.85% $2,321,358.16
Southwest Virginia Community College $0.00 0.00% $0.00 0.00% $0.00 0.00% $0.00 0.00% $0.00 0.00% $0.00 0.00% $9,865,963.95 100.00% $9,865,963.95
State Corporation Commission $0.00 0.00% $0.00 0.00% $0.00 0.00% $0.00 0.00% $0.00 0.00% $0.00 0.00% $681,869.33 100.00% $681,869.33
State Lottery Department $0.00 0.00% $0.00 0.00% $0.00 0.00% $0.00 0.00% $0.00 0.00% $0.00 0.00% $664,119.63 100.00% $664,119.63
The Library of Virginia $0.00 0.00% $0.00 0.00% $0.00 0.00% $0.00 0.00% $0.00 0.00% $0.00 0.00% $160,643.03 100.00% $160,643.03
The Science Museum of Virginia $7,574.46 0.15% $0.00 0.00% $2,093.35 0.04% $1,680.00 0.03% $0.00 0.00% $11,347.81 0.23% $4,987,452.49 99.77% $4,998,800.30
Thomas Nelson Community College $5,076.41 0.02% $0.00 0.00% $67.00 0.00% $0.00 0.00% $6,170.00 0.02% $11,313.41 0.04% $25,317,009.12 99.96% $25,328,322.53
Tidewater Community College $24,669.27 0.04% $750.00 0.00% $1,498.25 0.00% $0.00 0.00% $96,751.24 0.16% $123,668.76 0.21% $59,811,495.72 99.79% $59,935,164.48

Prime Contractor Utilization Based On The Commonwealth Accounting and Reporting System (CARS)
Page N-4
EXHIBIT N-1 (Continued) COMMONWEALTH OF VIRGINIA
CONSTRUCTION UTILIZATION ANALYSIS OF PRIME CONTRACTORS BASED ON CARS
DOLLARS AND PERCENTAGE OF TOTAL DOLLARS PAID BY AGENCY NAME AND RACE/ETHNICITY/GENDER CLASSIFICATION
JULY 1, 2005, THROUGH JUNE 30, 2009
Agency African Hispanic Asian Native Nonminority M/WBE Non-M/WBE Total
Description Americans Americans Americans Americans Women Firms Firms Dollars
$ %1$ %1
$ %1$ %1
$ %1$ %1
$ %1$
Virginia Employment Commission $15,524.76 0.79% $0.00 0.00% $0.00 0.00% $0.00 0.00% $762.25 0.04% $16,287.01 0.82% $1,959,611.93 99.18% $1,975,898.94
Virginia Highlands Community College $0.00 0.00% $0.00 0.00% $0.00 0.00% $0.00 0.00% $0.00 0.00% $0.00 0.00% $1,415,789.85 100.00% $1,415,789.85
Virginia Information Technologies Agency $6,025.66 0.20% $568.03 0.02% $169,841.45 5.64% $0.00 0.00% $45,788.64 1.52% $222,223.78 7.38% $2,790,873.49 92.62% $3,013,097.27
Virginia Military Institute $0.00 0.00% $0.00 0.00% $9,536.00 0.54% $5,792.01 0.33% $2,176.10 0.12% $17,504.11 1.00% $1,739,580.26 99.00% $1,757,084.37
Virginia Museum of Fine Arts $10,416.58 0.01% $0.00 0.00% $0.00 0.00% $0.00 0.00% $920.00 0.00% $11,336.58 0.01% $77,777,522.18 99.99% $77,788,858.76
Virginia Museum of Natural History $400.00 0.24% $0.00 0.00% $0.00 0.00% $0.00 0.00% $0.00 0.00% $400.00 0.24% $167,488.03 99.76% $167,888.03
Virginia Racing Commission $0.00 0.00% $0.00 0.00% $0.00 0.00% $0.00 0.00% $0.00 0.00% $0.00 0.00% $776.77 100.00% $776.77
Virginia School for Deaf and Blind at Staunton $0.00 0.00% $0.00 0.00% $0.00 0.00% $0.00 0.00% $0.00 0.00% $0.00 0.00% $1,027,354.20 100.00% $1,027,354.20
Virginia School for Deaf, Blind and Multi-Disabled at Hampton $315.00 0.04% $0.00 0.00% $0.00 0.00% $0.00 0.00% $0.00 0.00% $315.00 0.04% $833,417.59 99.96% $833,732.59
Virginia State University $125,089.70 0.23% $5,312,097.40 9.73% $11,080.64 0.02% $0.00 0.00% $1,041,092.04 1.91% $6,489,359.78 11.88% $48,129,857.29 88.12% $54,619,217.07
Virginia Tobacco Settlement Foundation $0.00 0.00% $0.00 0.00% $0.00 0.00% $0.00 0.00% $0.00 0.00% $0.00 0.00% $7,336.50 100.00% $7,336.50
Virginia Western Community College $0.00 0.00% $0.00 0.00% $0.00 0.00% $0.00 0.00% $0.00 0.00% $0.00 0.00% $9,011,075.74 100.00% $9,011,075.74
Virginia Workers' Compensation Commission $983.50 0.21% $0.00 0.00% $0.00 0.00% $0.00 0.00% $0.00 0.00% $983.50 0.21% $466,840.30 99.79% $467,823.80
Wytheville Community College $475.00 0.02% $0.00 0.00% $0.00 0.00% $0.00 0.00% $0.00 0.00% $475.00 0.02% $3,106,443.35 99.98% $3,106,918.35
Total $8,820,284.87 0.58% $11,520,764.87 0.75% $1,337,691.40 0.09% $752,452.10 0.05% $6,271,315.12 0.41% $28,702,508.36 1.87% $1,505,044,552.75 98.13% $1,533,747,061.11 Source: MGT developed a payment (based on CARS data) and vendor database for the Commonwealth from July1, 2005, through June 30, 2009. 1
Percent of total dollars paid to firms.
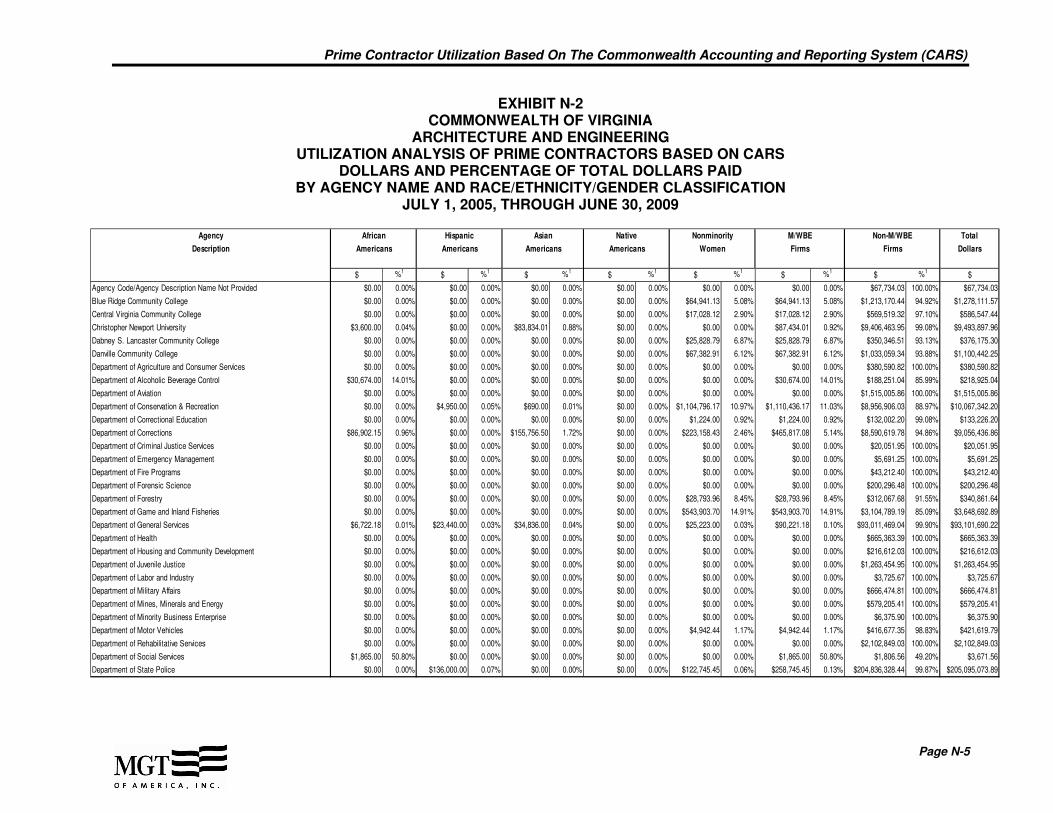
Prime Contractor Utilization Based On The Commonwealth Accounting and Reporting System (CARS)
Page N-5
EXHIBIT N-2 COMMONWEALTH OF VIRGINIA
ARCHITECTURE AND ENGINEERING UTILIZATION ANALYSIS OF PRIME CONTRACTORS BASED ON CARS
DOLLARS AND PERCENTAGE OF TOTAL DOLLARS PAID BY AGENCY NAME AND RACE/ETHNICITY/GENDER CLASSIFICATION
JULY 1, 2005, THROUGH JUNE 30, 2009
Agency African Hispanic Asian Native Nonminority M/WBE Non-M/WBE Total
Description Americans Americans Americans Americans Women Firms Firms Dollars
$ %1$ %1
$ %1$ %1
$ %1$ %1
$ %1$
Agency Code/Agency Description Name Not Provided $0.00 0.00% $0.00 0.00% $0.00 0.00% $0.00 0.00% $0.00 0.00% $0.00 0.00% $67,734.03 100.00% $67,734.03
Blue Ridge Community College $0.00 0.00% $0.00 0.00% $0.00 0.00% $0.00 0.00% $64,941.13 5.08% $64,941.13 5.08% $1,213,170.44 94.92% $1,278,111.57
Central Virginia Community College $0.00 0.00% $0.00 0.00% $0.00 0.00% $0.00 0.00% $17,028.12 2.90% $17,028.12 2.90% $569,519.32 97.10% $586,547.44
Christopher Newport University $3,600.00 0.04% $0.00 0.00% $83,834.01 0.88% $0.00 0.00% $0.00 0.00% $87,434.01 0.92% $9,406,463.95 99.08% $9,493,897.96
Dabney S. Lancaster Community College $0.00 0.00% $0.00 0.00% $0.00 0.00% $0.00 0.00% $25,828.79 6.87% $25,828.79 6.87% $350,346.51 93.13% $376,175.30
Danville Community College $0.00 0.00% $0.00 0.00% $0.00 0.00% $0.00 0.00% $67,382.91 6.12% $67,382.91 6.12% $1,033,059.34 93.88% $1,100,442.25
Department of Agriculture and Consumer Services $0.00 0.00% $0.00 0.00% $0.00 0.00% $0.00 0.00% $0.00 0.00% $0.00 0.00% $380,590.82 100.00% $380,590.82
Department of Alcoholic Beverage Control $30,674.00 14.01% $0.00 0.00% $0.00 0.00% $0.00 0.00% $0.00 0.00% $30,674.00 14.01% $188,251.04 85.99% $218,925.04
Department of Aviation $0.00 0.00% $0.00 0.00% $0.00 0.00% $0.00 0.00% $0.00 0.00% $0.00 0.00% $1,515,005.86 100.00% $1,515,005.86
Department of Conservation & Recreation $0.00 0.00% $4,950.00 0.05% $690.00 0.01% $0.00 0.00% $1,104,796.17 10.97% $1,110,436.17 11.03% $8,956,906.03 88.97% $10,067,342.20
Department of Correctional Education $0.00 0.00% $0.00 0.00% $0.00 0.00% $0.00 0.00% $1,224.00 0.92% $1,224.00 0.92% $132,002.20 99.08% $133,226.20
Department of Corrections $86,902.15 0.96% $0.00 0.00% $155,756.50 1.72% $0.00 0.00% $223,158.43 2.46% $465,817.08 5.14% $8,590,619.78 94.86% $9,056,436.86
Department of Criminal Justice Services $0.00 0.00% $0.00 0.00% $0.00 0.00% $0.00 0.00% $0.00 0.00% $0.00 0.00% $20,051.95 100.00% $20,051.95
Department of Emergency Management $0.00 0.00% $0.00 0.00% $0.00 0.00% $0.00 0.00% $0.00 0.00% $0.00 0.00% $5,691.25 100.00% $5,691.25
Department of Fire Programs $0.00 0.00% $0.00 0.00% $0.00 0.00% $0.00 0.00% $0.00 0.00% $0.00 0.00% $43,212.40 100.00% $43,212.40
Department of Forensic Science $0.00 0.00% $0.00 0.00% $0.00 0.00% $0.00 0.00% $0.00 0.00% $0.00 0.00% $200,296.48 100.00% $200,296.48
Department of Forestry $0.00 0.00% $0.00 0.00% $0.00 0.00% $0.00 0.00% $28,793.96 8.45% $28,793.96 8.45% $312,067.68 91.55% $340,861.64
Department of Game and Inland Fisheries $0.00 0.00% $0.00 0.00% $0.00 0.00% $0.00 0.00% $543,903.70 14.91% $543,903.70 14.91% $3,104,789.19 85.09% $3,648,692.89
Department of General Services $6,722.18 0.01% $23,440.00 0.03% $34,836.00 0.04% $0.00 0.00% $25,223.00 0.03% $90,221.18 0.10% $93,011,469.04 99.90% $93,101,690.22
Department of Health $0.00 0.00% $0.00 0.00% $0.00 0.00% $0.00 0.00% $0.00 0.00% $0.00 0.00% $665,363.39 100.00% $665,363.39
Department of Housing and Community Development $0.00 0.00% $0.00 0.00% $0.00 0.00% $0.00 0.00% $0.00 0.00% $0.00 0.00% $216,612.03 100.00% $216,612.03
Department of Juvenile Justice $0.00 0.00% $0.00 0.00% $0.00 0.00% $0.00 0.00% $0.00 0.00% $0.00 0.00% $1,263,454.95 100.00% $1,263,454.95
Department of Labor and Industry $0.00 0.00% $0.00 0.00% $0.00 0.00% $0.00 0.00% $0.00 0.00% $0.00 0.00% $3,725.67 100.00% $3,725.67
Department of Military Affairs $0.00 0.00% $0.00 0.00% $0.00 0.00% $0.00 0.00% $0.00 0.00% $0.00 0.00% $666,474.81 100.00% $666,474.81
Department of Mines, Minerals and Energy $0.00 0.00% $0.00 0.00% $0.00 0.00% $0.00 0.00% $0.00 0.00% $0.00 0.00% $579,205.41 100.00% $579,205.41
Department of Minority Business Enterprise $0.00 0.00% $0.00 0.00% $0.00 0.00% $0.00 0.00% $0.00 0.00% $0.00 0.00% $6,375.90 100.00% $6,375.90
Department of Motor Vehicles $0.00 0.00% $0.00 0.00% $0.00 0.00% $0.00 0.00% $4,942.44 1.17% $4,942.44 1.17% $416,677.35 98.83% $421,619.79
Department of Rehabilitative Services $0.00 0.00% $0.00 0.00% $0.00 0.00% $0.00 0.00% $0.00 0.00% $0.00 0.00% $2,102,849.03 100.00% $2,102,849.03
Department of Social Services $1,865.00 50.80% $0.00 0.00% $0.00 0.00% $0.00 0.00% $0.00 0.00% $1,865.00 50.80% $1,806.56 49.20% $3,671.56
Department of State Police $0.00 0.00% $136,000.00 0.07% $0.00 0.00% $0.00 0.00% $122,745.45 0.06% $258,745.45 0.13% $204,836,328.44 99.87% $205,095,073.89
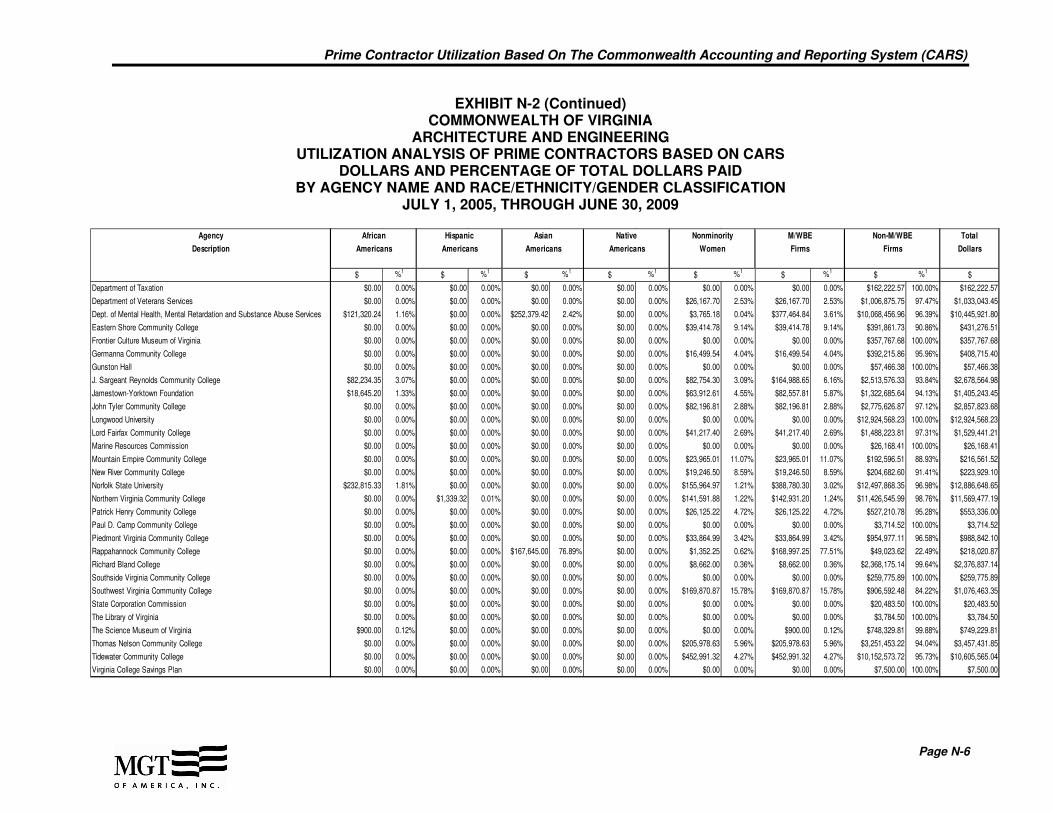
Prime Contractor Utilization Based On The Commonwealth Accounting and Reporting System (CARS)
Page N-6
EXHIBIT N-2 (Continued) COMMONWEALTH OF VIRGINIA
ARCHITECTURE AND ENGINEERING UTILIZATION ANALYSIS OF PRIME CONTRACTORS BASED ON CARS
DOLLARS AND PERCENTAGE OF TOTAL DOLLARS PAID BY AGENCY NAME AND RACE/ETHNICITY/GENDER CLASSIFICATION
JULY 1, 2005, THROUGH JUNE 30, 2009
Agency African Hispanic Asian Native Nonminority M/WBE Non-M/WBE Total
Description Americans Americans Americans Americans Women Firms Firms Dollars
$ %1$ %1
$ %1$ %1
$ %1$ %1
$ %1$
Department of Taxation $0.00 0.00% $0.00 0.00% $0.00 0.00% $0.00 0.00% $0.00 0.00% $0.00 0.00% $162,222.57 100.00% $162,222.57
Department of Veterans Services $0.00 0.00% $0.00 0.00% $0.00 0.00% $0.00 0.00% $26,167.70 2.53% $26,167.70 2.53% $1,006,875.75 97.47% $1,033,043.45
Dept. of Mental Health, Mental Retardation and Substance Abuse Services $121,320.24 1.16% $0.00 0.00% $252,379.42 2.42% $0.00 0.00% $3,765.18 0.04% $377,464.84 3.61% $10,068,456.96 96.39% $10,445,921.80
Eastern Shore Community College $0.00 0.00% $0.00 0.00% $0.00 0.00% $0.00 0.00% $39,414.78 9.14% $39,414.78 9.14% $391,861.73 90.86% $431,276.51
Frontier Culture Museum of Virginia $0.00 0.00% $0.00 0.00% $0.00 0.00% $0.00 0.00% $0.00 0.00% $0.00 0.00% $357,767.68 100.00% $357,767.68
Germanna Community College $0.00 0.00% $0.00 0.00% $0.00 0.00% $0.00 0.00% $16,499.54 4.04% $16,499.54 4.04% $392,215.86 95.96% $408,715.40
Gunston Hall $0.00 0.00% $0.00 0.00% $0.00 0.00% $0.00 0.00% $0.00 0.00% $0.00 0.00% $57,466.38 100.00% $57,466.38
J. Sargeant Reynolds Community College $82,234.35 3.07% $0.00 0.00% $0.00 0.00% $0.00 0.00% $82,754.30 3.09% $164,988.65 6.16% $2,513,576.33 93.84% $2,678,564.98
Jamestown-Yorktown Foundation $18,645.20 1.33% $0.00 0.00% $0.00 0.00% $0.00 0.00% $63,912.61 4.55% $82,557.81 5.87% $1,322,685.64 94.13% $1,405,243.45
John Tyler Community College $0.00 0.00% $0.00 0.00% $0.00 0.00% $0.00 0.00% $82,196.81 2.88% $82,196.81 2.88% $2,775,626.87 97.12% $2,857,823.68
Longwood University $0.00 0.00% $0.00 0.00% $0.00 0.00% $0.00 0.00% $0.00 0.00% $0.00 0.00% $12,924,568.23 100.00% $12,924,568.23
Lord Fairfax Community College $0.00 0.00% $0.00 0.00% $0.00 0.00% $0.00 0.00% $41,217.40 2.69% $41,217.40 2.69% $1,488,223.81 97.31% $1,529,441.21
Marine Resources Commission $0.00 0.00% $0.00 0.00% $0.00 0.00% $0.00 0.00% $0.00 0.00% $0.00 0.00% $26,168.41 100.00% $26,168.41
Mountain Empire Community College $0.00 0.00% $0.00 0.00% $0.00 0.00% $0.00 0.00% $23,965.01 11.07% $23,965.01 11.07% $192,596.51 88.93% $216,561.52
New River Community College $0.00 0.00% $0.00 0.00% $0.00 0.00% $0.00 0.00% $19,246.50 8.59% $19,246.50 8.59% $204,682.60 91.41% $223,929.10
Norfolk State University $232,815.33 1.81% $0.00 0.00% $0.00 0.00% $0.00 0.00% $155,964.97 1.21% $388,780.30 3.02% $12,497,868.35 96.98% $12,886,648.65
Northern Virginia Community College $0.00 0.00% $1,339.32 0.01% $0.00 0.00% $0.00 0.00% $141,591.88 1.22% $142,931.20 1.24% $11,426,545.99 98.76% $11,569,477.19
Patrick Henry Community College $0.00 0.00% $0.00 0.00% $0.00 0.00% $0.00 0.00% $26,125.22 4.72% $26,125.22 4.72% $527,210.78 95.28% $553,336.00
Paul D. Camp Community College $0.00 0.00% $0.00 0.00% $0.00 0.00% $0.00 0.00% $0.00 0.00% $0.00 0.00% $3,714.52 100.00% $3,714.52
Piedmont Virginia Community College $0.00 0.00% $0.00 0.00% $0.00 0.00% $0.00 0.00% $33,864.99 3.42% $33,864.99 3.42% $954,977.11 96.58% $988,842.10
Rappahannock Community College $0.00 0.00% $0.00 0.00% $167,645.00 76.89% $0.00 0.00% $1,352.25 0.62% $168,997.25 77.51% $49,023.62 22.49% $218,020.87
Richard Bland College $0.00 0.00% $0.00 0.00% $0.00 0.00% $0.00 0.00% $8,662.00 0.36% $8,662.00 0.36% $2,368,175.14 99.64% $2,376,837.14
Southside Virginia Community College $0.00 0.00% $0.00 0.00% $0.00 0.00% $0.00 0.00% $0.00 0.00% $0.00 0.00% $259,775.89 100.00% $259,775.89
Southwest Virginia Community College $0.00 0.00% $0.00 0.00% $0.00 0.00% $0.00 0.00% $169,870.87 15.78% $169,870.87 15.78% $906,592.48 84.22% $1,076,463.35
State Corporation Commission $0.00 0.00% $0.00 0.00% $0.00 0.00% $0.00 0.00% $0.00 0.00% $0.00 0.00% $20,483.50 100.00% $20,483.50
The Library of Virginia $0.00 0.00% $0.00 0.00% $0.00 0.00% $0.00 0.00% $0.00 0.00% $0.00 0.00% $3,784.50 100.00% $3,784.50
The Science Museum of Virginia $900.00 0.12% $0.00 0.00% $0.00 0.00% $0.00 0.00% $0.00 0.00% $900.00 0.12% $748,329.81 99.88% $749,229.81
Thomas Nelson Community College $0.00 0.00% $0.00 0.00% $0.00 0.00% $0.00 0.00% $205,978.63 5.96% $205,978.63 5.96% $3,251,453.22 94.04% $3,457,431.85
Tidewater Community College $0.00 0.00% $0.00 0.00% $0.00 0.00% $0.00 0.00% $452,991.32 4.27% $452,991.32 4.27% $10,152,573.72 95.73% $10,605,565.04
Virginia College Savings Plan $0.00 0.00% $0.00 0.00% $0.00 0.00% $0.00 0.00% $0.00 0.00% $0.00 0.00% $7,500.00 100.00% $7,500.00

Prime Contractor Utilization Based On The Commonwealth Accounting and Reporting System (CARS)
Page N-7
EXHIBIT N-2 (Continued) COMMONWEALTH OF VIRGINIA
ARCHITECTURE AND ENGINEERING UTILIZATION ANALYSIS OF PRIME CONTRACTORS BASED ON CARS
DOLLARS AND PERCENTAGE OF TOTAL DOLLARS PAID BY AGENCY NAME AND RACE/ETHNICITY/GENDER CLASSIFICATION
JULY 1, 2005, THROUGH JUNE 30, 2009
Agency African Hispanic Asian Native Nonminority M/WBE Non-M/WBE Total
Description Americans Americans Americans Americans Women Firms Firms Dollars
$ %1$ %1
$ %1$ %1
$ %1$ %1
$ %1$
Virginia Community College System $0.00 0.00% $0.00 0.00% $21,697.00 0.62% $0.00 0.00% $251,743.21 7.21% $273,440.21 7.84% $3,215,873.43 92.16% $3,489,313.64
Virginia Department for the Blind and Vision Impaired $176,831.66 19.74% $0.00 0.00% $522,193.20 58.29% $0.00 0.00% $0.00 0.00% $699,024.86 78.03% $196,768.07 21.97% $895,792.93
Virginia Employment Commission $0.00 0.00% $0.00 0.00% $0.00 0.00% $0.00 0.00% $0.00 0.00% $0.00 0.00% $1,462.43 100.00% $1,462.43
Virginia Highlands Community College $0.00 0.00% $0.00 0.00% $0.00 0.00% $0.00 0.00% $12,444.30 7.13% $12,444.30 7.13% $162,158.15 92.87% $174,602.45
Virginia Information Technologies Agency $0.00 0.00% $0.00 0.00% $0.00 0.00% $0.00 0.00% $0.00 0.00% $0.00 0.00% $447,748.66 100.00% $447,748.66
Virginia Military Institute $0.00 0.00% $0.00 0.00% $0.00 0.00% $0.00 0.00% $30,377.87 0.28% $30,377.87 0.28% $10,816,951.35 99.72% $10,847,329.22
Virginia Museum of Fine Arts $0.00 0.00% $0.00 0.00% $0.00 0.00% $0.00 0.00% $0.00 0.00% $0.00 0.00% $6,875,136.21 100.00% $6,875,136.21
Virginia Museum of Natural History $0.00 0.00% $0.00 0.00% $0.00 0.00% $0.00 0.00% $0.00 0.00% $0.00 0.00% $10,805,446.07 100.00% $10,805,446.07
Virginia School for Deaf and Blind at Staunton $0.00 0.00% $0.00 0.00% $0.00 0.00% $0.00 0.00% $0.00 0.00% $0.00 0.00% $7,302,145.00 100.00% $7,302,145.00
Virginia School for Deaf, Blind and Multi-Disabled at Hampton $0.00 0.00% $0.00 0.00% $0.00 0.00% $0.00 0.00% $0.00 0.00% $0.00 0.00% $24,066.00 100.00% $24,066.00
Virginia State University $23,572.00 0.28% $0.00 0.00% $3,279.50 0.04% $0.00 0.00% $0.00 0.00% $26,851.50 0.32% $8,304,496.98 99.68% $8,331,348.48
Virginia Western Community College $0.00 0.00% $0.00 0.00% $0.00 0.00% $0.00 0.00% $267.50 0.02% $267.50 0.02% $1,110,253.88 99.98% $1,110,521.38
Virginia Workers' Compensation Commission $0.00 0.00% $0.00 0.00% $0.00 0.00% $0.00 0.00% $0.00 0.00% $0.00 0.00% $27,500.00 100.00% $27,500.00
Wytheville Community College $0.00 0.00% $0.00 0.00% $0.00 0.00% $0.00 0.00% $33,543.31 5.81% $33,543.31 5.81% $544,230.05 94.19% $577,773.36
Total $786,082.11 0.17% $165,729.32 0.04% $1,242,310.63 0.26% $0.00 0.00% $4,153,886.25 0.88% $6,348,008.31 1.34% $466,757,361.09 98.66% $473,105,369.40 Source: MGT developed a payment (based on CARS data) and vendor database for the Commonwealth from July1, 2005, through June 30, 2009. 1
Percent of total dollars paid to firms.

Prime Contractor Utilization Based On The Commonwealth Accounting and Reporting System (CARS)
Page N-8
EXHIBIT N-3 COMMONWEALTH OF VIRGINIA
PROFESSIONAL SERVICES UTILIZATION ANALYSIS OF PRIME CONTRACTORS BASED ON CARS
DOLLARS AND PERCENTAGE OF TOTAL DOLLARS PAID BY AGENCY NAME AND RACE/ETHNICITY/GENDER CLASSIFICATION
JULY 1, 2005, THROUGH JUNE 30, 2009
Agency African Hispanic Asian Native Nonminority M/WBE Non-M/WBE Total
Description Americans Americans Americans Americans Women Firms Firms Dollars
$ %1$ %1
$ %1$ %1
$ %1$ %1
$ %1$
Agency Code/Agency Description Name Not Provided $20,132,558.21 4.25% $1,048,783.48 0.22% $10,029,886.12 2.11% $600.00 0.00% $40,840.94 0.01% $31,252,668.75 6.59% $443,000,766.79 93.41% $474,253,435.54
Attorney General and Department of Law $10,757.50 0.40% $0.00 0.00% $0.00 0.00% $0.00 0.00% $209.59 0.01% $10,967.09 0.41% $2,674,484.32 99.59% $2,685,451.41
Blue Ridge Community College $0.00 0.00% $0.00 0.00% $0.00 0.00% $0.00 0.00% $0.00 0.00% $0.00 0.00% $384,235.70 100.00% $384,235.70
Board of Accountancy $0.00 0.00% $0.00 0.00% $24,030.00 5.06% $0.00 0.00% $0.00 0.00% $24,030.00 5.06% $451,208.52 94.94% $475,238.52
Central Virginia Community College $60.00 0.01% $0.00 0.00% $0.00 0.00% $0.00 0.00% $0.00 0.00% $60.00 0.01% $779,351.68 99.99% $779,411.68
Christopher Newport University $10,207.20 0.14% $0.00 0.00% $105,726.98 1.42% $0.00 0.00% $0.00 0.00% $115,934.18 1.56% $7,305,488.03 98.44% $7,421,422.21
Commonwealth Attorneys' Services Council $0.00 0.00% $0.00 0.00% $0.00 0.00% $0.00 0.00% $0.00 0.00% $0.00 0.00% $33,450.92 100.00% $33,450.92
Compensation Board $3,286.00 0.71% $0.00 0.00% $4,400.00 0.95% $0.00 0.00% $89,649.00 19.38% $97,335.00 21.05% $365,138.16 78.95% $462,473.16
Comprehensive Services for At-Risk Youth and Families $96,794.75 37.92% $0.00 0.00% $0.00 0.00% $0.00 0.00% $0.00 0.00% $96,794.75 37.92% $158,470.48 62.08% $255,265.23
Dabney S. Lancaster Community College $0.00 0.00% $0.00 0.00% $0.00 0.00% $0.00 0.00% $0.00 0.00% $0.00 0.00% $67,792.11 100.00% $67,792.11
Danville Community College $0.00 0.00% $0.00 0.00% $0.00 0.00% $0.00 0.00% $0.00 0.00% $0.00 0.00% $210,009.45 100.00% $210,009.45
Department for the Aging $0.00 0.00% $0.00 0.00% $0.00 0.00% $0.00 0.00% $0.00 0.00% $0.00 0.00% $509,388.20 100.00% $509,388.20
Department for the Deaf & Hard-of-Hearing $784.00 0.22% $0.00 0.00% $2,907.00 0.80% $0.00 0.00% $1,240.00 0.34% $4,931.00 1.36% $357,121.80 98.64% $362,052.80
Department of Accounts $0.00 0.00% $0.00 0.00% $0.00 0.00% $0.00 0.00% $0.00 0.00% $0.00 0.00% $380,502.08 100.00% $380,502.08
Department of Agriculture and Consumer Services $90,417.82 3.14% $0.00 0.00% $916.66 0.03% $0.00 0.00% $3,313.22 0.12% $94,647.70 3.29% $2,782,151.80 96.71% $2,876,799.50
Department of Alcoholic Beverage Control $3,777.40 0.07% $0.00 0.00% $0.00 0.00% $0.00 0.00% $5,422.41 0.10% $9,199.81 0.17% $5,534,847.91 99.83% $5,544,047.72
Department of Aviation $0.00 0.00% $0.00 0.00% $0.00 0.00% $0.00 0.00% $0.00 0.00% $0.00 0.00% $842,203.87 100.00% $842,203.87
Department of Business Assistance $1,220.73 0.92% $0.00 0.00% $0.00 0.00% $0.00 0.00% $0.00 0.00% $1,220.73 0.92% $131,480.06 99.08% $132,700.79
Department of Charitable Gaming $9,679.02 23.86% $0.00 0.00% $0.00 0.00% $0.00 0.00% $138.00 0.34% $9,817.02 24.20% $30,748.16 75.80% $40,565.18
Department of Conservation & Recreation $885.50 0.02% $0.00 0.00% $0.00 0.00% $0.00 0.00% $579.39 0.01% $1,464.89 0.03% $4,188,584.00 99.97% $4,190,048.89
Department of Correctional Education $1,350.00 0.08% $0.00 0.00% $1,217.52 0.08% $0.00 0.00% $0.00 0.00% $2,567.52 0.16% $1,619,016.06 99.84% $1,621,583.58
Department of Corrections $10,872,276.37 2.12% $977,138.80 0.19% $4,294,938.16 0.84% $2,475.00 0.00% $1,605.48 0.00% $16,148,433.81 3.15% $496,704,832.29 96.85% $512,853,266.10
Department of Criminal Justice Services $14,960.00 0.35% $0.00 0.00% $0.00 0.00% $0.00 0.00% $595.00 0.01% $15,555.00 0.37% $4,233,298.62 99.63% $4,248,853.62
Department of Education $0.00 0.00% $90.00 0.00% $1,703,481.57 0.90% $0.00 0.00% $0.00 0.00% $1,703,571.57 0.90% $188,291,752.48 99.10% $189,995,324.05
Department of Emergency Management $1,500.00 0.11% $17,521.88 1.25% $0.00 0.00% $0.00 0.00% $0.00 0.00% $19,021.88 1.35% $1,385,331.44 98.65% $1,404,353.32
Department of Employment Dispute Resolution $0.00 0.00% $0.00 0.00% $0.00 0.00% $0.00 0.00% $0.00 0.00% $0.00 0.00% $9,230.37 100.00% $9,230.37
Department of Environmental Quality $229,214.14 3.09% $197,947.75 2.67% $508,967.00 6.86% $739.10 0.01% $4,999.00 0.07% $941,866.99 12.70% $6,472,301.84 87.30% $7,414,168.83
Department of Fire Programs $0.00 0.00% $0.00 0.00% $0.00 0.00% $0.00 0.00% $0.00 0.00% $0.00 0.00% $537,303.75 100.00% $537,303.75
Department of Forensic Science $0.00 0.00% $0.00 0.00% $64,043.02 4.53% $0.00 0.00% $0.00 0.00% $64,043.02 4.53% $1,350,103.73 95.47% $1,414,146.75
Department of Forestry $0.00 0.00% $0.00 0.00% $0.00 0.00% $0.00 0.00% $88,623.50 14.48% $88,623.50 14.48% $523,561.81 85.52% $612,185.31

Prime Contractor Utilization Based On The Commonwealth Accounting and Reporting System (CARS)
Page N-9
EXHIBIT N-3 (Continued) COMMONWEALTH OF VIRGINIA
PROFESSIONAL SERVICES UTILIZATION ANALYSIS OF PRIME CONTRACTORS BASED ON CARS
DOLLARS AND PERCENTAGE OF TOTAL DOLLARS PAID BY AGENCY NAME AND RACE/ETHNICITY/GENDER CLASSIFICATION
JULY 1, 2005, THROUGH JUNE 30, 2009
Agency African Hispanic Asian Native Nonminority M/WBE Non-M/WBE Total
Description Americans Americans Americans Americans Women Firms Firms Dollars
$ %1$ %1
$ %1$ %1
$ %1$ %1
$ %1$
Department of Game and Inland Fisheries $0.00 0.00% $0.00 0.00% $410,138.00 16.86% $0.00 0.00% $0.00 0.00% $410,138.00 16.86% $2,022,611.87 83.14% $2,432,749.87
Department of General Services $3,268.80 0.01% $18,847.63 0.04% $24,599.98 0.05% $0.00 0.00% $28,053.50 0.05% $74,769.91 0.15% $51,339,411.00 99.85% $51,414,180.91
Department of Health $150,311.53 0.16% $150,054.04 0.16% $593,193.77 0.63% $0.00 0.00% $366,252.53 0.39% $1,259,811.87 1.34% $92,452,164.23 98.66% $93,711,976.10
Department of Health Professions $0.00 0.00% $0.00 0.00% $0.00 0.00% $0.00 0.00% $15,559.50 0.87% $15,559.50 0.87% $1,779,059.70 99.13% $1,794,619.20
Department of Historic Resources $0.00 0.00% $0.00 0.00% $0.00 0.00% $0.00 0.00% $0.00 0.00% $0.00 0.00% $123,634.32 100.00% $123,634.32
Department of Housing and Community Development $238,452.67 7.56% $0.00 0.00% $400.00 0.01% $124,480.35 3.94% $6,323.14 0.20% $369,656.16 11.71% $2,786,402.84 88.29% $3,156,059.00
Department of Human Resource Management $0.00 0.00% $0.00 0.00% $5,552.64 0.53% $0.00 0.00% $0.00 0.00% $5,552.64 0.53% $1,033,139.90 99.47% $1,038,692.54
Department of Juvenile Justice $111,856.50 0.64% $12,345.00 0.07% $21,456.00 0.12% $8,390.00 0.05% $0.00 0.00% $154,047.50 0.88% $17,319,329.84 99.12% $17,473,377.34
Department of Labor and Industry $74.10 0.01% $0.00 0.00% $0.00 0.00% $0.00 0.00% $1,195.00 0.14% $1,269.10 0.15% $859,437.13 99.85% $860,706.23
Department of Medical Assistance Services $196,276.76 0.03% $0.00 0.00% $4,625.00 0.00% $0.00 0.00% $0.00 0.00% $200,901.76 0.04% $567,571,721.28 99.96% $567,772,623.04
Department of Military Affairs $0.00 0.00% $0.00 0.00% $0.00 0.00% $0.00 0.00% $0.00 0.00% $0.00 0.00% $1,279,914.15 100.00% $1,279,914.15
Department of Mines, Minerals and Energy $0.00 0.00% $0.00 0.00% $0.00 0.00% $0.00 0.00% $0.00 0.00% $0.00 0.00% $783,912.72 100.00% $783,912.72
Department of Minority Business Enterprise $74,164.12 20.22% $0.00 0.00% $64,900.00 17.70% $0.00 0.00% $0.00 0.00% $139,064.12 37.92% $227,685.57 62.08% $366,749.69
Department of Motor Vehicles $43,419.00 0.08% $506,382.74 0.93% $0.00 0.00% $0.00 0.00% $94,630.26 0.17% $644,432.00 1.19% $53,605,967.85 98.81% $54,250,399.85
Department of Planning and Budget $85,000.00 1.39% $0.00 0.00% $0.00 0.00% $0.00 0.00% $0.00 0.00% $85,000.00 1.39% $6,011,710.75 98.61% $6,096,710.75
Department of Professional and Occupational Regulation $890.00 0.08% $0.00 0.00% $0.00 0.00% $0.00 0.00% $0.00 0.00% $890.00 0.08% $1,058,954.68 99.92% $1,059,844.68
Department of Rehabilitative Services $23,738.07 0.05% $31,644.70 0.06% $410,931.68 0.84% $30.00 0.00% $136,557.91 0.28% $602,902.36 1.24% $48,199,334.05 98.76% $48,802,236.41
Department of Social Services $312,485.74 0.30% $41,760.46 0.04% $2,356,596.86 2.29% $0.00 0.00% $13,672.02 0.01% $2,724,515.08 2.64% $100,380,305.08 97.36% $103,104,820.16
Department of State Police $1,120.00 0.00% $225.00 0.00% $2,042,942.55 7.81% $0.00 0.00% $50,592.64 0.19% $2,094,880.19 8.00% $24,075,624.94 92.00% $26,170,505.13
Department of Taxation $0.00 0.00% $1,658.21 0.01% $54,660.00 0.45% $0.00 0.00% $14,050.00 0.12% $70,368.21 0.58% $11,968,863.84 99.42% $12,039,232.05
Department of the Treasury $306.20 0.00% $0.00 0.00% $0.00 0.00% $0.00 0.00% $0.00 0.00% $306.20 0.00% $10,449,819.57 100.00% $10,450,125.77
Department of Veterans Services $2,039.82 0.05% $2,450.00 0.06% $54,660.00 1.33% $0.00 0.00% $0.00 0.00% $59,149.82 1.44% $4,040,122.85 98.56% $4,099,272.67
Dept. of Mental Health, Mental Retardation and Substance Abuse Services $127,330.40 0.17% $1,666.50 0.00% $44,170.00 0.06% $0.00 0.00% $0.00 0.00% $173,166.90 0.23% $76,501,976.99 99.77% $76,675,143.89
Eastern Shore Community College $0.00 0.00% $0.00 0.00% $13,561.06 26.08% $0.00 0.00% $0.00 0.00% $13,561.06 26.08% $38,437.62 73.92% $51,998.68
Frontier Culture Museum of Virginia $0.00 0.00% $0.00 0.00% $0.00 0.00% $0.00 0.00% $0.00 0.00% $0.00 0.00% $166,778.01 100.00% $166,778.01
Germanna Community College $548.00 0.11% $0.00 0.00% $0.00 0.00% $0.00 0.00% $10,500.00 2.03% $11,048.00 2.13% $507,456.97 97.87% $518,504.97
Gunston Hall $0.00 0.00% $0.00 0.00% $0.00 0.00% $0.00 0.00% $0.00 0.00% $0.00 0.00% $2,920.93 100.00% $2,920.93
Human Rights Council $0.00 0.00% $0.00 0.00% $0.00 0.00% $0.00 0.00% $0.00 0.00% $0.00 0.00% $5,371.49 100.00% $5,371.49
J. Sargeant Reynolds Community College $4,817.00 0.25% $0.00 0.00% $1,990.00 0.10% $0.00 0.00% $0.00 0.00% $6,807.00 0.35% $1,956,330.37 99.65% $1,963,137.37
Jamestown-Yorktown Foundation $0.00 0.00% $0.00 0.00% $0.00 0.00% $0.00 0.00% $6,757.50 0.56% $6,757.50 0.56% $1,205,848.87 99.44% $1,212,606.37

Prime Contractor Utilization Based On The Commonwealth Accounting and Reporting System (CARS)
Page N-10
EXHIBIT N-3 (Continued) COMMONWEALTH OF VIRGINIA
PROFESSIONAL SERVICES UTILIZATION ANALYSIS OF PRIME CONTRACTORS BASED ON CARS
DOLLARS AND PERCENTAGE OF TOTAL DOLLARS PAID BY AGENCY NAME AND RACE/ETHNICITY/GENDER CLASSIFICATION
JULY 1, 2005, THROUGH JUNE 30, 2009
Agency African Hispanic Asian Native Nonminority M/WBE Non-M/WBE Total
Description Americans Americans Americans Americans Women Firms Firms Dollars
$ %1$ %1
$ %1$ %1
$ %1$ %1
$ %1$
John Tyler Community College $0.00 0.00% $0.00 0.00% $25,016.50 2.07% $0.00 0.00% $0.00 0.00% $25,016.50 2.07% $1,183,550.75 97.93% $1,208,567.25
Lieutenant Governor $0.00 0.00% $0.00 0.00% $0.00 0.00% $0.00 0.00% $0.00 0.00% $0.00 0.00% $8,097.17 100.00% $8,097.17
Longwood University $31,179.65 0.21% $0.00 0.00% $544,013.62 3.59% $0.00 0.00% $0.00 0.00% $575,193.27 3.80% $14,561,336.87 96.20% $15,136,530.14
Lord Fairfax Community College $0.00 0.00% $0.00 0.00% $20,925.07 3.37% $0.00 0.00% $0.00 0.00% $20,925.07 3.37% $599,424.48 96.63% $620,349.55
Marine Resources Commission $0.00 0.00% $0.00 0.00% $0.00 0.00% $0.00 0.00% $0.00 0.00% $0.00 0.00% $188,845.86 100.00% $188,845.86
Motor Vehicle Dealer Board $0.00 0.00% $0.00 0.00% $0.00 0.00% $0.00 0.00% $0.00 0.00% $0.00 0.00% $396,530.85 100.00% $396,530.85
Mountain Empire Community College $0.00 0.00% $0.00 0.00% $0.00 0.00% $0.00 0.00% $0.00 0.00% $0.00 0.00% $533,657.65 100.00% $533,657.65
New River Community College $0.00 0.00% $0.00 0.00% $0.00 0.00% $0.00 0.00% $0.00 0.00% $0.00 0.00% $700,672.04 100.00% $700,672.04
Norfolk State University $1,319,287.35 11.00% $6,700.88 0.06% $488,067.40 4.07% $0.00 0.00% $182.16 0.00% $1,814,237.79 15.13% $10,174,720.79 84.87% $11,988,958.58
Northern Virginia Community College $29,905.00 1.18% $0.00 0.00% $6,900.00 0.27% $4,625.00 0.18% $0.00 0.00% $41,430.00 1.64% $2,489,257.89 98.36% $2,530,687.89
Office for Substance Abuse Prevention $0.00 0.00% $0.00 0.00% $0.00 0.00% $0.00 0.00% $0.00 0.00% $0.00 0.00% $908,000.58 100.00% $908,000.58
Office of Commonwealth Preparedness $0.00 0.00% $0.00 0.00% $0.00 0.00% $0.00 0.00% $0.00 0.00% $0.00 0.00% $12,000.00 100.00% $12,000.00
Office of the Governor $0.00 0.00% $0.00 0.00% $0.00 0.00% $0.00 0.00% $0.00 0.00% $0.00 0.00% $22,795.13 100.00% $22,795.13
Patrick Henry Community College $0.00 0.00% $0.00 0.00% $0.00 0.00% $0.00 0.00% $0.00 0.00% $0.00 0.00% $1,622,289.38 100.00% $1,622,289.38
Paul D. Camp Community College $0.00 0.00% $0.00 0.00% $0.00 0.00% $0.00 0.00% $0.00 0.00% $0.00 0.00% $280,411.48 100.00% $280,411.48
Piedmont Virginia Community College $0.00 0.00% $0.00 0.00% $41,603.53 4.99% $0.00 0.00% $0.00 0.00% $41,603.53 4.99% $791,535.14 95.01% $833,138.67
Rappahannock Community College $0.00 0.00% $0.00 0.00% $0.00 0.00% $0.00 0.00% $0.00 0.00% $0.00 0.00% $525,434.13 100.00% $525,434.13
Richard Bland College $0.00 0.00% $0.00 0.00% $0.00 0.00% $0.00 0.00% $0.00 0.00% $0.00 0.00% $794,697.15 100.00% $794,697.15
Secretary of Administration $0.00 0.00% $0.00 0.00% $0.00 0.00% $0.00 0.00% $261.82 5.64% $261.82 5.64% $4,377.00 94.36% $4,638.82
Secretary of Commerce and Trade $0.00 0.00% $0.00 0.00% $0.00 0.00% $0.00 0.00% $0.00 0.00% $0.00 0.00% $303,549.51 100.00% $303,549.51
Secretary of Education $0.00 0.00% $0.00 0.00% $0.00 0.00% $0.00 0.00% $0.00 0.00% $0.00 0.00% $235,241.59 100.00% $235,241.59
Secretary of Finance $0.00 0.00% $0.00 0.00% $0.00 0.00% $0.00 0.00% $0.00 0.00% $0.00 0.00% $1,106.13 100.00% $1,106.13
Secretary of Health & Human Resources $0.00 0.00% $0.00 0.00% $0.00 0.00% $0.00 0.00% $0.00 0.00% $0.00 0.00% $241.98 100.00% $241.98
Secretary of Natural Resources $0.00 0.00% $0.00 0.00% $0.00 0.00% $0.00 0.00% $0.00 0.00% $0.00 0.00% $133,996.00 100.00% $133,996.00
Secretary of Public Safety $0.00 0.00% $0.00 0.00% $0.00 0.00% $0.00 0.00% $0.00 0.00% $0.00 0.00% $1,440.27 100.00% $1,440.27
Secretary of Technology $0.00 0.00% $0.00 0.00% $0.00 0.00% $0.00 0.00% $0.00 0.00% $0.00 0.00% $216,055.00 100.00% $216,055.00
Secretary of the Commonwealth $0.00 0.00% $0.00 0.00% $0.00 0.00% $0.00 0.00% $733.55 24.98% $733.55 24.98% $2,203.31 75.02% $2,936.86
Secretary of Transportation $0.00 0.00% $0.00 0.00% $0.00 0.00% $0.00 0.00% $0.00 0.00% $0.00 0.00% $338.00 100.00% $338.00
Southern Virginia Higher Eduation Center $0.00 0.00% $0.00 0.00% $15,775.09 8.57% $0.00 0.00% $0.00 0.00% $15,775.09 8.57% $168,355.89 91.43% $184,130.98
Southside Virginia Community College $0.00 0.00% $0.00 0.00% $0.00 0.00% $0.00 0.00% $0.00 0.00% $0.00 0.00% $252,145.99 100.00% $252,145.99
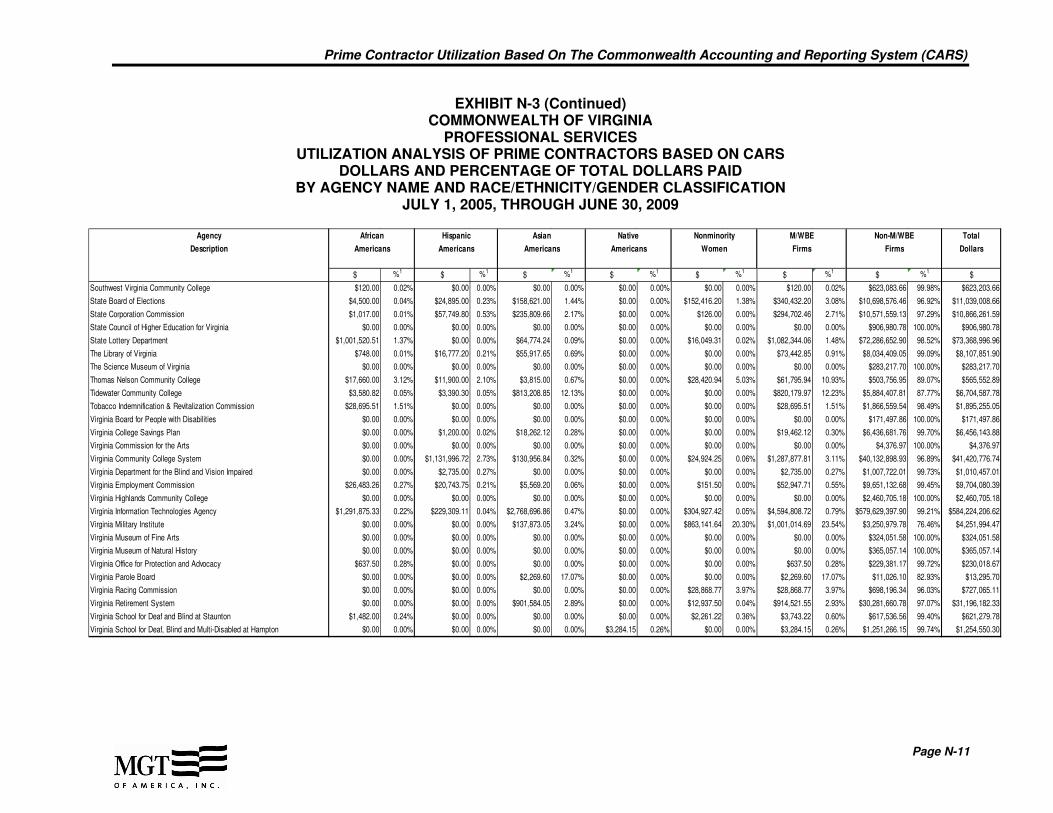
Prime Contractor Utilization Based On The Commonwealth Accounting and Reporting System (CARS)
Page N-11
EXHIBIT N-3 (Continued) COMMONWEALTH OF VIRGINIA
PROFESSIONAL SERVICES UTILIZATION ANALYSIS OF PRIME CONTRACTORS BASED ON CARS
DOLLARS AND PERCENTAGE OF TOTAL DOLLARS PAID BY AGENCY NAME AND RACE/ETHNICITY/GENDER CLASSIFICATION
JULY 1, 2005, THROUGH JUNE 30, 2009
Agency African Hispanic Asian Native Nonminority M/WBE Non-M/WBE Total
Description Americans Americans Americans Americans Women Firms Firms Dollars
$ %1$ %1
$ %1$ %1
$ %1$ %1
$ %1$
Southwest Virginia Community College $120.00 0.02% $0.00 0.00% $0.00 0.00% $0.00 0.00% $0.00 0.00% $120.00 0.02% $623,083.66 99.98% $623,203.66
State Board of Elections $4,500.00 0.04% $24,895.00 0.23% $158,621.00 1.44% $0.00 0.00% $152,416.20 1.38% $340,432.20 3.08% $10,698,576.46 96.92% $11,039,008.66
State Corporation Commission $1,017.00 0.01% $57,749.80 0.53% $235,809.66 2.17% $0.00 0.00% $126.00 0.00% $294,702.46 2.71% $10,571,559.13 97.29% $10,866,261.59
State Council of Higher Education for Virginia $0.00 0.00% $0.00 0.00% $0.00 0.00% $0.00 0.00% $0.00 0.00% $0.00 0.00% $906,980.78 100.00% $906,980.78
State Lottery Department $1,001,520.51 1.37% $0.00 0.00% $64,774.24 0.09% $0.00 0.00% $16,049.31 0.02% $1,082,344.06 1.48% $72,286,652.90 98.52% $73,368,996.96
The Library of Virginia $748.00 0.01% $16,777.20 0.21% $55,917.65 0.69% $0.00 0.00% $0.00 0.00% $73,442.85 0.91% $8,034,409.05 99.09% $8,107,851.90
The Science Museum of Virginia $0.00 0.00% $0.00 0.00% $0.00 0.00% $0.00 0.00% $0.00 0.00% $0.00 0.00% $283,217.70 100.00% $283,217.70
Thomas Nelson Community College $17,660.00 3.12% $11,900.00 2.10% $3,815.00 0.67% $0.00 0.00% $28,420.94 5.03% $61,795.94 10.93% $503,756.95 89.07% $565,552.89
Tidewater Community College $3,580.82 0.05% $3,390.30 0.05% $813,208.85 12.13% $0.00 0.00% $0.00 0.00% $820,179.97 12.23% $5,884,407.81 87.77% $6,704,587.78
Tobacco Indemnification & Revitalization Commission $28,695.51 1.51% $0.00 0.00% $0.00 0.00% $0.00 0.00% $0.00 0.00% $28,695.51 1.51% $1,866,559.54 98.49% $1,895,255.05
Virginia Board for People with Disabilities $0.00 0.00% $0.00 0.00% $0.00 0.00% $0.00 0.00% $0.00 0.00% $0.00 0.00% $171,497.86 100.00% $171,497.86
Virginia College Savings Plan $0.00 0.00% $1,200.00 0.02% $18,262.12 0.28% $0.00 0.00% $0.00 0.00% $19,462.12 0.30% $6,436,681.76 99.70% $6,456,143.88
Virginia Commission for the Arts $0.00 0.00% $0.00 0.00% $0.00 0.00% $0.00 0.00% $0.00 0.00% $0.00 0.00% $4,376.97 100.00% $4,376.97
Virginia Community College System $0.00 0.00% $1,131,996.72 2.73% $130,956.84 0.32% $0.00 0.00% $24,924.25 0.06% $1,287,877.81 3.11% $40,132,898.93 96.89% $41,420,776.74
Virginia Department for the Blind and Vision Impaired $0.00 0.00% $2,735.00 0.27% $0.00 0.00% $0.00 0.00% $0.00 0.00% $2,735.00 0.27% $1,007,722.01 99.73% $1,010,457.01
Virginia Employment Commission $26,483.26 0.27% $20,743.75 0.21% $5,569.20 0.06% $0.00 0.00% $151.50 0.00% $52,947.71 0.55% $9,651,132.68 99.45% $9,704,080.39
Virginia Highlands Community College $0.00 0.00% $0.00 0.00% $0.00 0.00% $0.00 0.00% $0.00 0.00% $0.00 0.00% $2,460,705.18 100.00% $2,460,705.18
Virginia Information Technologies Agency $1,291,875.33 0.22% $229,309.11 0.04% $2,768,696.86 0.47% $0.00 0.00% $304,927.42 0.05% $4,594,808.72 0.79% $579,629,397.90 99.21% $584,224,206.62
Virginia Military Institute $0.00 0.00% $0.00 0.00% $137,873.05 3.24% $0.00 0.00% $863,141.64 20.30% $1,001,014.69 23.54% $3,250,979.78 76.46% $4,251,994.47
Virginia Museum of Fine Arts $0.00 0.00% $0.00 0.00% $0.00 0.00% $0.00 0.00% $0.00 0.00% $0.00 0.00% $324,051.58 100.00% $324,051.58
Virginia Museum of Natural History $0.00 0.00% $0.00 0.00% $0.00 0.00% $0.00 0.00% $0.00 0.00% $0.00 0.00% $365,057.14 100.00% $365,057.14
Virginia Office for Protection and Advocacy $637.50 0.28% $0.00 0.00% $0.00 0.00% $0.00 0.00% $0.00 0.00% $637.50 0.28% $229,381.17 99.72% $230,018.67
Virginia Parole Board $0.00 0.00% $0.00 0.00% $2,269.60 17.07% $0.00 0.00% $0.00 0.00% $2,269.60 17.07% $11,026.10 82.93% $13,295.70
Virginia Racing Commission $0.00 0.00% $0.00 0.00% $0.00 0.00% $0.00 0.00% $28,868.77 3.97% $28,868.77 3.97% $698,196.34 96.03% $727,065.11
Virginia Retirement System $0.00 0.00% $0.00 0.00% $901,584.05 2.89% $0.00 0.00% $12,937.50 0.04% $914,521.55 2.93% $30,281,660.78 97.07% $31,196,182.33
Virginia School for Deaf and Blind at Staunton $1,482.00 0.24% $0.00 0.00% $0.00 0.00% $0.00 0.00% $2,261.22 0.36% $3,743.22 0.60% $617,536.56 99.40% $621,279.78
Virginia School for Deaf, Blind and Multi-Disabled at Hampton $0.00 0.00% $0.00 0.00% $0.00 0.00% $3,284.15 0.26% $0.00 0.00% $3,284.15 0.26% $1,251,266.15 99.74% $1,254,550.30

Prime Contractor Utilization Based On The Commonwealth Accounting and Reporting System (CARS)
Page N-12
EXHIBIT N-3 (Continued) COMMONWEALTH OF VIRGINIA
PROFESSIONAL SERVICES UTILIZATION ANALYSIS OF PRIME CONTRACTORS BASED ON CARS
DOLLARS AND PERCENTAGE OF TOTAL DOLLARS PAID BY AGENCY NAME AND RACE/ETHNICITY/GENDER CLASSIFICATION
JULY 1, 2005, THROUGH JUNE 30, 2009
Agency African Hispanic Asian Native Nonminority M/WBE Non-M/WBE Total
Description Americans Americans Americans Americans Women Firms Firms Dollars
$ %1$ %1
$ %1$ %1
$ %1$ %1
$ %1$
Virginia State University $38,387.00 0.17% $0.00 0.00% $124,101.45 0.54% $0.00 0.00% $1,295,005.65 5.63% $1,457,494.10 6.33% $21,563,850.64 93.67% $23,021,344.74
Virginia Tobacco Settlement Foundation $50.00 0.00% $0.00 0.00% $0.00 0.00% $0.00 0.00% $0.00 0.00% $50.00 0.00% $19,528,818.71 100.00% $19,528,868.71
Virginia Western Community College $0.00 0.00% $0.00 0.00% $20,680.28 1.16% $0.00 0.00% $0.00 0.00% $20,680.28 1.16% $1,757,316.92 98.84% $1,777,997.20
Virginia Workers' Compensation Commission $130.00 0.00% $285,832.95 2.07% $0.00 0.00% $0.00 0.00% $9,880.00 0.07% $295,842.95 2.14% $13,508,477.60 97.86% $13,804,320.55
Virginia-Israel Advisory Board $0.00 0.00% $0.00 0.00% $0.00 0.00% $0.00 0.00% $0.00 0.00% $0.00 0.00% $34,365.40 100.00% $34,365.40
Wytheville Community College $0.00 0.00% $18,704.76 3.26% $30,095.15 5.25% $0.00 0.00% $0.00 0.00% $48,799.91 8.51% $524,475.12 91.49% $573,275.03
Total $36,653,086.28 1.14% $4,820,451.66 0.15% $29,459,427.78 0.92% $144,623.60 0.00% $3,721,647.46 0.12% $74,799,236.78 2.33% $3,133,280,791.11 97.67% $3,208,080,027.89 Source: MGT developed a payment (based on CARS data) and vendor database for the Commonwealth from July1, 2005, through June 30, 2009. 1
Percent of total dollars paid to firms.
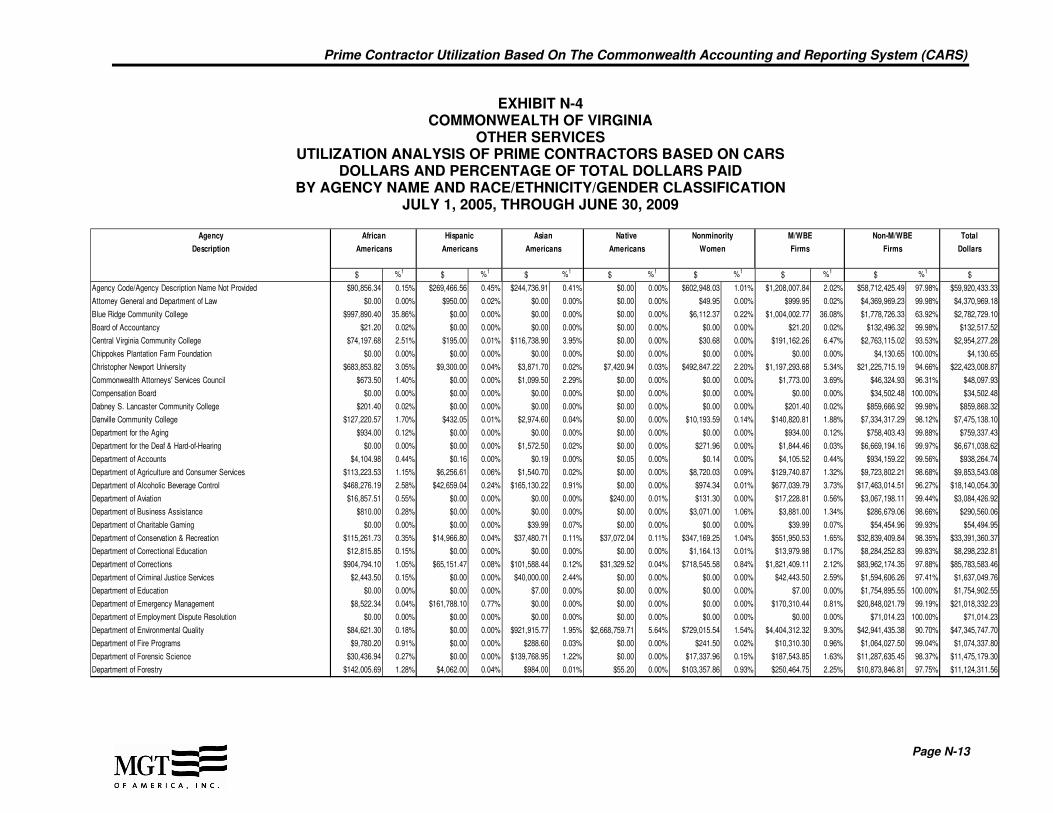
Prime Contractor Utilization Based On The Commonwealth Accounting and Reporting System (CARS)
Page N-13
EXHIBIT N-4 COMMONWEALTH OF VIRGINIA
OTHER SERVICES UTILIZATION ANALYSIS OF PRIME CONTRACTORS BASED ON CARS
DOLLARS AND PERCENTAGE OF TOTAL DOLLARS PAID BY AGENCY NAME AND RACE/ETHNICITY/GENDER CLASSIFICATION
JULY 1, 2005, THROUGH JUNE 30, 2009
Agency African Hispanic Asian Native Nonminority M/WBE Non-M/WBE Total
Description Americans Americans Americans Americans Women Firms Firms Dollars
$ %1$ %1
$ %1$ %1
$ %1$ %1
$ %1$
Agency Code/Agency Description Name Not Provided $90,856.34 0.15% $269,466.56 0.45% $244,736.91 0.41% $0.00 0.00% $602,948.03 1.01% $1,208,007.84 2.02% $58,712,425.49 97.98% $59,920,433.33
Attorney General and Department of Law $0.00 0.00% $950.00 0.02% $0.00 0.00% $0.00 0.00% $49.95 0.00% $999.95 0.02% $4,369,969.23 99.98% $4,370,969.18
Blue Ridge Community College $997,890.40 35.86% $0.00 0.00% $0.00 0.00% $0.00 0.00% $6,112.37 0.22% $1,004,002.77 36.08% $1,778,726.33 63.92% $2,782,729.10
Board of Accountancy $21.20 0.02% $0.00 0.00% $0.00 0.00% $0.00 0.00% $0.00 0.00% $21.20 0.02% $132,496.32 99.98% $132,517.52
Central Virginia Community College $74,197.68 2.51% $195.00 0.01% $116,738.90 3.95% $0.00 0.00% $30.68 0.00% $191,162.26 6.47% $2,763,115.02 93.53% $2,954,277.28
Chippokes Plantation Farm Foundation $0.00 0.00% $0.00 0.00% $0.00 0.00% $0.00 0.00% $0.00 0.00% $0.00 0.00% $4,130.65 100.00% $4,130.65
Christopher Newport University $683,853.82 3.05% $9,300.00 0.04% $3,871.70 0.02% $7,420.94 0.03% $492,847.22 2.20% $1,197,293.68 5.34% $21,225,715.19 94.66% $22,423,008.87
Commonwealth Attorneys' Services Council $673.50 1.40% $0.00 0.00% $1,099.50 2.29% $0.00 0.00% $0.00 0.00% $1,773.00 3.69% $46,324.93 96.31% $48,097.93
Compensation Board $0.00 0.00% $0.00 0.00% $0.00 0.00% $0.00 0.00% $0.00 0.00% $0.00 0.00% $34,502.48 100.00% $34,502.48
Dabney S. Lancaster Community College $201.40 0.02% $0.00 0.00% $0.00 0.00% $0.00 0.00% $0.00 0.00% $201.40 0.02% $859,666.92 99.98% $859,868.32
Danville Community College $127,220.57 1.70% $432.05 0.01% $2,974.60 0.04% $0.00 0.00% $10,193.59 0.14% $140,820.81 1.88% $7,334,317.29 98.12% $7,475,138.10
Department for the Aging $934.00 0.12% $0.00 0.00% $0.00 0.00% $0.00 0.00% $0.00 0.00% $934.00 0.12% $758,403.43 99.88% $759,337.43
Department for the Deaf & Hard-of-Hearing $0.00 0.00% $0.00 0.00% $1,572.50 0.02% $0.00 0.00% $271.96 0.00% $1,844.46 0.03% $6,669,194.16 99.97% $6,671,038.62
Department of Accounts $4,104.98 0.44% $0.16 0.00% $0.19 0.00% $0.05 0.00% $0.14 0.00% $4,105.52 0.44% $934,159.22 99.56% $938,264.74
Department of Agriculture and Consumer Services $113,223.53 1.15% $6,256.61 0.06% $1,540.70 0.02% $0.00 0.00% $8,720.03 0.09% $129,740.87 1.32% $9,723,802.21 98.68% $9,853,543.08
Department of Alcoholic Beverage Control $468,276.19 2.58% $42,659.04 0.24% $165,130.22 0.91% $0.00 0.00% $974.34 0.01% $677,039.79 3.73% $17,463,014.51 96.27% $18,140,054.30
Department of Aviation $16,857.51 0.55% $0.00 0.00% $0.00 0.00% $240.00 0.01% $131.30 0.00% $17,228.81 0.56% $3,067,198.11 99.44% $3,084,426.92
Department of Business Assistance $810.00 0.28% $0.00 0.00% $0.00 0.00% $0.00 0.00% $3,071.00 1.06% $3,881.00 1.34% $286,679.06 98.66% $290,560.06
Department of Charitable Gaming $0.00 0.00% $0.00 0.00% $39.99 0.07% $0.00 0.00% $0.00 0.00% $39.99 0.07% $54,454.96 99.93% $54,494.95
Department of Conservation & Recreation $115,261.73 0.35% $14,966.80 0.04% $37,480.71 0.11% $37,072.04 0.11% $347,169.25 1.04% $551,950.53 1.65% $32,839,409.84 98.35% $33,391,360.37
Department of Correctional Education $12,815.85 0.15% $0.00 0.00% $0.00 0.00% $0.00 0.00% $1,164.13 0.01% $13,979.98 0.17% $8,284,252.83 99.83% $8,298,232.81
Department of Corrections $904,794.10 1.05% $65,151.47 0.08% $101,588.44 0.12% $31,329.52 0.04% $718,545.58 0.84% $1,821,409.11 2.12% $83,962,174.35 97.88% $85,783,583.46
Department of Criminal Justice Services $2,443.50 0.15% $0.00 0.00% $40,000.00 2.44% $0.00 0.00% $0.00 0.00% $42,443.50 2.59% $1,594,606.26 97.41% $1,637,049.76
Department of Education $0.00 0.00% $0.00 0.00% $7.00 0.00% $0.00 0.00% $0.00 0.00% $7.00 0.00% $1,754,895.55 100.00% $1,754,902.55
Department of Emergency Management $8,522.34 0.04% $161,788.10 0.77% $0.00 0.00% $0.00 0.00% $0.00 0.00% $170,310.44 0.81% $20,848,021.79 99.19% $21,018,332.23
Department of Employment Dispute Resolution $0.00 0.00% $0.00 0.00% $0.00 0.00% $0.00 0.00% $0.00 0.00% $0.00 0.00% $71,014.23 100.00% $71,014.23
Department of Environmental Quality $84,621.30 0.18% $0.00 0.00% $921,915.77 1.95% $2,668,759.71 5.64% $729,015.54 1.54% $4,404,312.32 9.30% $42,941,435.38 90.70% $47,345,747.70
Department of Fire Programs $9,780.20 0.91% $0.00 0.00% $288.60 0.03% $0.00 0.00% $241.50 0.02% $10,310.30 0.96% $1,064,027.50 99.04% $1,074,337.80
Department of Forensic Science $30,436.94 0.27% $0.00 0.00% $139,768.95 1.22% $0.00 0.00% $17,337.96 0.15% $187,543.85 1.63% $11,287,635.45 98.37% $11,475,179.30
Department of Forestry $142,005.69 1.28% $4,062.00 0.04% $984.00 0.01% $55.20 0.00% $103,357.86 0.93% $250,464.75 2.25% $10,873,846.81 97.75% $11,124,311.56

Prime Contractor Utilization Based On The Commonwealth Accounting and Reporting System (CARS)
Page N-14
EXHIBIT N-4 (Continued) COMMONWEALTH OF VIRGINIA
OTHER SERVICES UTILIZATION ANALYSIS OF PRIME CONTRACTORS BASED ON CARS
DOLLARS AND PERCENTAGE OF TOTAL DOLLARS PAID BY AGENCY NAME AND RACE/ETHNICITY/GENDER CLASSIFICATION
JULY 1, 2005, THROUGH JUNE 30, 2009
Agency African Hispanic Asian Native Nonminority M/WBE Non-M/WBE Total
Description Americans Americans Americans Americans Women Firms Firms Dollars
$ %1$ %1
$ %1$ %1
$ %1$ %1
$ %1$
Department of Game and Inland Fisheries $128,952.24 0.74% $8,185.47 0.05% $121,314.50 0.69% $225.00 0.00% $116,713.34 0.67% $375,390.55 2.15% $17,093,676.54 97.85% $17,469,067.09
Department of General Services $4,709,920.18 10.35% $1,272.00 0.00% $530,726.61 1.17% $8,975.00 0.02% $204,803.06 0.45% $5,455,696.85 11.99% $40,056,420.08 88.01% $45,512,116.93
Department of Health $271,621.98 0.60% $139,312.96 0.31% $163,408.21 0.36% $1,520.00 0.00% $79,962.82 0.18% $655,825.97 1.45% $44,667,022.17 98.55% $45,322,848.14
Department of Health Professions $82.30 0.00% $0.00 0.00% $89,956.50 0.83% $0.00 0.00% $515.00 0.00% $90,553.80 0.83% $10,802,929.06 99.17% $10,893,482.86
Department of Historic Resources $2,930.00 0.11% $0.00 0.00% $0.00 0.00% $0.00 0.00% $114,180.19 4.30% $117,110.19 4.41% $2,535,539.31 95.59% $2,652,649.50
Department of Housing and Community Development $38,779.55 1.87% $0.00 0.00% $0.00 0.00% $0.00 0.00% $37,883.00 1.83% $76,662.55 3.71% $1,992,131.74 96.29% $2,068,794.29
Department of Human Resource Management $2,534.30 0.46% $0.00 0.00% $487.50 0.09% $0.00 0.00% $98.00 0.02% $3,119.80 0.57% $548,026.04 99.43% $551,145.84
Department of Juvenile Justice $1,559,229.03 2.78% $410,407.92 0.73% $128,885.65 0.23% $3,700.00 0.01% $18,418.56 0.03% $2,120,641.16 3.79% $53,906,394.67 96.21% $56,027,035.83
Department of Labor and Industry $15,593.42 5.12% $0.00 0.00% $0.00 0.00% $0.00 0.00% $41.85 0.01% $15,635.27 5.14% $288,768.69 94.86% $304,403.96
Department of Medical Assistance Services $26,893.75 0.44% $0.00 0.00% $0.00 0.00% $0.00 0.00% $1,363.23 0.02% $28,256.98 0.47% $6,029,591.60 99.53% $6,057,848.58
Department of Military Affairs $248,592.93 1.21% $61,536.03 0.30% $22,212.55 0.11% $20,460.00 0.10% $411,585.08 2.01% $764,386.59 3.73% $19,724,028.23 96.27% $20,488,414.82
Department of Mines, Minerals and Energy $4,975.00 0.06% $0.00 0.00% $0.00 0.00% $0.00 0.00% $2,730.00 0.04% $7,705.00 0.10% $7,770,342.90 99.90% $7,778,047.90
Department of Minority Business Enterprise $57,877.03 51.21% $0.00 0.00% $0.00 0.00% $0.00 0.00% $0.00 0.00% $57,877.03 51.21% $55,137.57 48.79% $113,014.60
Department of Motor Vehicles $2,039,814.12 5.37% $14,395,440.22 37.90% $200,468.53 0.53% $342,176.88 0.90% $7,259.20 0.02% $16,985,158.95 44.72% $20,998,320.69 55.28% $37,983,479.64
Department of Planning and Budget $247.60 0.15% $0.00 0.00% $0.00 0.00% $0.00 0.00% $0.00 0.00% $247.60 0.15% $162,262.50 99.85% $162,510.10
Department of Professional and Occupational Regulation $33,096.40 2.78% $0.00 0.00% $5,839.00 0.49% $0.00 0.00% $0.00 0.00% $38,935.40 3.27% $1,150,169.14 96.73% $1,189,104.54
Department of Rehabilitative Services $560,401.96 1.78% $895.87 0.00% $26,730.00 0.09% $0.00 0.00% $6,371.66 0.02% $594,399.49 1.89% $30,822,311.38 98.11% $31,416,710.87
Department of Social Services $134,123.72 1.14% $9,848.05 0.08% $26,696.22 0.23% $0.00 0.00% $419.00 0.00% $171,086.99 1.45% $11,642,929.82 98.55% $11,814,016.81
Department of State Police $268,125.86 0.51% $40,736.20 0.08% $68,886.05 0.13% $2,872.07 0.01% $27,785.56 0.05% $408,405.74 0.78% $52,131,840.09 99.22% $52,540,245.83
Department of Taxation $27,412.35 0.08% $0.00 0.00% $0.00 0.00% $0.00 0.00% $805.15 0.00% $28,217.50 0.09% $32,482,377.06 99.91% $32,510,594.56
Department of the Treasury $647.00 0.03% $0.00 0.00% $0.00 0.00% $0.00 0.00% $0.00 0.00% $647.00 0.03% $2,411,405.18 99.97% $2,412,052.18
Department of Veterans Services $5,850.98 0.56% $2,717.24 0.26% $0.00 0.00% $2,071.17 0.20% $57,660.61 5.48% $68,300.00 6.49% $984,119.70 93.51% $1,052,419.70
Dept. of Mental Health, Mental Retardation and Substance Abuse Services $743,583.59 2.28% $40,204.82 0.12% $156,414.70 0.48% $2,725.00 0.01% $1,664,880.47 5.10% $2,607,808.58 7.98% $30,065,793.45 92.02% $32,673,602.03
Eastern Shore Community College $5,425.00 0.82% $0.00 0.00% $2,860.00 0.43% $200.00 0.03% $19,203.33 2.92% $27,688.33 4.21% $630,438.92 95.79% $658,127.25
Frontier Culture Museum of Virginia $500.00 0.09% $0.00 0.00% $0.00 0.00% $0.00 0.00% $415.09 0.08% $915.09 0.17% $544,593.06 99.83% $545,508.15
Germanna Community College $40,224.50 1.39% $3,400.00 0.12% $0.00 0.00% $0.00 0.00% $1,720.71 0.06% $45,345.21 1.56% $2,852,491.77 98.44% $2,897,836.98
Gunston Hall $175.00 0.08% $0.00 0.00% $0.00 0.00% $0.00 0.00% $0.00 0.00% $175.00 0.08% $221,641.21 99.92% $221,816.21
Human Rights Council $680.00 3.03% $360.00 1.60% $0.00 0.00% $0.00 0.00% $0.00 0.00% $1,040.00 4.63% $21,411.06 95.37% $22,451.06
J. Sargeant Reynolds Community College $109,517.48 2.57% $14,266.19 0.34% $140,750.29 3.31% $0.00 0.00% $10,108.45 0.24% $274,642.41 6.45% $3,983,841.18 93.55% $4,258,483.59
Jamestown-Yorktown Foundation $34,667.72 0.14% $75,291.00 0.31% $12.00 0.00% $0.00 0.00% $70,459.20 0.29% $180,429.92 0.75% $23,894,453.42 99.25% $24,074,883.34

Prime Contractor Utilization Based On The Commonwealth Accounting and Reporting System (CARS)
Page N-15
EXHIBIT N-4 (Continued) COMMONWEALTH OF VIRGINIA
OTHER SERVICES UTILIZATION ANALYSIS OF PRIME CONTRACTORS BASED ON CARS
DOLLARS AND PERCENTAGE OF TOTAL DOLLARS PAID BY AGENCY NAME AND RACE/ETHNICITY/GENDER CLASSIFICATION
JULY 1, 2005, THROUGH JUNE 30, 2009
Agency African Hispanic Asian Native Nonminority M/WBE Non-M/WBE Total
Description Americans Americans Americans Americans Women Firms Firms Dollars
$ %1$ %1
$ %1$ %1
$ %1$ %1
$ %1$
John Tyler Community College $6,841.00 0.24% $0.00 0.00% $350.00 0.01% $0.00 0.00% $2,532.00 0.09% $9,723.00 0.35% $2,807,659.68 99.65% $2,817,382.68
Lieutenant Governor $0.00 0.00% $0.00 0.00% $0.00 0.00% $0.00 0.00% $0.00 0.00% $0.00 0.00% $9,822.83 100.00% $9,822.83
Longwood University $0.00 0.00% $0.00 0.00% $0.00 0.00% $0.00 0.00% $4,461.00 0.01% $4,461.00 0.01% $32,051,758.19 99.99% $32,056,219.19
Lord Fairfax Community College $6,315.00 0.05% $4,423.85 0.03% $10,849.00 0.08% $40,271.00 0.30% $35,775.00 0.26% $97,633.85 0.72% $13,525,983.95 99.28% $13,623,617.80
Marine Resources Commission $14,187.75 0.62% $76,515.00 3.35% $1,287.95 0.06% $0.00 0.00% $168,329.10 7.38% $260,319.80 11.41% $2,021,993.02 88.59% $2,282,312.82
Motor Vehicle Dealer Board $0.00 0.00% $0.00 0.00% $0.00 0.00% $0.00 0.00% $0.00 0.00% $0.00 0.00% $128,481.99 100.00% $128,481.99
Mountain Empire Community College $0.00 0.00% $0.00 0.00% $0.00 0.00% $0.00 0.00% $0.00 0.00% $0.00 0.00% $1,035,653.94 100.00% $1,035,653.94
New River Community College $2,850.50 0.08% $0.00 0.00% $222.05 0.01% $0.00 0.00% $2,463.50 0.07% $5,536.05 0.15% $3,575,228.37 99.85% $3,580,764.42
Norfolk State University $20,360,913.40 62.13% $870.15 0.00% $21,267.74 0.06% $0.00 0.00% $61,314.82 0.19% $20,444,366.11 62.38% $12,328,290.49 37.62% $32,772,656.60
Northern Virginia Community College $587,986.40 0.84% $1,215,151.92 1.74% $1,705,538.23 2.44% $400,809.06 0.57% $547,512.40 0.78% $4,456,998.01 6.38% $65,403,525.15 93.62% $69,860,523.16
Office for Substance Abuse Prevention $0.00 0.00% $0.00 0.00% $0.00 0.00% $0.00 0.00% $0.00 0.00% $0.00 0.00% $61,901.28 100.00% $61,901.28
Office of Commonwealth Preparedness $0.00 0.00% $0.00 0.00% $0.00 0.00% $0.00 0.00% $0.00 0.00% $0.00 0.00% $74,152.20 100.00% $74,152.20
Office of the Governor $0.00 0.00% $0.00 0.00% $0.00 0.00% $0.00 0.00% $0.00 0.00% $0.00 0.00% $724,308.04 100.00% $724,308.04
Patrick Henry Community College $0.00 0.00% $0.00 0.00% $0.00 0.00% $0.00 0.00% $4,174.68 0.06% $4,174.68 0.06% $7,354,264.91 99.94% $7,358,439.59
Paul D. Camp Community College $3,991.60 0.30% $46,037.00 3.42% $0.00 0.00% $0.00 0.00% $23,628.67 1.76% $73,657.27 5.48% $1,270,778.80 94.52% $1,344,436.07
Piedmont Virginia Community College $11,570.00 0.42% $6,592.50 0.24% $630.00 0.02% $253.50 0.01% $0.00 0.00% $19,046.00 0.70% $2,714,838.05 99.30% $2,733,884.05
Rappahannock Community College $245.75 0.02% $9,593.66 0.64% $34,489.10 2.30% $0.00 0.00% $0.00 0.00% $44,328.51 2.96% $1,452,248.90 97.04% $1,496,577.41
Richard Bland College $13,787.50 0.67% $308.63 0.01% $0.00 0.00% $0.00 0.00% $9,210.50 0.45% $23,306.63 1.13% $2,042,036.84 98.87% $2,065,343.47
Secretary of Administration $0.00 0.00% $0.00 0.00% $0.00 0.00% $0.00 0.00% $0.00 0.00% $0.00 0.00% $65,793.76 100.00% $65,793.76
Secretary of Agriculture and Forestry $0.00 0.00% $0.00 0.00% $0.00 0.00% $0.00 0.00% $0.00 0.00% $0.00 0.00% $2,156.54 100.00% $2,156.54
Secretary of Commerce and Trade $0.00 0.00% $0.00 0.00% $0.00 0.00% $0.00 0.00% $0.00 0.00% $0.00 0.00% $11,783.55 100.00% $11,783.55
Secretary of Education $0.00 0.00% $0.00 0.00% $0.00 0.00% $0.00 0.00% $0.00 0.00% $0.00 0.00% $30,487.32 100.00% $30,487.32
Secretary of Finance $0.00 0.00% $0.00 0.00% $0.00 0.00% $0.00 0.00% $0.00 0.00% $0.00 0.00% $4,880.92 100.00% $4,880.92
Secretary of Health & Human Resources $0.00 0.00% $0.00 0.00% $0.00 0.00% $0.00 0.00% $0.00 0.00% $0.00 0.00% $4,392.30 100.00% $4,392.30
Secretary of Natural Resources $0.00 0.00% $0.00 0.00% $0.00 0.00% $0.00 0.00% $0.00 0.00% $0.00 0.00% $12,852.37 100.00% $12,852.37
Secretary of Public Safety $0.00 0.00% $0.00 0.00% $0.00 0.00% $0.00 0.00% $0.00 0.00% $0.00 0.00% $1,871.44 100.00% $1,871.44
Secretary of Technology $0.00 0.00% $0.00 0.00% $0.00 0.00% $0.00 0.00% $0.00 0.00% $0.00 0.00% $6,221.13 100.00% $6,221.13
Secretary of the Commonwealth $0.00 0.00% $0.00 0.00% $1,012.86 0.56% $0.00 0.00% $0.00 0.00% $1,012.86 0.56% $179,985.56 99.44% $180,998.42
Secretary of Transportation $0.00 0.00% $0.00 0.00% $0.00 0.00% $0.00 0.00% $0.00 0.00% $0.00 0.00% $3,010.94 100.00% $3,010.94
Southern Virginia Higher Eduation Center $0.00 0.00% $0.00 0.00% $0.00 0.00% $0.00 0.00% $0.00 0.00% $0.00 0.00% $386,397.56 100.00% $386,397.56

Prime Contractor Utilization Based On The Commonwealth Accounting and Reporting System (CARS)
Page N-16
EXHIBIT N-4 (Continued) COMMONWEALTH OF VIRGINIA
OTHER SERVICES UTILIZATION ANALYSIS OF PRIME CONTRACTORS BASED ON CARS
DOLLARS AND PERCENTAGE OF TOTAL DOLLARS PAID BY AGENCY NAME AND RACE/ETHNICITY/GENDER CLASSIFICATION
JULY 1, 2005, THROUGH JUNE 30, 2009
Agency African Hispanic Asian Native Nonminority M/WBE Non-M/WBE Total
Description Americans Americans Americans Americans Women Firms Firms Dollars
$ %1$ %1
$ %1$ %1
$ %1$ %1
$ %1$
Southside Virginia Community College $1,615.29 0.03% $0.00 0.00% $2,000.00 0.04% $0.00 0.00% $0.00 0.00% $3,615.29 0.07% $5,530,581.24 99.93% $5,534,196.53
Southwest Virginia Community College $0.00 0.00% $0.00 0.00% $0.00 0.00% $0.00 0.00% $0.00 0.00% $0.00 0.00% $3,459,960.62 100.00% $3,459,960.62
State Board of Elections $121,137.78 6.02% $8,829.87 0.44% $0.00 0.00% $0.00 0.00% $0.00 0.00% $129,967.65 6.46% $1,883,316.74 93.54% $2,013,284.39
State Corporation Commission $78,791.40 0.38% $0.00 0.00% $6,020.00 0.03% $0.00 0.00% $2,997.62 0.01% $87,809.02 0.42% $20,631,906.27 99.58% $20,719,715.29
State Council of Higher Education for Virginia $0.00 0.00% $0.00 0.00% $0.00 0.00% $0.00 0.00% $48,500.00 3.88% $48,500.00 3.88% $1,201,171.08 96.12% $1,249,671.08
State Lottery Department $11,956.67 0.01% $44,269.04 0.04% $48,288.50 0.04% $0.00 0.00% $1,388.00 0.00% $105,902.21 0.09% $114,324,811.00 99.91% $114,430,713.21
The Library of Virginia $8,302.47 0.09% $65.00 0.00% $113.67 0.00% $0.00 0.00% $0.00 0.00% $8,481.14 0.09% $9,064,450.84 99.91% $9,072,931.98
The Science Museum of Virginia $31,844.75 0.45% $0.00 0.00% $0.00 0.00% $0.00 0.00% $8,260.00 0.12% $40,104.75 0.57% $6,985,314.88 99.43% $7,025,419.63
Thomas Nelson Community College $63,951.48 2.25% $66,298.50 2.33% $50,718.06 1.79% $0.00 0.00% $34,998.55 1.23% $215,966.59 7.61% $2,623,548.77 92.39% $2,839,515.36
Tidewater Community College $26,698.36 0.13% $10,598.95 0.05% $34,313.92 0.16% $0.00 0.00% $2,460,949.47 11.79% $2,532,560.70 12.14% $18,336,721.58 87.86% $20,869,282.28
Tobacco Indemnification & Revitalization Commission $0.00 0.00% $0.00 0.00% $0.00 0.00% $0.00 0.00% $0.00 0.00% $0.00 0.00% $516,669.20 100.00% $516,669.20
Virginia Agricultural Council $0.00 0.00% $0.00 0.00% $0.00 0.00% $0.00 0.00% $0.00 0.00% $0.00 0.00% $9,035.96 100.00% $9,035.96
Virginia Board for People with Disabilities $0.00 0.00% $0.00 0.00% $0.00 0.00% $0.00 0.00% $0.00 0.00% $0.00 0.00% $604,988.07 100.00% $604,988.07
Virginia College Savings Plan $0.00 0.00% $1,060.00 0.05% $0.00 0.00% $0.00 0.00% $0.00 0.00% $1,060.00 0.05% $2,154,420.81 99.95% $2,155,480.81
Virginia Commission for the Arts $0.00 0.00% $0.00 0.00% $0.00 0.00% $0.00 0.00% $0.00 0.00% $0.00 0.00% $82,410.24 100.00% $82,410.24
Virginia Community College System $8,683.84 0.42% $0.00 0.00% $10.11 0.00% $575.00 0.03% $328.00 0.02% $9,596.95 0.47% $2,049,817.91 99.53% $2,059,414.86
Virginia Department for the Blind and Vision Impaired $118,553.98 2.59% $2,920.00 0.06% $5,557.36 0.12% $0.00 0.00% $21,390.70 0.47% $148,422.04 3.25% $4,423,862.98 96.75% $4,572,285.02
Virginia Employment Commission $1,506,427.53 10.43% $7,300.00 0.05% $53,257.80 0.37% $0.00 0.00% $21,813.00 0.15% $1,588,798.33 11.00% $12,856,096.72 89.00% $14,444,895.05
Virginia Highlands Community College $4,900.00 1.23% $0.00 0.00% $0.00 0.00% $0.00 0.00% $240.00 0.06% $5,140.00 1.29% $393,663.94 98.71% $398,803.94
Virginia Information Technologies Agency $579,668.01 0.27% $67,464.16 0.03% $200,654.99 0.09% $0.00 0.00% $61,948.20 0.03% $909,735.36 0.42% $216,449,434.75 99.58% $217,359,170.11
Virginia Military Institute $323.00 0.00% $0.00 0.00% $472,381.54 0.30% $4,635.02 0.00% $2,444,411.20 1.54% $2,921,750.76 1.84% $155,444,019.61 98.16% $158,365,770.37
Virginia Museum of Fine Arts $96,182.21 0.44% $225,678.88 1.03% $0.00 0.00% $5,210,478.87 23.69% $17,581.00 0.08% $5,549,920.96 25.23% $16,444,596.84 74.77% $21,994,517.80
Virginia Museum of Natural History $570.00 0.01% $117,474.91 1.45% $0.00 0.00% $0.00 0.00% $18,725.10 0.23% $136,770.01 1.68% $7,986,457.65 98.32% $8,123,227.66
Virginia Office for Protection and Advocacy $0.00 0.00% $0.00 0.00% $0.00 0.00% $0.00 0.00% $0.00 0.00% $0.00 0.00% $236,761.61 100.00% $236,761.61
Virginia Parole Board $0.00 0.00% $0.00 0.00% $640.00 18.54% $0.00 0.00% $0.00 0.00% $640.00 18.54% $2,811.11 81.46% $3,451.11
Virginia Racing Commission $0.00 0.00% $0.00 0.00% $0.00 0.00% $0.00 0.00% $0.00 0.00% $0.00 0.00% $945,517.73 100.00% $945,517.73
Virginia Retirement System $3,720.66 0.07% $2,046.60 0.04% $415.50 0.01% $0.00 0.00% $110,848.21 2.17% $117,030.97 2.29% $4,983,214.39 97.71% $5,100,245.36

Prime Contractor Utilization Based On The Commonwealth Accounting and Reporting System (CARS)
Page N-17
EXHIBIT N-4 (Continued) COMMONWEALTH OF VIRGINIA
OTHER SERVICES UTILIZATION ANALYSIS OF PRIME CONTRACTORS BASED ON CARS
DOLLARS AND PERCENTAGE OF TOTAL DOLLARS PAID BY AGENCY NAME AND RACE/ETHNICITY/GENDER CLASSIFICATION
JULY 1, 2005, THROUGH JUNE 30, 2009
Agency African Hispanic Asian Native Nonminority M/WBE Non-M/WBE Total
Description Americans Americans Americans Americans Women Firms Firms Dollars
$ %1$ %1
$ %1$ %1
$ %1$ %1
$ %1$
Virginia School for Deaf and Blind at Staunton $8.95 0.00% $0.00 0.00% $6,488.00 0.70% $0.00 0.00% $6,700.47 0.72% $13,197.42 1.42% $918,442.37 98.58% $931,639.79
Virginia School for Deaf, Blind and Multi-Disabled at Hampton $25,730.84 14.47% $315.00 0.18% $0.00 0.00% $0.00 0.00% $0.00 0.00% $26,045.84 14.64% $151,807.14 85.36% $177,852.98
Virginia State University $18,337,948.47 28.62% $218,759.58 0.34% $41,061.73 0.06% $315.00 0.00% $625,102.01 0.98% $19,223,186.79 30.00% $44,844,793.56 70.00% $64,067,980.35
Virginia Tobacco Settlement Foundation $49.52 0.18% $0.00 0.00% $0.00 0.00% $0.00 0.00% $0.00 0.00% $49.52 0.18% $26,914.77 99.82% $26,964.29
Virginia Western Community College $0.00 0.00% $0.00 0.00% $0.00 0.00% $0.00 0.00% $55.00 0.00% $55.00 0.00% $4,176,603.19 100.00% $4,176,658.19
Virginia Workers' Compensation Commission $0.00 0.00% $1,070.60 0.05% $1,600.00 0.08% $0.00 0.00% $377.50 0.02% $3,048.10 0.15% $2,083,094.63 99.85% $2,086,142.73
Virginia-Israel Advisory Board $0.00 0.00% $0.00 0.00% $0.00 0.00% $0.00 0.00% $0.00 0.00% $0.00 0.00% $4,980.89 100.00% $4,980.89
Wytheville Community College $31,281.26 0.58% $186.00 0.00% $0.00 0.00% $404,852.92 7.54% $4,937.20 0.09% $441,257.38 8.21% $4,931,159.18 91.79% $5,372,416.56
Total $57,029,313.13 3.37% $17,912,931.56 1.06% $6,164,555.10 0.36% $9,191,992.95 0.54% $12,648,517.89 0.75% $102,947,310.63 6.09% $1,588,266,142.02 93.91% $1,691,213,452.65 Source: MGT developed a payment (based on CARS data) and vendor database for the Commonwealth from July1, 2005, through June 30, 2009. 1
Percent of total dollars paid to firms.

Prime Contractor Utilization Based On The Commonwealth Accounting and Reporting System (CARS)
Page N-18
EXHIBIT N-5 COMMONWEALTH OF VIRGINIA
GOODS AND SUPPLIES UTILIZATION ANALYSIS OF PRIME CONTRACTORS BASED ON CARS
DOLLARS AND PERCENTAGE OF TOTAL DOLLARS PAID BY AGENCY NAME AND RACE/ETHNICITY/GENDER CLASSIFICATION
JULY 1, 2005, THROUGH JUNE 30, 2009
Agency African Hispanic Asian Native Nonminority M/WBE Non-M/WBE Total
Description Americans Americans Americans Americans Women Firms Firms Dollars
$ %1$ %1
$ %1$ %1
$ %1$ %1
$ %1$
Agency Code/Agency Description Name Not Provided $31,289.26 0.04% $7,044.37 0.01% $9,700,239.05 13.70% $255.85 0.00% $157,479.85 0.22% $9,896,308.38 13.98% $60,906,153.84 86.02% $70,802,462.22
Attorney General and Department of Law $999.96 0.06% $0.00 0.00% $0.00 0.00% $0.00 0.00% $0.00 0.00% $999.96 0.06% $1,589,074.50 99.94% $1,590,074.46
Blue Ridge Community College $2,550.47 0.02% $0.00 0.00% $323,721.37 3.06% $0.00 0.00% $13,492.50 0.13% $339,764.34 3.21% $10,241,079.90 96.79% $10,580,844.24
Board of Accountancy $0.00 0.00% $0.00 0.00% $0.00 0.00% $0.00 0.00% $0.00 0.00% $0.00 0.00% $386,907.18 100.00% $386,907.18
Central Virginia Community College $4,816.04 0.06% $1,071.22 0.01% $164,020.12 2.14% $0.00 0.00% $2,062.11 0.03% $171,969.49 2.25% $7,477,028.93 97.75% $7,648,998.42
Christopher Newport University $903,580.45 1.70% $19,151.16 0.04% $326,843.16 0.62% $34,420.67 0.06% $11,995.85 0.02% $1,295,991.29 2.44% $51,798,878.44 97.56% $53,094,869.73
Commonwealth Attorneys' Services Council $555.93 0.35% $0.00 0.00% $0.00 0.00% $0.00 0.00% $0.00 0.00% $555.93 0.35% $157,560.23 99.65% $158,116.16
Compensation Board $0.00 0.00% $0.00 0.00% $0.00 0.00% $0.00 0.00% $0.00 0.00% $0.00 0.00% $1,544,208.41 100.00% $1,544,208.41
Comprehensive Services for At-Risk Youth and Families $46,640.00 100.00% $0.00 0.00% $0.00 0.00% $0.00 0.00% $0.00 0.00% $46,640.00 100.00% $0.00 0.00% $46,640.00
Dabney S. Lancaster Community College $0.00 0.00% $0.00 0.00% $6,240.10 0.13% $0.00 0.00% $0.00 0.00% $6,240.10 0.13% $4,804,985.01 99.87% $4,811,225.11
Danville Community College $17,672.84 0.19% $6,979.72 0.07% $87,545.84 0.94% $0.00 0.00% $46,371.56 0.50% $158,569.96 1.70% $9,194,166.00 98.30% $9,352,735.96
Department for the Aging $0.00 0.00% $9,314.00 0.78% $2,439.20 0.20% $0.00 0.00% $0.00 0.00% $11,753.20 0.98% $1,189,978.18 99.02% $1,201,731.38
Department for the Deaf & Hard-of-Hearing $0.00 0.00% $0.00 0.00% $7,194.21 0.70% $0.00 0.00% $0.00 0.00% $7,194.21 0.70% $1,017,538.98 99.30% $1,024,733.19
Department of Accounts $92.72 0.11% $0.00 0.00% $346.17 0.42% $0.00 0.00% $0.00 0.00% $438.89 0.54% $81,353.24 99.46% $81,792.13
Department of Agriculture and Consumer Services $2,408.38 0.02% $0.00 0.00% $1,854.61 0.02% $0.00 0.00% $6,450.03 0.06% $10,713.02 0.10% $10,270,067.18 99.90% $10,280,780.20
Department of Alcoholic Beverage Control $207,507.21 0.50% $25,461.50 0.06% $624,094.39 1.50% $506.05 0.00% $1,451,914.02 3.49% $2,309,483.17 5.55% $39,338,871.88 94.45% $41,648,355.05
Department of Aviation $0.00 0.00% $0.00 0.00% $2,628.93 0.02% $0.00 0.00% $0.00 0.00% $2,628.93 0.02% $11,552,066.08 99.98% $11,554,695.01
Department of Business Assistance $3,897.31 0.54% $0.00 0.00% $0.00 0.00% $0.00 0.00% $0.00 0.00% $3,897.31 0.54% $715,508.61 99.46% $719,405.92
Department of Charitable Gaming $695.18 0.86% $0.00 0.00% $349.56 0.43% $0.00 0.00% $0.00 0.00% $1,044.74 1.29% $80,241.30 98.71% $81,286.04
Department of Conservation & Recreation $93,257.28 0.78% $18,901.35 0.16% $72,158.27 0.60% $24,345.10 0.20% $144,620.15 1.20% $353,282.15 2.94% $11,665,612.55 97.06% $12,018,894.70
Department of Correctional Education $113,300.74 2.63% $32,391.56 0.75% $315,421.82 7.32% $291.16 0.01% $6,382.00 0.15% $467,787.28 10.86% $3,840,402.11 89.14% $4,308,189.39
Department of Corrections $1,278,854.50 0.35% $43,740.41 0.01% $2,394,608.99 0.65% $49,748.73 0.01% $1,568,825.99 0.43% $5,335,778.62 1.46% $360,710,717.75 98.54% $366,046,496.37
Department of Criminal Justice Services $150.10 0.01% $0.00 0.00% $99,962.64 3.58% $0.00 0.00% $38,257.51 1.37% $138,370.25 4.95% $2,655,018.63 95.05% $2,793,388.88
Department of Education $319.99 0.00% $0.00 0.00% $10,301.59 0.02% $0.00 0.00% $0.00 0.00% $10,621.58 0.03% $41,961,201.23 99.97% $41,971,822.81
Department of Emergency Management $4,847.57 0.07% $13,770.79 0.21% $83,502.83 1.26% $0.00 0.00% $45,446.55 0.69% $147,567.74 2.23% $6,458,535.44 97.77% $6,606,103.18
Department of Employment Dispute Resolution $0.00 0.00% $0.00 0.00% $0.00 0.00% $0.00 0.00% $0.00 0.00% $0.00 0.00% $62,563.65 100.00% $62,563.65
Department of Environmental Quality $2,075.03 0.04% $6,504.72 0.12% $58,869.17 1.07% $3,829.00 0.07% $975.00 0.02% $72,252.92 1.31% $5,434,495.77 98.69% $5,506,748.69
Department of Fire Programs $17,262.95 0.30% $4,124.29 0.07% $113,894.44 1.97% $0.00 0.00% $829.84 0.01% $136,111.52 2.35% $5,650,774.43 97.65% $5,786,885.95
Department of Forensic Science $150.10 0.00% $0.00 0.00% $810,343.72 4.03% $599.98 0.00% $13,685.00 0.07% $824,778.80 4.11% $19,266,028.01 95.89% $20,090,806.81
Department of Forestry $99,165.70 0.74% $805.00 0.01% $9,758.55 0.07% $0.00 0.00% $33,790.52 0.25% $143,519.77 1.07% $13,316,152.03 98.93% $13,459,671.80

Prime Contractor Utilization Based On The Commonwealth Accounting and Reporting System (CARS)
Page N-19
EXHIBIT N-5 (Continued) COMMONWEALTH OF VIRGINIA
GOODS AND SUPPLIES UTILIZATION ANALYSIS OF PRIME CONTRACTORS BASED ON CARS
DOLLARS AND PERCENTAGE OF TOTAL DOLLARS PAID BY AGENCY NAME AND RACE/ETHNICITY/GENDER CLASSIFICATION
JULY 1, 2005, THROUGH JUNE 30, 2009
Agency African Hispanic Asian Native Nonminority M/WBE Non-M/WBE Total
Description Americans Americans Americans Americans Women Firms Firms Dollars
$ %1$ %1
$ %1$ %1
$ %1$ %1
$ %1$
Department of Game and Inland Fisheries $37,650.00 0.15% $126,398.85 0.51% $709,507.10 2.86% $0.00 0.00% $35,330.25 0.14% $908,886.20 3.66% $23,921,860.02 96.34% $24,830,746.22
Department of General Services $334,065.81 0.17% $146,594.15 0.07% $4,390,532.32 2.18% $238.00 0.00% $87,387.33 0.04% $4,958,817.61 2.47% $196,147,147.14 97.53% $201,105,964.75
Department of Health $126,053.96 0.05% $54.72 0.00% $487,472.99 0.19% $6,174.90 0.00% $390,870.62 0.15% $1,010,627.19 0.40% $253,018,084.42 99.60% $254,028,711.61
Department of Health Professions $0.00 0.00% $0.00 0.00% $0.00 0.00% $0.00 0.00% $0.00 0.00% $0.00 0.00% $4,566,378.14 100.00% $4,566,378.14
Department of Historic Resources $0.00 0.00% $0.00 0.00% $0.00 0.00% $0.00 0.00% $0.00 0.00% $0.00 0.00% $450,023.33 100.00% $450,023.33
Department of Housing and Community Development $914.96 0.08% $0.00 0.00% $487.38 0.05% $0.00 0.00% $0.00 0.00% $1,402.34 0.13% $1,079,163.89 99.87% $1,080,566.23
Department of Human Resource Management $8,867.57 0.59% $0.00 0.00% $7,759.00 0.52% $0.00 0.00% $714.00 0.05% $17,340.57 1.16% $1,483,293.65 98.84% $1,500,634.22
Department of Juvenile Justice $137,033.03 0.66% $8,436.00 0.04% $42,806.04 0.21% $10,282.01 0.05% $27,493.13 0.13% $226,050.21 1.09% $20,535,070.16 98.91% $20,761,120.37
Department of Labor and Industry $41,037.82 4.32% $0.00 0.00% $12,420.43 1.31% $0.00 0.00% $1,673.67 0.18% $55,131.92 5.80% $894,846.95 94.20% $949,978.87
Department of Medical Assistance Services $2,258.00 0.05% $0.00 0.00% $40,748.90 0.95% $0.00 0.00% $39,900.68 0.93% $82,907.58 1.94% $4,189,227.93 98.06% $4,272,135.51
Department of Military Affairs $999,809.10 5.47% $43,626.40 0.24% $61,813.14 0.34% $0.00 0.00% $11,500.00 0.06% $1,116,748.64 6.10% $17,177,504.71 93.90% $18,294,253.35
Department of Mines, Minerals and Energy $0.00 0.00% $0.00 0.00% $6,591.09 0.19% $0.00 0.00% $49.99 0.00% $6,641.08 0.19% $3,434,711.17 99.81% $3,441,352.25
Department of Minority Business Enterprise $1,596.12 0.51% $0.00 0.00% $10,260.91 3.30% $978.86 0.31% $3,226.70 1.04% $16,062.59 5.17% $294,917.31 94.83% $310,979.90
Department of Motor Vehicles $1,547.92 0.00% $6,295.00 0.02% $2,556.00 0.01% $0.00 0.00% $57,475.00 0.14% $67,873.92 0.17% $40,123,978.07 99.83% $40,191,851.99
Department of Planning and Budget $0.00 0.00% $0.00 0.00% $0.00 0.00% $0.00 0.00% $0.00 0.00% $0.00 0.00% $130,787.46 100.00% $130,787.46
Department of Professional and Occupational Regulation $1,411.50 0.05% $4,500.00 0.16% $3,143.14 0.11% $0.00 0.00% $0.00 0.00% $9,054.64 0.31% $2,867,430.82 99.69% $2,876,485.46
Department of Rehabilitative Services $14,971.83 0.06% $3,187.00 0.01% $100,452.21 0.43% $0.00 0.00% $154,296.50 0.66% $272,907.54 1.16% $23,275,363.56 98.84% $23,548,271.10
Department of Social Services $151,565.14 1.07% $0.00 0.00% $74,331.60 0.53% $1,205.38 0.01% $218.75 0.00% $227,320.87 1.61% $13,918,314.73 98.39% $14,145,635.60
Department of State Police $142,449.61 0.15% $21,321.65 0.02% $1,341,103.51 1.40% $26,588.80 0.03% $360,688.90 0.38% $1,892,152.47 1.97% $94,237,688.16 98.03% $96,129,840.63
Department of Taxation $13,729.16 0.03% $0.00 0.00% $17,736.18 0.04% $0.00 0.00% $74,228.66 0.18% $105,694.00 0.26% $41,203,469.38 99.74% $41,309,163.38
Department of the Treasury $0.00 0.00% $0.00 0.00% $751.23 0.03% $0.00 0.00% $0.00 0.00% $751.23 0.03% $2,688,422.24 99.97% $2,689,173.47
Department of Veterans Services $1,572.96 0.02% $0.00 0.00% $2,763.56 0.03% $0.00 0.00% $125.60 0.00% $4,462.12 0.06% $8,025,673.18 99.94% $8,030,135.30
Dept. of Mental Health, Mental Retardation and Substance Abuse Services $268,647.91 0.10% $84,452.41 0.03% $290,558.17 0.10% $63,470.30 0.02% $232,201.06 0.08% $939,329.85 0.33% $280,543,838.79 99.67% $281,483,168.64
Eastern Shore Community College $0.00 0.00% $449.00 0.01% $142,927.50 4.44% $1,651.50 0.05% $5,019.90 0.16% $150,047.90 4.66% $3,069,376.17 95.34% $3,219,424.07
Frontier Culture Museum of Virginia $0.00 0.00% $0.00 0.00% $555.36 0.13% $0.00 0.00% $99.07 0.02% $654.43 0.15% $423,579.81 99.85% $424,234.24
Germanna Community College $0.00 0.00% $0.00 0.00% $0.00 0.00% $0.00 0.00% $469.80 0.00% $469.80 0.00% $14,451,771.16 100.00% $14,452,240.96
Gunston Hall $1,649.00 0.49% $0.00 0.00% $0.00 0.00% $0.00 0.00% $0.00 0.00% $1,649.00 0.49% $336,648.49 99.51% $338,297.49
Human Rights Council $95.00 0.25% $10.49 0.03% $0.00 0.00% $0.00 0.00% $0.00 0.00% $105.49 0.28% $38,185.40 99.72% $38,290.89
J. Sargeant Reynolds Community College $30,726.10 0.14% $295.36 0.00% $507,850.31 2.28% $726.71 0.00% $46,182.76 0.21% $585,781.24 2.62% $21,730,463.09 97.38% $22,316,244.33
Jamestown-Yorktown Foundation $33,039.34 0.32% $0.00 0.00% $31,838.28 0.31% $0.00 0.00% $7,100.00 0.07% $71,977.62 0.70% $10,252,174.62 99.30% $10,324,152.24

Prime Contractor Utilization Based On The Commonwealth Accounting and Reporting System (CARS)
Page N-20
EXHIBIT N-5 (Continued) COMMONWEALTH OF VIRGINIA
GOODS AND SUPPLIES UTILIZATION ANALYSIS OF PRIME CONTRACTORS BASED ON CARS
DOLLARS AND PERCENTAGE OF TOTAL DOLLARS PAID BY AGENCY NAME AND RACE/ETHNICITY/GENDER CLASSIFICATION
JULY 1, 2005, THROUGH JUNE 30, 2009
Agency African Hispanic Asian Native Nonminority M/WBE Non-M/WBE Total
Description Americans Americans Americans Americans Women Firms Firms Dollars
$ %1$ %1
$ %1$ %1
$ %1$ %1
$ %1$
John Tyler Community College $0.00 0.00% $9,743.80 0.08% $306,657.18 2.56% $0.00 0.00% $0.00 0.00% $316,400.98 2.64% $11,659,534.20 97.36% $11,975,935.18
Lieutenant Governor $0.00 0.00% $0.00 0.00% $0.00 0.00% $0.00 0.00% $0.00 0.00% $0.00 0.00% $27,655.03 100.00% $27,655.03
Longwood University $198,597.67 0.51% $5,958.00 0.02% $1,352,019.43 3.46% $0.00 0.00% $38,380.25 0.10% $1,594,955.35 4.09% $37,437,544.05 95.91% $39,032,499.40
Lord Fairfax Community College $55,979.63 1.02% $30,504.00 0.56% $459,947.31 8.40% $0.00 0.00% $13,692.93 0.25% $560,123.87 10.23% $4,914,571.21 89.77% $5,474,695.08
Marine Resources Commission $2,727.50 0.02% $49,822.80 0.40% $4,816.00 0.04% $0.00 0.00% $1,398.00 0.01% $58,764.30 0.47% $12,423,372.81 99.53% $12,482,137.11
Motor Vehicle Dealer Board $0.00 0.00% $0.00 0.00% $0.00 0.00% $0.00 0.00% $0.00 0.00% $0.00 0.00% $235,208.59 100.00% $235,208.59
Mountain Empire Community College $5,249.76 0.06% $946.95 0.01% $129,550.76 1.55% $0.00 0.00% $16,256.21 0.19% $152,003.68 1.82% $8,194,420.51 98.18% $8,346,424.19
New River Community College $8,628.15 0.06% $48,851.30 0.34% $122,107.55 0.86% $259.98 0.00% $697.07 0.00% $180,544.05 1.27% $14,011,469.57 98.73% $14,192,013.62
Norfolk State University $995,405.69 2.03% $23,377.58 0.05% $1,109,408.71 2.26% $0.00 0.00% $63,953.98 0.13% $2,192,145.96 4.47% $46,798,962.88 95.53% $48,991,108.84
Northern Virginia Community College $9,642.70 0.02% $269,825.87 0.45% $4,490,823.08 7.56% $0.00 0.00% $3,592.00 0.01% $4,773,883.65 8.04% $54,633,263.65 91.96% $59,407,147.30
Office for Substance Abuse Prevention $0.00 0.00% $0.00 0.00% $0.00 0.00% $0.00 0.00% $0.00 0.00% $0.00 0.00% $12,423.42 100.00% $12,423.42
Office of Commonwealth Preparedness $0.00 0.00% $0.00 0.00% $0.00 0.00% $0.00 0.00% $0.00 0.00% $0.00 0.00% $55,039.48 100.00% $55,039.48
Office of the Governor $0.00 0.00% $0.00 0.00% $0.00 0.00% $0.00 0.00% $0.00 0.00% $0.00 0.00% $1,059,531.36 100.00% $1,059,531.36
Patrick Henry Community College $3,133.97 0.04% $0.00 0.00% $25,214.68 0.36% $0.00 0.00% $18,158.01 0.26% $46,506.66 0.66% $6,997,324.99 99.34% $7,043,831.65
Paul D. Camp Community College $0.00 0.00% $0.00 0.00% $73,675.82 1.79% $0.00 0.00% $0.00 0.00% $73,675.82 1.79% $4,042,549.10 98.21% $4,116,224.92
Piedmont Virginia Community College $80.00 0.00% $0.00 0.00% $44,799.31 0.61% $0.00 0.00% $14,349.86 0.20% $59,229.17 0.81% $7,251,109.44 99.19% $7,310,338.61
Rappahannock Community College $19,434.34 0.32% $0.00 0.00% $161,441.19 2.64% $0.00 0.00% $0.00 0.00% $180,875.53 2.96% $5,924,277.86 97.04% $6,105,153.39
Richard Bland College $0.00 0.00% $0.00 0.00% $13,841.01 0.39% $0.00 0.00% $0.00 0.00% $13,841.01 0.39% $3,492,747.42 99.61% $3,506,588.43
Secretary of Administration $0.00 0.00% $0.00 0.00% $0.00 0.00% $0.00 0.00% $0.00 0.00% $0.00 0.00% $289,069.59 100.00% $289,069.59
Secretary of Agriculture and Forestry $0.00 0.00% $0.00 0.00% $0.00 0.00% $0.00 0.00% $0.00 0.00% $0.00 0.00% $3,381.69 100.00% $3,381.69
Secretary of Commerce and Trade $0.00 0.00% $0.00 0.00% $0.00 0.00% $0.00 0.00% $0.00 0.00% $0.00 0.00% $9,248.67 100.00% $9,248.67
Secretary of Education $0.00 0.00% $0.00 0.00% $0.00 0.00% $0.00 0.00% $0.00 0.00% $0.00 0.00% $13,431.93 100.00% $13,431.93
Secretary of Finance $0.00 0.00% $0.00 0.00% $0.00 0.00% $0.00 0.00% $0.00 0.00% $0.00 0.00% $8,621.12 100.00% $8,621.12
Secretary of Health & Human Resources $0.00 0.00% $0.00 0.00% $0.00 0.00% $0.00 0.00% $0.00 0.00% $0.00 0.00% $10,348.54 100.00% $10,348.54
Secretary of Natural Resources $0.00 0.00% $0.00 0.00% $0.00 0.00% $0.00 0.00% $0.00 0.00% $0.00 0.00% $8,687.49 100.00% $8,687.49
Secretary of Public Safety $675.00 5.46% $0.00 0.00% $0.00 0.00% $0.00 0.00% $0.00 0.00% $675.00 5.46% $11,689.03 94.54% $12,364.03
Secretary of Technology $0.00 0.00% $0.00 0.00% $0.00 0.00% $0.00 0.00% $0.00 0.00% $0.00 0.00% $25,842.30 100.00% $25,842.30
Secretary of the Commonwealth $0.00 0.00% $0.00 0.00% $0.00 0.00% $0.00 0.00% $0.00 0.00% $0.00 0.00% $168,116.94 100.00% $168,116.94
Secretary of Transportation $0.00 0.00% $0.00 0.00% $0.00 0.00% $0.00 0.00% $0.00 0.00% $0.00 0.00% $11,219.42 100.00% $11,219.42
Southern Virginia Higher Eduation Center $0.00 0.00% $0.00 0.00% $93,084.13 5.40% $0.00 0.00% $0.00 0.00% $93,084.13 5.40% $1,632,080.40 94.60% $1,725,164.53

Prime Contractor Utilization Based On The Commonwealth Accounting and Reporting System (CARS)
Page N-21
EXHIBIT N-5 (Continued) COMMONWEALTH OF VIRGINIA
GOODS AND SUPPLIES UTILIZATION ANALYSIS OF PRIME CONTRACTORS BASED ON CARS
DOLLARS AND PERCENTAGE OF TOTAL DOLLARS PAID BY AGENCY NAME AND RACE/ETHNICITY/GENDER CLASSIFICATION
JULY 1, 2005, THROUGH JUNE 30, 2009
Agency African Hispanic Asian Native Nonminority M/WBE Non-M/WBE Total
Description Americans Americans Americans Americans Women Firms Firms Dollars
$ %1$ %1
$ %1$ %1
$ %1$ %1
$ %1$
Southside Virginia Community College $4,324.79 0.05% $7,386.90 0.08% $76,511.28 0.87% $834.45 0.01% $2,428.97 0.03% $91,486.39 1.04% $8,682,998.50 98.96% $8,774,484.89
Southwest Virginia Community College $6,717.11 0.10% $31,790.00 0.49% $57,123.82 0.88% $0.00 0.00% $5,874.52 0.09% $101,505.45 1.56% $6,421,781.74 98.44% $6,523,287.19
State Board of Elections $0.00 0.00% $330.00 0.03% $110.90 0.01% $0.00 0.00% $0.00 0.00% $440.90 0.04% $1,220,728.36 99.96% $1,221,169.26
State Corporation Commission $0.00 0.00% $645.00 0.00% $1,117,160.52 7.06% $0.00 0.00% $107,564.88 0.68% $1,225,370.40 7.74% $14,606,410.59 92.26% $15,831,780.99
State Council of Higher Education for Virginia $0.00 0.00% $0.00 0.00% $0.00 0.00% $0.00 0.00% $0.00 0.00% $0.00 0.00% $84,911.99 100.00% $84,911.99
State Lottery Department $1,843,455.14 10.33% $0.00 0.00% $79,963.77 0.45% $0.00 0.00% $0.00 0.00% $1,923,418.91 10.77% $15,927,682.73 89.23% $17,851,101.64
The Library of Virginia $1,402.12 0.02% $11,431.08 0.15% $109,799.01 1.47% $0.00 0.00% $2,005.71 0.03% $124,637.92 1.67% $7,341,177.80 98.33% $7,465,815.72
The Science Museum of Virginia $710.71 0.01% $42.80 0.00% $5,251.34 0.10% $0.00 0.00% $42.97 0.00% $6,047.82 0.12% $5,214,969.75 99.88% $5,221,017.57
Thomas Nelson Community College $540,408.63 2.87% $267,700.63 1.42% $1,406,138.38 7.46% $0.00 0.00% $9,566.47 0.05% $2,223,814.11 11.80% $16,622,727.95 88.20% $18,846,542.06
Tidewater Community College $20,850.48 0.04% $179,004.08 0.38% $1,590,832.90 3.36% $0.00 0.00% $9,562.73 0.02% $1,800,250.19 3.80% $45,593,379.75 96.20% $47,393,629.94
Tobacco Indemnification & Revitalization Commission $0.00 0.00% $0.00 0.00% $0.00 0.00% $0.00 0.00% $0.00 0.00% $0.00 0.00% $61,727.14 100.00% $61,727.14
Virginia Agricultural Council $0.00 0.00% $0.00 0.00% $0.00 0.00% $0.00 0.00% $0.00 0.00% $0.00 0.00% $1,032.06 100.00% $1,032.06
Virginia Board for People with Disabilities $0.00 0.00% $0.00 0.00% $0.00 0.00% $0.00 0.00% $0.00 0.00% $0.00 0.00% $134,777.85 100.00% $134,777.85
Virginia College Savings Plan $0.00 0.00% $0.00 0.00% $5,914.89 0.27% $0.00 0.00% $0.00 0.00% $5,914.89 0.27% $2,214,176.17 99.73% $2,220,091.06
Virginia Commission for the Arts $4,230.41 6.24% $0.00 0.00% $0.00 0.00% $0.00 0.00% $0.00 0.00% $4,230.41 6.24% $63,587.44 93.76% $67,817.85
Virginia Community College System $0.00 0.00% $1,475,826.71 2.70% $989,297.44 1.81% $4,413.00 0.01% $850.00 0.00% $2,470,387.15 4.51% $52,244,862.98 95.49% $54,715,250.13
Virginia Department for the Blind and Vision Impaired $93,337.47 0.13% $0.00 0.00% $2,373,855.64 3.26% $0.00 0.00% $501,736.88 0.69% $2,968,929.99 4.08% $69,882,494.60 95.92% $72,851,424.59
Virginia Employment Commission $1,232.13 0.01% $11,358.72 0.12% $87,040.06 0.92% $0.00 0.00% $52,802.56 0.56% $152,433.47 1.62% $9,260,269.58 98.38% $9,412,703.05
Virginia Highlands Community College $0.00 0.00% $0.00 0.00% $2,434.15 0.04% $0.00 0.00% $0.00 0.00% $2,434.15 0.04% $6,281,107.45 99.96% $6,283,541.60
Virginia Information Technologies Agency $71,906.54 0.09% $758,979.70 0.93% $10,306,851.21 12.67% $6,319.82 0.01% $4,840.19 0.01% $11,148,897.46 13.70% $70,225,203.50 86.30% $81,374,100.96
Virginia Military Institute $9,137.58 0.03% $2,153.00 0.01% $553,349.70 1.88% $13,151.18 0.04% $16,060.97 0.05% $593,852.43 2.01% $28,915,503.33 97.99% $29,509,355.76
Virginia Museum of Fine Arts $14,003.74 0.28% $16,945.14 0.33% $12,647.96 0.25% $0.00 0.00% $23,497.00 0.46% $67,093.84 1.32% $4,997,109.94 98.68% $5,064,203.78
Virginia Museum of Natural History $0.00 0.00% $0.00 0.00% $5,628.85 0.14% $0.00 0.00% $48,390.48 1.23% $54,019.33 1.38% $3,868,613.14 98.62% $3,922,632.47
Virginia Office for Protection and Advocacy $0.00 0.00% $0.00 0.00% $0.00 0.00% $0.00 0.00% $0.00 0.00% $0.00 0.00% $307,544.17 100.00% $307,544.17
Virginia Parole Board $0.00 0.00% $0.00 0.00% $0.00 0.00% $0.00 0.00% $0.00 0.00% $0.00 0.00% $6,480.24 100.00% $6,480.24
Virginia Racing Commission $0.00 0.00% $0.00 0.00% $1,892.23 1.81% $0.00 0.00% $0.00 0.00% $1,892.23 1.81% $102,721.50 98.19% $104,613.73
Virginia Retirement System $0.00 0.00% $0.00 0.00% $284,876.33 4.05% $0.00 0.00% $413.61 0.01% $285,289.94 4.06% $6,748,183.56 95.94% $7,033,473.50
Virginia School for Deaf and Blind at Staunton $2,269.66 0.08% $464.00 0.02% $3,216.72 0.12% $0.00 0.00% $0.00 0.00% $5,950.38 0.22% $2,673,112.22 99.78% $2,679,062.60
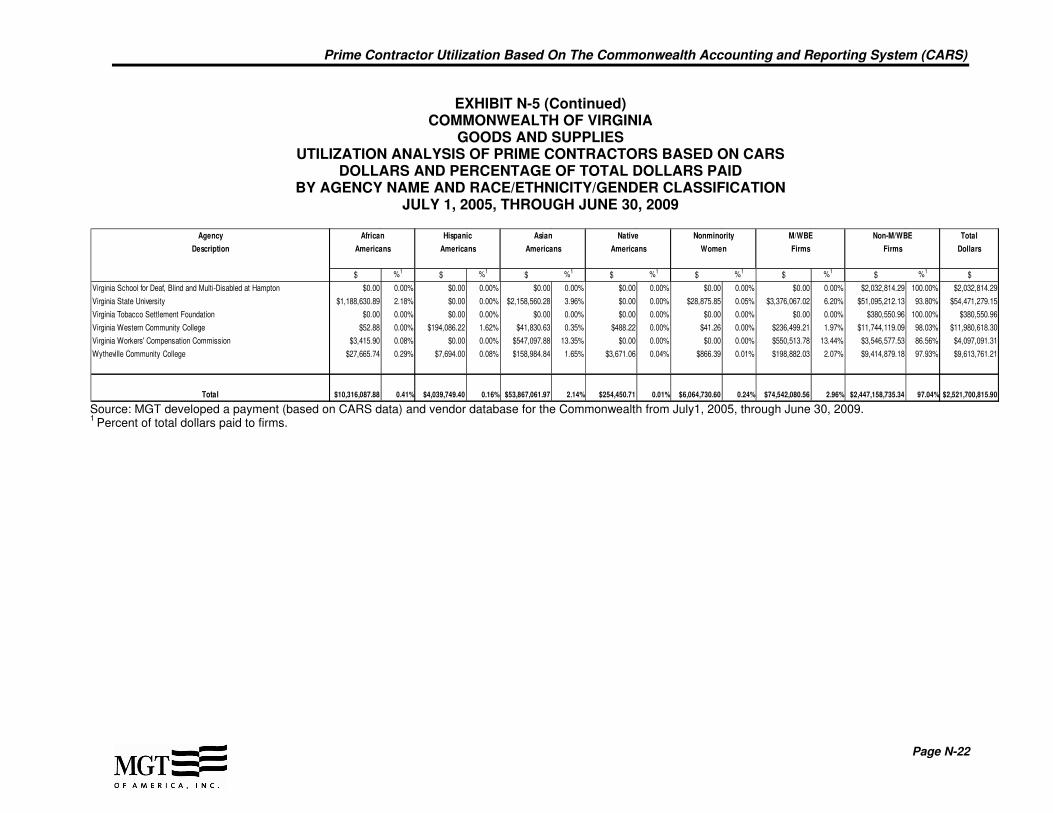
Prime Contractor Utilization Based On The Commonwealth Accounting and Reporting System (CARS)
Page N-22
EXHIBIT N-5 (Continued) COMMONWEALTH OF VIRGINIA
GOODS AND SUPPLIES UTILIZATION ANALYSIS OF PRIME CONTRACTORS BASED ON CARS
DOLLARS AND PERCENTAGE OF TOTAL DOLLARS PAID BY AGENCY NAME AND RACE/ETHNICITY/GENDER CLASSIFICATION
JULY 1, 2005, THROUGH JUNE 30, 2009
Agency African Hispanic Asian Native Nonminority M/WBE Non-M/WBE Total
Description Americans Americans Americans Americans Women Firms Firms Dollars
$ %1$ %1
$ %1$ %1
$ %1$ %1
$ %1$
Virginia School for Deaf, Blind and Multi-Disabled at Hampton $0.00 0.00% $0.00 0.00% $0.00 0.00% $0.00 0.00% $0.00 0.00% $0.00 0.00% $2,032,814.29 100.00% $2,032,814.29
Virginia State University $1,188,630.89 2.18% $0.00 0.00% $2,158,560.28 3.96% $0.00 0.00% $28,875.85 0.05% $3,376,067.02 6.20% $51,095,212.13 93.80% $54,471,279.15
Virginia Tobacco Settlement Foundation $0.00 0.00% $0.00 0.00% $0.00 0.00% $0.00 0.00% $0.00 0.00% $0.00 0.00% $380,550.96 100.00% $380,550.96
Virginia Western Community College $52.88 0.00% $194,086.22 1.62% $41,830.63 0.35% $488.22 0.00% $41.26 0.00% $236,499.21 1.97% $11,744,119.09 98.03% $11,980,618.30
Virginia Workers' Compensation Commission $3,415.90 0.08% $0.00 0.00% $547,097.88 13.35% $0.00 0.00% $0.00 0.00% $550,513.78 13.44% $3,546,577.53 86.56% $4,097,091.31
Wytheville Community College $27,665.74 0.29% $7,694.00 0.08% $158,984.84 1.65% $3,671.06 0.04% $866.39 0.01% $198,882.03 2.07% $9,414,879.18 97.93% $9,613,761.21
Total $10,316,087.88 0.41% $4,039,749.40 0.16% $53,867,061.97 2.14% $254,450.71 0.01% $6,064,730.60 0.24% $74,542,080.56 2.96% $2,447,158,735.34 97.04% $2,521,700,815.90 Source: MGT developed a payment (based on CARS data) and vendor database for the Commonwealth from July1, 2005, through June 30, 2009. 1
Percent of total dollars paid to firms.