a dynamic and generic cloud computing model for glaciological image processing
TRANSCRIPT
Ap
Éa
b
a
ARA
KEiICSW
1
ittHac(Lcswptte
ocs
f
0h
International Journal of Applied Earth Observation and Geoinformation 27 (2014) 109–115
Contents lists available at ScienceDirect
International Journal of Applied Earth Observation andGeoinformation
jo ur nal home page: www.elsev ier .com/ locate / jag
dynamic and generic cloud computing model for glaciological imagerocessing
lisabeth Ranisavljevic a,∗, Florent Devina, Dominique Lafflyb, Yannick Le Nira
École Internationale des Sciences du Traitement de l’Information, 2 boulevard Lucien Favre, CS 77563, 64 075 Pau Cedex, France1
University of Toulouse, GEODE UMR 5602 CNRS, Maison de la recherche, 5 allées Antonio Machado, 31 058 Toulouse Cedex, France
r t i c l e i n f o
rticle history:eceived 20 December 2012ccepted 9 August 2013
eywords:
a b s t r a c t
As satellite imaging is quite expensive, and because of poor weather conditions including common heavycloud cover at polar latitudes, daily satellite imaging is not always accessible or suitable to observefast temporal evolutions. We complement satellite imagery with a set of ground based autonomousautomated digital cameras which take three pictures a day. With these pictures we build a mosaic with
nvironmentn situ sensingmageloud computingchedulereb service
their projection and apply a classification to define the temporal evolution of the snow cover. As thepictures are subject to heavy disturbance, some processing is needed to build the mosaic. Once theprocesses are defined, we present our model. This model is built upon a cloud computing environmentusing Web services workflow. Then we present how the processes are dynamically organized using ascheduler. This scheduler chooses the order and the processes to apply to every picture to build themosaic. Once we obtain a mosaic we can study the variation of the snow cover.
. Introduction
Polar regions and especially glaciers are considered as relevantndicators of climate change (Bernard, 2011). In 2007, the Interna-ional Polar Year coordinated many different projects focused onhe Arctic and Antarctic dynamics. One of these projects was theydrow-Sensor-FLOW (HSF), supervised by M. Griselin, C. Marlinnd D. Laffly (Laffly et al., 2012). Its study area is located on the westoast of Spitsberg (Svalbard) and focused on the East Lovén glacierFig. 1). HSF aims to follow the spatiotemporal dynamics of the Eastovén glacier to understand its reactivity to climate change. HSFombines the disciplines of hydrology, glaciology, climatology andnow science. For this project, a rich database has been designedith temperature, precipitation, remote sensing imagery, in situictures, digital model elevation, snow density, etc. Environmen-al analysis is obtained by linking all the analyses from each expertogether: water balance, classification of the different glacier states,tc. (Bernard, 2011).
One of the goals of the HSF is to map the temporal evolution
f the snow cover of a glacier. In order to process it, we need toollect images of the whole glacier and then classify the differenttates (snow and ice). Due to poor weather conditions including∗ Corresponding author. Tel.: +33 559059091.E-mail addresses: [email protected], [email protected] (É. Ranisavljevic),
[email protected] (F. Devin), [email protected] (D. Laffly), [email protected] (Y. Le Nir).1 http://www.eisti.fr.
303-2434/$ – see front matter © 2013 Elsevier B.V. All rights reserved.ttp://dx.doi.org/10.1016/j.jag.2013.08.008
© 2013 Elsevier B.V. All rights reserved.
common heavy cloud cover at polar latitudes and because of itscost, daily remote sensing images are not always accessible. More-over, fast events like floods or blankets of snow are missed bysatellite based studies, since the slowest sampling rate is unableto observe them. In order to overcome this problem, a set of sixground based autonomous2 digital cameras has been installed inthe glacier, covering the whole area (Corripio, 2004; Hinkler et al.,2002; Laffly et al., 2012; Newbery and Southwell, 2009). The cam-eras are commercial off-the-shelf (either Leica D-Lux4 or PanasonicLumix LX3), selected for their optical lens, high sensor resolution(10Mpixel sensors) and data storage on Secure Digital mass storagememory card. They have been customized (e.g., airtight enclosureand microcontroller) in order to support the hard polar climateconditions. The ground datasets provide a high spacial resolutionof 10–100 cm/pixel side (Laffly et al., 2012). An example of sucha concept is given in Fig. 2. As the cameras are at low altitude, allunder 550 m, they are regularly below the clouds. The cameras havebeen programmed to take three pictures a day (08:00, 12:00 and16:00) since summer 2007 to complement satellite imagery. Withthe different in situ pictures, a map projection can be built up bymosaicking and georeferencing data.
The actual database contains 13 415 images (65 Gb). These pic-
tures form a very large database, but there is noise because ofweather conditions, electronic deficiency and geometry variations.2 This means that they are also automated.

110 É. Ranisavljevic et al. / International Journal of Applied Earth Observation and Geoinformation 27 (2014) 109–115
f the E
2
tgdd
cbei
nrwcmwa
3
tapr
Fig. 1. Location o
. Objectives
Nowadays, spatial environmental analysis is done using specificools. These tools may be GIS like ArcGIS, or a simple script or pro-ram developed internally. They are not always user-friendly, ando not allow mass processing. Each method of processing has to beone specifically for each group of data.
This gives rise to the following questions: how can a tool bereated which can fit the full process of this analysis and which cane re-usable in other similar analyses? How can it be made dynamicnough to adapt to the different possible scenarios? Moreover, hows such a large database to be used?
We will first discuss about the data and the different taskseeded to orthorectify the images in order to define the tempo-al evolution of the snow cover of the glacier (Section 3). Then, weill propose an architecture model of a standalone tool which can
lassify a large variety of phenomena avoiding human operation asuch as possible. This model is based on cloud computing that weill introduce in Section 4. We will finally present the model and
rchitecture of the application in Section 5.
. Data: processing and disturbances
In order to build up a mosaic from the in situ pictures projected,
he data have to be processed. This process can be split into severaltomic tasks: classification, cleaning, projection, dating and crop-ing. In our situation, cropping is a transformation that combinesotation and translation. Not all the pictures need to be processedast Lovén glacier.
by all the tasks, and the calling order of the different tasks may vary.As the series of the tasks in our model can vary, we only focus onthe functionality of the tasks rather than their implementations.
3.1. Classification
To identify the different parts of the glacier (snow, ice, rock,etc.) a classification task is needed. There are many algorithmsof classification that can be termed as either supervised or unsu-pervised. A supervised learning algorithm applies the knowledgelearnt from the training data to the new data. Whereas an unsu-pervised learning algorithm splits the data into groups in order tojoin together data that have the most similarities. Among them,the standard algorithms of geographical satellite-image classifica-tion are K-means (Duda et al., 2000; Marroquin and Girosi, 1993),maximum-likelihood (Venkateswarlu and Raju, 1991) and SupportVector Machines (Cortes and Vapnik, 1995; Schölkopf and Smola,2001).
The classification can be applied at different levels. On the onehand, it can be realized on the map projection reconstructed fromthe in situ pictures. The drawback is that the quality of the image isreduced due to the processing which has been done several timesbefore, so the precision of the classification might be reduced too.
Alternatively, it can be realized on the in situ pictures. At that stateof the process, the pictures still have the same quality, but it meansthat the result of the classification will have to be processed in thesame way as the pictures in order to obtain the map projection.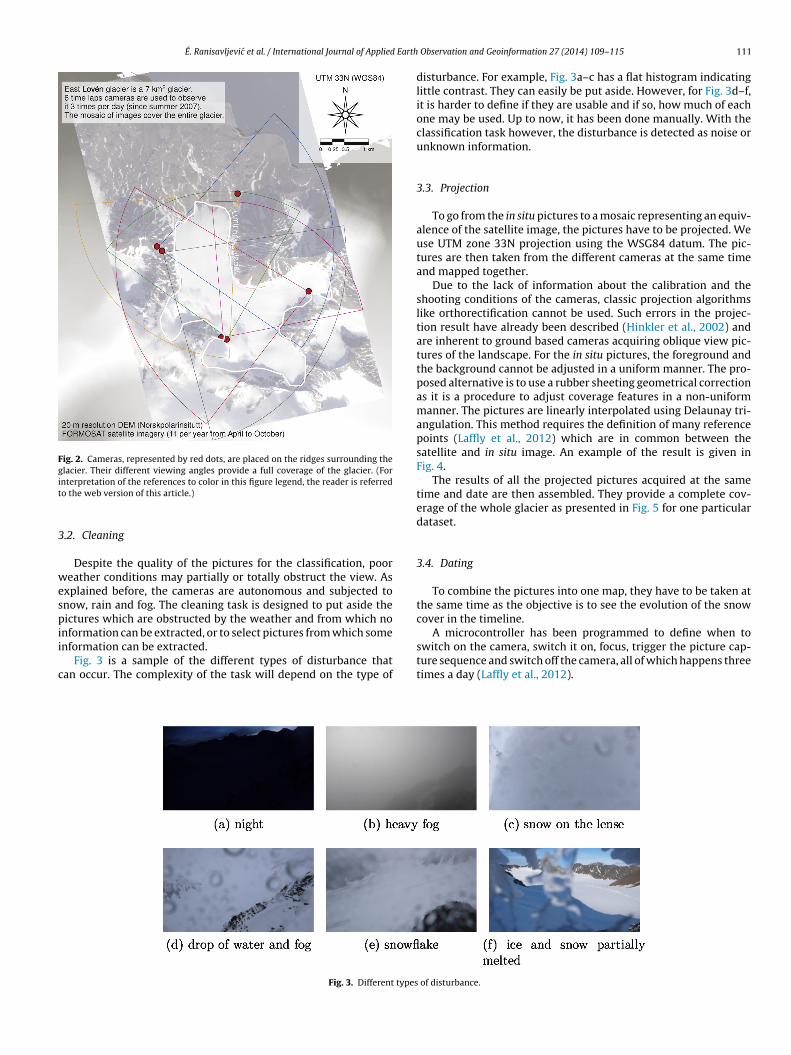
É. Ranisavljevic et al. / International Journal of Applied Earth
Fig. 2. Cameras, represented by red dots, are placed on the ridges surrounding theglacier. Their different viewing angles provide a full coverage of the glacier. (Forit
3
wespii
c
nterpretation of the references to color in this figure legend, the reader is referredo the web version of this article.)
.2. Cleaning
Despite the quality of the pictures for the classification, pooreather conditions may partially or totally obstruct the view. As
xplained before, the cameras are autonomous and subjected tonow, rain and fog. The cleaning task is designed to put aside theictures which are obstructed by the weather and from which no
nformation can be extracted, or to select pictures from which somenformation can be extracted.
Fig. 3 is a sample of the different types of disturbance thatan occur. The complexity of the task will depend on the type of
Fig. 3. Different types
Observation and Geoinformation 27 (2014) 109–115 111
disturbance. For example, Fig. 3a–c has a flat histogram indicatinglittle contrast. They can easily be put aside. However, for Fig. 3d–f,it is harder to define if they are usable and if so, how much of eachone may be used. Up to now, it has been done manually. With theclassification task however, the disturbance is detected as noise orunknown information.
3.3. Projection
To go from the in situ pictures to a mosaic representing an equiv-alence of the satellite image, the pictures have to be projected. Weuse UTM zone 33N projection using the WSG84 datum. The pic-tures are then taken from the different cameras at the same timeand mapped together.
Due to the lack of information about the calibration and theshooting conditions of the cameras, classic projection algorithmslike orthorectification cannot be used. Such errors in the projec-tion result have already been described (Hinkler et al., 2002) andare inherent to ground based cameras acquiring oblique view pic-tures of the landscape. For the in situ pictures, the foreground andthe background cannot be adjusted in a uniform manner. The pro-posed alternative is to use a rubber sheeting geometrical correctionas it is a procedure to adjust coverage features in a non-uniformmanner. The pictures are linearly interpolated using Delaunay tri-angulation. This method requires the definition of many referencepoints (Laffly et al., 2012) which are in common between thesatellite and in situ image. An example of the result is given inFig. 4.
The results of all the projected pictures acquired at the sametime and date are then assembled. They provide a complete cov-erage of the whole glacier as presented in Fig. 5 for one particulardataset.
3.4. Dating
To combine the pictures into one map, they have to be taken atthe same time as the objective is to see the evolution of the snowcover in the timeline.
A microcontroller has been programmed to define when toswitch on the camera, switch it on, focus, trigger the picture cap-ture sequence and switch off the camera, all of which happens threetimes a day (Laffly et al., 2012).
of disturbance.
112 É. Ranisavljevic et al. / International Journal of Applied Earth Observation and Geoinformation 27 (2014) 109–115
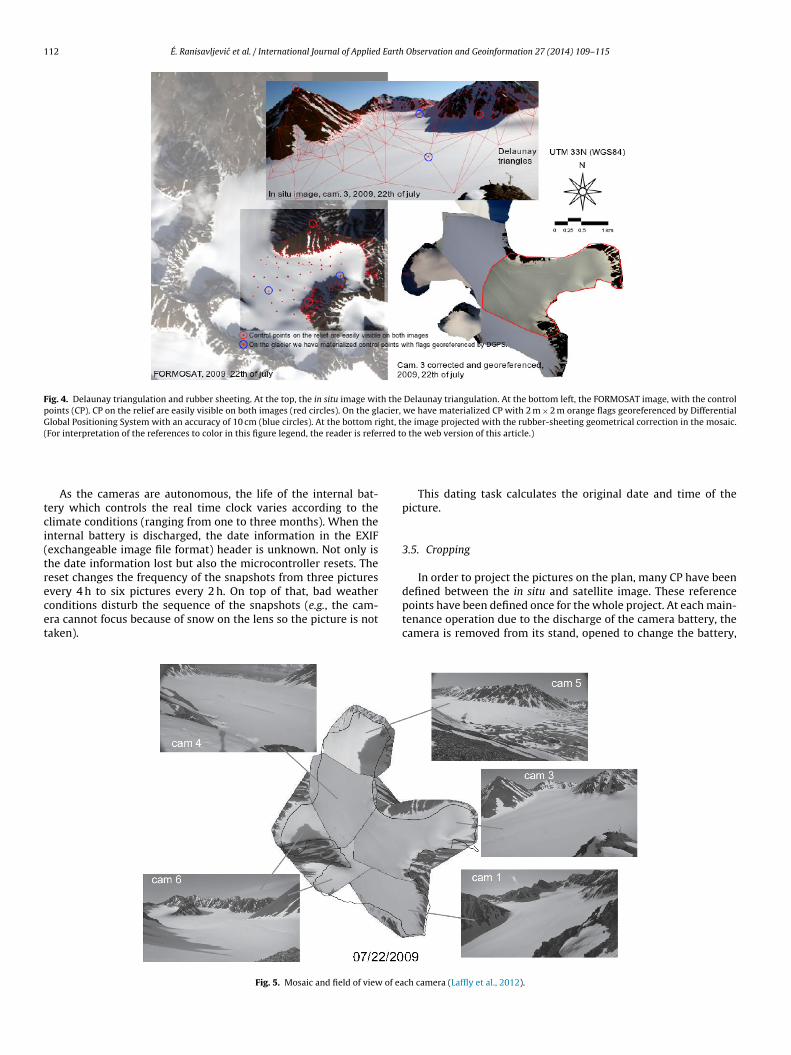
Fig. 4. Delaunay triangulation and rubber sheeting. At the top, the in situ image with the Delaunay triangulation. At the bottom left, the FORMOSAT image, with the controlpoints (CP). CP on the relief are easily visible on both images (red circles). On the glacier, we have materialized CP with 2 m × 2 m orange flags georeferenced by DifferentialGlobal Positioning System with an accuracy of 10 cm (blue circles). At the bottom right, the image projected with the rubber-sheeting geometrical correction in the mosaic.(For interpretation of the references to color in this figure legend, the reader is referred to the web version of this article.)
tci(trecet
As the cameras are autonomous, the life of the internal bat-ery which controls the real time clock varies according to thelimate conditions (ranging from one to three months). When thenternal battery is discharged, the date information in the EXIFexchangeable image file format) header is unknown. Not only ishe date information lost but also the microcontroller resets. Theeset changes the frequency of the snapshots from three pictures
very 4 h to six pictures every 2 h. On top of that, bad weatheronditions disturb the sequence of the snapshots (e.g., the cam-ra cannot focus because of snow on the lens so the picture is notaken).Fig. 5. Mosaic and field of view of ea
This dating task calculates the original date and time of thepicture.
3.5. Cropping
In order to project the pictures on the plan, many CP have been
defined between the in situ and satellite image. These referencepoints have been defined once for the whole project. At each main-tenance operation due to the discharge of the camera battery, thecamera is removed from its stand, opened to change the battery,ch camera (Laffly et al., 2012).
É. Ranisavljevic et al. / International Journal of Applied Earth
ai
scArd
t
po
123
Acdtu
vtd
tda
4
ps2
Gp
workflow, we will always have to project and build a mosaic from
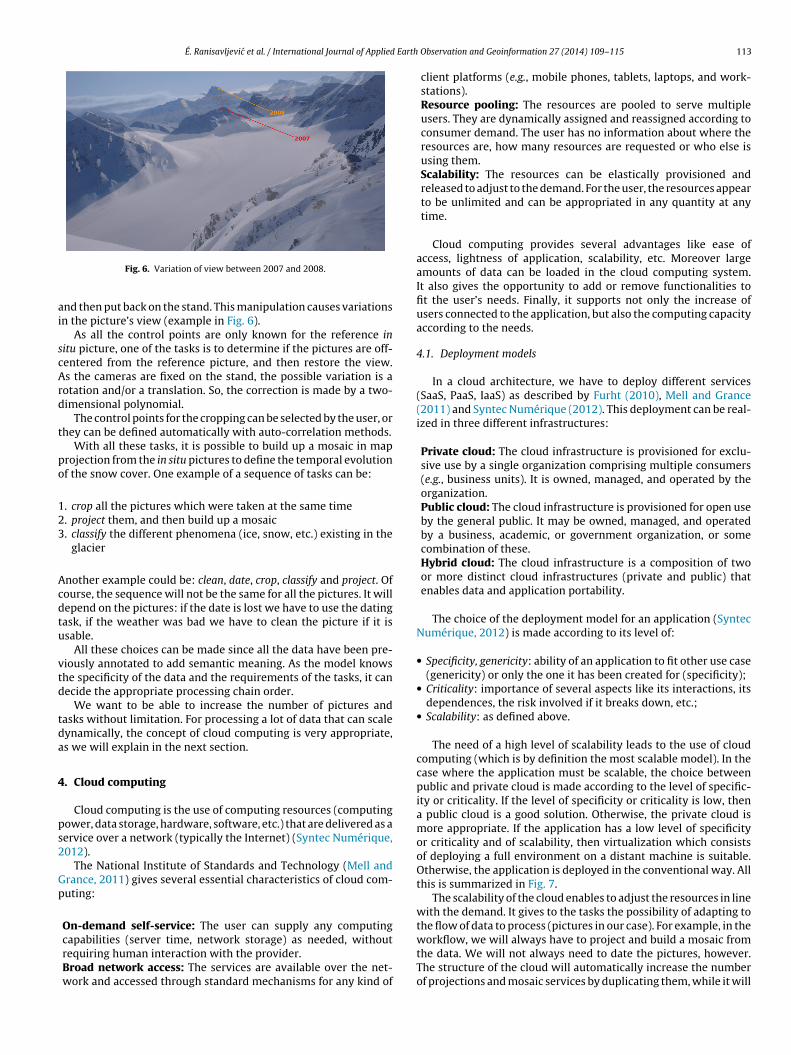
Fig. 6. Variation of view between 2007 and 2008.
nd then put back on the stand. This manipulation causes variationsn the picture’s view (example in Fig. 6).
As all the control points are only known for the reference initu picture, one of the tasks is to determine if the pictures are off-entered from the reference picture, and then restore the view.s the cameras are fixed on the stand, the possible variation is aotation and/or a translation. So, the correction is made by a two-imensional polynomial.
The control points for the cropping can be selected by the user, orhey can be defined automatically with auto-correlation methods.
With all these tasks, it is possible to build up a mosaic in maprojection from the in situ pictures to define the temporal evolutionf the snow cover. One example of a sequence of tasks can be:
. crop all the pictures which were taken at the same time
. project them, and then build up a mosaic
. classify the different phenomena (ice, snow, etc.) existing in theglacier
nother example could be: clean, date, crop, classify and project. Ofourse, the sequence will not be the same for all the pictures. It willepend on the pictures: if the date is lost we have to use the datingask, if the weather was bad we have to clean the picture if it issable.
All these choices can be made since all the data have been pre-iously annotated to add semantic meaning. As the model knowshe specificity of the data and the requirements of the tasks, it canecide the appropriate processing chain order.
We want to be able to increase the number of pictures andasks without limitation. For processing a lot of data that can scaleynamically, the concept of cloud computing is very appropriate,s we will explain in the next section.
. Cloud computing
Cloud computing is the use of computing resources (computingower, data storage, hardware, software, etc.) that are delivered as aervice over a network (typically the Internet) (Syntec Numérique,012).
The National Institute of Standards and Technology (Mell andrance, 2011) gives several essential characteristics of cloud com-uting:
On-demand self-service: The user can supply any computingcapabilities (server time, network storage) as needed, without
requiring human interaction with the provider.Broad network access: The services are available over the net-work and accessed through standard mechanisms for any kind ofObservation and Geoinformation 27 (2014) 109–115 113
client platforms (e.g., mobile phones, tablets, laptops, and work-stations).Resource pooling: The resources are pooled to serve multipleusers. They are dynamically assigned and reassigned according toconsumer demand. The user has no information about where theresources are, how many resources are requested or who else isusing them.Scalability: The resources can be elastically provisioned andreleased to adjust to the demand. For the user, the resources appearto be unlimited and can be appropriated in any quantity at anytime.
Cloud computing provides several advantages like ease ofaccess, lightness of application, scalability, etc. Moreover largeamounts of data can be loaded in the cloud computing system.It also gives the opportunity to add or remove functionalities tofit the user’s needs. Finally, it supports not only the increase ofusers connected to the application, but also the computing capacityaccording to the needs.
4.1. Deployment models
In a cloud architecture, we have to deploy different services(SaaS, PaaS, IaaS) as described by Furht (2010), Mell and Grance(2011) and Syntec Numérique (2012). This deployment can be real-ized in three different infrastructures:
Private cloud: The cloud infrastructure is provisioned for exclu-sive use by a single organization comprising multiple consumers(e.g., business units). It is owned, managed, and operated by theorganization.Public cloud: The cloud infrastructure is provisioned for open useby the general public. It may be owned, managed, and operatedby a business, academic, or government organization, or somecombination of these.Hybrid cloud: The cloud infrastructure is a composition of twoor more distinct cloud infrastructures (private and public) thatenables data and application portability.
The choice of the deployment model for an application (SyntecNumérique, 2012) is made according to its level of:
• Specificity, genericity: ability of an application to fit other use case(genericity) or only the one it has been created for (specificity);
• Criticality: importance of several aspects like its interactions, itsdependences, the risk involved if it breaks down, etc.;
• Scalability: as defined above.
The need of a high level of scalability leads to the use of cloudcomputing (which is by definition the most scalable model). In thecase where the application must be scalable, the choice betweenpublic and private cloud is made according to the level of specific-ity or criticality. If the level of specificity or criticality is low, thena public cloud is a good solution. Otherwise, the private cloud ismore appropriate. If the application has a low level of specificityor criticality and of scalability, then virtualization which consistsof deploying a full environment on a distant machine is suitable.Otherwise, the application is deployed in the conventional way. Allthis is summarized in Fig. 7.
The scalability of the cloud enables to adjust the resources in linewith the demand. It gives to the tasks the possibility of adapting tothe flow of data to process (pictures in our case). For example, in the
the data. We will not always need to date the pictures, however.The structure of the cloud will automatically increase the numberof projections and mosaic services by duplicating them, while it will
114 É. Ranisavljevic et al. / International Journal of Applied Earth Observation and Geoinformation 27 (2014) 109–115
nmstfiaccpaocp
4
t
aidsX
das
5
c
ifituW
p
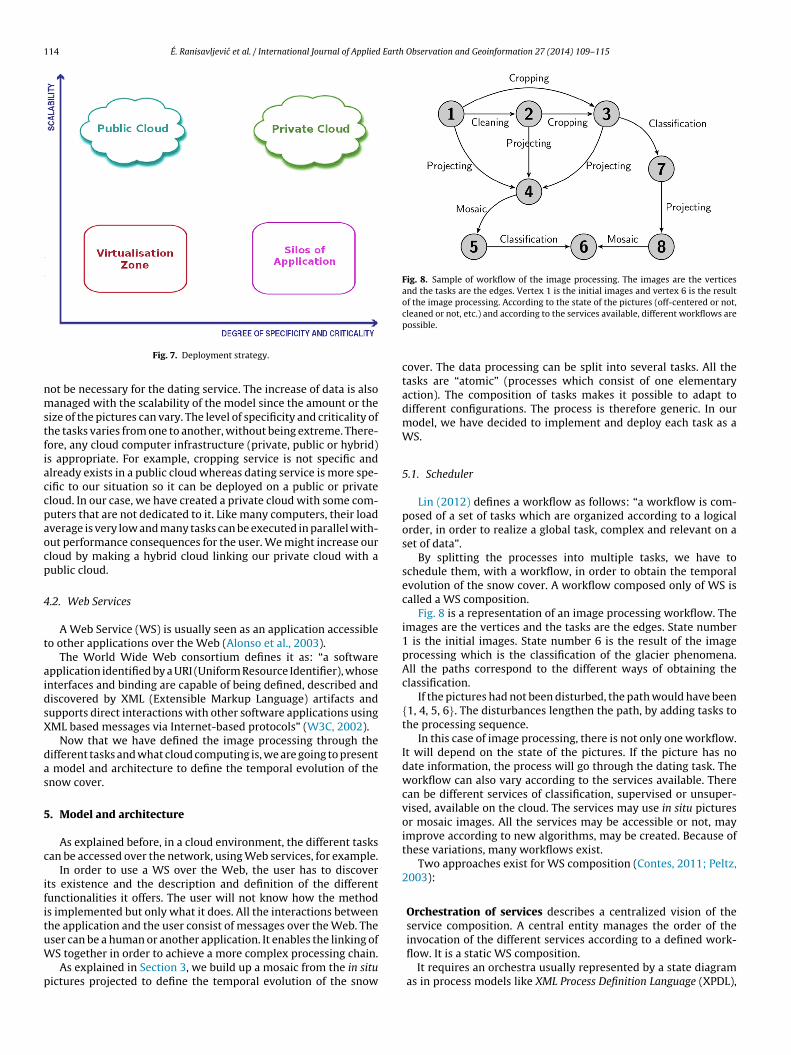
Fig. 8. Sample of workflow of the image processing. The images are the verticesand the tasks are the edges. Vertex 1 is the initial images and vertex 6 is the resultof the image processing. According to the state of the pictures (off-centered or not,
Fig. 7. Deployment strategy.
ot be necessary for the dating service. The increase of data is alsoanaged with the scalability of the model since the amount or the
ize of the pictures can vary. The level of specificity and criticality ofhe tasks varies from one to another, without being extreme. There-ore, any cloud computer infrastructure (private, public or hybrid)s appropriate. For example, cropping service is not specific andlready exists in a public cloud whereas dating service is more spe-ific to our situation so it can be deployed on a public or privateloud. In our case, we have created a private cloud with some com-uters that are not dedicated to it. Like many computers, their loadverage is very low and many tasks can be executed in parallel with-ut performance consequences for the user. We might increase ourloud by making a hybrid cloud linking our private cloud with aublic cloud.
.2. Web Services
A Web Service (WS) is usually seen as an application accessibleo other applications over the Web (Alonso et al., 2003).
The World Wide Web consortium defines it as: “a softwarepplication identified by a URI (Uniform Resource Identifier), whosenterfaces and binding are capable of being defined, described andiscovered by XML (Extensible Markup Language) artifacts andupports direct interactions with other software applications usingML based messages via Internet-based protocols” (W3C, 2002).
Now that we have defined the image processing through theifferent tasks and what cloud computing is, we are going to present
model and architecture to define the temporal evolution of thenow cover.
. Model and architecture
As explained before, in a cloud environment, the different tasksan be accessed over the network, using Web services, for example.
In order to use a WS over the Web, the user has to discoverts existence and the description and definition of the differentunctionalities it offers. The user will not know how the methods implemented but only what it does. All the interactions betweenhe application and the user consist of messages over the Web. The
ser can be a human or another application. It enables the linking ofS together in order to achieve a more complex processing chain.As explained in Section 3, we build up a mosaic from the in situictures projected to define the temporal evolution of the snow
cleaned or not, etc.) and according to the services available, different workflows arepossible.
cover. The data processing can be split into several tasks. All thetasks are “atomic” (processes which consist of one elementaryaction). The composition of tasks makes it possible to adapt todifferent configurations. The process is therefore generic. In ourmodel, we have decided to implement and deploy each task as aWS.
5.1. Scheduler
Lin (2012) defines a workflow as follows: “a workflow is com-posed of a set of tasks which are organized according to a logicalorder, in order to realize a global task, complex and relevant on aset of data”.
By splitting the processes into multiple tasks, we have toschedule them, with a workflow, in order to obtain the temporalevolution of the snow cover. A workflow composed only of WS iscalled a WS composition.
Fig. 8 is a representation of an image processing workflow. Theimages are the vertices and the tasks are the edges. State number1 is the initial images. State number 6 is the result of the imageprocessing which is the classification of the glacier phenomena.All the paths correspond to the different ways of obtaining theclassification.
If the pictures had not been disturbed, the path would have been{1, 4, 5, 6}. The disturbances lengthen the path, by adding tasks tothe processing sequence.
In this case of image processing, there is not only one workflow.It will depend on the state of the pictures. If the picture has nodate information, the process will go through the dating task. Theworkflow can also vary according to the services available. Therecan be different services of classification, supervised or unsuper-vised, available on the cloud. The services may use in situ picturesor mosaic images. All the services may be accessible or not, mayimprove according to new algorithms, may be created. Because ofthese variations, many workflows exist.
Two approaches exist for WS composition (Contes, 2011; Peltz,2003):
Orchestration of services describes a centralized vision of theservice composition. A central entity manages the order of theinvocation of the different services according to a defined work-
flow. It is a static WS composition.It requires an orchestra usually represented by a state diagramas in process models like XML Process Definition Language (XPDL),
É. Ranisavljevic et al. / International Journal of Applied Earth
uIv
auop
5
ptscuTs
6
agoIppcmraoo
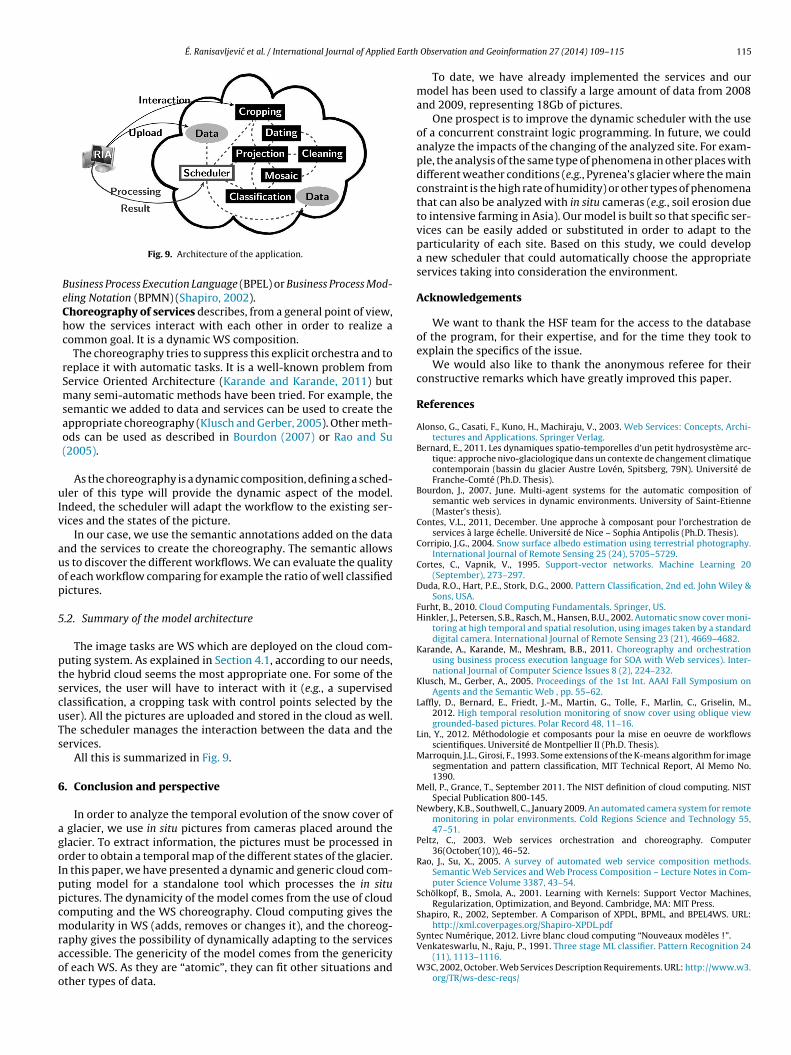
Fig. 9. Architecture of the application.
Business Process Execution Language (BPEL) or Business Process Mod-eling Notation (BPMN) (Shapiro, 2002).Choreography of services describes, from a general point of view,how the services interact with each other in order to realize acommon goal. It is a dynamic WS composition.
The choreography tries to suppress this explicit orchestra and toreplace it with automatic tasks. It is a well-known problem fromService Oriented Architecture (Karande and Karande, 2011) butmany semi-automatic methods have been tried. For example, thesemantic we added to data and services can be used to create theappropriate choreography (Klusch and Gerber, 2005). Other meth-ods can be used as described in Bourdon (2007) or Rao and Su(2005).
As the choreography is a dynamic composition, defining a sched-ler of this type will provide the dynamic aspect of the model.
ndeed, the scheduler will adapt the workflow to the existing ser-ices and the states of the picture.
In our case, we use the semantic annotations added on the datand the services to create the choreography. The semantic allowss to discover the different workflows. We can evaluate the qualityf each workflow comparing for example the ratio of well classifiedictures.
.2. Summary of the model architecture
The image tasks are WS which are deployed on the cloud com-uting system. As explained in Section 4.1, according to our needs,he hybrid cloud seems the most appropriate one. For some of theervices, the user will have to interact with it (e.g., a supervisedlassification, a cropping task with control points selected by theser). All the pictures are uploaded and stored in the cloud as well.he scheduler manages the interaction between the data and theervices.
All this is summarized in Fig. 9.
. Conclusion and perspective
In order to analyze the temporal evolution of the snow cover of glacier, we use in situ pictures from cameras placed around thelacier. To extract information, the pictures must be processed inrder to obtain a temporal map of the different states of the glacier.n this paper, we have presented a dynamic and generic cloud com-uting model for a standalone tool which processes the in situictures. The dynamicity of the model comes from the use of cloudomputing and the WS choreography. Cloud computing gives theodularity in WS (adds, removes or changes it), and the choreog-
aphy gives the possibility of dynamically adapting to the servicesccessible. The genericity of the model comes from the genericityf each WS. As they are “atomic”, they can fit other situations andther types of data.
Observation and Geoinformation 27 (2014) 109–115 115
To date, we have already implemented the services and ourmodel has been used to classify a large amount of data from 2008and 2009, representing 18Gb of pictures.
One prospect is to improve the dynamic scheduler with the useof a concurrent constraint logic programming. In future, we couldanalyze the impacts of the changing of the analyzed site. For exam-ple, the analysis of the same type of phenomena in other places withdifferent weather conditions (e.g., Pyrenea’s glacier where the mainconstraint is the high rate of humidity) or other types of phenomenathat can also be analyzed with in situ cameras (e.g., soil erosion dueto intensive farming in Asia). Our model is built so that specific ser-vices can be easily added or substituted in order to adapt to theparticularity of each site. Based on this study, we could developa new scheduler that could automatically choose the appropriateservices taking into consideration the environment.
Acknowledgements
We want to thank the HSF team for the access to the databaseof the program, for their expertise, and for the time they took toexplain the specifics of the issue.
We would also like to thank the anonymous referee for theirconstructive remarks which have greatly improved this paper.
References
Alonso, G., Casati, F., Kuno, H., Machiraju, V., 2003. Web Services: Concepts, Archi-tectures and Applications. Springer Verlag.
Bernard, E., 2011. Les dynamiques spatio-temporelles d’un petit hydrosystème arc-tique: approche nivo-glaciologique dans un contexte de changement climatiquecontemporain (bassin du glacier Austre Lovén, Spitsberg, 79N). Université deFranche-Comté (Ph.D. Thesis).
Bourdon, J., 2007, June. Multi-agent systems for the automatic composition ofsemantic web services in dynamic environments. University of Saint-Etienne(Master’s thesis).
Contes, V.L., 2011, December. Une approche à composant pour l’orchestration deservices à large échelle. Université de Nice – Sophia Antipolis (Ph.D. Thesis).
Corripio, J.G., 2004. Snow surface albedo estimation using terrestrial photography.International Journal of Remote Sensing 25 (24), 5705–5729.
Cortes, C., Vapnik, V., 1995. Support-vector networks. Machine Learning 20(September), 273–297.
Duda, R.O., Hart, P.E., Stork, D.G., 2000. Pattern Classification, 2nd ed. John Wiley &Sons, USA.
Furht, B., 2010. Cloud Computing Fundamentals. Springer, US.Hinkler, J., Petersen, S.B., Rasch, M., Hansen, B.U., 2002. Automatic snow cover moni-
toring at high temporal and spatial resolution, using images taken by a standarddigital camera. International Journal of Remote Sensing 23 (21), 4669–4682.
Karande, A., Karande, M., Meshram, B.B., 2011. Choreography and orchestrationusing business process execution language for SOA with Web services). Inter-national Journal of Computer Science Issues 8 (2), 224–232.
Klusch, M., Gerber, A., 2005. Proceedings of the 1st Int. AAAI Fall Symposium onAgents and the Semantic Web , pp. 55–62.
Laffly, D., Bernard, E., Friedt, J.-M., Martin, G., Tolle, F., Marlin, C., Griselin, M.,2012. High temporal resolution monitoring of snow cover using oblique viewgrounded-based pictures. Polar Record 48, 11–16.
Lin, Y., 2012. Méthodologie et composants pour la mise en oeuvre de workflowsscientifiques. Université de Montpellier II (Ph.D. Thesis).
Marroquin, J.L., Girosi, F., 1993. Some extensions of the K-means algorithm for imagesegmentation and pattern classification, MIT Technical Report, AI Memo No.1390.
Mell, P., Grance, T., September 2011. The NIST definition of cloud computing. NISTSpecial Publication 800-145.
Newbery, K.B., Southwell, C., January 2009. An automated camera system for remotemonitoring in polar environments. Cold Regions Science and Technology 55,47–51.
Peltz, C., 2003. Web services orchestration and choreography. Computer36(October(10)), 46–52.
Rao, J., Su, X., 2005. A survey of automated web service composition methods.Semantic Web Services and Web Process Composition – Lecture Notes in Com-puter Science Volume 3387, 43–54.
Schölkopf, B., Smola, A., 2001. Learning with Kernels: Support Vector Machines,Regularization, Optimization, and Beyond. Cambridge, MA: MIT Press.
Shapiro, R., 2002, September. A Comparison of XPDL, BPML, and BPEL4WS. URL:http://xml.coverpages.org/Shapiro-XPDL.pdf
Syntec Numérique, 2012. Livre blanc cloud computing “Nouveaux modèles !”.Venkateswarlu, N., Raju, P., 1991. Three stage ML classifier. Pattern Recognition 24
(11), 1113–1116.W3C, 2002, October. Web Services Description Requirements. URL: http://www.w3.
org/TR/ws-desc-reqs/