a fast approach for battery impedance …...pseudo-random-binary-sequence (prbs) and a...
TRANSCRIPT

Aalborg Universitet
A Fast Approach for Battery Impedance Identification Using Pseudo RandomSequence (PRS) Signals
Sihvo, Jussi; Stroe, Daniel-Ioan; Messo, Tuomas; Roinila, Tomi
Published in:I E E E Transactions on Power Electronics
DOI (link to publication from Publisher):10.1109/TPEL.2019.2924286
Publication date:2020
Document VersionAccepted author manuscript, peer reviewed version
Link to publication from Aalborg University
Citation for published version (APA):Sihvo, J., Stroe, D-I., Messo, T., & Roinila, T. (2020). A Fast Approach for Battery Impedance IdentificationUsing Pseudo Random Sequence (PRS) Signals. I E E E Transactions on Power Electronics, 35(3).https://doi.org/10.1109/TPEL.2019.2924286
General rightsCopyright and moral rights for the publications made accessible in the public portal are retained by the authors and/or other copyright ownersand it is a condition of accessing publications that users recognise and abide by the legal requirements associated with these rights.
? Users may download and print one copy of any publication from the public portal for the purpose of private study or research. ? You may not further distribute the material or use it for any profit-making activity or commercial gain ? You may freely distribute the URL identifying the publication in the public portal ?
Take down policyIf you believe that this document breaches copyright please contact us at [email protected] providing details, and we will remove access tothe work immediately and investigate your claim.

This work is licensed under a Creative Commons Attribution 3.0 License. For more information, see http://creativecommons.org/licenses/by/3.0/.
This article has been accepted for publication in a future issue of this journal, but has not been fully edited. Content may change prior to final publication. Citation information: DOI 10.1109/TPEL.2019.2924286, IEEETransactions on Power Electronics
1
A Fast Approach for Battery ImpedanceIdentification Using Pseudo Random Sequence
(PRS) SignalsJussi Sihvo, Student Member, IEEE, Daniel-Ioan Stroe, Member, IEEE, Tuomas Messo, Member, IEEE,
Tomi Roinila, Member, IEEE,
Abstract—Online measurements of the batteryimpedance provide valuable information on the batterystate-of-charge and state-of-health which can be utilized forimproving the safety and the performance of the associatedsystem. The electrochemical-impedance-spectroscopy (EIS)is widely used for battery impedance measurementsbut it is not the most applicable solution for onlinemeasurements due to its slowness and complexity. Thesedrawbacks can be improved using broadband signals,such as, pseudo-random-sequences (PRS), which arefast and easily implementable. However, the non-linearbehavior of batteries have significant effect on theimpedance measurements and the selection of the PRSsignal. Majority of the PRS signals are applicable formeasurements of linear systems but also signals fornon-linear system identification do exist. Moreover, thereduced accuracy and signal-to-noise ratio of the PRSsignals compared to the EIS make the filtering of theresults as well as the amplitude design important aspects.This paper demonstrates the use of two PRS signals, thepseudo-random-binary-sequence (PRBS) and a ternary-sequence with better toleration to battery non-lineareffects, with comprehensive amplitude and filtering designfor battery impedance measurements. It is shown that theternary-sequence provides accurate measurements and theeffects of non-linear dynamics of the battery impedanceare reduced with respect to the PRBS measurements.The results are referenced and validated to practicalEIS measurements in various operating conditions forlithium-iron-phosphate (LiFEPO4) cell.
Index Terms—Batteries, Impedance measurement, Real-time systems, Energy storage
I. INTRODUCTION
THE use of Lithium-Ion (Li-Ion) batteries in electricvehicles and stationary storage applications have
J. Sihvo and T. Messo are with the Faculty of InformationTechnology and Communication Sciences, Tampere, Finland, email:[email protected]; [email protected]
D.-I. Stroe is with the Department of Energy Technology, AalborgUniversity, Aalborg, Denmark, email: [email protected]
T. Roinila is with the Faculty of Engineering and Natural Sciences,Tampere University, Tampere, Finland, email: [email protected]
Manuscript received January 14, 2019; revised March 27, 2019.
become extremely popular in recent years. This is mainlydue to their high energy and power density, high effi-ciency, long lifetime and continuously reduced price [1],[2].
The Li-ion batteries are usually equipped with abattery-management-system (BMS) that monitors thebattery conditions to ensure it’s safe operation [3]. Typi-cally, the BMS monitors the battery current, voltage andtemperature which are further used to estimate the bat-tery state. The battery state is expressed by different stateparameters such as the state-of-charge (SOC) and thestate-of-health (SOH). The SOC indicates the remainingcharge that can be drawn from the battery [4]. The SOHindicates the remaining useful life of the battery for theapplication [5]. However, the accurate estimation of theSOC and the SOH is difficult due to their non-lineardependency to the monitored quantities.
For the battery state-estimation and modeling pur-poses, the battery AC impedance has recently gainedmuch research interest since it has significant relationto the battery aging [6]–[8] and the SOC [9]–[12] aswell as to the temperature [13]. In the impedance-based state-estimation, the impedance is typically fittedto a equivalent circuit model and the state-estimationis based on the variations in the model parameters[9]–[11], [14]. Therefore, the impedance online mea-surements have recently become important to utilizethe impedance for the state-estimation of Li-ion bat-teries. The impedance is conventionally characterizedby the Electrochemical-Impedance-Spectroscopy (EIS)which utilizes a sinusoidal excitation [14]–[16]. Themethod provides accurate measurements but comes withhigh complexity and long measurement time whichmakes it challenging to be utilized in online applications.For online use, methods such as, simplified EIS [17]–[19], square-sweep [20], steps [21]–[24], multisines [24],[25] and pseudo-random-sequences (PRS) are studied.Especially the PRS methods are attractive alternativesdue to their low complexity, low measurement time and

This work is licensed under a Creative Commons Attribution 3.0 License. For more information, see http://creativecommons.org/licenses/by/3.0/.
This article has been accepted for publication in a future issue of this journal, but has not been fully edited. Content may change prior to final publication. Citation information: DOI 10.1109/TPEL.2019.2924286, IEEETransactions on Power Electronics
Fig. 1: Impedance Nyquist plot from LiFEPO4 cell
relatively good accuracy. The PRS signals are stud-ied in [20], [26], [27] where the two-level pseudo-random-binary-sequence (PRBS) is applied for batteryimpedance measurements but are reported to sufferfrom reduced measurement accuracy under battery non-linearities. However, the excitation performance for non-linear systems can be improved with multilevel PRSsignals [28]–[31]. From such PRS signals, a three-levelternary-sequence have been studied in [32] for batteryimpedance measurement where it showed to provideaccurate results under battery non-linearities.
The low measurement time of the PRS signals com-pared to the EIS method comes at the expense of reducedaccuracy and signal-to-noise ratio (SNR) since the sig-nal power is divided into several frequency harmonicsinstead of one fundamental harmonic [28]. The SNR ofthe PRS is given by the length and the amplitude of thesignal that together determine the power content of thesignal. Increased amplitude of the PRS increases alsothe SNR but this can introduce more non-linear effectsin the battery and can be even limited by the application[33]. The SNR can also be increased by shortening thesequence length but this will reduce the bandwidth ofthe measurements by making the frequency resolutionmore sparse. In addition, filtering can be applied tosmooth the measurements and increase the SNR. Themoving-average-filter (MAF) is a good alternative due toit’s simplicity but careful window design is required tokeep the data uncorrupted [34]. Thus, the PRS frequencycontent, amplitude design and the effect of filtering needsto be carefully studied to obtain reliable results.
This paper provides a comprehensive study of fastimpedance measurement techniques for Li-ion batteriesusing two different PRS excitation signals, the PRBSand the ternary-sequence, with optimized amplitude andMAF design. The performance of both PRS methodsare studied in various operating conditions for lithium-iron-phosphate (LiFEPO4) battery cell. The results arevalidated by means of EIS reference data with erroranalysis based on the root-mean-square-error (RMSE).
Fig. 2: Impedance Bode plot from LiFEPO4 cell
Moreover, linear Kronig-Kramers compliance test is ap-plied to analyze the quality of the measured impedances[35].
The rest of the paper is organized as follows. Theimpedance characteristics and relation to battery stateparameters are introduced in Section II. The generationalgorithms and properties of the PRS signals are studiedin Section III. The experiments, including the amplitudeand filtering design, are presented in Section IV. Theperformance validation is carried out in Section V, andthe conclusions are drawn in Section VI.
II. INTERNAL IMPEDANCE RELATION TO BATTERYSTATE
The impedance of a battery is a parasitic quantitythat resists the current flow through the battery. Theimpedance introduces a voltage drop to the battery open-circuit-voltage (OCV) whenever any current is appliedto the battery. The impedance is a frequency-dependentquantity and can be represented in frequency domain as
Zbat(jω) =Vbat(jω)
Ibat(jω)(1)
where Vbat(jω) is the battery terminal voltage, Ibat(jω)is the battery current and ω is the angular frequency.
The impedance is typically represented in the Nyquist-plane (commonly known as complex-plane) shown inFig. 1 from which usually three or four main regionscan be detected caused by different electrochemical phe-nomenons. The diffusion part at low frequencies repre-sents the effect of the solid-state diffusion of lithium-ionsbetween the electrodes which results in a constant slope.The charge-transfer region represents the charge-transferphenomenon at the electrode surfaces. It is usuallyformed as one or more semi-circles mostly dependingon the battery chemistry and temperature at the mediumfrequencies. The ohmic region represents the regionwhere the impedance intersects the real-axis. At the veryhigh frequencies (> 10kHz), an inductive region can alsobe detected, which is caused by the inductance of the
2

This work is licensed under a Creative Commons Attribution 3.0 License. For more information, see http://creativecommons.org/licenses/by/3.0/.
This article has been accepted for publication in a future issue of this journal, but has not been fully edited. Content may change prior to final publication. Citation information: DOI 10.1109/TPEL.2019.2924286, IEEETransactions on Power Electronics
Fig. 3: Typical block diagram of the system impulse response mea-surement
wires and current collectors of the battery. Moreover,the shape of the impedance in the described regionsalso varies as a function of the temperature, the SOCand the SOH [7], [25]. The corrosion on the electrolyteand on electrodes, lithium plating and especially theformation of the solid-electrolyte-interface (SEI) layerincrease the impedance as the battery ages. The increasein temperature accelerates the chemical reactions in thebattery, thus, reducing the magnitude of the impedance.However, high temperatures also accelerates the aging ofthe battery which will eventually increase the impedancemagnitude in the long run [7]. The impedance alsochanges as the function of the SOC especially at verylow and high SOC values [8], [13].
Alternatively, the impedance can be also representedas Bode diagram with separate magnitude and phaseresponses shown in Fig. 2. The benefit of Bode diagramis the provided frequency information which cannot beseen in the Nyquist-plane. The same information aboutthe impedance behavior is still provided in the Bodediagram where the bounds for each region are givenby the phase behavior. The Bode diagram can be aneffective tool for optimizing the bandwidth and theresolution of the measurements to include only the partsof the impedance that are in the range of interest.
III. INTERNAL IMPEDANCE MEASUREMENTTECHNIQUES
A typical device under test measurement setup isillustrated in Fig. 3 where x(t) is the excitation injectedto the system input which generates the correspondingoutput response y(t). Together, the x(t) and y(t) definesthe system impulse-response g(t). For the system mea-surement, it is important that the excitation signal x(t)is a predefined signal with known frequency responsecharacteristics in order to generate any reliable responsefor the system output.
The different excitation signal types are illustrated inFig. 4 in which the excitation signals can be roughly di-vided into two categories. These are the single-frequencysignals and the broadband signals. Single-frequency sig-nals have energy at one fundamental frequency whilebroadband signals have energy at multiple frequencyharmonics. The single-frequency sweeps have highermeasurement time than broadband signals due to the factthat the specified frequencies must be excited with sepa-rate signals at different fundamental frequency. However,
Fig. 4: Different excitation signals used for system identification
the SNR is a lot higher because the energy of the signalis concentrated on the fundamental frequency [28].
For the battery impedance measurements, the excita-tion is typically injected as the current reference for abattery. The conventional method for battery impedancecharacterization is the EIS method in which a sine-sweep excitation is utilized [14]–[16]. The EIS providesaccurate and reliable results and is widely used foroffline applications. Due to the single-frequency char-acteristics, the EIS is not the most practical for onlinemeasurements and simplifications are required in orderto reduce the complexity and measurement time [17]–[19]. The complexity of the signal can be reduced byusing a square-sweep instead of sine-sweep [20] but themethod is still very slow. The measurement time can besignificantly reduced by the broadband methods shownin Fig. 4. From such methods, the step-based methods arethe easiest to implement but the accuracy is drasticallyreduced especially for the high-frequency response [21]–[24]. To achieve both the low measurement time andlow complexity, multisines [24], [25] and PRS signals[28], can be utilized. Especially the PRS signals areattractive for online applications since the number ofrequired signal levels can be reduced to the minimumof two levels (the PRBS) which significantly reducesthe complexity of the signal implementation. Moreover,the accuracy is also relatively high. As a drawback, theoperation of the PRBS is limited for identification oflinear systems which is challenging aspect for batteryimpedance measurements due to the non-linear behaviorof batteries [20], [26]–[28]. However, PRS signals withthree levels (ternary-sequence) can be designed in a waythat the non-linearities at specific frequency harmonicscan be reduced yielding to improved accuracy of thenon-linear system measurements [28]–[30], [32]. Thegenerating algorithms of both PRS signals, the PRBS andthe ternary-sequence, are carefully studied and presentedin the following subsections.
3

This work is licensed under a Creative Commons Attribution 3.0 License. For more information, see http://creativecommons.org/licenses/by/3.0/.
This article has been accepted for publication in a future issue of this journal, but has not been fully edited. Content may change prior to final publication. Citation information: DOI 10.1109/TPEL.2019.2924286, IEEETransactions on Power Electronics
(a) (b)
Fig. 5: a) time-domain characteristics of studied PRS signals b) Frequency-domain power spectrums of studied PRS signals
A. The PRBS method
The PRBS signal used in this paper is the maximum-length-binary-sequence (MLBS). The MLBS theory isbased on the linear recurrence relation algorithm [28]defined as
s(i) =n∑
r=1
Crs(i− r), mod 2, (2)
which yields to a binary sequence with possible valuesof 0 and 1. The variable C contains the coefficients ofthe arbitrary primitive polynomial of order n in modulo2. It should be noted that any primitive polynomialcoefficients can be used and the selection is up to theuser. The n determines the length of the MLBS period asN = 2n−1. The first n elements in s must be initializedto any combination of 0 and 1 excluding the zero vector.The sequence is typically re-mapped to values −1 and1 to give zero mean for the sequence. In order to avoidconfusion, the term PRBS is used over the MLBS in thefollowing parts of the paper. [28]
B. The Ternary-sequence method
The ternary-sequence used in this paper is thequadratic-residue-ternary (QRT) sequence [29], [30].The QRT-sequence can be obtained for any sequencelength N for which N/2 is a prime. The sequence isformed by means of quadratic residue algorithm. Thatis, v(i), i = 1, 2...N , is mapped to signal levels 1,−1and 0 as follows:
v(i) = 1 if i is square modulo N/2v(i) = −1 if i is not square modulo N/2v(i) = 0 if i = 0 modulo N/2
The sequence v(i) is now formed by two consecutivesub-sequences from which the QRT-sequence can be
obtained by inverting the alternate elements in v(i) as
sQRT(i) = −1i−1v(i) i = 1, 2..N , modulo N/2. (3)
As a result, the generated QRT-sequence sQRT has threesignal levels and zero power at all even-order harmonics.For the sake of simplicity, the QRT-sequence is treatedas ternary-sequence in the following parts of this paper.
C. Properties of the presented sequencesIn time-domain, the difference between the PRBS and
ternary-sequence is that the ternary-sequence is imple-mented with one extra signal level as shown Fig. 5a.The differences in frequency-domain are more charac-teristic as illustrated in Fig. 5b where normalized powerspectrums of the sequences with similar amplitude andlength are given. The ternary-sequence has no power ateven-order harmonics, thus, the non-linear distortion atthese harmonics will not affect to the non-zero harmonicsand the measurements [29], [30]. The power at the firstfrequency harmonic in Fig. 5b is determined for thePRBS as
PPRBS(1) =2A2(N + 1)
N2(4)
where A is the amplitude and N is the length of thesequence. The corresponding power for ternary-sequenceis given as
PTernary(1) =4A2
N. (5)
From (4)-(5), it is observed that the power of ternary-sequence is approximately twice the power of the PRBSwhich can also be seen from Fig. 5b [28], [29]. Thus,the SNR is also doubled according to
SNR =Psignal
Pnoise. (6)
It can be concluded from (4)-(6) that, for similar valuesof N , the amplitude of the ternary-sequence can be
4

This work is licensed under a Creative Commons Attribution 3.0 License. For more information, see http://creativecommons.org/licenses/by/3.0/.
This article has been accepted for publication in a future issue of this journal, but has not been fully edited. Content may change prior to final publication. Citation information: DOI 10.1109/TPEL.2019.2924286, IEEETransactions on Power Electronics
(a) (b)
Fig. 6: a) Measurement setup configuration for the experiments b) Laboratory setup
reduced by a factor of 1√2
to obtain equal SNR than thePRBS. This gives more freedom for the amplitude designof the ternary-sequence. Besides the amplitude, N alsohas significant effect on the signal power and SNR but istypically more significant design parameter to obtain de-sired measurement bandwidth and resolution. However,the number of possible N values is significantly higherfor the ternary-sequence than for the PRBS. This alsogives more freedom for the ternary-sequence to designthe power and frequency content of the signal. [36]
For both PRS signals, the frequency content is de-termined by the generation frequency fgen which istheoretically the maximum frequency that the sequencehas energy at. Due to the decreasing power of the non-zero harmonics towards higher frequencies (Fig. 5b), theusable bandwidth of the measurements is less than fgen inreality. The guideline for appropriate bandwidth is givenin [28] equaling to ≈ 0.45∗fgen. Together, N and fgendetermines the frequency resolution of the sequences as
fres =fgen
N(7)
which is also the lowest frequency at which the signalhas energy. For the battery impedance measurements,fres is important parameter because it determines alsothe minimum time consumed for the whole measurementas tmeas = 1/fres. This becomes especially importantwhen measuring the diffusion region of the impedancerealized at very low frequencies which correspond tolong response time.
IV. EXPERIMENTS
The measurements were carried out with the ternary-sequence and the PRBS injections for a LiFEPO4 batterycell with a nominal voltage of 3.3V and a capacity of2.5Ah at three different temperatures which were 24◦C,34◦C and 41◦C. The setup configuration is shown in
Fig. 6a where the bi-directional power supply is usedto inject the excitations as the current reference. Theexcitations are configured to have zero offset to keep theSOC at steady-state during the measurements, thus, min-imizing the non-linearities of the measured impedance.The changing current direction within the excitationpulse is considered not to affect to the measurementssince the dynamics of the impedance are similar duringcharging and discharging [23]. The voltage and currentmeasurements, imeas and vmeas, are recorded as vectorswhose lengths equal to the excitation length given asthe current reference iref. In the Frequency-Response-Analysis block, the voltage and current measurementsare applied by discrete Fourier transform to obtainthe impedance frequency spectrum. The filtering ofthe results is implemented with a moving-average-filter(MAF). Both PRS signals were generated by a softwareavailable in [30].
The laboratory setup and the used equipment areshown in Fig. 6b. The excitations were injected bythe data-acquisition (DAQ) device as the current ref-erence to a bi-directional power supply. The data isalso recorded from the measurement probes by theDAQ which is connected to the computer where data ispost-processed. The measurements were carried out byapplying the measurement sweep over the whole SOCand considering a SOC resolution of 10%. The desiredSOC level was reached by discharging the battery with acurrent of 1C. The SOC was monitored by the coulomb-counting method [26]. Before each measurement sweep,the battery is left on hold for 30min to allow the batteryvoltage to reach it’s thermo-dynamic stability. The EISreference measurement were carried out with a separateEIS analyzer setup.
Before validating the PRBS and the ternary-sequencemeasurements to the EIS reference, the amplitude sensi-tivity analysis and filtering design are carried out for both
5

This work is licensed under a Creative Commons Attribution 3.0 License. For more information, see http://creativecommons.org/licenses/by/3.0/.
This article has been accepted for publication in a future issue of this journal, but has not been fully edited. Content may change prior to final publication. Citation information: DOI 10.1109/TPEL.2019.2924286, IEEETransactions on Power Electronics
(a) (b) (c)
Fig. 7: a) Standard deviation of the impedance measurements as a function of injection amplitude at different temperatures at 50% of SOCb) Standard deviation of the impedance measurements as a function of injection amplitude at different SOC values at 41◦Cc) Normalysed standard deviation of the ternary-sequence and PRBS as a function of injection amplitude at 50% of SOC and at 41◦C
PRS signals in the following sub-sections. The designparameters of both PRS injections for the amplitudedesign are given in Table I where the fs denotes the sam-pling frequency. The generation frequency and sequencelenghts were selected to cover a bandwidth that capturesthe end of the diffusion part, as well as, the beginningof the ohmic region of the used LiFEPO4 cell.
A. Sensitivity analysis
The effect of the amplitude sensitivity to theimpedance measurements is investigated by the standard-deviation (STD) of the impedance magnitude over theused frequency spectrum. The STD is mathematicallydefined as
σ =
√√√√ 1
N
N∑i=1
(Zi − Zmean)2 (8)
where Zi is the ith sample of the measured impedance,Zmean is the average over the whole measured impedanceand N is the length of the measured impedance vec-tor. The STD can be regarded as a rms-value of themeasurement deviation around the Zmean. Therefore, itis an equally informative indicator than the SNR formeasuring the accuracy of the measurements. However,the STD provides the information about the noise in themeasurements which is why it is used for the amplitudesensitivity analysis instead of the SNR given in (6).
The STD is analyzed at different excitation currentamplitudes as C-rates which corresponds the current
TABLE I: Injection parameters for sensitivity analysis
fgen N frequency band fs
Ternary-sequence 7kHz 32762 210mHz − 3.15kHz 35kHzMLBS 7kHz 32767 210mHz − 3.15kHz 35kHz
normalized by the capacity of the battery. The currentof 1C was determined to be the upper limit for theamplitude design due to the protection limits of thepower supply that are violated with higher currents. Themeasured impedance STD as a function of C-rate isillustrated at varying temperatures and SOC values inFigs. 7a and 7b, respectively. The temperature affects tothe STD by increasing it as the temperature increaseswhile the SOC does not have noticeable impact on theSTD. Moreover, the STD of the ternary-sequence islower than that of the PRBS.
Due to the observations made above, the amplitudedesign of the injections is based on the STD at worstcase temperature which is at 41◦C. To have a betterunderstanding of the STD, the STD is normalized bythe mean value of the measured impedance magnitudeillustrated in Fig. 7c. For the currents greater than 0.4C,the normalized STD is not significantly reduced and theselection guideline was selected to choose the currentat which the normalized STD is 5% for both PRSsignals. According to Fig. 7c, the 5% point equals to0.55C= 1.375A for the ternary-sequence and 0.8C= 2Afor the PRBS. The ratio of the amplitudes is very close to1/√2 ≈ 0.707 for each STD values which results from
the increased SNR of the ternary-sequence as discussedin Subsection III-C.
B. Filtering of the measurement results
The simple MAF is used for filtering the measurementdata due to its simplicity and relatively good perfor-mance [34]. Instead of time-domain filtering, the MAFis applied to frequency-domain data in order to ensurethe uniqueness of the PRS signals. This significantlychanges the design guidelines and performance of the
6

This work is licensed under a Creative Commons Attribution 3.0 License. For more information, see http://creativecommons.org/licenses/by/3.0/.
This article has been accepted for publication in a future issue of this journal, but has not been fully edited. Content may change prior to final publication. Citation information: DOI 10.1109/TPEL.2019.2924286, IEEETransactions on Power Electronics
Fig. 8: Impedance Nyquist plots obtained with ternary-sequence at41◦C and at 50% of SOC with different MAF window lengths. Thecolored indices i represents the data index where the correspondingMAF starts to adapt to the data
MAF compared to time-domain filtering. The simpleMAF is defined as
xMAF(i) =1
M
d∑k=−d
x(i+ k), (9)
where M is the window length, i is the element indexin the data set and
d =M − 1
2, (10)
which represents the delay of the MAF. The MAFenhances the SNR of the measurements by a factor√M since the noise in the measurements is expected
to have white-noise Gaussian distribution [36]. However,the MAF in (9) cannot be applied to the first d elementsin the data. Therefore, the estimates for the first d datapoints are obtained by increasing the window startingfrom M = 1 until the desired M is reached. Thealgorithm is mathematically expressed as
xMAF(i) =1
2i− 1
i−1∑k=−(i−1)
x(i+ k), i = 1...d (11)
which is changed to (9) for i > d. The effect ofthe MAF delay for the impedance plot is illustrated inFig. 8 where several different window sizes are appliedto ternary-sequence battery impedance measurements at41◦C. Each window will follow the black curve, i.e.the (11), until the index corresponding to d is reached.Therefore, if there are changing trends in the data duringthe effect of d, the curve will be dislocated. This isespecially the case for the end of the diffusion part whichis lifted from the average of the unfiltered data for higherwindows than 21. The same occurs also for the top of thesemi-circle for very high windows. Thus, the selectionof the optimal window length is highly depending on the
Fig. 9: Bode plot representation of the unfiltered impedance dataobtained with ternary-sequence at 50% of SOC. Colored markings iDrepresents the end of the diffusion part indices and iCT the top of thesemi-circle indices of the impedance at the corresponding temperature
data indices at the end of the diffusion region and thetop of the semi-circle. The data indices at these pointsare illustrated in Fig. 9 where unfiltered impedance dataat different temperatures are shown as bode plot. Theyellow curve in Fig. 9 corresponds the impedance inFig. 8 and shows that the end of the diffusion region istaking place at 25th data index while the top of the semi-circle is obtained at 200th data index. Fig. 8 shows thatthe window lengths greater than the foregoing indices aredislocating the corresponding part of the impedance plot.Thus, in order to prevent the data from dislocating, thewindow size should not exceed the data index at whichthe corresponding region bound is reached. However, itcan be seen from Fig. 9 that the indices of the impedanceregion bounds will change as a function of temperatureand the window length can be difficult to be selectedadaptively.
Based on the above discussion, the MAF of two fixed-length overlapping windows are used for the filtering.The window sizes are selected according to the smallestindices at the end of the diffusion part and at the topof the semi-circle in Fig. 9 at 41◦C. This yields to firstwindow equaling to 25 for the ternary-sequence. Thiswill slightly affect to the smoothing of the measurementsat 24◦C and 34◦C by dislocating the end of the diffusionregion. The latter window is selected to be sufficientlysmaller than the indice at the top of the semi-circle toensure the good performance of the MAF. Therefore, thewindow size of 120 is selected for the latter window forthe ternary-sequence. The windows for the PRBS canbe twice as long due to the twice as dense frequencyresolution. Therefore, the window lengths of 50 and 240are used for the PRBS. An over-lap of 25% is consideredfor the windows to minimize the transient effect whenthe windows are changed. With the designed configura-tions, the SNR can be maximized while minimizing thedislocation of the measurements results.
7

This work is licensed under a Creative Commons Attribution 3.0 License. For more information, see http://creativecommons.org/licenses/by/3.0/.
This article has been accepted for publication in a future issue of this journal, but has not been fully edited. Content may change prior to final publication. Citation information: DOI 10.1109/TPEL.2019.2924286, IEEETransactions on Power Electronics
(a) (b) (c)
(d) (e) (f)
Fig. 10: Impedance Nyquist plot at 34◦C and a) at 20% of SOC b) 50% at of SOC c) at 80% of SOCImpedance Nyquist plot at 50% of SOC and d) at 24◦C e) at 34◦C f) at 41◦C
V. RESULTS AND VALIDATION
The design parameters for the measurements andvalidation are shown in Table II. The accuracy of theresults in Fig. 10 is validated by the root-mean-square-error (RMSE) given as
εerr =
√√√√ 1
N
N∑i=1
(1− Zmeas(i)
Zref(i))2, (12)
where Zmeas is the measurements of the PRBS and theternary-sequence and Zref is the EIS reference data.Due to the logarithmic frequency distribution, the EISimpedance results are realized with only 35 data pointswhich is much less than the impedance measurementswith the designed PRS signals which harmonics are
TABLE II: Injection parameters for measurements and performancevalidation
EIS Ternary PRBSAmplitude 0.7A-2A 1.375A 2A
First measured freq. 206mHz 220mHz 220mHzLast measured freq. 3.7kHz 3.15kHz 3.15kHz
fgen - 7kHz 7kHzfs - 35kHz 35kHzN - 32767 32762
MAF window - 25 and 120 50 and 240Measurement time 1min 4.7s 4.7s
linearly distributed. Therefore, the frequency harmonicsin the PRBS and the ternary-sequence impedance resultsthat are closest to each corresponding harmonics in theEIS data are chosen to be applied in (9).
The validity of the applied PRS measurements is alsoanalyzed by applying linear Kronig-Kramers compliancetest to the measurements [35]. In the test, the impedancedata is fitted to a linearized impedance model fromwhich the residuals of the real- and imaginary partsare observed. According to the test, the data can beregarded corrupted if the residuals are following a cleartrace while uncorrupted data is realized with white noisedistribution of the residuals. The test is a useful toolfor validating how well the impedance can be linearlyfitted which also indicates the usability of the results for
TABLE III: RMS errors of the PRS measurements with respect to theEIS results at various SOCs and temperatures
PRBSSOC 30% SOC 50% SOC 80%
24◦C 8.3% 7.3% 7.4%34◦C 6.8% 5.1% 4.3%41◦C 6.3% 4.0% 3.2%
TernarySOC 30% SOC 50% SOC 80%
24◦C 2.9% 2.1% 2.3%34◦C 2.1% 1.1% 0.5%41◦C 1.6% 0.7% 1.1%
8
This work is licensed under a Creative Commons Attribution 3.0 License. For more information, see http://creativecommons.org/licenses/by/3.0/.
This article has been accepted for publication in a future issue of this journal, but has not been fully edited. Content may change prior to final publication. Citation information: DOI 10.1109/TPEL.2019.2924286, IEEETransactions on Power Electronics
(a) (b) (c)
Fig. 11: a) Fitted impedances from the Kronig-Kramers test compared to the measured impedances at 25◦C and 50% of SOCb) Real-part residuals from the Kronig-Kramers compliance test applied to impedance measurements at 25◦C and 50% of SOCc) Imaginary-part residuals from the Kronig-Kramers compliance test applied to impedance measurements at 25◦C and 50% of SOC
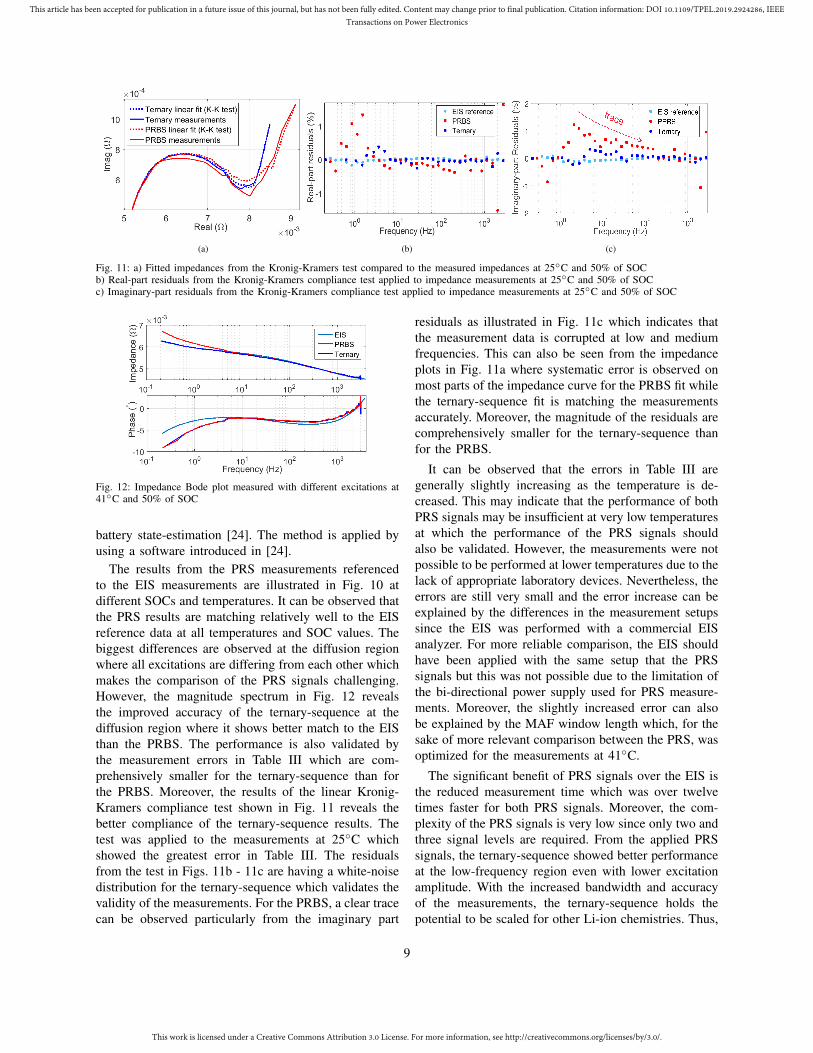
Fig. 12: Impedance Bode plot measured with different excitations at41◦C and 50% of SOC
battery state-estimation [24]. The method is applied byusing a software introduced in [24].
The results from the PRS measurements referencedto the EIS measurements are illustrated in Fig. 10 atdifferent SOCs and temperatures. It can be observed thatthe PRS results are matching relatively well to the EISreference data at all temperatures and SOC values. Thebiggest differences are observed at the diffusion regionwhere all excitations are differing from each other whichmakes the comparison of the PRS signals challenging.However, the magnitude spectrum in Fig. 12 revealsthe improved accuracy of the ternary-sequence at thediffusion region where it shows better match to the EISthan the PRBS. The performance is also validated bythe measurement errors in Table III which are com-prehensively smaller for the ternary-sequence than forthe PRBS. Moreover, the results of the linear Kronig-Kramers compliance test shown in Fig. 11 reveals thebetter compliance of the ternary-sequence results. Thetest was applied to the measurements at 25◦C whichshowed the greatest error in Table III. The residualsfrom the test in Figs. 11b - 11c are having a white-noisedistribution for the ternary-sequence which validates thevalidity of the measurements. For the PRBS, a clear tracecan be observed particularly from the imaginary part
residuals as illustrated in Fig. 11c which indicates thatthe measurement data is corrupted at low and mediumfrequencies. This can also be seen from the impedanceplots in Fig. 11a where systematic error is observed onmost parts of the impedance curve for the PRBS fit whilethe ternary-sequence fit is matching the measurementsaccurately. Moreover, the magnitude of the residuals arecomprehensively smaller for the ternary-sequence thanfor the PRBS.
It can be observed that the errors in Table III aregenerally slightly increasing as the temperature is de-creased. This may indicate that the performance of bothPRS signals may be insufficient at very low temperaturesat which the performance of the PRS signals shouldalso be validated. However, the measurements were notpossible to be performed at lower temperatures due to thelack of appropriate laboratory devices. Nevertheless, theerrors are still very small and the error increase can beexplained by the differences in the measurement setupssince the EIS was performed with a commercial EISanalyzer. For more reliable comparison, the EIS shouldhave been applied with the same setup that the PRSsignals but this was not possible due to the limitation ofthe bi-directional power supply used for PRS measure-ments. Moreover, the slightly increased error can alsobe explained by the MAF window length which, for thesake of more relevant comparison between the PRS, wasoptimized for the measurements at 41◦C.
The significant benefit of PRS signals over the EIS isthe reduced measurement time which was over twelvetimes faster for both PRS signals. Moreover, the com-plexity of the PRS signals is very low since only two andthree signal levels are required. From the applied PRSsignals, the ternary-sequence showed better performanceat the low-frequency region even with lower excitationamplitude. With the increased bandwidth and accuracyof the measurements, the ternary-sequence holds thepotential to be scaled for other Li-ion chemistries. Thus,
9

This work is licensed under a Creative Commons Attribution 3.0 License. For more information, see http://creativecommons.org/licenses/by/3.0/.
This article has been accepted for publication in a future issue of this journal, but has not been fully edited. Content may change prior to final publication. Citation information: DOI 10.1109/TPEL.2019.2924286, IEEETransactions on Power Electronics
the ternary-sequence is attractive alternative for the con-ventional EIS for utilizing the impedance measurementsin online battery applications.
VI. CONCLUSIONS
This paper demonstrated the use of two PRS excitationsignals, the PRBS and the ternary-sequence, for fastbattery impedance measurements. Both sequences werecomprehensively designed and validated to reliable EISreference measurements in various operating conditionsfor a LiFEPO4 battery cell. The measurement time withboth PRS signals was only 4.7s which is twelve timesless than that of the EIS for which the measurementtime was 1min. The complexity of the PRS signals isalso significantly lower than for the EIS and the PRSsignals could be implemented to an application withlow-cost micro-processors. The practical measurementsshowed that the performance of the ternary-sequence ishigher especially at the low frequencies where the PRBSresults were slightly distorted. Another advantage of theternary sequence is that the signal allows using smallerinjection amplitude compared to the PRBS. Moreover,the linear Kronig-Kramers compliance test validatedthe performance of the ternary-sequence. By contrast,the PRBS measurements were found to be corruptedmostly due to the non-linear distortion affected to themeasurements especially at the diffusion region of thebattery impedance. By considering the aforementionedaspects, the ternary-sequence is a very attractive alter-native for battery impedance measurement and practicalfor online battery applications in electric-vehicles and instationary energy storages with scalability to other Li-ionchemistries.
ACKNOWLEDGMENT
This work was supported by Tiina and Antti HerlinFoundation, as well as, the Academy of Finland
REFERENCES
[1] S. Vazquez, S. M. Lukic, E. Galvan, L. G. Franquelo, andJ. M. Carrasco, “Energy Storage Systems for Transport and GridApplications,” IEEE Trans. Ind. Electron., vol. 57, no. 12, pp.3881–3895, 2010.
[2] G. Berckmans, M. Messagie, J. Smekens, N. Omar, L. Vanhaver-beke, and J. V. Mierlo, “Cost projection of state of the art lithium-ion batteries for electric vehicles up to 2030,” Energies, vol. 10,no. 9, 2017.
[3] H. Rahimi-Eichi, U. Ojha, F. Baronti, and M. Chow, “BatteryManagement System: An Overview of Its Application in theSmart Grid and Electric Vehicles,” IEEE Ind. Electron. Mag.,vol. 7, no. June, pp. 4–16, 2013.
[4] J. Rivera-Barrera, N. Munoz-Galeano, and H. Sarmiento-Maldonado, “SoC Estimation for Lithium-ion Batteries: Reviewand Future Challenges,” Electronics, vol. 6, no. 4, p. 102, 2017.
[5] M. Berecibar, I. Gandiaga, I. Villarreal, N. Omar, J. Van Mierlo,and P. Van den Bossche, “Critical review of state of healthestimation methods of Li-ion batteries for real applications,”Renewable and Sustainable Energy Reviews, vol. 56, pp. 572–587, apr 2016.
[6] D. I. Stroe, M. Swierczynski, A. I. Stan, V. Knap, R. Teodor-escu, and S. J. Andreasen, “Diagnosis of lithium-ion batteriesstate-of-health based on electrochemical impedance spectroscopytechnique,” in 2014 IEEE Energy Conversion Congress andExposition (ECCE), Sept 2014, pp. 4576–4582.
[7] D. I. Stroe, M. Swierczynski, S. K. Kær, and R. Teodorescu,“Degradation Behavior of Lithium-Ion Batteries During CalendarAgeing - The Case of the Internal Resistance Increase,” IEEETrans. Ind. Appl., vol. 54, no. 1, pp. 517–525, 2018.
[8] J. Vetter, P. Nov, M. R. Wagner, and C. Veit, “Ageing mechanismsin lithium-ion batteries,” Journal of Power Sources, vol. 147, pp.269–281, 2005.
[9] D. V. Do, C. Forgez, K. El, K. Benkara, G. Friedrich, andS. Member, “Impedance Observer for a Li-Ion Battery UsingKalman Filter,” IEEE Trans. Veh. Technol, vol. 58, no. 8, pp.3930–3937, 2009.
[10] U. Westerhoff, T. Kroker, K. Kurbach, and M. Kurrat, “Electro-chemical impedance spectroscopy based estimation of the stateof charge of lithium-ion batteries,” Journal of Energy Storage,vol. 8, pp. 244–256, 2016.
[11] J. Xu, C. C. Mi, B. Cao, and J. Cao, “A new method to estimatethe state of charge of lithium-ion batteries based on the batteryimpedance model,” Journal of Power Sources, vol. 233, pp. 277–284, 2013.
[12] A. Zenati, P. Desprez, and H. Razik, “Estimation of the soc andthe soh of li-ion batteries, by combining impedance measure-ments with the fuzzy logic inference,” in IECON 2010 - 36thAnnual Conference on IEEE Industrial Electronics Society, Nov2010, pp. 1773–1778.
[13] H. Dai, B. Jiang, and X. Wei, “Impedance Characterization andModeling of Lithium-Ion Batteries Considering the Internal,”Energies, vol. 220, 2018.
[14] S. Skoog and S. David, “Parameterization of linear equivalent cir-cuit models over wide temperature and SOC spans for automotivelithium-ion cells using electrochemical impedance spectroscopy,”Journal of Energy Storage, vol. 14, pp. 39–48, 2017.
[15] E. Unamuno, L. Gorrotxategi, I. Aizpuru, U. Iraola, I. Fernandez,and I. Gil, “Li-ion battery modeling optimization based onElectrical Impedance Spectroscopy measurements,” InternationalSymposium on Power Electronics, Electrical Drives, Automationand Motion, pp. 154–160, 2014.
[16] E. Karden, S. Buller, and R. W. De Doncker, “A methodfor measurement and interpretation of impedance spectra forindustrial batteries,” Journal of Power Sources, vol. 85, no. 1,pp. 72–78, 2000.
[17] W. Huang and J. A. Qahouq, “An online battery impedancemeasurement method using DC-DC power converter control,”IEEE Trans. Ind. Electron., vol. 61, no. 11, pp. 5987–5995, 2014.
[18] X. Wei, X. Wang, and H. Dai, “Practical On-Board Measurementof Lithium Ion Battery Impedance Based on Distributed Voltageand Current Sampling,” Energies, vol. 11, no. 1, p. 64, jan 2018.
[19] E. Din, C. Schaef, K. Moffat, and J. T. Stauth, “A scalableactive battery management system with embedded real-timeelectrochemical impedance spectroscopy,” IEEE Transactions onPower Electronics, vol. 32, no. 7, pp. 5688–5698, 2017.
[20] R. Al Nazer, V. Cattin, P. Granjon, M. Montaru, and M. Ranieri,“Broadband identification of battery electrical impedance forHEVs,” IEEE Trans. Veh. Technol, vol. 62, no. 7, pp. 2896–2905,2013.
[21] J. A. Abu Qahouq and Z. Xia, “Single-Perturbation-Cycle OnlineBattery Impedance Spectrum Measurement Method with Closed-Loop Control of Power Converter,” IEEE Trans. Ind. Electron,vol. 0046, no. c, pp. 1–1, 2017.
10

This work is licensed under a Creative Commons Attribution 3.0 License. For more information, see http://creativecommons.org/licenses/by/3.0/.
This article has been accepted for publication in a future issue of this journal, but has not been fully edited. Content may change prior to final publication. Citation information: DOI 10.1109/TPEL.2019.2924286, IEEETransactions on Power Electronics
[22] Z. Xia and J. A. Qahouq, “Method for online battery ACimpedance spectrum measurement using DC-DC power converterduty-cycle control,” Conference Proceedings - IEEE AppliedPower Electronics Conference and Exposition - APEC, no. 1,pp. 1999–2003, 2017.
[23] D.-I. Stroe, M. Swierczynski, A.-I. Stroe, and S. Knudsen Kær,“Generalized Characterization Methodology for PerformanceModelling of Lithium-Ion Batteries,” Batteries, vol. 2, no. 4,p. 37, 2016.
[24] A. Lasia, Electrochemical Impedance Spectroscopy and its Ap-plications. New York, NY: Springer New York, 2014.
[25] D. A. Howey, P. D. Mitcheson, S. Member, V. Yufit, G. J. Offer,and N. P. Brandon, “Motor Controller Excitation,” IEEE Trans.Veh. Technol, vol. 63, no. 6, pp. 2557–2566, 2014.
[26] J. Sihvo, T. Messo, T. Roinila, and R. Luhtala, “Online internalimpedance measurements of li-ion battery using prbs broadbandexcitation and fourier techniques: Methods and injection design,”in 2018 International Power Electronics Conference (IPEC-Niigata 2018 -ECCE Asia), May 2018, pp. 2470–2475.
[27] A. J. Fairweather, M. P. Foster, and D. A. Stone, “Batteryparameter identification with Pseudo Random Binary Sequenceexcitation (PRBS),” Journal of Power Sources, vol. 196, no. 22,pp. 9398–9406, 2011.
[28] K. Godfrey, Perturbation Signals for System Identification. Pren-tice Hall, 1993.
[29] K. Godfrey, H. Barker, and A. Tucker, “Comparison of pertur-bation signals for linear system identification in the frequencydomain,” IEE Proceedings-Control Theory and Applications, vol.146, no. 6, pp. 535–548, 1999.
[30] A. H. Tan and K. R. Godfrey, “The generation of binaryand near-binary pseudorandom signals: An overview,” IEEETransactions on Instrumentation and Measurement, vol. 51,no. 4, pp. 583–588, 2002. [Online]. Available:http://www.eng.warwick.ac.uk/EED/DSM/prs.htm.
[31] T. Roinila and T. Messo, “Online Grid-Impedance MeasurementUsing Ternary-Sequence Injection,” IEEE Transactions on Indus-try Applications, vol. 54, no. 5, pp. 5097–5103, sep 2018.
[32] J. Sihvo, T. Messo, T. Roinila, and D. I. Stroe, “Online iden-tification of internal impedance of Li-ion battery cell usingternary-sequence injection,” in Energy Conversion Congress andExposition (ECCE), 2018 IEEE, 2018, pp. 1–7.
[33] J. J. Giner-Sanz, E. M. Ortega, and V. Perez-Herranz, “Opti-mization of the Perturbation Amplitude for EIS MeasurementsUsing a Total Harmonic Distortion Based Method,” Journal ofThe Electrochemical Society, vol. 165, no. 10, pp. E488–E497,jul 2018.
[34] S. Golestan, M. Ramezani, J. M. Guerrero, F. D. Freijedo, andM. Monfared, “Moving average filter based phase-locked loops:Performance analysis and design guidelines,” IEEE Transactionson Power Electronics, vol. 29, no. 6, pp. 2750–2763, 2014.
[35] B. A. Boukamp, “A Linear Kronig-Kramers Transform Test forImmittance Data Validation,” Journal of The ElectrochemicalSociety, vol. 142, no. 6, p. 1885, 1995.
[36] N. Storey, Electronics: a system approach, 4th ed. Pearson,2009.
Jussi Sihvo (S’18) received the M.Sc. degreein electrical engineering from Tampere Uni-versity of Technology, Tampere, Finland, in2018. Since then, he has worked as a doc-toral student with the Faculty of InformationTechnology and Communication Sciences atTampere University. His research interestsinclude modeling, diagnostics, and analysisof energy-storage systems and grid-connectedconverters.
Daniel-Ioan Stroe (M’11) received the Dipl.-Ing. degree in automatics from “Transilvania”University of Brasov, Romania, in 2008, andM.Sc. degree in wind power systems fromAalborg University, Aalborg, Denmark, in2010. He has been with Aalborg Universitysince 2010, from where he obtained his Ph.D.degree in lifetime modelling of Lithium-ionbatteries in 2014. Currently, he is an Asso-ciate Professor with the Department of En-ergy Technology, where he leads the Battery
Storage Systems research programme and the Battery Systems TestingLab. He was a Visiting Researcher with RWTH Aachen, Germany, in2013. He has co-authored over 100 journal and conference papers invarious battery-related topics. His current research interests are in thearea of energy storage systems for grid and e-mobility, Lithium-basedbatteries testing, modelling, diagnostics and their lifetime estimation.
Tuomas Messo (M’14) received his Ph.D. inelectrical engineering from the Tampere Uni-versity of Technology, Tampere, Finland, in2014. He is currently with GE Grid Solutionsand holds the position of Adjunct Professor atthe Tampere University in the field of powerelectronics, where he also worked as an As-sistant Professor between 2016 and 2019.His research interests include grid-connectedthree-phase power converters for renewableenergy applications and microgrids, dynamic
modeling, control design, impedance-based interactions in three-phasesystems and impedance design of grid-connected inverters.
Tomi Roinila (M’10) received his M.Sc.and Dr.Tech. degrees in automation and con-trol engineering from Tampere University ofTechnology (TUT), in Finland, in 2006 and2010, respectively. Since then, he has workedas an Academic research fellow and as anAcademic researcher with the Faculty ofEngineering and Natural Sciences, TampereUniversity. His main research interests in-clude modeling and control of grid-connectedpower-electronics system, analysis of power-
electronics multi-converter systems, and analysis of energy-storagesystems.
11