a fay: extensible distributed tracing from kernels to …€¦ · · 2015-07-28fay: extensible...
TRANSCRIPT

A
Fay: Extensible Distributed Tracing from Kernels to Clusters
ÚLFAR ERLINGSSON, Google Inc.∗
MARCUS PEINADO, Microsoft ResearchSIMON PETER, ETH Zurich∗
MIHAI BUDIU, Microsoft ResearchGLORIA MAINAR-RUIZ, Microsoft Research
Fay is a flexible platform for the efficient collection, processing, and analysis of software execution traces. Fay providesdynamic tracing through use of runtime instrumentation and distributed aggregation within machines and across clusters. Atthe lowest level, Fay can be safely extended with new tracing primitives, including even untrusted, fully-optimized machinecode, and Fay can be applied to running user-mode or kernel-mode software without compromising system stability. Atthe highest level, Fay provides a unified, declarative means of specifying what events to trace, as well as the aggregation,processing, and analysis of those events.
We have implemented the Fay tracing platform for Windows and integrated it with two powerful, expressive systems fordistributed programming. Our implementation is easy to use, can be applied to unmodified production systems, and providesprimitives that allow the overhead of tracing to be greatly reduced, compared to previous dynamic tracing platforms. To showthe generality of Fay tracing, we reimplement, in experiments, a range of tracing strategies and several custom mechanismsfrom existing tracing frameworks.
Fay shows that modern techniques for high-level querying and data-parallel processing of disagreggated data streamsare well suited to comprehensive monitoring of software execution in distributed systems. Revisiting a lesson from the late1960’s [Deutsch and Grant 1971], Fay also demonstrates the efficiency and extensibility benefits of using safe, statically-verified machine code as the basis for low-level execution tracing. Finally, Fay establishes that, by automatically derivingoptimized query plans and code for safe extensions, the expressiveness and performance of high-level tracing queries canequal or even surpass that of specialized monitoring tools.
Categories and Subject Descriptors: B.8 [Performance and Reliability]: General; C.2.4 [Distributed Systems]: Distributedapplications; C.4 [Performance of Systems]: Measurement techniques; C.4 [Performance of Systems]: Performance at-tributes; D.4.8 [Performance]: Monitors; D.2.5 [Software Engineering]: Testing and Debugging—Tracing
General Terms: Design, Experimentation, Languages, Measurement, Performance
ACM Reference Format:ACM Trans. Comput. Syst. V, N, Article A (January YYYY), 32 pages.DOI = 10.1145/0000000.0000000 http://doi.acm.org/10.1145/0000000.0000000
1. INTRODUCTIONFay takes a new approach to the collection, processing, and analysis of software execution traceswithin a machine or across a cluster. The dictionary definition of Fay is “a fairy,” as a noun, or “tojoin tightly or closely,” as a verb. In our work, Fay is a comprehensive tracing platform that providesboth expressive means for querying software behavior and also the mechanisms for the efficientexecution of those queries. Our Fay platform implementation shows the appeal of the approach andcan be applied to live, unmodified production systems running current x86-64 versions of Windows.
∗Work done while at Microsoft Research Silicon Valley.Author’s addresses: Ú. Erlingsson, Google Inc.; M. Peinado and Gloria Mainar-Ruiz, Microsoft Research, eXtreme Comput-ing Group, One Microsoft Way, Redmond, WA 98052; Simon Peter, Systems Group, ETH Zurich; Mihai Budiu, MicrosoftResearch Silicon Valley, 1065 La Avenida, Mountain View, CA 94043Permission to make digital or hard copies of part or all of this work for personal or classroom use is granted without feeprovided that copies are not made or distributed for profit or commercial advantage and that copies show this notice on thefirst page or initial screen of a display along with the full citation. Copyrights for components of this work owned by othersthan ACM must be honored. Abstracting with credit is permitted. To copy otherwise, to republish, to post on servers, toredistribute to lists, or to use any component of this work in other works requires prior specific permission and/or a fee.Permissions may be requested from Publications Dept., ACM, Inc., 2 Penn Plaza, Suite 701, New York, NY 10121-0701USA, fax +1 (212) 869-0481, or [email protected].© YYYY ACM 0734-2071/YYYY/01-ARTA $10.00DOI 10.1145/0000000.0000000 http://doi.acm.org/10.1145/0000000.0000000
ACM Transactions on Computer Systems, Vol. V, No. N, Article A, Publication date: January YYYY.

A:2 Ú Erlingsson et al.
At its foundation, Fay provides highly-flexible, efficient mechanisms for the inline generationand general processing of trace events, via dynamic instrumentation and safe machine-code exe-cution. These mechanisms allow pervasive, high-frequency tracing of functions in both kernel anduser-mode address spaces to be applied dynamically, to executing binaries, without interruption inservice. At the point of each trace event generation, Fay safely allows custom processing of eventdata and computation of arbitrary summaries of system state. Through safe execution of native ma-chine code and through inline code invocation (not using hardware traps), Fay provides primitiveswith an order-of-magnitude less overhead than those of DTrace or SystemTap [Cantrill et al. 2004;Prasad et al. 2005].
At its topmost level, Fay provides a high-level interface to systems tracing where runtime behaviorof software is modeled as a distributed, dynamically-generated dataset, and trace collection andanalysis is modeled as a data-parallel computation on that dataset. This query interface provides aflexible, unified means for specifying large-scale tracing of distributed systems. High-level queriesalso allow the Fay platform to automatically optimize trace event collection and analysis in waysthat often greatly reduce overhead.
Below is an example of a complete high-level Fay query that specifies both what to trace and alsohow to process and combine trace events from different CPUs, threads, and machines:
from io in cluster.Function("iolib!Read")where io.time < Now.AddMinutes(5)let size = io.GetArg(2) // request size in bytesgroup io by size/1024 into gselect new { sizeInKilobytes = g.Key,
countOfReadIOs = g.Count() };
This query will return, for an entire cluster of machines, an aggregate view over 5 minutes of theread sizes seen in a module iolib, for all uses of that module in user-mode or in the kernel. Inour Fay implementation, such declarative queries are written in a form of LINQ [Marguerie et al.2008]. From these queries, Fay automatically derives efficient code for distributed query execution,optimizing for factors such as early trace data aggregation and reduced network communication.
Fay can also be accessed through other, more traditional means. In particular, in our imple-mentation, Fay can be used through scripts in the PowerShell system administration scripting lan-guage [Stanek 2009], as well as directly through standard command-line tools. However it is used,Fay retains the best features of prior tracing systems, such as efficient trace event collection, lowoverhead—proportional to tracing activity, and zero by default—and stateful probes that can pro-cess event data directly at a tracepoint. Fay also provides strong safety guarantees that allow probesto be extended in novel ways with new, high-performance primitives.
1.1. Implementation and ExperienceFay has been implemented for the current x86-64 variants of Windows. However, the Fay approachis generally applicable, and could be used for distributed software execution tracing on most op-erating systems platforms. In particular, a Fay implementation for Linux should be achievable bymodifying existing mechanisms such as Ftrace [Rostedt 2009], Native Client [Yee et al. 2010], andthe FlumeJava or Hadoop data-parallel execution frameworks [Apache ; Chambers et al. 2010].
Although the specifics will vary, any Fay implementation will have to overcome most of thesame challenges that we have addressed in our implementation for Windows. First, Fay must pre-serve all the relevant software invariants—such as timing constraints, reentrancy and thread safety,locking disciplines, custom calling conventions, paging and memory access controls, and the exe-cution states of threads, processes, and the kernel—and these are often hard-to-enumerate, implicitproperties of systems platforms.
Specifically, Fay must correctly manage tracepoints and probes and reliably modify machine codeto invoke probes inline at tracepoints—which is made especially challenging by preemptive threadscheduling and hardware concurrency [Ansel et al. 2011]. As described in Section 3, Fay meets
ACM Transactions on Computer Systems, Vol. V, No. N, Article A, Publication date: January YYYY.

Fay: Extensible Distributed Tracing from Kernels to Clusters A:3
these challenges with generally-applicable techniques that include machine-wide code-modificationbarriers, non-reentrant dispatching, lock-free or thread-local state, and the use of time-limited, safemachine code to prevent side effects. In particular, Fay offers the lesson that reliable machine-codemodification is a good basis for implementing platform mechanisms, as well as to install tracepoints.
Second, Fay must provide mechanisms for safe machine-code extensibility, in a manner thatbalances tradeoffs between simplicity, performance, high assurance, applicability to legacy code,compatibility with low-level runtime environments, debuggability, ease-of-use, etc. As described inSection 3.3, the safety of our Fay extensions is based on XFI mechanisms, which are uniquely wellsuited to low-level, kernel-mode machine code [Erlingsson et al. 2006a]. We have developed severalvariants of XFI, over a number of years, and applied them to different purposes. Our experience isthat specializing mechanisms like XFI to the target application domain, and its constraints, resultsin the best tradeoffs. Thus, Fay’s XFI variant is relatively simple, and is tuned for thread-local, run-to-completion execution of newly-written, freshly ported, or synthesized Fay extensions, either inuser-mode processes or the kernel.
Third, as the last major hurdle, to efficiently support high-level queries, a Fay tracing plat-form must correctly integrate with new or existing query languages and data-parallel executionframeworks. In particular, Fay query-plan generation, optimizations, and task scheduling must cor-rectly consider the difference between persistent, redundantly-stored trace event data and tracepoint-generated data—which is available only at an online, ephemeral source, since a tracepoint’s thread,process, or machine may halt at any time. Section 4.2 describes how our Fay implementation meetsthis challenge, by using a simple, fixed policy for scheduling the processing of ephemeral traceevents, by using explicitly-flushed, constant-size (associative) arrays as the single abstraction fortheir data, and by applying incremental-view-update techniques from databases to query planningand optimization.
We have applied Fay tracing to a variety of execution monitoring tasks and our experience sug-gests that Fay improves upon the expressiveness and efficiency of previous dynamic tracing plat-forms, as well as of some custom tracing mechanisms. In particular, we have found no obstaclesto using data-parallel processing of high-level queries for distributed systems monitoring. AlthoughFay query processing is disaggregated—collecting and partially analyzing trace events separatelyon different CPU cores, user-mode processes, threads, and machines—in practice, Fay can combinecollected trace events into a sufficiently global view of software behavior to achieve the intendedmonitoring goals. We have found no counterexamples, ill-suited to Fay tracing, in our review of theexecution tracing literature, in our searches of the public forums and repositories of popular tracingplatforms, or in our experiments using Fay tracing to reimplement a wide range of tracing strategies,described in Section 5. Thus, while data-parallel processing is not a natural fit for all computations,it seems well-suited to the mechanisms, strategies, and queries of distributed systems tracing.
Our experiences also confirm the benefits of extensibility through safe, statically-verified machinecode—benefits first identified four decades ago in the Informer profiler [Deutsch and Grant 1971].Safe extensions are key to the flexibility of Fay tracing, since they allow any untrusted user toutilize new, native-code tracing primitives without increased risk to system integrity or reliability.As described in Section 4.2, they also enable practical use of high-level, declarative Fay tracingqueries, by allowing Fay to synthesize code for efficient, query-specific extensions that it can usefor early aggregation and processing in optimized Fay query plans.
In the rest of this paper we outline the motivation, design, and high-level interfaces of Fay tracingand describe the details of its mechanisms. We report on benchmarks, measurements, and use casesin order to establish the scalability, efficiency, and flexibility of Fay tracing and to show its benefitsto investigations of software behavior. In particular, we show that Fay tracing can replicate andextend a variety of powerful, custom strategies used on existing distributed software monitoringplatforms.
ACM Transactions on Computer Systems, Vol. V, No. N, Article A, Publication date: January YYYY.

A:4 Ú Erlingsson et al.
FayLINQ tracing a single machine:
FayLINQ tracing a cluster:
Tracing
Kernel
from event
in machine …
HD
Tracing
from event
in cluster …
Tracing
Kernel
from io
in cluster …
HD
Tracing
Kernel
from io
in cluster …
HD
Tracing
Kernel
from io
in cluster …
HD
Tracing
Kernel
from io
in cluster …
HD
Tracing
Kernel
from io
in cluster …
HD
Tracing
Kernel
from io
in cluster …
HD
Tracing
Kernel
from io
in cluster …
HD
Fig. 1. Tracing of an operating system and a machine cluster, as implemented in FayLINQ. Stars represent tracepoints,circles are probes, rounded rectangles are address spaces or modules, rectangles are machines, and pentagons denote finalaggregation and processing. Arrows show data flow, optimized for early data reduction within each module, process, ormachine; redundant copying for fault tolerance is not indicated.
2. GOALS AND LANGUAGE INTERFACESFay is motivated by an idealized model of software execution tracing for distributed systems, out-lined in Figure 1. The goals can be summarized as follows: The tracing platform should allow arbi-trary high-level, side-effect-free queries about any aspect of system behavior. At each tracepoint—i.e., when the traced behavior occurs at runtime—the platform should allow arbitrary processingacross all current system state. Such general processing probes should be allowed to maintain state,and used to perform early data reduction (such as filtering or aggregation) before emitting traceevents.
Ideally, tracing should incur low overhead when active and should have zero overhead whenturned off. The total overhead should be proportional to the frequency of tracepoints and to thecomplexity of probe processing. Tracing should be optimized for efficiency, in particular by favoringearly data reduction and aggregation; this optimization should apply to all communication, includingthat between probes, between traced modules, and between machines in the system. Finally, traceevents may be ephemeral, since software or hardware may fail at any time; however, once a traceevent has been captured, further trace processing should be lossless, and fault-tolerant.
To achieve these goals for Fay tracing, our implementation integrates with two high-level-language platforms: PowerShell scripting [Stanek 2009] and the DryadLINQ system for distributedcomputing [Yu et al. 2008]. Figure 2 and Figure 3 show examples of how Fay tracing can be speci-fied on these platforms.
ACM Transactions on Computer Systems, Vol. V, No. N, Article A, Publication date: January YYYY.

Fay: Extensible Distributed Tracing from Kernels to Clusters A:5
$probe = {process {switch( $([Fay]::Tracepoint()) ) {$([Fay]::Kernel("ExAllocate*")){ $count = $count + 1; }
}}end { Write-FayOutput $count; }
}Get-FayTrace $probe -StopAfterMinutes 5 ‘
| select count ‘| measure -Sum
Fig. 2. A Fay PowerShell script that counts the invocation of certain memory-allocation functions in a 5-minute interval,on all CPUs of a Windows kernel. Here, $probe uses a switch to match tracepoints to awk-like processing (counting)and specifies the output of aggregated data (the count). A separately-specified pipeline combines the outputs (into a finalsum).
cluster.Function(kernel, "ExAllocate*").Count(event => (event.time < Now.AddMinutes(5)));
Fig. 3. An example FayLINQ query to perform the same count as in Figure 2 across an entire cluster. From this, Fay cangenerate optimized query plans and efficient code for local processing (counting) and hierarchical aggregation (summing).
FayLINQ is a high-level interface to Fay tracing that allows analysis of strongly-typed sequencesof distributed trace events. FayLINQ is implemented by extending DryadLINQ and derives its ex-pressive programming model from Language INtegrated Queries, or LINQ [Marguerie et al. 2008].FayLINQ’s programming model allows a flexible combination of object-oriented, imperative codeand high-level declarative data processing [Yu et al. 2009; Yu et al. 2008]. A FayLINQ query cansimultaneously express trace collection, trace event analysis, and even the persisting of trace eventlogs.
FayLINQ queries operate on the entire dataset of all possible tracepoints, and their associatedsystem state, but hide the distributed nature of this dataset by executing as if it had been collectedto a central location. In practice, queries are synthesized into data-parallel computations that enabletracing only at relevant tracepoints, and perform early data selection, filtering, and aggregation oftrace events. FayLINQ makes use of modified mechanisms from DryadLINQ—described in Sec-tion 4.2—to handle query optimization, data distribution, and fault-tolerance [Yu et al. 2009; Yuet al. 2008]. In particular, analysis and rewriting of the query plan allows FayLINQ to automati-cally derive optimized code that runs within the finite space and time constraints of simple probeprocessing, and can be used even in the operating system kernel.
There is little room for optimization in script-based tracing systems such as Fay PowerShell, orthe popular DTrace and SystemTap platforms [Cantrill et al. 2004; Prasad et al. 2005]. These script-ing interfaces share inefficiencies that can also be seen in Figure 2. Trace events are generated byexecuting imperative probes that are specified separately, in isolation from later processing, and thisbarrier between event generation and analysis prevents most automatic optimizations. Furthermore,by default, for final analysis, trace events must be collected in a fan-in fashion onto a single machine.
In comparison, FayLINQ is able to give the illusion of tracing a single system, through a unified,coherent interface, even when multiple computers, kernels, or user-level processes are involved.Only a few limitations remain, such as that tracing may slightly perturb timing, and that probes canaccess only state in the address space they are tracing.
Fay tracing may sometimes be best done directly on the command line, or through a Power-Shell script, despite the limited opportunity for optimization, In particular, PowerShell is part ofthe standard Windows monitoring toolset, and is well suited to processing and analysis of objectsequences such as trace events [Stanek 2009]. Furthermore, PowerShell exposes Windows secure
ACM Transactions on Computer Systems, Vol. V, No. N, Article A, Publication date: January YYYY.

A:6 Ú Erlingsson et al.
remote access features that allow Fay scripts to be executed even across machines in heterogeneousadministrative domains.
Even so, the benefits of FayLINQ over PowerShell are made clear by the example query ofFigure 3. This query shows how simple and intuitive tracing a cluster of machines can be withFayLINQ—especially when compared against the more traditional script in Figure 2, which appliesto one machine only. Using FayLINQ, this query will also be executed in an efficient, optimizedfashion.
In particular, counts will be aggregated, per CPU, in each of the operating system kernels of thecluster; per-machine counts will then be aggregated locally, persisted to disk for fault-tolerance andfinally aggregated in a tree-like fashion for a final query result.
3. FUNDAMENTAL MECHANISMSAt the core of Fay tracing are safe, efficient, and easily extensible mechanisms for tracing kerneland user-mode software behavior within a single machine.
3.1. Tracing and ProbingThe basis of the Fay platform is dynamic instrumentation that adds function tracing to user-levelprocesses or the operating system kernel. Fay instrumentation is minimally intrusive: only the firstmachine-code instruction of a function is changed, temporarily, while that function is being traced.
Notably, Fay instrumentation uses inline invocations that avoid the overhead of hardware trapinstructions. However, such inline invocations, and their resulting state updates, are necessarilyconfined to a single process, or to the kernel, forcing each address space to be traced separately.Therefore, Fay treats even a single machine as a distributed system composed of many isolatedparts.
3.1.1. Tracepoints. Fay provides tracepoints at the entry, normal return, and exceptional exit ofthe traced functions in a target address space. All Fay trace events are the result of such functionboundary tracing. Fay can also support asynchronous or time-based tracepoints, as long as theyeventually result in a call to an instrumentable function.
When a tracepoint is triggered at runtime, execution is transferred inline to the Fay dispatcher.The dispatcher, in turn, invokes one or more probe functions, or probes, that have been associatedwith the tracepoint. A probe may be associated with one or more tracepoints, and any number ofprobe functions may be associated with each tracepoint. Further details of the Fay dispatcher aredescribed in Section 3.2 and illustrated in Figure 5.
To enable tracing of an address space, the base Fay platform module must be loaded into theaddress space to be traced. This platform module then installs probes by loading probe modules intothe target address space.
3.1.2. Probe Modules. Fay probe modules are kernel drivers or user-mode libraries (DLLs). Forboth FayLINQ and PowerShell, source-to-source translation is used to automatically generate com-piled probe modules. (Our implementation uses the freely available, state-of-the-art optimizingC/C++ compiler in the Windows Driver Kit [Microsoft Corp. 2010].)
Figure 4 outlines how Fay probe modules are used for tracing in the kernel address space. A high-level query is evaluated and compiled into a safe probe module; then, that driver binary is installedinto the kernel. At a kernel function tracepoint, Fay instrumentation ensures that control is trans-ferred to the Fay dispatcher, which invokes one or more probes at runtime. Finally the probe outputs(partially) processed trace events for further aggregation and analysis. Probe modules are subject tothe standard Windows access control checks. In particular, only system administrators can trace thekernel or other system address spaces, and kernel probe modules must be cryptographically signedfor the x86-64 platform. However, this is not enough: bad compiler setup, malicious input data, orother factors might easily lead to the creation of a flawed probe that would impair system securityand reliability. Therefore, subsequent to their generation, probe module binaries are rewritten andprocessed to establish that they can be safely loaded and used within the traced address space. This
ACM Transactions on Computer Systems, Vol. V, No. N, Article A, Publication date: January YYYY.

Fay: Extensible Distributed Tracing from Kernels to Clusters A:7
Target
Probe
Kernel Fay
ETW
Hotpatching XFI
Create probe
Tracing Runtime Aggregate query
Fig. 4. Overview of how Fay makes use of probes when tracing the kernel address space. Visual representations are as inFigure 1—e.g., the star is a tracepoint. Kernel arrows show probe module installation (going down), dynamic instrumentation(going left), the dispatch of a tracepoint to a probe function (going right), as well as the flow of trace event data (going up).
processing is based on a variant of XFI: a Software-based Fault Isolation (SFI) technique that isuniquely applicable to both kernel-mode and user-mode code [Wahbe et al. 1993; Yee et al. 2010;Erlingsson et al. 2006a]. Section 3.3 gives the details of the simplified XFI mechanisms used in ourFay platform.
Fay probe modules can be written from scratch, in C or C++, ported from legacy code, or evenhand-crafted in assembly code. Fay can also be extended with new computations or data structures,similarly specified as low-level or native code. Such Fay probe extensions might, for example, in-clude hash functions for summarizing state, or code for maintaining representative samples of data.Extensions allow enhancing Fay with new primitives without any changes to the platform—andcan be used even from FayLINQ or other high-level queries. Extensions are compiled with probes,and are subject to the same safety checks; therefore, they raise no additional reliability or securityconcerns.
Fay resolves symbolic target-module references by making use of debug information emitted atcompile time for executable binaries. (Much the same is done in other tracing systems [Cantrillet al. 2004; Prasad et al. 2005].) On the Windows platform, such “PDB files” are available, andeasily accessible through a public network service [Microsoft Corp. 2011c], for all components andversions of Windows.
3.1.3. Probe Processing. When triggered at a tracepoint, a probe will typically perform selection,filtering, and aggregation of trace data. For instance, a probe may count how often a function returnswith an error code, or collect a histogram of its argument values. However, probes are not limited tothese actions, they may perform arbitrary processing.
In particular, probes might summarize a large, dynamic data structure in the traced address spaceusing expensive pointer chasing—but do so only when certain, exceptional conditions hold true. Fayprobe extensions for such data traversal may even be compiled from the same code as is used in thetarget system. Thus, Fay tracing can make it practical to perform valuable, deep tracing of softwarecorner cases, and to gather all their relevant system state and execution context when probes aretriggered.
Fay probes can invoke an accessor support routine to examine the state of the system. Multi-ple accessors are available in a runtime library and can be used to obtain function arguments andreturn values, the current CPU, process, and thread identity, CPU cycle counts, etc. A TryReadaccessor allows attempted reading from any memory address, and thereby arbitrary inspection ofthe address space. All accessors are simple, and self-contained, in order to prevent probe activityfrom perturbing the traced system.
3.1.4. Probe State. For maintaining summaries of system behavior, Fay provides each probemodule with its own local and global memories. This mutable state is respectively private to eachthread (or CPU, in the kernel), or global to each probe module. These two types of state allow effi-
ACM Transactions on Computer Systems, Vol. V, No. N, Article A, Publication date: January YYYY.
A:8 Ú Erlingsson et al.
PF5
PF2
PF3
PF4
PF1 Caller:
...
e8ab62ffff call Foo
...
ff1508e70600 call[Dispatcher]
Foo: ebf8 jmp Foo-6
cccccc
Foo2: 57 push rdi
...
c3 ret
Module with a traced function Foo Fay platform module
Exception Handler:
call t.except_probes
return ContinueSearch
Dispatcher:
t = lookup(return_addr) ...
call t.entry_probes ...
call t.Foo2_trampoline ...
call t.return_probes
...
return /* to after call Foo */
Fay probes
XFI XFI
XFI XFI
XFI
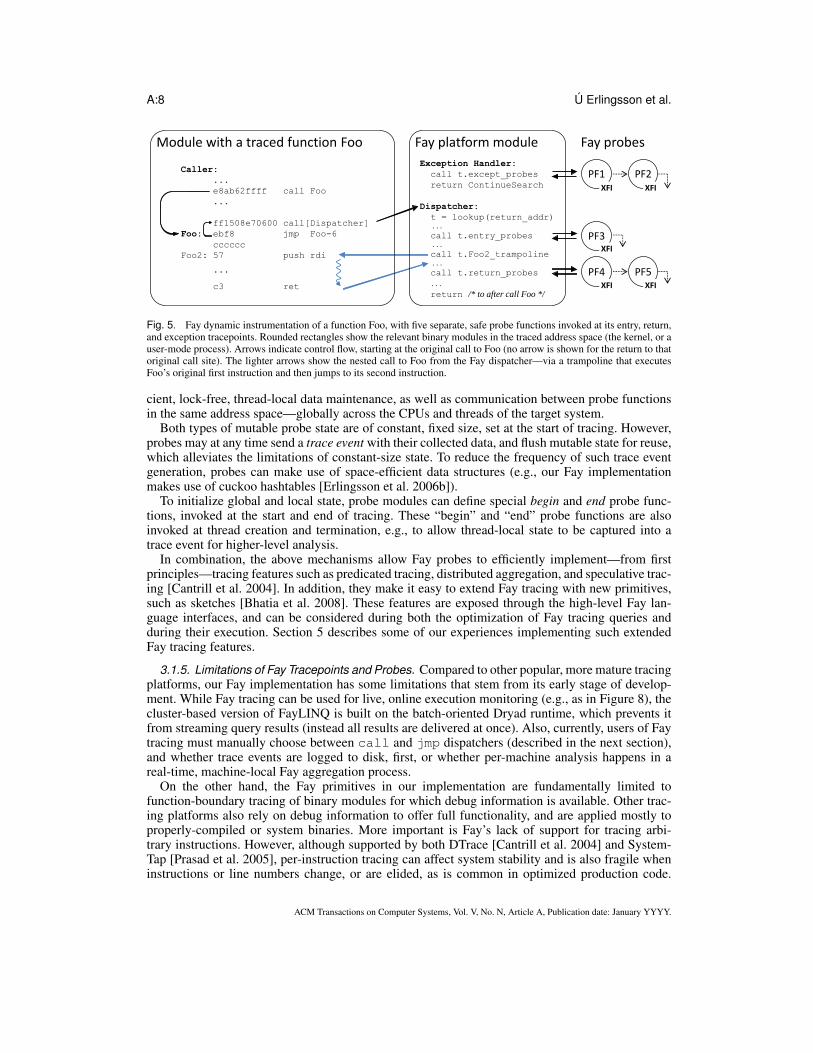
Fig. 5. Fay dynamic instrumentation of a function Foo, with five separate, safe probe functions invoked at its entry, return,and exception tracepoints. Rounded rectangles show the relevant binary modules in the traced address space (the kernel, or auser-mode process). Arrows indicate control flow, starting at the original call to Foo (no arrow is shown for the return to thatoriginal call site). The lighter arrows show the nested call to Foo from the Fay dispatcher—via a trampoline that executesFoo’s original first instruction and then jumps to its second instruction.
cient, lock-free, thread-local data maintenance, as well as communication between probe functionsin the same address space—globally across the CPUs and threads of the target system.
Both types of mutable probe state are of constant, fixed size, set at the start of tracing. However,probes may at any time send a trace event with their collected data, and flush mutable state for reuse,which alleviates the limitations of constant-size state. To reduce the frequency of such trace eventgeneration, probes can make use of space-efficient data structures (e.g., our Fay implementationmakes use of cuckoo hashtables [Erlingsson et al. 2006b]).
To initialize global and local state, probe modules can define special begin and end probe func-tions, invoked at the start and end of tracing. These “begin” and “end” probe functions are alsoinvoked at thread creation and termination, e.g., to allow thread-local state to be captured into atrace event for higher-level analysis.
In combination, the above mechanisms allow Fay probes to efficiently implement—from firstprinciples—tracing features such as predicated tracing, distributed aggregation, and speculative trac-ing [Cantrill et al. 2004]. In addition, they make it easy to extend Fay tracing with new primitives,such as sketches [Bhatia et al. 2008]. These features are exposed through the high-level Fay lan-guage interfaces, and can be considered during both the optimization of Fay tracing queries andduring their execution. Section 5 describes some of our experiences implementing such extendedFay tracing features.
3.1.5. Limitations of Fay Tracepoints and Probes. Compared to other popular, more mature tracingplatforms, our Fay implementation has some limitations that stem from its early stage of develop-ment. While Fay tracing can be used for live, online execution monitoring (e.g., as in Figure 8), thecluster-based version of FayLINQ is built on the batch-oriented Dryad runtime, which prevents itfrom streaming query results (instead all results are delivered at once). Also, currently, users of Faytracing must manually choose between call and jmp dispatchers (described in the next section),and whether trace events are logged to disk, first, or whether per-machine analysis happens in areal-time, machine-local Fay aggregation process.
On the other hand, the Fay primitives in our implementation are fundamentally limited tofunction-boundary tracing of binary modules for which debug information is available. Other trac-ing platforms also rely on debug information to offer full functionality, and are applied mostly toproperly-compiled or system binaries. More important is Fay’s lack of support for tracing arbi-trary instructions. However, although supported by both DTrace [Cantrill et al. 2004] and System-Tap [Prasad et al. 2005], per-instruction tracing can affect system stability and is also fragile wheninstructions or line numbers change, or are elided, as is common in optimized production code.
ACM Transactions on Computer Systems, Vol. V, No. N, Article A, Publication date: January YYYY.

Fay: Extensible Distributed Tracing from Kernels to Clusters A:9
Thus, this feature is not often used, and its omission should not greatly affect the utility of Faytracing.
To confirm that per-instruction tracing is rarely-used, we performed an extensive review of thepublic discussion forums and available collections of tracing scripts and libraries for both DTraceand SystemTap. The per-instruction tracing examples we could find either count the instructions ex-ecuted by a process or a function [Eigler 2010], or monitor changes to a certain variable [SystemTap]. This type of tracing is not likely to be common, since it requires extensive instrumentation andincurs correspondingly high overhead. Its goals are more easily achieved using hardware perfor-mance counters or memory tracepoints. Another per-instruction tracing application is the additionof new debugging messages to already-compiled code [Strosaker ]; however, the same can also beachieved by running under a debugger or, if recompilation is an option, by the addition of calls toempty functions, which Fay could then trace. Therefore, we have no current plans to extend Faybeyond function-boundary tracing.
Fay supports only disaggregated tracing, even within a single machine: Fay probes provide aseparate view of the activity in each address space, i.e., the kernel or each user-mode process.These views are combined by higher-level Fay trace-event processing. Existing tracing platformssuch as DTrace [Cantrill et al. 2004] support imperative operations on per-machine shared state,and use hardware-trap-based instrumentation to access this shared state from both the kernel andany user-mode address space. We have considered (but decided against) adding Fay support formachine-global probe state, accessible across all address spaces, implemented via memory mappingor a software device driver. So far, the distributed nature of Fay tracing has made it sufficientlyconvenient to get visibility into user-mode activity by combining trace events from user and kerneladdress spaces.
3.2. Dispatching Tracepoints to ProbesFay tracing uses inline invocations to a Fay probe dispatcher, through a call or jump instruction in-serted directly into the target machine code. Some other platforms dynamically insert a kernel tran-sition, or faulting instruction, to perform tracing [Cantrill et al. 2004; Prasad et al. 2005]. Comparedto this alternative, Fay inline tracing offers greater efficiency, by avoiding hardware traps; similarly,the Ftrace facility recently added to Linux also uses inline tracing for kernel functions [Rostedt2009].
Fay repurposes Windows hotpatching in a novel manner to modify the machine code at a functionentry point, so that control is transferred to the Fay probe dispatcher. Windows function hotpatch-ing is an existing operating systems facility, designed to allow incorrect or insecure functions tobe replaced on a running system, without a reboot or process shutdown [Microsoft Corp. 2003].Hotpatching performs reliable, atomic code modification with all CPUs in a well-defined state (e.g.,not executing the code being hotpatched). Previously, hotpatching has been rarely used: since itsintroduction in 2003, we are not aware of a generally-available software update from Microsoft thatmakes use of hotpatching.
Fay uses the hotpatching mechanism to insert, at the start of functions, inline invocations to theFay probe dispatcher. This permitted, but unintended use of hotpatching allows Fay to be used forthe pervasive tracing of existing, unmodified production systems.
All currently supported Windows binaries are hotpatch enabled. Hotpatching constrains machine-code at function entry: six unused bytes must be present before the function, and its first instructionmust be at least two bytes long, and be drawn from a small set of opcodes. Each binary must alsocontain a number of hotpatch data slots for pointers to new function versions; a normal binarymodule has only 31 such slots, while the kernel has 127. In Fay, these constraints on hotpatchdata slots do not limit the number of tracepoints: Fay tracing is scalable to an arbitrary number offunctions.
Figure 5 shows the machine code of a function Foo after Fay has used hotpatching to modifyFoo to enable its entry, return, and exceptional exit tracepoints. The first instruction of Foo hasbeen replaced with a two-byte instruction that jumps backwards by six bytes. At the six-bytes-
ACM Transactions on Computer Systems, Vol. V, No. N, Article A, Publication date: January YYYY.

A:10 Ú Erlingsson et al.
Probe
XFI
module globals
module
Probe
Ta
rge
t-s
ys
tem
ad
dre
ss
sp
ace
Fay
platform
module
Calls to Fay accessors
Dispatch to probe function Heap / other memory Stacks
locals
thread
Probe
Traced
target
module
Fig. 6. The layout of a traced address space, with a Fay probe XFI module. Probe functions may invoke only a restricted setof Fay accessor support routines. Probe functions may write only to the shaded memory areas—and only to the thread-localmemory of the current thread. A probe may attempt to read any memory address via a Fay accessor that prevents faults dueto invalid addresses. XFI safeguards the integrity of the execution stacks, privileged hardware registers, and other criticalhost-address-space state.
earlier address, a new instruction has been written that calls the Fay dispatcher. The call is indirect,through one of the hotpatch data slots of the target module being traced (this indirection allowsloading the Fay platform module anywhere in the 64-bit address space).
As Figure 5 indicates, upon entry the Fay dispatcher looks up a descriptor for the current tra-cepoint (shown as t in the figure). Tracepoint descriptors control what probes are triggered andprovide the crucial first instruction that allows the dispatcher to call the traced function. Fay looksup these descriptors in a space-efficient hashtable [Erlingsson et al. 2006b], and the use of a simplerhashtable, with significantly more memory, could reduce the cost of this lookup. For threads notbeing traced, the lookup and use of descriptors might even be eliminated by using a Fay dispatcherwith multiple entry points—one for each possible first instruction—since different preamble codeat each distinct entry point could instruct the Fay dispatcher how to emulate the effects of a tracedfunction’s first instruction before passing control to the rest of the function. Fay does not yet imple-ment such elaborations, since we have found the current lookup efficient enough (about 40 cyclesin our measurements).
A Fay tracepoint descriptor contains lists of probe functions to be invoked, as well as other rel-evant information—such as the global and local state to be used for each probe. Dispatching islock free, but runs with (most) interrupts disabled; descriptor updates are atomically applied at anall-CPU synchronization barrier.
If the current thread is to be traced, the Fay dispatcher will invoke probe functions both beforeand after the traced function as indicated in the tracepoint descriptor lists—subjecting the executionof each probe to the necessary safety and reliability constraints.
The Fay dispatcher also invokes the traced function itself. For this, the dispatcher creates a newstack frame with copies of the function’s arguments. Then, the dispatcher uses a pointer from thetracepoint descriptor to transfer control to a function-specific, executable trampoline that containsa copy of the traced function’s first instruction, followed by a direct jump to its second instruction.At runtime, before invoking this trampoline, Fay also copies all of the function arguments from thedispatcher’s invocation stack frame, to the new stack frame.
The Fay dispatcher also registers an exception handler routine, for capturing any exceptional exitof the function being traced. Fay invokes exceptional exit probes when an exception is unwoundpast this handler; once the probes have executed, Fay forwards the exception on to higher stackframes.
Fay provides multiple dispatcher implementations whose performance and scalability differs.In particular, depending on the traced function, Fay can save different sets of registers: functionssynthesized through whole-program optimizations require preserving all registers, while stable,externally-accessible functions require saving only a small, non-volatile set of registers.
Figure 5 shows the slowest and most scalable version of the Fay dispatcher. This version hot-patches a call instruction before the traced function. That call pushes Foo’s address on thestack for descriptor lookup. This dispatcher is scalable since it requires only one hotpatch data slot(out of the very limited number of slots). However, the call places a superfluous return address
ACM Transactions on Computer Systems, Vol. V, No. N, Article A, Publication date: January YYYY.

Fay: Extensible Distributed Tracing from Kernels to Clusters A:11
on the stack, which the dispatcher must eliminate before returning (at the /**/ comment). Unfortu-nately, on modern CPU architectures, such stack manipulations can have an adverse performanceimpact by disrupting dynamic branch prediction [Skadron et al. 1998]. Therefore, when only a lim-ited number of functions are traced, Fay will use a faster dispatcher, where hotpatching places ajmp instruction to a dispatch trampoline. Both dispatchers have low overheads; Section 5 comparestheir performance.
3.3. Reliability and SafetyReliability is the paramount goal of the Fay dispatcher and other Fay mechanisms; these must becorrect, and are designed and implemented defensively, with the goal of allowing target systems toalways make progress. In the worst case the Fay mechanisms fail gracefully. However, Fay reliescrucially on the safety of probe processing: to the rest of the system, probes must always appearas (almost) side-effect-free, pure functions—whether written by hand, compiled in an unknownenvironment, or even when crafted by a malicious attacker. To ensure probe safety, previous tracingsystems have used safe interpreters or trusted compilers [Cantrill et al. 2004; Prasad et al. 2005].
Fundamentally, Fay ensures probe safety through use of XFI: one of the recently-developed,low-overhead SFI mechanisms that are suitable to x86-64 CPUs [Erlingsson et al. 2006a; Wahbeet al. 1993; Yee et al. 2010]. XFI is the only SFI mechanism to be applicable even to machinecode that runs as part of privileged, low-level systems software. Thus, Fay can rely on XFI toprovide comprehensive constraints on machine code probes, including flexible access controls andstrong integrity guarantees, and yet allow probes to be utilized in any address space, including thekernel. As in all SFI systems, safety is enforced through a combination of inline software guardsand static verification of machine code. Below, we outline the characteristics of the Fay variant ofXFI; more details about its underlying policies and mechanisms can be found in the original XFIpaper [Erlingsson et al. 2006a].
Like previous variants, Fay XFI is implemented using the Vulcan [Srivastava et al. 2001] binaryrewriting tool. However, Fay XFI aims for simplicity, and avoids complexities—such as “fastpathguards” [Erlingsson et al. 2006a]—as long as doing so retains acceptable performance. Instead ofbeing fully inlined, XFI guards reside in separate functions, but are invoked inline with argumentspushed on the stack. While slightly less efficient, this style leads to minimal code perturbation,which both simplifies XFI rewriting and also facilities debugging and understanding of probe ma-chine code.
Fay XFI is also customized to its task of enforcing safety properties for Fay probes. Figure 6shows a Fay XFI probe module in a target address space (cf. Figure 1 in [Erlingsson et al. 2006a]).Fay probes should be side-effect-free, and execute only for short periods—to completion, withoutinterruption, serially on each (hardware) thread—using only the fixed-size memory regions of theirlocal and global state, and making external invocations only to Fay accessor routines. Thus, upona memory access, Fay XFI memory-range guards need compare against only one thread-local andone static region, and do not need to consult slowpath permission tables. XFI can also consult fixedtables upon use of a software call gate.
Fay probes are not unmodified legacy code—they are either newly written, newly ported, or au-tomatically generated. Therefore, Fay XFI does not allow arbitrary C, C++, or assembly code, butimposes some restrictions on how probes are written. Fay probes may not use recursive code, dy-namically allocate memory on the stack frame, or make use of function pointers or virtual methods;these restrictions make XFI enforcement of control-flow integrity trivial, and also reduce the numberof stack-overflow guards necessary, by allowing worst-case stack usage to be computed statically.Also, Fay probes may not use code that generates or handles exceptions, or use other stack contextsaving functionality; such probe code would be very difficult to support at low levels of the kernel;as a consequence, in the Fay version of XFI we have removed the XFI required host-system support.Finally, Fay probes may not access stack memory through pointers, so probe code must be convertedto use thread-local probe state instead of stack-resident variables; this simplifies XFI rewriting andverification, and eliminates the need for XFI allocation stacks. These restrictions do not prevent any
ACM Transactions on Computer Systems, Vol. V, No. N, Article A, Publication date: January YYYY.

A:12 Ú Erlingsson et al.
functionality, and although they may result in greater porting efforts for some Fay probe extensions,this is not onerous, since Fay probes necessarily execute relatively small amounts of code and thiscode is often automatically generated.
Despite the above simplifications, Fay XFI still enforces all the safety properties of XFI [Er-lingsson et al. 2006a]—for instance, constraining machine-code control flow, preventing use ofdangerous instructions, restricting memory access, and thwarting violations of stack integrity.
3.3.1. Thread-local Tracking for Reliability. To ensure reliability, the interactions between Fay andthe software it is tracing must always be benign. Thus, the operation of the Fay dispatcher, probes,and accessors must be self-contained, since Fay’s invocation of an external subsystem might ad-versely affect the integrity of that subsystem, or result in deadlock. For example, while Fay accessorroutines may read system state, they must never invoke system functions with negative side effects.
A thread that is performing Fay dispatching must be treated differently by both the Fay platformand the system itself. In particular, Fay tracing must not be applied recursively, such as might happenif Fay were used to trace system functions that are themselves used by code in a Fay accessor routine.This scenario might happen, e.g., if Fay tracing was applied to mechanisms for trace event transport.
To prevent recursive tracing, Fay maintains a thread-local flag that is set only while a probe isexecuting, and that is checked during dispatching. (In the kernel, a small amount of thread-localstorage is available in the CPU control block; in user mode, arbitrary thread-local storage is avail-able.) A similar flag allows Fay to efficiently support thread-specific tracing: the common scenariowhere some threads are traced, but not others. Depending on the state of these flags for the currentthread, the Fay dispatcher may skip all probes and invoke only the traced function. Fay keeps acount of lost tracing opportunities due to the Fay dispatcher being invoked recursively on a flaggedthread.
Fay does not enforce any confidentiality policy: no secrets can be held from kernel probes. Evenso, Fay kernel probes are subject to an unusual form of memory access control. A probe may writeonly to its global or local state, and may only read those regions when dereferencing a memoryaddress. In addition, probes may use a special TryRead accessor to try to read a value from any(potentially invalid) memory address; this functionality can be used by probes that perform pointerchasing, for example. The TryRead accessor sets a thread-local flag that changes pagefault be-havior on invalid memory accesses and prevents the kernel from halting (Section 3.5 gives furtherdetails on its implementation). However, Fay will prevent even TryRead from accessing the mem-ory of hardware control registers, since such accesses could cause side effects.
Finally, probes must be prevented from executing too long. In the kernel, a special tracing probeis added by Fay to one of the Windows kernel functions that handles timer interrupts, to detectrunaway probes. This special probe maintains state that allows it to detect if a hardware thread isstill running the same probe as at the previous timer interrupt—and will trigger an exception if aFay probe runs for too many timer interrupts in a row.
3.4. Transporting Trace EventsFay uses Event Tracing for Windows, (ETW) [Park and Buch 2007] to collect and persist traceevents in a standard log format. ETW is a high-functionality Windows system mechanism thatprovides general-purpose, structured definitions for trace events, efficient buffering of trace events,support for real-time trace consumers as well as efficient persistent logging and access to tracelogfiles, support for dynamic addition and removal of producers, consumers, and trace sessions, as wellas the automatic provisioning of timestamps and other metadata.
ETW tracing is lock free and writes trace events to CPU-local buffers. Also, ETW is lossless, inthat the number of outstanding buffers is dynamically adjusted to the rate of event generation—andin the unlikely case that no buffer space is available, an accurate count of dropped events is stillprovided. Finally, the standard, manifest-based ETW tracelog formats allows Fay trace events to beconsumed and processed by a wide range of utilities on the Windows platform.
ACM Transactions on Computer Systems, Vol. V, No. N, Article A, Publication date: January YYYY.

Fay: Extensible Distributed Tracing from Kernels to Clusters A:13
$probe = {process {
$malloc = "ExAllocatePoolWithTag";$pin = $($nt["POOL_TYPE.NonPagedPool"]);switch( $([Fay]::Tracepoint()) ){$([Fay]::Kernel($malloc)) {$pool = Get-FayArg 1;$tag = Get-FayArg 3;if ($pool -eq $($pin)) {$counts[$tag] = $counts[$tag]+1;
}}$([Fay]::TickInSeconds(1)) {Write-FayOutput $counts;
}}
}}Get-FayTrace $probe -StopAfterMinutes 20 ‘
| select counts ‘| foreach {($_.GetEnumerator() ‘
| sort -Property Value ‘| select -Last 5| ConvertTo-Hashtable)} ‘
| Out-UpdatingChart -BarType
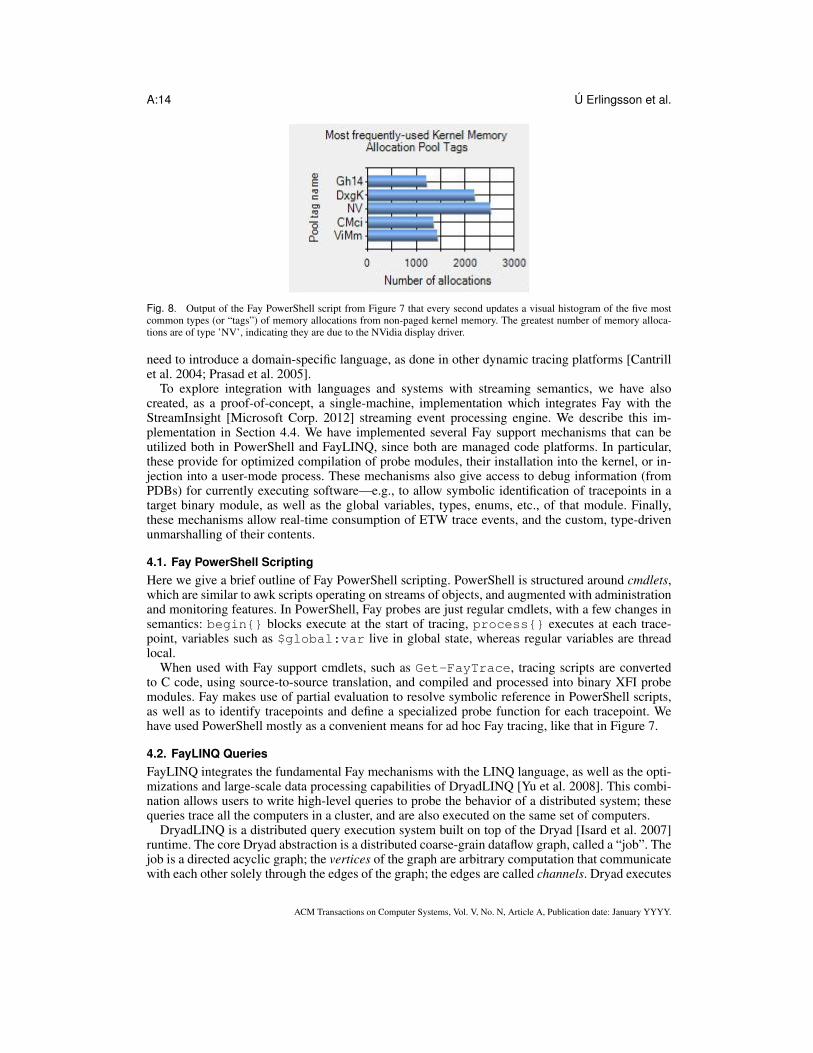
Fig. 7. A Fay script that updates a bar chart once per second with the five most common types (or “tags”) used by memoryallocations of non-paged kernel memory.
3.5. Practical Deployment IssuesOur Fay implementation has been crafted to ensure that it can be installed even on production sys-tems, without a reboot. In particular, we have carefully (and painfully) avoided dependencies onsystem internals, and on features that vary across Windows versions. For this, our Fay implementa-tion sometimes makes use of side-effect-free tracing of system functions such as in our support forasynchronous tracepoints. In one case we had to change the behavior of Windows: Fay hotpatchesthe kernel page fault handler with a new variant that throws an exception (instead of halting execu-tion) when invalid kernel-mode addresses are accessed during execution of the TryRead accessor.
The use of Fay tracing is subject to some limitations. In particular, Fay requires that target binarymodules have been compiled with hotpatching support; while this holds true for binaries in Windowsand Microsoft server products, it is not the case for all software. Also, kernel tracing with themore scalable Fay probe dispatcher will require rebooting with kernel debugging automaticallyenabled; otherwise, PatchGuard [Microsoft Corp. 2006] will bugcheck Windows after detecting anunexpected call instruction, which it disallows in machine-code hotpatches.
Finally, even for Windows system binaries, Fay is currently not able to trace variable-argumentfunctions—since the Fay dispatcher would then have to create a stack frame of unbounded size forits invocation of the traced function.
4. LANGUAGES FOR FAY TRACINGWe have integrated Fay with PowerShell to provide a traditional scripting interface to tracing, andwe have also built FayLINQ to provide a LINQ query interface and a declarative, data-parallelapproach to tracing distributed systems. Both these popular high-level language platforms provideflexible, efficient means of specifying tracing, in a manner that feels natural—thereby removing the
ACM Transactions on Computer Systems, Vol. V, No. N, Article A, Publication date: January YYYY.
A:14 Ú Erlingsson et al.
Fig. 8. Output of the Fay PowerShell script from Figure 7 that every second updates a visual histogram of the five mostcommon types (or “tags”) of memory allocations from non-paged kernel memory. The greatest number of memory alloca-tions are of type ’NV’, indicating they are due to the NVidia display driver.
need to introduce a domain-specific language, as done in other dynamic tracing platforms [Cantrillet al. 2004; Prasad et al. 2005].
To explore integration with languages and systems with streaming semantics, we have alsocreated, as a proof-of-concept, a single-machine, implementation which integrates Fay with theStreamInsight [Microsoft Corp. 2012] streaming event processing engine. We describe this im-plementation in Section 4.4. We have implemented several Fay support mechanisms that can beutilized both in PowerShell and FayLINQ, since both are managed code platforms. In particular,these provide for optimized compilation of probe modules, their installation into the kernel, or in-jection into a user-mode process. These mechanisms also give access to debug information (fromPDBs) for currently executing software—e.g., to allow symbolic identification of tracepoints in atarget binary module, as well as the global variables, types, enums, etc., of that module. Finally,these mechanisms allow real-time consumption of ETW trace events, and the custom, type-drivenunmarshalling of their contents.
4.1. Fay PowerShell ScriptingHere we give a brief outline of Fay PowerShell scripting. PowerShell is structured around cmdlets,which are similar to awk scripts operating on streams of objects, and augmented with administrationand monitoring features. In PowerShell, Fay probes are just regular cmdlets, with a few changes insemantics: begin{} blocks execute at the start of tracing, process{} executes at each trace-point, variables such as $global:var live in global state, whereas regular variables are threadlocal.
When used with Fay support cmdlets, such as Get-FayTrace, tracing scripts are convertedto C code, using source-to-source translation, and compiled and processed into binary XFI probemodules. Fay makes use of partial evaluation to resolve symbolic reference in PowerShell scripts,as well as to identify tracepoints and define a specialized probe function for each tracepoint. Wehave used PowerShell mostly as a convenient means for ad hoc Fay tracing, like that in Figure 7.
4.2. FayLINQ QueriesFayLINQ integrates the fundamental Fay mechanisms with the LINQ language, as well as the opti-mizations and large-scale data processing capabilities of DryadLINQ [Yu et al. 2008]. This combi-nation allows users to write high-level queries to probe the behavior of a distributed system; thesequeries trace all the computers in a cluster, and are also executed on the same set of computers.
DryadLINQ is a distributed query execution system built on top of the Dryad [Isard et al. 2007]runtime. The core Dryad abstraction is a distributed coarse-grain dataflow graph, called a “job”. Thejob is a directed acyclic graph; the vertices of the graph are arbitrary computation that communicatewith each other solely through the edges of the graph; the edges are called channels. Dryad executes
ACM Transactions on Computer Systems, Vol. V, No. N, Article A, Publication date: January YYYY.

Fay: Extensible Distributed Tracing from Kernels to Clusters A:15
job graphs reliably on a computer cluster. In most Dryad jobs the input vertices represent datastored on some persistent medium (e.g., a disk). FayLINQ synthesizes Dryad jobs where the inputvertices are executables that insert probes into a running system and capture their outputs. Theoutput channels of the input vertices will transport the events generated by the probes.
DryadLINQ provides a high-level language layer on top of Dryad, by automatically translatingprograms written in the .Net framework into Dryad graphs. More specifically, DryadLINQ trans-lates queries written in LINQ [Marguerie et al. 2008] into Dryad jobs, while executing the impera-tive fragments of the .Net programs as user-defined functions in each vertex. The core datatype ofLINQ is a collection of data values; the LINQ language contains a set of operations on collections.The capabilities of LINQ computations are similar to those of relational algebra (filtering, transfor-mation, aggregation, grouping, sorting, joining), but operate on a richer data model of collections ofarbitrary .Net objects.
On both a single machine, and on a cluster, the input data processed by FayLINQ is naturallymodeled as a concurrent set of trace event streams. Fay tracing generates multiple, disjoint streamsof ordered trace events, with a separate trace event stream output by each thread in each addressspace (or each CPU core in the kernel). Therefore, FayLINQ tracing consists of the execution ofLINQ queries whose input is the unordered, merged collection composed by the union of theseordered streams.
The FayLINQ compiler starts from a single, high-level query and generates an efficient set oftracepoints, and code for Fay probes that perform extraction, processing, and early aggregationof trace event data. FayLINQ also relies on DryadLINQ to produce optimized query plans andprocessing code for both machine-local and cluster-level aggregation and analysis.
The example in Figure 9 helps explain how FayLINQ operates, and gives an overview of queryexecution. In the query, kernelAllocations constrains the set of tracepoints to those at theentry of the primary kernel memory allocation function—with the Function method operat-ing like a filtering Where clause. Then, from each tracepoint, the query retrieves the time prop-erty and the size of the allocation, which is the second argument of ExAllocatePool. Then,allocIntervalSizePairs is used to collect, for each tracepoint, which period-length in-terval it fell into, and integer log2 of its allocation size. These events are then grouped togetherinto results, and a separate count is made of each group where both the time and log2 alloca-tion sizes are equal, with these triples output as strings. This final grouping applies to events fromall machines, and is implemented in two phases: first on each machine, and then across all clustermachines.
Distributed tracing can be straightforwardly implemented by emitting trace events for each tra-cepoint invocation and collecting and processing those events centrally. One approach would be touse a flat, wide schema (the union of all possible output fields) to allow the same trace events to beoutput at any probe and at any tracepoint. Probes may be very simple, and need only fill out fieldsin the schema. Unfortunately, this is not a very viable strategy: flattened schemas lead to large traceevents, and the output of trace events at high-frequency tracepoints will incur significant load, whichmay easily skew measurements or even swamp the system.
Instead of the above, naive implementation approach, FayLINQ performs a number of steps tooptimize the execution of queries like that in Figure 9. As a result, the execution of each query is splitin three different tiers, as shown in Figure 10. First, each probe executes in the context of a singleaddress space (i.e., the kernel or a user-mode process) and perform filtering, early aggregation, andother processing that is best performed close to the generation of (ephemeral) events; for efficiency,probe processing typically involves only lock-free state (e.g., hardware- or software-thread-localmemory). Second, each machine aggregates, performs initial joins, and persists the output datafrom all address spaces and probes on the machine. Third, and finally, the cluster performs reliabledistributed processing to aggregate output data and perform final joins across all machines.
ACM Transactions on Computer Systems, Vol. V, No. N, Article A, Publication date: January YYYY.

A:16 Ú Erlingsson et al.
// Get the disaggregated set of kernel allocation trace events.var kernelAllocations =
cluster.Function(kernel,"ExAllocatePool");
// For the next 10 minutes, map each allocation to a coarser period-based// timeline of intervals and to log2 of the requested allocation size.var allocIntervalSizePairs =
from event in kernelAllocationswhere event.time < Now.AddMinutes(10)let allocSize = event.GetArg(2) // NumberOfBytesselect new { interval = event.time/period,
size = log2(allocSize)) };
// Group allocations by interval and log2 of the size and count each group.var results =
from pair in allocIntervalSizePairsgroup pair by pair into reductionselect new { interval = reduction.Key.interval,
logsize = reduction.Key.size,count = reduction.Count() };
// Map each interval/ log2size/count triple to a string for output.var output =
results.Select( r => r.ToString() );
Fig. 9. A FayLINQ query that summarizes the rate of different-sized kernel memory allocation requests over 10 minutes.The output indicates, for each period-length interval, how often allocation sizes of different magnitude were seen.
4.2.1. Generic Optimizations. First, FayLINQ performs basic DryadLINQ query optimizations,like dead code removal, and moving filtering and selection to the leaves of the query plan—i.e.,towards the source of trace event data, the tracepoints.
4.2.2. Early Aggregation. Next the query plan optimizer tries to move computations as early aspossible, and to push as much computation as possible into the Fay probe functions. The queryis optimized using a set of term-rewriting rules, shown in Figure 10. The rules push (parts of)computations in front of “merge” operators; thus, instead of collecting events from all probes andprocessing the resulting merged stream, the processing is moved ahead of the merge, and performedon the data stream of each probe independently. Filtering and transformation are trivially moved,since they operate on events independently (first two rewrite rules), while associative aggregation(with or without grouping) can be partially pushed into the probes (last two rewrite rules). Manyaggregation operations (shown as A in the figure) can be written as a “map” function followed byan associative aggregation. These functions are rewritten to perform the map phase and an initialround of aggregation locally, followed by a final aggregation of the results across all probes. Forexample, Count is the composition of a map tranforming each value to a constant 1, followedby a Sum, so it is rewritten as a local Count followed by a global Sum. A similar observationholds for aggregations that are applied after grouping values using GroupBy (denoted by GA inFigure 10). A combination such as GroupBy(e => key(e)).Select(g => g.Count())can be rewritten into a local GC phase, which only builds groups and aggregates locally at eachprobe, followed by a data exchange and one (or more) global aggregations GR, which combine thepartial results. GC and GR are also called “combiner” and “reducer” in [Dean and Ghemawat 2010].The DryadLINQ compiler already contains extensive optimizations and static analyses to cope withsuch constructs [Yu et al. 2009]. We leverage these optimizations in FayLINQ.
For the query in Figure 9, nearly all work can be pushed into Fay probes at the query plan leaves.The resulting query plan is shown in Figure 11; it spans both probes and cluster-level computation.
ACM Transactions on Computer Systems, Vol. V, No. N, Article A, Publication date: January YYYY.

Fay: Extensible Distributed Tracing from Kernels to Clusters A:17
I = Input
W = Where
S = Select
M = Merge
A = Aggregate
R = Reducer for A
GA = GroupBy-Aggregate
GC = GroupBy-Combiner
GR = GroupBy-Reducer
M
I I
LINQ query
M
W W
M
W
M
S S
M
S
M
A A
M
A R
M
GC GC
M
GA GR
M
M
I I probe
machine
cluster
Input query Rewrite rules
Legend
Fig. 10. Term-rewriting from LINQ to Fay probes, with circles and arrows representing operators and data flow. The inputoperation merges the trace events from tracepoints and performs user-specified computations on that merged stream. Term-rewriting optimizations push operations closer to data sources. The first and second rewrite rules push filtering and selectionahead of merging. The last rewrite rule transforms counting into a sum of partial counts; the third rule generalizes this lastone and rewrites aggregations on partial groups.
The dotted line marks the separation between Fay and DryadLINQ. Only the global aggregation andthe conversion of the output to strings are performed by DryadLINQ.
The code for the Fay probes is generated dynamically and shipped to the cluster as a job resource.At job runtime the job input Dryad vertices perform the following actions: specialize, build and in-stall the probes, then start a user-space loop to receive the ETW events generated by the probes. Onreceipt of an ETW event, the probe data is extracted from the event and converted to the C# repre-sentation used in the FayLINQ query, then it is writen as C# objects into the output Dryad channels,where it flows through the rest of the DryadLINQ job pipeline using reliable Dryad channels. Thecompiler statically infers the type of the payload of the ETW events, so it can generate very effi-cient code for marshalling and unmarshalling the data into ETW events. The DryadLINQ part of thequery runs on the cluster, taking full advantage of the fault-tolerance, scheduling and optimizationsof the Dryad runtime, which is proven to scale to large clusters.
4.2.3. Probe Code Generation. As described above, the FayLINQ implementation optimizes thequery plan to move data filtering, transformation, and aggregation (including GroupBy-Aggregate)from the LINQ query into Fay probes. Currently, the following LINQ statements can be executed byFay probes: Where, Select, Aggregate, and GroupBy—as well as the many special cases ofthese operators, such as Sum, Count, Average, Distinct, Take, etc. Query parts that cannotbe executed by probes are executed by DryadLINQ, on the cluster. This includes the aggregates ofdata from multiple machines—which, DryadLINQ will automatically perform in a tree-like fashion,when that improves performance [Yu et al. 2009].
The probes treat the event source as a continuous, incrementally-updated stream. The query is in-terpreted as a database view, and query evaluation is recast as an incremental view update, a problem
ACM Transactions on Computer Systems, Vol. V, No. N, Article A, Publication date: January YYYY.

A:18 Ú Erlingsson et al.
S
W
S
GC
GR
S
S
W
S
GC
GR
S
FayLINQ probe processing: Distributed, partial aggregation, local to CPUs, machines, etc.
Final aggregation in DryadLINQ
Ephemeral trace events transition to being
persistent, fault-tolerant
Fig. 11. Optimized plan for the query in Figure 9. Symbols are as in Figure 10 and its legend. The first two S operationscompute allocIntervalSizePairs. The computation of results is synthesized as GC+GR. The final S computesoutput.
Table I. Incremental implementations of LINQ operations.
LINQ operator C code for probesWhere(e => p(e)) if (!p(e)) return;
Select(e => f(e)) result = f(e);
Aggregate((x,y)=>f(x,y)) agg = f(agg, x)
GroupBy(e => k(e)) key = k(e);.Select(g => g.Count()) v = hashLookup(key);
if (hashFull(key))EmitAndClrHash();
hashUpdate(key, v+1);
well-known in the database literature [Gupta et al. 1993]. Fortunately, many of the natural opera-tions on probe events (transformation, filtering and aggregation) are easily amenable to very efficientimplementations using incremental view updates. We will call them incremental implementations.
An operation can be moved into the probe only if three conditions can be met: (1) the operationinvokes user-defined code which can be translated to C, (2) the operation can be implemented in-crementally and (3) the operation manipulates only data available locally to the probe. To elaborate:
(1) LINQ queries can invoke arbitrary user-defined code written in C#. However, we cannot ex-pect to run arbitrary C# programs as part of a probe. We have implemented a C# to C syntax-directed translator for a subset of C#. The allowed C# constructs are restricted to manipulatingonly value types (basic types or structures), invoking static functions and using local values, orlambda-expressions with a local context. If a construct does not satisfy these criteria, it cannotbe implemented as part of the probe, so it is executed in the user-level DryadLINQ computation.
(2) Next, incremental update code is generated for the LINQ operators which are implemented aspart of the probes. Table I shows pseudocode for the incremental translations of these operators.The GroupBy operator is incrementalized only if it is immediately followed by a per-groupaggregation. The incremental version of GroupBy uses a cuckoo hashtable indexed with thegroup key and storing the result of the aggregation. While Table I shows only an example us-ing GroupBy/Count, the compiler supports arbitrary GroupBy/Aggregate combinations(also called the “map-reduce pattern”). The hashtables are fixed-size (statically allocated); whena hashtable is full, its contents are marshalled as an ETW event and it is cleared for reuse. Asecond-level aggregation running at the user-level is responsible for “fixing” the partial aggre-gates caused by a full hashtable.
ACM Transactions on Computer Systems, Vol. V, No. N, Article A, Publication date: January YYYY.

Fay: Extensible Distributed Tracing from Kernels to Clusters A:19
For the program in Figure 11 at each probe invocation, the time interval and logarithm of al-location size are computed immediately and used to update counts in a hashtable. Each ETWevent contains as payload the complete contents of the cuckoo hashtable, an array of hashtableentries. Each hashtable entry contains a key and a value. In this case the key is a C structwith two fields: { int interval, int logsize }. The value is the integer count.
(3) Finally, an operation can only be implemented inside a probe if it manipulates informationcomputed by the probe or accessible in its address space. For example, an operation whichaggregates information across machines cannot be implemented entirely inside a probe. On theother hand, some aggregations can processed completely within a probe, or on a single machine:for example, all aggregations of groups which include the local machine as part of the key (suchaggregations do not access data from different machines).
The Fay probes will usually perform some aggregation. The results of the aggregation are period-ically encapsulated in ETW events and flushed to the cluster-level aggregation pipeline. Normallythe aggregation results are flushed when the internal fixed-size hashtables are filled. However, theuser can control the message frequency by specifying that aggregated event statistics should beflushed at least every k probe invocations.
4.3. Writing Complex ProbesWhile LINQ is powerful enough to express many interesting computations using events, we havefound the constraint (1) quite limiting: there are many useful C operations that have no counterpartin C# (e.g., dereferencing a pointer). In order to exploit the full expressive power of the native probeswe have extended the system in two ways:
(1) We allow the LINQ computations to invoke the Fay accessor functions described in Sec-tion 3.1.3. For example, the following LINQ query will find the processes that allocate most memoryon the cluster during the measurement interval:
cluster.Functions(‘‘ExAllocatePoolWithTag’’).Where(e => e.time < Now.AddMinutes(10)).Select(e => new {
Machine = Fay.GetMachineID(),PID = Fay.GetCurrentProcessID() })
.GroupBy(e => e)
.Select(g => new { key = g.Key, count = g.Count() })
.OrderByDescending(p => p.count)
.Take(10)
For this query the key used for indexing the hashtable is a tuple composed from the machine id(the IP address) and the process id.
(2) We allow the user to supply additional hand-written C code in source files which are shippedto the cluster as resources of the DryadLINQ computation. The C code is compiled, sandboxedand linked to the probe by the FayLINQ input vertex prior to probe injection. The hand-writtenC code can use private statically-allocated persistent state. The user is allowed to invoke these Cfunctions in the LINQ query as user-defined external functions. The static persistent state willbe translated by our compiler to references to a probe-allocated global state. We show an exampleusing this feature in Section 5.2.3 to implement statistical biased filtering using sketches.
4.4. Combining Fay and StreamInsightFayLINQ leverages DryadLINQ for implementing efficient large-scale, fault tolerant data analysison the cluster. However, DryadLINQ is a batch computation engine, which assumes that the entiredata is available before starting the computation. As a consequence, while the FayLINQ probes gen-erate data incrementally, the cluster-level part of the FayLINQ pipeline will block until all eventshave been received and decoded. This behavior is undesirable for performing a long-running anal-
ACM Transactions on Computer Systems, Vol. V, No. N, Article A, Publication date: January YYYY.

A:20 Ú Erlingsson et al.
Table II. The processes in the command shell case study, anda count of how often they made the relevant system calls.The two calling NtRequestWaitReplyPort did so aboutequally often.
Windows System Call Count Callers
NtRequestWaitReplyPort 1,515,342 cmd.execonhost
NtAlpcSendWaitReceivePort 764,503 CSRSSNtQueryInformationProcess 758,933 CSRSSNtReplyWaitReceivePort 757,934 conhost
ysis where there is a need to inspect partial results on the fly. For such a case one should use astreaming computation engine.
To evaluate the feasibility of such an implementation we have built a simple prototype whichintegrates Fay with the Microsoft StreamInsight stream-processing engine [Microsoft Corp. 2012].We have used a single-machine version of StreamInsight, since a distributed version was not avail-able. The StreamInsight query language is also based on LINQ, but is richer than traditional LINQ,supporting explicit temporal query operators. We have not yet built an integrated compiler to gen-erate probe code from StreamInsight queries, but we foresee no fundamental obstacle for adaptingour LINQ compiler to this setting. StreamInsight is connected to the probes by the TraceInsightsoftware layer, which converts ETW event streams into StreamInsight event streams.
The availability of temporal query operators makes it much easier to express some types ofqueries, for example, the ones involving explicit time sequencing of events. As an example, the tem-poral joins [Gao et al. 2005] of Magpie [Barham et al. 2004] naturally map to the native StreamIn-sight joins.
5. EXPERIMENTS AND EVALUATIONWe have used Fay to diagnose system behavior on both single machines and on medium-size clus-ters.
The utility of tracing and monitoring platforms has long since been established through bothpublished results as well as through previous anecdotal case studies. In many cases, such as in theDTrace study in Section 9 of [Cantrill 2006], an issue is first raised by some external monitoringtool that can be applied continuously to live production systems (such as an offline log analysis toolor a low-overhead, statistical profiler [Burrows et al. 2000]). After such initial identification by othermeans, dynamic tracing may be used for detailed, manual or semi-automatic behavior analysis. Eventhen, tracing overheads may be too high for production systems, which often forces the issue to bereproduced on non-critical systems before it can be analyzed.
Fay tracing can be efficient enough to overturn the above paradigm and allow continuous dynamictracing of live production systems, both before and during the analysis of any detected issues.
The rest of this section starts off with a Fay case study, presented in the informal, anecdotalstyle of studies in the literature [Cantrill 2006]. Instead of enumerating further tracing applications,we subsequently examine the flexibility of Fay tracing through the implementation of a variety ofdifferent distributed software monitoring strategies. We then present experimental measurementsthat establish the efficiency of the Fay tracing primitives, the scalability of the Fay platform to fully-loaded clusters, and the benefits of FayLINQ query optimizations. We end by describing briefly howsome of the Fay technologies are used for monitoring SQL Server.
5.1. A Fay Performance-diagnosis Case StudyIn some of our earliest Fay tracing experiments, we interactively used the Windows command shell(cmd.exe) while observing a live, real-time chart of machine-wide system-call frequencies much likethat in Figure 8. Surprisingly, we observed very high frequencies for some tasks where we expectedto see few system calls, such as copy * NUL, type large.txt in a minimized window, or
ACM Transactions on Computer Systems, Vol. V, No. N, Article A, Publication date: January YYYY.

Fay: Extensible Distributed Tracing from Kernels to Clusters A:21
dir /S >NUL. We used Fay to investigate, as described below. To ensure reproducibility we usedonly public information available outside Microsoft, such as public symbol files.
Outputting a 16 MB file of ASCII text in a minimized console window, using type, producedaround 3.75 million system calls, and was CPU bound for a significant amount of time. We used aFay query to aggregate by calling process, with Table II showing the dominant four system calls.To see how these three processes interacted, we combined their system calls and arguments into asingle view, using a Fay query for a temporal join (see Section 5.2.4 and [Barham et al. 2004]). Thequery showed a repeated pattern: cmd.exe blocks on a port request to conhost; then, conhost blockson a port request to the CSRSS service, which queries for process information; then, CSRSS blockson a port send to conhost, which unblocks it; finally, conhost makes a request back to cmd.exe,unblocking it. These were clearly Windows Local Procedure Calls (LPC) spanning the three pro-cesses [Russinovich et al. 2009].
Fay tracing showed some LPC rounds to be a result of the well-documented WriteConsolefunction outputting a line (of 80 characters or less) to the console, However, we saw an even greaternumber of LPC rounds caused by a function FileIsConsole. Using Fay to trace function ar-guments, we could establish that, for every single line of output, the command shell would checktwice whether stdout was directed to the console window, or not, at the cost of two LPC roundsand many context switches and system calls. Even more surprisingly, we saw those checks and LPCrounds continue to occur when output was directed to a file—causing nearly a million system callswhen we used type to output our 16 MB text file to the special file NUL, for example.
We also used Fay tracing to investigate other frequent system calls, by collecting and count-ing their distinct arguments, return values, and user-mode stack traces. This data indicated that thecalls to NtQueryInformationProcess in Table II were due to an internal CSRSS function,IsConhost, inspecting an undocumented property (number 49) of the cmd.exe process. The ar-guments and return values strongly indicated that CSRSS was retrieving this property, on everyLPC round, to verify that an intermediary conhost was still hosting the console for an originatingcmd.exe.
The above behavior also occurs for commands run in shell scripts, which often redirect largeamounts of output to files or to NUL. The most frequent system calls simply retrieve informationfrom the kernel, and user-mode processes can typically cache such data or read it via a “shared userdata page” (like the one exposed by the Windows kernel) that gives a read-only, up-to-date view ofdata maintained elsewhere [Russinovich et al. 2009]. Thus, concretely, our Fay case study identifiedpotential reductions in the LPC rounds and context switches required for each line of commandshell output, which could eliminate most of the system calls in Table II. However, command shelloutput is usually not a critical performance issue, and its implementation in Windows appears tunedfor reliability and simplicity; thus, while insightful, our observations are not sufficient to justifyimmediate changes to user-mode or kernel-mode code.
5.2. Reimplementing Tracing StrategiesTo stress the generality of Fay tracing, we reimplemented several existing, custom tracing strategieson top of the Fay tracing platform. This reimplementation was done with minimal effort, by leverag-ing Fay extensions and the high-level queries of FayLINQ. For evaluation we used two DryadLINQclusters: one with 12 machines with dual 2GHz AMD Opteron 246 processors and 8GB of memory,and another with 128 machines with two 2.1GHz quad-core AMD Opteron 2373EE processors and16GB of memory, both running Windows Server 2008 R2 Enterprise. Below we describe our imple-mentations and (in some cases) the results of applying these monitoring strategies to our clusters.
5.2.1. Distributed Performance Counters. A common strategy for distributed monitoring is tocount the events generated across all machines of a cluster. Fay tracing can trivially implementthis strategy by applying the appropriate aggregation operations to any metrics on the trace eventsavailable to probes on a single machine. Unlike traditional performance counters, Fay tracing allowsboth user-controllable and efficient aggregation. For instance, with small changes, the query shown
ACM Transactions on Computer Systems, Vol. V, No. N, Article A, Publication date: January YYYY.

A:22 Ú Erlingsson et al.
on page 2 can provide per-process, per-thread, and per-module statistics on all cluster activity inboth user-mode and the kernel. Such monitoring of memory allocation cannot be achieved withtraditional Windows performance counters, even on a single machine.
5.2.2. Automatic Analysis of Cluster Behavior. Several recent systems have applied automaticmachine-learning techniques to extract useful information from activity signatures collected acrossa cluster [Marian et al. 2011; Woodard and Goldszmidt 2009]. We used FayLINQ to perform ananalysis similar to that of Fmeter [Marian et al. 2011] on our cluster, while it executed an unrelatedmap-reduce workload (N-gram generation).
A single FayLINQ query sufficed to express the entire trace collection, the k-means clustering ofthe collected traces, and the analysis of the traced workload using those machine-learning results.This query collects periodic system-call-frequency histograms for the 402 system calls in the Win-dows kernel, at a granularity of around 1 second. Collecting this information does not measurablyaffect CPU utilization or machine performance, since FayLINQ synthesizes efficient, stateful kernelprobes that maintain counts per system call. The data-analysis part of the FayLINQ query reducedthe dataset dimensionality by applying k-means clustering (with k set to 5) on the histograms, usingpublished distributed machine-learning techniques for DryadLINQ [McSherry et al. 2011]. Then,the FayLINQ query associated the workload activity in each period with the closest of the fivecentroids resulting from the k-means clustering. Finally, the FayLINQ query output results into avisualization tool to produce the chart in Figure 12.
Figure 12 shows activity on all machines, during execution of the map-reduce workload. Allactivity periods are associated with their most similar k-means centroid, each of which has a uniquecolor and a (manually-added) label: io, idle, memory, cpu, or outlier. By comparing against the map-reduce job plan, it can be seen that Figure 12 precisely captures the workload’s different processingstages, as annotated at the bottom of the figure. Here, we compared against ground truth froma known map-reduce job plan. However, in most cases, no such explicit plan exists, and similarFayLINQ analysis could clarify the processing phases of even complex, opaque distributed services.
We can clearly see in the figure the first job stage (N-gram generation) running on 5 machines,and the second stage running on 10 machines. (The last three stages of the reduction are very brief,due to the large data reduction performed by the reducer stage; they are mostly I/O intensive.) Theouliers are characterized by a large spike of invocations of the NtQueryPerformanceCounterand NtYieldExecution system calls, which are not due to our application.
5.2.3. Predicated and Windowed Trace Processing. Some systems implement stateful or non-deterministic tracing primitives that are not so easily expressed as pure, functional LINQ queries.Nonetheless, FayLINQ can utilize Fay’s extensibility to provide such primitives and incorporatetheir results into tracing queries. Concretely, users of FayLINQ can implement any probe extensionby providing an arbitrary C function, or makeing use of our library of such extensions.
Fay extensions can use optimized machine code to evaluate the state of a traced system in anymanner, whether complex or stateful. Thus, Fay can offer a efficient, general form of predicationand speculation, and support tracing that cannot even be expressed in language-restricted platformslike DTrace [Cantrill et al. 2004]. To achieve similar functionality, other tracing platforms requirethe evaluation code to be fully trusted—thereby leaving the traced system fully exposed to anyreliability and security issues in that code.
In particular, we have implemented Fay probe extension functions for Chopstix sketches [Bhatiaet al. 2008], to provide statistical, non-uniform sampling of low- and high-frequency events with lowoverhead. FayLINQ sketching uses a hashtable of counters to ensure that trace events are output inlogarithmic proportion to the total number of occurrences. The sketching library is defined by thefollowing API:
struct State { int eventCount[SKETCHSIZE]; };BOOLEAN sample(struct event, struct State*);
ACM Transactions on Computer Systems, Vol. V, No. N, Article A, Publication date: January YYYY.

Fay: Extensible Distributed Tracing from Kernels to Clusters A:23
10 machines used 5 machines used
map, repartition reduce combine sort merge
time
ma
chin
e
io memory cpu outlier idle
Fig. 12. The result of FayLINQ analysis of cluster behavior while executing a map-reduce job. This 2D plot shows theresults of automatic k-means clustering of system-call histograms collected periodically across all machines. The X axisshows time, machines are on the Y axis, and each period is colored according to its representative k-means centroid.
The sample function returns true for every event that should be propagated further. It usesthe State data structure to maintain the logarithmic counters. Here is an example FayLINQ queryusing sketches to estimate the frequency of synchronization operations:
cluster.Function("NtWaitForSingleObject").Where(ev => ev.time < Now.AddMinutes(5)).Where(e => sample(e, State))
We have also implemented probe extensions for temporal processing on trace event streams,such as windowed (sliding or staggered) computations. For example, our simple MovingAverageextension for computing moving averages is used in the below query, which emits all kernel memoryallocations that are 10 times larger than the current local moving average:
cluster.Function("ExAllocatePoolWithTag").Select(event => event.GetArg(2)) // allocation size.Select(sizeArg => new {
average = MovingAverage(sizeArg, State),size = sizeArg })
.Where(alloc => alloc.size > 10*alloc.average);
5.2.4. Tracking Work Across Distributed Systems. Several distributed monitoring platforms trackall the activity performed for work items, as those items are processed by different parts of the sys-tem [Barham et al. 2004; Sigelman et al. 2010]. Often, such tracking is done via passive, distributedmonitoring, combined with “temporal joins” to infer dynamic dependencies and flow of work items.Fay tracing can easily support such monitoring, by encoding temporal joins as recursive queries thattransitively propagate information, and by iterating to convergence. We have used FayLINQ to trackwork in a distributed system by monitoring and correlating sent and received network packets, toanalyze the traffic matrix of DryadLINQ workloads.
5.2.5. Tracing Third-Party Modules. As described so far, Fay works for functions in modules forwhich debug information (PDB files) is available and which are hotpatch enabled. However, we canalso use Fay to identify and trace interface functions in modules that lack hotpatch support and forwhich we have no information beyond the binary itself.
ACM Transactions on Computer Systems, Vol. V, No. N, Article A, Publication date: January YYYY.

A:24 Ú Erlingsson et al.
We do not attempt to find and understand internal functions of such black box modules, as thiswould require reverse engineering the internal structure of a potentially complex software compo-nent. Instead, we identify and trace the functions the module uses to interact with the rest of thesystem. Such functions need to adhere to known system interfaces.
Such functionality can be useful when trying to determine whether a problem is being caused bya black box module such as a network card driver. Users can profile how much time is spent in blackbox module functions. They can log invocations of the black box module and check for correlationswith failure events. They can also check if the module leaks resources.
Some of the module’s interface functions are typically declared in static import and export tables.These functions are readily identified by parsing the tables. However, many interface functions areexposed by passing function pointer parameters in calls to other interface functions (registrationfunctions). Identifying and tracing such functions requires tracing the registration functions andevaluating their function pointer parameters.
In order to do so, we ensure that Fay is running before the target module is loaded. We usePsSetLoadImageNotifyRoutine to notify Fay when the target module is loaded and readyto run. On systems where such a callback does not exist, it may still be possible to set a trace pointon an appropriate loader function. When Fay receives notification that the target module is loaded,it places trace points on the module’s initialization function (DriverEntry for Windows drivers) andon all registration functions in the module’s import list. Each of the system’s registration functionsis traced with a separate probe function that is aware of the semantics of the registration function.The probe function identifies the relevant function pointer parameters of the registration functionand replaces them with pointers to Fay wrapper functions, which invoke entry and exit probes inaddition to calling the interface function. We implemented this mechanism entirely as a collectionof Fay probes without requiring modifications to the core system.
We have prototyped this mechanism for various Windows driver models, including NDIS networkcard drivers and file system filter drivers and used Fay to answer questions such as: “How manynetwork packets has the network card forwarded to Windows?”, “How many CPU cycles are spentin the anti-virus file system filter driver on each file system access?”, and “How much CPU time isspent inside a particular driver?” Beyond Windows drivers, we have also applied this mechanism toWin32 applications.
5.2.6. Tracing Across Software Abstractions. We have used Fay to explore the timer interfaces inWindows and their use by applications. In a previous study of Windows timers [Peter et al. 2008],traces were obtained by adding instrumentation directly into the source code. This approach can bevery time consuming and error prone. It requires searching for the right tracepoints in a large andcomplex code base, resolving potential header file and linker conflicts, compiling and deploying akernel and correcting bugs that might have been introduced by the instrumentation code. All thismay have to be done repeatedly and for a number of trace points. Comparable Fay scripts can oftenbe written in a matter of minutes.
Starting with the low-level, kernel timer interfaces KeSetTimer, KeSetTimerEx, andKeCancelTimer, we used FayLINQ to trace timer usage. For each use, we grouped by returnaddresses on the call stack and sorted to identify common callers, thereby identifying the smallnumber of modules and functions that are the primary users of KeSetTimer, etc. We then iter-ated, by creating a larger, recursive FayLINQ query, predicated to generate trace events only in cer-tain contexts, and discovered 13 sets of timer interfaces in Windows, such as ZwUserSetTimer.Close, manual inspection revealed that those interfaces were based on five separate timer wheelimplementations [Varghese and Lauck 1997].
Each time, the modifications to the Fay script were trivial: We simply added the newly discoveredtimer interface functions to the list of functions we wanted to trace. Achieving the same result bymodifying the source code would have required significantly more time.
ACM Transactions on Computer Systems, Vol. V, No. N, Article A, Publication date: January YYYY.

Fay: Extensible Distributed Tracing from Kernels to Clusters A:25
Table III. Overhead in CPU cycles per call to a tracedfunction. Here, km is kernel mode, um is user mode,and deep builds a 20-deep stack before each call. Faydispatches using inline call or jmp instructions; otherplatforms trap to the kernel.
Solaris OS X FedoraExperiment Fay DTrace DTrace STapkm 220 1717 1805 1129um call 197 1557 2565 9009um jmp 155um call deep 431 1683 2813 9384um jmp deep 268
Table IV. Slowdown due to XFI for three benchmarks. When comparedwith the original version of XFI from [Erlingsson et al. 2006a], the Fayimlpementation is much simpler, at the expense of larger overheads.
MD5 lld hotlistMeasured Fay XFI slowdown 184% 552% 1387%XFI slowdown from [Erlingsson et al. 2006a] 101% 346% 798%
5.3. Performance EvaluationTo assess the efficiency and scalability of our Fay implementation, we measured the performance ofFay tracing and its mechanisms for instrumentation, inline dispatching, and safe probe execution.The experiments ran on an iMac with a 3.06GHz Intel E7600 CPU and 8GB of RAM. We configuredthis machine to run 64-bit versions of Windows 7 Enterprise, Mac OS X v10.6, Fedora 15 Linux(kernel version 2.6.40-4.fc15), and Oracle Solaris 11 Express, in order to directly compare Faytracing against DTrace, on two platforms, and against SystemTap (version 1.5/0.152) on Linux.
5.3.1. Microbenchmarks. To measure the cost of dispatching and executing an empty probe, wecreated a user-mode microbenchmark that contains an empty function foo, which it calls in a tightloop. We measured its running time both with, and without, Fay tracing of foo using an emptyprobe. We also created a microbenchmark that invokes a trivial system call in a tight loop, andwhere we traced the kernel-mode system call handler. (We used the getpid system call, except onWindows where we used NtQuerySystemInformationwith an invalid parameter to minimizethe work it performed.)
We also wanted to measure the effects of branch-misprediction caused by the stack manipulationof the Fay call dispatcher (see Section 3.2). Therefore, we created variants of the microbench-marks that call foo via a sequence of 20 nested functions—forcing 20 extra stack frames to beunwound at each foo tracepoint.
Table III shows the results of our microbenchmarks, with time measurements converted to CPUcycle counts. Fay takes around 200 cycles per call and, as expected, dispatching using jmp is no-ticeably faster than Fay call dispatcher. If a thread is not being traced, this work can be cut inhalf, and the Fay call dispatcher adds only about 107 cycles per call. In both of these cases,the hashtable lookup of tracepoint descriptors accounts for roughly 40 cycles. The experimentsfor DTrace and SystemTap were run using function boundary tracing and per-CPU collection andaggregation. Compared to Fay, the other tracing platforms generally required a bit less than anorder-of-magnitude more cycles.
Next, we compare the execution time of three benchmark probes with and without XFI rewriting,summarizing the results in Table IV. This experiment replicates parts of Table 1 in [Erlingsson et al.2006a] (slowpath with read and write protection). Our overhead is larger than that in [Erlingssonet al. 2006a], which is not surprising, since we targeted simplicity in our implementation. How-ever, Fay XFI performance still compares favorably to that of safe interpreters like those used inDTrace [Romer et al. 1996].
ACM Transactions on Computer Systems, Vol. V, No. N, Article A, Publication date: January YYYY.

A:26 Ú Erlingsson et al.
Table V. Instrumenting all kernel functions to test scala-bility.
Solaris OS XFay DTrace DTrace
Traced functions 8001 31998 9341Function calls (millions) 60 253 306Running time w/tracing 28.0 103.2 149.6Slowdown 2.8x 17.2x 26.7x
5.3.2. Scalability and Impact of Optimizations. We have used Fay to trace all the 8,001 hotpatch-able functions in the Windows kernel and increment a per-CPU counter at each tracepoint, to countthe total kernel function invocations. Such tracing does not occur often, but can be useful. An ex-ample application, that has seen practical use in other tracing platforms, is the tracing of all kernelactivity due to a specific kernel module, such as a network driver, or a specific interrupt handler [Ei-gler 2010], and the generation of function call graphs for later visualization [Eclipse ].
Table V displays the results of tracing a workload that copied all the RFC text files betweenramdisk directories, deleted the new copies, and repeated this a fixed number of times. Fay scalesvery well, and using it to trace the vast majority of Windows kernel functions leaves the machineperfectly responsive and about 2.8 times slower on a benchmark that spends 75% of its time ex-ecuting kernel code. Notably, the scale of this experiment creates a worst-case scenario for Fayperformance: the Fay call dispatcher adds an extra stack frame on every kernel function invoca-tion, and suffers a branch-prediction miss on every function return.
The slowdown factors for DTrace are significantly higher, on both Solaris and Mac OS X. How-ever, slowdown factors are not directly comparable, since Fay and DTrace are instrumenting differ-ent operating systems. Trying to repeat the experiment with SystemTap resulted in a hung Linuxkernel, apparently due to a long-standing, well-known SystemTap bug [SystemTap 2006].
We tested the scalability, robustness, and optimizations of Fay tracing by utilizing our 128-machine, 1024-core cluster for a benchmark that makes 50 million memory allocations per machine.In the benchmark, each thread allocates and clears 10 heap-memory regions, of a random size be-tween 1 byte and 16 kilobytes, yields with a Sleep(0), clears and frees the 10 regions, and thenloops. We measured all configurations of partitioning per-machine work over 1, 2, 5, or 10 processesand 1, 5, 10, 50, 100, 500, or 1000 concurrent threads in each process. These configurations ran onthe entire, dedicated cluster, spreading 6.4 billion allocations between 128 to 1,280,000 threads,each at 100% CPU utilization when running. The benchmark took between 30 seconds and 4 min-utes to run, depending on the configuration—not counting unpredictable delays and high variancecaused by the cluster’s job scheduler.
Using a FayLINQ query to measure total allocated memory added an overhead of 1% to 11%(mean 7.8%, std.dev. 3.8%) to the benchmark running time. The numbers matched our expectation:per allocation, the benchmark spent approximately a couple of thousand cycles, to which Fay tracingadded a couple of hundred cycles, as per Figure III—but, as the number of processes and threadsgrew, increased context switches and other costs started masking some of Fay’s overhead. The timeto initialize tracing, and install Fay probes, grew as processes increased from 1 to 10, going from 1.5to 7 seconds. Whether or not Fay tracing was enabled, the benchmark had similar variance in CPUtime (mean std.dev. 2%, max std.dev. 6%) and wall-clock time (mean std.dev. 10%, max std.dev.33%), both per-process and per-thread.
We exercised the fault-tolerance of Fay tracing by randomly killing threads, processes, or ma-chines running the benchmark. When a thread dies, all its thread-local Fay probe state is lost, if ithas not already been sent as a trace event. Machine-local Fay aggregation continued unimpeded byfailure of benchmark threads or processes. Thus, the results of our FayLINQ query were perturbedin proportion to our violence. In addition, the data lost for any thread could be bounded by hav-ing Fay probes periodically send off their data as ETW trace events. For our benchmark FayLINQ
ACM Transactions on Computer Systems, Vol. V, No. N, Article A, Publication date: January YYYY.

Fay: Extensible Distributed Tracing from Kernels to Clusters A:27
query, probe state was sent as trace events every 100 memory allocations, at the cost of 1% extraFay tracing overhead.
In the limit, a trace event might need to be sent at every tracepoint invocation, if the work of atracing query was completely unsuited to Fay probe processing. To assess the benefits of early aggre-gation and FayLINQ optimizations, we modified our benchmark to measure such high-frequencytrace events. With nearly half-a-million Fay trace events a second, and no probe processing, thebenchmark’s tracing overhead increased to between 5% and 163% (average 67%, std.dev. 45%).However, most of those trace events were lost, and not accounted for in the result of our FayLINQquery.
These lost trace events were surprising, since our Fay implementation minimizes the risk of dataloss, both by dynamically tuning ETW buffer size, and also by running time-critical Fay activitylike trace-event processing on Windows threads with high enough priority. Upon inspection, wediscovered that the real-time, machine-local FayLINQ aggregation process that converts ETW traceevents to .Net objects—rather slowly, on a single thread—was completely unable to handle the highevent rate. FayLINQ can be manually directed to stream trace events directly to disk, into ETW logfiles, processed by later, batch-processing parts of the query plan. We attempted this next, but failedagain: each ETW log file record is about 100 bytes, which at 50 million events, in less than fourminutes, exceeded our disk bandwidth. Even though consuming data at high rates is intrinsicallydifficult, these results clearly indicated that FayLINQ was lacking in its support for high-event-ratetracing. So, we enhanced Fay with a custom, real-time ETW consumer thread that efficiently streamsjust the Fay payload of ETW events (4 bytes in our benchmark) directly to disk. After this, FayLINQcould return correct query results, by generating a plan that processes the disk files subsequent tothe benchmark run.
To further evaluate the benefits of FayLINQ query-plan optimizations, we reran the experimentfrom Section 5.2.2 with the term-rewriting in Figure 10 turned off. While Fay tracing previouslyhad no measurable performance effects, unoptimized tracing significantly increased the workloadcompletion time, e.g., due to the addition of (a near-constant) 10% of CPU time being spent onkernel-mode trace event processing. Also, the lack of early-aggregation optimizations lead to ahigh event rate (more than 100,000 events/second, for some phases of the workload). In this caseseveral times more data was received and processed at the higher-levels of the FayLINQ aggregationpipeline.
5.4. XE Dynamic tracing in Microsoft SQL ServerSQL Server comes with a built-in tracing infrastructure called extended events (XE)[Microsoft Corp.2011b]. XE offer a static list of tracepoints and an API allowing users to dynamically turn on andoff instrumentation at any tracepoint from the static list.
For example, while troubleshooting performance in one installation, inspection of the SQL Serverlogs showed numerous error messages about an attempt to acquire a latch that had timed out andfailed. Latches are low-level synchronization primitives used in SQL Server to protect certain in-memory structures such as data pages [Microsoft Corp. 2011a]. The information in the error logsindicated that a thread had timed out trying to acquire an exclusive buffer latch because anotherthread was holding a shared latch for a long time. This was a recurring problem, and identifying thethread that was holding the shared latch was the logical next step.
The standard procedure for diagnosing such problems with SQL Server locks is to use XE to tracethe functions that acquire and release locks [Microsoft Corp. ]. The trace can then be processed todetermine which thread was holding a particular lock at a particular time. However, the functionsfor acquiring and releasing latches lack the necessary static instrumentation.
The SQL Server group at Microsoft has extended the capabilities of XE into a dynamic instru-mentation system based on Fay, called XE Dynamic. XE Dynamic can be used on any process andcan trace any hot patchable native user mode function in any module in the process. The list oftracepoints is obtained by enumerating all the instrumentable functions from the PDB files. Using
ACM Transactions on Computer Systems, Vol. V, No. N, Article A, Publication date: January YYYY.

A:28 Ú Erlingsson et al.
XE Dynamic one could finally instrument functions which hold latches. The resulting logs readilyidentified the thread that was holding the latch.
Although we had tested the scaling of Fay on computer clusters, earlier versions of Fay didnot scale properly when used on a single large machine, with 128 cores; with SQL Server Fayreduced the transaction throughput by up to 70%. However reimplementing the locking strategiesused internally by Fay eliminated most of these problems.
Fay and XE Dynamic have helped in diagnosing a range of problems of this general type. Theinvestigation typically starts with the observation that a resource or system object (latch, lock, priv-ilege, TCP port, UDP packet) is not available. The next step is to identify the cause by monitoringfunctions that manipulate the resource or object. Often, static instrumentation is not available or notsufficient, and Fay can easily gather the required information.
XE Dynamic is being used internally in development for bug and performance investigations. Itis used in testing to implement validation and notification functionality without requiring changesto the production source code. XE Dynamic is also the basis for a profiler that is used to track per-formance regressions between builds. The profiler uses Fay probes to query hardware performancecounters and record detailed information about each function such as cache misses, instructions re-tired and CPU cycles spent executing the function. Another important application of XE Dynamicis in the investigation of customer support cases.
6. RELATED WORKFay is motivated by the many attractive benefits of the DTrace platform [Cantrill et al. 2004], whileFay’s fundamental primitives are more like those of SystemTap [Prasad et al. 2005] and Ftrace [Ros-tedt 2009].
Fay makes use of, and integrates with a number of technologies from Microsoft Windows [Russi-novich et al. 2009], including Event Tracing for Windows [Park and Buch 2007], Power-Shell [Stanek 2009], Vulcan [Srivastava et al. 2001], Hotpatching [Microsoft Corp. 2003], Struc-tured Exception Handling [Pietrek 1997], and the Driver Model [Oney 2002].Dynamic Instrumentation Systems Fay is related to several systems that perform dynamic in-strumentation: KLogger [Etsion et al. 2007], PinOS [Bungale and Luk 2007], Valgrind [Nethercoteand Seward 2007], scalable tracing on K42 [Wisniewski and Rosenburg 2003], Ftrace and System-Tap on Linux [Prasad et al. 2005; Rostedt 2009], Solaris DTrace [Cantrill et al. 2004], the NTraceprototype [Passing et al. 2009], and Detours for the Win32 interface [Hunt and Brubacher 1998].
The Fay probe dispatcher is related to new tracing tools that make use of inline mechanisms,not traps. On Linux, Ftrace [Rostedt 2009] provides tracing based on fast, inline hooks placedby compiling the kernel with special flags. On Windows, the NTrace research project leverageshotpatching [Passing et al. 2009], but does so via a custom, modified kernel. Compared to Fay, theFtrace and NTrace mechanisms offer more limited functionality, are likely to be less efficient, andprovide neither safe extensibility nor a high-level query interface.Safe Operating Systems Extensions Fay is an example of a system that implements safe operatingsystems extensions using software-based techniques [Bershad et al. 1995]. This is not a new idea.Indeed, Fay has striking similarities to the SDS-940 Informer profiler developed at the end of the1960’s [Deutsch and Grant 1971]. Other systems and techniques for providing safe system exten-sibility include Typed Assembly Language [Morrisett et al. 1998], Proof-Carrying Code [Necula1997], as well as Software-based Fault Isolation (SFI) [Wahbe et al. 1993], and its implementationsin MiSFIT [Small and Seltzer 1998], Native Client [Yee et al. 2010], and similar systems [Erlingssonet al. 2006a].Declarative Tracing and Debugging The Fay integration with DryadLINQ is related to severalprior efforts to support declarative or relational queries of software execution traces. In partic-ular, Fay is related to declarative tracepoints [Cao et al. 2008], PQL [Martin et al. 2005], andPTQL [Goldsmith et al. 2005], and also to work in aspect-oriented programming [Avgustinov et al.2006].
ACM Transactions on Computer Systems, Vol. V, No. N, Article A, Publication date: January YYYY.

Fay: Extensible Distributed Tracing from Kernels to Clusters A:29
In the trade-off between creating a domain-specific language and using a generic language, suchas LINQ, we have opted towards the latter. Embedded knowledge about the semantics of traces(e.g., time, procedure nesting, etc.) can make the evaluation of some queries more efficient. Probesshould be be able to aggregate and reduce data as much as possible, while relegating expensivecomputations to external systems. Here, we believe that FayLINQ strikes a good balance.Large-scale, Distributed Tracing Large-scale, distributed tracing, data collection and debug-ging [Liblit et al. 2003; Sookoor et al. 2009] is a highly active area, with several existing, attractivesystems, and one deployed across a billion machines [Glerum et al. 2009]. Of particular relevanceare recent systems, like Chopstix [Bhatia et al. 2008], and Flight data recorder [Verbowski et al.2006], as well as their predecessor DCPI [Burrows et al. 2000] and its recent distributed analogueGWP [Ren et al. 2010]. Similarly, earlier work such as Magpie [Barham et al. 2004] on tracingrequests across activities has recently been extended to the datacenter [Sigelman et al. 2010]. Fi-nally, also highly relevant is work from the high-performance community for tracing in parallel sys-tems [Lee et al. 2007; Massie et al. 2003], and the techniques of stream-processing platforms [Bal-azinska et al. 2005]. Flume [flume ] is a log collection system that allows the transformation andfiltering of log data, similar in some aspects to simple FayLINQ queries.
7. CONCLUSIONSFay is a flexible platform for the dynamic tracing of distributed systems. Fay is applicable to bothuser- and kernel-mode activity; our Fay implementation for x86-64 Windows can be applied evento live, unmodified production systems. Users can utilize Fay tracing through several means, whichinclude traditional scripting. Fay users can also safely extend Fay with new, efficient tracing primi-tives, without affecting the reliability of traced systems.
Distinguishing Fay from previous tracing platforms is its disaggregated execution, even within asingle machine, as well as its safe, efficient extensibility, and its deep integration with a high-levellanguage and distributed runtime in FayLINQ—all of which facilitate large-scale execution tracecollection and analysis.
Building on the above, FayLINQ provides a unified, declarative means of specifying what eventsto trace, as well as the aggregation, processing, and analysis of those events. As such, FayLINQholds the potential to greatly simplify the investigation of performance, functionality, or reliabilityissues in distributed systems. Through benchmarks and experiments, we have demonstrated theefficiency and flexibility of Fay distributed tracing, and also shown how a few simple FayLINQqueries can offer the same functionality as that provided by custom mechanisms in other tracingplatforms.
AcknowledgmentsFay’s hotpatch-based instrumentation was designed and implementated in collaboration with Mi-crosoft Windows Fundamentals: Anshul Dhir, Haifeng He, Bradford Neuman, and Dragos Sâm-botin contributed directly to the implementation, starting from a prototype by Neeraj Singh. TheDryadLINQ integration benefited from work by Pradeep Kumar Gunda. Jon Currey helped withcluster-experiment infrastructure. We used a SystemTap version provided by William Cohen, ofRed Hat Inc.
REFERENCESANSEL, J., MARCHENKO, P., ERLINGSSON, Ú., TAYLOR, E., CHEN, B., SCHUFF, D. L., SEHR, D., BIFFLE, C. L., AND
YEE, B. 2011. Language-independent sandboxing of just-in-time compilation and self-modifying code. In PLDI.APACHE. Hadoop project. http://hadoop.apache.org/.AVGUSTINOV, P., TIBBLE, J., BODDEN, E., HENDREN, L., LHOTAK, O., DE MOOR, O., ONGKINGCO, N., AND SITTAM-
PALAM, G. 2006. Efficient trace monitoring. In OOPSLA.BALAZINSKA, M., BALAKRISHNAN, H., MADDEN, S., AND STONEBRAKER, M. 2005. Fault-tolerance in the Borealis
distributed stream processing system. In SIGMOD.
ACM Transactions on Computer Systems, Vol. V, No. N, Article A, Publication date: January YYYY.

A:30 Ú Erlingsson et al.
BARHAM, P., DONNELLY, A., ISAACS, R., AND MORTIER, R. 2004. Using Magpie for request extraction and workloadmodelling. In OSDI.
BERSHAD, B. N., SAVAGE, S., PARDYAK, P., BECKER, D., FIUCZYNSKI, M., AND SIRER, E. G. 1995. Protection is asoftware issue. In HotOS.
BHATIA, S., KUMAR, A., FIUCZYNSKI, M. E., AND PETERSON, L. 2008. Lightweight, high-resolution monitoring fortroubleshooting production systems. In OSDI.
BUNGALE, P. P. AND LUK, C.-K. 2007. PinOS: A programmable framework for whole-system dynamic instrumentation.In VEE.
BURROWS, M., ERLINGSSON, Ú., LEUNG, S.-T. A., VANDEVOORDE, M. T., WALDSPURGER, C. A., WALKER, K., ANDWEIHL, W. E. 2000. Efficient and flexible value sampling. In ASPLOS.
CANTRILL, B. 2006. Hidden in plain sight. ACM Queue 4.CANTRILL, B. M., SHAPIRO, M. W., AND LEVENTHAL, A. H. 2004. Dynamic instrumentation of production systems. In
USENIX Annual Technical Conf.CAO, Q., ABDELZAHER, T., STANKOVIC, J., WHITEHOUSE, K., AND LUO, L. 2008. Declarative tracepoints: A pro-
grammable and application independent debugging system for wireless sensor networks. In SenSys.CHAMBERS, C., RANIWALA, A., PERRY, F., ADAMS, S., HENRY, R. R., BRADSHAW, R., AND WEIZENBAUM, N. 2010.
FlumeJava: Easy, efficient data-parallel pipelines. In PLDI.DEAN, J. AND GHEMAWAT, S. 2010. MapReduce: A flexible data processing tool. Comm. ACM 53, 1.DEUTSCH, P. AND GRANT, C. A. 1971. A flexible measurement tool for software systems. In IFIP.ECLIPSE. Callgraph plug-in. http://wiki.eclipse.org/Linux_Tools_Project/Callgraph/User_
Guide.EIGLER, F. C. 2010. Systemtap tutorial. http://sourceware.org/systemtap/tutorial/.ERLINGSSON, Ú., ABADI, M., VRABLE, M., BUDIU, M., AND NECULA, G. C. 2006a. XFI: Software guards for system
address spaces. In OSDI.ERLINGSSON, Ú., MANASSE, M., AND MCSHERRY, F. 2006b. A cool and practical alternative to traditional hash tables.
In Workshop on Distributed Data and Structures.ETSION, Y., TSAFRIR, D., KIRKPATRICK, S., AND FEITELSON, D. G. 2007. Fine grained kernel logging with KLogger:
Experience and insights. In EuroSys.flume. Flume: Open source log collection system. http://github.com/cloudera/flume.GAO, D., JENSEN, S., SNODGRASS, R. T., AND SOO, M. D. 2005. Join operations in temporal databases. International
Journal on Very Large Databases (VLDB Journal) 14, 2.GLERUM, K., KINSHUMANN, K., GREENBERG, S., AUL, G., ORGOVAN, V., NICHOLS, G., GRANT, D., LOIHLE, G.,
AND HUNT, G. 2009. Debugging in the (very) large: Ten years of implementation and experience. In SOSP.GOLDSMITH, S. F., O’CALLAHAN, R., AND AIKEN, A. 2005. Relational queries over program traces. In OOPSLA.GUPTA, A., MUMICK, I. S., AND SUBRAHMANIAN, V. S. 1993. Maintaining views incrementally. In ACM Intl. Conf. on
Management of Data.HUNT, G. AND BRUBACHER, D. 1998. Detours: Binary interception of Win32 functions. In USENIX Windows NT Sympo-
sium.ISARD, M., BUDIU, M., YU, Y., BIRRELL, A., AND FETTERLY, D. 2007. Dryad: Distributed data-parallel programs from
sequential building blocks. In EuroSys.LEE, G. L., SCHULZ, M., AHN, D. H., BERNAT, A., DE SUPINSKIL, B. R., KO, S. Y., AND ROUNTREE, B. 2007. Dynamic
binary instrumentation and data aggregation on large scale systems. Intl. Journal on Parallel Programming 35, 3.LIBLIT, B., AIKEN, A., ZHENG, A. X., AND JORDAN, M. I. 2003. Bug isolation via remote program sampling. PLDI 38, 5.MARGUERIE, F., EICHERT, S., AND WOOLEY, J. 2008. LINQ in action. Manning Publications Co.MARIAN, T., SAGAR, A., CHEN, T., AND WEATHERSPOON, H. 2011. Fmeter: Extracting Indexable Low-level System
Signatures by Counting Kernel Function Calls. Tech. Rep. http://hdl.handle.net/1813/23568, CornellUniversity, Computing and Information Science.
MARTIN, M., LIVSHITS, B., AND LAM, M. S. 2005. Finding application errors and security flaws using PQL: A programquery language. In OOPSLA.
MASSIE, M. L., CHUN, B. N., AND CULLER, D. E. 2003. The Ganglia distributed monitoring system: Design, implemen-tation and experience. Intl. Journal on Parallel Computing 30.
MCSHERRY, F., YU, Y., BUDIU, M., ISARD, M., AND FETTERLY, D. 2011. Scaling Up Machine Learning. Cambridge U.Press.
MICROSOFT CORP. Determine which queries are holding locks. MSDN. http://msdn.microsoft.com/en-us/library/bb677357.aspx.
MICROSOFT CORP. 2003. Introduction to hotpatching. Microsoft TechNet.
ACM Transactions on Computer Systems, Vol. V, No. N, Article A, Publication date: January YYYY.

Fay: Extensible Distributed Tracing from Kernels to Clusters A:31
MICROSOFT CORP. 2006. Kernel patch protection: Frequently asked questions. Windows Hardware Developer Central.http://www.microsoft.com/whdc/driver/kernel/64bitpatch_FAQ.mspx.
MICROSOFT CORP. 2010. WDK and developer tools. Windows Hardware Developer Central. http://www.microsoft.com/whdc/DevTools/default.mspx.
MICROSOFT CORP. 2011a. Diagnosing and resolving latch contention on SQL Server. Microsoft Download Center. http://www.microsoft.com/en-us/download/details.aspx?displaylang=en&id=26665.
MICROSOFT CORP. 2011b. Introducing SQL Server extended events. MSDN. http://msdn.microsoft.com/en-us/library/bb630354.aspx.
MICROSOFT CORP. 2011c. Use the Microsoft Symbol Server to obtain debug symbol files. http://support.microsoft.com/kb/311503.
MICROSOFT CORP. 2012. Microsoft StreamInsight. MSDN. http://msdn.microsoft.com/en-us/library/ee362541.aspx.
MORRISETT, G., WALKER, D., CRARY, K., AND GLEW, N. 1998. From System F to typed assembly language. In POPL.NECULA, G. C. 1997. Proof-carrying code. In POPL.NETHERCOTE, N. AND SEWARD, J. 2007. Valgrind: A framework for heavyweight dynamic binary instrumentation. In
PLDI.ONEY, W. 2002. Programming the Microsoft Windows Driver Model. Microsoft Press.PARK, I. AND BUCH, R. 2007. Improve debugging and performance tuning with ETW. MSDN Magazine.PASSING, J., SCHMIDT, A., VON LOWIS, M., AND POLZE, A. 2009. NTrace: Function boundary tracing for Windows on
IA-32. In Working Conference on Reverse Engineering.PETER, S., BAUMANN, A., ROSCOE, T., BARHAM, P., AND ISAACS, R. 2008. 30 seconds is not enough!: A study of
operating system timer usage. In EuroSys.PIETREK, M. 1997. A crash course on the depths of Win32 structured exception handling. Microsoft Systems Journal.PRASAD, V., COHEN, W., EIGLER, F. C., HUNT, M., KENISTON, J., AND CHEN, B. 2005. Locating system problems
using dynamic instrumentation. In Ottawa Linux Symposium.REN, G., TUNE, E., MOSELEY, T., SHI, Y., RUS, S., AND HUNDT, R. 2010. Google-wide profiling: A continuous profiling
infrastructure for data centers. IEEE Micro 30, 4.ROMER, T. H., LEE, D., VOELKER, G. M., WOLMAN, A., WONG, W. A., BAER, J.-L., BERSHAD, B. N., AND LEVY,
H. M. 1996. The structure and performance of interpreters. In ASPLOS.ROSTEDT, S. 2009. Debugging the kernel using Ftrace. lwn.net.RUSSINOVICH, M. E., SOLOMON, D. A., AND IONESCU, A. 2009. Microsoft Windows Internals. Microsoft Press.SIGELMAN, B. H., BARROSO, L. A., BURROWS, M., STEPHENSON, P., PLAKAL, M., BEAVER, D., JASPAN, S., AND
SHANBHAG, C. 2010. Dapper, a large-scale distributed systems tracing infrastructure. Tech. Rep. 2010-1, Google Inc.SKADRON, K., AHUJA, P. S., MARTONOSI, M., AND CLARK, D. W. 1998. Improving prediction for procedure returns
with return-address-stack repair mechanisms. In MICRO.SMALL, C. AND SELTZER, M. I. 1998. MiSFIT: Constructing safe extensible systems. IEEE Concurrency: Parallel, Dis-
tributed and Mobile Computing 6, 3.SOOKOOR, T., HNAT, T., HOOIMEIJER, P., WEIMER, W., AND WHITEHOUSE, K. 2009. Macrodebugging: Global views
of distributed program execution. In SenSys.SRIVASTAVA, A., EDWARDS, A., AND VO, H. 2001. Vulcan: Binary transformation in a distributed environment. Tech.
Rep. MSR-TR-2001-50, Microsoft Research.STANEK, W. 2009. Windows PowerShell(TM) 2.0 Administrator’s Pocket Consultant. Microsoft Press.STROSAKER, M. Sample real-world use of systemtap. http://zombieprocess.wordpress.com/2008/01/03/
sample-real-world-use-of-systemtap/.SYSTEMTAP. Examples. http://sourceware.org/systemtap/examples/.SYSTEMTAP. 2006. Bug 2725: function(“*”) probes sometimes crash & burn. http://sources.redhat.com/
bugzilla/show_bug.cgi?id=2725.VARGHESE, G. AND LAUCK, A. 1997. Hashed and hierarchical timing wheels. IEEE/ACM Transactions on Networking 5, 6.VERBOWSKI, C., KICIMAN, E., KUMAR, A., DANIELS, B., LU, S., LEE, J., WANG, Y.-M., AND ROUSSEV, R. 2006.
Flight data recorder: Monitoring persistent-state interactions to improve systems management. In OSDI.WAHBE, R., LUCCO, S., ANDERSON, T. E., AND GRAHAM, S. L. 1993. Efficient software-based fault isolation. In SOSP.WISNIEWSKI, R. W. AND ROSENBURG, B. 2003. Efficient, unified, and scalable performance monitoring for multiproces-
sor operating systems. In Supercomputing.WOODARD, D. B. AND GOLDSZMIDT, M. 2009. Model-based clustering for online crisis identification in distributed com-
puting. Tech. Rep. TR-2009-131, MSR.
ACM Transactions on Computer Systems, Vol. V, No. N, Article A, Publication date: January YYYY.

A:32 Ú Erlingsson et al.
YEE, B., SEHR, D., DARDYK, G., CHEN, J. B., MUTH, R., ORMANDY, T., OKASAKA, S., NARULA, N., AND FULLAGAR,N. 2010. Native client: A sandbox for portable, untrusted x86 native code. Comm. ACM 53, 1, 91–99.
YU, Y., GUNDA, P. K., AND ISARD, M. 2009. Distributed aggregation for data-parallel computing: Interfaces and imple-mentations. In SOSP.
YU, Y., ISARD, M., FETTERLY, D., BUDIU, M., ERLINGSSON, Ú., KUMAR, P. G., AND CURREY, J. 2008. DryadLINQ:A system for general-purpose distributed data-parallel computing using a high-level language. In OSDI.
Received ; revised ; accepted
ACM Transactions on Computer Systems, Vol. V, No. N, Article A, Publication date: January YYYY.