a feasibilty study of new type seismic isolation - composed system of piles covered by pipes
TRANSCRIPT

13th World Conference on Earthquake Engineering Vancouver, B.C., Canada
August 1-6, 2004 Paper No. 2204
A FEASIBILTY STUDY OF NEW TYPE SEISMIC ISOLATION - COMPOSED SYSTEM OF PILES COVERED BY PIPES AND
DAMPERS WITH PARTIAL SOIL IMPROVEMENT -
Shinji ISHIMARU 1, Ippei HATA2, Yukio SHIMOMURA3 Yoshio IKEDA4, Hidenori ISHIGAKI5, Yoshiya OGUSHI6
SUMMARY The author's group has undertaken a study on the feasibility of the seismic base-isolation system constructed on a soft ground site. To verify the applicability of building structures with the seismic-isolation system, we made an experimental model, which is composed of double steel pipe piles, a partial ground improvement body and dampers. Based on the knowledge obtained from the excitation experiment of the model of the seismic base-isolation system, we contrived a mock-up experimental device. In this paper, we first introduce the outline of the system and the excitation experiment, and then display its simulation analysis. Furthermore, a comparison of the earthquake observation continuously executed and its simulation analysis is presented.
INTRODUCTION As a solution to the earth’s environmental problems, spread of the seismic isolation structures plays an important role to realize long-lived structures in the countries in which earthquake activity is very high. However, isolation structures can withstand disasters only when they are constructed in fine soil condition sites. Unfortunately, most of the large cities in Japan are located on weak ground area. Therefore, if a structure with the conventional type isolation device is planned, both construction costs of the pile foundation and isolation devices have to be taken into account. From the above viewpoint, the author's group has undertaken a study on the feasibility of the seismic base-isolation system constructed on soft ground site as shown in Fig.1. To verify the applicability of structures with the seismic-isolation system, we made an experimental model, which is composed of double steel pipe piles, a partial ground improvement body and dampers. The double steel pipe pile is composed of a core pile and an outer pipe that covers the upper part of the core pile to enhance the deformability of the core pile head. From the
1 Professor, Dept. of Architecture, College of Science and Technology, Nihon Univ., Japan. 2 Assistant Engineer, College of Science & Technology, Nihon Univ., Japan. 3 Professor, Dept. of Construction, Junior College of Nihon University, Japan. 4 Senior Engineer, Nuclear Facilities Department, Taisei Corporation, Japan 5 Research Associate, Dept. of Architecture, College of Science and Technology, Nihon Univ., Japan. 6 Graduate Student, College of Science and Technology, Nihon Univ., Japan.

results of forced vibration tests and its simulation analysis for the prototype, the effectiveness of the isolation system is confirmed. Based on the knowledge obtained from the excitation experiment of the model of the seismic base-isolation system, we contrived a mock-up experimental device. In this paper, we first introduce the outline of the system and the excitation experiment, and then display its simulation analysis. Furthermore, a comparison of the earthquake observation continuously executed and its simulation analysis is presented.
Super-Structure
Soft Ground
Pile Soil Improvement
Elasto-Plastic Damper
Viscous Damper
Bearing Stratum
Super-Structure
Fig. 1 Concept illustration of the proposed base-isolation system
OUTLINE OF PERFORMANCE TESTING BY SMALL SIZED SPECIMEN Before the trial production of a base-isolation system, the outline of a test [1, 2] by small-sized specimens conducted by the study committee of Seismic Isolation by Use of a Soil-Pile-Structure System led by the authors’ group is explained. The test by small-sized basic model was conducted to understand the basic nature of a new type base-isolation system, which is the effectiveness of a double steel pipe pile composed of a core pile and its outer pipe that covers the upper part of the core pile and the effectiveness of the damping device. Fig. 2 shows the base-isolation foundation and conventional foundation of 1.8m (width) x 1.8m (depth) x 2.0m in height and 152kN in weight for each one. Each of them is supported by 4 steel pipe piles (pile diameter Φ=114.3mm, pile length L=6.2m, geometrical moment of inertia I=3.0xl06mm4) on G.L.-6.2m as the bearing stratum. The steel pipe piles supporting the base-isolation foundation are double structured from G.L.-0m to G.L.-2m in depth. As the soil does not restrict the deformation of the pile in this interval, the piles work as long columns. As a result, horizontal stiffness of the piles becomes lower, and it can work as an isolator like laminated rubber bearing. Furthermore, in the lower part of the base-isolation foundation, soil improvement columns that mount shear keys to convey the reaction force of the damper to soil are installed. The soil improvement columns are installed apart from the foundation and piles. If a damper is installed between the soil improvement columns and the foundation, an effectiveness of energy-absorbing can be obtained by the displacement difference. The modulus of deformation and coefficient of subgrade reaction of the soil at the test yard are obtained as 2205kN/m2 and 2.84xl04kN/m3, respectively. In the experiments, the comparisons were conducted in the three cases; i.e. case of without a damper, with lead damper and with friction damper. The colonnades of soil improvement column in both sides of the foundation are to generate a soil vibration through a soil-loading girder when an actuator conducts a ground excitation test. As the reaction wall and actuator are in a test building, they work on the loading girder located outdoors through rods. A part of the results is organized as follows:

Excitation 1800 1800
2000
2000 6200
1200 Outer Pipe
Core-Pile
6800 9050 6900
3600 1800
1200
1800 3600
Actuator
A A
Improved Soil Columns
(a) Plan
(b) A-A section
unit:mm
Excitation
Girder
Girder
Conventional Foundation
Base-Isolation Foundation
Reinforced Concrete Block
Reaction Wall
Reaction Wall
Fig. 2 Test models (reinforced concrete block supported by pile foundation
-40-30
-20-10
010
2030
40
0 5 10 15time[sec]
Dis
plac
emen
t[m
m]
Base-isolation foundation model withfriction dampar model
Base-isolation foundation
0
5
10
15
0 10 20 30Relative displacement betweenfoundation and ground (mm)
Hor
izon
tal L
oad
(kN
)
Conventional foundation model
Base-isolation foundationwith friction damper model
Fig. 3 Time histories of displacement Fig. 4 Hysteretic loop obtained by of block in free vibration test static loading test
(1)Free vibration test The foundation was vibrated freely by being pulled and released at once with an oil jack using the soil- loading girder. The tests were conducted presuming the initial displacement as 3mm for the conventional foundation and as 30mm for base isolation foundation. Fig. 3 shows the time history of the displacements of the tests of the base-isolation foundation without damper and with friction damper. It reveals that a high energy absorption effect was obtained when the friction damper is attached. Moreover, the natural

period of the base isolation foundation could be extended to T=1.20sec (equivalent spring constant k=426kN/m) although that of the conventional was T=0.40sec (k=3841kN/m). (2)Static loading test Fig. 4 shows hysteretic curves of conventional foundation and base-isolation foundation with friction damper in the static loading test, using the soil-loading girder as a reaction point. The radiation damping can hardly be assessed by the conventional foundation and the area of the hysteretic loop is long and thin. On the contrary, it is demonstrated that the base-isolation foundation has a stable hysteretic loop with larger area.
OUTLINE OF BASE-ISOLATION SYSTEM IN REAL SIZE On the basis of the above mentioned tests using small-sized specimen, it was confirmed that the base-isolator system has a high vibration performance. Then, we constructed a base-isolation system in real size for trial. The mock-up model, which a slab of 20m in length, 15m in width and 2000kN in weight is supported by four of the double steel pipe piles as shown in Fig. 5. The specifications of the steel pipe piles are : the outer shell of the steel pipe pile (STK400 1,219Φ x12.7) is 7m in length (1m above ground and 6m under ground) and 1,200mm in diameter, and the inside of the steel pipe pile (SKT490 600 Φ x16) is 36m in length (4m above ground and 32m under ground) and 600mm in diameter. This system is composed of four of these driven into it. At the points of GL-6m, the inner core piles and outer pipes are welded by a steel plate. As shown in Fig. 6, fifty-nine soil cement columns of 1,000mm in diameter and the specified design strength 1MPa are aligned on the soil improvement columns, and above these, a reinforced concrete raft foundation of 500mm in thickness is constructed. As the outer shells of the pipe piles are restricted by this improved soil medium, the inner pipe piles behave as protruding piles with a protruding length of 10m. Fig. 7 shows the soil profile of the construction site of this system. Because this system is used as a shaking table, it can be excited by an actuator from the reaction wall within the experimental building. The specification of the actuator is: the maximum excitation force is 1,200kN (400kN×3 each), the maximum stroke is ±200mm and the maximum excitation velocity is 1m/s. Furthermore, ten earthquake observation systems (30 components) including the underground seismographs in G.L.-38m, G.L.-22m and G.L.-7m are established in the Joint Research Center for Environment Protection & Disaster Prevention City in Funabashi Campus of Nihon University where this base-isolation system is located as shown in Fig. 8.
12,700
7,750
8,000
3,450
Reaction
wall
Actuator
2,400 500
20,000
8,300 18,500
Mat foundation
Soil improvement
Table
6,000
1,000 10,000 36,000
1,000
1,500 unit:mm
Double steel pipe pile
500500
1, 4501, 450 〃〃〃〃〃〃〃〃〃
13, 500
1,350
1,350
1,400
1,400
〃
〃
〃
〃
〃
〃
〃
〃
〃
〃
500
500
18,500
Fig. 5 Concept illustration of mock-up Fig. 6 Plan of improved body
model of base-isolation system (soil cement columns)

210110
500150
800 1000400 6000 200
1600 2000
Vs(m/sec)
Vp(m/sec)0 400 800 1200
100
N value
20 30 40 50 60
fine sand mixed with gravel
fine sand
-35
-40
-10
silty fine sand
-15
fine sand
-20
-25
-30
450
Depth(m)
soil profile
0loam
claytuffaceous fine sand-5
silty fine sand
fine sand
380
620
1790
1410
1360280
350
Fig. 7 Soil profile
RESULTS OF EARTHQUAKE OBSERVATION Two specific earthquake motions among earthquake records that have been observed are reviewed. Table 1 shows the hypocenters and earthquake parameters for those two earthquakes. The hypocenter and epicenter of earthquake No.1 are close and deep, and these of earthquake No.2 are distant and shallow. Fig. 9 shows the pseudo-elastic response spectra obtained in cases of the viscous damping ratios h=0.05, 0.1 and 0.4 for the X-directional component of G.L.-7m, as examples of the analysis. Earthquake No.2 shows great earthquake motions of an extended period of vibration that is said to be generated by the deep seismostructure of the Kanto plains area. Fig. 10 shows the maximum acceleration distribution chart at the location of each seismograph. The distribution of the maximum accelerations at G.L.-22m and G.L.-7m of the earthquake whose hypocenter is close and epicenter is deep are quite different. This base-isolation system constitutes a multiple input one, and it must be recognized that input motions from the earthquake whose hypocenter is shallow and epicenter is far to the piles and improved soil medium are almost identical.
免震棟東側1F床面
免震棟北側1F床面
実験棟
免震棟基礎床面
地盤免震装置
免震棟G L-7m実験棟G L-7m
実験棟地下ピット床面
Z
X
免震棟G L-38m
免震棟G L-22m実験棟G L-22m
免震棟東側1F床面
免震棟北側1F床面
実験棟
免震棟基礎床面
地盤免震装置
免震棟G L-7m実験棟G L-7m
実験棟地下ピット床面
Z
X
免震棟G L-38m
免震棟G L-22m実験棟G L-22m
Z
X North position on table
Basement
GL-7m
GL-22m
GL-38m
GL- 7m
GL-22m
Basement of pit
Experimental building
Base-isolation structure East position on table
Basement of pit
Fig. 8 Seismograph installation positions

Table 1 Characteristics of two Earthquakes No Occurrence date Hypocenter Magnitude Depth Epicentral distance 1 2000/6/3 North-east of Chiba Pref. 5.8 50km 70km 2 2000/7/1 Inshore sea of Niijima 6.1 10km 185km
0.1
1
10
0.1 1 10Period[sec]
Pse
udo
Vel
ocit
y[cm
/s]
h=0.40
h=0.10
h=0.05
1cm/s2
10cm/s2
0.1cm
1cm
10cm
0.1
1
10
0.1 1 10Period[sec]
Pse
udo
Vel
ocit
y[cm
/s]
h=0.40
h=0.10
h=0.05
1cm/s2
10cm/s2
0.1cm
1cm
10cm
(a) No.1 Earthquake (b) No.2 Earthquake
Fig. 9 Pseudo-elastic response spectra (G.L.-7m, X-component)
0
1
2
3
4
0 0.1 0.2 0.3 0.4ACC.[m/s2]
X
Y
Z
GL-22m
GL-38m
GL-7m
Basement
East position ontable
0
1
2
3
4
0 0.05 0.1 0.15ACC.[m/s2]
X
Y
Z
GL-22m
GL-38m
GL-7m
Basement
East position ontable
(a) No.1 Earthquake (b) No.2 Earthquake Fig. 10 Maximum acceleration distribution in each depth
A
C
B P
T PT system
I I system
A
B
D
P
T
I G
PT system
(a) Design standard model (1) (b) Design standard model (2)
Fig. 11 Design standard model of base-isolation system
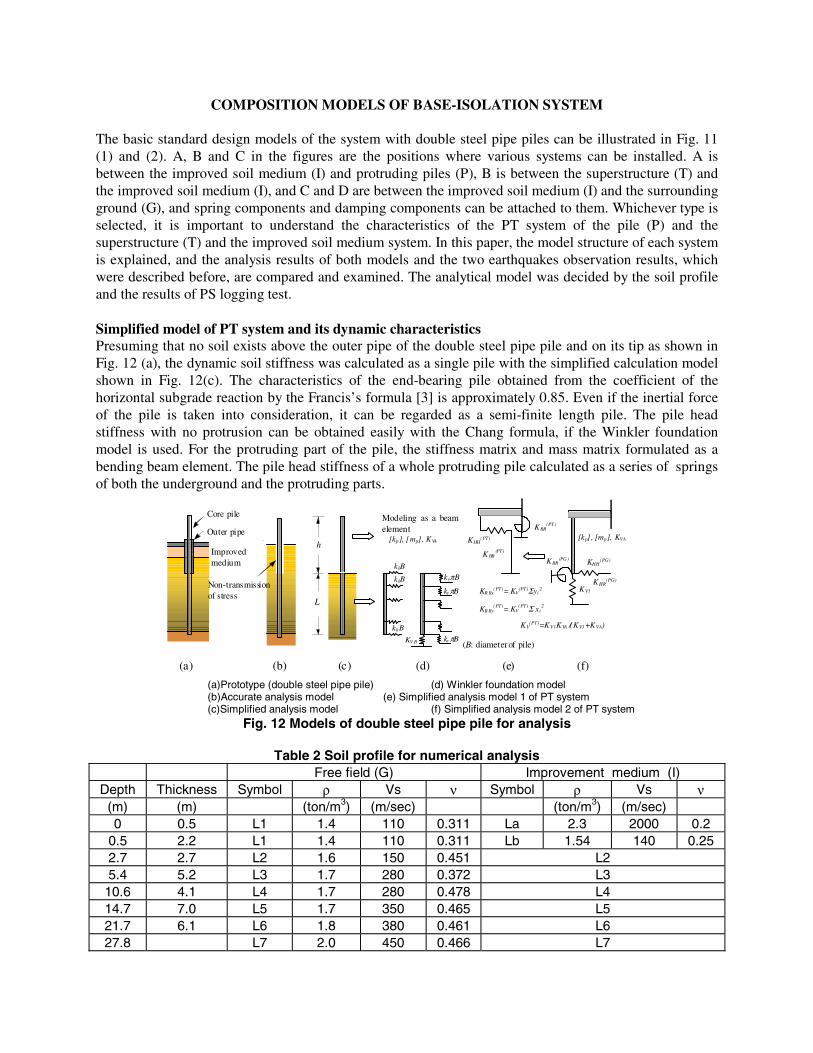
COMPOSITION MODELS OF BASE-ISOLATION SYSTEM The basic standard design models of the system with double steel pipe piles can be illustrated in Fig. 11 (1) and (2). A, B and C in the figures are the positions where various systems can be installed. A is between the improved soil medium (I) and protruding piles (P), B is between the superstructure (T) and the improved soil medium (I), and C and D are between the improved soil medium (I) and the surrounding ground (G), and spring components and damping components can be attached to them. Whichever type is selected, it is important to understand the characteristics of the PT system of the pile (P) and the superstructure (T) and the improved soil medium system. In this paper, the model structure of each system is explained, and the analysis results of both models and the two earthquakes observation results, which were described before, are compared and examined. The analytical model was decided by the soil profile and the results of PS logging test. Simplified model of PT system and its dynamic characteristics Presuming that no soil exists above the outer pipe of the double steel pipe pile and on its tip as shown in Fig. 12 (a), the dynamic soil stiffness was calculated as a single pile with the simplified calculation model shown in Fig. 12(c). The characteristics of the end-bearing pile obtained from the coefficient of the horizontal subgrade reaction by the Francis’s formula [3] is approximately 0.85. Even if the inertial force of the pile is taken into consideration, it can be regarded as a semi-finite length pile. The pile head stiffness with no protrusion can be obtained easily with the Chang formula, if the Winkler foundation model is used. For the protruding part of the pile, the stiffness matrix and mass matrix formulated as a bending beam element. The pile head stiffness of a whole protruding pile calculated as a series of springs of both the underground and the protruding parts.
RC べた基礎
内殻支持杭
外殻鋼管
地盤改良体
応力伝達なし
(a)二重鋼管杭 (b)精算用モデル (c)簡易計算モデル (d)ウインクラーモデル
梁材として定式化
(e)簡易 PTモデル① (f)簡易 PT モデル②
KHH(PT)
KHR(PT)
KRR(PT)
KR Rx(PT)= KV
(PT)Σyi2
KR Ry(PT)= KV
(PT)Σ xi2
KHH(PG)
KV1
KRR(PG)
KHR(PG)
[kp] , [mp], KVA
KV(PT)=KV1KVA /(KV1+KVA)
(B :杭径)
h
L
khB
khB
khB
KV B
kv πB
kvπB
kv πB
[kp], [mp], KVA
Modeling as a beam element
Improved medium
(B: diameter of pile)
Core pile
Outer pipe
Non-transmission of stress
(a) (b) (c) (d) (e) (f)
(a)Prototype (double steel pipe pile) (d) Winkler foundation model (b)Accurate analysis model (e) Simplified analysis model 1 of PT system (c)Simplified analysis model (f) Simplified analysis model 2 of PT system
Fig. 12 Models of double steel pipe pile for analysis
Table 2 Soil profile for numerical analysis Free field (G) Improvement medium (I)
Depth Thickness Symbol ρ Vs ν Symbol ρ Vs ν (m) (m) (ton/m3) (m/sec) (ton/m3) (m/sec) 0 0.5 L1 1.4 110 0.311 La 2.3 2000 0.2
0.5 2.2 L1 1.4 110 0.311 Lb 1.54 140 0.25 2.7 2.7 L2 1.6 150 0.451 L2 5.4 5.2 L3 1.7 280 0.372 L3
10.6 4.1 L4 1.7 280 0.478 L4 14.7 7.0 L5 1.7 350 0.465 L5 21.7 6.1 L6 1.8 380 0.461 L6 27.8 L7 2.0 450 0.466 L7

The rotational stiffness of the whole system was obtained only from the axial stiffness of each pile. The axial stiffness viewed macroscopically at the pile top was calculated as a series of springs of the protruding part (axial stiffness KVA) and of the underground part (spring KV1 that represents a value at the ground surface). The Winkler foundation model was applied to the calculation of the axial soil stiffness, as the same manner as the case of horizontal components, and it was obtained from Randolph's coefficient of the vertical subgrade reaction [4]. It presumed that the vertical spring at the tip of piles was equivalent to vertical stiffness Kvb of the circular rigid foundation that is calculated by neglecting the existence of the soil part above the pile tip. Fig. 13 shows the impedance function KHH
(PT) calculated at the bottom surface of the table (base-isolation structure 1F) in the PT system. The result of the simplified calculation corresponds well to the result of the accurate analysis using thin layer element method (TLEM) that takes into soil stratification consideration, and it was confirmed that the simplified calculation has enough accuracy for the design of the PT system. Through the thin layer element method (TLEM), outer pipe pile is treated as the model shown in Fig. 12(b). The imaginary part obtained by TLEM is negligible, and the PT system can be recognized as a system in which the damping is very small.
Fig. 14 shows the acceleration response magnification of the table (base-isolation structure 1F) to the free field surface. Fig.14 shows the results from the two earthquake observation records and the simplified PT model 2. It is assumed that the Rayleigh type damping of 1.5% is set for 1st and 2nd modes to the simplified PT model 2. The results of this model and those from observation coincide well with each other. It was revealed that the fundamental natural frequency 0.98Hz of the simplified model and 0.95-0.96Hz of the observation records agreed well with that frequency 1 Hz for the design target. It is found that the small peak value near 1.4Hz corresponds to the first mode of torsion from the results of the eigen value analysis. Simplified model of system I and dynamic characteristics It is assumed that the composite medium made by the soil cement columns and the unimproved soil is equivalent to homogeneous one, and the equivalent physical property (Lb) shown in Table 2 is estimated. Now, this composite medium is called the improved soil medium. Moreover, this medium is transferred to the circular section that has the same section area with a radius of R. The two simplified discretized models shown in Fig. 15 that corresponds to the design standard model were prepared for the System I. Firstly, a simplified model for System I (1) was set up, presuming the reinforced concrete raft foundation as a rigid foundation on the ground surface. In this model, the embedment effect of the portion of 0.5m was ignored. The horizontal spring that takes into the stratification under the reinforced concrete raft account was obtained by the simplified method [5]. The simplified method is based on the cone model proposed by Wolf [6]. Presuming the shearing elastic modulus of the soil directly below the foundation as
KHH (PT)
-10
-5
0
5
10
0 2 4 6 8 10f(Hz)
Re. (Accurate analysis)
Im. (Accurate analysis)
Re. (Simplified analysis)
(x103kN/m)
Fig. 14 Comparison of transfer functions
between observations and analysis
(Amp.) Table / Free surface
0
10
20
30
40
0 1 2 3 4 5f(Hz)
Earthquake No.1 East
Earthquake No.2 East
Simplified model 2 ofPT system
Fig. 13 Horizontal impedance functions
of PT system

G1, the soil stiffness of the foundation can be approximated the foundation on the uniform semi-infinite medium of G*=βHG1 by the correction factor βH in this method. It is presumed that the improvement medium (Lb) and its surrounding soil are identical as shown in Table 2, and the correction factor βH of this model is 2.09. The imaginary part of the impedance function that is estimated by the equivalent values of S-wave velocity Vs* and the mass density under the bottom surface ρ* can be approximated by the following equation:
2*)(.Im RaiKHH πρωω = (1)
Fig 17 (a) shows the horizontal impedance function of the rigid foundation without embedment together with the accurate analytical result. The accurate analytical results of the three ideal models shown in Fig. 16 were obtained by TLEM. The correction factor of the imaginary part of the simplified calculation was assumed as a=0.65, and the effect of the cut-off frequency of the surface layer was taken into consideration by the method of Dr. Iiba et al. [5]. For the simplified method, it was assumed that all the physical properties of the soil layers from the bottom of the foundation to the bottom of the improved soil medium were identical with that of the improved soil medium (Lb). Therefore, the stiffness by the simplified method is estimated considerably higher than the accurate result from Model 2 of Fig. 16. The stiffness by the simplified method is approximately the same as Model 1, which incorporated the embedment effect of 0.5m at the side surface. In Fig. 15 (b), we explain the modeling of the design standard model. The reinforced concrete raft foundation and the improvement soil medium are modeled as an embedded foundation. In this case, the springs that are estimated by the assumption of the embedded rigid foundation are utilized for both of accurate and simplified calculations. For the calculation of the soil spring at the bottom surface of the embedded foundation of the standard design model (2), it is assumed that the bottom surface of this design model coincides with that of the improved medium and can be calculated by the cone model without embedment. Novak's spring [7] was used for the side surface soil spring. The effect of the cut-off frequency was corrected the same as in case of no embedment. The correction factor in Eq.(1) for the imaginary part of the bottom surface spring is presumed as 1.0. The side surface spring was set as a half value of the Novak's soil spring, neglecting that of the active earth pressure side [5]. Fig. 17(b) shows the horizontal impedance functions of a whole improved soil medium by the above method and the accurate analysis.
Reinforced concrete raft foundation
CHB KHB
CHB
CHE1
CHE2
KHB
KHE2
KHE1
KHEn
CHEn
KF1
KF2
1
2
n
(a) Simplified model (1) (b) Simplified model (2)
Fig. 15 Two descretized models of I system (Improved soil medium)
Lb
L2
L1
L2
L1
L2
Lb L1
L2
L1 L2 L2
Lb L2 L2 L2
Lb Lb
(a) Model 1 (b) Model 2 (c) Model 3
Fig. 16 Three models for accurate analysis of I system (improved medium)
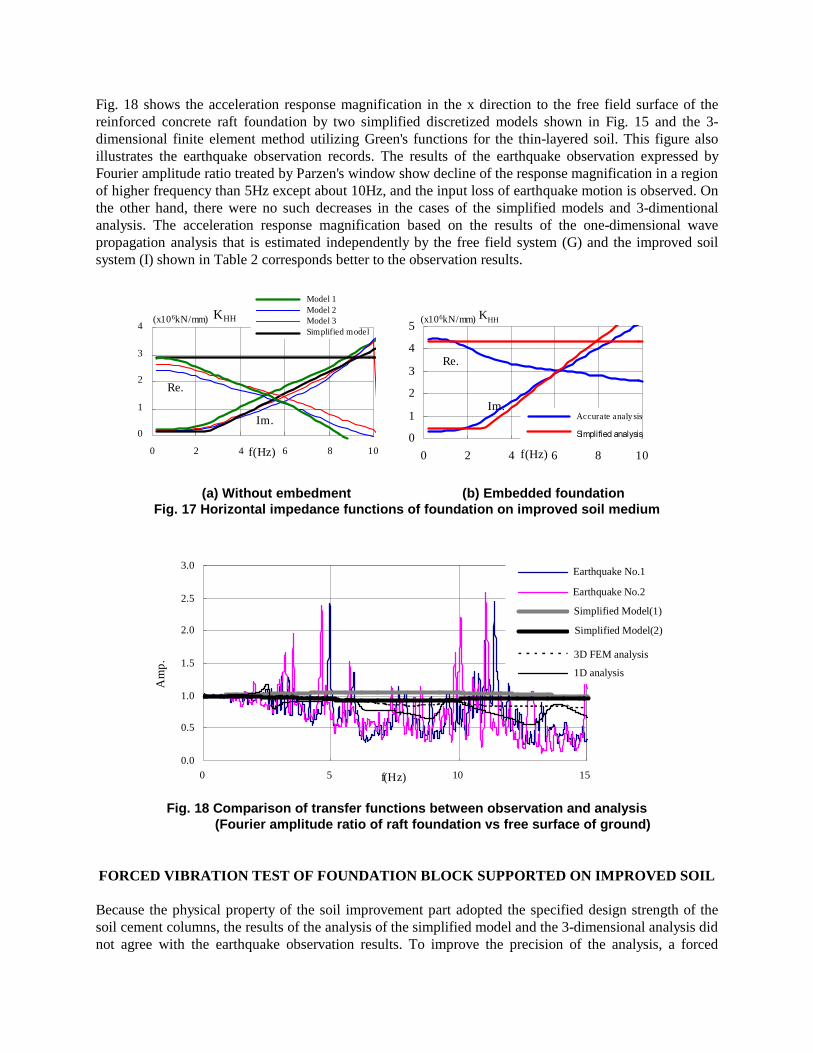
Fig. 18 shows the acceleration response magnification in the x direction to the free field surface of the reinforced concrete raft foundation by two simplified discretized models shown in Fig. 15 and the 3-dimensional finite element method utilizing Green's functions for the thin-layered soil. This figure also illustrates the earthquake observation records. The results of the earthquake observation expressed by Fourier amplitude ratio treated by Parzen's window show decline of the response magnification in a region of higher frequency than 5Hz except about 10Hz, and the input loss of earthquake motion is observed. On the other hand, there were no such decreases in the cases of the simplified models and 3-dimentional analysis. The acceleration response magnification based on the results of the one-dimensional wave propagation analysis that is estimated independently by the free field system (G) and the improved soil system (I) shown in Table 2 corresponds better to the observation results.
KHH
0
1
2
3
4
5
0 2 4 6 8 10f(Hz)
(x106kN/mm)
Accurate analy sis
Simplified analysis
Re.
Im.
KHH
0
1
2
3
4
0 2 4 6 8 10f(Hz)
Model 1
Simplified model1
Model 2Model 3
Re.
Im.
(x106kN/mm)
(a) Without embedment (b) Embedded foundation
Fig. 17 Horizontal impedance functions of foundation on improved soil medium
0.0
0.5
1.0
1.5
2.0
2.5
3.0
0 5 10 15f(Hz)
Am
p.
観測地震No.1
観測地震No.2
簡易モデル①
簡易モデル②
3次元FEM解析
1次元波動
Earthquake No.1
Earthquake No.2
Simplified Model(2)
Simplified Model(1)
3D FEM analysis
1D analysis
Fig. 18 Comparison of transfer functions between observation and analysis
(Fourier amplitude ratio of raft foundation vs free surface of ground) FORCED VIBRATION TEST OF FOUNDATION BLOCK SUPPORTED ON IMPROVED SOIL Because the physical property of the soil improvement part adopted the specified design strength of the soil cement columns, the results of the analysis of the simplified model and the 3-dimensional analysis did not agree with the earthquake observation results. To improve the precision of the analysis, a forced

vibration test of the reinforced concrete foundation block supported on the improved soil medium with soil cement columns made by the standard construction procedure. The outline of the test is as follows: Fig. 19 shows the illustration of the foundation block specimen constructed on the site about 20m far from the real-sized model. We accommodated the specified design strength of the soil cement column to that of the real-sized model, lMPa. The diameter of the column is Φ600mm and the length of column is 2.5m. Fig. 20 shows the stress-strain curves of the core samples of the soil cement column. This figure illustrates the results of the specimen of the highest and the lowest moduli of deformation among the total specimens (22 samples). This figure shows the results up to the unconfined compressive strength. Further, the figure also represents inclinations of the modulus of deformation (E50max, E50min, the mean value and standard deviation σ). The unconfined compressive strength of all the specimens became 2.5-4.6 times as large as the specified design strength. The results of the modulus of deformation were 839-1755MPa. The equivalent shear wave velocity obtained from the modulus of deformation was about two times higher than the value that had been used for the simulation analysis of the real-sized model.
600
600600 6006002400
600600600 600
600
600
600
600
240
060
060
0
GL100
025
00
600600
GL100
025
00
GL100
025
00
2400
5010
0
400 400600 600
240
0 1
000
100
4004002400
2400
600600600600
600600600600
600
600
600
600
240
050
Reinforced concrete block
Soil cement column
GL
(mm)
2500
Fig. 19 Foundation block supported on improved soil medium
0
0.5
1
1.5
2
2.5
3
3.5
4
4.5
0 0.1 0.2 0.3 0.4ε(%)
E50max
E50min
E50+σ
E50-σ
E50
σ(MPa)
Fig. 20 Stress-strain curves of core samples of soil cement column
The forced vibration test was conducted by a sweep excitation that gradually increases exciting frequencies by an eccentric mass-type vibration generator. Fig. 21 shows the resonance curve of the acceleration per unit exciting force for the exciting direction on the upper surface of the block at the eccentric moment Mr=2kgm. The forced vibration tests were carried out by the sub-tests divided by

several exciting frequency ranges. This figure shows the amplitude; phase in degrees, and coherence function that combined the results of each sub-test. From the coherence function, it was revealed that reasonable data were obtained except in low frequency ranges and connecting points between the sub-tests. The amplification and phase functions of the prediction and simulation analysis, which is conducted before and after the vibration test, are also shown in Fig. 21. For the prediction analysis, we set the physical property of the improved soil medium based on the specified design strength, 1MPa. On the other hand, based upon the material test results of the soil cement column, the physical property of the improved medium is set for the simulation analysis. Since a separation between the soil improvement medium and the surrounding soil beneath the block was observed during the vibration test, that of 0.5m depths from the bottom of the block was taken into consideration for the simulation analysis. From the phase functions, it is found that the resonant frequency in the X and Y direction of the excitation was 10.1Hz and 9.2Hz, respectively. The resonant frequency, 9.5Hz of the simulation analysis is closer in the experimental one than the prediction analysis. The amplitude function in the X-directional and Y-directional excitation has a peak at 11.6Hz, and 11.4Hz, respectively. The difference of the frequency characteristics in both directional excitation might be caused by the effect of the existence of adjacent structures, that is, the cross interaction. The details of results both the experiment and analysis will be reported in other papers. To confirm the advancement of the damping performance of the block on the soil improvement medium, the experiment using the same specimen has been planning.
0
0.05
0.1
0.15
0.2
0.25
0.3
0
0.05
0.1
0.15
0.2
0.25
0.3
0
90
180
00.20.40.60.8
1
0 5 10 15 20f(Hz)
0
90
180
00.20.40.60.8
1
0 5 10 15 20f(Hz)
phase
coh.
abs.abs.
coh.
phase
m/s2/kN m/s2/kN
degree degree
γ2γ2
Fig. 21 Normalized resonance curves of horizontal acceleration of upper surface of block
CONCLUSIONS In this study, a real-sized model of the new base-isolation system with the seismic isolation interface of the double steel pipe pile system was introduced. The real-sized model has utilized the pile construction

procedure that has to apply to weak ground sites. It was confirmed that the analysis results of double steel pipe pile system (PT system) by a simplified model agree well with the earthquake observation one as well as that of the accurate analysis. The analysis results of the simplified model of the improved soil medium (System I) that adopted the designed value of the physical property of the soil improvement body (soil cement column) is low accuracy. On the other hand, the simulation analysis of the forced vibration test of the foundation block based on the material test results provided appropriate results. Our future task is what system should be mounted on A, B, C and D of standard design models shown in Fig. 11. If there is much clearance between the upper structure and the base improvement body, the "soft first story" can be applied to the B part. On the other hand, if not much clearance, the "pseudo seismic isolation interface" can be provided. The simplest system that is applicable to the A part will be viscoelastic media. The C part and the D part represent the interaction between the improvement soil medium and the surrounding soil. Vibration elements and wave propagation elements are taken into account for the C and D part, respectively. Furthermore, a simple-shaped damper, a damper with an amplifying device, and an auxiliary mass damper will be applicable to the B part.
ACKNOWLEDGEMENTS This research was conducted as a part of the Academically Promoted Frontier Research Program on “Sustainable City Based on Environment Preservation and Disaster Prevention “ at Nihon University, College of Science and Technology (Head Investigator: Prof. Ohtsu, I.) under a grant from the Ministry of Education, Science and Sports, Japan. The research was partially supported by Grant-in-Aid for Science Research (B), 15360303, 2003, the Ministry of Education, Science, Sports and Culture. Furthermore, the experiment conducted to verify the validity of the proposed system is the one executed by the study committee of Seismic Isolation by Use of a Soil-Pile-Structure System (Chief: Prof. Ishimaru, Members: Coll. of Sci. & Tech., Nihon Univ., Kume Sekkei Co. Ltd., Oiles Co., Kawada Industries Inc., Tokyo Soil Research Co. Ltd., Asahi Chemical Construction Materials Co. Ltd., Tenox Co., Tomoe Co., Mitsubishi Materials Co., Soil Design Inc. and Nippon Stud Welding Co. Ltd.). The authors wish to express their appreciation to all the members of this committee.
REFERENCES 1. Ishimaru, S. et al. ”A feasibility study for seismic isolation by use of a soil-pile-structure system, Part
1 - Part 3.” Summary of Technical Papers of Annual Meeting Architectural Institute of Japan, Vol.B-2, pp.653-658, 1999 (in Japanese).
2. Shimomura, Y. et al. ” A study of dynamic interaction of soil and pile with non-uniform section.” Proceedings of 12th World Conference on Earthquake Engineering, Auckland, New Zealand. Paper No.875. 2000.
3. Kishida, H. and Nakai, S. ”Analysis of a laterally loaded pipe with non-linear subgrade reaction.” Transactions Architectural Institute of Japan, No.281, pp.41-55, 1979 (in Japanese).
4. Randolf, M. and Wroth, C. P. ”Analysis of deformation of vertically loaded piles.” Journal of GT Eng. Div., ASCE, Vol.104, No.GT12, pp.1465-1488, 1978.
5. Iiiba, M. ”Performance-based type of the provisions in the building standard law of Japan-Introduction of soil structure interaction in the calculation of response and limit strength-.” Proceedings of the 6th Symposium of Dynamic Soil Structure Interaction, Architectural Institute of Japan, pp.73-88, 2001 (in Japanese).
6. Wolf, J. P. ”Foundation analysis using simple physical models.” PTR prentice Hall, 1994. 7. Novak, M., Nogami, T. and Aboul-Ella, F. ”Dynamic soil reaction for plane strain case.” Journal of
Eng. Mech. Div., ASCE, Vol.104, pp.477-479, 1978.