a field observation on lightning performance improvement
TRANSCRIPT

126
ITB J. Eng. Sci. Vol. 41 B, No. 2, 2009, 126-140
Received August 23rd
, 2007, Revised July 19th, 2009, Accepted for publication August 26
th, 2009.
*Contact Address: Power Engineering Research Division, School of Electrical Engineering and Informatics,
Institute of Technology Bandung, Gd. Kerjasama PLN-ITB, Jl Ganesha 10, Bandung 40132, West Java,
Indonesia, Tel/Fax. +62 22 2500995, E-mail : [email protected]
A Field Observation on Lightning Performance
Improvement of Overhead Distribution Lines
Reynaldo Zoro*, Ryan Mefiardhi, Syarif Hidayat & Redy Mardiana
School for Electrical Engineering and Informatics, Institute of Technology Bandung, Indonesia
Abstract. Two feeders of 20 kV overhead distribution lines which are located in
a high lightning density area are chosen to be observed as a field study due to
their good lightning performance after improvement of lightning protection
system. These two feeders used the new overhead ground wire and new line
arrester equipped with lightning counter on the main lines. The significant
reduced of lines outages are reported. Study was carried out to observe these
improvements by comparing to the other two feeders line which are not
improved and not equipped yet with the ground wire and line arrester. These two
feeders located in the nearby area. Two cameras were installed to record the
trajectory of the lightning strikes on the improved lines. Lightning peak currents
are measured using magnetic tape measurement system installed on the grounding lead of lightning arrester. Lightning overvoltage calculations are
carried out by using several scenarios based on observation results and historical
lightning data derived from lightning detection network. Lightning overvoltages
caused by indirect or direct strikes are analyzed to get the lightning performance
of the lines. The best scenario was chosen and performance of the lines were
improved significantly by installing overhead ground wire and improvement of
lightning arrester installation.
Keywords: direct and indirect strikes; flashover rate; improved lightning performance;
lightning data; lightning outages analysis.
1 Introduction
Depok and Bogor are two area which are located in the south of Jakarta in West
Jawa Province, Indonesia and have a very high lightning density. According to
the Guinness Book of Record the highest thunderstorm day in the world is Bogor area which has more than 300 thunderstorm days a year. State Electricity
Company of Indonesia reported that this area located in the area with high
lightning density and has the highest outages in Indonesia due to lightning strikes to the overhead distribution lines. The latest study of lightning
performance on the distribution lines was carried out in year 2002 in this area
[1,2]. A lot of outages have been reported and have given the significant

Lightning Performance Improvement 127
problems to the local utility. Installation of the additional grounding system and
the use of the earth wire along the line have been done. The result of the study
was to recommend the company to improve the lightning protection system on
the lines. The significant reduces of the outages was achieved on the two observed lines after improvement. The study is still going on to derive more
field data in order to prove the reducing outages is caused by the
implementation of the recommendations.
The results of this study can be used by PLN to propose the important
guidelines on how to solve the problem due to lightning strikes on the overhead
distribution lines. This study has used local lightning data derived from
Indonesian Lightning Detection Network operated by High Voltage Engineering Laboratory of Institute of Technology Bandung, Indonesia [3].
The study was carried out by observing several feeders that have high lightning
outages on distribution lines by using video camera recorders, lightning event counters and magnetic tapes for measuring lightning peak current [4]. This work
was focused on two improved medium voltage 20 kV feeders in Depok area and
two other unimproved feeders at the city of Bogor which are located at the east side of Depok area.
2 Overhead Distribution Lines
The objects of the study are to observe four feeder of medium voltage 20 kV overhead distribution lines operated by state electricity company in the region,
which are:
a. Kapur feeder and Beton feeder operated by local electricity company.
These two feeders supplying urban area, community houses, and
several middle scales
This improvement gave the significant result of Lightning Performance in the
region. It was achieved by installing the overhead ground wire and line arrester
on the main line. It shown in Figure 1. This area was located in the flat and open land.
b. Another two feeder, Hutan feeder and Rimba feeder operated by local
electricity company in Bogor area. These two feeders supply the urban
area, small city and small-scale industries. The geographical condition is
mainly mountainous area. These two feeders are not improved yet.

128 Reynaldo Zoro, et al.
Figure 1 Typically overhead ground wire installation on the pole equipped with
line arrester at Kapur feeder.
Figure 2 The observed overhead distribution lines: Hutan feeder and Rimba
feeder at Bogor and Kapur feeder and Beton feeder in Depok.
2.1 Historical Lightning Data
Local lightning data derived from lightning detection system for more than 7
years were analysed [1]. The data in the area was observed by measuring the
latitude and longitude position of -6.5229oS and 106.6817
oE as the center of the
region to derive local lightning data within the area of 50x50 km2. This area

Lightning Performance Improvement 129
cover all four feeders as shown on Figure 2. This data was very important to get
a better analysis of the lightning performance of the medium voltage 20 kV
distribution lines.
Figure 3 shows the distribution of probability of lightning peak current in Depok and Bogor area, and Figure 4 shows flash density map of Kapur Feeder
located in Depok Area.
Figure 3 Logarithmic scale of lightning peak current probability.
Figure 4 Ground flash density map at Kapur feeder (more than 7 years data).

130 Reynaldo Zoro, et al.
Table 1 Estimated Ground flash density at Kapur feeder.
Map Area [km2] Ground Flash Density [flash/km
2/year]
Total
- Average
- Maximum
- Minimum
140
1
1
5.24
14.9
1.36
Circuit w/o OHGW
- Average
- Maximum
- Minimum
74
1
1
3.9
6.27
1.36
Circuit w/ OHGW
- Average
- Maximum
- Minimum
66
1
1
6.8
14.9
1.6
Four feeders have almost the same Ground Flash Density. By using this map the
area are sectionalized into several group for analysis such as: main distribution
line, sub-distribution line, soil resistivity, forest area, building density around the feeders, improved and unimproved lines. The calculation of lightning
performance for each feeders are being done by using the data derived from
ground flash density map. To make the observation more accurate the work were concentrated only on main distribution lines where the highest lightning
density took place or has the highest outages. It reduced also the installation
cost for the improvement.
Figure 5 Average and maximum lightning peak current per month in Depok area.

Lightning Performance Improvement 131
Maximum and average of lightning peak current per month recorded at Depok
area are shown on Figure 5 is 70 kA to 160 kA for positive strokes and –100 kA
to –200 kA for negative strokes respectively. Maximum of lightning peak
current is recorded higher on the first semester and decreasing to the end of the year. The averages data of lightning peak current are more flat than the
maximum values which is varies between 35 kA to 55 kA for positive strokes
and –39 kA to –56 kA for negatives strokes.
2.2 Lines Data
Distribution lines data of the four feeders are shown on Table 2.
Table 2 Lines Data for Hutan, Rimba, Kapur and Beton Feeder.
Detail Unit Name of the feeder
Kapur Beton Rimba Hutan
Circuit Length km 37.294 44.181 66.0 115.0
VLL kV 20 20 20 20
Insulator CFO kV 125 125 125 125
Pole Type Steel Concrete Concrete Concrete
Average Wire Configuration
- Phase R m (1 , 10) (1 , 10) (1 , 10) (1 , 10)
- Phase S m (0 , 10) (0 , 10) (0 , 10) (0 , 10)
- Phase T m (-1 , 10) (-1 , 10) (-1 , 10) (-1 , 10)
- OHGW m (0, 11) (0, 11) - -
Pole Grounding Resistance
- Average Ohm 3.98 5.59 6.25 5.51
- Maximum Ohm 12 22 10 8
Overhead Ground Wire (OHGW)
- Population % 17.68 16.76 0 0
- Ground at Every pole Every 6 span - -
Line Arrester
- Without OHGW Span 10 11 19 26
- With OHGW Span 4 5 - -
Object Near Overhead Lines (mainly trees)
- Average Height m 10 10 13 11
- Average Distance from Lines m 15 14 15 13
- Shielding Factor 0.528 0.492 0.6 0.576

132 Reynaldo Zoro, et al.
Kapur is the only feeder that use steel type pole. The other three use concrete
pole. It assumed that the overhead ground wire (OHGW) at Kapur feeder is
grounded at every pole. All systems are solidly grounded. Many of the
equipment grounding system are separated to pole grounding, especially at Hutan and Rimba feeders. The existing grounding is pole itself (pole
foundation) and some of them use additional grounding rods. Measuring of
tower footing resistance were being done by disconnecting the ground wire. In this study most of pole grounding resistance were measured no ground wires.
The value of the grounding resistance were vary significantly and it greatly
depend on the climate condition at the time when measurement was carried out.
In practice the values for deep earth electrodes show variations for about 20% [5].
The recorded line outages is shown in Figure 6, derived from real lightning
outages data (stated by the PLN) and the outage data correlated with the lightning such as; bad weather, failed equipment, insulator damaged etc. The
data shown that reduced outages were recorded at Kapur and Beton feeder
which have already improved at year 2003 since no improvement at Hutan and Rimba feeder yet.
Figure 6 Lightning performance of the lines derived from the PLN outages
data.
The earth contour of Depok and Bogor area is flat area at the northern part to
the mountainous area at the southern part of the Jawa Island which has over
3000 m height of mountain. This area is influenced by regional monsoon and local wind that flows from mountainous area during night and and from the sea
during daylight. Due to this weather condition the thunderstorm activity occurs

Lightning Performance Improvement 133
almost along the year. On the first transition periode on March to May the high
lightning activity take place. The second transition periode on September to
December the high lightning activity is also recorded. The first periode in this
area is higher than the second one. Figure 7 is showing the monthly lightning activities and correlated to the lightning outages on Kapur feeder. It shows that
Kapur outages are in good correlated with the lightning activaty in the region.
Figure 7 Lightning outages recorded on Kapur Feeder compare with the
lightning activity (average GFD) in the region per month.
Statistical analysis of the outages caused by lightning shown on Figure 6 and
the and the maximum lightning peak current as shown in Figure 5 is compared
and analyzed. The averages values of outages on the first periode are almost the same to the second one which differ from lightning current variation. It was
caused by the weather condition that has more wet at the second periode and it
increased the outages number on this periode.
2.3 Lightning Performance Calculation
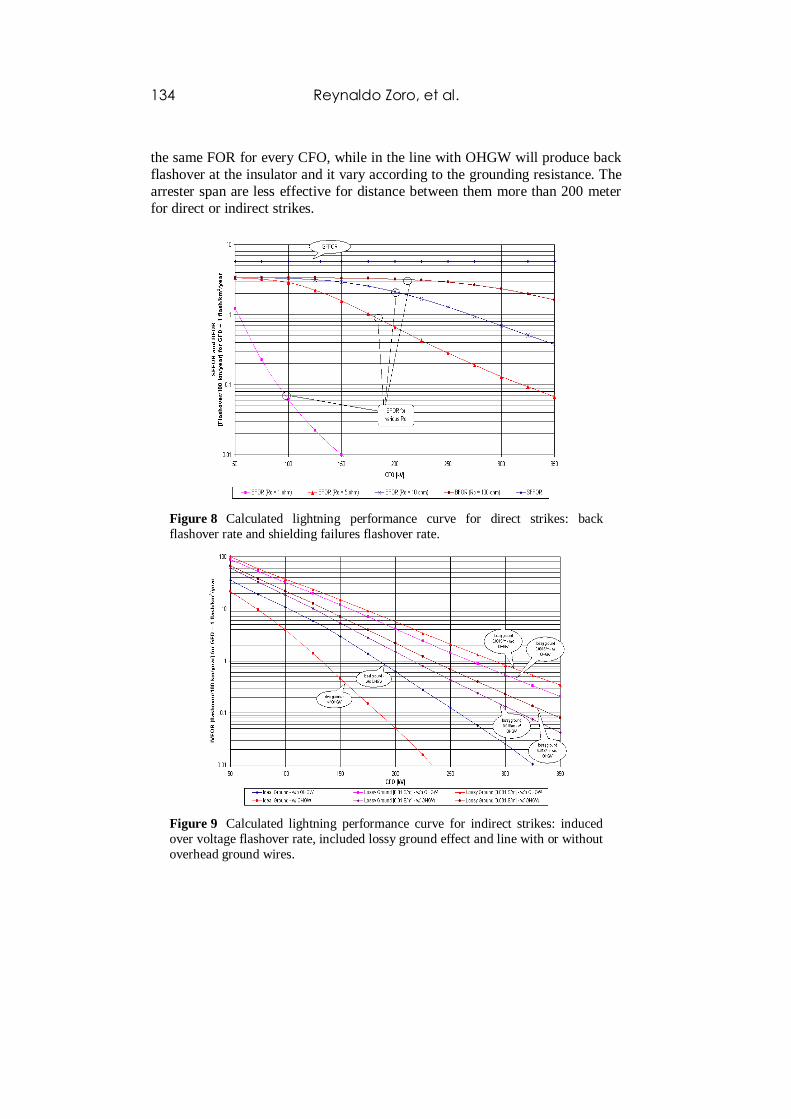
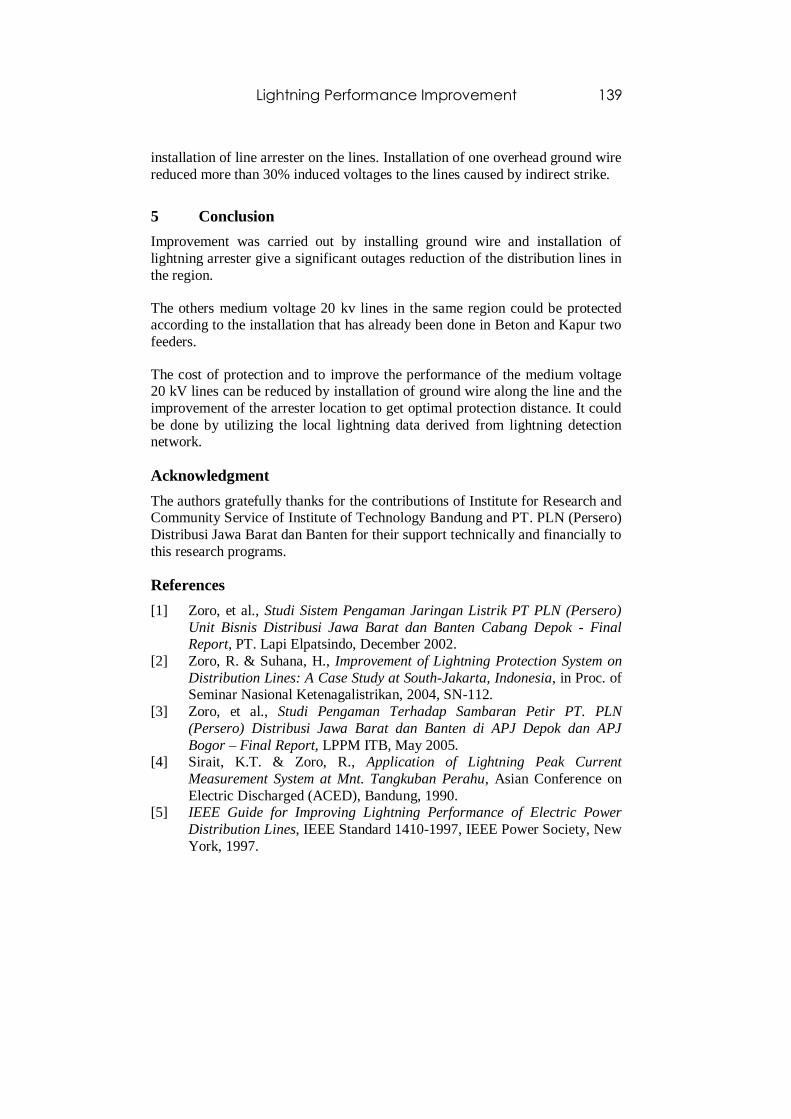
The lightning performance calculation is given at literature [6] with some appropriation with local lightning data. Figure 8 and 9 shown the lightning
performance of the lines with flash over rate (FOR) as functions of ground flash
density, Critical Flashover (CFO) of the line, grounding resistance etc. The use
of Over Head Ground Wire gave a significant reduction of FOR for more than 30% from indirect strikes. Direct strikes to the line without OHGW will result
134 Reynaldo Zoro, et al.
the same FOR for every CFO, while in the line with OHGW will produce back
flashover at the insulator and it vary according to the grounding resistance. The
arrester span are less effective for distance between them more than 200 meter
for direct or indirect strikes.
Figure 8 Calculated lightning performance curve for direct strikes: back
flashover rate and shielding failures flashover rate.
Figure 9 Calculated lightning performance curve for indirect strikes: induced
over voltage flashover rate, included lossy ground effect and line with or without
overhead ground wires.

Lightning Performance Improvement 135
This calculation shown that the main source of the outages is indirect strikes,
which is more than 10 times FOR than direct strikes.
Table 3 Estimated Flashover rate per 100 km per year for kapur and beton
feeders before and after improvement.
FOR
[Flashover/100 km/year]
Kapur Beton
Direct Indirect Total Direct Indirect Total
Before Total 16.62 268.58 285.20 3.13 371.44 374.56
After
Circuit w/o OHGW 12.09 195.41 207.49 2.31 284.15 286.46
Circuit w/ OHGW 3.06 3.40 6.46 0.89 20.63 21.52
Total 15.15 198.80 213.95 3.20 304.78 307.98
3 Field Observation
3.1 Video Camera and Recorder
Figure 10 Lightning strikes video frame and its trajectory at the nearby
lightning strikes at the observed distribution lines.

136 Reynaldo Zoro, et al.
A set of video camera is installed at the top of pole, viewing back to back of 20
kV overhead lines. Video recorder is located inside a building near the pole
which is operated manually. Based on the lightning data derived from
Indonesian lightning detection network [7] shows that lightning activity start at 11.00 to 21.00 hour where the most incident was taken place at 16.00 to 19.00
hour. Most of lightning stroke are recorded on video frame. It was recorded that
on the area of observation has a very high lightning incident in month January to April 2005 [3]. During the observation more nearby strike from cloud to
ground hit trees and other structures near the lines compare to the lightning
direct strike to 20 kV lines. Some of the photos of the lightning strikes are
shown in Figure 10.
3.2 Outages Reduction
The reduction of the outages are very significant for the two improved feeders in Depok. On the first year after the installation of overhead ground wire and
line arrester on the feeder at main distribution line the outage has reduced for
more than 40% as shown in Figure 11.
3.3 Magnetic Tape Measurement System and Lightning Event
Counter
A peak current measurement system using magnetic tape (APM) consist of three different type of commercial magnetic tape which are IEC type I Normal,
type II Chorm and type IV Ferro. These tapes were filled with 315 Hz
sinusoidal signal and laid on yellow fiber plate and attached to the arrester grounding lead [1].
Figure 11 Magnetic tape measuring system and lightning event counter
installation on arrester grounding lead.

Lightning Performance Improvement 137
The measurement unit installed in several pole with different type of arrester
installation such as ; arrester lead on distribution transformer, arrester lead on
the line and arrester lead on cable at dead end tower. The magnetic tape
measurement system (APM) and lightning event counter (LEC) are placed in a box attached to the tower. Minimum current of 2 kA can trigger the LEC. The
lead grounding of arrester is using single core N2XSY 1x50 mm2 cable to allow
lightning current flows undisturbed to the ground trough the LEC and APM.
One of the research results of this observation is explained as follows:
On January 18, 2005 a lightning hit the line nearby and triggered the LEC. The
counter had changed from 002 to 003 positions. At the same time it was
reported that the outage take place and the relays on the substations recorded 2 phases over current and also 2 phase’s ground faults. The magnetic tape reading
of this evidence is shown in following Figure 13.
Figure 12 The result of magnetic tape reading using free audio analyzer
software. It shows the erased 315 Hz signal on IEC type I Normal commercial
tape by lightning impulse. The length of erasement is about 3.5 cm or equivalent
with 8.9 kA of lightning current.

138 Reynaldo Zoro, et al.
Figure 13 Outage curves of Kapur and Beton feeders shown outages reduction
after the installation of OHGW.
4 Discussion
This study was carried to observe the results of the improvement that has been
made by electricity company from the previous study which was completed on year 2002. Several improvements have been made and gave the significant
results in reducing line outages. Improvements are not done yet for the other
feeders at city of Bogor.
Bogor is suffering more outages due to lightning strikes than Depok while
Bogor has higher Ground Flash Density and located in mountainous area with a
lot of trees nearby 20 kV lines.
Some of the installations on the existing overhead lines need to be repaired and cleaned such as fungi on the insulators, trees touch the wire, etc. and it produced
outages not caused by lightning. Some of the arrester grounding lead was not
yet properly installed. The lines used the different type of insulators that has different Basic Impulse Insulation Level. Some of the lines have too low span
distance and improper installation of grounding system was also found.
As the result of the observation stated that the improvement which has been carried out on Depok’s feeder have decreased the outages significantly and
improved the lightning performance of this overhead distribution lines.
Based on this results the same improvement will be done for Bogor’s feeder and
other distribution lines in Indonesia. The installation of grounding wire and the improvement of grounding system gave significant outages reduced than
Lightning Performance Improvement 139
installation of line arrester on the lines. Installation of one overhead ground wire
reduced more than 30% induced voltages to the lines caused by indirect strike.
5 Conclusion
Improvement was carried out by installing ground wire and installation of
lightning arrester give a significant outages reduction of the distribution lines in
the region.
The others medium voltage 20 kv lines in the same region could be protected according to the installation that has already been done in Beton and Kapur two
feeders.
The cost of protection and to improve the performance of the medium voltage 20 kV lines can be reduced by installation of ground wire along the line and the
improvement of the arrester location to get optimal protection distance. It could
be done by utilizing the local lightning data derived from lightning detection network.
Acknowledgment
The authors gratefully thanks for the contributions of Institute for Research and Community Service of Institute of Technology Bandung and PT. PLN (Persero)
Distribusi Jawa Barat dan Banten for their support technically and financially to
this research programs.
References
[1] Zoro, et al., Studi Sistem Pengaman Jaringan Listrik PT PLN (Persero)
Unit Bisnis Distribusi Jawa Barat dan Banten Cabang Depok - Final Report, PT. Lapi Elpatsindo, December 2002.
[2] Zoro, R. & Suhana, H., Improvement of Lightning Protection System on
Distribution Lines: A Case Study at South-Jakarta, Indonesia, in Proc. of Seminar Nasional Ketenagalistrikan, 2004, SN-112.
[3] Zoro, et al., Studi Pengaman Terhadap Sambaran Petir PT. PLN
(Persero) Distribusi Jawa Barat dan Banten di APJ Depok dan APJ
Bogor – Final Report, LPPM ITB, May 2005. [4] Sirait, K.T. & Zoro, R., Application of Lightning Peak Current
Measurement System at Mnt. Tangkuban Perahu, Asian Conference on
Electric Discharged (ACED), Bandung, 1990. [5] IEEE Guide for Improving Lightning Performance of Electric Power
Distribution Lines, IEEE Standard 1410-1997, IEEE Power Society, New
York, 1997.

140 Reynaldo Zoro, et al.
[6] Hoidalen, Hans Christian, Analitycal Formulation of Lightning Induced
Voltage on Multiconductor Overhead Lines Above Lossy Ground, IEEE
Transaction on Electromagnetic Compability, 45(1), February 2003.
[7] Zoro, R., Bambang, N. & Mefiardhi, R., Evaluation and Improvement of Lightning Protection on Transmission and Distribution Lines Using
Lightning Detection Network, in Proc. of 27th
International Conference on
Lightning Protection, 2004, 6p.13.