a financial analysis of homeowners insurance · a financial analysis of homeowners insurance...
TRANSCRIPT

AA FFiinnaanncciiaall AAnnaallyyssiiss ooff HHoommeeoowwnneerrss
IInnssuurraannccee
OOffffiicceess ooff tthhee IInnssuurraannccee CCoommmmiissssiioonneerr
JJuullyy 22000044
SSttaattee ooff WWeesstt VViirrggiinniiaa

2
CCoonnttaaccttss ffoorr qquueessttiioonnss aanndd ccoommmmeennttss oonn tthhiiss rreeppoorrtt::
JJaannee LL.. CClliinnee, Insurance Commissioner Phone: 558-3354 ext. 140
Email: [email protected]
BBiillll KKeennnnyy, Deputy Commissioner Phone: 558-3029 ext. 187
Email: [email protected]
Compiled By:
RRiicchhaarrdd MM.. CCuunnddyy, FCAS, MAAA, Agency Actuary Phone: 558-2094 ext. 175
Email: [email protected]

3
TTaabbllee ooff CCoonntteennttss
Introduction 4
Background on Homeowners Policies 5
Homeowners Results 7
Cost Drivers for West Virginia Results 10
Comparing West Virginia Homeowners Rates with Other States 13
Writers of Homeowners Insurance 17
Availability of Homeowners Insurance in West Virginia 23
Consumer Shopping Tips 24
Summary 25
APPENDIX
Glossary 27 West Virginia Homeowners Rate History 28

4
IInnttrroodduuccttiioonn
This report examines homeowners insurance in West Virginia. It compares
average premiums in West Virginia with those in other states, examines results in
West Virginia against the industry, and discusses why rates are rising and what
factors are driving the increases. The report also looks at the major homeowners
writers in West Virginia, their loss ratios and rate history.
Recently, concerns about both affordability (as rates have been rising) and
availability (as some insurers have tightened their underwriting standards and, in
certain cases, stopped writing new homeowners business) are being raised in
West Virginia and throughout the country.
Nationally, homeowners insurance premiums have been on the rise. Company
underwriting standards have tightened considerably. Customers filing too many
claims are being dropped and some customers are finding that their insurer is
using credit information to adjust their premium up or down. Since 1995,
premium increases had been running in the 2%-5% range. In 2003, the average
homeowners premium jumped about 7% (countrywide) and the outlook for 2004
is an additional 3%. West Virginia increases have been even more substantial.
Average Expenditures on Homeowners Insurance (Countrywide)
$418$440 $455
$481 $488$508
$536$558
$599$616
$400
$450
$500
$550
$600
$650
1995 1996 1997 1998 1999 2000 2001 2002* 2003* 2004*
*III estimates based on U.S. Bureau of Labor CPI data, company filings and trend projections Sources: National Association of Insurance Commissioners, Insurance Information Institute

5
BBaacckkggrroouunndd oonn HHoommeeoowwnneerrss PPoolliicciieess
A homeowners insurance policy is a package policy that combines coverage against the insured’s property being destroyed or damaged by various perils, and coverage for the insured’s liability exposures. Thus, the homeowners insurance policy covers against loss to the insured’s property as well as extending to the insured’s personal liability exposures. There are six generally recognized types of homeowners insurance policies explained more fully below: HO-1; HO-2; HO-3; HO-4; HO-5; and HO-6. HO-1 covers eleven (11) basic risks (fire or lightning, explosion, riot, aircraft, vehicles, smoke, vandalism, windstorm or hail, theft, damage by glass and volcanic eruption). It is an “old” form of coverage and no longer used much. HO-2 is also a basic coverage and adds six (6) more risks than HO-1. They are falling objects, weight of ice, snow or sleet, and three (3) categories of water related damage from home utilities to electrical surge damage. HO-3 provides the most common form of homeowners insurance. It provides extended coverage and covers the seventeen (17) standard perils plus any other peril not specifically excluded in the policy. Some common examples of excluded loss are: earthquakes and floods (covered separately by government flood insurance), war and nuclear accident. HO-4 is renters insurance and covers personal property (no dwelling coverage) only under the seventeen (17) standard perils. HO-5 is the top of the line and costs about 15% more than the HO-3. It bundles up all the extra type of riders that might be available with other policies such as; coverage for jewelry, furs, etc. It even can include coverage for sewer backup and building code upgrades. HO-6 covers condo and co-op owners but just for personal property and only under the standard seventeen (17) perils. A product similar to a homeowners insurance policy is a mobile homeowners insurance policy which generally provides coverages matching those available under a homeowners insurance policy for an insured’s property and liability exposures associated with ownership of a manufactured home. Another product available is a dwelling fire policy or dwelling fire coverage. This is a limited form of property insurance which generally only provides coverage for loss to the structure. There are three (3) typical types of dwelling fire policies (DF-1, DF-2 and DF-3) which provide different degrees of coverage against loss to the insured structure; however, a dwelling fire policy does not offer the same amount or types of coverage available under a homeowners insurance policy (for

6
example; personal liability coverage; loss of use/additional living expenses; valued policy law protections). TTyyppeess ooff CCoovveerraaggee::
1. Valued Policy: West Virginia has a valued-policy law requiring insurance companies to pay to the insured, in case of total loss, the full amount of the insurance, regardless of the actual value of the property at the time of loss. West Virginia does not presently allow actual cash value policies, which provide for a reduction in payout, for depreciation of the property.
2. Replacement Cost: This policy pays the cost of rebuilding/repairing your
home or replacing your possessions up to a stated amount without a reduction for depreciation.
3. Guaranteed or extended replacement cost: This policy offers the
highest level of protection. A guaranteed replacement cost policy pays whatever it costs to rebuild your home as it was before the fire or other disaster – even if it exceeds the policy limit. A guaranteed replacement cost policy may not be available if you own an older home. An extended replacement cost will generally pay the replacement cost plus 20 to 25 percent above the policy limit.

7
HHoommeeoowwnneerrss RReessuullttss
The table below provides Industry and West Virginia Combined Ratio results
over the last six years:
Homeowners
Direct Industry vs. West Virginia Results (000's) Direct Direct Direct Loss Written Earned Losses Loss Adj. Underwriting CombinedYear Premium Premium Incurred Ratio Expense Expenses Ratio
Countrywide 1997 $29,149,847 $28,144,268 $15,507,492 55.1% 11.0% 29.2% 95.3%1998 $30,958,768 $29,957,341 $19,082,826 63.7% 11.7% 29.8% 105.2%1999 $32,540,368 $31,711,261 $20,200,073 63.7% 10.9% 30.0% 104.6%2000 $34,661,215 $33,848,285 $22,475,261 66.4% 10.6% 29.9% 106.9%2001 $37,568,297 $36,165,647 $27,919,879 77.2% 12.2% 29.2% 118.6%2002 $43,042,146 $40,026,435 $26,337,394 65.8% 11.5% 28.4% 105.7%Total $207,920,641 $199,853,237 $131,522,925 65.8% 11.3% 29.4% 106.5% Source: A.M. Best
West Virginia 1997 $152,282 $147,958 $91,070 61.6% 11.2% 31.0% 103.8%1998 $164,045 $157,855 $155,580 98.6% 17.9% 33.0% 149.6%1999 $171,734 $167,789 $106,677 63.6% 11.0% 31.8% 106.4%2000 $180,054 $179,399 $116,845 65.1% 10.3% 32.9% 108.3%2001 $190,178 $187,048 $140,210 75.0% 10.8% 31.5% 117.3%2002 $208,244 $197,976 $202,529 102.3% 15.3% 28.3% 145.9%Total $1,066,537 $1,038,025 $812,911 78.3% 12.7% 31.3% 122.3%
Source: NAIC
Items of note:
• Over the past six years, West Virginia produced significantly poorer results
than the industry countrywide figures. The West Virginia loss ratio for the
1997 to 2002 period (78.3%), on average, has exceeded the countrywide
result (65.8%) by 12.5 points.

8
• Both 1998 and 2002 were catastrophe years for West Virginia (primarily
hail and windstorm damage). The overall poorer loss ratio results in West
Virginia are driven by the catastrophe results of 1998 and 2002. All other
years are comparable to countrywide in terms of loss ratio.
• Similarly, loss adjustment expenses are higher than countrywide over the
time period shown. Again, the catastrophe years caused abnormally
higher loss adjustment expenses in 1998 and 2002.
• Underwriting expenses are higher in West Virginia by about 2 points.
• The result of the higher loss ratio and higher expense ratio is a significantly higher combined ratio in West Virginia.
Visually, the figures in the table on page 7 can be displayed:
30%40%50%60%70%80%90%
100%110%
1997 1998 1999 2000 2001 2002
Loss Ratio
IndustryWest Virginia

9
10%
15%
20%
25%
30%
35%
1997 1998 1999 2000 2001 2002
Expenses
IndustryWest Virginia
40%
60%
80%
100%
120%
140%
160%
1997 1998 1999 2000 2001 2002
Combined Ratio
IndustryWest Virginia
.

10
CCoosstt DDrriivveerrss ffoorr WWeesstt VViirrggiinniiaa RReessuullttss
Loss Ratio: The loss ratio is the result of claim frequency and claim severity.
As a property line of business, homeowners insurance is subject to catastrophe
losses. The table below compares claim frequency and claim severity for West
Virginia with countrywide:
West Virginia Countrywide
Frequency Severity Frequency Severity Homeowners excluding Catastrophes Homeowners excluding Catastrophes
1998* 8.14% $2,706 1998 6.81% $2,786 1999 6.60% $3,121 1999 6.53% $3,122 2000 6.80% $3,233 2000 6.35% $3,478 2001 7.11% $3,724 2001 6.63% $4,022 2002* 6.21% $4,222 2002 5.96% $4,639
Homeowners including Catastrophes Homeowners including Catastrophes 1998* 11.57% $2,858 1998 9.66% $2,757 1999 6.86% $3,141 1999 8.91% $3,134 2000 7.23% $3,144 2000 8.34% $3,554 2001 7.40% $3,653 2001 9.13% $3,978 2002* 9.51% $4,135 2002 7.76% $4,460
Homeowners Catastrophes Homeowners Catastrophes 1998* 3.43% $3,219 1998 2.84% $2,688 1999 0.25% $3,644 1999 2.39% $3,168 2000 0.43% $1,734 2000 1.99% $3,797 2001 0.29% $1,899 2001 2.50% $3,860 2002* 3.30% $3,969 2002 1.80% $3,866
* 1998 and 2002 were significant Catastrophe years for West Virginia.
The best comparison in the table above is the Homeowners frequencies and
severities excluding catastrophes. Looking at a frequency comparison shows:

11
HO Claim Frequency (X Cats)
5.00%
5.50%
6.00%
6.50%
7.00%
7.50%
8.00%
8.50%
1998 1999 2000 2001 2002
West VirginiaCountrywide
With the exception of 1998, West Virginia’s claim frequencies correspond very
closely with the countrywide claim frequencies. The largest difference is under
0.5%, which is statistically insignificant. The 1998 year shows a more significant
difference. It is often the case that companies do not identify and report all
catastrophe claims as such. It is very likely that the frequency difference in 1998
is due to that effect (more prevalent when there are a series of catastrophic
events and the line between identifying claims as arising from a particular
catastrophe or a normal event becomes blurred).
Based on the above, it appears that high claim frequency is NOT a major
cause for poor West Virginia Homeowners results.
Likewise, looking at claim severities for Homeowners, excluding catastrophes,
shows that severities for West Virginia are very comparable to countrywide.

12
Underwriting Expense: A comparison of underwriting expenses between West
Virginia and countrywide is much more straightforward. Underwriting expense is
made up of General Expenses, Commissions, Other Acquisition Expense and
Taxes, Licenses and Fees. The next table displays these components for
comparison:
Underwriting Expense Comparison
General Expense Commissions Taxes+Surcharges WV C/W WV C/W WV C/W 1998 5.4% 5.5% 22.7% 22.7% 6.2% 2.5% 1999 5.5% 5.6% 22.7% 23.1% 4.3% 2.4% 2000 5.5% 5.6% 22.7% 19.4% 4.8% 2.4% 2001 5.2% 5.2% 22.0% 21.7% 4.8% 2.4% Source: NAIC Profitability Report
The primary reason for the higher homeowners underwriting expense in
West Virginia is the premium tax and surcharges. General Expenses are
identical and commissions vary due to the mix of companies, commission rates,
types of delivery systems, etc. within the state.
At this point, the conclusion would have to be that West Virginia
homeowners rates have not been adequate to cover the exposure written.
In particular, West Virginia experienced significant catastrophe losses in 1998
and 2002. These catastrophe losses appear to be the principal driver of the
recent rise in homeowners rates. The next section of this report looks at how
West Virginia compares with other states.

13
CCoommppaarriinngg WWeesstt VViirrggiinniiaa HHoommeeoowwnneerr RRaatteess wwiitthh OOtthheerr SSttaatteess
In the INTRODUCTION to this report, the average yearly expenditures
countrywide for homeowner insurance were shown graphically. Comparing
those figures with West Virginia projections (using average rate increases)
shows:
$200
$300
$400
$500
$600
$700
1999 2000 2001 2002* 2003* 2004*
Average Expenditures on Homeowners InsuranceWV vs CW
West VirginiaCountrywide
Source: 2003 PCI Greenbook
In 2001, West Virginia ranked 42nd from the highest average premium in the
country (Texas). If the projections above hold true, West Virginia is rapidly
catching up to the countrywide averages. The next chart shows the average
homeowners premium by state from highest to lowest. (Note: 2001 is the latest
year for which this information is available as of the writing of this report.)

14
Ranking of Average Premiums by State 2001 2001 Average Average
Geographic Area Ranking Premium Geographic Area Ranking Premium
United States $536 .Missouri 26 $480 .Texas 1 $955 .North Carolina 27 $484 .Louisiana 2 $758 .Georgia 28 $471 .Florida 3 $709 .Michigan 29 $470 .Oklahoma 4 $668 .Minnesota 30 $464 .District of Columbia 5 $655 .North Dakota 31 $463 .New York 6 $631 .Arizona 32 $460 .Kansas 7 $619 .Washington 33 $456 .Alaska 8 $614 .Vermont 34 $451 .Mississippi 9 $613 .New Mexico 35 $449 .Connecticut 10 $608 .New Hampshire 36 $444 .California 11 $599 .Pennsylvania 37 $441 .Colorado 12 $595 .Kentucky 38 $437 .Massachusetts 13 $571 .Illinois 39 $428 .Rhode Island 14 $562 .Indiana 40 $421 .South Carolina 15 $559 .Maryland 41 $419 .Hawaii 16 $553 .West Virginia 42 $410 .Arkansas 17 $537 .South Dakota 43 $410 .Nebraska 18 $526 .Virginia 44 $404 .New Jersey 19 $523 .Utah 45 $381 .Alabama 20 $501 .Maine 46 $372 .Wyoming 21 $499 .Ohio 47 $358 .Nevada 22 $490 .Delaware 48 $358 .Tennessee 23 $489 .Oregon 49 $356 .North Carolina 24 $484 .Idaho 50 $334 .Montana 25 $482 .Wisconsin 51 $308 Source: NAIC
Texas, Louisiana and Florida rank at the top because of their hurricane exposure
and, more recently, mold claims. It may be argued that we should compare West
Virginia with states of comparable population, so the next table does that:

15
A Comparison of Average Premiums for States of Similar Population to West Virginia (1,000,000 to $3,000,000)
Homeowners 2001 Ranking 1-Jul-03 Average High to
Geographic Area Population Premium Low United States 290,809,777 $536
.Montana 917,621
.Rhode Island 1,076,164 $562 3
.Hawaii 1,257,608 $553 4
.New Hampshire 1,287,687 $444 9
.Maine 1,305,728 $372 13
.Idaho 1,366,332 $334 14
.Nebraska 1,739,291 $526 6
.West Virginia 1,810,354 $410 10
.New Mexico 1,874,614 $449 8
.Nevada 2,241,154 $490 7
.Utah 2,351,467 $381 12
.Kansas 2,723,507 $619 1
.Arkansas 2,725,714 $537 5
.Mississippi 2,881,281 $613 2
.Iowa 2,944,062 $382 11
.Connecticut 3,483,372
Source: US Census Bureau and NAIC
Comparing states with similar population, West Virginia’s average homeowners
premium ranks 10th from the highest, out of a group of fourteen (14) states.
Another way to view West Virginia’s homeowners premium is to compare
average premiums for homes of comparable value. Over 70% of the homes in
West Virginia are valued between $50,000 and $125,000. Using the same states
above, but showing the average premium for homes valued between $50,000
and $125,000 gives the next table:
16
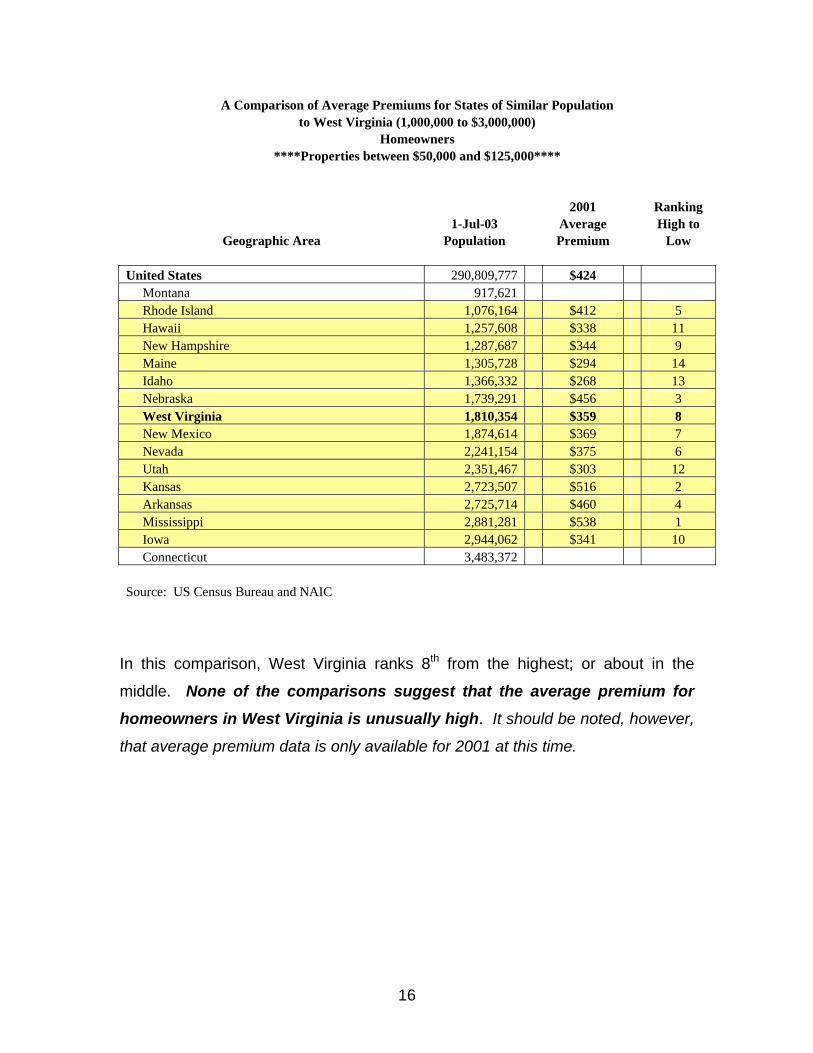
A Comparison of Average Premiums for States of Similar Population to West Virginia (1,000,000 to $3,000,000)
Homeowners ****Properties between $50,000 and $125,000****
2001 Ranking 1-Jul-03 Average High to
Geographic Area Population Premium Low United States 290,809,777 $424
.Montana 917,621
.Rhode Island 1,076,164 $412 5
.Hawaii 1,257,608 $338 11
.New Hampshire 1,287,687 $344 9
.Maine 1,305,728 $294 14
.Idaho 1,366,332 $268 13
.Nebraska 1,739,291 $456 3
.West Virginia 1,810,354 $359 8
.New Mexico 1,874,614 $369 7
.Nevada 2,241,154 $375 6
.Utah 2,351,467 $303 12
.Kansas 2,723,507 $516 2
.Arkansas 2,725,714 $460 4
.Mississippi 2,881,281 $538 1
.Iowa 2,944,062 $341 10
.Connecticut 3,483,372 Source: US Census Bureau and NAIC
In this comparison, West Virginia ranks 8th from the highest; or about in the
middle. None of the comparisons suggest that the average premium for
homeowners in West Virginia is unusually high. It should be noted, however,
that average premium data is only available for 2001 at this time.

17
2002 WV Homeowners Premiums
27.6%
18.3%
9.8%
7.8%
36.5%
State FarmNationwideErieAllstateOthers
WWrriitteerrss ooff HHoommeeoowwnneerrss IInnssuurraannccee
There are presently four insurance groups that write over 60% of the West
Virginia homeowners market: State Farm Group (27.6%), Nationwide Group
(18.3%), Erie Group (9.8%) and Allstate Group (7.8%) are the major writers for
2002.

18
STATE FARM
State Farm Group Homeowners West Virginia
Direct Direct Direct Written Market Earned Losses Loss CombinedYear Premium Share Premium Incurred Ratio Expenses* Ratio 1997 $46,548,429 30.6% $44,414,862 $27,617,673 62.2% 42.2% 104.4%1998 $50,282,625 30.7% $48,553,187 $45,563,160 93.8% 50.9% 144.7%1999 $51,836,409 30.2% $50,306,804 $31,766,718 63.1% 42.8% 105.9%2000 $50,006,703 27.8% $52,322,257 $35,878,604 68.6% 43.2% 111.8%2001 $54,330,756 28.6% $53,676,597 $46,221,954 86.1% 42.3% 128.4%2002 $57,537,563 27.6% $55,668,837 $57,156,943 102.7% 43.6% 146.3%Total $310,542,485 $304,942,544 $244,205,052 80.1% 44.0% 124.1%
*Statewide
Loss Ratio vs Rate Changes Loss Rate Ratio Change
1997 62.2% 8.9% 1998 93.8% 2.4% 1999 63.1% 0.0% 2000 68.6% 0.0% 2001 86.1% 0.0% 2002 102.7% 40.3% 2003 N/A 13.7%
For State Farm, serious adverse results appeared in 2001, with the loss ratio
moving into the ‘80’s. As is often the case in personal lines, rates will move
upward after an unfavorable year or two occurs. However, the movement of
rates is generally not as cause and effect related as the State Farm scenario
above. Competition, investment returns, expenses, corporate strategies, etc. will
also impact a company’s need to seek a rate adjustment. Additionally, in State
Farm’s case, the company was known to use homeowners as a ‘loss leader’ in
order to attract the larger premiums of personal automobile and underwrite the
account. Despite significant rate increases in 2002 and 2003, State Farm is still
not writing new homeowners business as of this report.

19
NATIONWIDE
Nationwide Group Homeowners West Virginia
Direct Direct Direct Written Market Earned Losses Loss CombinedYear Premium Share Premium Incurred Ratio Expenses* Ratio 1997 $24,640,159 16.2% $24,041,100 $13,734,962 57.1% 42.2% 99.3%1998 $26,580,724 16.2% $25,419,610 $24,745,292 97.3% 50.9% 148.2%1999 $28,018,981 16.3% $27,276,155 $16,594,332 60.8% 42.8% 103.6%2000 $30,229,581 16.8% $28,869,814 $19,527,873 67.6% 43.2% 110.8%2001 $32,813,642 17.3% $31,803,514 $24,975,392 78.5% 42.3% 120.8%2002 $38,204,338 18.3% $35,043,529 $32,851,557 93.7% 43.6% 137.3%Total $180,487,425 $172,453,722 $132,429,408 76.8% 44.0% 120.8% *Statewide
Loss Ratio vs Rate Changes Loss Rate Ratio Change
1997 57.1% 0.0% 1998 97.3% 3.4% 1999 60.8% 0.0% 2000 67.6% 9.9% 2001 78.5% 9.9% 2002 93.7% 19.9% 2003 N/A 13.2%
Nationwide’s figures show the impact of coming off good years in 1997 and 1999
by not adjusting rates upward, despite the severe catastrophe losses suffered in
1998. However, worsening results starting in 2000 have led to some significant
rate adjustments over the last few years. Nationwide’s market share in West
Virginia has been growing since 1998.

20
ERIE
Erie Group Homeowners West Virginia
Direct Direct Direct Written Market Earned Losses Loss CombinedYear Premium Share Premium Incurred Ratio Expenses* Ratio 1997 $10,583,770 7.0% $9,892,900 $6,666,674 67.4% 42.2% 109.6%1998 $12,039,229 7.3% $11,260,945 $12,286,807 109.1% 50.9% 160.0%1999 $13,468,612 7.8% $12,716,047 $8,205,906 64.5% 42.8% 107.3%2000 $14,562,087 8.1% $14,018,430 $8,511,708 60.7% 43.2% 103.9%2001 $16,458,415 8.7% $15,265,114 $9,949,098 65.2% 42.3% 107.5%2002 $20,316,439 9.8% $18,147,915 $26,225,239 144.5% 43.6% 188.1%Total $87,428,552 $81,301,351 $71,845,432 88.4% 44.0% 132.4% *Statewide
Loss Ratio vs Rate Changes Loss Rate Ratio Change
1997 67.4% 5.5% 1998 109.1% 6.8% 1999 64.5% 5.6% 2000 60.7% 0.3% 2001 65.2% 4.4% 2002 144.5% 5.8% 2003 N/A 20.8%
Erie shows better management of its rate revisions by generally taking more
moderate increases each year. Thus, apart from the catastrophe years of 1998
and 2002, loss ratios have remained in the ‘60’s. Notice the significant increase
in market share that Erie is showing for West Virginia.

21
ALLSTATE
Allstate Group Homeowners West Virginia
Direct Direct Direct Written Market Earned Losses Loss CombinedYear Premium Share Premium Incurred Ratio Expenses* Ratio 1997 $13,078,080 8.6% $12,659,798 $7,958,065 62.9% 42.2% 105.1%1998 $13,826,323 8.4% $13,465,652 $14,438,797 107.2% 50.9% 158.1%1999 $14,333,035 8.3% $14,004,828 $8,561,686 61.1% 42.8% 103.9%2000 $14,826,050 8.2% $14,554,250 $7,898,786 54.3% 43.2% 97.5%2001 $15,479,415 8.1% $15,445,919 $9,328,116 60.4% 42.3% 102.7%2002 $16,290,639 7.8% $15,832,706 $15,907,598 100.5% 43.6% 144.1%Total $87,833,542 $85,963,153 $64,093,048 74.6% 44.0% 118.6% *Statewide
Loss Ratio vs Rate Changes Loss Rate Ratio Change
1997 62.9% 4.0% 1998 107.2% 2.0% 1999 61.1% 0.0% 2000 54.3% 3.5% 2001 60.4% 0.0% 2002 100.5% 21.8% 2003 N/A 11.6%
After filing modest increases since 1997, Allstate came back with double-digit
rate increases in 2002 and 2003. Despite these increases, Allstate’s market
share has declined suggesting they are writing little if any new business in West
Virginia.

22
STATEWIDE
Loss Ratio vs Rate Changes Loss Rate Ratio Change*
1997 61.6% 3.5% 1998 98.6% 2.6% 1999 63.6% 0.6% 2000 65.1% 3.5% 2001 75.0% 2.4% 2002 102.3% 18.9% 2003 N/A 11.7%
*Based on 80% of Market
Looking at the statewide loss ratios vs. the average rate changes (see Appendix,
Exhibit 1) for most of the West Virginia market (about 80%), the pattern of higher
loss ratios followed by a number of years of rate increases is again evident.
Compared with countrywide rate increases (below), West Virginia has
experienced larger increases than countrywide in 2002 and 2003.
COUNTRYWIDE
Loss Ratio vs Rate Changes Loss Rate Ratio Change*
1997 55.1% 3.4% 1998 63.7% 5.7% 1999 63.7% 1.5% 2000 66.4% 4.1% 2001 77.2% 2.4% 2002 65.8% 2.3% 2003 N/A 7.0%
*Based on 100% of Market

23
AAvvaaiillaabbiilliittyy ooff HHoommeeoowwnneerrss IInnssuurraannccee iinn WWeesstt VViirrggiinniiaa In 2002, twenty-six (26) insurance companies wrote $1,000,000 or more
homeowners premium in West Virginia. In addition to the large national
companies State Farm, Nationwide, Erie and Allstate, West Virginia is fortunate
to have a number of domestic mutual companies to assist in filling gaps which
might otherwise occur in the homeowners market. Domestic mutuals such as
Farmers and Mechanics Mutual Fire Insurance of West Virginia, West Virginia
Insurance Company, Municipal Mutual Insurance Company, Farmers Mutual
Insurance Company, Panhandle Farmers Mutual Insurance Company and Safe
Insurance Company each write well over $1,000,000 in homeowners premium.
However, as was noted earlier in this paper, the homeowners market in West
Virginia and elsewhere has hardened. Tighter underwriting standards and rate
increases together with little or no new writing by State Farm and Allstate are
making homeowners insurance more difficult to find. Unique situations, such as
finding insurance for rental property, can often be difficult even in a soft market;
and are more so in a tight market.

24
CCoonnssuummeerr SShhooppppiinngg TTiippss
•• Shop Around: Get at least three (3) price quotes. Get quotes from
different types of companies. Some companies sell through direct agents, independent agents, mail, phone, or internet.
•• Maintain good credit: Companies are increasingly relying on your credit
rating (developing a ‘credit score’) as an additional factor in pricing your
insurance. A good credit history may result in a lower insurance cost.
•• C.L.U.E. Report: Additionally, check your C.L.U.E. report, which your
agent or insurer can direct you to. New homebuyers should ask sellers for
a copy of their C.L.U.E. report because insurers now consider what claims
have been made on a property when calculating your premium, even if
you didn’t own the home at the time.
•• Consider higher deductibles: Raising your deductible to $500 or $1,000
will lower your premium; in fact many companies no longer offer a $250
deductible. Raising your deductible from $500 to $1,000 could reduce
your premium considerably.
•• Inquire about discounts: Often employers, alumni groups or other
affiliations may qualify you for a discount. Companies will usually give a
discount if you purchase your homeowners insurance and auto insurance
from the same company. Other discounts may include homes equipped
with burglary alarms and smoke/fire detectors.
•• Know your policy: Many insurers are now requiring a windstorm
deductible of 1 or 2 percent of the insured policy. For example, if a
windstorm damages the roof on your $100,000 home, you would be
responsible to pay the first $2,000 of loss.

25
SSuummmmaarryy
•• Homeowners insurance premiums have increased in West Virginia sharply
in the last two (2) years. Combined ratio results in West Virginia support
the need for a correction in West Virginia homeowners rates. •• Significant West Virginia catastrophe losses in 1998 and 2002 (hail and
windstorm damage) appear to be the primary cause for the recent steep
rise in rates. •• Homeowners results have been worse in West Virginia than countrywide
over the last six (6) years. •• Lower interest rates over the last couple of years are forcing insurers to
revise their profit provisions placing further upward pressure on rates.
Most insurers are now setting rates to generate an underwriting profit in
the homeowners line. •• Both claim frequency and claim severity in West Virginia have been
comparable to countrywide. This suggests that rates have not been
adequate for homeowners in the state. •• In 2001, the average homeowners premium in West Virginia ranked 42nd
from the highest in the country. •• Even accounting for lower average property values in West Virginia, it
appears that homeowners premiums here have been below countrywide. •• 60% of West Virginia homeowners insurance is written by State Farm,
Nationwide, Erie and Allstate. However, roughly twenty-six (26)
companies write $1,000,000 in premium or more. •• Creation of a fraud unit may contribute to better loss experience in West
Virginia. •• Consumers should shop for homeowners insurance, as rates and
discounts vary widely by company.

26
AAPPPPEENNDDIIXX

27
GGLLOOSSSSAARRYY (All words in the report in BLUE)
CCllaaiimm FFrreeqquueennccyy:: For homeowners, the number of claims per one hundred (100) insured homes. CCllaaiimm SSeevveerriittyy:: The average cost per claim. CC..LL..UU..EE..:: Comprehensive Loss Underwriting Exchange. Through C.L.U.E., which is assembled by a company called Choicepoint, information on individuals automobile and homeowners claim history is collected. This information is often used for underwriting in combination with credit scoring. CCoommbbiinneedd RRaattiioo:: The sum of an insurer’s loss ratio and expense ratio. A Combined Ratio under 100% means the insurer made an underwriting profit; over 100% means an underwriting loss. Investment income is quite limited for the homeowners line, thus producing a combined ratio under 100% is generally necessary for profitability. CCrreeddiitt SSccoorree ((aallssoo kknnoowwnn aass IInnssuurraannccee SSccoorree)):: Derived from a consumer’s credit history (and sometimes, also the loss history), it is used by some companies to aid in pricing the consumer’s insurance. DDiirreecctt: Direct figures, such as premiums, losses and loss ratios are numbers prior to the effect of reinsurance. In contrast, NNeett figures are after reinsurance. DDiirreecctt AAggeennttss:: Agents that only write insurance for a particular company, for example, Nationwide agents. IInnddeeppeennddeenntt AAggeennttss:: Agents that represent and can offer insurance for a number of companies. LLoossss RRaattiioo:: The ratio of losses to earned premiums. LLoossss AAddjjuussttmmeenntt EExxppeennssee:: Expenses related to claim adjustment and legal costs. UUnnddeerrwwrriittiinngg EExxppeennsseess:: Expenses relating to the operation of an insurance company in acquiring and underwriting (assessing) business.

28
Exhibit 1 West Virginia Homeowners Rate History
2002
Market Rate 2002
Market Rate Company Share Year Change Company Share Year Change State Farm Fire & Casualty 1996 0.0% Farmers Mutual Ins Co* 1996 Unknown 1997 8.9% 1997 Unknown 1998 2.4% 1998 Unknown 1999 0.0% 1999 Unknown 2000 0.0% 2000 Unknown 2001 0.0% 2001 Unknown 27.6% 2002 40.3% 2.0% 2002 Unknown 2003 13.7% 2003 Unknown Nationwide Mutual Ins Co 1996 0.0% Ohio Farmers Ins Co 1996 0.0% 1997 0.0% 1997 0.0% 1998 3.4% 1998 8.3% 1999 0.0% 1999 0.0% 2000 9.9% 2000 9.0% 2001 9.9% 2001 0.0% 18.4% 2002 19.9% 1.8% 2002 20.8% 2003 13.2% 2003 16.5% Erie Ins Property & Casualty 1996 0.0% Prudential P&C Co 1996 0.0% 1997 5.5% 1997 0.0% 1998 6.8% 1998 7.6% 1999 5.6% 1999 0.0% 2000 0.3% 2000 0.0% 2001 4.4% 2001 0.0% 9.8% 2002 5.8% 1.2% 2002 11.2% 2003 20.8% 2003 0.0% Allstate Insurance Company 1996 0.0% State Auto P&C Co 1996 0.0% 1997 4.0% 1997 5.3% 1998 2.0% 1998 -0.1% 1999 0.0% 1999 4.4% 2000 9.0% 2000 2.0% 2001 0.0% 2001 0.0% 7.6% 2002 21.8% 1.1% 2002 3.9% 2003 11.6% 2003 8.5% Farmers & Mechanics Mut* 1996 Unknown Safeco Ins Co 1996 0.0% 1997 Unknown 1997 0.0% 1998 Unknown 1998 -1.9% 1999 Unknown 1999 3.0% 2000 Unknown 2000 9.9% 2001 Unknown 2001 0.0% 4.7% 2002 Unknown 1.0% 2002 21.0% 2003 Unknown 2003 0.0%

29
WV Ins Co* 1996 Unknown
United Services Auto Assoc 1996 0.0%
1997 Unknown 1997 0.0% 1998 Unknown 1998 0.0% 1999 Unknown 1999 -4.9% 2000 Unknown 2000 0.0% 2001 Unknown 2001 0.0% 2.9% 2002 Unknown 1.0% 2002 12.0% 2003 Unknown 2003 11.0% Municipal Mutual Ins Co* 1996 Unknown Farm Family Cas Ins Co 1996 0.0% 1997 Unknown 1997 0.0% 1998 Unknown 1998 7.6% 1999 Unknown 1999 -4.8% 2000 Unknown 2000 0.0% 2001 Unknown 2001 0.0% 2.9% 2002 Unknown 1.0% 2002 19.6% 2003 Unknown 2003 19.6% Glens Falls Ins Co 1996 0.0% Foremost Ins Co 1996 0.0% 1997 0.0% 1997 -3.2% 1998 -2.2% 1998 0.0% 1999 -0.2% 1999 4.4% 2000 11.4% 2000 0.0% 2001 0.0% 2001 1.2% 2.7% 2002 0.0% 0.9% 2002 9.5% 2003 49.5% 2003 0.0% Westfield Ins Co 1996 0.0% WV Fire & Cas Co 1996 0.0% 1997 0.0% 1997 4.4% 1998 8.0% 1998 0.0% 1999 0.0% 1999 5.9% 2000 9.4% 2000 9.0% 2001 0.0% 2001 15.0% 2.7% 2002 11.6% 0.8% 2002 27.3% 2003 10.0% 2003 0.0% Shelby Cas Ins Co 1996 0.0% Combined* 1996 0.0% 1997 4.5% 1997 3.5% 1998 0.0% 1998 2.6% 1999 0.0% 1999 0.6% 2000 0.0% 2000 3.5% 2001 0.0% 2001 2.4% 2.0% 2002 9.9% 92.1% 2002 18.9% 2003 15.1% 2003 11.7%
*Domestic Farm Mutuals not required to make rate filings. *Total Excluding
Farm Mutuals 79.6%