a first step up the energy ladder?
TRANSCRIPT

Policy Research Working Paper 7859
A First Step up the Energy Ladder?
Low Cost Solar Kits and Household’s Welfare in Rural Rwanda
Michael GrimmAnicet Munyehirwe
Jörg PetersMaximiliane Sievert
Development Economics Vice PresidencyOperations and Strategy TeamOctober 2016
WPS7859P
ublic
Dis
clos
ure
Aut
horiz
edP
ublic
Dis
clos
ure
Aut
horiz
edP
ublic
Dis
clos
ure
Aut
horiz
edP
ublic
Dis
clos
ure
Aut
horiz
edP
ublic
Dis
clos
ure
Aut
horiz
edP
ublic
Dis
clos
ure
Aut
horiz
edP
ublic
Dis
clos
ure
Aut
horiz
edP
ublic
Dis
clos
ure
Aut
horiz
ed

Produced by the Research Support Team
Abstract
The Policy Research Working Paper Series disseminates the findings of work in progress to encourage the exchange of ideas about development issues. An objective of the series is to get the findings out quickly, even if the presentations are less than fully polished. The papers carry the names of the authors and should be cited accordingly. The findings, interpretations, and conclusions expressed in this paper are entirely those of the authors. They do not necessarily represent the views of the International Bank for Reconstruction and Development/World Bank and its affiliated organizations, or those of the Executive Directors of the World Bank or the governments they represent.
Policy Research Working Paper 7859
This paper is a product of the Operations and Strategy Team, Development Economics Vice Presidency. It is part of a larger effort by the World Bank to provide open access to its research and make a contribution to development policy discussions around the world. Policy Research Working Papers are also posted on the Web at http://econ.worldbank.org. The authors may be contacted at [email protected], [email protected], and [email protected].
More than 1.1 billion people in developing countries are lacking access to electricity. Based on the assumption that electricity is a prerequisite for human development, the United Nations has proclaimed the goal of providing elec-tricity to all by 2030. In recent years, Pico-Photovoltaic kits have become a low-cost alternative to investment intensive grid electrification. Using a randomized controlled trial, the paper examines uptake and impacts of a simple Pico-Photovoltaic kit that barely exceeds the modern energy
benchmark defined by the United Nations. The authors find significant positive effects on household energy expen-ditures and some indication for effects on health, domestic productivity, and on the environment. Since only parts of these effects are internalized, underinvestment into the technology is likely. In addition, our data show that adop-tion will be impeded by affordability, suggesting that policy would have to consider more direct promotion strategies such as subsidies or financing schemes to reach the UN goal.

A First Step up the Energy Ladder? Low Cost Solar Kits and
Household’s Welfare in Rural Rwanda
Michael Grimm, Anicet Munyehirwe, Jörg Peters, and Maximiliane Sievert
JEL codes: D13, H23, H43, I31, O13, O18, Q41. Keywords: Sustainable Energy for All (SE4All), household welfare, household technology
adoption, Sub‐Saharan Africa, Randomized Controlled Trial.
Michael Grimm is a Professor of Development Economics at University of Passau. He is also affiliated with Erasmus University Rotterdam and IZA, Bonn; [email protected]. Anicet Munyehirwe is director of IB&C Rwanda; [email protected]. Jörg Peters is heading the research group “Climate Change in Developing Countries” at RWI, Germany. He is Visiting Associate Professor at the University of the Witwatersrand, Johannesburg, South Africa; [email protected]. Maximiliane Sievert (corresponding author) is Research Fellow at RWI, Germany; [email protected]. We thank two anonymous referees and the editor for very valuable comments. We also thank conference participants in Münster (VfS 2015), in Oxford (CSAE 2015), in Kiel (VfS Development Economics 2015), Copenhagen (PEGNET 2013) and Düsseldorf (IAEE 2013) as well as participants at research seminars at the University of Bonn (ZEF), the Kiel Institute for the World Economy, and the University of Groningen. The data underlying this research was collected for an impact evaluation commissioned by the Policy and Evaluation Department of the Ministry of Foreign Affairs of the Netherlands (IOB). This work was supported by the German Federal Ministry for Economic Affairs and Energy and the Ministry of Innovation, Science, and Research of the State of North Rhine-Westphalia [Sondertatbestand – special grant] to JP and MS. Please cite the version of this paper published in the World Bank Economic Review (http://wber.oxfordjournals.org/).

More than 1.1 billion people in developing countries lack access to electricity. Some
590 million of them live in Africa, where the rural electrification rate is only 14 percent
(SE4All 2015). Providing access to electricity is an explicit goal of the sustainable
development goals (SDGs) and frequently considered a precondition for economic and
social development (UN 2005). Based on such assumptions, the United Nations aims
for universal access to electricity by 2030 via its initiative Sustainable Energy for All
(SE4All; see also UN 2010). The investment requirements to achieve this target are
enormous, estimated by the International Energy Agency (IEA) (2011) to be about 640
billion US Dollars.
In recent years, so‐called Pico‐Photovoltaic (Pico‐PV) kits have become a low‐cost
alternative to existing electrification technologies thanks to a substantial cost decrease
of photovoltaic and battery systems as well as energy saving LED lamps. Different
Pico‐PV kits exist that provide basic energy services like lighting, mobile phone
charging, and radio usage. In the SE4All initiative’s multi‐tier definition of what is
considered as modern energy, the Pico‐PV technology constitutes the Tier 1 and thus
the first step on the metaphoric energy ladder. Investment costs for Pico‐PV kits are
far lower than for the provision of on‐grid electricity or higher tier PV systems.
This paper investigates usage behavior and the changes in people’s living conditions
when households make this first step toward modern energy based on a randomized
controlled trial (RCT) that we implemented in rural Rwanda. The kit, which we
randomly assigned free of charge to 150 out of 300 households in 15 remote villages,
consists of a 1 Watt solar panel, a 40 lumen lamp, a telephone charger, and a radio—

and thereby just barely reaches the benchmark of what qualifies as modern energy
access in the SE4All framework. The market price of the full Pico‐PV kit is at around
30 USD. Our study population is the main target group of the Pico‐PV technology, that
is, the bottom‐of‐the‐pyramid living in a country’s periphery who will not be reached
by the electricity grid in the years to come and who will have problems to afford higher
tier PV systems.
We investigate the adoption of the Pico‐PV kit at both the extensive and the intensive
margin. At the extensive margin, we examine whether households actually use the
Pico‐PV kit. This is not obvious given that we distribute the kit for free and the
technology is new for the households. There is an intense debate in the development
community about usage intensity of freely distributed goods (see, e.g., Dupas 2014).
At the intensive margin, so conditional on households using the kit, we examine the
effects of Pico‐PV usage on three types of outcomes: energy expenditures, health and
environment, and productivity in domestic work. The amplitude of effects heavily
depends on usage behavior: is the kit used in addition or as a substitute to traditional
lighting sources like kerosene? Which household member uses the kit and for which
purposes? Do households expand their activities that require lighting into evening
hours, or do they just shift activities from daytime to nighttime? Does the total time
awake of household members change? Nonelectrified rural households in Africa are
increasingly using LED lamps that run on dry‐cell batteries. Since these batteries are
not disposed of appropriately and potentially harm the local environment, Pico‐PV
usage might also induce environmental benefits. We also analyze whether potential

productivity gains in domestic work release time that can now be dedicated to income
generating activities.
Our paper complements the seminal work of Furukawa (2014) who studies the effects
of Pico‐PV lamps on children’s learning outcomes in rural Uganda. We extend the
scope by examining the effects of Pico‐PV kits on various in‐house activities of all
household members, not only those of school children. We find that households use
the kits intensively in spite of the zero price and the novelty of the product.
Furthermore, the kit considerably reduces consumption of kerosene, candles, and dry‐
cell batteries and, in consequence, energy expenditures. The reduction of kerosene
improves household air quality and the reduction of dry‐cell battery consumption
plausibly leads to environmental benefits. Moreover, we find that children shift part
of their homework into the evening hours. Primary school boys even increase their
total study time. While parts of these effects are clearly internalized benefits, other
parts are important externalities, which may provide the cause for public subsidies, in
particular if it turns out that households are simply too poor to raise the upfront costs
alone.
The role of public policy in the promotion of Pico‐PV technology is not defined so far.
The expectation of the World Bank’s Lighting Global program, for example, as well as
other donors is that Pico‐PV kits make inroads to African households via commercial
markets, implying that end users pay cost‐covering prices (see Lighting Global 2016).
This might in fact work out for the relatively well‐off strata in rural areas but is much
more uncertain for the rural poor. In fact, the major target group of Pico‐PV kits within
the SE4All endeavor is located beyond the reach of the grid in remoter areas. These
households are short on cash, credit constrained, and might have more essential
priorities to spend their money on. If these groups in the periphery of the developing
world shall be reached by the SE4All initiative, direct subsidies or even a free
distribution might be required. This is indeed the policy intervention we mimic in our
study. From a welfare economics point of view this would be justified if the usage of
Pico‐PV kits generates private and social returns that outweigh the investment cost.
Our paper provides empirical substance to this debate.
So far, only very little evidence exists on the take‐up and impacts of Pico‐PV lamps. To
our knowledge, the only published study is Furukawa (2014), who concentrates on
educational outcomes alone. Furukawa randomized Pico‐PV lamps among 155
primary school students in Uganda who at baseline used kerosene wick lamps as the
main lighting source at home. Although Furukawa (2014) finds that children’s study
hours clearly increased among Pico‐PV lamp owners, he curiously observes
decreasing test scores. Furukawa tests different explanations of this “unexpected
result”. Without having the data at hand to obtain a robust answer, he hypothesizes
that the low power of the lamps and the inadequate recharging behavior could have
led to flickering light, which eventually worsened studying conditions. Based on this
experience, we will therefore carefully check the lighting quality and users’ satisfaction
in our experiment.
Much more evidence exists on the socioeconomic effects of classical rural
electrification programs using higher tier technologies, mostly the extension of the

electricity grid. These interventions differ from our randomized solar kit to the extent
that much higher effect sizes can be expected, but also much higher costs are incurred.
Nonetheless, this literature constitutes an important background of our work, in
particular those studies that explore the effects of electricity usage on similar
outcomes. Van de Walle et al. (2016) for instance find that in rural India electrification
led to a significant increase in households’ expenditures. For the case of a grid
extension program in El Salvador, Barron and Torero (2014, 2015) find reductions in
kerosene consumption, in particulate matter exposure, and respiratory disease
prevalence as well as an increase in study hours among children. The latter finding is
confirmed in a grid extension program in Bangladesh (Khandker et al. 2012) but not in
a previous study in Rwanda on the effects of mini‐grid electrification (Bensch et al.
2011). For South Africa and Nicaragua, respectively, Dinkelman (2011) and Grogan
and Sadanand (2013) provide evidence that the use of electricity saves women’s time
in household chores and leads to increased labor supply of women.1
In SE4All’s multi‐tier framework solar home systems are the intermediate step
between Pico‐PV and grid electricity. Samad et al. (2013) evaluate a solar home system
program in Bangladesh and find increases in evening study hours of school children,
TV usage, and female decision‐making power. They also find reduced kerosene
consumption and some moderate evidence for positive health effects. Bensch et al.
1 Further studies exist that examine whether on‐grid rural electrification programs can spur income generation and
economic growth (see, e.g., Bensch et al. 2011; Dinkelman 2011; Bernard 2012; Khandker et al. 2012, 2013; Grogan
and Sadanand 2013; Lipscom et al. 2013; Barron and Torero 2014; Lenz et al. 2016; Peters and Sievert 2016). As
discussed above, we do not expect the Pico‐PV systems to affect such outcomes.

(2013) confirm positive effects of solar home system usage on children’s studying
hours in Senegal.
It is the aim of our paper to extend the scope of this literature to the bottom step of the
energy ladder. Hence, these findings are important to classify our observations,
although of course the cost‐related and technological differences between on‐grid
electricity, 50 Watt solar home systems and our 1 Watt Pico‐PV kit have to be borne in
mind.
The remainder of the paper is organized as follows: Section I gives the policy and
country background. Section II provides theoretical considerations that will guide our
empirical analysis. Section III presents our experimental design. Section IV discusses
all results, and Section V concludes.
Background
Policy Background
In the absence of electricity, people in rural Sub‐Saharan Africa light their homes using
traditional lighting sources—candles or kerosene driven wick lamps and hurricane
lamps. In recent years, dry‐cell battery driven LED‐lamps have become available in
almost every rural shop and are increasingly used (see Bensch et al. 2015). The most
common ones are small LED‐torches and mobile LED‐lamps that exist in various
versions (see Figure 1). In addition, many rural households use hand‐crafted LED
lamps, that is, LED‐lamps that are removed from torches and installed somewhere in

the house or on a stick that can be carried around. For rural households in Africa,
expenditures for both traditional lighting sources and dry‐cell batteries constitute a
considerable part of their total expenditures. In very remote and poor areas, people
who are cash constrained generally use very little artificial lighting and sometimes
even only resort to the lighting that the cooking fire emits. For this stratum, the day
inevitably ends after sunset.
Figure 1: Traditional lighting devices
Hurricane
lamp
Traditional tin
lamp
Ready‐
made torch
Hand‐crafted
LED lamp
Mobile LED lamp
Source: Own illustration
Obviously, this lighting constraint restricts people in many regards. Activities after
nightfall are literally expensive but also difficult and tiring because of the low quality
of the lighting (see Section II for more information on lighting quality). At the same
time, it becomes evident that modern energy is not a binary situation. Rather, there are
several steps between a candle and an incandescent light bulb.
This continuum has sometimes been referred to as the energy ladder. In fact, SE4All has
defined different tiers of modern energy access within its Global Tracking Framework
(SE4All 2013) according to the electricity supply that is made available. For example,

a regular connection to the national grid qualifies as Tier 3, because it allows for using
general lighting, a television, and a fan the whole day. A solar home system would
qualify for Tier 1 or 2 (depending on its capacity). Tier 1 requires having access to a
peak capacity of at least 1 Watt and basic energy services comprising a task light and
a radio or a phone charger for four hours per day. The spread between the service
qualities of the different tiers is also reflected in the required investment costs: the
retail price of the Pico‐PV kit used in this study is at around 30 USD. The World Bank
(2009) estimates a cost range for on‐grid electrification in rural areas of 730 to 1450 USD
per connection.2
The promotion of Pico‐PV kits is most prominently pursued by the World Bank
program Lighting Global. Based on the assumption that the market for Pico‐PV systems
is threatened by a lack of information and information asymmetries, it provides
technical assistance to governments, conducts market research, facilitates access to
finance to market players, and has introduced a quality certificate for Pico‐PV systems.
The objective of Lighting Global’s initiative in the region, Lighting Africa, is to provide
access to certificated Pico‐PV kits to 250 million people by 2030. The Pico‐PV lantern
and the panel used for the present study were certified by Lighting Africa.3
2 The investment requirements calculated by IEA (2011) of additional 640 billion USD to achieve universal access
to electricity are based on electricity connections that provide a minimum level of electricity of 250 kWh per year.
This roughly corresponds to a Tier 2 electricity source. 3 At the point of the Pico‐PV kit’s certification, Lighting Africa did not yet issue certificates for mobile phone
charging and other services.

Country Background
Rwanda’s energy sector is undergoing an extensive transition with access to electricity
playing a dominating role. The Government of Rwanda’s goal is to increase the
electrification rate to 70 percent of the population by 2017/2018 and to full coverage by
2020. The key policy instrument clearly is the huge Electricity Access Roll‐Out
Program (EARP) that since 2009 quintuplicated the national connection rate to 24
percent country wide. Three further programs exist that have not been implemented
so far, though. First, the Government plans to establish a mechanism to provide the
poorest households (categorized as Ubudehe 1 according to the national poverty scale)
with a basic solar system corresponding to Tier 1 electricity access. Second, a risk
mitigation facility shall be established to encourage the private sector to increase sales
of solar products and services. Third, mini‐grids shall be developed by the private
sector (MININFRA 2016). These programs are complemented by the so‐called Bye Bye
Agatadowa initiative that aims at eliminating kerosene lamps completely from the
country.
In the absence of public promotion schemes, few private firms that sell Lighting Africa
verified Pico‐PV kits were active in the country at the time of the study
implementation. They operate mostly in the Rwandan capital Kigali and other cities.
In rural areas, Pico‐PV kits are sometimes available, but their retail price is much
higher compared to lower quality dry‐cell battery driven LED‐lamps that can be
bought in rural shops all over the country. These devices are not quality verified, but

cost only between 500 FRW (0.82 USD4) for hand‐crafted LED lamps and 3000 FRW
(4.95 USD) for an LED hurricane lamp. The battery costs to run an LED hurricane lamp
for one hour are around 0.01 USD. This is cheaper than running a kerosene driven wick
lamp (around 0.03 USD per hour) and the lighting quality is slightly better, which is
why many households are now using such ready‐made or hand‐crafted LED‐lamps.
Compared to both battery‐driven LED lamps and kerosene lamps, Pico‐PV kits
provide higher quality lighting (depending on the number of LED diodes) at zero
operating costs. Assuming that a household uses the lamp for four hours per day, the
investment into the Pico‐PV lamp used for this study amortizes after 10 months if a
ready‐made LED lamp is replaced and after less than 5 months if it replaces a kerosene
wick lamp.
Theoretical Considerations
Based on the literature on rural electrification presented in the Introduction, we
assume that the Pico‐PV treatment affects three dimensions of living conditions: First,
the budget effect which arises because households with access to a Pico‐PV kit
experience a change in the price of energy, while no (substantial) investment costs
occur as long as we assume that the Pico‐PV treatment is subsidized or distributed for
free. Second, health and environmental effects occur whenever Pico‐PV kits replace
kerosene lamps, candles, and dry‐cell batteries. A decrease in kerosene and candles
4 Exchange rate as of November 2011: 1 USD = 607 FRW.

consumption reduces household air pollution with potential effects on health (see Lam
et al. 2012; WHO 2016). Environmental benefits arise due to inappropriate dry‐cell
battery disposal (see Bensch et. al 2015) that is reduced if dry‐cell battery consumption
goes down. Third, we analyze the productivity of domestic production, that is,
production not intended to be traded on competitive markets. This we refer to as
domestic productivity effect in what follows. The reason for only focusing on domestic
production is that income in such remote rural areas is virtually only generated by
subsistence agriculture. The Pico‐PV kit, in turn, is too small to affect agricultural
production. For non‐agricultural products, access to markets is very limited and,
hence, local nonagricultural labor markets are nonexistent. At baseline, only seven
percent of head of household’s main occupation and one percent of spouse’s main
occupation was a non‐agricultural activity. Yet, since in theory the Pico‐PV kit could
liberate time from domestic labor and extend the time awake of household members,
we examine at least the time dedicated to any income generating activity (agricultural
and nonagricultural activities). Labor demand in such rural regions is too low, though,
to absorb increases in labor supply, and therefore measurable effects on
nonagricultural income cannot be expected.
The mechanism leading to the budget and health and environmental effects are quite
intuitive, whereas the transmission channel for the domestic productivity effect might
be less obvious. Productive activities at home include cooking, cleaning, and making
and repairing of household goods as well as studying and charging a cell phone.Since
the visual performance of humans strongly increases with the lighting level (Brainard

et al. 2001), we assume that the productivity in performing these activities increases
with the quantity and quality of light. Productivity in fine assembly work for instance
has been shown to increase by 28 percent as the lighting level increases from 500 to
1500 lumen (lm) (Lange 1999). But even increasing the lighting level from much lower
levels comes with significant productivity effects. Evidence comes for instance from
weaving mills (Lange 1999).5 The literature attributes good quality lighting to devices
that provide sufficient, nonglaring, nonflickering and uniform light, balanced
luminous distribution throughout the room, good color rendering and appropriate
light color (Lange 1999). Along all these criteria, the Pico‐PV kits perform better than
other traditional lighting devices such as kerosene lamps and candles, but also
compared to smaller hand‐crafted LED lamps. Our Pico‐PV lamp emits 40 lm, while a
candle only emits around 12 lm, a hurricane lamp used at full capacity around 32 lm
and large mobile LED lamps can reach levels around 100 lm (O’Sullivan and Barnes
2006). The LED lamps used in poor and remote areas are less luminous, though.
Lumen levels emitted by hand‐crafted LED lamps vary substantially depending on the
number and quality of diodes and batteries used. Two to three diode‐lamps connected
to a battery package emit about 10 lm.6
5 More evidence exists also on softer impacts such as a positive linkage between lighting and work mood (Kuller
and Wetterberg 1993; Boyce et al. 1997; Partonen and Lönnqvist 2000), fatigue (Daurat et al. 1993; Grunberger et
al. 1993; Begemann et al. 1997), and eye strain and headache (Wilkins et al. 1989, Kuller and Laike 1998) that can
be assumed to improve working performance. For a detailed presentation of the evidence for productivity effects
associated with light, see the supplemental appendix.
6 Since lumen numbers for these hand‐crafted lamps do not exist, we tested the two most widely used structures (a
two diode‐lamp and a three diode‐lamp structure) in a laboratory at University of Ulm, Germany, using standard
lumen emission test procedures. According to these tests, the level of emitted lumens by hand‐crafted LED lamps
is at around 10 lm.
One additional effect associated with a possible increase in radio usage is better access
to information, which in turn may have productivity effects if the information relates
to market data or can affect norms, such as gender norms for instance, and preferences
(Bertrand et al. 2006; Jensen and Oster 2009; La Ferrara et al. 2012; Sievert 2015).
Although we analyze whether radios are used with the Pico‐PV kit and display radio
ownership and usage in the supplemental appendix (see Appendix S5), we do not
further investigate any of these effects as most households use the Pico‐PV kit only for
lighting.
Research Approach and Data
Our identification strategy relies on the randomized assignment of Pico‐PV kits after
the baseline survey. The intention‐to‐treat effect (ITT) in our case is almost identical to
the average treatment effect on the treated (ATT) because of the high compliance rate
in the treatment group and no treatment contamination in the control group. Since all
results are robust with regard to both ways of estimating impacts, we show only the
more conservative ITT results.
Treatment
The randomized kits include a 1 Watt panel, a rechargeable 4‐LED‐diodes lamp (40
lumen maximum) including an installed battery, a mobile phone charger, a radio
including a charger, and a back‐up battery package (see Figure 2)Error! Reference

source not found..7 There are different options to use the panel. First, it can be used to
directly charge the lamp’s battery. After one day of solar charging it is fully charged.
The lamp can be used in three dimming levels and—fully charged—provides lighting
for between 6 and 30 hours depending on the chosen intensity level. Second, the kit
can be connected directly to the mobile phone connector plug and the radio connector
to charge mobile phones or the radio. Third, the kit can be used to charge the back‐up
battery package that can then be used to charge the other devices without sunlight.
The complete kit costs around 30 USD, the smallest version with only the solar panel
and an LED lamp including an installed battery costs around 16.50 USD.
Figure 2: The Pico‐PV kit
Source: Own illustration
Impact Indicators
As a precondition for the three effects on budget, health, and environment, and
domestic productivity the households’ usage behavior is our first matter of interest.
We look at usage and charging patterns of the Pico‐PV kit and analyze which of the
7 The kit used in our experiment provides more energy services than the solar lantern used by Furukawa (2014),
but the panel is also twice as large (1 Watt compared to 0.5 Watt).

different energy services—lighting, radio operation, and mobile phone charging—
households use most. Since the kit is mostly used for lighting (see below), we focus in
particular on this service.
For budget effects, we first look at changes in the price of the energy service. We
calculate the price per lighting hour and price per lumen hour the households effectively
pay. Second, we analyze whether price effects translate into a change in lighting
consumption. Here, we look at the average amount of lighting hours consumed per day
and lumen hours consumed per day. Lighting hours are calculated as the sum of usage
time of all lamps used during a typical day (including candles and ready‐made
torches). The price per lighting hour is calculated by dividing expenditures on lighting
fuels by the number of lighting hours consumed. For calculating lumen hours, we
multiply the lamp specific lighting hours with the amount of lumen emitted per lamp.
Finally, we look at changes in total energy expenditures and in the expenditures for the
different energy sources kerosene, batteries, and candles.
For health and environmental effects, we first explore reductions in kerosene and
candle consumption and to what extent this leads to a perceived improvement of air
quality, measured by the subjective assessment of the respondents. Also for measuring
the household members’ health status, we rely on self‐reported information on
whether any household member suffers from respiratory diseases and eye problems. We
distinguish between male and female adults as well as primary, and secondary school
children. We did not measure air quality or undertake any medical exams. For
environmental effects, we analyze reductions in dry‐cell battery consumption and the

way how households dispose of dry‐cell batteries.
In order to investigate domestic productivity effects, we look at the main users’
domestic labor activities exercised when using the Pico‐PV lamp. The main domestic
labor activity for adults is housework; children use the lamp mainly for studying. We
assess the increase of domestic productivity by analyzing the lighting source used for
these respective activities. Based on the evidence from the literature presented in
Section II and the supplemental appendix, we assume that households become more
productive when they switch from a lower quality lighting source or no artificial
lighting to the Pico‐PV lamp. This seems reasonable since even at day time, the typical
dwelling in rural Rwanda is quite dark. Windows are small in order to keep the rain
and the heat out of the inner of the dwelling. To analyze lamp switching, we
enumerated all lamps in each household interview and asked respondents to name all
users for each lamp and the respective purpose of using it. The information on time
spent on different activities was elicited in the interviews through an activity profile
for each household member. If a certain activity pursued by the household is not
associated with one of the employed lamps, we assume that no specific lighting device
is used for this activity, and it is either exercised using daylight, or using indirect
lighting from the fireplace or lamps used for other household tasks.
In order to analyze whether the higher productivity also leads to an increase in total
domestic labor input, we analyze the total amount of time dedicated to domestic labor per
day. We furthermore examine whether total time household members are awake changes
due to increased lighting availability and whether time dedicated to income generating

activities changes as a result of time savings in domestic production.
RCT Implementation
The key facts of the implementation are presented in Table 1. A detailed description of
the implementation including a map of the survey area and a figure illustrating the
participant flow can be found in the supplemental appendix. A discussion of the
external validity of our results is also presented in the supplemental appendix.
Table 1. Key Facts on RCT Implementation
Baseline survey November 2011
Delivery of Pico‐PV kits December 2011
Follow‐up survey June 2012
Study population 15 nonadjoined communities in four rural districts of Rwanda
located in the Northern, Western and Southern Province.
No Pico‐PV kits available on the market
~5.5 hours of sunlight per day (which is similar to country average)
Sample 300 randomly sampled households
Randomization
Stratified randomization and additional re‐randomization using
minmax t‐stat method at the household level; random assignment of
150 Pico‐PV kits
Stratification criteria Consumed lighting hours per day, usage of mobile phones (binary),
radio usage (binary), and district
Re‐randomization
Balancing criteria are marked in The surveyed households are
mainly subsistence farmers that live in very
modest conditions. The educational level of the
head of household is low and households own

only a few durable consumption goods. The
households in our sample have cash expenditures
of on average 0.45 USD (1.12 USD PPP) a day per
person with the lower 25%‐stratum having only
0.07 USD (0.18 USD PPP). Even the upper quartile
has cash expenditures of 1.14 USD (2.86 USD PPP)
only. By any standard, the sampled households
qualify as extremely poor.
Also energy consumption patterns illustrate the
precarious situation of most households (see
Table 3). They consume on average only around
three hours of artificial lighting per day which is
mainly provided through kerosene wick lamps or
battery‐driven small hand‐crafted LED lamps.
Around 11 percent of households even do not use
any artificial lighting devices and rely only on
lighting from the fireplace after nightfall. For the
baseline values, we calculate lighting hours as the
sum of lighting usage per day across all used lamps,
excluding candles and torches, for which we did not
elicit usage hours at the baseline stage. Almost 65
percent of the household own a radio, around 40
percent have a cell phone.
Table 2 and
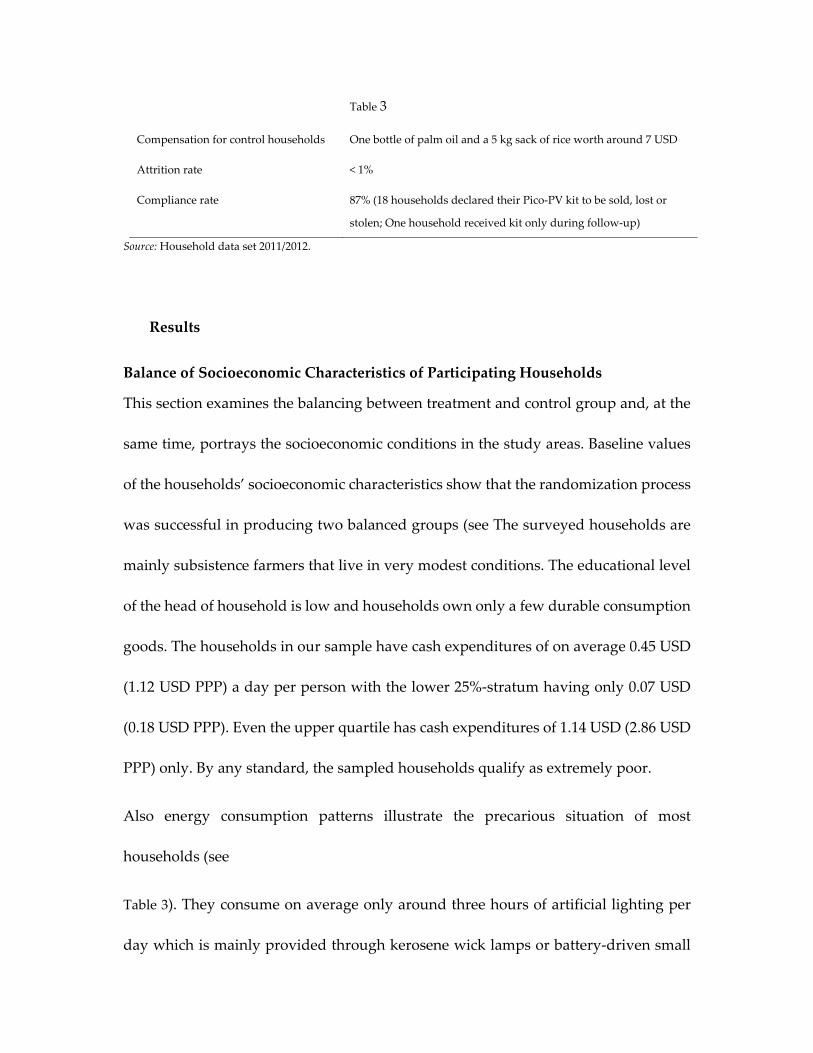
Table 3
Compensation for control households One bottle of palm oil and a 5 kg sack of rice worth around 7 USD
Attrition rate < 1%
Compliance rate 87% (18 households declared their Pico‐PV kit to be sold, lost or
stolen; One household received kit only during follow‐up)
Source: Household data set 2011/2012.
Results
Balance of Socioeconomic Characteristics of Participating Households
This section examines the balancing between treatment and control group and, at the
same time, portrays the socioeconomic conditions in the study areas. Baseline values
of the households’ socioeconomic characteristics show that the randomization process
was successful in producing two balanced groups (see The surveyed households are
mainly subsistence farmers that live in very modest conditions. The educational level
of the head of household is low and households own only a few durable consumption
goods. The households in our sample have cash expenditures of on average 0.45 USD
(1.12 USD PPP) a day per person with the lower 25%‐stratum having only 0.07 USD
(0.18 USD PPP). Even the upper quartile has cash expenditures of 1.14 USD (2.86 USD
PPP) only. By any standard, the sampled households qualify as extremely poor.
Also energy consumption patterns illustrate the precarious situation of most
households (see
Table 3). They consume on average only around three hours of artificial lighting per
day which is mainly provided through kerosene wick lamps or battery‐driven small

hand‐crafted LED lamps. Around 11 percent of households even do not use any
artificial lighting devices and rely only on lighting from the fireplace after nightfall.
For the baseline values, we calculate lighting hours as the sum of lighting usage per
day across all used lamps, excluding candles and torches, for which we did not elicit
usage hours at the baseline stage. Almost 65 percent of the household own a radio,
around 40 percent have a cell phone.
Table 2).
The surveyed households are mainly subsistence farmers that live in very modest
conditions. The educational level of the head of household is low and households own
only a few durable consumption goods. The households in our sample have cash
expenditures of on average 0.45 USD (1.12 USD PPP) a day per person with the lower
25%‐stratum having only 0.07 USD (0.18 USD PPP). Even the upper quartile has cash
expenditures of 1.14 USD (2.86 USD PPP) only. By any standard, the sampled
households qualify as extremely poor.
Also energy consumption patterns illustrate the precarious situation of most
households (see
Table 3). They consume on average only around three hours of artificial lighting per
day which is mainly provided through kerosene wick lamps or battery‐driven small
hand‐crafted LED lamps. Around 11 percent of households even do not use any
artificial lighting devices and rely only on lighting from the fireplace after nightfall.
For the baseline values, we calculate lighting hours as the sum of lighting usage per
day across all used lamps, excluding candles and torches, for which we did not elicit
usage hours at the baseline stage. Almost 65 percent of the household own a radio,
around 40 percent have a cell phone.
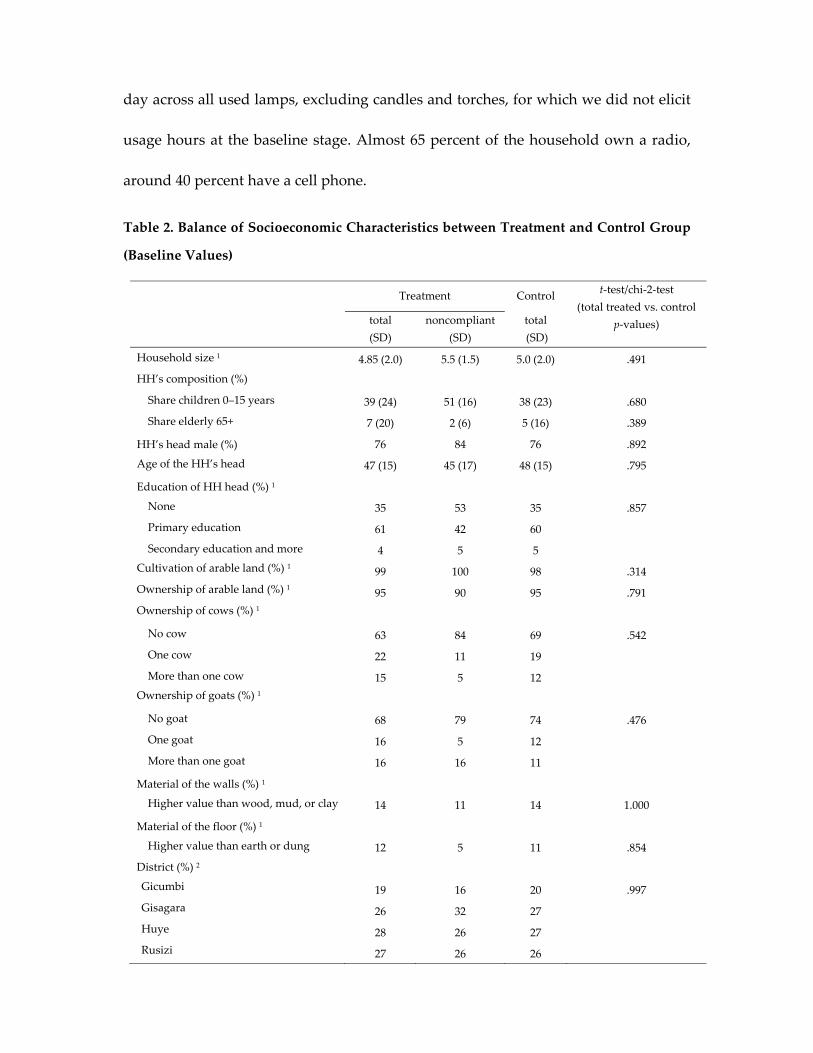
Table 2. Balance of Socioeconomic Characteristics between Treatment and Control Group
(Baseline Values)
Treatment Control
t‐test/chi‐2‐test
(total treated vs. control
p‐values)
total
(SD)
noncompliant
(SD)
total
(SD)
Household size 1 4.85 (2.0) 5.5 (1.5) 5.0 (2.0) .491
HH’s composition (%)
Share children 0–15 years 39 (24) 51 (16) 38 (23) .680
Share elderly 65+ 7 (20) 2 (6) 5 (16) .389
HH’s head male (%) 76 84 76 .892
Age of the HH’s head 47 (15) 45 (17) 48 (15) .795
Education of HH head (%) 1
None 35 53 35 .857
Primary education 61 42 60
Secondary education and more 4 5 5
Cultivation of arable land (%) 1 99 100 98 .314
Ownership of arable land (%) 1 95 90 95 .791
Ownership of cows (%) 1
No cow 63 84 69 .542
One cow 22 11 19
More than one cow 15 5 12
Ownership of goats (%) 1
No goat 68 79 74 .476
One goat 16 5 12
More than one goat 16 16 11
Material of the walls (%) 1
Higher value than wood, mud, or clay 14 11 14 1.000
Material of the floor (%) 1
Higher value than earth or dung 12 5 11 .854
District (%) 2
Gicumbi 19 16 20 .997
Gisagara 26 32 27
Huye 28 26 27
Rusizi 27 26 26
Number of observations 148 19 148
Note: 1 Used for re‐randomization; 2 used for stratification.
Source: Household data set 2011.
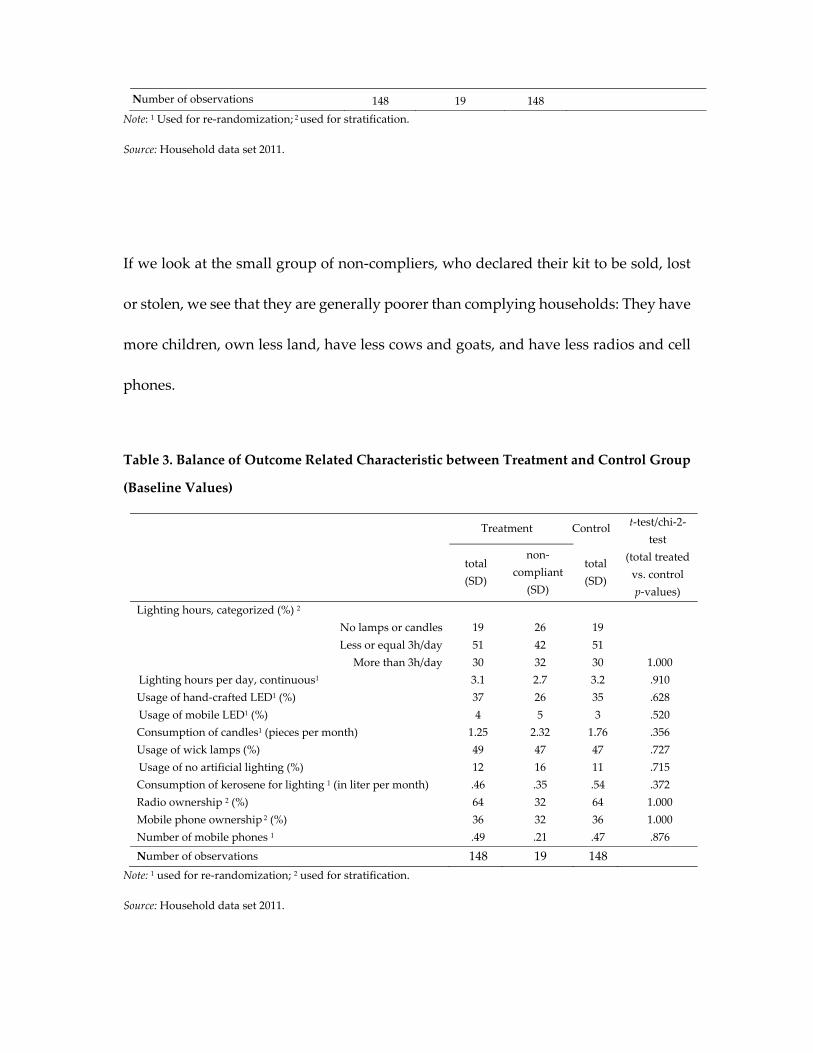
If we look at the small group of non‐compliers, who declared their kit to be sold, lost
or stolen, we see that they are generally poorer than complying households: They have
more children, own less land, have less cows and goats, and have less radios and cell
phones.
Table 3. Balance of Outcome Related Characteristic between Treatment and Control Group
(Baseline Values)
Treatment Control t‐test/chi‐2‐
test
(total treated
vs. control
p‐values)
total
(SD)
non‐
compliant
(SD)
total
(SD)
Lighting hours, categorized (%) 2
No lamps or candles 19 26 19
Less or equal 3h/day 51 42 51
More than 3h/day 30 32 30 1.000
Lighting hours per day, continuous1 3.1 2.7 3.2 .910
Usage of hand‐crafted LED1 (%) 37 26 35 .628
Usage of mobile LED1 (%) 4 5 3 .520
Consumption of candles1 (pieces per month) 1.25 2.32 1.76 .356
Usage of wick lamps (%) 49 47 47 .727
Usage of no artificial lighting (%) 12 16 11 .715
Consumption of kerosene for lighting 1 (in liter per month) .46 .35 .54 .372
Radio ownership 2 (%) 64 32 64 1.000
Mobile phone ownership 2 (%) 36 32 36 1.000
Number of mobile phones 1 .49 .21 .47 .876
Number of observations 148 19 148
Note: 1 used for re‐randomization; 2 used for stratification.
Source: Household data set 2011.

Impact Assessment
Take‐Up and Lighting Usage
Among the 131 households that still have a Pico‐PV kit when interviewed in the
follow‐up survey, usage rates are very high (see Table 4). In sum, 86 percent use the
kit at least once per day, primarily for lighting. Radio and especially cell phone
charging usage rates are rather low. Most households report that both the radio and
the cell phone charger were very difficult to use with the kit, which was confirmed by
technical inspectors involved in testing the kit for Lighting Africa. The major reason
for this seems to be the low capacity of the panel, which only allows for charging all
devices completely within one day if the daily sunlight is exploited at a maximum. In
practice, households used the charging capacities mainly for the lighting device. Given
this preference for lighting, too little capacity is left for the other two services. For cell
phone charging, noncompatibility of the solar charger with some of the widely used
cell phone types in rural Rwanda posed additional problems. In line with these
technical deficiencies and the households’ expressed priorities for lighting, charging
patterns are dominated by the lamp: most of the time, the kit is used to charge the lamp
(26 hours per week), followed by operating the radio (20 hours). It is hardly used to
charge a cell phone (only two hours8).
Due to the technical drawbacks of the Pico‐PV kit, we will concentrate in the following
on effects related to the usage of improved lighting service. Virtually all kit owning
8 The share of households using the kit for cell phone charging is very low at less than ten percent. Those households
that do charge their phone with the kit charge it 19 hours per week.

households predominantly use it for lighting.9 Some details on radio usage, preferred
programs and other information sources are shown in the supplemental appendix.10
The Pico‐PV lamps are mainly used by female adults, followed by male adults (see
Table 4). Children use the lamps less frequently.
Traditional lamp usage goes down substantially, with 47 percent of the treatment
group using exclusively the Pico‐PV lamp for lighting purposes.11 While treatment
group households use on average 0.8 traditional lamps (any type, including candles),
control group households use 1.4 traditional lamps implying that the Pico‐PV lamps
have replaced half of the traditional lighting sources. Treatment households use above
all significantly less wick lamps and hand‐crafted LED lamps, but also less ready‐made
torches, hurricane lamps, and mobile LED lamps. The share of households that do not
use any artificial lighting source, amounting to nine percent in the control group, still
reaches five percent among treatment households. They either belong to the group of
non‐compliers or to the households with technical problems with the Pico‐PV lamp.
Table 4. Usage of Pico‐PV Kits (Share of Treatment Households in Percent)
9 The only exceptions are four households that reported to have technical problems with the lamp and cannot use
it for this reason. 10 It can be seen that radio usage significantly increased in the treatment group, on average and across all types of
household members. Adults listen above all to news on the radio, while children listen to music. Consequently,
radio is substantially more often the main source of information for treatment households. In the control group
community gatherings constitute typically a more important source of information.
11 Table S6.1 in the supplemental appendix shows a comprehensive presentation of lamp usage in the treatment
and the control group.

Share of treatment households…
(in parentheses: only compliant households) %
Pico‐PV lamp is mainly used by… %
using the kit at least once a day 86 (95) Female adult >17 years old 49
…using the kit for lighting 85 (97) Male adult >17 years old 23
…using the kit for listening to the radio 68 (79) Female between 12 and 17 years old 10
…using the kit for charging mobile phones 10 (11) Male between 12 and 17 years old 7
…use the battery pack 65 (71) Collectively used by whole family 6
Children between six and 11 years old 5
Source: Household data set 2012.
Most lamp users are satisfied with the lighting quality of the lamp. More than 70
percent of all lamp users report they are “always” or “often” satisfied with the lighting
quality. Only 22 percent report to be satisfied only seldom and six percent are never
satisfied. Satisfaction levels with traditional lamps are substantially lower. For wick
lamps and hand‐crafted LED lamps, 94 percent and 91 percent, respectively, report to
be satisfied seldom or never.
Since both treatment and control households are located within the same communities,
spill‐over effects might occur. Especially children often meet and play with friends and
there might be positive spill‐over effects on other households’ children. If among these
‘other’ households are households from our control group, it may even downward
bias our impact estimates. Yet we did not find any evidence for spill‐overs. For
instance, in the control group the share of children studying outside their home did
not increase and is negligible at less than one percent. More generally, the qualitative
interviews we conducted did not provide any indication for joint activities using the
kits and hence spill‐overs of that sort.

Budget Effects and Kerosene Consumption
Looking at the price per consumed lighting hour and the price per consumed lumen hour
(Table 5), households in the control group pay approximately five times as much per
lighting hour as households in the treatment group (950 FRW vs. 180 FRW; 1.56 USD
vs. 0.30 USD). The difference is obviously even more pronounced for the price per
lumen hour: A household in the control group pays seven times more per lumen hour
than a household in the treatment group (70 FRW vs. 9 FRW; 0.12 USD vs. 0.02 USD).
This reduction in lighting costs effectively translates into a strong increase in the
amount of lumen hours consumed per day in treated households, which is more than two
times as high as in control‐group households (see Table 5)—reflecting the very poor
lighting quality of traditional lighting sources. Yet, also without accounting for the
improved quality of lighting, the Pico‐PV kit leads to an increase in lighting
consumption. The amount of lighting hours consumed per day is significantly higher in
the treatment group after having received the Pico‐PV lamp.
Table 5. Price and Consumption of Lighting Energy
Treatment Control ITT p‐value
Cost per lighting hour (in FRW per 100 hours) 176 950 ‐702 .000
Cost per lumen hour (in FRW per 100 hours) 9 70 ‐57 .000
Lighting hours consumed per day 4.43 3.85 0.59 .074
Lumen hours consumed per day 142 61 78 .000
Note: The ITT depicts the difference in means at the follow‐up stage between the whole treatment and control group,
including also non‐complying households. We control for all stratification and re‐randomization characteristics.

Detailed estimation results can be found in the supplemental appendix. Exchange rate as of November 2011: 1 USD
= 607 FRW.
Source: Household data set 2011/2012.
Looking at total energy expenditure (Table 6. Expenditures per Month per Category (in FRW)
Treatment Control ITT
p‐
value
Candles 42 109 ‐20 .339
Kerosene for lighting 155 609 ‐418 .000
Big batteries (Type D) 358 352 ‐9 .750
Small batteries (Type AA) 30 72 ‐43 .003
Mobile phone charging 407 520 ‐68 .407
Total traditional energy sources (without cooking energy) 993 1,662 ‐557 .000
Total expenditures 37,971 31,334 7,249 .276
Share of energy expenditure on total expenditures 0.04 0.07 ‐0.03 .001
Note: The ITT depicts the difference in means at the follow‐up stage between the whole treatment and control group,
including also non‐complying households. We control for all stratification and re‐randomization characteristics.
Detailed estimation results can be found in the supplemental appendix. Exchange rate as of November 2011: 1 USD
= 607 FRW).
Source: Household data set 2011/2012.
As a consequence, we observe a significant reduction in expenditures for small
batteries, but not for the larger batteries since households use their Pico‐PV kit
predominantly for lighting but only very seldom to run their radio. The consumption
of candles is also significantly reduced. In addition, we find a moderate reduction in
expenditures on cell phone charging, although the difference is not significant.
Estimating an ATT only among mobile phone users by employing the random
treatment assignment as an instrument shows a statistically significant reduction of
costs for phone charging of 1,662 FRW (2.74 USD). The average household that pays

for charging the mobile phone pays 1,400 FRW per month (2.31 USD).
In total, energy expenditures without cooking energy are 557 FRW (0.92 USD PPP)
lower in the treatment group. This difference is statistically significant. If we compare
this to the total household expenditures it shows the importance of energy
expenditures for the household budget: The share of energy expenditures without
cooking decreases by three percentage points from seven percent to four percent.
), we observe that households spend around five percent of their overall expenditures
on kerosene, candles, and dry‐cell batteries. In treated households we expect a
significant decrease of expenditures for kerosene, candles and dry‐cell batteries. In
fact, we observe a significant and considerable drop of kerosene expenditures by
almost 70 percent. Two types of dry‐cell batteries are used in our sample, big (Type D)
and small (Type AA) batteries. While more than 90 percent of small batteries are used
for lighting, more than three‐fourths of big batteries are used for radios.
Table 6. Expenditures per Month per Category (in FRW)
Treatment Control ITT
p‐
value
Candles 42 109 ‐20 .339
Kerosene for lighting 155 609 ‐418 .000
Big batteries (Type D) 358 352 ‐9 .750
Small batteries (Type AA) 30 72 ‐43 .003
Mobile phone charging 407 520 ‐68 .407
Total traditional energy sources (without cooking energy) 993 1,662 ‐557 .000

Total expenditures 12 37,971 31,334 7,249 .276
Share of energy expenditure on total expenditures 0.04 0.07 ‐0.03 .001
Note: The ITT depicts the difference in means at the follow‐up stage between the whole treatment and control group,
including also non‐complying households. We control for all stratification and re‐randomization characteristics.
Detailed estimation results can be found in the supplemental appendix. Exchange rate as of November 2011: 1 USD
= 607 FRW).
Source: Household data set 2011/2012.
As a consequence, we observe a significant reduction in expenditures for small
batteries, but not for the larger batteries since households use their Pico‐PV kit
predominantly for lighting but only very seldom to run their radio. The consumption
of candles is also significantly reduced. In addition, we find a moderate reduction in
expenditures on cell phone charging, although the difference is not significant.
Estimating an ATT only among mobile phone users by employing the random
treatment assignment as an instrument shows a statistically significant reduction of
costs for phone charging of 1,662 FRW (2.74 USD). The average household that pays
for charging the mobile phone pays 1,400 FRW per month (2.31 USD).
In total, energy expenditures without cooking energy are 557 FRW (0.92 USD PPP)
lower in the treatment group. This difference is statistically significant. If we compare
this to the total household expenditures it shows the importance of energy
expenditures for the household budget: The share of energy expenditures without
cooking decreases by three percentage points from seven percent to four percent.
12 This difference seems not to be driven by the treatment. The (nonsignificant) difference in total expenditures
had already existed at baseline. Moreover, the different subcategories of expenditures do not show any significant changes over time neither.

Health and Environmental Effects
The combustion of kerosene is associated with harmful emissions that can lead to
respiratory diseases (WHO 2016). Although the relative contribution of kerosene
lamps to household air pollution is rather low compared to firewood and charcoal
usage for cooking purposes, it is the immediate exposure of people sitting next to a
wick lamp for a specific task (e.g., studying), that makes kerosene a substantial health
threat (Lam et al. 2012).
Indeed, in our sample kerosene lamps are above all used by children for studying and
by women for cooking. In qualitative in‐depth interviews preceding the baseline
survey many households complained about sooty kerosene lamps leading to recurring
eye problems and kids having black nasal mucus. We therefore examined the extent
to which the decrease in kerosene lamp usage translates into a perceived improvement
of air quality and, potentially, into a decrease in respiratory disease symptoms and eye
problems. At the baseline stage the judgement of most households (around 67 percent
in both groups) was that air quality in their houses was good, in the follow‐up survey
45 percent of treated households and only three percent of control households say that
the air quality in their homes has improved in comparison to the baseline period. In
an open question, virtually all treated households ascribe this improvement to the
Pico‐PV lamp. Looking at self‐reported health indicators, though, we cannot confirm
that this improved air quality leads to a better health status of the household members,
which is not surprising given that cooking fuels are still the dominating source of
household air pollution.13
Households in nonelectrified areas in Africa are increasingly using dry‐cell batteries
and LED lamps to light their homes. Therefore, a potential reduction in dry‐cell
batteries deserves special attention because they might contain harmful materials and
a proper collection system does not exist. In fact, in our sample 95 percent of
households throw discharged batteries into their pit latrines, that is, nonsealed 3–4
meter holes in their backyard. Two percent of the households collect them with their
garbage, and three percent throw them away somewhere in their backyard. Hence,
potentially toxic substances can be expected to enter the groundwater. The extent to
which this poses a threat to people’s health is unclear, as little is known about this
process, neither in Rwanda nor elsewhere (see also Bensch et al. 2015).
Domestic Productivity Effects
Building on the substantial usage of the Pico‐PV lamp we examine the extent to which
this induces a potential gain in domestic productivity. For this purpose, we look at the
main users’ activities exercised when using the Pico‐PV lamp and—in order to assess
the extent of the quality improvement—which lighting sources are used among
households in the control group for the respective activity.
The most frequent users of the Pico‐PV lamp are female adults, of which 87 percent
use the lamp mainly for housework (see Table 7). Housework done by women refers
13 See supplemental appendix, Table S6.2, for more detailed results.

above all to cooking but also includes, for example, child caring, preparing the beds
before going to sleep, and repairing clothes. The Pico‐PV lamp replaces above all wick
lamps and is used by female adults that had not been using any particular lighting
device before.14 Male adults also use the lamp mostly for housework, although these
are more diverse activities than for women. For male adults, the Pico‐PV lamp replaces
wick lamps, ready‐made torches, and hand‐crafted LEDs and is also used by men who
had not used any artificial lighting device before for housework activities.
Table 7. Activity Using Pico‐PV Lamp, Adults and Children in Treatment Households (%)
First Activity Second Activity Third Activity
Female adult >17 years old N=149 Housework 87 Study 5 Eat 4
Male adult >17 years old N=60 Housework 71 Recreation 10 Study 10
Children 6 to 17 years old N=56 Study 75 Housework 16 Recreation 4
Note: Information on activities stem from an open question among treatment households at follow‐up, asking for
the main activities the different lamp users are exercising while using the lamp.
Source: Household data set 2011/2012.
Table 8 shows that housework is done primarily during daytime, also in the treatment
group, and the total time dedicated to domestic work per day does not change
significantly. The total time household members are awake per day does not change
significantly, either. This reveals that the Pico‐PV lamp is also used during daytime for
housework activities, which is in line with observations made during qualitative
14 We analyse lamp switching by comparing lamps used for the corresponding activities by treatment and control
households. Detailed results of the analysis can be found in the supplemental appendix, Table S6.3.

interviews: the typical Rwandan dwelling is quite dark even during the daytime and
people sometimes use artificial lighting in their homes. To the extent the Pico‐PV lamp
replaces a traditional lighting source for their daytime housework activity, lighting
quality clearly improves. Yet, people might also relocate outside activities indoors and
replace natural daylight by the Pico‐PV lamp. In this case, lighting quality would
probably not improve, but still it demonstrates the higher flexibility people have in
organizing their daily tasks.
Table 8. Daily Time Awake, Time Spent on Domestic Labor and Any Income Generating
Activity
Treatment Control ITT p‐value
Time awake
Head of household 14h28 14h27 0h05 .739
Spouse 14h46 14h36 0h11 .378
Domestic labor
Head of household, total 2h08 2h10 ‐0h01 .950
Head of household, after nightfall 0h16 0h12 0h04 .542
Spouse, total 2h48 2h30 0h16 .333
Spouse, after nightfall 0h32 0h31 0h02 .779
Any income generating activity of subsistence
farmers
Head of household, total 5h37 5h29 0h21 .215
Head of household, after nightfall 0h01 0h01 0h00 .823
Spouse, total 5h37 5h25 0h10 .354
Spouse, after nightfall 0h00 0h01 0h00 .462
Note: The ITT depicts the difference in means at the follow‐up stage between the whole treatment and control group,

including also non‐complying households. We control for stratum dummies and re‐randomization characteristics.
Detailed estimation results can be found in the supplemental appendix.
Source: Household data set 2011/2012.
Moreover, Table 8 probes into the question whether time dedicated to any income
generating activity increases, which might happen because the higher domestic
productivity could set free time for other purposes. We concentrate our analysis on
subsistence farmers that constitute 86 percent of household heads and 85 percent of
spouses at baseline.15 Both the head of household and the spouse slightly increase the
time they dedicate to income generation (by six and three percent, respectively), but
this difference is not statistically significant.
The third most important user group are children between six and 17 years. They use
the Pico‐PV lamp mainly for studying (see Table 7). In order to understand changes in
the productivity of studying at home, we first need to analyze children’s study
patterns and how they divide their study time between daylight time and evening.
As can be seen in Table 9, in around one‐third of the households with children at school
age, children do not study after school. There is no significant difference between
households in the control and treatment groups. The share of children studying after
15 We distinguish as income generating activities between subsistence farmers, governmental employees,
independent occupations, and other dependent occupations. The group sizes of the latter three are small at n=2,
n=1, and n=2 for spouses and n=4, n=11, and n=9 for head of households. Therefore, these groups are very
unbalanced across treatment and control households at baseline (see Table S6.4 in the supplemental appendix).
When estimating effects on time dedicated to income generation including these occupation groups, we find a
significant postive effect for overall income generation time for spouses. This difference is driven, however, by
these non‐balanced sub‐groups and can thus not be interpreted as an effect.

nightfall, though, is significantly higher in the treated group. The total study time, that
is, after nightfall and during daytime, increases only for male primary school children.
Female primary school children just shift their study time from afternoon hours to the
evening leading to an increase in study time after nightfall. For secondary school
children we do not observe any significant changes. Hence, the Pico‐PV kits benefit
primarily younger children. Besides the increase of total study time for primary school
boys, it seems to increase the flexibility in girl’s time allocation, although we do not
detect whether they use the freed time during the day for domestic work or recreation.
In any case, at least for those children who used wick lamps before, the lighting and
air quality increases.
Table 9. Study Pattern (Only HH with Children at School Age; 6–17 years)
N Treatment Control ITT p‐value
Share of HH with children studying after
school
209 67 61 5 .369
Share of HH with children studying after
nightfall
209 26 14 14 .006
Daily study time after school (in minutes)
male children 6‐11, total 100 0h37 0h26 0h13 .009
male children 6‐11, after nightfall 100 0h29 0h12 0h12 .045
female children 6‐11, total 92 0h51 0h30 0h12 .533
female children 6‐11, after nightfall 92 0h27 0h11 0h11 .090
male children 12‐17, total 89 1h01 0h54 0h21 .191
male children 12‐17, after nightfall 89 0h50 0h32 0h14 .382
female children 12‐17, total 94 1h02 0h58 0h10 .327
female children 12‐17, after nightfall 94 0h44 0h37 0h10 .191
Note: The ITT depicts the difference in means at the follow‐up stage between the whole treatment and control group,
including also non‐complying households. We control for all stratification and re‐randomization characteristics.
Detailed estimation results can be found in the supplemental appendix.
Source: Household data set 2011/2012.
Altogether, we observe an effect of Pico‐PV kit ownership on time dedicated to
domestic activities only in the case of study time of primary school boys. For other
Pico‐PV users, we only observe a higher flexibility in organizing their domestic duties.
Moreover, it is plausible to expect that the improved lighting also increases the
effectiveness of the tasks it is used for. Quantifying this effect is beyond the scope of
our study, though. At least for the case of students’ school test‐scores the Furukawa
(2014) results advise some caution in making hasty statements about improving
learning outcomes based on longer study times and better light.16
Conclusion
Our results show that simple but quality verified Pico‐PV kits in fact constitute an
improvement compared to the baseline energy sources, mostly dry‐cell batteries and
kerosene. Given the small size of the panel, the charging capacity is obviously not
abundantly available, and many households did not manage to use the panel for
charging the radio and mobile phones; lighting turned out to be the most often used
16 Remember that Furukawa (2014) observes even a decline of school children’s test scores in spite of an increase in
study time in an RCT using solar lanterns in Uganda. One explanation for this puzzling outcome he provides is
the potentially bad lighting quality of the solar lamp. In our case, we have no indication for such a bad lighting
quality and we believe this would have been disclosed in the various qualitative interviews we conducted (in
which many other problems were discussed pretty openly, see Section IV).

service. In these remote and poor areas, lighting is a scarce good and the lamp was
indeed intensively used by virtually all treatment group households leading to
increases in both the quality and the quantity of lighting usage.
The most important finding of our study is that total energy expenditures and
expenditures for dry‐cell batteries and kerosene go down considerably. This shows
that beneficiaries substitute traditional energy sources instead of just increasing their
energy consumption. Beyond the direct effect this has on household welfare, the usage
of the lamp also implies social returns. It induces advantages for people’s health
because kerosene usage is associated with harmful smoke emissions and the
environment because dry‐cell batteries are usually disposed of in unprotected latrines
or in the landscape. Since households in rural Sub‐Saharan Africa are rapidly
switching from kerosene or candles to LED‐lamps that run on dry‐cell batteries this
finding deserves particular attention.
In addition, we find that beneficiaries use the kit for various domestic production
activities like cooking or studying. Although we cannot quantify the benefits, evidence
from the literature strongly suggests that the solar lamp allows doing these activities
better and faster than with traditional lighting sources, which plausibly results in an
overall increase in domestic output. The solar lamp also enables households to allocate
their time more freely and to shift activities toward the evening hours. School children,
for example, find better and more flexible studying conditions thanks to the improved
lighting source. Even if this does not lead to an immediate measurable increase in
domestic output, pursuing the activities with better light and in a more flexible way

will at least reduce the effort that is needed to undertake household chores. This would
still be an important improvement of household’s living conditions.
While ultimate poverty impacts on, for example, income or educational investments
might be small compared to productivity gains associated with bigger infrastructure
interventions, these effects are still considerable from the poor’s perspective,
particularly having in mind the low investment costs of the intervention at 30 USD per
kit.
Our results hence substantiate the Tier‐1‐threshold of modern energy access in the
SE4All Global Tracking Framework. The Pico‐PV kits can in fact meet the need for
basic energy services in poor areas where energy consumption is still at a very low
level. Yet, comparing our findings to more advanced regions and larger interventions,
such as grid extension, it also becomes evident that Pico‐PV kits cannot satisfy the
whole portfolio of energy demand (Lenz et al. 2016). Hence, in many not so remote
areas Pico‐PV kits can be considered as either a complement to a grid connection for
backup purposes or as a bridging technology toward a grid connection at a later point
in time. For very poor areas in the periphery of a country as studied in this paper, in
contrast, Pico‐PV is in many cases the only option to obtain modern energy because,
first, these regions are beyond the reach of the electricity grid for many years to come
and, second, other off‐grid solutions such as larger solar home systems are too
expensive. We therefore argue that households in such remote areas are the major
target group of Tier 1 energy systems within the SE4All initiative.
What is crucial for the acceptance of this new technology is the proper functioning and

ease in usage of the kit—in particular if the objective is to set up a market as pursued
by programs like Lighting Africa. It has turned out that a relatively mature product
such as the Pico‐PV kit used in this study, of which the principal components had been
tested and certified by Lighting Africa as well as massively sold in other countries,
might still exhibit technical problems under real usage conditions. This is in line with
findings of Furukawa (2014) who observes that insufficient charging under real usage
conditions led to flickering light quality. Testing and certification procedures as well
as the development of comprehensible usage guidelines should therefore encompass
a strong component of field tests and not only laboratory examinations. This is
particularly important in the light of the rapid penetration of rural Africa with non‐
branded LED lamps that has occurred in recent years (see Bensch et al. 2015). In terms
of lighting quality, these dry‐cell battery‐run lamps are on a par with Pico‐PV kits.
Nonetheless, Pico‐PV kits that meet quality standards in terms of usability and lifetime
are a worthwhile investment. If kerosene or dry‐cell batteries are replaced, households
with consumption patterns as observed in our research economize on average 0.95
USD PPP per month, which is around two percent of monthly household
expenditures. The investment into the Pico‐PV kit then pays off after 18 months, which
is less than its life‐span of 2–3 years, but the interplay of cash and credit constraints,
the lack of information, and high discount rates will make most households forego this
investment.
This claim points at a dilemma of Lighting Africa and other donor and governmental
interventions, which intend to disseminate Pico‐PV kits via sustainable markets as a

contribution to SE4All: The major target population will hardly be able to bring up the
required investment. Financing schemes might in some regions be an obvious solution.
But given the long pay‐off period for the bottom of the income distribution and
noninternalized advantages, such financing schemes are probably not effective. At the
same time, if it is clearly the political will both in national governments and among the
international community to provide electricity also to the very poor, one should
consider more direct promotion options. Subsidized or even free distribution of kits
might then be an alternative to reach the poorest of the poor. While many development
practitioners are opposed to a free distribution policy and it would be in stark contrast
to the strategies pursued by ongoing dissemination programs, the empirical literature
provides evidence from other field experiments that supports such an approach
(Kremer and Miguel 2007; Cohen and Dupas 2010; Tarozzi et al. 2014; Bensch and
Peters 2015). As a matter of course, a subsidized distribution policy would require
establishing institutions that maintain the subsidy scheme including an effective
system for maintenance and replacement of broken kits in order to ensure long‐term
sustainability. Moreover, since subsidies would require public funds, the priority of
the SE4All goal would obviously need to be pondered against other development
objectives.
Having said this, it is also clear that further experimental studies that can examine the
mechanisms behind take‐up behavior, such as the households’ willingness‐to‐pay for
electric energy, the role of credit constraints, and information are certainly useful. Such
research efforts would help to design appropriate least‐cost strategies to achieve the

modern “energy‐for‐all‐goals” of the international community.
REFERENCES
Barron, M., and M. Torero. 2014. “Electrification and Time Allocation: Experimental
Evidence from Northern El Salvador.ʺ MPRA Paper 63782, University Library of
Munich, Germany.
———. 2015. ʺHousehold Electrification and Indoor Air Pollution.ʺ MPRA Paper
61424, University Library of Munich, Germany.
Begemann, S.H.A., G.J. van den Beld, and A.D. Tenner. 1997. “Daylight, Artificial Light
and People in an Office Environment, Overview of Visual and Biological
Responses.” International Journal of Industrial Ergonomics 3: 231–39.
Bensch, G., and J. Peters. 2015. ʺThe Intensive Margin of Technology Adoption:
Experimental Evidence on Improved Cooking Stoves in Rural Senegal.ʺ Journal of
Health Economics 42: 44–63.
Bensch, G., J. Peters, and M. Sievert. 2013. “Fear of the Dark? How Aaccess to Electric
Lighting Affects Security Attitudes and Nighttime Activities in Rural Senegal.”
Journal of Rural and Community Development 8 (1): 1–19.
———. 2015. “The Lighting Transition in Africa: From Kerosene to LED and the
Emerging Dry‐Cell Battery Problem.” (No. 579). Essen: Ruhr Economic Papers.
Bensch, G., J. Kluve, and J. Peters. 2011. “Impacts of Rural Electrification in Rwanda.”
Journal of Development Effectiveness 3 (4): 567–88.
Bernard, Tanguy. 2012. “Impact Analysis of Rural Electrification Projects in Sub‐
Saharan Africa.” World Bank Research Observer 27 (1): 33–51.

Bertrand, J. T., K. OʹReilly, J. Denison, R. Anhang, and M. Sweat. 2006. “Systematic
Review of the Effectiveness of Mass Communication Programs to Change
HIV/AIDS‐related Behaviors in Developing Countries.” Health Education Research
21 (4): 567–97.
Boyce, P.R., J.W. Beckstead, N.H. Eklund, R.W. Strobel, and M.S. Rea. 1997. “Lighting
the Graveyard Shift: The Influence of a Daylight‐Simulating Skylight on the Task
Pperformance and Mood of Night Shift Workers.” Lighting Research and Technology
29 (3): 105–34.
Brainard, G.C., J.P. Hanifin, J.M. Greeson, B. Byrne, G. Glickman, E. Gerner, and M.D.
Rollag. 2001. “Action Spectrum for Melatonin Regulation in Humans: Evidence for
a Novel Circadian Photoreceptor.” Journal of Neuroscience 21 (16): 6405–6412.
Cohen, J., and P. Dupas. 2010. “Free Distribution or Cost‐Sharing? Evidence from a
Randomized Malaria Prevention Experiment.” Quarterly Journal of Economics 125
(1): 1–45.
Daurat A, Aguirre A, Foret J, Gonnet P, Keromes A, and Benoit O. 1993. “Bright
Light Affects Alertness and Performance Rhythms during a 24‐hour Constant
Routine.” Physics and Behaviour 53 (5):929–36.
Dinkelman, T. 2011. “The Effects of Rural Electrification on Employment: New
Evidence from South Africa.” American Economic Review 101 (7): 3078–108.
Dupas, P 2014. ʺShort‐Run Subsidies and Long‐Run Adoption of New Health
Products: Evidence from a Field Experiment.ʺ Econometrica 82 (1): 197–228.

Furukawa, C. 2014. “Do Solar Lamps Help Children Study? Contrary Evidence from a
Pilot Study in Uganda.” Journal of Development Studies 50 (2): 319–41.
Grogan, L., and A. Sadanand. 2013. “Rural Electrification and Employment in Poor
Countries: Evidence from Nicaragua.” World Development 43: 252–65.
Grunberger, J., L. Linzmayer , M. Dietzel, and B. Saletu. 1993. “The Effect of
Biologically Active Light on the Noo‐ and Thymopsyche on Psycho‐physiological
Variables in Healthy Volunteers.” International Journal of Psychophysiology 15 (1):
27–37.
IEA. 2011. World Energy Outlook 2011. Paris.
Jensen, R., and E. Oster. 2009. “The Power of TV: Cable Television and Women’s Status
in India.” Quarterly Journal of Economics 124 (3): 1057–94.
Khandker, Shahidur R., Douglas F. Barnes, and Hussain A. Samad. 2012. “The Welfare
Impacts of Rural Electrification in Bangladesh.” Energy Journal 33 (1): 187–206.
Khandker, Shahidur R., Douglas F. Barnes, and Hussain A. Samad. 2013. “Welfare
Impacts of Rural Electrification: A Panel Data Analysis from Vietnam.” Economic
Development and Cultural Change 61 (3): 659–92.
Kremer, M., and E/ Miguel. 2007. “The Illusion of Sustainability.” Quarterly Journal of
Economics 122 (3): 1007–65.
Kuller, R., and T. Laike. 1998. ʺThe Impact of Flicker from Fluorescent Lighting on
Well‐Being, Performance and Physiological Arousal.ʺ Journal of Ergonomics 41 (4):
433–47.

Kuller, R., and L. Wetterberg. 1993. ʺMelatonin, Cortisol, EEG, ECG and Subjective
Comfort in Healthy Humans: Impact of Two Fluorescent Lamp Types at Two
Light Intensities.” Lighting Research and Technology 25 (2): 71–80.
Lenz, L., A. Munyehirwe, J. Peters, and M. Sievert. 2016. “Does Large Scale
Infrastructure Investment Alleviate Poverty? Impacts of Rwanda’s Electricity
Access Roll‐Out Program.” World Development, forthcoming.
La Ferrara, E., A. Chong, and S. Duryea. 2012. “Soap Operas and Fertility: Evidence
from Brazil.” American Economic Journal: Applied Economics 4 (4): 1–31.
Lam, N. L., K. R. Smith, A. Gauthier, and M. N. Bates. 2012. “Kerosene: A Review of
Household Uses and Their Hazards in Low‐ and Middle‐Income Countries.”
Journal of Toxicology and Environmental Health, Part B 15 (6): 396–432.
Lange, H. 1999. Handbuch für Beleuchtung, SLG, LiTG, LTG, NSVV, 5. Auflage, ecomed
SICHERHEIT. Landsberg am Lech.
Lighting Global. 2016. Off‐Grid Solar Market Trends Report 2016, Bloomberg New
Energy Finance and Lighting Global in cooperation with the Global Off‐Grid
Lighting Association (GOGLA).
Lipscom M., M. Mobarak, and T. Barham. 2013. “Development Effects of
Electrification: Evidence from the Topographic Placement of Hydropower Plants
in Brazil.” American Economic Journal: Applied Economics 5 (2): 200–231.
MININFRA. 2016. Rural Electrification Strategy. April 2016. Ministry of Infrastructure,
Republic of Rwanda. Kigali.

O’Sullivan, K., and D. F. Barnes. 2006. “Energy Policies and Multitopic Household
Surveys. Guidelines for Questionnaire Design in Living Standards Measurement
Studies.” Energy and Mining Sector Board Discussion Paper (17).
Partonen, T., and J. Lönnqvist. 2000. “Bright Light Improves Vitality and Alleviates
Distress in Healthy People.” Journal of Affective Disorders 57 (1–3): 55–61.
Peters, J., and M. Sievert. 2016. “Impacts of Rural Electrification Revisited: The
African Context.” Journal of Development Effectiveness, forthcoming.
Samad, Hussain A., Shahidur R. Khandker, M. Asaduzzaman, and M. Yunus. 2013.
“The Benefits of Solar Home Systems: An Analysis from Bangladesh.” World Bank
Policy Research Working Paper No. 6724, World Bank, Washington D.C.
Sievert, M. 2015. “Rural Electrification and Domestic Violence in Sub‐Saharan Africa.”
RWI Working Paper No. 570.
Sustainable Energy for All (SE4All). 2013. Sustainable Energy for All Global Tracking
Framework Consultation Document. http://www.se4all.org/tracking‐progress/
[Accessed September 10, 2014].
Sustainable Energy for All (SE4All). 2015. Sustainable Energy for All Global Tracking
Framework Consultation Document. Retrieved from:
http://www.se4all.org/tracking‐progress/.
Tarozzi, A., A. Mahajan, B. Blackburn, D. Kopf, L. Krishnan, and J. Yoong. 2014.
“Micro‐loans, Insecticide‐Treated Bednets, and Malaria: Evidence from a
Randomized Controlled Trial in Orissa, India.” American Economic Review 104
(7): 1909–41.

United Nations. 2005. The Energy Challenge for Achieving the Millennium
Development Goals. New York.
———. 2010. Energy for a Sustainable Future. Report and Recommendations. New
York.
van de Walle, D., M. Ravallion, V. Mendiratta, and G. Koolwal. 2016. “Long‐Term
Gains from Electrification in Rural India.” World Bank Economic Review,
forthcoming.
WHO. 2016. Burning Opportunity: Clean Household Energy for Health, Sustainable
Development, and Wellbeing of Women and Children. Washington, D.C.: World
Health Organization.
Wilkins, A.J., I. Nimmo‐Smith, A. Slater, L. Bedocs. 1989. ʺFluorescent Lighting,
Headaches and Eyestrain.ʺ Lighting Research and Technology 21 (1): 11–18.
World Bank. 2009. “Unit Costs of Infrastructure Projects in Sub‐Saharan Africa.” Africa
Infrastructure Country Diagnostic, Background Paper No. 11, World Bank, Washington
D.C.
A First Step up the Energy Ladder? Low Cost Solar Kits and
Household’s Welfare in Rural Rwanda
Supplemental Appendix
Appendix S1: Productivity effects associated with lighting 46
Appendix S2: RCT Implementation 48
Appendix S3: Contract for lottery winners 52
Appendix S4: External Validity of results 53
Appendix S5: Radio Usage 56
Appendix S6: Additional tables 59
Appendix S7: Full regression results of tables in main document 66

Appendix S1: Productivity effects associated with lighting
Since the visual performance of humans strongly increases with the lighting level (Brainard et
al. 2001), we assume that the labor productivity in performing these activities increases with
the quantity and quality of light. With high quantity and quality of light, activities can be done
faster and with more precision, and hence output increases. Productivity in fine assembly
work for instance has been shown to increase by 28% as the lighting level increases from 500
to 1500 lm (Lange 1999). But even increasing the lighting level from much lower levels comes
with significant productivity effects. Evidence comes for instance from weaving mills (Lange
1999). The literature also shows that light has a stimulating effect on the work mood (Kuller
and Wetterberg 1993; Boyce et al. 1997; Partonen and Lönnqvist 2000). It also helps to avoid
accidents as alertness increases with light (Daurat et al. 1993). Studies have also shown that
the use of higher lighting levels helps to cope with fatigue (Daurat et al. 1993; Grunberger et
al. 1993; Begemann et al. 1997). Moreover, Wilkins et al. (1989) show that working in poor or
low quality lighting, people can suffer eye strain which again results in poorer performance
and is often accompanied by headaches. Headaches and stress in people are also caused by
lamp flicker (Kuller and Laike 1998). The literature attributes good quality lighting to devices
that provide sufficient light at the visual task, good uniformity of the lighting over the whole
task area, balanced luminous distribution throughout the room, a lighting installation without
glare, good color rendering and appropriate light color, and lighting without flicker (Lange
1999).
References
Begemann, S.H.A., G.J. van den Beld, and A.D. Tenner. 1997. “Daylight, artificial light and people in an
office environment, overview of visual and biological responses”, International Journal of Industrial
Ergonomics, 3, 231–239.
Boyce, P.R., J.W. Beckstead, N.H. Eklund, R.W. Strobel, M.S. Rea. 1997. “Lighting the graveyard‐shift:
the influence of a daylight‐simulating skylight on the task performance and mood of night shift
workers”, Lighting Research and Technology, 29 ( 3), 105‐134.
Brainard, George C., John P. Hanifin, Jeffrey M. Greeson, Brenda Byrne, Gena Glickman, Edward
Gerner, and Mark D. Rollag. 2001. “Action spectrum for melatonin regulation in humans: Evidence for
a novel circadian photoreceptor”, Journal of Neuroscience, 21(16): 6405‐6412.
Daurat A, Aguirre A, Foret J, Gonnet P, Keromes A, Benoit O. 1993. “Bright light affects alertness and
performance rhythms during a 24‐hour constant routine”, Physics and behaviour, 53(5):929‐36.
Grunberger, J., L. Linzmayer , M. Dietzel, B. Saletu. 1993. “The effect of biologically active light on the
noo‐ and thymopsyche on psycho‐physiological variables in healthy volunteers”, Int. J. of
Psychophysiology, 15(1):27‐37.

Kuller, R. and T. Laike. 1998. ̋ The impact of flicker from fluorescent lighting on well‐being, performance
and physiological arousal.ʺ Journal of Ergonomics, 41(4):433‐47.
Kuller, R. and L. Wetterberg. 1993. ʺMelatonin, cortisol, EEG, ECG and subjective comfort in healthy
humans: impact of two fluorescent lamp types at two light intensities.” Lighting Research and Technology,
25 (2) 71‐80.
Lange, Horst. 1999. Handbuch für Beleuchtung, SLG, LiTG, LTG, NSVV, 5. Auflage, ecomed
SICHERHEIT. Landsberg am Lech.
Partonen, T. and J. Lönnqvist. 2000. “Bright light improves vitality and alleviates distress in healthy
people.” Journal of Affective disorders, 57(1‐3): 55‐61.
Wilkins, A.J., I. Nimmo‐Smith, A. Slater, L. Bedocs, ʺFluorescent lighting, headaches and eyestrain.ʺ,
Lighting Research and Technology, 21(1): 11‐18.

Appendix S2: RCT Implementation
The RCT for this study was conducted between November 2011 and July 2012 in close
cooperation with the Rwandan survey company IB&C and the Rwandan Energy Water and
Sanitation Authority (EWSA). IB&C team members and EWSA staff were included at all stages
of the planning and implementation process. In November 2011, we did a preparation mission
to select the regions in which the RCT should be implemented. In order to mimic the effects
Pico‐PV kits would have on their ultimate target population – households beyond the reach of
the electricity grid and its extensions – we selected 15 remote communities equally distributed
across four districts in the periphery of the country (see Figure S2.1). The communities do not
border each other. According to Rwandan solar experts, these regions show a medium solar
radiation level with a yearly average of 5.5 hours of sunlight per day. Also in the (cloudier)
rainy season the radiation level is typically enough for the Pico‐PV kit to produce sufficient
electricity. In order to avoid treatment contamination, none of the few regions were selected
in which Pico‐PV kits were already available.17
Figure S2.1: Map of survey regions
Source: Own representation based on map provided by REG.
Together with IB&C we conducted a baseline survey among 300 randomly sampled
households in December 2011. The baseline data was used to build strata of comparable
households with regards to the consumed lighting hours per day, usage of mobile phones
17 For a discussion of the representativeness of these rural communities, please refer to the section on external
validity in the supplemental appendix, Section S4.

(binary), radio usage (binary), and district. We then randomized the treatment within the 48
strata resulting from this stratification and additionally applied a minmax t‐stat method for
further important baseline criteria (see Bruhn and McKenzie 2009).18 For the impact analysis,
we include stratum dummies according to our stratification process and control for all
household characteristics used for re‐randomization.
A few days after the baseline survey, the Pico‐PV lamps were delivered to the randomly
selected households. Those households assigned to the control group received a compensation
(one bottle of palm oil and a 5kg sack of rice worth around 7 USD) in order to avoid resentment
among the villagers. The Pico‐PV “winners” furthermore were instructed on how to use the
kit. This instruction was conducted by staff members of the organization that marketed the
Pico‐PV kit in other regions and who are hence also responsible for instructing real customers
that buy a kit at a regular sales man.
Since the survey was embedded into a broader set of evaluation studies in the Rwandan
energy sector on other ongoing interventions in different areas of the country, it was presented
as a general survey on energy usage and not as a study on Pico‐PV or lighting usage. Neither
treatment nor control group members were informed about the experiment. An official survey
permission issued by the Rwandan energy authority was shown to both local authorities and
the interviewed households. Both the Pico‐PV kit and the control group compensation were
presented to participants not as a gift, but as a reward for participation in the survey. We
conducted the randomization in our office using the digitalized baseline data. Local authorities
as well as the field staff of IB&C were only informed on the final randomization results.
Figure S2.2: Participants flow
18 See Ashraf et al. (2010) for an application of this combined stratified re‐randomization approach. All
balancing criteria are highlighted in Table 2 and 3 of Section 5.1.

Source: own illustration in accordance with guidelines provided in BOSE (2010)
Given the high poverty rates in the region, our local partners assessed the risk of households
selling the Pico‐PV kit to be fairly high. Since it was our ambition to mimic a policy
intervention in which basic energy services are provided for free to all households (and thus
potentials to sell the kits would be reduced considerably) we tried to avoid this. Our local
research partners addressed this risk by preparing a short contract to be signed by the district
mayors and the winners that obliged the winners not to sell the Pico‐PV system (see Online
Appendix). The governmental authority is well respected also in remote areas of the country
and Rwandans generally tend to comply with formal agreements. At the same time we were
assured that such a procedure would not induce irritations in the villages. A monitoring visit

among all winners each two months was conducted to ensure the proper functioning of the
Pico‐PV systems and may remind the winners of their commitment not to sell the systems.
Six months after the randomization we revisited the 300 households for the follow‐up survey.
Except for two, all households interviewed during the baseline could be retrieved giving us a
fairly low attrition rate of only 1 percent. Also compliance turned out to be high with only 18
households that declared their Pico‐PV kit to be sold, lost or stolen (it can be suspected that
also the lost and stolen ones were sold in fact). One household got the kit only during the
follow‐up, since the household had been absent during multiple delivery attempts after
baseline. The participant flow is visualized in Figure S2.2.
References
Ashraf, Nava, James Berry, and Jesse M. Shapiro. 2010. “Can Higher Prices Stimulate Product Use?
Evidence from a Field Experiment in Zambia.” American Economic Review, 100(5): 2383–413.
Bose, Ron. 2010. “A Checklist for the Reporting of Randomized Control Trials of Social and Economic
Policy Interventions in Developing countries: CEDE Version 1.0.” Working Paper No. 6. New Delhi:
International Initiative for Impact Evaluation.
Bruhn, Miriam and David McKenzie. 2009. “In Pursuit of Balance: Randomization in Practice in
Development Field Experiments.” American Economic Journal: Applied Economics, 1(4): 200–32.

Appendix S3: Contract for lottery winners
AGREEMENT OF COOPERATION (translated from Kinyarwanda) Between……………………………………..Representative of RWI/ISS And the beneficiary of solar kits:
-Name: ………………………..... -Phone number: ……………………….... -Code of household: ………………………....
-Village ……………………….... -Cell: ……………………….... -Sector: ……………………….... -District: ……………………….... -Province: ……………………….... Article 1: This agreement concerns the cooperation between RWI/ISS and beneficiaries of solar kits during research on impact of electricity on living conditions of beneficiaries. Article 2: The Agreement is valid for one year from the date of signature. Article 3: RWI/ISS’s responsibilities:
To offer beneficiaries solar kits freely (solar kits consist of 1. solar panel, 2. lamp, 3. battery power pack, 4. active and passive radio connectors, 5. radio, and 6. phone connector)
To conduct survey on impact of electricity on living conditions of beneficiaries Assist beneficiaries in collaboration with Though Stuff in any case of technical problems of
solar kits Article 4: Responsibilities of beneficiaries of solar kits:
To follow rules given by Though Stuff about how to keep well solar kits To give all required information on the impact of electrification on the living conditions To communicate Though Stuff on the encountered problems about the use of solar kits Don’t sell or give freely solar kits to someone else Turn back to RWI/ISS solar kits when beneficiaries are not able to keep them
Done at ….., the….December 2011 Signature Beneficiary’s name:……………………………………
Signature Name………………………………………………………. Local Authorities representative………………………………….
Signature Name…………………………………………………. Representative of RWI-ISS
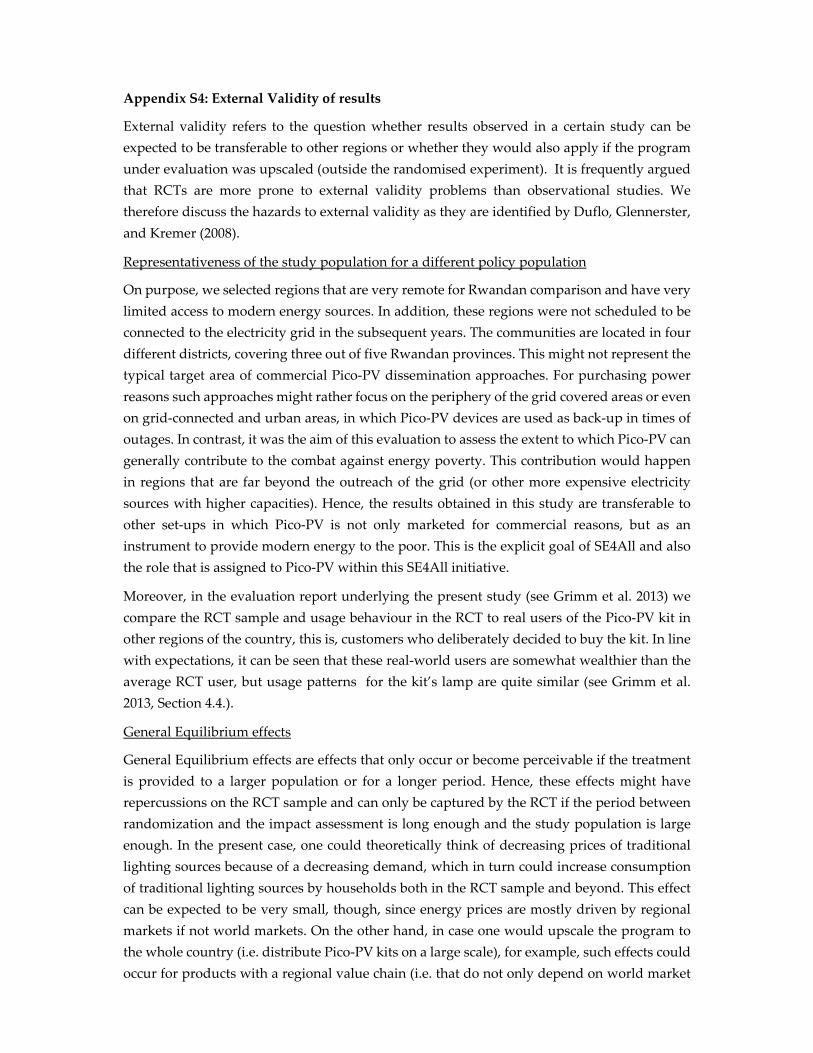
Appendix S4: External Validity of results
External validity refers to the question whether results observed in a certain study can be
expected to be transferable to other regions or whether they would also apply if the program
under evaluation was upscaled (outside the randomised experiment). It is frequently argued
that RCTs are more prone to external validity problems than observational studies. We
therefore discuss the hazards to external validity as they are identified by Duflo, Glennerster,
and Kremer (2008).
Representativeness of the study population for a different policy population
On purpose, we selected regions that are very remote for Rwandan comparison and have very
limited access to modern energy sources. In addition, these regions were not scheduled to be
connected to the electricity grid in the subsequent years. The communities are located in four
different districts, covering three out of five Rwandan provinces. This might not represent the
typical target area of commercial Pico‐PV dissemination approaches. For purchasing power
reasons such approaches might rather focus on the periphery of the grid covered areas or even
on grid‐connected and urban areas, in which Pico‐PV devices are used as back‐up in times of
outages. In contrast, it was the aim of this evaluation to assess the extent to which Pico‐PV can
generally contribute to the combat against energy poverty. This contribution would happen
in regions that are far beyond the outreach of the grid (or other more expensive electricity
sources with higher capacities). Hence, the results obtained in this study are transferable to
other set‐ups in which Pico‐PV is not only marketed for commercial reasons, but as an
instrument to provide modern energy to the poor. This is the explicit goal of SE4All and also
the role that is assigned to Pico‐PV within this SE4All initiative.
Moreover, in the evaluation report underlying the present study (see Grimm et al. 2013) we
compare the RCT sample and usage behaviour in the RCT to real users of the Pico‐PV kit in
other regions of the country, this is, customers who deliberately decided to buy the kit. In line
with expectations, it can be seen that these real‐world users are somewhat wealthier than the
average RCT user, but usage patterns for the kit’s lamp are quite similar (see Grimm et al.
2013, Section 4.4.).
General Equilibrium effects
General Equilibrium effects are effects that only occur or become perceivable if the treatment
is provided to a larger population or for a longer period. Hence, these effects might have
repercussions on the RCT sample and can only be captured by the RCT if the period between
randomization and the impact assessment is long enough and the study population is large
enough. In the present case, one could theoretically think of decreasing prices of traditional
lighting sources because of a decreasing demand, which in turn could increase consumption
of traditional lighting sources by households both in the RCT sample and beyond. This effect
can be expected to be very small, though, since energy prices are mostly driven by regional
markets if not world markets. On the other hand, in case one would upscale the program to
the whole country (i.e. distribute Pico‐PV kits on a large scale), for example, such effects could
occur for products with a regional value chain (i.e. that do not only depend on world market

prices).
As for the time horizon, our evaluation examines short‐term usage and impacts. While we
believe that the six months period between delivery of the Pico‐PV kit and our follow‐up
survey is long enough to allow the users’ adaptation to the new technology, we cannot rule
out that usage behaviour would change over time.
Hawthorne‐ and John‐Henry‐Effects
Hawthorne‐ and John‐Henry‐effects occur if participants in an experiment change their
behaviour because they know that they are participating in an experiment. To the extent that
the field work team has to interact with the study population, these effects can hardly be
excluded completely in most RCTs. However, there are ways to keep them as small as possible,
mostly by reducing the attention that is evoked in the participating household and the villages.
The surveys used for this study were presented as part of a general survey on energy usage in
relation to on‐going and well‐known energy interventions. Respondents were asked to
consent to participating in the survey, but the randomization or the experimental character
were not mentioned. A permission letter issued by the Rwandan Energy Authority was
presented to the local authorities as well as the participating households both during the
baseline survey and the follow‐up survey. In fact, our study was part of a broader evaluation
engagement in the country, which also covered 50 different target villages of the Rwandan
grid roll‐out programme EARP (see Lenz et al. 2016). Although the study regions of the present
paper were not scheduled to be connected by EARP in the near future, most of the residents
are aware of the electrification programme that possibly will also reach their communities. The
survey work was implemented as unobtrusive as possible. Each household was visited
individually.
Furthermore, the randomly assigned Pico‐PV system was not labelled as a gift, but as a
compensation for participation in the survey. Also, households assigned to the control group
received a compensation consisting of a sack of 5kg of rice and one litre of cooking oil.19 As a
side effect, this compensation for the control group addresses a potential ethical concern that
is sometimes brought forward against RCTs: Randomly assigning a treatment to one group
may induce uncomfortable feelings in the other group.
In sum, while some sort of survey effect is unavoidable, there is no reason to expect strong
Hawthorne and John Henry‐effects, since the participants were not informed about an
experiment, both treatment and control groups received a reimbursement for participation
and the surveys and interviews were implemented as unobtrusive as possible.
Special Care
The way in which we provided the Pico‐PV kit (most importantly the training) was in line
19 This implementation design follows the approach presented in De Mel, McKenzie, and Woodruff (2008) and was
also applied in a RCT with improved cooking stoves in Senegal (Bensch and Peters 2015).

with what the company that marketed the product had foreseen for the marketing process.
Although the level of care was probably higher compared to some other Pico‐PV kits that are
just sold in shops and do not comprise a training, many regular market vendors also offer such
trainings.
References
Bensch, Gunther and Jörg Peters. 2015. “The intensive margin of technology adoption – Experimental
Evidence on improved cooking stoves in rural Senegal.” Journal of Health Economics 42: 44‐63.
Duflo, E., R. Glennerster, and M. Kremer. 2008. Using Randomization in Development Economics
Research: A Toolkit, Chapter 61, Handbook of Development Economics.
Grimm, Michael, Jörg Peters, and Maximiliane Sievert. 2013. Impacts of Pico‐PV Systems Usage using a
Randomized Controlled Trial and Qualitative Methods. Final Report on behalf of the Policy and
Operations Evaluation Department (IOB) of the Netherlands Ministry of Foreign Affairs.
Lenz, Luciane, Anicet Munyehirwe, Jörg Peters and Maximiliane Sievert (2016) Does Large Scale
Infrastructure Investment Alleviate Poverty? Impacts of Rwanda’s Electricity Access Roll‐Out Program.
World Development, forthcoming.
Mel, Suresh de, David McKenzie, and Christopher Woodruff. 2008. “Returns to Capital in
Microenterprises: Evidence from a Field Experiment.” Quarterly Journal of Economics, 123(4): 1329–72.

Appendix S5: Radio Usage
Table S5.1 portrays the effects of the Pico‐PV kit treatment on radio ownership and usage
patterns. Since the randomized Pico‐PV kit encompasses a radio, the share of radio owners is
close to 100 percent in the treatment group, while slightly more than 50 percent of the control
group households own a radio. It is above all the head of the household who uses the radio,
but the increased number of radios in the households also leads to significantly increased radio
usage of other household members. The share of members listening to the radio is significantly
higher in the treatment group for all household members. The listening hours for those who
use a radio only increases significantly for the head of households.
Table S5.1: Radio ownership and usage
Treatment Control ITT p‐value
Radio Ownership 95% 52% 41% 0.000
HH member listens regularly to radio
Head of HH 86% 43% 41% 0.000 ‐ Listening hours per day (only user) 4.3 3.2 1.1 0.012
Spouse 78% 42% 34% 0.000 ‐ Listening hours per day (only user) 3.3 2.7 0.4 0.289
Boys 12‐17 years 76% 47% 33% 0.048
‐ Listening hours per day (only user) 2.2 2.0 ‐0.1 0.907
Girls 12‐17 years 80% 42% 26% 0.151
‐ Listening hours per day (only user) 1.7 2.1 ‐0.3 0.639
Children 6‐11 years 63% 33% 16% 0.090 ‐ Listening hours per day (only user) 1.9 2.2 0.4 0.631
Radios are mostly used to listen to programs that transmit information (see Table S5.2). We
asked all radio users to name their two favourite radio programs: the by far most preferred
program among adults are news, followed by music. The third preference are programs that
people refer to as “théatre”. These are radio plays that try to raise awareness on different topics
like reconciliation, working attitude, or justice. The last category subsumes special broadcasts
topics like politics or health (‘broadcasts’ in Table S5.2).

Table S5.2: Preferred radio programs per household member
(in percent) Treatment Control ITT p‐value
Head of HH Music 46 62 ‐17 0.062
(N=193) News 84 86 ‐4 0.408
Theatre 13 5 10 0.056
Broadcast 13 8 1 0.847
Other 14 15 3 0.697
Spouse Music 43 67 ‐29 0.006
(N=158) News 71 68 5 0.426
Theatre 24 14 8 0.245
Broadcast 10 9 ‐1 0.893
Other 16 12 12 0.114
Children Music 76 71 ‐2 0.907
6‐11 years old News 31 39 ‐1 0.963
(N=77) Theatre 22 14 ‐7 0.498
Broadcast 8 11 4 0.709
Other 4 11 ‐2 0.836
Male Music 70 83 8 0.824
12‐17 years old News 47 63 ‐24 0.425
(N=54) Theatre 10 17 ‐20 0.247
Broadcast 13 8 ‐21 0.238
Other 13 8 12 0.562
Female Music 89 84 16 0.309
12‐17 years old News 44 58 ‐11 0.613
(N=64) Theatre 18 16 ‐2 0.940
Broadcast 9 5 ‐3 0.856
Other 16 11 5 0.777
In line with these usage patterns, radio is by far the most important source of information in
the surveyed villages. More than 90 percent of treatment households and 40 percent of control
households answer to an open question on their main source of information that they
exclusively or together with other sources receive information through the radio (see Table
S5.3). Apart from this, direct conversations with other people (community gatherings,
neighbours and friends) are the most important sources of information. TVs and newspaper

are only used by a negligible number of households. While for treated households the
importance of radio is substantially higher, control households rely more on community
gathering and information exchange with neighbours and friends. This obviously creates
potentials for spillovers of increased access to information for some households to the whole
village.
Table S5.3: Main source of information (multiple answers possible)
Treatment Control ITT p‐value
Radio 91 40 51 0.000
Community gathering 70 82 ‐11 0.029
Neighbours/friends 28 28 0 0.929
Box S5.1: Radio stations in Rwanda
In Rwanda, the biggest radio station is the state‐financed Radio Rwanda that reaches more than 90
percent of the population. It broadcasts 24 hours in Kinyarwanda, French, English and Swahili. Radio
Rwanda maintains additionally 5 community radio stations that partly broadcast contributions from
Radio Rwanda and additionally cover local news and regional information. Since 2002, also private
radio stations have received licences to broadcast. Their reception area, though, is mainly restricted to
Kigali and bigger towns. Within our survey area, people frequently reported that besides Rwandan
radio stations they can also receive radio from Burundi or Congo.
Radio Rwanda and its community radio stations cover both entertainment and information broadcasts.
For example at Radio Rusizi, the community radio of Rusizi, on a regular day where they offer program
from 5 am to 23 pm, music covers 7 hours, news sum up to almost 4 hours, 3.5 hours of entertainment
shows like soap operas (“théatre”), quizzes or sports events, and almost 3 hours on broadcast with some
educational background. These educational broadcasts diffuse for example information on hygiene and
cleanliness, on agricultural activities, on animal husbandry, on good governance, or to raise workers’
motivation.

Appendix S6: Additional tables
Lamp Usage
Table S6.1: Number of lighting devices and consumption
Share of households using [lamp] Operation hours per
day and lamp
Treatment Control ITT p‐
value
Treatment Control
Pico‐PV lamp 0.86 0.00 0.86* 0.00 2.89 ‐
Hand‐crafted LED lamps 0.28 0.45 ‐0.18 0 3.45 3.40
Ready‐made torch 0.14 0.22 ‐0.10 0.01 2.23 2.12
Wick lamp 0.12 0.43 ‐0.22 0 2.47 2.98
Candles 0.07 0.15 0.04 0.935 2.05 1.58
Hurricane lamp 0.04 0.10 ‐0.07 0.002 3.2 2.43
Mobile LED lamp 0.03 0.05 ‐0.03** 0.014 2 2.57
No lamp 0.05 0.09 0.03 0.16 ‐ ‐
SUM 1.62 1.43 0.16 0.004 4.3 3.8
Note: The ITT depicts the difference in means at the follow‐up stage between the whole treatment and control group,
also including non‐complying households. We control for all stratification and re‐randomization characteristics.
Rechargeable lamps and gas lamps are not included in the table, since only one control household uses a
rechargeable lamp and only one treatment household uses a gas lamp.
*Probit estimation is not applicable, since control group households do not use the lamp leading to convergence
problems; we display simple differences in means instead. **Controlling for randomization stratum dummies leads
to convergence problems. We include the stratification criteria instead.

Health
Table S6.2: Share of households with household members suffering diseases (in percent)
Treatment Control ITT p‐value
Male adult Respiratory diseases 7 7 ‐2 0.596
Eye problem 7 8 0 0.972
Female adult Respiratory diseases 5 6 0 0.904
Eye problem 9 13 ‐6 0.128
Male Respiratory diseases 2 2 1 0.785
6‐11 years old Eye problem 2 6 ‐3 0.440
Female Respiratory diseases 0 0 0 ‐‐‐
6‐11 years old Eye problem 9 10 5 0.472
Male Respiratory diseases 0 0 0 ‐‐‐
12‐17 years old Eye problem 2 0 1 0.672
Female Respiratory diseases 4 0 3 0.452
12‐17 years old Eye problem 6 3 8 0.292
Note: The data is self‐reported information of whether any household member suffers from any of the diseases. The
ITT depicts the difference in means at the follow‐up stage between the whole treatment and control group,
including also non‐complying households. We control for all stratification and re‐randomization characteristics.

Lamps used for domestic labor
Table S6.3: Most frequently used lamps for housework by male and female adult (percent
of all households)
Female adults doing
housework
Male adults doing
housework
Children (6‐17 years)
studying
Lamp
Treat. Ctrl. ITT p‐
value
Treat. Ctrl. ITT p‐
value
Treat. Ctrl. ITT p‐value
Wick lamp 7 32 ‐23 0.000
3 9 ‐7 0.001
2 12
‐
12*** 0.000
Ready‐made torch 8 12 ‐7 0.056 3 7 ‐8 0.000
Hand‐crafted LED 7 9 ‐3 0.182
1 5
‐
6**
0.003
Pico‐PV lamp 72 0 72* 0.000 26 0 26* 0.000 30 0 30* 0.000
None 15 42 ‐25 0.000 68 78 ‐9 0.006 32 41 ‐19 0.000
None and studying at day time only 9 18 ‐19 0.000
None and studying after nightfall 23 22 ‐2 0.633
Note: The ITT depicts the difference in means at the follow‐up stage between the whole treatment and control group,
including also non‐complying households. We control for all stratification and re‐randomization characteristics.
Detailed estimation results can be found in the following.
*Probit estimation is not applicable, since control group households do not use the lamp leading to convergence
problems; we display simple differences in means instead. **Controlling for randomization stratum dummies leads
to convergence problems. We include the stratification criteria instead. *** Controlling for baseline kerosene
consumption (continuous) causes convergence problems. We include a dummy indicating baseline kerosene
consumption yes/no instead.

Table S6.3a: Most frequently used lamps for housework by female adult (% of all
households)
Wick lamp Ready‐made
torch
Hand‐
crafted
LED
None
Treatment ‐0.228 ‐0.069 ‐0.034 ‐0.249
(0.000)*** (0.056)* (0.182) (0.000)***
Consumption of candles ‐0.001 ‐0.016 0.000 ‐0.001
(0.612) (0.001)*** (0.829) (0.854)
Consumption of kerosene 0.013 ‐0.022 ‐0.017 0.017
(0.229) (0.427) (0.652) (0.151)
Number of household members ‐0.005 0.011 ‐0.006 0.017
(0.676) (0.106) (0.347) (0.091)
Number of mobile phones 0.047 0.005 0.013 ‐0.025
(0.270) (0.836) (0.484) (0.734)
Plastered dwelling ‐0.056 0.071 ‐0.000 0.147
(0.481) (0.024)** (0.994) (0.200)
Modern wall ‐0.073 ‐0.106 0.042 0.075
(0.217) (0.119) (0.390) (0.468)
Modern floor 0.078 0.090 ‐0.058 ‐0.136
(0.094)* (0.076)* (0.246) (0.161)
Hand‐crafted LED ‐0.082 ‐0.095 0.071 0.042
(0.134) (0.022)** (0.012)** (0.507)
Mobile LED ‐0.040 0.058 ‐0.008 0.007
(0.763) (0.379) (0.916) (0.962)
Household owns land ‐0.238 0.104 ‐0.060 0.147
(0.003)*** (0.434) (0.176) (0.218)
Household owns one goat ‐0.064 0.072 ‐0.005 ‐0.019
(0.126) (0.109) (0.915) (0.808)
Household owns several goats ‐0.005 0.034 0.060 ‐0.005
(0.897) (0.430) (0.148) (0.932)
Household owns one cow ‐0.033 0.001 0.025 ‐0.065
(0.543) (0.978) (0.521) (0.321)
Household owns several cows 0.026 ‐0.056 ‐0.086 0.036
(0.657) (0.287) (0.055)* (0.722)
Head of household completed primary school 0.046 0.085 ‐0.002 ‐0.095
(0.385) (0.045)** (0.937) (0.083)
Head of household completed secondary school ‐0.100 0.185 n.i. ‐0.038
(0.136) (0.021)** (0.816)
Redistributed between strata for randomization ‐0.029 0.078 n.i. 0.112
(0.853) (0.314) (0.409)
Pseudo R‐Squared 0.36 0.32 0.29 0.20
Number of Observations 294 294 294 294
Note: Robust pval in parentheses; *** p<0.01, ** p<0.05, * p<0.1;
Randomization strata dummies are included in all estimations; Control variables refer to baseline values; Standard
errors are clustered at the village level.
n.i.: not included since variable predicts success or failure perfectly.

Table S6.3b: Most frequently used lamps for housework by male adult (% of all
households)
Wick lamp Ready‐
made torch
Hand‐crafted
LED
None
Treatment ‐0.070 ‐0.078 ‐0.055 ‐0.085
(0.001)*** (0.000)*** (0.003)*** (0.006)***
Consumption of candles 0.004 ‐0.007 ‐0.013 0.002
(0.062)* (0.006)*** (0.113) (0.728)
Consumption of kerosene 0.011 ‐0.043 ‐0.057 0.007
(0.006)*** (0.046)** (0.000)*** (0.545)
Number of household members 0.007 0.009 0.002 0.003
(0.195) (0.025)** (0.427) (0.856)
Number of mobile phones 0.006 ‐0.005 0.000 ‐0.048
(0.794) (0.587) (0.979) (0.391)
Modern floor ‐0.010 0.050 n.i. ‐0.031
(0.874) (0.056)* (0.781)
Hand‐crafted LED ‐0.003 ‐0.053 0.037 ‐0.090
(0.900) (0.047)** (0.140) (0.089)*
Household owns land ‐0.029 n.i. ‐0.022 0.009
(0.581) (0.447) (0.942)
Household owns one goat 0.039 ‐0.051 n.i. ‐0.023
(0.168) (0.216) (0.723)
Household owns several goats 0.077 0.082 ‐0.044 ‐0.107
(0.004)*** (0.000)*** (0.036)** (0.038)**
Household owns one cow ‐0.007 ‐0.003 n.i. 0.030
(0.866) (0.896) (0.614)
Household owns several cows ‐0.016 ‐0.045 0.013 0.130
(0.656) (0.244) (0.470) (0.134)
Head of household completed primary school 0.036 0.048 ‐0.025 ‐0.036
(0.073)* (0.138) (0.040)** (0.485)
Redistributed between strata for randomization 0.137 n.i. n.i. 0.109
(0.039)** (0.646)
Plastered dwelling n.i. 0.009 n.i. 0.191
(0.526) (0.079)*
Modern wall n.i. ‐0.059 ‐0.047 0.072
(0.073)* (0.049)** (0.488)
Mobile LED n.i. ‐0.050 0.121 ‐0.110
(0.317) (0.000)*** (0.359)
Head of household completed secondary
school
n.i. 0.075 0.020 ‐0.065
(0.147) (0.568) (0.528)
Household owns a radio n.i. n.i. ‐0.004 n.i.
(0.811)
Household owns a mobile phone n.i. n.i. 0.038 n.i.
(0.000)***
Consumption of lighting hours n.i. n.i. ‐0.001 n.i.
(0.883)
Pseudo R‐Squared 0.36 0.51 0.51 0.17
Number of Observations 294 294 295 294
Note: Robust pval in parentheses; *** p<0.01, ** p<0.05, * p<0.1;
Randomization strata dummies are included in all estimations; Control variables refer to baseline values;
Standard errors are clustered at the village level.
n.i.: not included since variable predicts success or failure perfectly.

Table S6.3c: Most frequently used lamps for studying by children (% of households with
children at school age; N=208)
Wick lamp No lamp None and
studying at
daytime
only
None and
studying
after
nightfall
Treatment ‐0.118 ‐0.194 ‐0.185 ‐0.020
(0.000)*** (0.000)*** (0.000)*** (0.633)
Consumption of candles 0.002 ‐0.004 ‐0.009 ‐0.001
(0.327) (0.235) (0.116) (0.780)
Number of household members 0.021 0.009 0.003 0.006
(0.049)** (0.623) (0.748) (0.669)
Number of mobile phones ‐0.027 0.089 0.059 0.015
(0.211) (0.319) (0.272) (0.827)
Plastered dwelling ‐0.031 ‐0.053 ‐0.061 ‐0.083
(0.526) (0.616) (0.540) (0.284)
Modern wall ‐0.137 ‐0.069 ‐0.041 ‐0.082
(0.008)*** (0.378) (0.530) (0.232)
Modern floor 0.025 ‐0.088 n.i. 0.049
(0.692) (0.525) (0.453)
Hand‐crafted LED ‐0.049 ‐0.092 ‐0.065 ‐0.020
(0.312) (0.360) (0.005)*** (0.773)
Household owns one goat ‐0.041 0.109 0.083 0.054
(0.415) (0.257) (0.005)*** (0.628)
Household owns several goats ‐0.138 0.178 0.027 0.137
(0.014)** (0.012)** (0.644) (0.015)**
Household owns one cow ‐0.022 0.100 0.125 ‐0.039
(0.652) (0.292) (0.040)** (0.621)
Household owns several cows 0.118 0.217 ‐0.051 0.142
(0.021)** (0.033)** (0.674) (0.086)*
Head of household completed primary school ‐0.013 ‐0.058 0.056 ‐0.106
(0.797) (0.543) (0.269) (0.179)
Head of household completed secondary school 0.033 ‐0.123 ‐0.027 ‐0.229
(0.574) (0.543) (0.842) (0.216)
Consumption of kerosene n.i. ‐0.144 ‐0.111 ‐0.060
(0.015)** (0.005)*** (0.110)
Household owns land n.i. 0.055 0.014 0.064
(0.751) (0.891) (0.663)
Redistributed between strata for randomization n.i. 0.177 ‐0.655 0.204
(0.379) (0.000)*** (0.216)
Mobile LED n.i. 0.116 n.i. 0.186
(0.558) (0.147)
Pseudo R‐Squared 0.50 0.27 0.40 0.33
Number of Observations 207 207 207 207
Note: Robust pval in parentheses; *** p<0.01, ** p<0.05, * p<0.1;
Randomization strata dummies are included in all estimations; Control variables refer to baseline values;
Standard errors are clustered at the village level.
n.i.: not included since variable predicts success or failure perfectly.

Table S6.4: Main Occupation at baseline (in percent)
Treatment Control
Head of household Subsistence Farmer 90 83
Government Employee 1 1
Other independent occupation 3 5
Other dependent occupation 1 5
Housewife, Retired 4 6
Unemployed 1 0
Spouse Subsistence Farmer 98 93
Government Employee 2 0
Other independent occupation 0 1
Other dependent occupation 0 2
Housewife, Retired 0 3
Studies 0 1
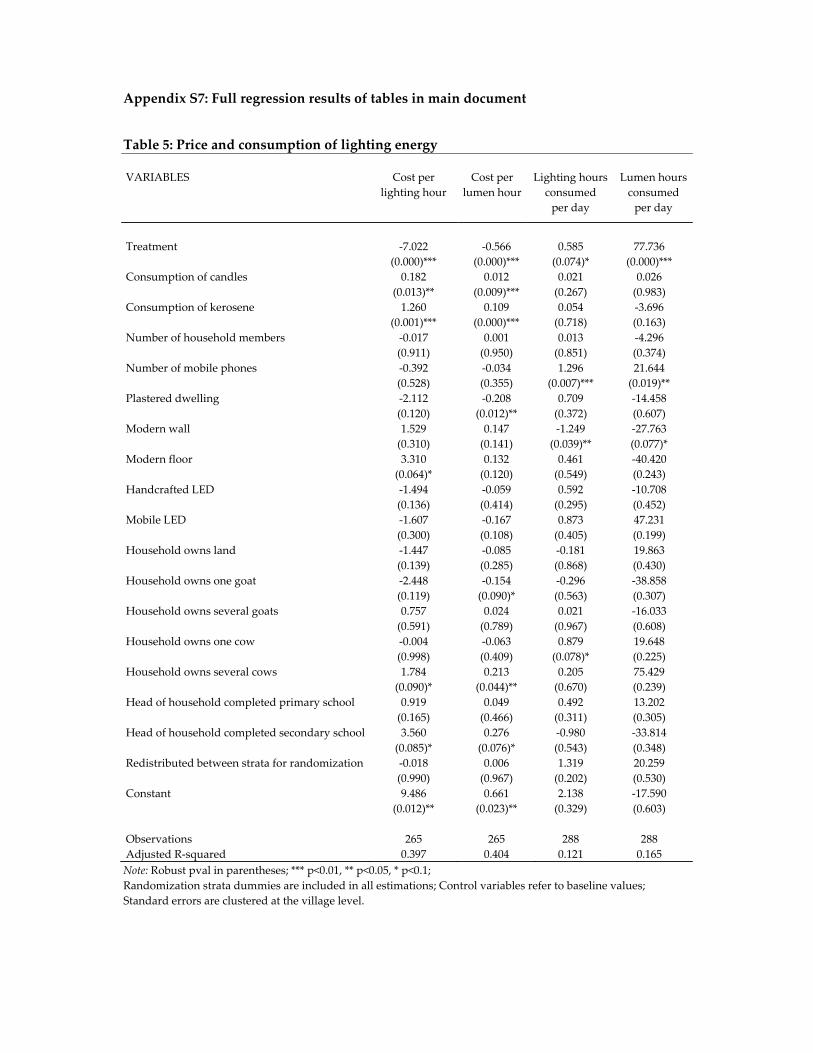
Appendix S7: Full regression results of tables in main document
Table 5: Price and consumption of lighting energy
VARIABLES Cost per
lighting hour
Cost per
lumen hour
Lighting hours
consumed
per day
Lumen hours
consumed
per day
Treatment ‐7.022 ‐0.566 0.585 77.736
(0.000)*** (0.000)*** (0.074)* (0.000)***
Consumption of candles 0.182 0.012 0.021 0.026
(0.013)** (0.009)*** (0.267) (0.983)
Consumption of kerosene 1.260 0.109 0.054 ‐3.696
(0.001)*** (0.000)*** (0.718) (0.163)
Number of household members ‐0.017 0.001 0.013 ‐4.296
(0.911) (0.950) (0.851) (0.374)
Number of mobile phones ‐0.392 ‐0.034 1.296 21.644
(0.528) (0.355) (0.007)*** (0.019)**
Plastered dwelling ‐2.112 ‐0.208 0.709 ‐14.458
(0.120) (0.012)** (0.372) (0.607)
Modern wall 1.529 0.147 ‐1.249 ‐27.763
(0.310) (0.141) (0.039)** (0.077)*
Modern floor 3.310 0.132 0.461 ‐40.420
(0.064)* (0.120) (0.549) (0.243)
Handcrafted LED ‐1.494 ‐0.059 0.592 ‐10.708
(0.136) (0.414) (0.295) (0.452)
Mobile LED ‐1.607 ‐0.167 0.873 47.231
(0.300) (0.108) (0.405) (0.199)
Household owns land ‐1.447 ‐0.085 ‐0.181 19.863
(0.139) (0.285) (0.868) (0.430)
Household owns one goat ‐2.448 ‐0.154 ‐0.296 ‐38.858
(0.119) (0.090)* (0.563) (0.307)
Household owns several goats 0.757 0.024 0.021 ‐16.033
(0.591) (0.789) (0.967) (0.608)
Household owns one cow ‐0.004 ‐0.063 0.879 19.648
(0.998) (0.409) (0.078)* (0.225)
Household owns several cows 1.784 0.213 0.205 75.429
(0.090)* (0.044)** (0.670) (0.239)
Head of household completed primary school 0.919 0.049 0.492 13.202
(0.165) (0.466) (0.311) (0.305)
Head of household completed secondary school 3.560 0.276 ‐0.980 ‐33.814
(0.085)* (0.076)* (0.543) (0.348)
Redistributed between strata for randomization ‐0.018 0.006 1.319 20.259
(0.990) (0.967) (0.202) (0.530)
Constant 9.486 0.661 2.138 ‐17.590
(0.012)** (0.023)** (0.329) (0.603)
Observations 265 265 288 288
Adjusted R‐squared 0.397 0.404 0.121 0.165
Note: Robust pval in parentheses; *** p<0.01, ** p<0.05, * p<0.1;
Randomization strata dummies are included in all estimations; Control variables refer to baseline values;
Standard errors are clustered at the village level.

Table 6a: Expenditures per month per category (in FRW)
VARIABLES Candles Kerosene Char
coal
Big
batteries
Small
batteries
Mobile
phone
charging
Treatment ‐19.927 ‐418.007 1.917 ‐9.344 ‐43.352 ‐67.916
(0.339) (0.000)*** (0.447) (0.750) (0.003)*** (0.407)
Consumption of candles 29.621 8.273 ‐0.019 0.405 ‐1.165 19.456
(0.000)*** (0.165) (0.780) (0.911) (0.537) (0.039)**
Consumption of kerosene 1.833 169.929 ‐0.096 9.460 ‐0.074 7.410
(0.753) (0.007)*** (0.594) (0.133) (0.978) (0.686)
Number of household members 8.228 8.295 ‐0.934 ‐2.416 1.281 29.491
(0.267) (0.567) (0.382) (0.829) (0.678) (0.383)
Number of mobile phones ‐9.833 195.483 7.513 60.265 17.418 1,100.513
(0.631) (0.067)* (0.367) (0.149) (0.232) (0.009)***
Plastered dwelling 16.502 ‐63.128 ‐0.548 ‐70.298 ‐12.142 205.632
(0.581) (0.576) (0.726) (0.330) (0.686) (0.198)
Modern wall ‐44.866 ‐120.093 ‐0.820 64.199 ‐58.167 63.933
(0.322) (0.267) (0.617) (0.504) (0.058)* (0.686)
Modern floor 56.056 281.553 ‐2.738 ‐65.299 22.367 ‐434.782
(0.246) (0.050)* (0.360) (0.282) (0.599) (0.060)*
Hand‐crafted LED 18.316 9.387 ‐4.571 20.710 ‐15.293 86.275
(0.392) (0.925) (0.334) (0.686) (0.440) (0.552)
Mobile LED ‐2.633 255.134 ‐3.422 139.388 21.636 ‐84.409
(0.965) (0.234) (0.403) (0.361) (0.735) (0.867)
Household owns land ‐0.584 ‐117.541 5.549 179.692 ‐19.392 ‐14.158
(0.986) (0.287) (0.185) (0.036)** (0.544) (0.942)
Household owns one goat 73.643 ‐134.849 ‐1.542 26.665 ‐16.252 ‐11.673
(0.000)*** (0.225) (0.500) (0.621) (0.202) (0.912)
Household owns several goats 10.973 ‐111.840 ‐1.314 164.868 33.091 287.823
(0.609) (0.363) (0.510) (0.042)** (0.219) (0.036)**
Household owns one cow ‐11.154 ‐151.915 5.046 134.052 14.472 74.082
(0.533) (0.076)* (0.290) (0.019)** (0.707) (0.600)
Household owns several cows 93.441 91.004 ‐1.129 68.589 ‐19.832 ‐136.453
(0.027)** (0.486) (0.673) (0.315) (0.233) (0.568)
Head of household completed primary school ‐27.737 89.954 1.490 115.139 ‐2.168 26.694
(0.095)* (0.332) (0.353) (0.004)*** (0.885) (0.799)
Head of household completed secondary school 83.751 26.200 ‐0.821 326.077 110.878 ‐523.982
(0.277) (0.880) (0.717) (0.047)** (0.408) (0.153)
Redistributed between strata for randomization 44.463 56.283 1.826 126.782 ‐80.459 185.076
(0.488) (0.769) (0.426) (0.403) (0.231) (0.292)
Constant ‐227.965 ‐283.081 ‐
18.863
‐419.144 261.650 ‐320.098
(0.049)** (0.463) (0.259) (0.173) (0.130) (0.723)
Observations 296 296 295 296 296 296
Adjusted R‐squared 0.622 0.356 ‐0.019 0.275 0.046 0.480
Note: Robust pval in parentheses; *** p<0.01, ** p<0.05, * p<0.1;
Randomization strata dummies are included in all estimations. Control variables refer to baseline values;
Standard errors are clustered at the village level.

Table 6b: Expenditures per month per category (in FRW)
VARIABLES Total traditional
energy expenditures
(without cooking)
Total
expenditures
Share of energy
expenditure on
total expenditures
Treatment ‐556.653 7,249.033 ‐0.030
(0.000)*** (0.276) (0.001)***
Consumption of candles 56.573 ‐603.375 0.001
(0.002)*** (0.074)* (0.017)**
Consumption of kerosene 188.463 2,594.154 0.003
(0.010)** (0.002)*** (0.144)
Number of household members 43.955 3,700.456 0.000
(0.315) (0.135) (0.922)
Number of mobile phones 1,371.322 22,314.462 0.013
(0.004)*** (0.051)* (0.164)
Plastered dwelling 75.918 21,254.017 ‐0.023
(0.724) (0.165) (0.066)*
Modern wall ‐95.781 23,581.834 ‐0.002
(0.672) (0.137) (0.893)
Modern floor ‐142.721 ‐7,699.614 0.016
(0.550) (0.719) (0.143)
Hand‐crafted LED 114.774 1,974.949 ‐0.004
(0.525) (0.762) (0.724)
Mobile LED 325.633 ‐1,101.144 ‐0.003
(0.561) (0.930) (0.854)
Household owns land 33.578 2,184.018 0.010
(0.881) (0.485) (0.364)
Household owns one goat ‐64.025 ‐7,456.327 0.006
(0.721) (0.112) (0.610)
Household owns several goats 383.684 8,874.944 ‐0.005
(0.082)* (0.524) (0.643)
Household owns one cow 64.631 ‐4,661.881 0.001
(0.693) (0.381) (0.924)
Household owns several cows 95.617 14,374.902 ‐0.015
(0.777) (0.171) (0.302)
Head of household completed primary school 203.383 5,767.114 ‐0.003
(0.217) (0.329) (0.791)
Head of household completed secondary school 22.096 ‐8,550.415 ‐0.004
(0.965) (0.701) (0.836)
Redistributed between strata for randomization 333.947 ‐9,091.174 0.013
(0.137) (0.214) (0.729)
Constant ‐1,007.517 ‐45,103.310 0.071
(0.342) (0.298) (0.150)
Observations 296 296 295
Adjusted R‐squared 0.582 0.250 0.136
Note: Robust pval in parentheses; *** p<0.01, ** p<0.05, * p<0.1;
Randomization strata dummies are included in all estimations. Control variables refer to baseline values;
Standard errors are clustered at the village level.

Table 8a: Daily time spent on domestic labour
VARIABLES Total time of
head of
household
Time during
night of head
of household
Total time
of spouse
Time during
night of
spouse
Treatment ‐1.674 6.150 26.953 2.752
(0.950) (0.542) (0.333) (0.779)
Consumption of candles ‐0.431 ‐0.858 3.755 0.320
(0.871) (0.099)* (0.182) (0.705)
Consumption of kerosene ‐6.370 ‐1.981 ‐4.528 0.123
(0.274) (0.129) (0.339) (0.954)
Number of household members ‐3.233 ‐0.591 3.293 5.514
(0.660) (0.793) (0.735) (0.248)
Number of mobile phones 39.520 7.932 32.397 28.709
(0.103) (0.367) (0.306) (0.029)**
Plastered dwelling ‐2.937 8.097 ‐15.112 2.584
(0.952) (0.556) (0.764) (0.890)
Modern wall ‐42.319 ‐10.732 29.055 6.767
(0.353) (0.389) (0.627) (0.768)
Modern floor ‐0.894 15.761 ‐50.724 ‐20.211
(0.986) (0.211) (0.184) (0.430)
Handcrafted LED ‐9.829 0.960 ‐64.496 ‐19.938
(0.726) (0.904) (0.108) (0.354)
Mobile LED ‐104.698 ‐13.120 72.072 99.724
(0.061)* (0.552) (0.331) (0.008)***
Household owns land ‐57.488 ‐18.418 ‐180.938 ‐67.553
(0.314) (0.378) (0.135) (0.113)
Household owns one goat 44.618 11.146 ‐60.298 ‐0.667
(0.359) (0.438) (0.186) (0.965)
Household owns several goats ‐10.393 ‐0.429 ‐42.010 ‐28.114
(0.820) (0.967) (0.478) (0.170)
Household owns one cow ‐14.606 ‐13.052 36.974 8.110
(0.748) (0.290) (0.281) (0.565)
Household owns several cows ‐0.574 ‐18.584 ‐38.480 2.483
(0.989) (0.065)* (0.509) (0.897)
Head of household completed primary school ‐10.490 ‐6.117 ‐25.867 2.283
(0.755) (0.488) (0.427) (0.793)
Head of household completed secondary school ‐22.247 ‐20.982 12.455 23.273
(0.748) (0.459) (0.902) (0.601)
Redistributed between strata for randomization 99.878 ‐28.758 0.900 55.525
(0.347) (0.139) (0.991) (0.187)
Constant 463.535 86.662 80.674 ‐55.506
(0.054)* (0.060)* (0.603) (0.313)
Observations 287 287 257 257
Adjusted R‐squared 0.000 ‐0.042 ‐0.006 0.092
Note: Robust pval in parentheses; *** p<0.01, ** p<0.05, * p<0.1;
Randomization strata dummies are included in all estimations; Control variables refer to baseline values;
Standard errors are clustered at the village level.
Outcome variables have been transformed to a decimal system. For retransformation multiply with 0.6.

Table 8b: Daily time spent on domestic labour and income generation
VARIABLES Total time of
head of
household
Time during
night of head
of household
Total time
of spouse
Time during
night of
spouse
Treatment 34.898 ‐0.633 16.890 ‐0.000
(0.215) (0.823) (0.354) (0.462)
Consumption of candles 0.115 ‐0.030 ‐0.038 ‐0.000
(0.953) (0.828) (0.983) (0.178)
Consumption of kerosene 17.951 0.640 ‐44.361 0.000
(0.022)** (0.292) (0.107) (0.070)*
Number of household members 14.813 0.366 12.094 0.000
(0.072)* (0.647) (0.208) (0.063)*
Number of mobile phones 27.912 ‐2.668 ‐47.178 ‐0.000
(0.374) (0.169) (0.088)* (0.029)**
Plastered dwelling 5.573 15.244 ‐77.895 0.000
(0.935) (0.138) (0.131) (0.708)
Modern wall ‐45.806 ‐9.566 4.021 ‐0.000
(0.471) (0.071)* (0.955) (0.084)*
Modern floor 24.199 6.033 111.740 0.000
(0.701) (0.377) (0.058)* (0.364)
Handcrafted LED ‐13.573 0.767 ‐90.818 0.000
(0.729) (0.637) (0.073)* (0.035)**
Mobile LED 90.041 32.162 41.571 0.000
(0.510) (0.297) (0.597) (0.040)**
Household owns land 34.368 0.377 ‐113.986 ‐0.000
(0.734) (0.924) (0.001)*** (0.042)**
Household owns one goat ‐61.557 ‐3.939 ‐3.032 0.000
(0.229) (0.144) (0.860) (0.694)
Household owns several goats ‐67.281 ‐4.119 ‐3.641 0.000
(0.354) (0.156) (0.940) (0.508)
Household owns one cow 9.356 ‐3.255 ‐35.505 ‐0.000
(0.850) (0.116) (0.366) (0.898)
Household owns several cows 37.263 4.393 ‐51.729 0.000
(0.159) (0.361) (0.371) (0.065)*
Head of household completed primary school 30.875 2.090 13.715 ‐0.000
(0.457) (0.156) (0.657) (0.355)
Head of household completed secondary school 62.866 ‐3.830 ‐45.834 0.000
(0.530) (0.642) (0.588) (0.198)
Redistributed between strata for randomization ‐58.066 ‐8.810 ‐100.196 0.000
(0.712) (0.321) (0.499) (0.708)
Constant 268.389 ‐21.343 1,324.191 150.000
(0.204) (0.195) (0.000)*** (0.000)***
Observations 218 218 219 219
Adjusted R‐squared ‐0.003 0.051 0.189 1.000
Note: Robust pval in parentheses; *** p<0.01, ** p<0.05, * p<0.1;
Randomization strata dummies are included in all estimations; Control variables refer to baseline values;
Standard errors are clustered at the village level.
Outcome variables have been transformed to a decimal system. For retransformation multiply with 0.6.

Table 8c: Daily time awake
VARIABLES Total time of
head of
household
Time during
night of head
of household
Treatment 9.019 17.002
(0.739) (0.378)
Consumption of candles ‐0.913 0.304
(0.685) (0.673)
Consumption of kerosene 1.820 ‐5.699
(0.689) (0.133)
Number of household members 13.346 6.049
(0.046)** (0.104)
Number of mobile phones 32.596 15.604
(0.234) (0.189)
Plastered dwelling 50.196 ‐30.972
(0.293) (0.676)
Modern wall ‐39.148 10.260
(0.222) (0.751)
Modern floor ‐20.131 22.464
(0.727) (0.508)
Handcrafted LED 23.839 ‐52.063
(0.551) (0.081)*
Mobile LED 27.487 7.605
(0.741) (0.841)
Household owns land 124.099 ‐46.603
(0.325) (0.149)
Household owns one goat ‐66.221 ‐3.483
(0.068)* (0.916)
Household owns several goats ‐52.641 6.490
(0.094)* (0.770)
Household owns one cow 24.014 ‐20.545
(0.308) (0.268)
Household owns several cows 67.650 13.639
(0.078)* (0.540)
Head of household completed primary school 59.966 4.630
(0.083)* (0.745)
Head of household completed secondary school 101.419 10.572
(0.160) (0.781)
Redistributed between strata for randomization 47.874 ‐15.860
(0.504) (0.762)
Constant 1,132.298 1,563.754
(0.000)*** (0.000)***
Observations 287 256
Adjusted R‐squared 0.001 0.040
Note: Robust pval in parentheses; *** p<0.01, ** p<0.05, * p<0.1;
Randomization strata dummies are included in all estimations; Control variables refer to baseline values;
Standard errors are clustered at the village level.
Outcome variables have been transformed to a decimal system. For retransformation multiply with 0.6.

Table 9a: Study pattern (only households with children at school age; 6‐17 years)
Share of households with
children studying
after school
Share of households with
children studying
at home after nightfall
Treatment 0.053 0.142
(0.389) (0.006)***
Consumption of candles ‐0.008 ‐0.006
(0.188) (0.088)*
Consumption of kerosene 0.200 0.109
(0.005)*** (0.028)**
Number of household members 0.013 0.039
(0.522) (0.025)**
Number of mobile phones 0.152 ‐0.062
(0.077)* (0.115)
Plastered dwelling ‐0.093 ‐0.029
(0.405) (0.768)
Modern wall 0.071 ‐0.074
(0.344) (0.181)
Modern floor ‐0.105 0.001
(0.407) (0.992)
Hand‐crafted LED 0.170 0.111
(0.093)* (0.122)
Household owns land 0.084
(0.379)
Household owns one goat 0.160 0.049
(0.164) (0.494)
Household owns several goats 0.163 0.009
(0.081)* (0.889)
Household owns one cow 0.179 ‐0.035
(0.099)* (0.579)
Household owns several cows 0.139 0.043
(0.211) (0.659)
Head of household completed primary school ‐0.051 ‐0.086
(0.469) (0.076)*
Head of household completed secondary
school
0.174 0.047
(0.353) (0.747)
Redistributed between strata for
randomization
1.404 0.284
(0.000)*** (0.021)**
Pseudo R‐Squared 0.22 0.29
Number of Observations 209 209
Note: Robust pval in parentheses; *** p<0.01, ** p<0.05, * p<0.1;
Randomization strata dummies are included in all estimations; Control variables refer to baseline values;
Standard errors are clustered at the village level.

77
Table 9b: Study pattern (only households with children at school age; 6‐17 years) (1) (2) (3) (4)
Time children study m611
Time children study m611
Time children study f611
Time children study f611
VARIABLES total night total night
Treatment 21.677 20.717 19.396 17.896
(0.093)* (0.045)** (0.533) (0.090)*
Consumption of candles
-0.056 -0.818 -2.145 -2.005
Consumption of kerosene (0.968) (0.525) (0.354) (0.142)
27.913 36.604 35.199 42.368
# of household members (0.141) (0.021)** (0.190) (0.000)***
-0.394 -1.548 0.586 -4.349
Number of mobile phones (0.926) (0.728) (0.952) (0.132)
17.281 -8.491 -36.963 -13.436
Plastered dwelling (0.450) (0.503) (0.218) (0.144)
-14.352 -38.274 -87.895 -35.751
Modern wall (0.639) (0.052)* (0.183) (0.072)*
3.435 26.824 91.559 -6.578
Modern floor (0.861) (0.159) (0.145) (0.726)
-48.736 -36.603 8.429 -29.381
Hand‐crafted LED (0.397) (0.131) (0.889) (0.071)*
23.893 25.171 47.443 57.773
Mobile LED (0.285) (0.293) (0.279) (0.001)***
47.961 78.711 162.397 139.533
Household owns land (0.275) (0.071)* (0.023)** (0.000)***
49.601 41.979 -2.465 0.857
Household owns one goat (0.117) (0.136) (0.941) (0.966)
36.085 6.248 -65.871 -2.252
Hh owns several goats (0.218) (0.828) (0.325) (0.934)
18.801 14.272 -67.680 29.021
Household owns one cow (0.497) (0.581) (0.397) (0.162)
42.575 32.030 88.579 -13.953
Hh owns several cows (0.091)* (0.232) (0.244) (0.430)
39.019 69.939 85.677 22.076
Head of household completed primary
school
(0.286) (0.012)** (0.376) (0.427)
-10.078 3.784 -19.635 9.669
Head of household completed
secondary school
(0.611) (0.748) (0.345) (0.528)
8.449 -13.685 -105.612 -18.220
Redistributed between strata for
randomization
(0.879) (0.798) (0.526) (0.662)
-22.938 -37.743 242.863 58.804
Constant (0.498) (0.129) (0.049)** (0.104)
-55.092 1.256 -4.198 -33.329
(0.231) (0.985) (0.959) (0.346)
Observations 100 101 92 92
Adjusted R‐squared 0.204 0.258 -0.040 0.329
Note: Robust pval in parentheses; *** p<0.01, ** p<0.05, * p<0.1;
Randomization strata dummies are included in all estimations; Control variables refer to baseline values;
Standard errors are clustered at the village level.
Outcome variables have been transformed to a decimal system. For retransformation multiply with 0.6.
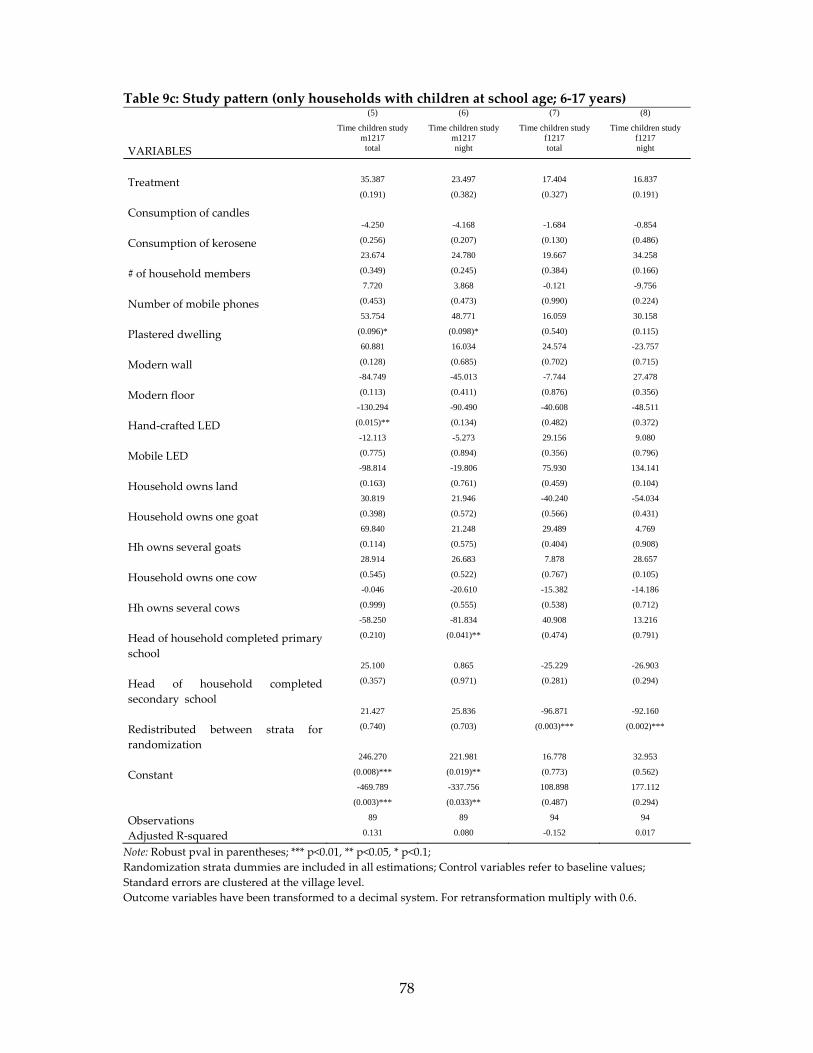
78
Table 9c: Study pattern (only households with children at school age; 6‐17 years) (5) (6) (7) (8)
Time children study m1217
Time children study m1217
Time children study f1217
Time children study f1217
VARIABLES total night total night
Treatment 35.387 23.497 17.404 16.837
(0.191) (0.382) (0.327) (0.191)
Consumption of candles
-4.250 -4.168 -1.684 -0.854
Consumption of kerosene (0.256) (0.207) (0.130) (0.486)
23.674 24.780 19.667 34.258
# of household members (0.349) (0.245) (0.384) (0.166)
7.720 3.868 -0.121 -9.756
Number of mobile phones (0.453) (0.473) (0.990) (0.224)
53.754 48.771 16.059 30.158
Plastered dwelling (0.096)* (0.098)* (0.540) (0.115)
60.881 16.034 24.574 -23.757
Modern wall (0.128) (0.685) (0.702) (0.715)
-84.749 -45.013 -7.744 27.478
Modern floor (0.113) (0.411) (0.876) (0.356)
-130.294 -90.490 -40.608 -48.511
Hand‐crafted LED (0.015)** (0.134) (0.482) (0.372)
-12.113 -5.273 29.156 9.080
Mobile LED (0.775) (0.894) (0.356) (0.796)
-98.814 -19.806 75.930 134.141
Household owns land (0.163) (0.761) (0.459) (0.104)
30.819 21.946 -40.240 -54.034
Household owns one goat (0.398) (0.572) (0.566) (0.431)
69.840 21.248 29.489 4.769
Hh owns several goats (0.114) (0.575) (0.404) (0.908)
28.914 26.683 7.878 28.657
Household owns one cow (0.545) (0.522) (0.767) (0.105)
-0.046 -20.610 -15.382 -14.186
Hh owns several cows (0.999) (0.555) (0.538) (0.712)
-58.250 -81.834 40.908 13.216
Head of household completed primary
school
(0.210) (0.041)** (0.474) (0.791)
25.100 0.865 -25.229 -26.903
Head of household completed
secondary school
(0.357) (0.971) (0.281) (0.294)
21.427 25.836 -96.871 -92.160
Redistributed between strata for
randomization
(0.740) (0.703) (0.003)*** (0.002)***
246.270 221.981 16.778 32.953
Constant (0.008)*** (0.019)** (0.773) (0.562)
-469.789 -337.756 108.898 177.112
(0.003)*** (0.033)** (0.487) (0.294)
Observations 89 89 94 94
Adjusted R‐squared 0.131 0.080 -0.152 0.017
Note: Robust pval in parentheses; *** p<0.01, ** p<0.05, * p<0.1;
Randomization strata dummies are included in all estimations; Control variables refer to baseline values;
Standard errors are clustered at the village level.
Outcome variables have been transformed to a decimal system. For retransformation multiply with 0.6.