a five-year study of lightning paerns across southcentral ... · a five-year study of lightning...
TRANSCRIPT

AFive-YearStudyofLightningPa7ernsAcrossSouthcentralAlaska
RebeccaDuellandMa7hewClayNWSAnchorage

Background• LightningandthunderstormclimatologiesofAlaskahavebeencreated,howeverthesourcesofthedatahavevariedandgenerallyimprovedwithHme.
• ThunderstormClimatologyofAlaska,Grice&Comiskey,1976• UseddatafromtheBLMThunderstormandWildfireSurveillanceProgram(radar,aircraTpatrols,fire-weatherobservingstaHons)1969-1974
• ClimatologyCharacteris7csandObjec7vePredic7onofThunderstormsoverAlaska,Reap,1991• BLMdatafrom1Maythrough30September1987-1989

Background
• AlaskaLightningClimatologyandApplica7ontoWildfireScience,McGuineyetal.,2004• BLMdata1986-2002
• ClimatologyandtheIntra-SeasonalVaria7onofSummer7meCloud-to-GroundLightninginMainlandAlaska,BuckeyandBothwell,2009• BLMdata2000-2007

GriceandComisky,1976 Reap1991
BuckeyandBothwell,2009
ThevastmajorityoflightningstrikesinAlaskaoccurovertheInterior

Background• LightningacHvitypeaks3-6hoursaTerlocalnoon.– ThisindicatesthattheconvecHonisdrivenprimarilybyintensesolarheaHngduringtheaTernoon.
– MostthunderstormsinAlaskaareairmassthunderstorms(notassociatedwithafrontorinstabilityline)(Grice&Comisky1976)
• Mostthunderstormsoccuroverelevatedterrain.– AreasofenhancedstaHcinstabilityandorographicforcing– Lightningstrikesoverhigherterrainpeakearlierthanstrikesoverlowerterrain(Grice&Comisky1976,Reap1991)

ObjecHvesofThisStudy• Whileotherstudieshavefocusstatewide,thisstudywillfocus
primarilyonSouthcentralAlaska.
• PrimaryObjec7ve:ExaminefiveyearsoflightningtrendsoverSouthcentralAlaska
- Howmanydaysayearcanweexpectthunderstormsinourdifferentforecastzones?
- Whatweatherpa7ernsleadtothebiggestlightningevents?

Alaska'sseason-to-datewildfirestaHsHcsasofJune19
• Wildfires:218Es7matedacresburned:153,441Ac7vefires:71Staffedfires:8Human-causedfires:156Lightning-causedfires:62Largestfirestodate:
1)LockwoodFire-22,346acres,GalenaZone,startedbylightningonJune62)PitkaForkFire-16,823acres,SouthwestArea,startedbylightningonJune43)Li7leYetnaFire-16,514acres,SouthwestArea,startedbylightningonJune44)ToikHillFire-16,471acres,GalenaZone,startedbylightningonJune65)BallCreekFire-13,924acres,SouthwestArea,startedbylightningonJune4
h7ps://fire.ak.blm.gov/content/aicc/sitreport/current.pdf
Image:AlaskaDepartmentofNaturalResources–DivisionofForestryFacebookPage
EastForkFire

AlaskaLightningDetecHonNetwork• Changedtonewsystemin2012(TOA)
• ReporHng2.25HmesthelightningstrikescomparedtooldVaisalasensors
• Thisisdueincreasedefficiency,longerrangedetecHonandstatewidesensorcoverage
• 16Sensors• 14inAlaska,2inCanada
Credit:AlaskaInteragencyCoordinaHonCenter

• LightningAcHvityLevel(LAL)isusedtodescribethearealcoverageofthunderstorms,notthenumberofthunderstormsorlightningstrikes.
LALValue Descrip7on ArealCoverage
1 Nothunderstormsexpected 0%
2 Isolatedthunderstorms 5%to25%
3 Widelysca7eredthunderstorms 25%to40%
4 Sca7eredthunderstorms 40%to55%
5 Numerousthunderstorms 55%orgreater
6 DryLightning LALof3anddrythunderstorms
present
WhatisLAL?

Methodology• Downloadedandplo7edALDNdataandclippedthedataforSouthcentralAlaska• RemovedCloudtoCloudLightningstrikes
• Createda10X10kmgridwithinArcMap• CalculatedtheNumberofinstancesoflightningstrikespergrid

10kmLightningGridforSouthcentralAlaska2012-2016

Smoothed10kmLightningGridforSouthcentralAlaska2012-2016
• Usingnearestneighborsmoothing,wecansmooththedatatomakeiteasiertoread

ThunderstormDaysbyGeographicArea
ZoneNumber AverageThunderstormDays/Year
101(Anchorage) 6days/year111(MatanuskaValley) 14.8days/year
121(WesternKenaiPeninsula) 16.8days/year
125(WesternPrinceWilliamSound) 23.8days/day
141(CopperRiverBasin) 76.6days/year145(SusitnaValley) 60.2days/year

ThunderstormDaysvsAverageHighTemperature
Year AverageHighTemp
#ofT-StormDays
2012 62.4°F 1
2013 67.3°F 4
2014 64.6°F 5
2015 68.0°F 9
2016 67.5°F 11
Year AverageHighTemp
#ofT-StormDays
2012 63.6°F 5
2013 68.0°F 7
2014 64.9°F 14
2015 67.7°F 21
2016 67.9°F 27
Anchorage MatanuskaValley(Palmer)

ThunderstormDaysvsAverageHighTemperature
Year AverageHighTemp
#ofT-StormDays
2012 59.9°F 10
2013 61.9°F 12
2014 61.8°F 15
2015 64.1°F 23
2016 64.7°F 24
Year AverageHighTemp
#ofT-StormDays
2012 58.8°F 6
2013 63.3°F 14
2014 61.4°F 24
2015 63.6°F 30
2016 63.9°F 45
WesternKenaiPeninsula(Kenai)
WesternPrinceWilliamSound
(Seward)

ThunderstormDaysvsAverageHighTemperature
Year AverageHighTemp
#ofT-StormDays
2012 64.3°F 37
2013 71.7°F 69
2014 65.3°F 81
2015 68.2°F 80
2016 69.3°F 116
Year AverageHighTemp
#ofT-StormDays
2012 63.7°F 34
2013 69.8°F 51
2014 65.6°F 66
2015 68.0°F 69
2016 68.4°F 81
CopperRiverBasin(Gulkanna)
SusitnaValley(Talkeetna)

ThunderstormDaysvsAverageHighTemperature
0
2
4
6
8
10
12
6263646566676869
2012 2013 2014 2015 2016Num
bero
fThu
nderstormDays
AverageHighTem
perature(F)
Year
Anchorage
AverageHighTemperature #ofT-stormDays
30405060708090100110120
646566676869707172
2012 2013 2014 2015 2016
Num
bero
fThu
nderstormDays
AverageHighTem
perature(F)
Year
CopperRiverBasin(Gulkana)
AverageHighTemperature #ofT-stormDays
VeryweakcorrelaHonbetweenaveragehightemperaturesandthunderstormdays.-Likelya7ributedtoincreasedsensorsacrossAKdetecHngmorelightningstrikes.

LightningStaHsHcs
• Greaterthan99%oflightningstrikesacrossSouthcentralAlaskaoccurbetweenthemonthsofJuneandAugust.
• NumberoflightningstrikesacrosssouthernAlaskahavegenerallybeenincreasingeachyearwith2016themostacHveacrossallzones.
• NodisHnctcorrelaHonbetweenaveragehightemperaturesandlightningstrikes.– It’spossiblethatasmoresensorsareinstalled,thenumberofstrikesbeingdetectedgoesup.
– Pastresearchshowsthatthunderstormsarediurnallydrivenwhichcouldhintatmorewarmoutliersnotpickedupby3monthaverage.

Thunderstormpa7ernsfortheKenaiMountainsandthewesternChugach
Mountains

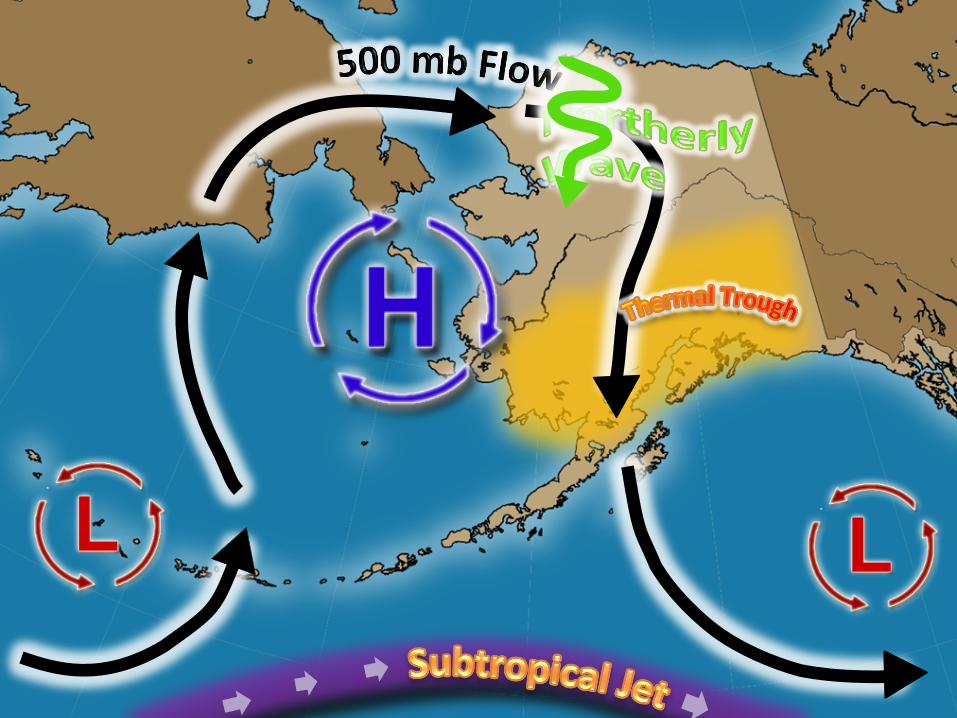
Pa7ern1:NortherlyWave
500mbGeopotenHalHeight 500mbTemperature(°C)

MeanSeaLevelPressure(Pa) 925mbTemperature(°C)
Pa7ern1:NortherlyWave

Pa7ern1:NortherlyWave
Anchorage00ZSounding17June2015
Anchorage06ZSounding17June2015

Pa7ern2(EasterlyWave)
500mbGeopotenHalHeight 500mbTemperature(°C)

MeanSeaLevelPressure(Pa) 925mbTemperature(°C)
Pa7ern2(EasterlyWave)


6/16/2015LightningPlotforAnchorage
*Greenboxesindicatea5kmgridthathadatleastonerecordedlightningstrike
Pa[ern1:NortherlyWaves

6/20/2014LightningPlotforAnchorage
*Greenboxesindicatea5kmgridthathadatleastonerecordedlightningstrike
Pa[ern2:EasterlyWaves

LALComparisonforAnchorage
Date ForecastedLALAbove1500_
ActualLALAbove1500_
ForecastedLALBelow1500_
ActualLALBelow1500_
6/16/2015 6 3(6) 6 2
7/29/2014 1 2 1 2
6/20/2014 2 2 2 2
7/31/2015 2 2 1 1
Overall,forecastsforLALarequiterepresentaHveforAnchorage.-Itappearsthatevenundernortherlywaves(6/16/2015)thattheAnchoragebowlwillbehardpressedtoseeLALof6duetoarealcoveragewithmostthunderstormsresidingovertheChugachMountains.

Thunderstormpa7ernsfortheCopperRiverBasinand
WrangellMountains

500mbGeopoten7alHeight 500mbTemperature(°C)

MeanSeaLevelPressure(Pa) 925mbTemperature(°C)


References• Buckey,D.R.andBothwell,P.D,2009:Climatologyandtheintra-seasonalvariaHonof
summerHmecloud-to-groundlightninginmainlandAlaska.FourthConferenceonMeteorologicalApplicaHonsofLightningData,Phoenix,AZ,Amer.Meteor.Soc.,7pp.
• Grice,G.K.andA.L.Comisky,1976:ThunderstormClimatologyofAlaska.NOAATechnicalMemo.NWSAR-14,36pp.
• Mesinger,F.,andCoauthors,2006:NorthAmericanRegionalReanalysis.Bull.Amer.Meteor.Soc.,87,343–360,doi:10.1175/BAMS-87-3-343
• McGuineyE,ShulskiM,WendlerG(2004)AlaskalightningclimatologyandapplicaHontowildfirescience.Proceedings,ConferenceonMeteorologicalApplicaHonsofLightningData,85thAnnualAMS
• Reap,R.M.,1991:ClimatologyCharacterisHcsandObjecHvePredicHonofThunderstormsoverAlaska.Wea.Forec.,6,309-19.

Acknowledgements
HistoricallightningdataprovidedbytheBureauofLandManagement,AlaskaFireService.
SynopHcImagesprovidedbytheNOAA/ESRL
PhysicalScienceDivision,BoulderColoradofromtheirWebsiteath7p://www.esrl.noaa.gov/psd/
DatausedforthesynopHcimagesfromthe
NorthAmericanRegionalReanalysis