a framework for decreasing lead times by supplier...
TRANSCRIPT
Main title
A framework for decreasing lead times
by supplier collaboration
- A study performed at Mölnlycke Health Care
Master of Science thesis in Supply Chain Management
David Magnusson
Paul Simonsson
Department of Technology Management and Economics
Division of Logistics and Transportation
CHALMERS UNIVERSITY OF TECHNOLOGY
Goteborg, Sweden, 2012
Report No. E2012:044
i
Abstract
It is widely acknowledged that responsiveness to customer demand is an important property to
develop in order to be competitive. Responsiveness is with regards to price, product differentiation
and delivery time, and is partly affected by the lead time of replenished material. Hence, decreasing
lead time provides increased competitiveness. This thesis presents a framework for conducting
quality improvement efforts across company borders, aiming at lead time reduction for replenished
material. The thesis is based on relationship and quality management literature as well as empirical
data gathered from interviews with supply chain professionals within Mölnlycke Health Care as well
as from other companies. The findings show that assessing the relational fit prior to engaging in
inter-firm efforts is beneficial, since it increases the likelihood of successful such efforts. They also
show that a structured way of working is of great importance when working with quality
improvements. For these reasons the framework clarifies what relational aspects to consider in inter-
firm efforts, as well as comprises a process for conducting quality improvements.
The framework consists of three stages, the first one being choosing a supplier to conduct a joint
quality improvement project with. This decision is mainly affected by the financial potential for the
principal of the project, i.e. the customer, and the potential for attaining a cooperative way of
working the companies in between. The second stage deals with initiating the project and revolves
around retrieving the top management commitment of the chosen supplier, which is important for
performing the project as well as for implementing the solutions resulting thereof. The third and final
stage of the framework describes a process for how the project itself should be conducted. It
comprises a set of tools retrieved from the field of quality management; these tools are combined in
a way that provides an easy to use, yet effective process for quality improvement with the aim of
decreasing lead time.

ii
Acknowledgement
This Master of Science thesis was conducted during the spring of 2012 within the Master Degree
Program Supply Chain Management at Chalmers University of Technology in Goteborg, Sweden. The
thesis was carried out at Mölnlycke Health Care’s (MHC) headquarters in Goteborg.
First, we would like to thank Ann-Christine Strigén and Staffan Bröte at MHC for initiating this project
and giving us the opportunity to conduct the thesis at the company. We would further like to give a
special thanks to Katerina Tomaskova who has served as our supervisor at MHC. The continuous
feedback received regarding the expectations and usefulness of the thesis from a MHC perspective
has been very helpful. Furthermore, we want to thank our supervisor at Chalmers, Pehr-Ola Pahlén,
whose support and feedback on our ideas have been very helpful for the success of this thesis.
During the process of writing the thesis we have done numerous interviews and would like to issue a
special thank you to the people interviewed who gave us much needed information. We would like
to thank all people interviewed at MHC and their suppliers. Your information has formed the basis
for findings and results. In addition, we would also like to thank the group put together by Andres
Laas at Autoliv, Peter Lindkvist and Per Siesing at Flexlink and Jenny Lilliehöök at Volvo Powertrain for
the valuable information provided from your perspectives on supplier interactions and lead time.
This project has given us valuable insights regarding lead time reduction and company interactions
and we are very grateful for having gotten this experience.
Goteborg, 2012
David Magnusson Paul Simonsson

iii
Table of contents 1. Introduction ......................................................................................................................................... 1
1.1 Background .................................................................................................................................... 1
1.1.1 Lead time effects .................................................................................................................... 2
1.2 Problem analysis ............................................................................................................................ 4
1.3 Purpose .......................................................................................................................................... 4
1.4 Research questions........................................................................................................................ 4
1.5 Scope ............................................................................................................................................. 4
2. Theoretical Framework ....................................................................................................................... 5
2.1 Process changes and improvements ............................................................................................. 5
2.1.1 Total cost approach in make or buy decisions ....................................................................... 5
2.1.2 Inter-firm connections ............................................................................................................ 7
2.1.3 Measuring inter-firm performance ........................................................................................ 8
2.1.4 Improving inter-firm performance ......................................................................................... 9
2.2 Business relations ........................................................................................................................ 17
2.2.1 Trust and commitment ......................................................................................................... 17
2.2.2 Conflict and cooperation ...................................................................................................... 20
2.2.3 Power and dependence ........................................................................................................ 24
3. Method .............................................................................................................................................. 27
3.1 Data Gathering ............................................................................................................................ 27
3.1.1 Primary data ......................................................................................................................... 27
3.1.2 Secondary data ..................................................................................................................... 28
3.1.3 Critique of method ............................................................................................................... 28
4. Empirical findings .............................................................................................................................. 29
4.1 MHC ............................................................................................................................................. 29
4.1.1 Procurement and replenishment processes ........................................................................ 30
4.1.2 Change and improvement management ............................................................................. 32
4.2 Benchmarks ................................................................................................................................. 33
4.2.1 Autoliv .................................................................................................................................. 33
4.2.2 Flexlink .................................................................................................................................. 34
4.2.3 Volvo Powertrain .................................................................................................................. 35
5. Analysis .............................................................................................................................................. 37
5.1 Total cost approach ..................................................................................................................... 37
5.1.1 Quality in processes .............................................................................................................. 37

iv
5.2 Improving quality ........................................................................................................................ 38
5.3 What to consider in inter-firm efforts ......................................................................................... 44
5.3.1 Choosing suppliers ................................................................................................................ 44
5.3.2 Initiating joint efforts ............................................................................................................ 45
5.3.3 Conducting joint efforts........................................................................................................ 49
6. Discussion .......................................................................................................................................... 51
6.1 Choose supplier ........................................................................................................................... 51
6.2 Initiate effort ............................................................................................................................... 51
6.3 Conduct Effort ............................................................................................................................. 52
6.3.1 Plan ....................................................................................................................................... 52
6.3.2 Do ......................................................................................................................................... 52
6.3.3 Study ..................................................................................................................................... 52
6.3.4 Act ......................................................................................................................................... 53
7. Conclusions ........................................................................................................................................ 54
Bibliography and Appendices
v
Table of Figures Figure 1. Example of products offered by the Surgical division. ............................................................. 1
Figure 2. Example of products offered by the Wound Care division. ..................................................... 1
Figure 3. Relation between lead time and forecast error (Christopher, 2011). ...................................... 3
Figure 4. Guidelines to make or buy decisions, adapted from Jennings (1997). .................................... 5
Figure 5. Costs affected by purchasing, adapted from Gadde and Håkansson (1993). .......................... 6
Figure 6. System of measurements, adapted from Neely et al. (2005). ................................................. 8
Figure 7. The PDSA cycle, adapted from (Bergman & Klefsjö, 2010). ................................................... 10
Figure 8. An example of a value stream map (Rother & Shook, 1999). ................................................ 12
Figure 9. Steps in building a cause-and-effect diagram, adapted from Doggett (2005). ...................... 13
Figure 10. Example of Pareto chart. ...................................................................................................... 14
Figure 11. The seven wastes as presented in Lean production (Hines & Rich, 1997). .......................... 15
Figure 12. Control chart, adapted from (Bergman & Klefsjö, 2010). .................................................... 17
Figure 13. The dimensions and definitions of corporate culture, adapted from Trompenaars and
Prud’Homme (2004). ............................................................................................................................. 21
Figure 14. Relationship characteristics matrix (Gadde, Håkansson, & Persson, 2010). ........................ 21
Figure 15. Competing versus cooperation orientation, adapted from Trompenaars and Prud’Homme
(2004). ................................................................................................................................................... 23
Figure 16. The exchange power matrix, adapted from Cox et al. (2001). ............................................. 24
Figure 17. The sourcing process (Mölnlycke Health Care, 2012b). ....................................................... 30
Figure 18. Call-off raw material and components (Mölnlycke Health Care, 2012b). ............................ 31
Figure 19. Changes in the actor layer at Autoliv. .................................................................................. 34
Figure 20. Lead time performance gap. ................................................................................................ 39
Figure 21. Examples of activities identified in VSM. ............................................................................. 39
Figure 22. Example of Pareto chart. ...................................................................................................... 40
Figure 23.Example of a cause-and-effect diagram. ............................................................................... 41
Figure 24. Example of Pareto chart. ...................................................................................................... 41
Figure 25. Example of a cause-and-effect diagram. .............................................................................. 42
Figure 26. Example of Pareto chart. ...................................................................................................... 42
Figure 27. Example of control chart. ..................................................................................................... 43

1
1. Introduction This chapter briefly presents Mölnlycke Health Care and the problems that the company experience
with long lead times. In addition, a theoretical introduction presents the effects of long lead times
that are put forward in literature. Lead time is here defined as the time in between an order is
submitted to a supplier to when that order arrives at the customer’s facility.
1.1 Background Mölnlycke Health Care (MHC) was originally a textile company, founded in the mid 19th century,
which started to develop textile products for health care applications as a response to the Swedish
textile crisis in the 1950s. Today MHC provides various health care solutions and is a world leading
manufacturer of single-use surgical and wound care products. The company has two separate
business units, Surgical and Wound Care; the former provides products that are used during surgery,
such as drapes and surgical gloves (see Figure 1), while the latter provides products to be used post
surgery, such as wound dressings and wound treatment (see Figure 2).
MHC has manufacturing facilities located in Europe, Asia and North America, which are served by a
supplier base that is spread worldwide, one reason being a limited number of possible suppliers for
some materials. This can for instance be due to few manufacturers of a specific material as well as a
restricted number of suppliers being able to adhere to the quality requirements that MHC and
market regulations demand. The location of suppliers in relation to manufacturing facilities creates
long lead times, which is a problem for a number of reasons, for instance planning of what quantities
to order and manufacture becomes harder. This in turn leads to large safety stocks of material to
Figure 1. Example of products offered by the Surgical division.
Drapes / Gowns Surgical gloves Antiseptics All-in-one surgical kit
Figure 2. Example of products offered by the Wound Care division.
Wound dressings Skin care Negative pressure Biological wound Retention &
wound treatment treatment Compression

2
mitigate the risk of stock outs, resulting in tied-up capital and occupied warehouse space. A high
safety stock level will also lead to obsolete material and won’t fully prevent the necessity for rush
orders. Long lead times decrease the company’s ability to respond to market demand swiftly, which
makes it more expensive to provide a certain service level than if the lead times were shorter.
As of now, MHC has not calculated the actual cost for long lead times, but the company is aware that
they probably are costly. According to a health care industry benchmark, MHC is a midrange
performer when it comes to number of days of sales in inventory, which relates to the safety stock
level, but the company still perceives long times to drive inventory levels and reduce flexibility to
unsatisfactory levels.
As a result of the drawbacks of long lead times, a procurement strategy within the Surgical division
states that lead times should be optimised and that no suppliers should have a lead time that
exceeds a certain number of weeks1 by the year of 2014. For this reason a number of projects will be
launched in collaboration with suppliers to decrease lead times. The company has identified that a
structured way of working will be necessary in order for these projects to succeed. There is presently
no structured way of decreasing lead times nor any structured way to conduct joint improvement
projects; hence such a way of working needs to be developed.
1.1.1 Lead time effects
A challenge facing most companies in today’s customer focused business environment is to create
processes that facilitate responsiveness to customers’ demands (Christopher, 2011). This can for
instance be demands regarding product differentiation and pricing, which need to be considered in
order to be competitive (Gunasekaran, Patel, & Tirtiroglu, 2001). Also short delivery time is widely
recognised to be of great importance to customers, wanting to receive the ordered products as soon
as possible (Ouyang, Wu, & Ho, 2007; Ray & Jewkes, 2004; Da Cunha, Agard, & Kusiak, 2007). The
possibility to provide satisfactory levels of these three competitive dimensions, i.e. price, product
differentiation and delivery time, is dependent on the lead time for fulfilling a customer order, and
by that also the replenishment lead time for material from suppliers.
Product differentiation makes it possible to customise products, creating value for the customer and
therefore also creating a competitive advantage for the offering company (Christopher, 2011). A
manufacturer should not keep stock of all possible product variants, due to that the costs related to
holding inventory of all such variants are substantial; customised products are therefore not suitable
to produce prior to customer order (ibid.). This leads to that demand for customised products is
hampered by a long lead time (Daaboul, Da Cunha, & Bernard, 2011). The inability to keep a full stock
close to all customers is also valid for non-customised items for the same cost related reasons as just
mentioned, which is a limiting factor for the availability of products. This means that a long lead time
makes it harder to follow demand fluctuations in volume and product configuration, which limits the
availability and therefore is a cause for stock outs and discontent customers (Ben-Daya & Raouf,
1994; Ouyang, Wu, & Ho, 2007; De Treville, Shapiro, & Hameri, 2004).
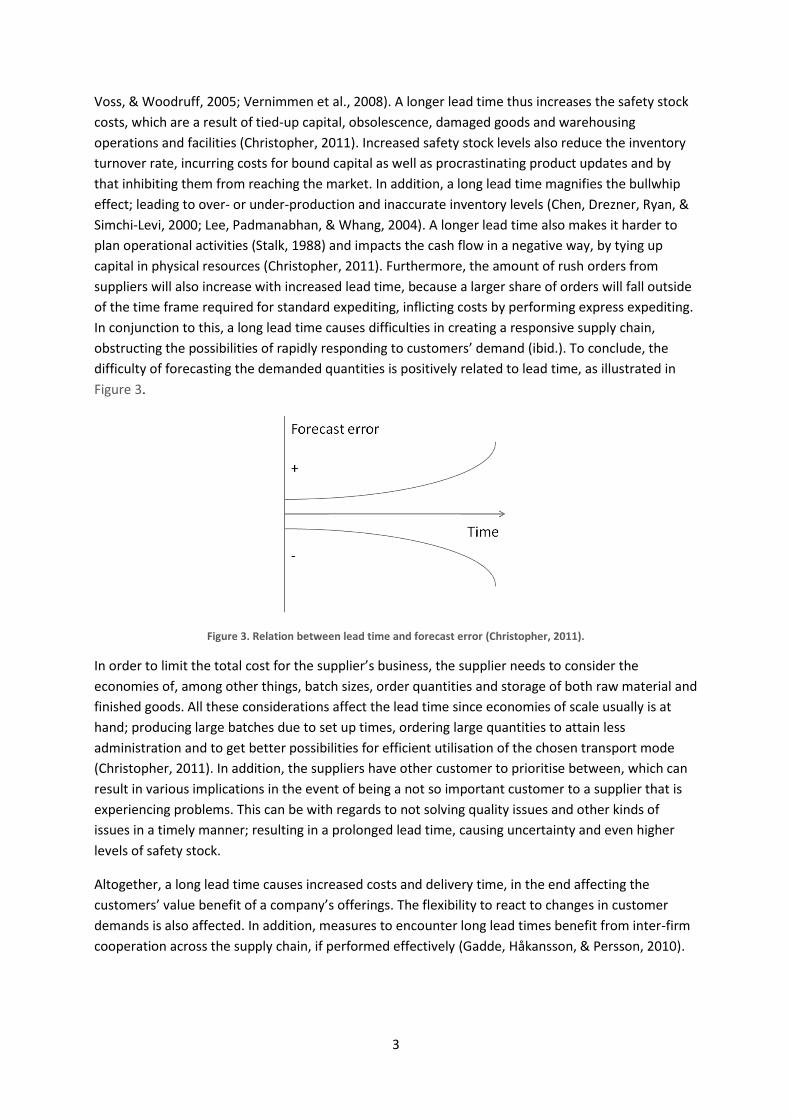
Cost and lead time are intimately connected to each other, both on the supplier side and on the
purchasing side (Ray & Jewkes, 2004). On the purchasing side, lead time has a positive correlation
with the required size of inventory and safety stock levels, that is needed to prevent stock outs (Pahl,
1 The exact number of weeks is known but confidential
3
Voss, & Woodruff, 2005; Vernimmen et al., 2008). A longer lead time thus increases the safety stock
costs, which are a result of tied-up capital, obsolescence, damaged goods and warehousing
operations and facilities (Christopher, 2011). Increased safety stock levels also reduce the inventory
turnover rate, incurring costs for bound capital as well as procrastinating product updates and by
that inhibiting them from reaching the market. In addition, a long lead time magnifies the bullwhip
effect; leading to over- or under-production and inaccurate inventory levels (Chen, Drezner, Ryan, &
Simchi-Levi, 2000; Lee, Padmanabhan, & Whang, 2004). A longer lead time also makes it harder to
plan operational activities (Stalk, 1988) and impacts the cash flow in a negative way, by tying up
capital in physical resources (Christopher, 2011). Furthermore, the amount of rush orders from
suppliers will also increase with increased lead time, because a larger share of orders will fall outside
of the time frame required for standard expediting, inflicting costs by performing express expediting.
In conjunction to this, a long lead time causes difficulties in creating a responsive supply chain,
obstructing the possibilities of rapidly responding to customers’ demand (ibid.). To conclude, the
difficulty of forecasting the demanded quantities is positively related to lead time, as illustrated in
Figure 3.
Figure 3. Relation between lead time and forecast error (Christopher, 2011).
In order to limit the total cost for the supplier’s business, the supplier needs to consider the
economies of, among other things, batch sizes, order quantities and storage of both raw material and
finished goods. All these considerations affect the lead time since economies of scale usually is at
hand; producing large batches due to set up times, ordering large quantities to attain less
administration and to get better possibilities for efficient utilisation of the chosen transport mode
(Christopher, 2011). In addition, the suppliers have other customer to prioritise between, which can
result in various implications in the event of being a not so important customer to a supplier that is
experiencing problems. This can be with regards to not solving quality issues and other kinds of
issues in a timely manner; resulting in a prolonged lead time, causing uncertainty and even higher
levels of safety stock.
Altogether, a long lead time causes increased costs and delivery time, in the end affecting the
customers’ value benefit of a company’s offerings. The flexibility to react to changes in customer
demands is also affected. In addition, measures to encounter long lead times benefit from inter-firm
cooperation across the supply chain, if performed effectively (Gadde, Håkansson, & Persson, 2010).

4
1.2 Problem analysis The current problem is that MHC lacks an established way of working for reducing lead times in
collaboration with the company’s suppliers. The company does not know the actual financial savings
that are generated by decreased lead times.
1.3 Purpose The purpose of this thesis is to provide MHC with a process to be used for shortening lead times in
collaboration with the company’s suppliers and to provide a basis for calculating the financial
benefits of decreased lead times.
1.4 Research questions How can lead times be improved by cooperating with suppliers?
How should MHC work with suppliers in order to improve lead times?
How can MHC visualise the financial benefits gained from lead time reduction?
1.5 Scope This thesis is performed at the Surgical division and is thus delimited to this business unit.
Furthermore, the focus is to identify and generate improvement measures that require cooperation
with suppliers in order to be fully utilised.

5
2. Theoretical Framework This section contains the relevant theory for the thesis. It is divided into two sections; managing
process changes and business relations. It aims to provide a basis for the framework and also provide
means on how to manage the relationship with the supplier.
2.1 Process changes and improvements It is important to have a structured way of working when conducting quality improvement efforts; by
working according to a defined process one can conduct similar improvement efforts without the
need for reinventing the process each time it is needed (Bergman & Klefsjö, 2010).
2.1.1 Total cost approach in make or buy decisions
When making a decision whether one should make or buy a specific item, the company need to
evaluate what is more advantageous. Taking a total cost approach enables one to take in all costs
involved in the manufacturing or purchase of a product in order to find the most beneficial for the
firm. Both qualitative aspects, such as quality control, and quantitative aspects, such as relative costs,
need to be involved when making the decision (Business Dictionary, 2012).
Jennings (1997) presents five factors that need to be emphasized when making a make or buy
decision. These factors can be seen in Figure 4.
Figure 4. Guidelines to make or buy decisions, adapted from Jennings (1997).
The first factor, business environment contains aspects such as the firm’s competitive advantage,
flexibility and consonance with changes in the overall organizations environment (Jennings, 1997).
The implications from choosing strategy need to be considered on a long-term basis since it might be
hard to reverse the decision.
The second factor is capability and basically states that the one with the best capability to make the
specific task should conduct it (Jennings, 1997). The challenge here lies in defining and knowing
which of the firm’s capabilities that is within the company’s core and which that are peripheral. It is
more likely that a core activity is kept in house, both based on that the company probably has better
Make or buy?
Business environment
Capability
Technology Supplier
relationships
Cost
6
capabilities for making it and that it is important for the company’s competitive advantage. It is also
important to consider whether an outsource decision has the potential of creating competitors
(ibid.).
Technology is also important to consider when making these decisions. Jennings (1997) states that
being able to access technology and maturity of these is a prerequisite of a company’s competitive
advantage. If a supplier can provide new or have a better maturity of its technology it can be a good
reason to make a buy decision.
There are several important aspects to account for when managing the supplier relationship. The
first step should be a careful evaluation of the supplier’s capabilities and culture so that it
complements one’s own. It is also important to present clear expectations regarding performance
and service (Jennings, 1997). Furthermore, one should aim to develop trust and commitment to the
relationship.
Cost aspects are probably those aspects that are most considered when making a make or buy
decision (Jennings, 1997). Even though the direct costs of buying might be lower, especially when
outsourcing to a low cost country, one must consider the indirect costs associated with this. Van
(2010) states that it is important to address the transaction costs when making a make or buy
decision. He furthermore categorize them as (1) costs associated with establishing, monitoring and
enforcing the contract, (2) costs associated with managing the relationship with the external party,
and (3) costs that are associated with the transaction itself. Gadde et al. (2010) exemplifies this with
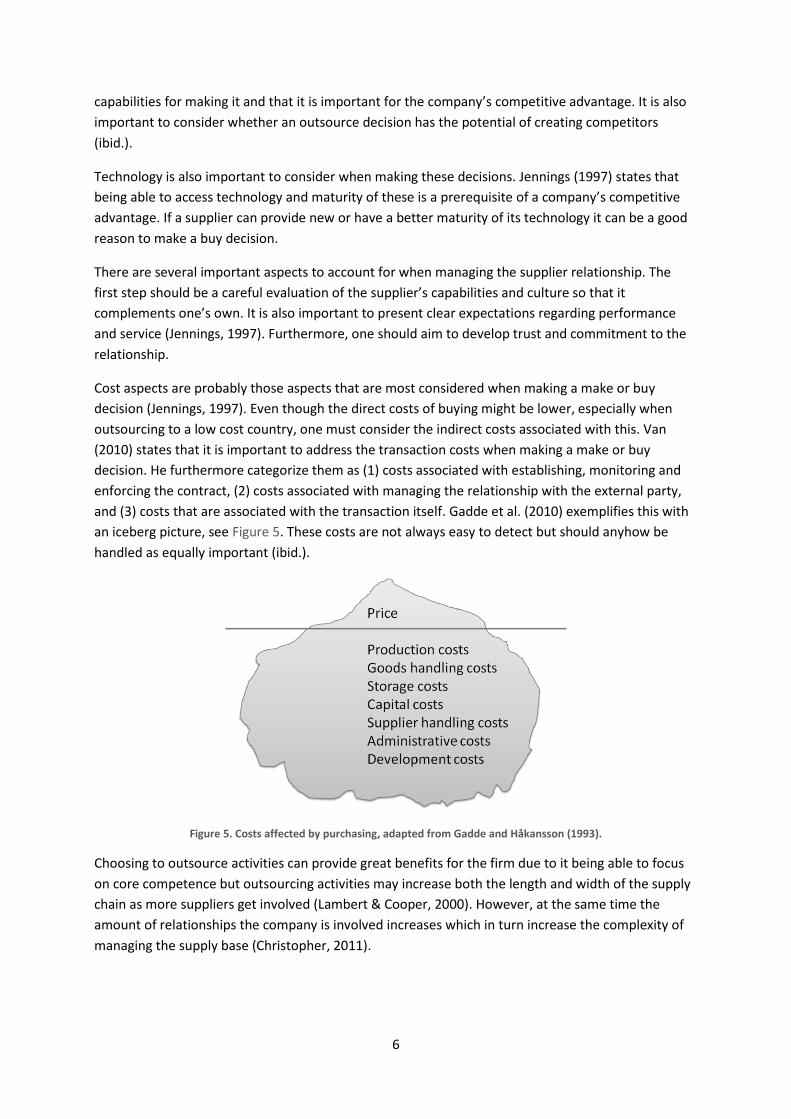
an iceberg picture, see Figure 5. These costs are not always easy to detect but should anyhow be
handled as equally important (ibid.).
Figure 5. Costs affected by purchasing, adapted from Gadde and Håkansson (1993).
Choosing to outsource activities can provide great benefits for the firm due to it being able to focus
on core competence but outsourcing activities may increase both the length and width of the supply
chain as more suppliers get involved (Lambert & Cooper, 2000). However, at the same time the
amount of relationships the company is involved increases which in turn increase the complexity of
managing the supply base (Christopher, 2011).
7
2.1.2 Inter-firm connections
Most companies are utilising suppliers and are therefore part of a network of companies, although
not directly linked, affecting each other (Gadde, Håkansson, & Persson, 2010). Gadde et al. (2010)
describes these links between companies as composed of three layers; the actor, resource and
activity layer. It is valuable to have notion about these three layers to understand how a company
affects and is affected by other companies’ businesses, and by that, providing a foundation for
effective and efficient inter-organisational performance improvement efforts.
2.1.2.1 Actor layer
The actor layer is the network of actors, which is the entity that controls resources and performs
activities, that make out the business landscape (Håkansson & Snehota, 1995). By studying the actor
layer it is possible to put the focal company into a context, thus providing a greater understanding of
the interests and behaviour of that company (Gadde, Håkansson, & Persson, 2010). A supplier can for
instance be dealing with customers that have different preferences, some being more in line with the
supplier’s own preferences. This may cause the supplier to prioritise these customers’ wishes over
others’, for instance in the event of considerations on what technology to invest in or how to set up
logistics arrangements. The actors are linked together by actor bonds, which are a prerequisite to be
able to utilise the resources actors in between (Håkansson & Snehota, 1995). The actor bonds
constitute of among other things, commitments, obligations and social interaction; these dimensions
make the actor bonds an important factor to manage, to bring about changes in the resource and
activity layers (Gadde, Håkansson, & Persson, 2010). This is particularly important considering that a
change to these layers in one business relation will affect those of another one (ibid.). This can for
instance mean that a supplier, by making a decision to increase the service level for one customer, in
fact at the same time decreases the possible service level for another one. Changes can however also
provide strengthening positions for all the supplier’s customers, by actors developing improvements
to the resource and activity layers that are in line with all the customers’ preferences.
2.1.2.2 Resource layer
The resource layer denotes how the actors’ resources are connected to each other (Håkansson &
Snehota, 1995). What is important is how well a resource connects to other resources, both intra-
and inter-organisational wise; the value of a resource thus depends on how it is connected to other
resources (Gadde, Håkansson, & Persson, 2010). The value of a resource such as a production
system can for example increase, by altering a resource which it is connected to, such as the
products built in the system. By achieving a better alignment between product design and the
production system, the result is increased value in terms of greater operational efficiency (Pero et al.,
2010). Resources are classified in accordance with the 4R model presented by Håkansson and
Waluszewski (2002), i.e. the physical resources: products and facilities and the organisational
resources: organisational units and business relationships. The products resource includes the
products which are manufactured and distributed and the facilities resource includes the hardware
for conducting manufacturing and distribution such as manufacturing and logistics equipment and
the available infrastructure (Gadde, Håkansson, & Persson, 2010). The resource of organisational
units comprehends the available knowledge and abilities of those, while the business relationships
resource concerns how business units interact with each other to create value (ibid.). All four
categories of resources interact with and affect each other, making it both important to understand
how value is generated by the combining of resources. What is more, it is important and complex to
understand what effects that changes to one resource will have on another one.

8
2.1.2.3 Activity layer
The activity layer comprises a company’s entire set of activities, which in many ways affect each
other, creating activity links (Håkansson & Snehota, 1995). Together, the activities and their links
form an activity pattern, showing the relations between different activities, for instance product
development and manufacturing (Gadde, Håkansson, & Persson, 2010). These relations contain a
certain degree of interdependency between activities, signifying how dependent one activity is upon
another one to be able to be performed (ibid.). In order to perform a specific task, for example the
manufacturing of a product, the order of the concerned activities need to be structured, creating an
activity configuration. In the case of manufacturing, this naturally comprehends activities related to
the information and material flow. The activities supporting the material flow include for example
materials handling, manufacturing, packaging and distribution, while the information flow involves
everything from handling of customer orders to procurement. These activities can be broken down
further into sub-activities, for instance the manufacturing activity can consist of the activities casting,
cutting, honing, drilling, cleaning, welding, painting and assembly. In addition to the manufacturing
related activities just mentioned, there are a number of activities that needs to be performed such as
marketing, human resource management and financing (ibid.). The most important aspects of the
activity layer are the interdependencies among activities that in conjunction with the design and
configuration of activities have a great impact on a company’s performance (Håkansson & Snehota,
1995).
2.1.3 Measuring inter-firm performance
In order to enhance the performance of an activity, one must first measure it (Neely, Gregory, &
Platts, 2005). It is therefore important to track the performance of not only one’s own activities but
also activities of actors affecting one’s own firm.
Performance measurements aim to measure the performance of pre-defined actions or occurrences
in order to control and improve the performance of these activities (Neely, Gregory, & Platts, 2005).
These measurements then form a system of measurements that should incorporate all important
aspects that aims to be measured (ibid.).
Figure 6. System of measurements, adapted from Neely et al. (2005).
Performance measurements can, according to Setijono and Dahlgaard (2007), be divided into two
groups; proactive and reactive measurements. Reactive measurements are based on monitoring
previous actions and its performance. Examples of such are on time deliveries and order fulfilment.
Proactive performance measurements instead aim to track the eventual improvements of a process
Individual
measurement
Individual
measurement
Individual
measurement
Individual
measurement
Whole system

9
such as yearly price cuts or lead time reductions. Setijono and Dahlgaard (2007) define the reactive
measurements as Key Performance Indicators (KPIs) and the proactive as Key Improvement
Indicators (KIIs). Furthermore, Setijono and Dahlgaard (2007) states that it is not always easy to
define the difference between these two types of performance measurements and that they can
overlap within different areas.
Performance measurements can hinder cooperation if they are chosen so that different business
functions or different companies have conflicting ones (Jüttner, Christopher, & Baker, 2007).
According to Jüttner et al. (2007), this is quite common to have between the marketing and sales
areas and the operational areas such as manufacturing and purchasing. In order to have a total cost
approach it is important that measurements benefit the overall business performance and not only
the specific departments. Jüttner et al. (2007) furthermore recommends businesses to also reduce
the number of performance measurements in order to more easily respond to market forces.
Commonly measured reactive performance measurements towards suppliers are for example service
level and quality (Neely, Gregory, & Platts, 2005). The service level measures the percentage of
deliveries made with the right quantity at the right time. In addition to the reactive measurements,
commonly used proactive performance measurements are cost reduction and lead time reduction
(Neely, Gregory, & Platts, 2005). These are often used on a more tactical or strategic level than the
reactive performance measurements that are based on a more operational level.
2.1.4 Improving inter-firm performance
Performance needs not only to be measured but also improved; inter-firm performance can be
improved by using the basis from the ARA-model in order to change and improve the different layers
as presented by Gadde et al. (2010).
2.1.4.1 Re-configuring activities
By re-configuring activities or moving them in the activity layer, one can reap benefits in both cost
and quality (Gadde, Håkansson, & Persson, 2010). Dubois (1998) provides an example from Swefork2
where the company initially had a supplier for pre-machined plates and several suppliers of
components delivered from several suppliers to a storage facility at Swefork. The next activity, the
welding process, was triggered when all needed components together with the pre-machined plates
became available. In order to have low costs, Swefork had relatively unsophisticated methods for the
welding activity and in order to improve the efficiency of the process the activity was moved to the
supplier supplying the pre machined plates, which resulted in lower total costs.
2.1.4.2 Resource re-combining
A supplier may have resource capabilities that are either complementary or superior to the buying
company’s resources. By re-combining the available resources within the supply network, one can
gain improvements that are unable to attain by just using the own firm’s resources. This can however
be hard to evaluate due to that all resources provided by the network might not be known. It also
requires the purchasing department at the buying firm to work strategically and long-term in order
to make the necessary changes (Gadde, Håkansson, & Persson, 2010).
2 Fictional name for a real company

10
2.1.4.3 Actor re-positioning
Actor interaction is required in order to re-combine resources and re-configure activities. The impact
of interventions of actors is mostly decided by two factors; the interaction atmosphere and the
identity of the actors (Gadde, Håkansson, & Persson, 2010).
2.1.4.4 Process quality
A company can increase its competitiveness by attending to the processes affecting a product’s
quality, which is defined as “a product’s ability to satisfy, or preferably exceed, the needs and
expectations of the customers” (Bergman & Klefsjö, 2010, pp. 23). In order to work with quality
improvements there are a number of methods and tools developed and used within the field of
quality management. For instance a method called the Plan-Do-Study-Act cycle can be utilised to
structure the activities that need to be performed during an improvement effort (ibid). Furthermore
there are a number of tools, such as Value stream mapping, the Pareto chart and the cause-and-
effect diagram that can be used for identifying improvement areas and solutions. This can also be
done by considering waste reduction, which is one of the principles of Lean production (Hines & Rich,
1997). In conclusion, the developed solutions will relate to and affect one or several of the layers of
the ARA model and can for instance comprehend a restructuring of the actor layer. The following
chapters provide a further elaboration on this and explain the presented methods and tools more in
detail.
2.1.4.5 The Plan-Do-Study-Act cycle
It is important to perform quality improvement efforts systematically; the Plan-Do-Study-Act (PDSA)
cycle is a problem solving method providing a structured way of working (Bergman & Klefsjö, 2010).
The cycle is commonly illustrated as seen in Figure 7.
Figure 7. The PDSA cycle, adapted from (Bergman & Klefsjö, 2010).
The first step, Plan, starts with describing the problem affecting quality; large problems should be
broken down into smaller ones to be manageable. In conjunction, one has to understand the needs
and requirements that are present in order to clarify the performance gap that the problem causes,
and by that also clarify the extent of the required quality improvements. After the problem has been
specified one establishes potential root causes of the problem; a cause-and-effect diagram is often
useful for this task. In order to verify the assumptions made about what causes the problem, data is
collected and compiled in for instance a Pareto chart to illustrate the results. After causes have been
verified, solutions to be developed and approved by management.
Act Plan
Do Study
11
The second step, Do, comprehends implementing solutions to solve the chosen problem.
The third step, Study, comprehends following up the results of the implemented changes to make
sure that these have had the wished for effect. Data is collected and evaluated by for instance a
Pareto chart. Once improvements are convincingly attained, a control chart can be used to track the
new and improved quality level to secure that it is retained.
The fourth step, Act, comprehends using the experience gained from the improvement process to
avoid the same problem occurring again by establishing new routines supporting the new and
improved quality level. An important part of this step is also to evaluate how the improvement
process was performed in order to improve it as well.
2.1.4.6 Value stream mapping
The main reason for mapping a value stream is to discover waste in the production in order to
eliminate it (Rother & Shook, 1999). The mapping includes all activities within the investigated part
of the supply chain, including both value adding and non-value adding. A value stream perspective
means that one does not only investigate single operations but instead takes the big picture under
consideration and aims to improve the sum of the operations, not the single ones. The larger picture,
the better since the risks of sub-optimization decreases. However, at the same time, the complexity
increases with the increase of scope (Rother & Shook, 1999). Since mapping is complex, one should
not choose to map all products but instead choose one product or product family to map at a time.
Both the production and information flows are important to map. The production flow is how
products flow through the processes in the investigated area and the information flow are the
activities that trigger each process in the physical flow.
When mapping the value stream it is important to use visual and graphical tools since these makes
the map easier to interpret. According to Rother and Shook (1999) it is not as important to use the
figures defined in the literature as using consistent figures that is easy to understand in the current
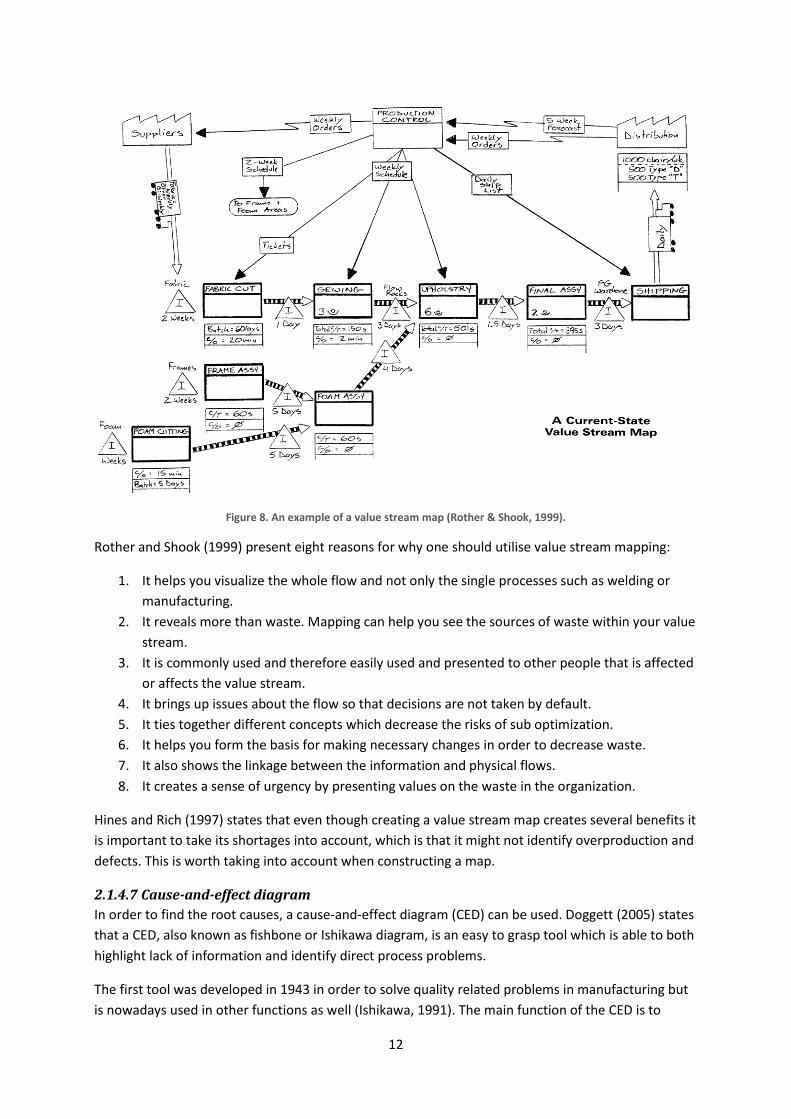
work situation. Figure 8 shows an example of how a mapped factory setting can be viewed and also
provides an example on which figures one can use while doing a value stream map. The boxes are
processes and a process is defined as when the goods are active at that place (ibid.). One could break
down the processes even further and create a value stream map within each process if one needs to.
The triangles are storage zones. It can be raw material, work in progress and finished goods stock.
The lines are either physical flows (thick lines) or information flows (thin lines).
12
Figure 8. An example of a value stream map (Rother & Shook, 1999).
Rother and Shook (1999) present eight reasons for why one should utilise value stream mapping:
1. It helps you visualize the whole flow and not only the single processes such as welding or
manufacturing.
2. It reveals more than waste. Mapping can help you see the sources of waste within your value
stream.
3. It is commonly used and therefore easily used and presented to other people that is affected
or affects the value stream.
4. It brings up issues about the flow so that decisions are not taken by default.
5. It ties together different concepts which decrease the risks of sub optimization.
6. It helps you form the basis for making necessary changes in order to decrease waste.
7. It also shows the linkage between the information and physical flows.
8. It creates a sense of urgency by presenting values on the waste in the organization.
Hines and Rich (1997) states that even though creating a value stream map creates several benefits it
is important to take its shortages into account, which is that it might not identify overproduction and
defects. This is worth taking into account when constructing a map.
2.1.4.7 Cause-and-effect diagram
In order to find the root causes, a cause-and-effect diagram (CED) can be used. Doggett (2005) states
that a CED, also known as fishbone or Ishikawa diagram, is an easy to grasp tool which is able to both
highlight lack of information and identify direct process problems.
The first tool was developed in 1943 in order to solve quality related problems in manufacturing but
is nowadays used in other functions as well (Ishikawa, 1991). The main function of the CED is to

13
illustrate the possible causes of a particular problem by sorting and relating the causes in a
classification scheme (Doggett, 2005). The activities of constructing and studying the diagram intend
to promote discussion and stimulate knowledge acquisition (ibid.). According to Fredendall et al.
(2002) the CED process can be seen as an exercise in structured brainstorming. The reasoning behind
CED is that one cannot or should not act until the cause and effect relationship of a problem is
known, the CED thus attempts to present related actions in order for action to be taken (Doggett,
2005).
Ishikawa (1991) presents five steps that one should take when constructing a CED:
Step 1: Decide upon the problem to improve.
Step 2: Draw an arrow and write the problem on the arrow’s right side, according to Figure 9.
Steps in building a cause-and-effect diagram, adapted from Doggett
Step 3: Write the main factors that might be causing the problem as branches connected to
the arrow.
Step 4: Write down minor causes as twigs attached to the major branch causes. Even smaller
twigs can be attached to these twigs if one intends to go deeper with a cause.
Step 5: Ensure that all possible causes are included in the CED.
Figure 9. Steps in building a cause-and-effect diagram, adapted from Doggett (2005).
Bhote (1988) presents some weaknesses with CED and states that there is a risk that some causes
might be missed and that it is very dependent on the group performing the CED. Sproull (2001)
agrees and states that CED is heavily dependent on the group’s knowledge about the problem and
wrongly formed group will not be able to find all causes to the problem.
2.1.4.8 Pareto chart
Decisions that are taken for improving quality should be based on facts to secure that the right
decisions are being made; therefore collecting data on the occurrence of identified causes is
14
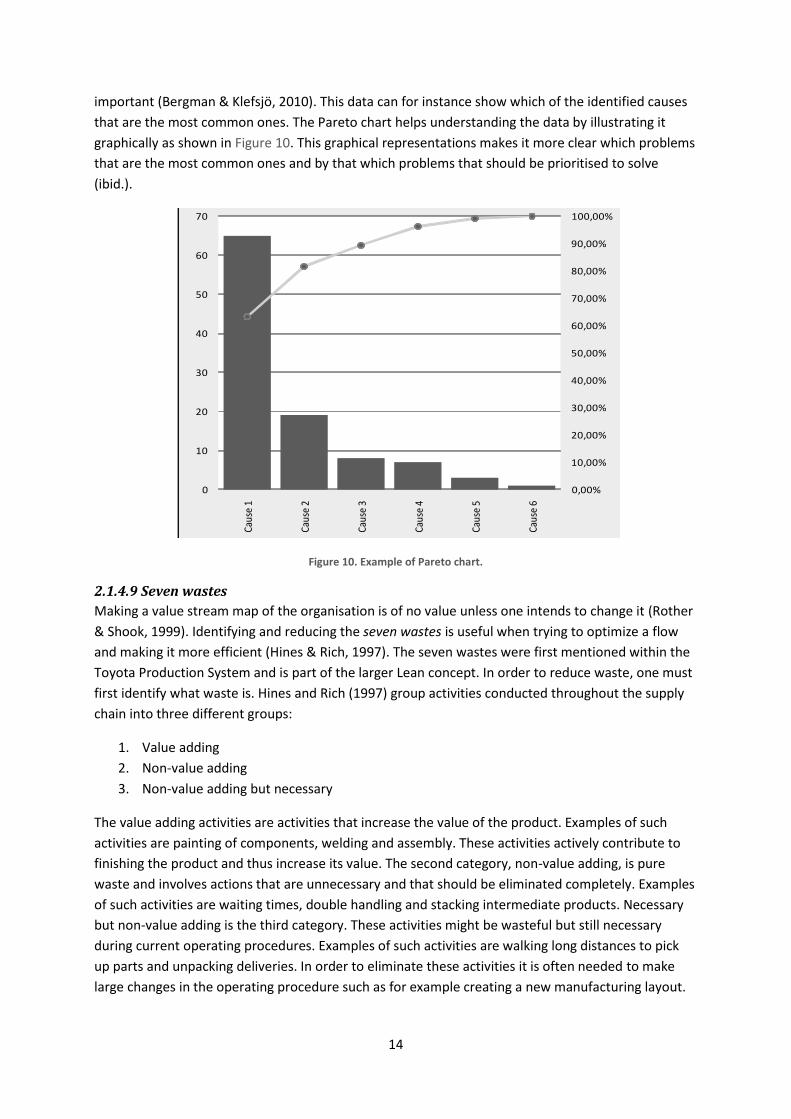
important (Bergman & Klefsjö, 2010). This data can for instance show which of the identified causes
that are the most common ones. The Pareto chart helps understanding the data by illustrating it
graphically as shown in Figure 10. This graphical representations makes it more clear which problems
that are the most common ones and by that which problems that should be prioritised to solve
(ibid.). Pareto Analysis total: 103
Category Frequency/Quantity Cumulative %
Cause 1 65 63,11%
Cause 2 19 81,55%
Cause 3 8 89,32%
Cause 4 7 96,12%
Cause 5 3 99,03%
Cause 6 1 100,00%
0,00%
10,00%
20,00%
30,00%
40,00%
50,00%
60,00%
70,00%
80,00%
90,00%
100,00%
0
10
20
30
40
50
60
70
Caus
e 1
Caus
e 2
Caus
e 3
Caus
e 4
Caus
e 5
Caus
e 6
Figure 10. Example of Pareto chart.
2.1.4.9 Seven wastes
Making a value stream map of the organisation is of no value unless one intends to change it (Rother
& Shook, 1999). Identifying and reducing the seven wastes is useful when trying to optimize a flow
and making it more efficient (Hines & Rich, 1997). The seven wastes were first mentioned within the
Toyota Production System and is part of the larger Lean concept. In order to reduce waste, one must
first identify what waste is. Hines and Rich (1997) group activities conducted throughout the supply
chain into three different groups:
1. Value adding
2. Non-value adding
3. Non-value adding but necessary
The value adding activities are activities that increase the value of the product. Examples of such
activities are painting of components, welding and assembly. These activities actively contribute to
finishing the product and thus increase its value. The second category, non-value adding, is pure
waste and involves actions that are unnecessary and that should be eliminated completely. Examples
of such activities are waiting times, double handling and stacking intermediate products. Necessary
but non-value adding is the third category. These activities might be wasteful but still necessary
during current operating procedures. Examples of such activities are walking long distances to pick
up parts and unpacking deliveries. In order to eliminate these activities it is often needed to make
large changes in the operating procedure such as for example creating a new manufacturing layout.
15
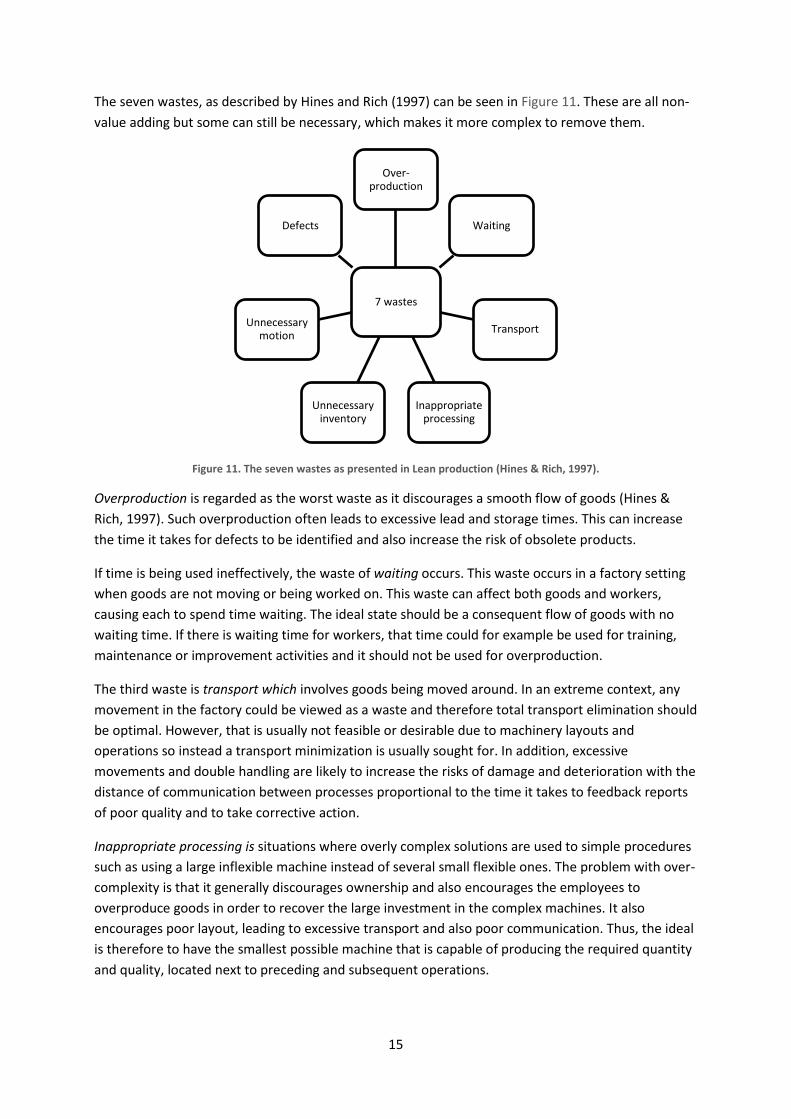
The seven wastes, as described by Hines and Rich (1997) can be seen in Figure 11. These are all non-
value adding but some can still be necessary, which makes it more complex to remove them.
Figure 11. The seven wastes as presented in Lean production (Hines & Rich, 1997).
Overproduction is regarded as the worst waste as it discourages a smooth flow of goods (Hines &
Rich, 1997). Such overproduction often leads to excessive lead and storage times. This can increase
the time it takes for defects to be identified and also increase the risk of obsolete products.
If time is being used ineffectively, the waste of waiting occurs. This waste occurs in a factory setting
when goods are not moving or being worked on. This waste can affect both goods and workers,
causing each to spend time waiting. The ideal state should be a consequent flow of goods with no
waiting time. If there is waiting time for workers, that time could for example be used for training,
maintenance or improvement activities and it should not be used for overproduction.
The third waste is transport which involves goods being moved around. In an extreme context, any
movement in the factory could be viewed as a waste and therefore total transport elimination should
be optimal. However, that is usually not feasible or desirable due to machinery layouts and
operations so instead a transport minimization is usually sought for. In addition, excessive
movements and double handling are likely to increase the risks of damage and deterioration with the
distance of communication between processes proportional to the time it takes to feedback reports
of poor quality and to take corrective action.
Inappropriate processing is situations where overly complex solutions are used to simple procedures
such as using a large inflexible machine instead of several small flexible ones. The problem with over-
complexity is that it generally discourages ownership and also encourages the employees to
overproduce goods in order to recover the large investment in the complex machines. It also
encourages poor layout, leading to excessive transport and also poor communication. Thus, the ideal
is therefore to have the smallest possible machine that is capable of producing the required quantity
and quality, located next to preceding and subsequent operations.
7 wastes
Over-production
Waiting
Transport
Inappropriate processing
Unnecessary inventory
Unnecessary motion
Defects

16
Unnecessary inventory tends to increase lead time, preventing rapid identification of problems and
increasing space, thereby discouraging communication. Thus, problems are hidden by inventory. To
correct these problems, they first have to be found. This can be achieved only by reducing inventory.
In addition, unnecessary inventories create significant storage costs and, hence, lower the
competitiveness of the organization or value stream wherein they exist.
Unnecessary movements involve the ergonomics of a production process where operators have to,
bend, stretch and pick up products when these actions could be avoided. This waste is not only direct
but it also is tiring for the employees and thus is likely to lead to poor productivity, potential
healthcare issues and, often, to quality problems.
The bottom-line waste is defects which affect the direct costs for a firm. The philosophy from Toyota
is that defects should not be regarded as something to be traded off against other parts within the
production but instead as opportunities to improve the production. Thus defects are collected so
that they can be investigated and improved. An important part of the Toyota Production System is
the continuous improvements and reduction of defects.
2.1.4.10 Control chart
After solutions have been implemented and a new quality level has been achieved, one wishes to
secure that this level is retained; Bergman and Klefsjö (2010) present the control chart as a useful
tool to for this purpose. The idea is to continuously collect and evaluate data from the improved
process, in order to detect changes in the process that affects the quality level.
The starting point is to decide upon a process quality indicator (PQI), which is a quantitative measure
correlating to the process’s quality performance, such as the number of defective units. The PQI is
expressed in a control chart, for instance as the arithmetic mean of observations ( ). One type of
control chart utilising the arithmetic mean is the -chart, which is used to track deviations from an
expected mean (µ). The arithmetic mean ( ) value is calculated from the number of observations
that are taken in each sample according to ∑ ⁄ , where n is the number of observations in
each sample.
The second step in setting up a control chart is to decide upon upper (UCL) and lower (LCL) control
limits; as long as the PQI resides within the control limits the process is in statistical control and is
seen as stable. A LCL is wished for since it brings attention to performance improvements, deliberate
as well as non deliberate. The control limits are chosen by deciding upon the number of standard
deviations ( ⁄ ) from the expected mean (µ), which is a consideration between the risk of
false alarms and how quickly too large deviations are spotted. If is normally distributed, the control
limits can be set to ⁄ with a reasonable relation between risk and the amount of false
alarms. To clarify, when a control chart has an escalating PQI, as illustrated in Figure 12, this signals
that something in the process needs to be adjusted.

17
Figure 12. Control chart, adapted from (Bergman & Klefsjö, 2010).
When starting controlling a process, the µ and values need to be determined in order to set the
control limits. An estimator ( ) for µ is attained by taking a number of samples (k), preferably at least
20-25, comprehending n units each. The estimator is the mean of the sample means according to
( ⁄ ) ( ).
The standard deviation ( ) can then be calculated by using either the s-method or the R-method. In
the former the standard deviation (s) for each sample (k) is calculated and then put into the formula:
. The value for c4 is a list value that depends on the number of units (n) in the
samples and can be found in Appendix 2. The value of ⁄ is used as the estimator for in
calculating the control limits.
In the R-method the range (R), i.e. the difference between the largest and the smallest value, in each
sample is calculated and put into the formula: ⁄⁄ ⁄
. The value for d2 is a list
value that depends on the number of units (n) in the samples and can be found in Appendix 2. The
value of ⁄ is used as the estimator for in calculating the control limits.
2.2 Business relations In today’s business environment it is common notion that supply chains rather than individual
companies compete against each other (Baiman & Rajan, 2002; Cousins & Spekman, 2003; Lambert
& Cooper, 2000). As the ARA model illustrates, there are a number of inter-organisational aspects
affecting a supply chain’s performance. With this in mind it is evident that performance
improvements will have to be carried out across organisational boundaries in order for supply chains
to be as competitive as possible (Cousins & Spekman, 2003; De Crombrugghe & Le Coq, 2003),
providing means for a total cost approach (Dubois, 2003). An important prerequisite for inter-
organisational efforts is good relations (Luo, 2002), which are dependent upon among other things,
social interaction, trust and commitment (Gadde, Håkansson, & Persson, 2010).
2.2.1 Trust and commitment
The concept of trust in an organisational setting refers to an actor’s intention to accept vulnerability
in a business relationship, based on expectations that the other party will not exploit this
vulnerability (Dyer & Chu, 2011; Rousseau, Sitkin, Burt, & Camerer, 1998). There is thus an element
of risk embedded, as trust is based on one party relying on another (Bachmann & Inkpen, 2011; Luo,
x
x x
x x
x
Upper control limit = µ + 3
Central line = µ
Lower control limit = µ - 3
Time
xsgsg

18
2002). Trust can be seen to be a substitute for control (Luo, 2002) and therefore a complement to
contracts (Blomqvist, Hurmelinna, & Seppänen, 2005). Risk and interdependence, for instance as a
result of investments, are consequently requisites for trust (Dyer & Chu, 2011; Luo, 2002).
A difference is made between inter-organisational and inter-personal trust, they are however closely
related (Luo, 2002) as one affects the other (Blomqvist & Ståhle, 2000). For instance can a company
representative such as a salesperson improve the perceived trustworthiness of the company by
acting trustworthy (ibid.). Inter-organisational trust is defined as “the extent of trust placed in the
partner organisation by the members of a focal organisation” and inter-personal trust is defined as
“the trust placed by the individual boundary spanner in her individual opposite member” (Zaheer,
McEvily, & Perone, 1998, pp. 142).
Inter-organisational trust is for example affected by legal regulations (Bachmann & Inkpen, 2011),
company processes and routines (Dyer & Chu, 2011), company reputation (Bachmann & Inkpen,
2011; Blomqvist & Ståhle, 2000), and corporate culture (Blomqvist & Ståhle, 2000; Dyer & Chu, 2011;
Lazear, 1999; Luo, 2002; MacDuffie, 2011). Inter-personal trust on the other hand is affected by how
communication is handled (Morgan & Hunt, 1994) and the level of social interaction conducted
between the parties in a business relationship (Bachmann & Inkpen, 2011; Blomqvist & Ståhle, 2000;
Dyer & Chu, 2011; Gadde, Håkansson, & Persson, 2010; Havila, Johanson, & Thilenius, 2004; Luo,
2002).
In addition to inter-organisational and inter-personal, trust may also be divided into calculative and
relational components (Bachmann & Inkpen, 2011), where the former is based on rational choice
(Luo, 2002) and can be a result of aligning goals (Dyer & Chu, 2011) and/or legal regulations and
certifications (Bachmann & Inkpen, 2011). Trust is thereby made out of several separate components
and actors may thus trust each other in some respects but not in others (Gadde, Håkansson, &
Persson, 2010).
Closely related to trust is commitment (Havila, Johanson, & Thilenius, 2004), which is defined as “an
exchange partner believing that an ongoing relationship with another is so important as to warrant
maximum efforts at maintaining it; that is the committed party believes the relationship is worth
working on to ensure that it endures indefinitely” (Morgan & Hunt, 1994, pp. 23). Commitment is
thus materialised in time and sense of urgency of relation related activities (Blomqvist & Ståhle,
2000) and entails sacrificing short-term benefits in favour of long-term relational investments
(Gadde, Håkansson, & Persson, 2010). This cost of lost opportunity consequently makes it important
to consider the pros and cons of pursuing a trust-building behaviour (Dyer & Chu, 2011). Lastly, the
nature of commitment can be moral or calculative, the latter meaning that an actor is chosen
because it is the less inappropriate (ibid.)
Trust and commitment are important properties of a business relationship as they lead to a
cooperative way of working, which promotes long-term benefits over short-term opportunistic
behaviour (Morgan & Hunt, 1994; Havila, Johanson, & Thilenius, 2004). They are thus important for
building strategic alliances (Zaheer, McEvily, & Perone, 1998) and are crucial elements to business
exchange (Gadde, Håkansson, & Persson, 2010). Commitment is also necessary to be able to reap
relationship benefits as it comprehends relationship specific investments, for example (ibid.). In
conclusion, developing trust is valuable as conditions for reaching network benefits of scale and
scope are improved (Blomqvist, Hurmelinna, & Seppänen, 2005). A lack of trust on the other hand is
19
a common cause for alliance failures (Trompenaars & Prud'Homme, 2004). It can also have
tremendous impact on business relationships, as the global financial crisis is an example of, which
above all is a trust crisis (Bachmann & Inkpen, 2011).
There is a positive relation between trust and performance (Luo, 2002; Zaheer, McEvily, & Perone,
1998), a relation that intensifies as market uncertainty increases and resource interdependency gets
stronger (Luo, 2002). The importance of trust to performance can however vary between firms and
vary over time for a specific firm (ibid.). Trust contributes to increased performance since transaction
costs are decreased (Bachmann & Inkpen, 2011; Zaheer, McEvily, & Perone, 1998) and that it
encourages investments in the business relationship required for attaining relationship benefits
(Gadde, Håkansson, & Persson, 2010; Havila, Johanson, & Thilenius, 2004). In addition, new ideas
may be more easily developed and shared as knowledge may be commonly pooled and the winnings
thereof are trusted to be shared in a fair way (Bachmann & Inkpen, 2011). A trusting relationship
consequently makes out a competitive advantage (Dyer & Chu, 2011).
As mentioned, trust and commitment are intimately linked and according to some authors, e.g. Dyer
and Chu (2011), Havila et al. (2004) and Luo (2002), commitment results in trust, while others, for
instance Morgan and Hunt (1994) and Blomqvist (2005) claim that trust results in commitment. The
relationship between trust and commitment is thus not clear with the relationship being a complex
interplay them in between (Gadde, Håkansson, & Persson, 2010). For example, an actor needs to
make commitment in a business relationship to seem trustworthy, while on the other hand an actor
needs to be trusting in order to make commitments in a business relationship (ibid.).
As inter-organisational trust is influenced by company processes and routines, trust may be gained
by the supplier selection process if it favours renewing contracts with existing suppliers rather than
always utilising competitive bidding for new orders (Dyer & Chu, 2011). Also routines that deal with
supplier problems can enhance trust, for example by providing assistance for effective problem
resolution (ibid.). Processes and routines also contribute to trustworthiness by unifying the
behaviour of the employees and by that decreasing the uncertainty of what response to expect from
the company, regardless of which employee one interacts with (Blomqvist & Ståhle, 2000).
The employee behaviour is also affected by corporate culture as it can be developed to support
trustworthy manners among employees (Blomqvist & Ståhle, 2000). However, differences in
corporate culture may cause differing perceptions of what constitutes a trustworthy behaviour
(Trompenaars & Prud'Homme, 2004). An example of this is that the perception of trustworthy
behaviour may be that one follows present processes consistently, while others may appreciate a
certain degree of flexibility to be a constituent of trust (ibid.). Additionally, differences in national
culture can obstruct initial trust development and are thus a barrier in building trust (Luo, 2002),
national culture is however not as important as corporate with regards to building inter-
organisational trust (Dyer & Chu, 2011; MacDuffie, 2011). As corporate culture affects the behaviour
of employees, trustworthiness can be achieved for instance by establishing a professional code of
conduct (Bachmann & Inkpen, 2011). Also, actions can be taken to mitigate the ubiquitous issues
caused by differences in culture, for instance by educating cultural differences and similarities to
better accept diversity and by conducting inter-firm workshops where members of the different
firms get to work together (Blomqvist & Ståhle, 2000).
20
Inter-personal trust is enhanced by positive emotions about the other party since a positive attitude
gives an inclination towards a positive evaluation of the other party’s character; additionally, the
opposite relation is also prevalent (Jones & George, 1998). The importance of social interaction in
building inter-personal trust is widely recognised, e.g. by Bachmann and Inkpen (2011) and Dyer and
Chu (2011), partly because personal ties are strengthened and that it provides better possibilities to
interpret the other party’s behaviour and motivations (Dyer & Chu, 2011). Social interaction also
entails giving advice, social support and recognition, which contribute to building trust (Blomqvist &
Ståhle, 2000). However, developing trust by social interaction takes a lot of time and may therefore
be quite uneconomical (Bachmann & Inkpen, 2011). It can also dissolve fairly easy, as a result of
changes caused by internal conflicts or external threats, for example (Gadde, Håkansson, & Persson,
2010).
Inter-personal trust is also affected by how communication between actors is conducted and is
particularly important when the possibilities for social interaction are limited (Blomqvist & Ståhle,
2000). By communicating issues timely, clearly and precise (ibid.) as well as communicating market
intelligence, expectations and performance evaluations of the other party’s achievements, trust can
be enhanced (Morgan & Hunt, 1994).
2.2.2 Conflict and cooperation
Business relationships consist of conflicts as well as cooperative efforts, which are a natural outcome
of actors’ interests sometimes being contradictive and sometimes being coincidental (Gadde,
Håkansson, & Persson, 2010). Conflict is closely related to the concept of power (Welch & Wilkinson,
2005), as conflict commonly is defined to be a result of an actor using its power to insist another
actor to do things that are not in line with its goals (Rosenbloom, 1999). The impact of the conflict
depends on the scope and intensity of the disagreement that is the base for the conflict (ibid.). Also
the way in which power is applied affects the impact; a coercive approach will be destructive for the
relationship, for example (Gadde, Håkansson, & Persson, 2010). The sources of conflicts thus are
disagreements of some kind, which commonly relate to goal divergence, communication problems,
disagreement over roles and/or differing perceptions of reality (Rosenbloom, 1999). Additionally,
differences in corporate culture can be a source of conflict (Vargas-Hernandéz & Noruzi, 2009).
Corporate culture may however also be a foundation for cooperation (ibid.). There are numerous
definitions of corporate culture (Schein, 2004), with Trompenaars and Prud’Homme (2004) providing
four such definitions, each representing a different dimension of the corporate culture according to
Figure 13. In addition, corporate culture is affected by its national roots, which makes it important to
understand the related national culture in order to understand the characteristics of the corporate
culture (ibid.).

21
Figure 13. The dimensions and definitions of corporate culture, adapted from Trompenaars and Prud’Homme (2004).
As mentioned, both conflicts and cooperation are natural occurrences in business relationships, and
by assessing the level of conflict and cooperation respectively, one can appreciate the characteristics
of the relationship, as presented in Figure 14 (Gadde, Håkansson, & Persson, 2010). The figure thus
prescribes that conflict is not inherently negative, but rather depends on how conflicts are handled;
by handling them through cooperation, a foundation for creativity is provided (ibid.). Poorly handled
conflicts can however lead to a decline in efficiency as they threaten core organisational processes
(Vargas-Hernandéz & Noruzi, 2009).
Figure 14. Relationship characteristics matrix (Gadde, Håkansson, & Persson, 2010).
Conflicts can be handled and/or prevented by various countervailing measures, for instance by
learning how to handle conflicting cultures or negotiation strategies or by dealing with the structures
and rules that affect the business relationship (Kolb & Putnam, 1992). An example of the latter is to
attend to goal divergence between actors, which in agency theory is known as the agency problem
(Eisenhardt, 1989). Eisenhardt (1989) describes the agency problem to arise when an actor (principal)
hires another actor (agent) to perform a task and their respective self-interests cause them to have
conflicting goals and additionally have different perceptions of risk. The principal thus wishes to
make sure the agent is acting in line with the interests of the principal, which can be achieved by
monitoring the agent by the use of budgeting systems and reporting procedures, for example (ibid.).
Monitoring may however be costly and complex (ibid.) as well as risks undermining the agent’s
willingness to act in the best interest of the relationship (Stephen & Coote, 2007). In addition to the

22
issues mentioned above, a self-interest seeking behaviour among the actors may also lead to an
overall loss of efficiency (Hennet & Arda, 2008; Vargas-Hernandéz & Noruzi, 2009).
In order to align goals and distributing risk between the principal and the agent, agency theory
suggests utilisation of contracts (Eisenhardt, 1989) by which improved performance and decreased
risk can be obtained (Hennet & Arda, 2008). Stephen and Coote (2007) find that in conjunction to
contracts also relational behaviour, such as solidarity and trustworthiness, affects the possibilities for
achieving goal alignment. The reasoning behind this is that social interactions among actors bring
about strong relational bonds that support the generation of common relational norms as well as
improve inter-firm cooperation (ibid.). Furthermore, Nan (2011) establishes that mutually increased
awareness of business partner’s interests and needs also provides support for constructive inter-firm
cooperation.
The value of awareness and social interaction in resolving conflicts is supported by Asmus et al.
(2006), who present a case where environmental activists and a multinational corporation sat down
and engaged in a dialogue to resolve a dispute over how rainforests were affected by the company’s
business practices. By the counterparts being able to explain their positions they were able to
understand the interests and needs of each other, and by engaging in social interaction a greater
level of trust and acceptance was attained, which provided a greater possibility to affect the actions
of the counterpart (ibid.).
Another source of conflict mentioned is communication problems. Closely related is the language
barrier, which play an important role in the origination of such problems (Vargas-Hernandéz &
Noruzi, 2009). Also more subtle aspects of communication such as body language and tone of voice
affect how interaction is perceived (Schein, 2004). Conflicts may thus be avoided if actors in a
business relationship are able to understand and communicate with each other without
misconceptions (ibid.). This can for instance be achieved by utilising translators or learning a
language to be able to communicate in a common language (Lazear, 1999). Language also relates to
the problem of differing perceptions of reality, as different corporations attach different value to
what is a good product, good quality, low cost, fast market entry etcetera (Schein, 2004). For actors
to be able to communicate effectively it is thus important to establish common definitions, which
may be achieved by educational interventions, for example (ibid.).
Finally, differences in corporate culture may be a source of conflicts in business relationships, as perception, values and behaviour of cooperating actors may not fit well with each other (Vargas-Hernandéz & Noruzi, 2009). By being aware of and understanding cultural differences, one thus can avoid conflicts caused by irritation and anxiety over an actor’s seemingly irrational behaviour (Schein, 2004). Trompenaars and Prud’Homme (2004) complement that it is important to view differing cultures just as being different rather than being wrong, as a lack of respect for the differences can lead to mistrust between partners. A step on the way to gain a greater insight of national culture can for instance be accomplished by consulting bicultural competence (Lazear, 1999). Also numerous models for mapping the characteristics of corporate culture are developed, e.g. Trompenaars and Prud’Homme (2004), Goffee and Jones (1996) and Hofstede (1991). There is however no “perfect fit” to seek in a business partner to avoid conflict, as conditions for these vary (Vargas-Hernandéz & Noruzi, 2009), as does business environments and organisations (Goffee & Jones, 1996). What is more is that corporate culture may vary within an organisation and deviate between organisational units such as large divisions down to small teams (ibid.; Schein, 2004).
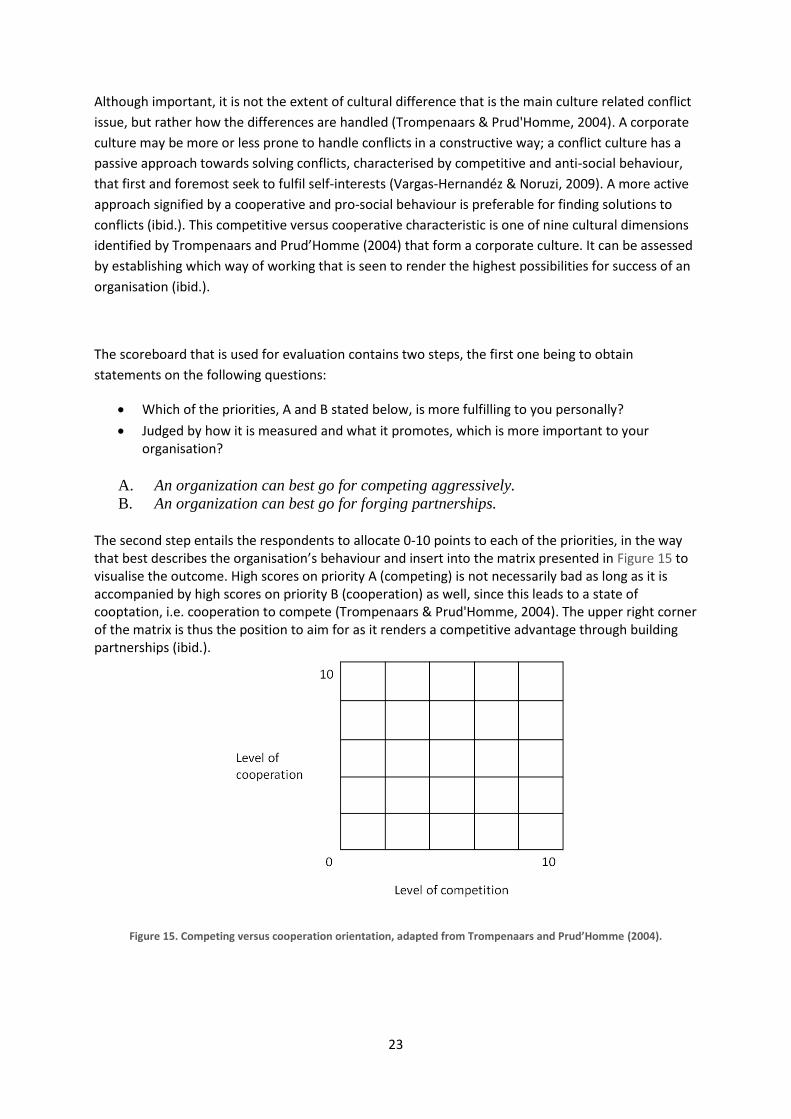
23
Although important, it is not the extent of cultural difference that is the main culture related conflict
issue, but rather how the differences are handled (Trompenaars & Prud'Homme, 2004). A corporate
culture may be more or less prone to handle conflicts in a constructive way; a conflict culture has a
passive approach towards solving conflicts, characterised by competitive and anti-social behaviour,
that first and foremost seek to fulfil self-interests (Vargas-Hernandéz & Noruzi, 2009). A more active
approach signified by a cooperative and pro-social behaviour is preferable for finding solutions to
conflicts (ibid.). This competitive versus cooperative characteristic is one of nine cultural dimensions
identified by Trompenaars and Prud’Homme (2004) that form a corporate culture. It can be assessed
by establishing which way of working that is seen to render the highest possibilities for success of an
organisation (ibid.).
The scoreboard that is used for evaluation contains two steps, the first one being to obtain
statements on the following questions:
Which of the priorities, A and B stated below, is more fulfilling to you personally?
Judged by how it is measured and what it promotes, which is more important to your organisation?
A. An organization can best go for competing aggressively.
B. An organization can best go for forging partnerships.
The second step entails the respondents to allocate 0-10 points to each of the priorities, in the way that best describes the organisation’s behaviour and insert into the matrix presented in Figure 15 to visualise the outcome. High scores on priority A (competing) is not necessarily bad as long as it is accompanied by high scores on priority B (cooperation) as well, since this leads to a state of cooptation, i.e. cooperation to compete (Trompenaars & Prud'Homme, 2004). The upper right corner of the matrix is thus the position to aim for as it renders a competitive advantage through building partnerships (ibid.).
Figure 15. Competing versus cooperation orientation, adapted from Trompenaars and Prud’Homme (2004).

24
2.2.3 Power and dependence
Dahl (1957) defines power as the ability of an actor to influence another to act in the manner that
they would not have otherwise. All business relationships are subjected to a balance of power; which
has its roots in the resource dependency theory (Argyres & Liebeskind, 1999), meaning that actors to
a varying degree are dependent upon other actors’ resources (Pfeffer & Salancik, 2003). Pfeffer and
Salancik (2003) also present a framework for assessing the level of dependence between actors; the
framework state that dependence is affected by three dimensions: resource importance,
concentration of resource control and discretion over resources. Resource importance is further
divided into relative magnitude and criticality. The relative magnitude signifies what proportion of
the total input that the resource presents and criticality is how important the resource is for
continuing the business of the actor. Concentration of resource control relates to how many actors
that are available for a specific resource and discretion over resources denotes the possibility to
control the allocation and use of a resource. This control is generated by any of five influential
factors: possession of the resource, ownership of the resource, control of access to the resource,
control of actual use of the resource and lastly making the rules that regulate the resource. As an
example, a purchaser controls allocation of resources, although not owning them (Pfeffer & Salancik,
2003). To conclude, power is affected by the dependence of specific resources and the control of
those resources (ibid.).
A result of the resource dependency theory is that the more dependent an actor is upon another
actor’s resources, the higher relative power this actor will enjoy, thus creating an imbalance of power
(Gadde, Håkansson, & Persson, 2010). There are basically four types of such power relations in
dyadic business relationships, as shown in Figure 16 (Cox et al.,2001).
Figure 16. The exchange power matrix, adapted from Cox et al. (2001).
A power relation signified by independence may exist when there is a good availability of both
customers and suppliers and there are low switching costs (Ritter, Wilkinson, & Johnston, 2004) as in
the case of office consumables, for example. In this kind of relation, power can be exploited since
actors easily can choose to conduct business with others in case conflicts get too severe (Gadde,
Håkansson, & Persson, 2010).
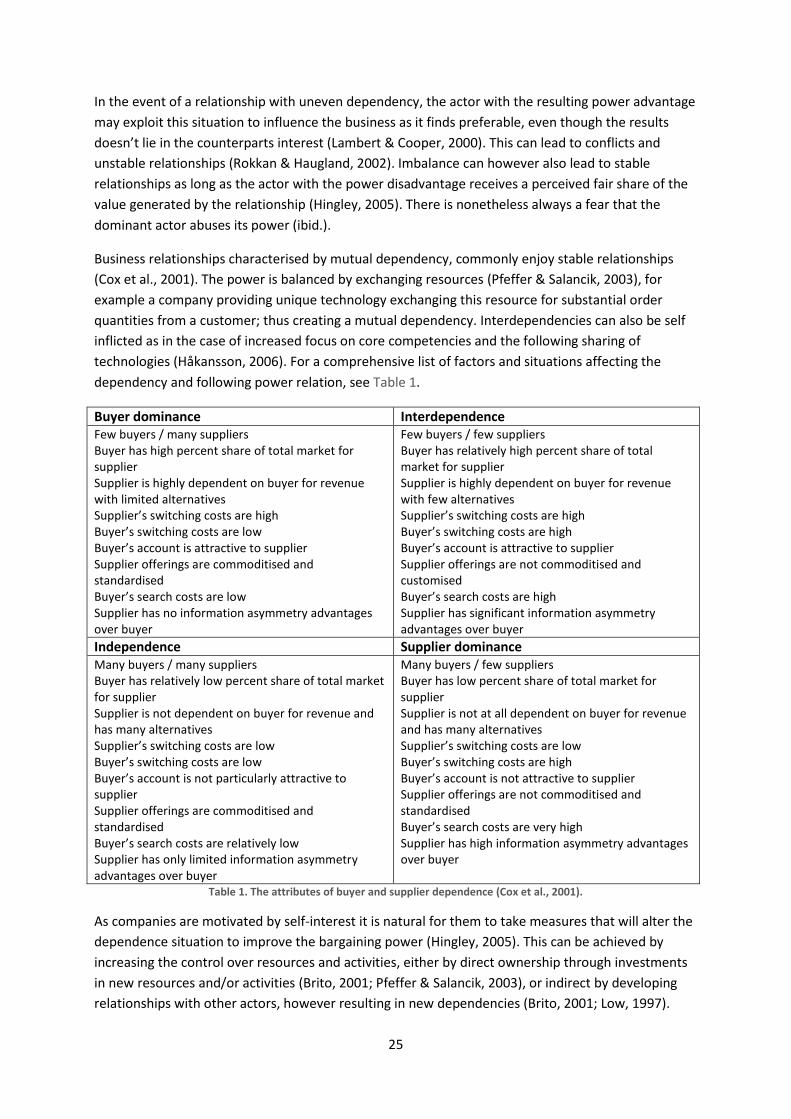
25
In the event of a relationship with uneven dependency, the actor with the resulting power advantage
may exploit this situation to influence the business as it finds preferable, even though the results
doesn’t lie in the counterparts interest (Lambert & Cooper, 2000). This can lead to conflicts and
unstable relationships (Rokkan & Haugland, 2002). Imbalance can however also lead to stable
relationships as long as the actor with the power disadvantage receives a perceived fair share of the
value generated by the relationship (Hingley, 2005). There is nonetheless always a fear that the
dominant actor abuses its power (ibid.).
Business relationships characterised by mutual dependency, commonly enjoy stable relationships
(Cox et al., 2001). The power is balanced by exchanging resources (Pfeffer & Salancik, 2003), for
example a company providing unique technology exchanging this resource for substantial order
quantities from a customer; thus creating a mutual dependency. Interdependencies can also be self
inflicted as in the case of increased focus on core competencies and the following sharing of
technologies (Håkansson, 2006). For a comprehensive list of factors and situations affecting the
dependency and following power relation, see Table 1.
Buyer dominance Interdependence Few buyers / many suppliers Buyer has high percent share of total market for supplier Supplier is highly dependent on buyer for revenue with limited alternatives Supplier’s switching costs are high Buyer’s switching costs are low Buyer’s account is attractive to supplier Supplier offerings are commoditised and standardised Buyer’s search costs are low Supplier has no information asymmetry advantages over buyer
Few buyers / few suppliers Buyer has relatively high percent share of total market for supplier Supplier is highly dependent on buyer for revenue with few alternatives Supplier’s switching costs are high Buyer’s switching costs are high Buyer’s account is attractive to supplier Supplier offerings are not commoditised and customised Buyer’s search costs are high Supplier has significant information asymmetry advantages over buyer
Independence Supplier dominance Many buyers / many suppliers Buyer has relatively low percent share of total market for supplier Supplier is not dependent on buyer for revenue and has many alternatives Supplier’s switching costs are low Buyer’s switching costs are low Buyer’s account is not particularly attractive to supplier Supplier offerings are commoditised and standardised Buyer’s search costs are relatively low Supplier has only limited information asymmetry advantages over buyer
Many buyers / few suppliers Buyer has low percent share of total market for supplier Supplier is not at all dependent on buyer for revenue and has many alternatives Supplier’s switching costs are low Buyer’s switching costs are high Buyer’s account is not attractive to supplier Supplier offerings are not commoditised and standardised Buyer’s search costs are very high Supplier has high information asymmetry advantages over buyer
Table 1. The attributes of buyer and supplier dependence (Cox et al., 2001).
As companies are motivated by self-interest it is natural for them to take measures that will alter the
dependence situation to improve the bargaining power (Hingley, 2005). This can be achieved by
increasing the control over resources and activities, either by direct ownership through investments
in new resources and/or activities (Brito, 2001; Pfeffer & Salancik, 2003), or indirect by developing
relationships with other actors, however resulting in new dependencies (Brito, 2001; Low, 1997).
26
Both Low (1997) and Pfeffer and Salancik (2003) also conclude that forming strong social
relationships, increase interdependencies between actors and thus provide high entry barriers for
new actors. In addition, Nair et al. (2011) propose the utilisation of a resource development strategy
to improve bargaining power by altering the dependence between actors. Such a resource
development strategy can be fulfilled by combining and recombining resources (Gadde, Håkansson,
& Persson, 2010). Furthermore, Low (1997) argues that bargaining power is time-dependent, as
demand for specific resources and activities vary over time.
Some business relationships require investments in resources on one actor’s behalf as a prerequisite
for further business; after such investments have been made, the dependency of the investing actor
increases (Argyres & Liebeskind, 1999). In order to prevent a shift in bargaining power as well,
contracts containing exclusivity clauses should be utilised under these circumstances (ibid.).
Additionally, information can be used to increase the influence over other actors; by possessing more
knowledge about other actors, resources and activities than the competitors (Håkansson &
Johansson, 1992). This is exemplified by Fairhead and Griffin (2000), who present a case of an Irish
plant belonging to a subsidiary of General Motors. The management of this plant identified the
possibility of rationalisation efforts among the company’s eight European plants and acted upon that
knowledge. By gaining and utilising information about competing plants, the management team
could provide a business case that included continued utilisation of the Irish plant and thus managed
to stay in business.
In addition to increasing control as a means to increase bargaining power, an actor can work towards
limiting dependence of scarce resources and by that, decrease the impact of low bargaining power
(Pfeffer & Salancik, 2003). Pfeffer and Salancik (2003) present two ways to fulfil this strategy, one
being to develop suitable replacements and the other one being to adopt diversification. Developing
replacements can for instance mean changing the materials that are used in a product or changing
the characteristics of the final product to fit another market than the present one. The authors
exemplify the latter with a cereal producer that could complement the production of breakfast
cereals with natural cereals, which were sold as snack foods and by that, establishing products in an
additional market, which limited the dependence on the breakfast cereals. Diversification is
described as a more radical approach as it concludes exploring other lines of business into new
products, technologies, markets etcetera.

27
3. Method There are mainly two different approaches for conducting research, quantitative method or
qualitative method. The quantitative method usually aims to provide measurable findings such as for
example diffusion of a product in a market (Eriksson & Wiedersheim-Paul, 2008). When using a
qualitative method the researcher is interested in explaining why a certain phenomenon occurs and
thus, examines content and patterns in the related context (ibid.). In this thesis a qualitative method
is applied since the purpose of is to develop a framework for how MHC can reduce its lead times in
cooperation with its suppliers. The qualitative data gained both in interviews and in literature and
the findings from these sources is the basis for the developed framework for lead time reduction.
Thus, an inductive research approach has been used. With an inductive stance, the theory is the
outcome of the observations and findings (Eriksson & Wiedersheim-Paul, 2008). This differs from the
deductive approach where the researcher aims to derive a hypothesis from a theory and then test it
(Haig, 2005). The inductive strategy of linking data and theory is typically associated with the
qualitative research method (Bryman & Bell, 2007).
3.1 Data Gathering The collection of data was a central part of the work and in order to provide a good framework to
MHC, the quality of the assembled data was crucial. The primary data was mainly derived from
interviews, both with personnel within and outside MHC, but also from brainstorming sessions. The
secondary data was collected by literature searches on relevant topics and observations of their
internal network.
3.1.1 Primary data
Björklund and Paulsson (2007) states that primary data is newly collected data that is to be used in a
specific study. The primary data from this study has been assembled through interviews with
academics and with key personnel at MHC and other companies that have a strong emphasis on
supplier management. The interviews with academics was less structured and aimed to give us ideas
and guidance in the work process in order to find general information regarding the subject.
Interviews conducted with corporate personnel outside of MHC aimed to provide us with
information regarding how other companies work with supplier relations and inter-firm efforts.
These interviews were semi-structured and aimed to provide us insights and tools from their ways of
work. This results in that the findings from the interviewed companies emphasise different areas and
can therefore not be compared directly to each other. The companies were chosen based on their
long experience from working with supplier relations and well known procedures for this. MHC
personnel were interviewed in order to get an understanding for their work and to map their
processes. The empirical section is to a large extent based on the interviews with MHC personnel and
the interviews with other companies. Not included in these interviews are the reoccurring
discussions with the tutors at MHC. See Appendix 1 for a list of interviewees and interview
templates.
In addition to the interviews, brainstorming sessions were used regularly in order to both get new
ideas but also to secure that the information known was perceived in the same way.

28
3.1.2 Secondary data
Secondary data is information and data collected by someone else with other purposes than for the
particular study. It is therefore important to remember that this data might be biased and that it
might not be comprehensive (Björklund & Paulsson, 2007). The secondary data collected was both
the literature used in the literature study and the empirical data regarding the processes that MHC
works with. This was gathered from the company’s Intranet.
An extensive literature study has been made in order to not be biased. The literature chosen to be
included in this report is the one found relevant for the topic and it has been chosen in discussions
with the tutors at MHC and at Chalmers. Most data has been found through online searches in
different data bases for articles and through local libraries for the books that have been used.
The literature study is based on two different areas; process improvement and relationship
management. Process improvements aim to provide an extensive framework on how to change and
improve processes both within the firm and also in the interaction with other actors. It is centred on
the PDSA (Plan, Do, Study, Act) method and includes the concepts of value stream mapping and
cause-and-effect finding. The relationship management section aims to give a guide on managing
business relations and how one can influence the relationship in a buyer-supplier situation. It
includes concepts such as trust, commitment and power in business relations.
Secondary data have also been gathered at MHC. The data gathered here is presented in the
empirical findings chapter and has mostly been gathered through the company’s Quality
Management System, Succeed. Here the process maps and relevant data regarding work processes
and work descriptions have been gathered. Other sources such as the company’s Supplier
Performance Measurement system have also been used in order to find information.
3.1.3 Critique of method
In qualitative studies there are some factors to bear in mind. With the way the information is
gathered, the data can easily be impressionistic and too subjective (Bryman & Bell, 2007). The
criticism increases by the fact that it is difficult to replicate the study and thus, verify how the
researchers came to the thesis’s conclusions. It is for example difficult to perform the same interview
twice and receive the exact same answers. In order to decrease these risks, triangulation of data has
been done by combining information found in literature by information gathered at MHC and in
interviews.

29
4. Empirical findings The empirical data is mostly based on data gathered at MHC regarding the company’s business
environment, organisation and processes but it also includes information gathered from three
interviews with three different companies and their take on lead time and supplier collaboration.
4.1 MHC As stated in the introduction, MHC was formerly a textile company that has transitioned into the
medical industry. The company has had various owners since it was started in the mid 19th century,
but since 2007 the Swedish industrial holding company Investor has been the major owner of MHC
with a 96 percent share. MHC headquarters are located in Gothenburg, Sweden, although an
absolute majority of the 7000 employees are distributed worldwide, for instance among the nine
manufacturing facilities in Belgium, Czech Republic, France, Finland, Malaysia, Poland, Thailand, UK
and North America. There are also a total of 30 sales offices, located in Europe (21), the Middle East
(1), Africa (1), Asia-Pacific (5) and North America (2). These cover the customer base, mainly
consisting of hospitals and local treatment centres, in over 80 countries. MHC has since 2007
increased revenue from 767 MEUR to 1014 MEUR in 2011, with Europe, the Middle East and Africa
(EMEA) as the largest contributor with 73 percent of sales. However North America (21 percent) and
Asia Pacific (6 percent) show strong sales growth. Revenue is more or less evenly distributed among
the two business units. In addition to the mentioned facilities, there are a number of distribution
centres and local warehouses, which provide products to the market within two (Europe) or six
(North America) days. Suppliers are spread worldwide, one reason being a limited number of
possible suppliers for some materials. This can for instance be due to few manufacturers of specific
materials and quality requirements determined by MHC and market regulations. (Mölnlycke Health
Care, 2012)
Due to legal requirements and the characteristics of the goods produced, shifting suppliers is a
process that can take over a year. Another characteristic of the supplier base is that it generally is
few suppliers available for some material and that it under certain circumstances might be very hard
to shift supplier. Due to this, MHC cannot choose supplier based on physical location either. This
results in that there sometimes are long transport times between the supplier and factory. The goods
supplied by the suppliers are usually bulky and of low value and is due to that, transported by boat.
These transports can be up to six weeks if the supplier and factory are located on different
continents. The transportation of the goods can be organised either by MHC or the suppliers.3
MHC’s suppliers are in general larger than MHC and have their main businesses outside of the
medical sector. Since MHC, and the medical sector in general, has larger demands on for example
cleanness than customers in other industries, the supplier needs to take this into consideration. On
the other hand, the marginal for the supplier are generally higher for these products than for
products produced for other industries. Due to the general size difference between MHC and their
suppliers, the yearly demand of a product for MHC can be just a few days of production for the
supplier. This leads to that MHC sometimes need to buy large batches and that they are not the
preferred customer of the supplier.
3 MHC interview, 2012-03-14
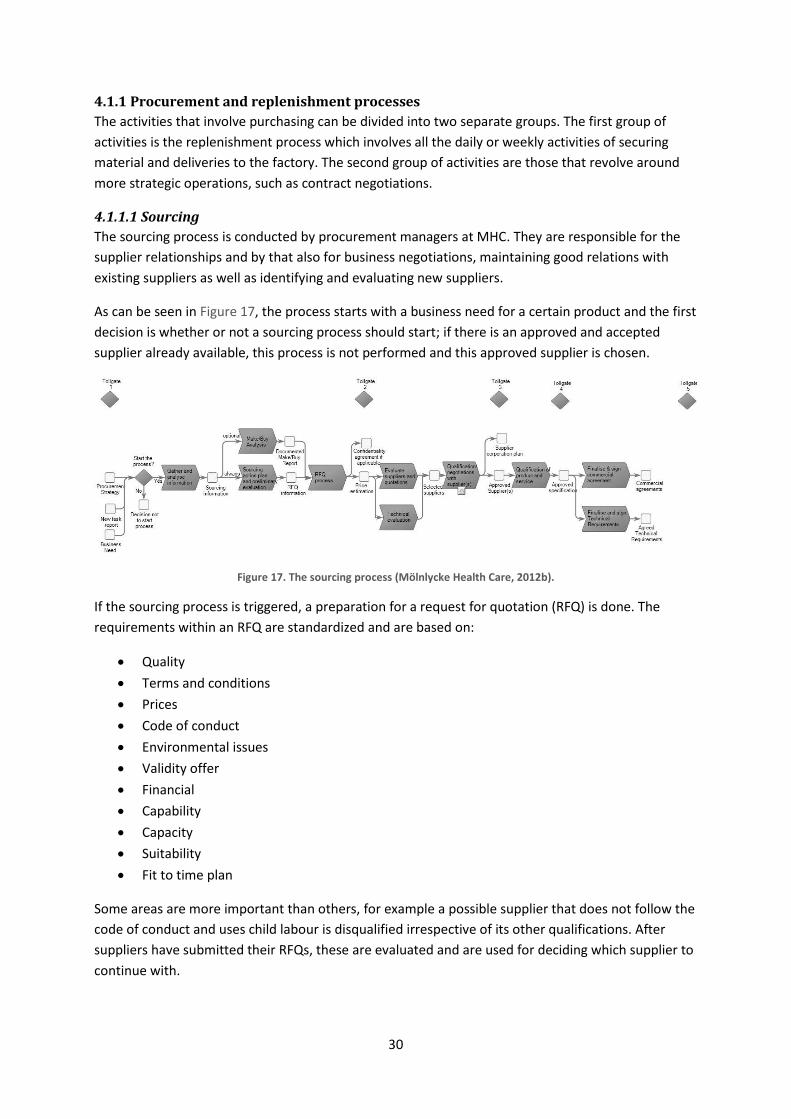
30
4.1.1 Procurement and replenishment processes
The activities that involve purchasing can be divided into two separate groups. The first group of
activities is the replenishment process which involves all the daily or weekly activities of securing
material and deliveries to the factory. The second group of activities are those that revolve around
more strategic operations, such as contract negotiations.
4.1.1.1 Sourcing
The sourcing process is conducted by procurement managers at MHC. They are responsible for the
supplier relationships and by that also for business negotiations, maintaining good relations with
existing suppliers as well as identifying and evaluating new suppliers.
As can be seen in Figure 17, the process starts with a business need for a certain product and the first
decision is whether or not a sourcing process should start; if there is an approved and accepted
supplier already available, this process is not performed and this approved supplier is chosen.
Figure 17. The sourcing process (Mölnlycke Health Care, 2012b).
If the sourcing process is triggered, a preparation for a request for quotation (RFQ) is done. The
requirements within an RFQ are standardized and are based on:
Quality
Terms and conditions
Prices
Code of conduct
Environmental issues
Validity offer
Financial
Capability
Capacity
Suitability
Fit to time plan
Some areas are more important than others, for example a possible supplier that does not follow the
code of conduct and uses child labour is disqualified irrespective of its other qualifications. After
suppliers have submitted their RFQs, these are evaluated and are used for deciding which supplier to
continue with.
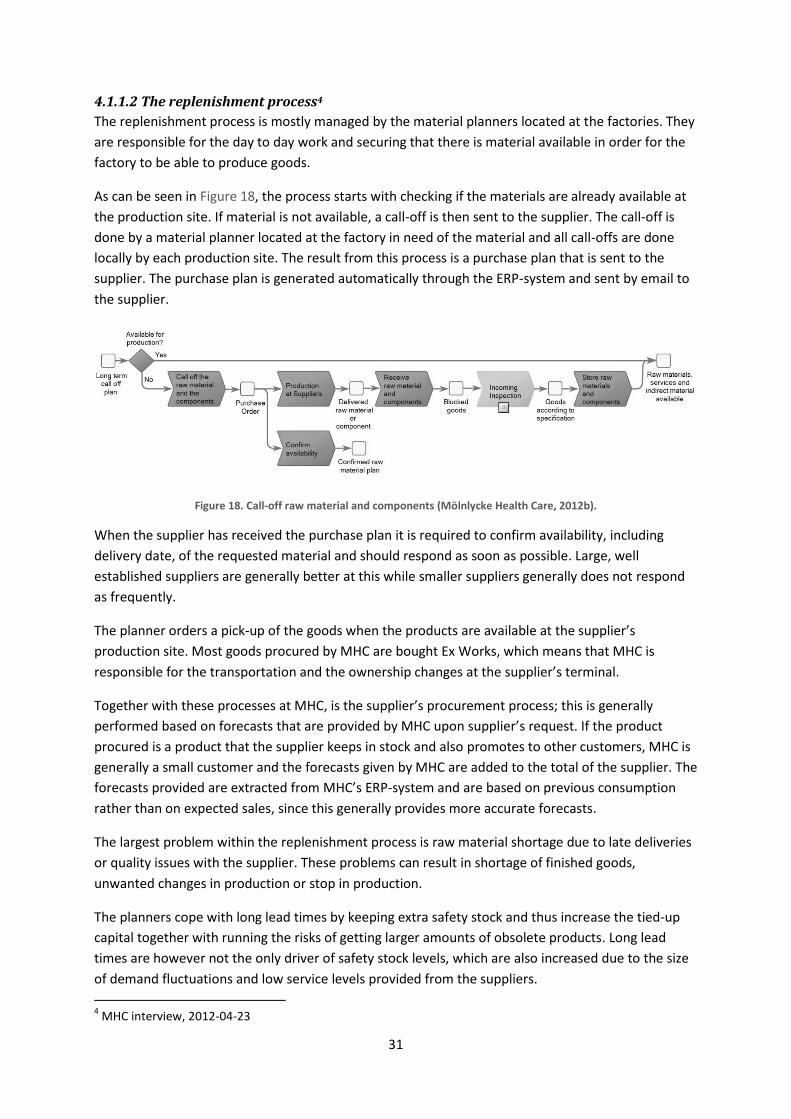
31
4.1.1.2 The replenishment process4
The replenishment process is mostly managed by the material planners located at the factories. They
are responsible for the day to day work and securing that there is material available in order for the
factory to be able to produce goods.
As can be seen in Figure 18, the process starts with checking if the materials are already available at
the production site. If material is not available, a call-off is then sent to the supplier. The call-off is
done by a material planner located at the factory in need of the material and all call-offs are done
locally by each production site. The result from this process is a purchase plan that is sent to the
supplier. The purchase plan is generated automatically through the ERP-system and sent by email to
the supplier.
Figure 18. Call-off raw material and components (Mölnlycke Health Care, 2012b).
When the supplier has received the purchase plan it is required to confirm availability, including
delivery date, of the requested material and should respond as soon as possible. Large, well
established suppliers are generally better at this while smaller suppliers generally does not respond
as frequently.
The planner orders a pick-up of the goods when the products are available at the supplier’s
production site. Most goods procured by MHC are bought Ex Works, which means that MHC is
responsible for the transportation and the ownership changes at the supplier’s terminal.
Together with these processes at MHC, is the supplier’s procurement process; this is generally
performed based on forecasts that are provided by MHC upon supplier’s request. If the product
procured is a product that the supplier keeps in stock and also promotes to other customers, MHC is
generally a small customer and the forecasts given by MHC are added to the total of the supplier. The
forecasts provided are extracted from MHC’s ERP-system and are based on previous consumption
rather than on expected sales, since this generally provides more accurate forecasts.
The largest problem within the replenishment process is raw material shortage due to late deliveries
or quality issues with the supplier. These problems can result in shortage of finished goods,
unwanted changes in production or stop in production.
The planners cope with long lead times by keeping extra safety stock and thus increase the tied-up
capital together with running the risks of getting larger amounts of obsolete products. Long lead
times are however not the only driver of safety stock levels, which are also increased due to the size
of demand fluctuations and low service levels provided from the suppliers.
4 MHC interview, 2012-04-23
32
4.1.2 Change and improvement management5
MHC has developed a process for managing and monitoring supplier performance. This process is
called the Supplier Performance Management (SPM) process. The purpose with this is divided in five
parts, namely:
1. Defining supplier non-conformities
2. Measuring supplier non-conformities
3. Solving and improving supplier non-conformities
4. Closing supplier non-conformities
5. Escalating supplier non-conformities
The KPI’s that are measured are on-time delivery, quantity delivered, quality, awareness and
correction as well as corrective and preventive action. The first three measurements are compared to
what is agreed and acknowledged in the contract and purchase plan. The awareness and correction
measures the suppliers problem awareness and if they can correct the problem or at least contain it
within 48 hours. This includes that the supplier shall define, verify and implement the correction or
containment to isolate effects of the problem until the definitive corrective and preventive actions
are implemented. This is very important due to the high levels of quality that is needed in the
healthcare industry. The corrective and preventive action measurement states that the supplier shall
create corrective and preventive actions based on root causes within 14 days. This includes both
detecting the root cause and the best corrective and preventive action to remove the root cause that
will give capable results. The supplier shall also verify that actions will be successful when
implemented without causing undesirable effects. If the corrective and preventive actions cannot be
implemented within 14 days, the supplier shall present a detailed time plan/action follow-up list that
will describe the future execution of presented actions. One of the main benefits with the SPM
process is that is clarifies the expectations from MHC and that the expectations are the same
regardless of which factory the supplier supplies.
4.1.2.1 Previous lead time reduction projects
MHC has previously done lead time reduction projects and is also currently working on one project.
This project aimed to reduce the lead time for a flow from a supplier in China to the manufacturing
plant in Thailand. The lead time was 10 weeks including the transportation from the supplier to
MHC’s manufacturing plant but the direct time needed to produce the products was only two days.
MHC is not the supplier’s largest customer but the largest within the healthcare sector and this
sector often provides higher margins.6
There was no framework used when doing this project. Instead it was based on the experience of the
people involved in the group responsible for the project and their knowledge regarding the subject.
In order to identify the drivers of the long lead time, they made a value stream map over the
production and assigned the supplier to make a detailed value stream map over the suppliers own
processes. The project members at MHC were responsible for mapping the rest of the processes. As
of now, MHC and the supplier have quarterly meetings with the supplier and contact almost daily
regarding this project. The project is not finished as of now and thus the results from it are not
known at this time.6
5 MHC interview, 2012-03-14 and 2012-03-23
6 MHC interview, 2012-03-02
33
During an interview with MHC, a risk was expressed that the persons that have the authority to
engage in a joint lead time reduction project might not be the same people that make the decisions
on the changes7.
4.2 Benchmarks Supplier collaboration is of growing importance for many companies. Autoliv, Flexlink and Volvo
Powertrain (VP) all have different pre requisites and markets but they all view supplier collaboration
and short lead times as important aspects.
4.2.1 Autoliv8
Autoliv Inc. is a company within the automotive safety area. The company’s main products are
seatbelts and airbags, comprehending a number other products as well, the company has the widest
product offering of automotive safety in the industry. The customer base consists of most of the
leading automobile manufacturers around the world, which are serviced from 80 facilities in 29
countries. As of 2010, 48 000 people are employed globally and the sales volume was $6,5 billion.
Their largest markets are Europe which constitutes 53 percent of the company’s total sales and
North America which constitute 24 percent of total sales.
All the facilities have deployed Autoliv’s own developed manufacturing system Autoliv Production
System which is based on the Toyota Production System (APS). Currently, the company is working
together with selected suppliers in order to align these with the APS, which is done in order for the
suppliers to also gain the advantages that Autoliv has experienced from adapting the APS. Autoliv has
developed its own manufacturing process called Autoliv Manufacturing System (AMS). The system is
based on the Toyota Manufacturing System, which incorporates the lean philosophy. In order to be
more efficient in the company’s production, a Kanban-system is used, which allows it to be more
flexible. Since Autoliv has a demand from their customers that the customers can change orders up
to two days before products are shipped, they try to put the same demand on their customers. The
company also expects a constant cost decrease of four percent yearly.
Autoliv believes that communication is a key issue and that language barriers should not be
overlooked. It is therefore important to try to be very clear with what one mean in all situations to
reduce misunderstandings. In order to help their suppliers to fulfil these requirements they have set
up a program called Autoliv Supplier Development Program. The goal is to decrease the suppliers’
cost and improve their performance. In this program, Autoliv works together with selected suppliers
in order to increase their efficiency. Autoliv and a supplier conduct a VSM together and then Autoliv
tries to help the supplier to improve their production processes. The improvement process is based
on the knowledge of the supplier and the processes themselves. The supplier can keep all the
benefits that are gained through this program. Except commitment to the program, all Autoliv
requires is that the supplier lives up to the standards set in the contracts and is able to reduce its
prices by four percent annually. By not sharing the profits based on the benefits gained, the supplier
generally is willing to provide more transparency.
Autoliv believes that the best way to get suppliers interested in joining this program is to present the
benefits that Autoliv has gained by working with these questions. By showing successful examples
7 MHC interview, 2012-04-23
8 Autoliv interview, 2012-03-28
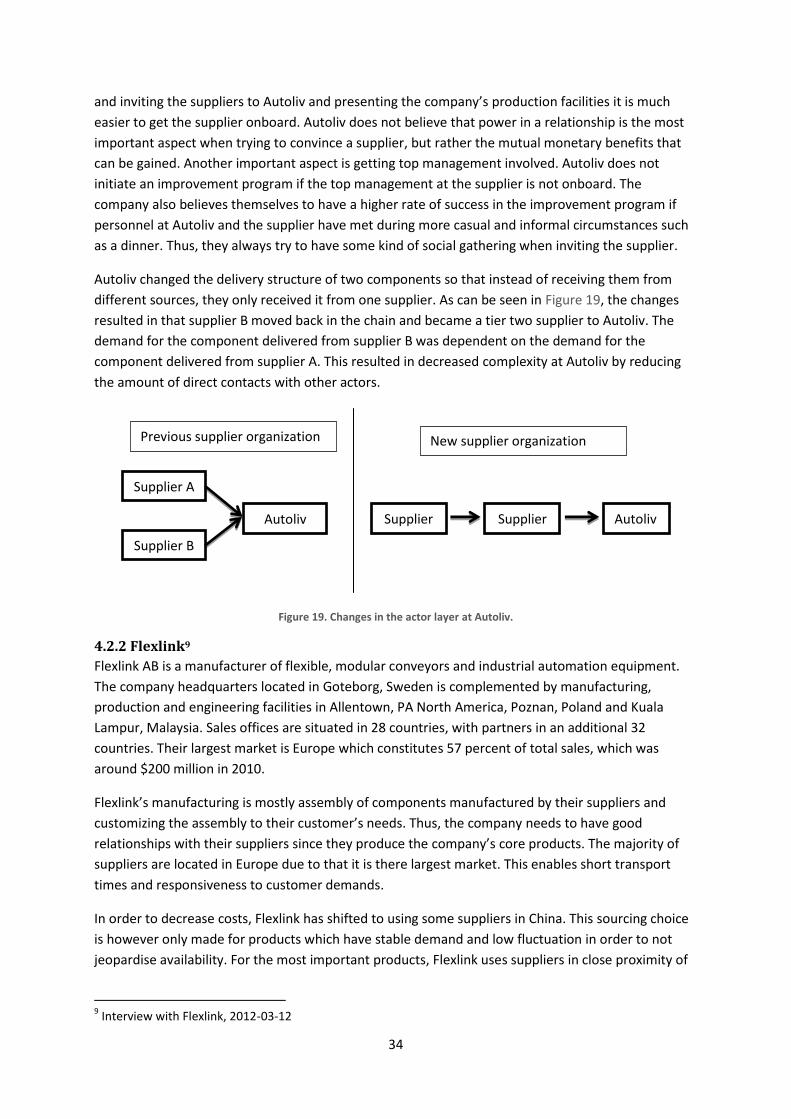
34
and inviting the suppliers to Autoliv and presenting the company’s production facilities it is much
easier to get the supplier onboard. Autoliv does not believe that power in a relationship is the most
important aspect when trying to convince a supplier, but rather the mutual monetary benefits that
can be gained. Another important aspect is getting top management involved. Autoliv does not
initiate an improvement program if the top management at the supplier is not onboard. The
company also believes themselves to have a higher rate of success in the improvement program if
personnel at Autoliv and the supplier have met during more casual and informal circumstances such
as a dinner. Thus, they always try to have some kind of social gathering when inviting the supplier.
Autoliv changed the delivery structure of two components so that instead of receiving them from
different sources, they only received it from one supplier. As can be seen in Figure 19, the changes
resulted in that supplier B moved back in the chain and became a tier two supplier to Autoliv. The
demand for the component delivered from supplier B was dependent on the demand for the
component delivered from supplier A. This resulted in decreased complexity at Autoliv by reducing
the amount of direct contacts with other actors.
Figure 19. Changes in the actor layer at Autoliv.
4.2.2 Flexlink9
Flexlink AB is a manufacturer of flexible, modular conveyors and industrial automation equipment.
The company headquarters located in Goteborg, Sweden is complemented by manufacturing,
production and engineering facilities in Allentown, PA North America, Poznan, Poland and Kuala
Lampur, Malaysia. Sales offices are situated in 28 countries, with partners in an additional 32
countries. Their largest market is Europe which constitutes 57 percent of total sales, which was
around $200 million in 2010.
Flexlink’s manufacturing is mostly assembly of components manufactured by their suppliers and
customizing the assembly to their customer’s needs. Thus, the company needs to have good
relationships with their suppliers since they produce the company’s core products. The majority of
suppliers are located in Europe due to that it is there largest market. This enables short transport
times and responsiveness to customer demands.
In order to decrease costs, Flexlink has shifted to using some suppliers in China. This sourcing choice
is however only made for products which have stable demand and low fluctuation in order to not
jeopardise availability. For the most important products, Flexlink uses suppliers in close proximity of
9 Interview with Flexlink, 2012-03-12
Supplier A
Supplier B
Autoliv Supplier
B
Supplier
A
Autoliv
vv
Previous supplier organization New supplier organization
35
the company’s markets. These suppliers generally have been supplying Flexlink for a long time and
they have developed a good relationship between each other.
The lead time from suppliers, excluding those in China, is approximately one to three weeks. This
time includes both supplier production and transportation time. In order to keep a short lead time,
the suppliers keep raw material for Flexlink’s products so that they can start producing them as soon
as an order is sent from Flexlink. Flexlink, on the other hand, agrees to cover the costs for the raw
material if it becomes obsolete (ibid.). The reason for having the supplier keeping stock of raw
material instead of finished goods is that the costs of obsolete goods are lower and that the
production time is short.
4.2.3 Volvo Powertrain10
Volvo Powertrain (VP) is a business unit within AB Volvo, one of the world’s largest providers of
transport solutions for commercial use. VP has the main responsibility for the development and
production of the power train, i.e. the engine, gearbox, and driven axles. The company supplies the
business areas in the group, for example Volvo Trucks, Volvo Construction Equipment, and Volvo
Buses, with its solutions.
VP has approximately 9000 employees and delivers on a yearly basis 200 000 heavy duty engines,
125 000 transmissions, and 45 000 marine drives. The company’s sourcing of material and
components yearly amounts to 3.6 Billion Euro. The core values of the company are shared with the
Volvo Group and contain three areas; quality, safety and environmental care.
Having acquired Renault along with Mack Trucks in 2001 and later on UD Trucks in 2007, VP’s supply
base consisted of over 1000 suppliers. By sourcing more strategically since 2001, for example going
from transactional purchases and annual negotiations to coordinated and cross-functional purchases
as well as developing common platforms for the power train, VP has been able to reduce its supplier
base to approximately 100 suppliers. Strategic sourcing is of importance to VP since the cost of
purchased material stands for 75-80 percent of the cost of the finished product.
VP put large demands on their suppliers already in the supplier selection process, demanding a two
day lead time. The company also monitors the suppliers and their performance continuously,
especially the service level. If a supplier does not live up to the standards set in the contract, they can
be fined. For VP, lead time is of crucial importance and if a potential supplier is unable to meet the
terms of delivery they will not be employed. This is a general concept within the automotive industry
and generally all customers in the industry have the same demands. VP also requires suppliers to
have consignment stock within proximity to their production sites so that they can ensure exact
delivery precision. They can thus, use a supplier with production located far away if they provide
stock nearby.
Since VP put a large emphasis on decreasing lead times already in the contracts, they do not have
any lead time reduction frameworks. Nonetheless, the company does have frameworks that aim to
improve the supplier in general in order for them to live up to the standards set in the contracts. It
can for example incorporate increasing service level, increasing the quality of the goods supplied or
reducing risks.
10
Volvo Powertrain interview, 2012-03-28

36
Sharing information with suppliers is vital for continuous improvements. VP has a portal set up where
suppliers can log in and check their performance. By allowing the supplier access to a database, VP
can reduce the amount of work required to inform suppliers of their service level etcetera.
Lastly, VP is of the impression that social interaction with suppliers improves the chances of a
successful partnership. By meeting staff from the supplier in person and not only on phone and by
email, one can better work together and solve problems.
37
5. Analysis This chapter covers an analysis of earlier presented findings and is focused on answering the stated
research questions:
How can lead times be improved by cooperating with suppliers?
How should MHC work with suppliers in order to improve lead times?
How can MHC visualise the financial benefits gained from lead time reduction?
The analysis starts with evaluating a total cost approach and the ARA-model at MHC, followed by
analyses of what will be important for MHC to do in order to decrease lead times.
5.1 Total cost approach As presented by both Gadde et al. (2010) and Jennings (1997) a total cost approach needs to be
utilised on outsourced material rather than evaluating the price tag alone. Many of the indirect costs,
such as storage and capital costs contribute to the total cost and are directly related to lead time, as
lead time makes it harder to plan and thereby contributes to the build-up of safety stocks, which in
turn generate costs for, among other things, tied-up capital and obsolescence. In order to develop
the ability to utilise a total cost approach it is therefore of the essence to have notion about the costs
that lead time generates.
In order to secure a total cost approach it is important to establish and measure various KPIs and KIIs.
In addition it is also crucial to measure the performance level prior to changes to get a benchmark.
MHC currently has the SPM process that tracks the performance of the suppliers but it only measures
reactive performance measurements. Having a performance measurement of reducing lead time can
conflict with some of the reactive performance measurements such as service level due to that the
suppliers might not want to challenge themselves and run the risk of decreasing its performance with
regards to the other measurements. This is an important aspect to consider when initiating an
improvement effort with a supplier. MHC has stated from top management that they have a long-
term goal of reducing lead times and it is therefore important when initiating improvement efforts to
ensure that the performance measurements measured in SPM are not negatively affected by these
efforts.
5.1.1 Quality in processes
By utilizing the concepts of activity re-configuring, resource re-combining and actor re-positioning
one can change and improve the processes for a firm. By interacting with their suppliers on these
different levels, MHC can both change and improve its processes in order to shorten lead time.
Autoliv did a re-positioning of an actor when they moved a first tier supplier to be a second tier
supplier. By doing this, they decreased the complexity in the supplier network due to having fewer
suppliers and improved the planning by only getting materials from one supplier instead of two.
When MHC makes changes in the actor layer, it is important to be aware of the changes that will
follow in the resource and activity layers and how these changes affect the possibilities to adhere to
market needs. For instance the pros and cons of making such a change as Autoliv had done. This
generated a less complex supplier network, while on the other hand Autoliv decreased the control of
the resources the company depends on, which can generate risks regarding supply and technology
development. When conducting a re-structure of the actor layer or else, it is important to consider
how lead times are affected by this change.

38
In order to re-combine resources it is important to first identify which the most critical resource
elements are and which actor that has the best possibilities to conduct a given activity. What
resources are held by the actors within the supply chain and how can MHC best utilise them? This is a
key question to ask when re-combining current resources in the supply chain. In a lead time
perspective it is important to define the resources that best can provide short lead times and choose
to use those. If several actors within the supply chain have the same resources it is thus beneficial to
choose the one that can provide the shortest lead time.
By re-configuring activities MHC could either improve the current activities or completely change the
activities by outsourcing current in-house activities or add outsourced activities to the in-house
production. The example provided regarding Swefork and their outsourcing of the welding process
gives an example of the benefits one can gain by doing this. Swefork gained an improvement due to
that the company doing the welding process was more specialized and had better capabilities for
handling this process. MHC could gain benefits by mapping the company’s current activities and
evaluating if a supplier is more capable of handling these activities or if an activity currently
conducted by a supplier would gain benefits being conducted in-house instead. When evaluating
these activities MHC should also evaluate the possibilities of improving them without moving them.
This could provide benefits that could be more easily acquired due to the fewer amount of changes
needed to conduct them. Another aspect that possibly could reap benefits is to evaluate if
coordination of activities could be improved. This is a key element when reducing lead times due to
that low coordination often results in storage time which can be seen as non-value adding. By better
coordinating activities that lie at MHC, the supplier and in between them, MHC could possibly
decrease lead times.
By mapping actors, resources and activities one can more easily identify the drivers for lead time, it is
therefore important to evaluate if changes can be made in the related layers mentioned in order to
shorten lead times.
5.2 Improving quality Given the definition of product quality presented by Bergman and Klefsjö (2010), lead time can be
seen as a quality dimension of a product. Long lead times can thus be looked upon as a lack of quality
and are by that suitably treated as a quality problem.
According to Bergman and Klefsjö (2010) it is important to work systematically with quality
improvements. MHC has no commonly established such way of working in inter-firm quality issues,
making the PDSA cycle a suitable way to structure the activities required for problem solving to
secure an ample effort.
i. The first step of the PDSA cycle, Plan, should start with describing the problem (Bergman &
Klefsjö, 2010). The starting-point for an effort aimed at reducing lead times naturally is that
the lead time is too long. In the case with MHC it should also be concluded that the lead time
is too long for a specific item from a specific supplier to a specific MHC facility, in order to
end up with a clearer problem description. Although the quality improvement effort is
performed in cooperation, the owner of the problem description should be the one initiating
the effort, i.e. MHC in this case.
ii. The next thing to do is to establish the performance gap that is to be dealt with (Bergman &
Klefsjö, 2010); if the present lead time is 42 days and the needed one is 37 days there is a

39
performance gap of five days to fill (see Figure 20). A benefit of establishing the performance
gap is that it gives an idea about what measures that can be necessary to take. If the needed
lead time would be four days in the presented example and one knows that a reason for the
long lead time is an ocean freight taking several weeks, that situation will render totally
different solutions than if the gap is relatively small. By defining the gap, MHC can align their
expectations on the outcome with the supplier’s expectations and create a common
understanding for goal of the coming effort.
Figure 20. Lead time performance gap.
iii. Another important part of the Plan stage is to break down large problems into smaller and
more manageable ones (Bergman & Klefsjö, 2010). Taking on the total lead time all at once
would be complicated since it comprises a series of activities, as presented in chapter 3.1. It
is therefore a good idea to clarify the activities’ contribution to lead time. This can be done
by conducting a VSM, as presented by Rother and Shook (1999), which both gives what
activities that constitute the lead time and the duration of the respective activities. The total
lead time is consequently divided into the lead times of the activities constituting the
replenishment process and the problem with long lead time is thus broken down into smaller
and more manageable problems. Depending on how detailed the first VSM is, it may be
necessary to conduct another one on the chosen activity in order to better understand its
constituents, as exemplified in Figure 21. Since the VSM will comprehend activities at MHC,
the suppliers and in the interface them in between, it would be preferable to conduct parts
of the VSM jointly, for example activities linking the companies together, such as the
ordering process. To ease conducting of the VSM, the companies can perform a VSM of
activities that are isolated to the respective company and join the two VSMs to get the
complete picture. The transportation mapping could be placed with the party in charge of
ordering the transports for simplification.
Figure 21. Examples of activities identified in VSM.
34
35
36
37
38
39
40
41
42
43
Present state Future state
Lead time in days

40
iv. In order to choose which activity to attend to, the Pareto chart presented by Bergman and
Klefsjö (2010) can be used for illustrating the activities’ relative contribution to lead time as
exemplified in Figure 22. Preferably the activity with the largest lead time is dealt with first,
since this will have the highest impact on the total lead time. However, with respect taken to
the performance gap and the nature of the activity, another activity can be chosen if it is
estimated to be less resource demanding while still managing to fill the performance gap. For
instance if an ocean freight constitutes the longest activity lead time and the performance
gap is quite narrow, it may be less costly to decrease the second largest lead time while still
achieving the needed total lead time. Additionally, the choice of activity will also be affected
by and decided upon by MHC and the supplier jointly. Pareto Analysis total: 42
Category Frequency/Quantity Cumulative %
Awaiting production 10 23,81%
Warehousing 10 47,62%
Shipping 10 71,43%
Ordering 8 90,48%
Planning 2 95,24%
Production 2 100,00%
0,00%
10,00%
20,00%
30,00%
40,00%
50,00%
60,00%
70,00%
80,00%
90,00%
100,00%
0
2
4
6
8
10
12
Aw
aitin
g pr
oduc
tion
War
ehou
sing
Ship
ping
Ord
erin
g
Plan
ning
Prod
uctio
n
Figure 22. Example of Pareto chart.
v. After a specific activity has been chosen to work with, potential root causes for the activity’s
long lead time is to be identified (Bergman & Klefsjö, 2010), which is necessitated by a cause-
and-effect diagram as presented in chapter 2.1 and exemplified in Figure 23. While
conducting the diagram it can be valuable to keep the seven wastes presented by Hines and
Rich (1997) in mind. For instance non-value adding time in waiting and transports can be
causes for long lead times. Of course also value-adding time may be driving lead times and
show improvement potential, however focusing on non-value adding time will likely render
easier to implement solutions. Performing the cause-and-effect diagram may or may not
benefit from having participants present from both MHC and the supplier, depending on
what problem is in focus. Performing a cause-and-effect diagram of an activity such as the
manufacturing operations at the supplier, may not benefit from the attendance of MHC
personnel, for example.

41
Figure 23.Example of a cause-and-effect diagram.
vi. To verify the assumptions made about which causes that lie behind the lead time, data
regarding the occurrences of the identified cause needs to be collected and compiled
(Bergman & Klefsjö, 2010). Again the Pareto chart comes to use in illustrating the
commonality of causes, as exemplified in Figure 24, and by that helps the choice of which
cause to attend to. Additionally, task v. and vi. can be repeated over again until a sufficiently
detailed level of the causes is attained, as will be exemplified by describing task vii. and viii. It
seems obvious that the party, whose activity is affected, is also the one responsible for
collecting and compiling this data. Pareto Analysis total: 16
Category Frequency/Quantity Cumulative %
Lack of material 8 50,00%
Other orders planned 5 81,25%
Long set up time 2 93,75%
Lack of capacity 1 100,00%
0,00%
10,00%
20,00%
30,00%
40,00%
50,00%
60,00%
70,00%
80,00%
90,00%
100,00%
0
1
2
3
4
5
6
7
8
9
Lack
of
mat
eria
l
Oth
er o
rder
s pl
anne
d
Long
set u
p tim
e
Lack
of
capa
city
Figure 24. Example of Pareto chart.
vii. After choosing a specific cause, this is now the focal problem of another cause-and-effect
diagram, as exemplified in Figure 25. By performing this diagram, the resolution of the
problem will gain greater detail and what will be the necessary solutions will consequently
become clearer.
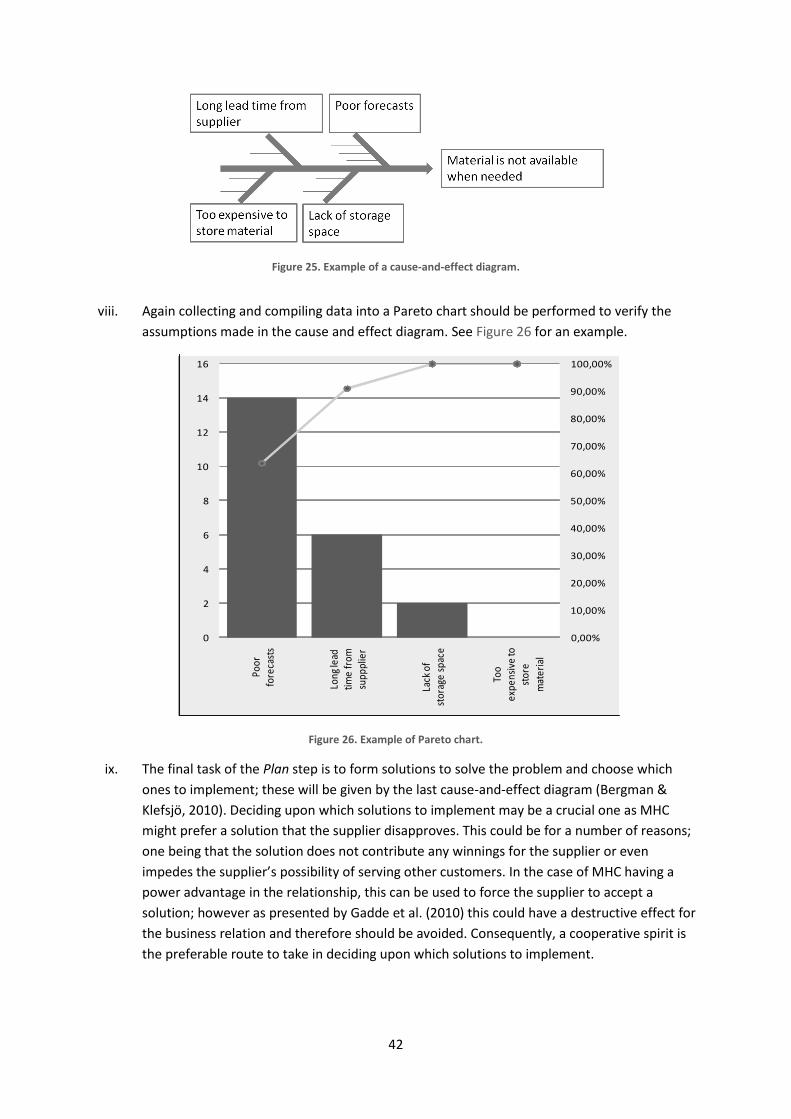
42
Figure 25. Example of a cause-and-effect diagram.
viii. Again collecting and compiling data into a Pareto chart should be performed to verify the
assumptions made in the cause and effect diagram. See Figure 26 for an example. Pareto Analysis total: 22
Category Frequency/Quantity Cumulative %
Poor forecasts 14 63,64%
Long lead time from suppplier 6 90,91%
Lack of storage space 2 100,00%
Too expensive to store material 0 100,00%
0,00%
10,00%
20,00%
30,00%
40,00%
50,00%
60,00%
70,00%
80,00%
90,00%
100,00%
0
2
4
6
8
10
12
14
16
Poor
fo
reca
sts
Long
lead
tim
e fr
om
supp
plie
r
Lack
of
stor
age
spac
e
Too
expe
nsiv
e to
st
ore
mat
eria
l
Figure 26. Example of Pareto chart.
ix. The final task of the Plan step is to form solutions to solve the problem and choose which
ones to implement; these will be given by the last cause-and-effect diagram (Bergman &
Klefsjö, 2010). Deciding upon which solutions to implement may be a crucial one as MHC
might prefer a solution that the supplier disapproves. This could be for a number of reasons;
one being that the solution does not contribute any winnings for the supplier or even
impedes the supplier’s possibility of serving other customers. In the case of MHC having a
power advantage in the relationship, this can be used to force the supplier to accept a
solution; however as presented by Gadde et al. (2010) this could have a destructive effect for
the business relation and therefore should be avoided. Consequently, a cooperative spirit is
the preferable route to take in deciding upon which solutions to implement.
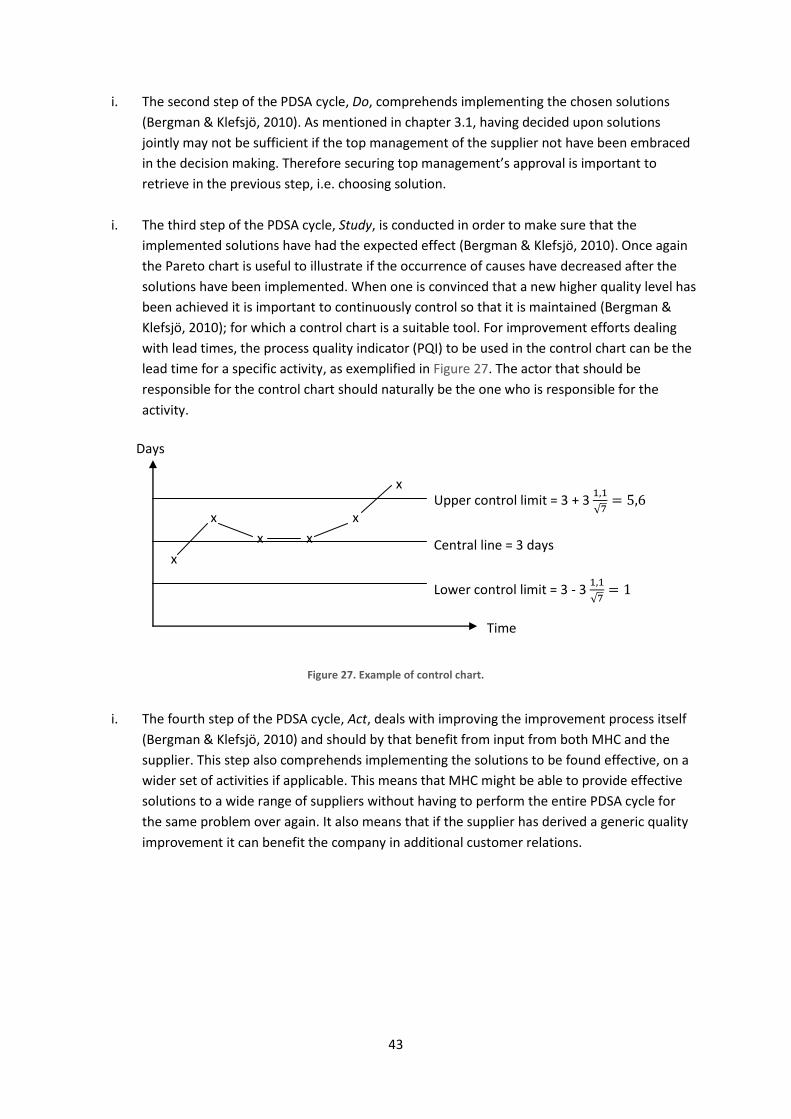
43
i. The second step of the PDSA cycle, Do, comprehends implementing the chosen solutions
(Bergman & Klefsjö, 2010). As mentioned in chapter 3.1, having decided upon solutions
jointly may not be sufficient if the top management of the supplier not have been embraced
in the decision making. Therefore securing top management’s approval is important to
retrieve in the previous step, i.e. choosing solution.
i. The third step of the PDSA cycle, Study, is conducted in order to make sure that the
implemented solutions have had the expected effect (Bergman & Klefsjö, 2010). Once again
the Pareto chart is useful to illustrate if the occurrence of causes have decreased after the
solutions have been implemented. When one is convinced that a new higher quality level has
been achieved it is important to continuously control so that it is maintained (Bergman &
Klefsjö, 2010); for which a control chart is a suitable tool. For improvement efforts dealing
with lead times, the process quality indicator (PQI) to be used in the control chart can be the
lead time for a specific activity, as exemplified in Figure 27. The actor that should be
responsible for the control chart should naturally be the one who is responsible for the
activity.
Figure 27. Example of control chart.
i. The fourth step of the PDSA cycle, Act, deals with improving the improvement process itself
(Bergman & Klefsjö, 2010) and should by that benefit from input from both MHC and the
supplier. This step also comprehends implementing the solutions to be found effective, on a
wider set of activities if applicable. This means that MHC might be able to provide effective
solutions to a wide range of suppliers without having to perform the entire PDSA cycle for
the same problem over again. It also means that if the supplier has derived a generic quality
improvement it can benefit the company in additional customer relations.
x
x x
x x
x
Upper control limit = 3 + 3
Central line = 3 days
Lower control limit = 3 - 3
Time
xsgsg
Days
44
5.3 What to consider in inter-firm efforts The factors affecting a make or buy decision presented by Jennings (1997) clarifies the choice made
by MHC to source various materials from suppliers. As MHC not uncommonly needs small quantities
in relation to the supplier’s total production volumes and economies of scale are present, the
capability dimension as well as the cost dimension point in the direction that sourcing material is the
most valid alternative. Hence, solving the issue of long lead times by in-sourcing is in most cases not
conceivable.
Following outsourcing of material, the issue of long lead times becomes more apparent, as
outsourced material is more prone to be subjected to long lead times as the supply chain may
increase in length and in width according to Lambert and Cooper (2000). This is also the situation for
MHC that has suppliers spread world-wide, leading to extensive and complex distribution networks.
The company’s distribution network is therefore prone to have long lead times, and given the many
drawbacks resulting from long lead times that are presented by literature and the empirical data,
these are an issue that needs to be addressed. As lead times are affected by both MHC, suppliers and
the interface the companies in between, efforts should be performed in cooperation to increase the
possibilities for effective and efficient improvement efforts according to, among others, Cousins and
Spekman (2003).
As presented by Luo (2002), good inter-firm relations are a prerequisite for inter-organisational
efforts, which are dependent on for instance trust, commitment and how conflicts are handled,
according to Gadde et al. (2010). This calls for a more extensive analysis of, firstly, which suppliers
MHC should approach for joint efforts, secondly, what aspects that affect the possibility for MHC to
initiate joint improvement efforts, and thirdly, what aspects that are important to consider in such
efforts to provide a successful outcome. These concerns are analysed in the following chapters.
5.3.1 Choosing suppliers
A starting point for choosing suppliers for joint efforts will be one which considers the financial
leverage on the resources that needs to be invested. This comprehends estimations of how much the
safety stock level may be decreased, which would render a decrease in tied-up capital, needed
storage space and obsolescence. What was discovered during these interviews is that the safety
stock level is not driven by lead time alone; it is therefore imperative to investigate the specific
influence of lead time case by case, in order to not end up with an over-optimistic calculation. In
addition to cost savings related to the safety stock, there are also a number of potential savings that
are harder to estimate, such as less effort spent on rush orders, stock-outs and re-planning
manufacturing operations. The value of decreasing lead times can also be estimated in the views of
decreasing the risk in the supply chain or the value of increasing the flexibility of the same. The idea
with calculating savings at this stage is to get a rough estimation of the potential savings to judge
whether or not launching an improvement effort will be financially beneficial. A calculation format,
as presented in Appendix 3, does therefore only consider the financial effects that are somewhat
straightforward to estimate, making the format user friendly, while still providing a good enough
cost-benefit analysis.
In conjunction, as stressed by Vargas-Hernandéz and Noruzi (2009), the supplier’s approach to
conflict and cooperation should be appraised since it will have a significant effect on how conflicts,
which will most certainly appear, are handled. This is thus important to consider as it will have
45
significant effect on the success of the joint improvement effort. By utilising the scoreboard
presented by Trompenaars and Prud’Homme (2004) the supplier’s attitude can be assessed. By
relating this result to the relationship characteristic matrix Figure 14 presented by Gadde et al.
(2010), the potential of joint efforts may be evaluated. Preferably a behaviour indicating possibilities
to end up in the right hand upper corner, which provides an environment signified by creativity. The
progressive efforts that are claimed to be achieved in this type of relationship require that also MHC
qualifies for such behaviour. As perceived during the interviews with MHC personnel, the level of
conflict is to be kept to a minimum as great respect is paid to honouring co-workers as well as
suppliers. This provides many possibilities as positive emotions provides a trustworthy behaviour as
pointed out by Jones and George (1998), but at the same time inhibits the company from reaching
the progressive state that signifies the creativity quadrant of the relationship matrix. To conclude,
with respect to the relationship characteristics matrix, the most important thing is to secure that the
supplier’s characteristics won’t lead to a hostile relationship as this may not only deteriorate the joint
improvement effort but also the relationship itself.
In addition, as came out during the Autoliv interview, a joint improvement effort will be easier to
manage and less resource demanding if the supplier is used to working with improvements in a
structured way, hence such a supplier is preferable to choose. On the other hand, a supplier that has
no extensive experience of improvement efforts may have a lot of improvement potential and by
that provide significant efficiency gains without a great amount of resources invested.
5.3.2 Initiating joint efforts
To be able to conduct joint improvement efforts, the supplier obviously needs to be interested in
such efforts. There are several aspects affecting this interest, firstly it is important to have the
supplier’s top management commitment, which was greatly emphasised by Autoliv. Without top
management commitment it will be hard for personnel further down the rack to accept and prioritise
a joint improvement effort. During interviews with MHC personnel a scenario worse than top
management not giving consent to a joint effort would be if a joint improvement effort is accepted
and initiated by supplier employees with sufficient power to do so, but without the power to
implement changes. The risk is that the joint effort will come to an abrupt end if top management
declines implementation of needed changes, resulting in resources put in, but without reaping the
benefits thereof. Hence, top management commitment is important to secure, both to be able to
initiate a joint improvement effort, but also to secure the forthcoming implementation of changes
that are necessary in order to reach the benefits of the effort.
According to Autoliv, top management commitment is enhanced by a cost-benefit analysis showing
financial winnings for the supplier; also ideas from an important customer will receive higher
attention from top management than from less important ones. One of the suppliers also pointed
out that potential revenue increase also worked as an incentive to engage interest in joint efforts. In
addition, as brought forward by Autoliv it is easier to attract the interest from top management if
one can provide examples of successful joint efforts. The company also points out the value of the
supplier having a positive approach to change for improvement. Top management commitment is
thus influenced in several aspects, which provides the possibility to establish commitment in various
ways. The identified aspects, i.e. cost-benefit, power, showing good examples and approach to
change, are further elaborated on in the following chapters.

46
5.3.2.1 Cost-benefit
An aspect influencing top management commitment is that it is of great importance to be able to
present a favourable cost-benefit analysis of an improvement effort. The reasons for the long lead
times of course affect the magnitude of demanded investments, e.g. it may be less resource
demanding to improve an ordering process than to improve set up times in process industry.
Nevertheless a customer contributing a significant amount of revenue will have higher volumes to
distribute invested efforts to and by that making a joint improvement effort with such a customer
likely to be more profitable than with a smaller customer. This relation between contributed revenue
and profitability of a joint effort is an issue for MHC, as the company is a relatively small customer to
many of the suppliers, according to MHC personnel. This means that MHC will have to find
alternative measures to financially motivate the supplier.
Firstly, as mentioned in the Autoliv interview, a joint improvement effort commonly leads to generic
improvements that can be utilised in the supplier’s other business relationships. This means that
solutions generated in a MHC initiated effort can be applicable to a wider customer base and by that
gain increased leverage on invested resources. Generic improvements typically relate to process
improvements of order handling, manufacturing and material handling.
Secondly, as pointed out by MHC personnel there are some suppliers that have a consignment stock
with MHC; these suppliers may be easier to motivate into shortening lead times as the cash flow of
these companies are directly related to lead time. On the other hand, MHC will likely not perceive
lead times to be an issue when using such an arrangement, although MHC indirectly pays the costs
for long lead times in the consignment stock fee.
Thirdly, one of the interviewed MHC suppliers considers the future potential revenue as one
parameter when choosing which customers to engage in joint improvement efforts. The supplier can
thus see a joint effort as a more long-term investment in the business relationship, and by that
showing commitment to the same. This approach will increase trust in the relation according to e.g.
Morgan and Hunt (1994), which is beneficial for a number of reasons. For instance trust is important
for building strategic alliances (Zaheer et al., 1998) and is positively related to performance (e.g. Luo,
2002). The supplier’s intention in showing this kind of commitment to a presently small customer is
to be provided increased sales volume. Since the Surgical division of MHC has not extensive volume
growth to distribute directly, volumes need to be shifted around suppliers in order to meet the
expectations from suppliers reasoning as described here.
Intimately linked to calculating the financial benefits of a joint improvement effort is how the
winnings should be distributed between the parties. This should be decided upon and clearly stated
in this initial phase; if postponed, there is a risk that the party that have made investments increases
its resource dependency and by that decreases its bargaining power relative the other party (Argyres
& Liebeskind, 1999). If the party with the power advantage abuses this, the business relationship will
be subjected to distrust (e.g. Dyer & Chu, 2011) and conflict will arise (Rokkan & Haugland, 2002).
This will harm the relationship and not only inflict on the possibilities for future joint efforts but on
the relationship in whole (e.g. Gadde et al., 2010; Trompenaars & Prud’Homme, 2004). Autoliv deals
with the issue of benefit sharing by stating that the company will only claim the expected yearly
negotiated price reductions, even though improvements may be significant, for instance due to being
generic and by that benefit the supplier’s other businesses and customers. Autoliv however beliefs
47
that the chosen approach shows a trustworthy behaviour that, together with strong performing
suppliers, benefits the company in the long run, a belief that also is supported by e.g. Morgan and
Hunt (1994). Hence, clear rules for benefit sharing should be decided upon early on in the process to
establish trust which increases the supplier’s willingness to commit to inter-firm process
development efforts. These rules could be stated in contracts (Argyres & Liebeskind, 1999) or orally if
a trusting relationship is at hand (Blomqvist, Hurmelinna & Seppänen, 2005). Choosing the latter
poses a risk (e.g. Bachmann & Inkpen, 2011), but showing mutual trust at the same time provides
many benefits as presented by e.g. Zaheer et al. (1998) and ultimately results in competitive
advantage (Dyer & Chu, 2011).
5.3.2.2 Power
Another aspect influencing top management commitment is that of the relative power between the
customer and the supplier; Autoliv claims that this power relation does not affect the interest from
the supplier to engage in joint efforts. However, resource dependence and the power generated
thereof means that a powerful customer has the ability to influence the supplier’s decisions
regarding such efforts, according to Lambert and Cooper (2000). It is thus useful for MHC to increase
its power and decrease the power of the suppliers for increasing the possibilities of joint efforts,
however as clearly noted in the previous chapter, applying power is a delicate task that requires
discretion.
By using the list of factors presented in Table 1, one can quickly get a sense of what kind of power
relation that characterises a specific business relation. Relating to the exchange power matrix (Figure
16) presented by Cox et al. (2001), MHC will benefit from power in the “buyer dominance” quadrant.
This gives opportunities to exercise power on a supplier, however the incentive to use power for joint
efforts in this situation likely is small, since joint efforts will bring the companies closer and move the
business relation towards one signified by inter-dependence, thereby leading to a loss in power. In
the “supplier dominance” quadrant MHC will have restricted possibility to attract the supplier’s
interest for joint efforts. The “inter-dependence” quadrant provides the strongest incentives for two
firms to engage in joint efforts as the resource dependence is levelled between the parties. In
conclusion, if a business relation is characterised by supplier dominance, MHC might need to take
actions to increase power to attract the supplier’s interest for joint efforts.
The foundation for power is elaborated on by Pfeffer and Salancik (2003), who claim that resource
dependence is affected by resource importance, concentration of resource control and discretion
over resources. This means that power for instance is generated by contributing with a relatively
large share of a supplier’s revenue, something that also is stated in Table 1. It also means that power
is affected by controlling the resources (Brito, 2001), which not necessarily means possessing them
(Pfeffer & Salancik, 2003). By developing strong social relationships with supplier’s personnel and top
management, interdependencies can be increased according to e.g. Low (1997), thus leading to an
increased influence over the decisions taken by the supplier. This conclusion is also supported by
Morgan and Hunt (1994), who state that commitment is an effect of trust, which is attained by,
among other things, social interaction according to Dyer and Chu (2011).
The situation described above essentially deals with attaining and utilising power to influence a
supplier’s interest to engage in a joint effort, although not being totally convinced of the own
benefits in doing so. This may hamper the actual commitment to such an effort, resulting in sub-

48
optimised solutions. Another way to utilise a power advantage, which is more progressive, is to
secure goal alignment between the parties. This creates a profound base for cooperation as both
parties benefit from the same solutions, since the agency problem as presented by Eisenhardt (1989)
is mitigated. It is likely that goal alignment also is possible to achieve without having a power
advantage; by developing a relation signified by solidarity and trustworthiness, Stephen and Coote
(2007) claim that the possibilities for goal alignment increase. The latter point may be a crucial one
for MHC, due to a common lack of power in business relations, as a result of suppliers not perceiving
themselves to be resource dependent upon MHC.
The level of trustworthiness is affected by a number of aspects, for instance the ones brought
forward by Bachmann and Inkpen (2011); inter-organisational trust at MHC is supported by
comprehensive legal regulations characterising the healthcare industry and by a solid company
reputation. It is also supported by a corporate culture emphasising to work in a constructive and
cooperative spirit with suppliers. Inter-personal trust is also supported by this corporate culture as
well as the company’s professional code of conduct. It is also strengthened of that MHC personnel
are aware of and knowledgeable about differences in national culture, due to the company’s multi-
cultural workforce. The final contribution to inter-personal trust is social interaction with supplier
personnel, which in this case means top management; it is unclear whether the level of social
interaction with this group is sufficient to generate trust. One way to increase the level of top
management interaction would be to conduct a supplier event as Autoliv does, which provides
opportunities to strengthen the ties with and between suppliers. To conclude, MHC states an overall
trustworthy behaviour which provides possibilities for aligning goals with suppliers, even though a
lack of power is present in a business relationship.
5.3.2.3 Showing good examples
Yet another aspect influencing top management commitment is the possibility to show examples of
successful joint efforts; Autoliv claims that it is valuable to be able to show such examples to raise the
interest of the supplier. As Autoliv has a supplier development program which aims at sharing the
knowledge of working with Lean principles, the company’s efforts takes a broad grip on the supplier’s
way of working in implementing the Lean philosophy. The lead time improvement efforts that this
study is focused on have not got the same extensive impact on the supplier’s organisation, however
the utilisation of good examples is something worth considering even in less comprehensive efforts.
As pointed out by Autoliv, the value of good examples is that they clearly illustrate the benefits that
can be gained by engaging in a joint improvement effort and thereby also contribute in attaining top
management commitment.
The examples that are used by Autoliv have been collected over several years, which also the
knowledge and experience of joint efforts have. MHC has in relation to Autoliv likely more to learn in
this respect and although some inter-firm improvement efforts have been conducted, MHC is in need
of experience, both for conducting such efforts and for attaining good examples to show. The pilot
projects that are planned to take place within the coming year can pose as examples, which make
documentation and evaluation of these very important.
5.3.2.4 Approach to change
The final identified aspect influencing top management commitment is the supplier’s approach to
change. The experience of Autoliv is that having a power advantage the companies in between is not

49
the most important prerequisite for the possibility of initiating joint improvement efforts. It is rather
a matter of the supplier’s approach to change for improvement, which is supported also by the
interviews conducted with MHC suppliers. This means that if a supplier works with improving
processes etcetera, be it in a standardised and structured way or not, the corporate culture is one
implying that such efforts are valued as beneficial and important. Hence a more open sighted view
on changes for improvement is present and by that a positive attitude towards performing joint
improvement efforts in general can be expected from such a supplier.
5.3.3 Conducting joint efforts
The two previous chapters deal with issues and aspects related to choosing appropriate suppliers and
initiating joint improvement efforts; this chapter reviews relational issues and aspects to consider
throughout the duration of such efforts. According to Trompenaars and Prud’Homme (2004) a
cooperative spirit is essential in attaining creativity. This reasoning is supported by the relationship
matrix (Figure 14) presented by Gadde et al. (2010), and attaining creativity is consequently related
to how conflicts are handled. As illustrated by the matrix, conflicts need to be handled by
cooperation, if not, a state of hostility will appear (Gadde, Håkansson, & Persson, 2010) and
efficiency will be reduced (Vargas-Hernandéz & Noruzi, 2009). This is also supported by e.g. Hennet
and Arda (2008) who claim that a self-interest seeking behaviour leads to an overall loss of efficiency.
A creative environment is thus perceived to benefit efficiency.
Sources of conflict commonly relate to goal divergence, communication problems, disagreement
over roles and differing perceptions of reality (Rosenbloom, 1999), which all can be related to and
affected by both corporate (Vargas-Hernandéz & Noruzi, 2009) and national culture (Trompenaars &
Prud'Homme, 2004). The many different sources of conflicts gives that they can take a number of
forms and impact different functions, processes, relations etcetera. One way of interpreting the
matrix (Figure 14) is that a project benefits from conflicts, as they are necessary to reach creativity. It
is however conceived that the meaning of conflicts in this respect, first and foremost means conflicts
resulting from different perceptions of reality, rather than conflicts due to communication problems,
for example. That is, a project benefits from receiving input from people with different perspectives,
since solutions will regard a wider range of aspects. To conclude, it is not likely that all types of
conflicts have the ability to provide value and some types should therefore be avoided.
5.3.3.1 Creating a cooperative spirit and avoiding negative conflicts
As argued for above, a cooperative spirit needs to be developed in order to gain value from conflicts.
According to Stephen and Coote (2007) strong relational bonds improve cooperation, which also
trust and commitment does (Morgan & Hunt, 1994). The latter is supported by Bachmann and
Inkpen (2011) who state that trust lets ideas be more easily developed and shared between parties.
As social interaction affects the level of trust (e.g. Bachmann & Inkpen, 2011) is can be concluded
that social interaction affects trust, which in turn leads to a cooperative spirit. Consequently, the
participants of an inter-firm project should interact, not only on a business level, but also on a
personal level, something that also was expressed by Volvo Powertrain.
Furthermore, to end up with a relationship signified by cooperation the concerned parties need to
develop an awareness of each other’s interests and needs (e.g. Nan, 2011). Morgan and Hunt (1994)
complement this statement by claiming that trust is gained by sharing intelligence and expectations.
It also gains from communicating timely, clearly and precise (Blomqvist & Ståhle, 2000). It can thus

50
be concluded that effective communication builds trust, which in turn generate a cooperative spirit.
In addition, communication problems are one of the sources of conflict that is presented by
(Rosenbloom, 1999). Insufficient communication is also brought forward by e.g. Schein (2004) and
Autoliv to be a source for problems. This further emphasises the importance of effective
communication, as conflicts emerged from communication problems, such as misunderstandings,
lack the ability of generating any value to an improvement project. Dissolving conflicts of this kind
can be resource demanding and move focus away from the purpose of the project as well as
consume energy of the involved participants. Effective communication can be reinforced by agreeing
on what should be communicated, by whom and when. Also common definitions should be
developed, as should quantitative measures of notions that generally are expressed qualitatively,
such as “good quality” and “quick delivery”.
In addition to the elements of communication treated above, communication problems can be
closely related to differences in culture as well (Vargas-Hernandez, 2009) as for instance body
language (Schein, 2004) and behaviour (Vargas Hernandez, 2009) are different and differently
interpreted. These differences cannot be avoided at this stage of the project and conflicts due to
them can best be mitigated by being aware of and understanding the cultural differences (Schein,
2004). This can be achieved for instance by consulting bicultural competence (Lazear, 1999). This is a
constructive way of dealing with cultural differences, which likely increases trust, as a lack of respect
for the differences can lead to mistrust between partners according to Trompenaars and
Prud’Homme (2004).
Altogether, trust is imperative to develop since it affects the prospect of cooperating. In addition to
the elements of trust treated above, also aspects concerning inter-organisational and inter-personal
trust are of importance. These have been treated above in the Power chapter and conclude that
MHC states an overall trustworthy behaviour.
51
6. Discussion Costs and problems with long lead times were presented in Chapter 1 together with the need for a
structured way of reducing them. By analysing and combining relevant theory, company examples
and MHC’s pre-requisites, a framework for working with reducing lead times in collaboration with
suppliers has emerged.
The framework developed can be broken down into three steps; choosing supplier, initiating effort
and conducting effort. All steps are important but the most effort is placed on how to conduct the
effort and it is based on the PDSA cycle.
6.1 Choose supplier Choosing the correct supplier to work with when trying to reduce lead times is crucial and is divided
into three steps. First, it is important to do and evaluate a cost-benefit analysis of the costs and
benefits that MHC will get from conducting the project. Will the benefits of reducing the lead times
compared to the costs of conducting the project? In order to calculate the monetary benefits from
reduced lead time a simple calculation format, as in Appendix 3, can be used. This can be important
in order to get internal commitment from top management at MHC.
Second, one needs to evaluate the suppliers approach to cooperation in the relationship with MHC.
Is it a relationship based on trust and commitment or is information withheld? Here it is important to
evaluate MHC’s power position towards the supplier. This is usually based on the amount of
purchased material compared to the suppliers total sales but it can also potential new contracts sales
and the suppliers profit margins from the goods sold.
The last step to consider is suppliers approach to making performance improvements. If the supplier
is continuously improving their own processes, it is more likely that they will be interested in
conducting a joint project.
6.2 Initiate effort In order to initiate the effort it is of most importance to get a good commitment from the supplier
and especially from top management at the supplier. This is done by showing them the potential
benefits that the supplier can gain by doing a joint project and how they can use the benefits gained.
MHC could also use their power position in the relationship and convince the supplier to engage in
the contract. However, it is important to not abuse one’s power position since it might impair the
relationship and decrease future commitment from the supplier.
By presenting good examples MHC can further increase the commitment from the supplier. It is
therefore important to track the benefits from previous projects in order to have them available
when doing new projects. The good examples could also be examples from internal projects at MHC.
The supplier’s approach towards change is an important aspect to consider. If the supplier in general
is reluctant to make changes, there is a larger risk that the suggested changes will not be
implemented and cause the project to fail.
52
6.3 Conduct Effort Conducting the effort is based on the PDSA cycle and the first step is planning the project. Planning
the project is the most emphasised step in this framework and is intended to be the base for the
whole quality improvement effort.
6.3.1 Plan
The first step is to describe the problem. This would generally consists of that the lead times are too
long but also contains the effects caused by the specific long lead time. With a defined problem
description it is easier to have a common understanding of the problem.
By establishing and stating a performance gap between the current lead time and the demanded
lead time, several benefits can be gained. It creates a common understanding from both MHC and
the supplier for the magnitude of the project and also sets the standard for the size of the project. A
project aimed to cut the lead time in half would probably require greater efforts than a project aimed
to decrease the lead times with ten percent.
The defined problem needs to be divided into smaller problems in order to make it more
manageable. By conducting a VSM of the activities involved one is better able to identify which parts
of the replenishment process that drives the lead time. These activities should then be mapped in a
Pareto chart in order to choose the activity, or activities, with the largest potential. One could
continue to make another more detailed VSM of the selected activity in order to divide it further and
also make another Pareto chart with the new activities from the new VSM. This is an iterative process
and should be conducted until the activities are sufficiently manageable.
After choosing activities it is important to find the root causes driving the lead times. This should be
done by using a cause-and-effect diagram. The cause-and-effect diagram should be done in a group
and the group should be formed depending on which activities that have been chosen. With defined
root causes one should create qualitative measurements to track them. This should then be tracked
for a sufficient duration of time and result in information regarding which root causes that influence
the problem the most. Putting the measured information into a Pareto chart should help visualize it.
One could consider making a new cause-and-effect diagram of the root causes in order to more
easily get a clear picture of the effects causing it.
The last step in the planning phase is to choose a root cause and decide upon the changes needed to
solve it. The supplier and MHC might disagree regarding which changes that should be implemented
which could result in conflicts. MHC could use its positional power but this could be risky due to the
long-term effects that it can cause on the relationship.
6.3.2 Do
The second step in the PDSA cycle is to implement the changes. This step requires commitment from
the supplier and if the project was started with a low level of commitment from the supplier there is
a risk that the implementations will be rejected by the supplier. The supplier might also be more
reluctant to make the changes based on their views on change management.
6.3.3 Study
With the changes implemented it is important to measure the effects of the changes. A control chart
should be used to monitor the shortened lead time in order to measure the success of the project.

53
One could also measure the effects of shortened lead time such as fewer rush orders and smaller
safety stock to find the monetary effects.
6.3.4 Act
In addition to using the information to trigger commitment one should also use it to improve the
project process. MHC should evaluate each project and develop the processes in order to improve
the process of reducing lead times together with their suppliers. This is an important part that should
be improved in order to make even more successful projects in the future. Furthermore, this step will
be important for MHC to perform for the planned pilot projects in order to attain good examples to
show suppliers.

54
7. Conclusions Improving performance, such as decreasing lead time, in a collaborative spirit in between actors will
benefit from having a framework as the one here presented. The framework not only provides a
systematic way of improving performance, but also emphasise the consequences that follows from
conducting efforts of this kind across company borders. More specifically, performance is to be
improved by attending to problems affecting quality dimensions, such as lead time, and should be
solved by identifying and eliminating the root causes of problems. Furthermore, the success of inter-
firm efforts relies heavily on relational aspects such as trust and commitment. These are of course
also important when conducting a similar effort within one company, but different perceptions and
behaviours will be more noticeable, for instance due to misaligned goals and differences in corporate
culture. It is therefore of great importance that everyone engaged, i.e. personnel at both the
customer and the supplier, are aware of and accept for instance cultural differences and the
possibilities and drawbacks these generate, in order to handle conflicts in a cooperative spirit.
For MHC, the framework provides a process that complements the already established processes and
contributes with widening the scope of the company’s efforts to include a greater part of the supply
chain. By that, the possibility of attending to issues with a total cost approach is significantly
improved. A result of the findings is that MHC carefully has to consider which suppliers that are
chosen to engage in joint improvement efforts; although a supplier initially has a positive attitude,
relational aspects will have considerable effect on the success of the effort. Therefore attention has
to be paid to, for instance the supplier’s approach to handle conflicts and how reliable the supplier is
in committing to agreements. Closely related to choosing an appropriate supplier is of course also
attracting the interest of the supplier. As MHC not uncommonly is a small customer there is likely low
financial leverage for the supplier to reap directly from MHC’s purchasing volumes. Therefore
attention has to be paid to in which ways the supplier’s interest can be affected, making for instance
social relations valuable to develop and the ability to provide examples of generic improvements
necessary to retrieve. In the cases where MHC although enjoys a high level of power to influence the
supplier’s decision, the findings of the paper show that it is important to not force the supplier into
an engagement by abusing this power. Rather a more constructive approach should be sought for,
since the success of the project relies on genuine interest and commitment from both parties.
It is clear that long lead times generate costs, for instance as a consequence of greater forecast
errors which causes the necessity for higher safety stocks and an increase of rush orders. The issue
boils down to not being able to swiftly follow customer demand, which at times will render too low
stock levels and lost sales as well as too high stock levels and obsolete material, tied-up capital and
warehouse space. The cost parameters so far noticed here can be quantified with relative ease
compared to the value of for instance increased flexibility and product updates reaching the market
faster. It can be concluded that the value of decreasing lead times hence is greater for products with
high fluctuation in demand. The calculation format provided in Appendix 3 is an easy to use tool that
MHC can use for visualising the financial benefits of decreasing lead times.
Companies’ increased focus on core competence has caused greater dependence on suppliers, which
has rendered the supply chain to be the competitive entity, rather than the individual companies
thereof. The competitiveness of the supply chain hence depends on the actor’s ability to cooperate
and jointly drive performance improvement efforts. In addition, supply networks are spread
worldwide, making communication harder, which in combination with corporate and national culture

55
differences, increases the risk of misunderstandings. It has therefore been valuable to investigate
which implications that relational aspects can have on inter-firm improvement efforts. Furthermore,
the study provides insights to what aspects to consider in choosing suppliers and what aspects that
affect the success of the initiation and performance of such efforts. These insights are valuable since
being aware of and considering them will increase the possibility of efforts being successful.
As mentioned, companies should cooperate across supply chains in order to improve performance
and maintain competitiveness. Therefore it would be valuable with research examining what aspects
that a supplier selection process should incorporate in order to Increase the likelihood of long-term
successful business relations. For instance if aspects, such as corporate culture, that affect relational
dimensions should be incorporated. If they should, it would also be beneficial to bring clarity to
which aspects that are most important to consider. In conjunction, it would also be of interest to
establish if the degree of importance varies depending on what type of joint effort that is at hand,
e.g. product development or process development. If a need is identified it would apparently also be
of great value to develop a model to use for assessing such aspects. Another possible area for further
research that relates to a supplier selection process is whether it is more valuable to take on a
supplier that works with improvements continuous than one who does not.
Closely related to the relational aspects is the issue of misaligned goals; although the actors in a
supply chain need to cooperate, they are still separate entities with self-interests to fulfil. This affects
the acceptance and implementation of solutions, thus making goal alignment a very important and
presumably challenging issue to alleviate. Therefore conducting further research on goal alignment
through contract design or other measure has the potential to be beneficial for a wide corporate
audience.
Furthermore, the issue of inter-firm transparency could be further investigated. For instance what
benefits and drawbacks that comes with transparency and how it can be attained. It would seem
likely that transparency is closely related to sharing information across company borders, orally as
well as in script. With this comes the interesting issue of how such information flows should be
managed in order to be effective and efficient while still paying attention to politically sensitive
issues such as ownership.

56
Bibliography
Argyres, N., & Liebeskind, J. (1999). Contractual commitments, bargaining power, and governance
inseparability: Incorporating history into transaction cost theory. The Academy of Management
Review , 24 (1), 49-63.
Asmus, P., Cauley, H., & Maroney, K. (2006). Turning Conflict Into Cooperation. Stanford Social
Innovation Review , 4 (3), 52-61.
Bachmann, R., & Inkpen, A. (2011). Understanding institutional-based trust building processes in
inter-organizational relationships. Organization Studies , 32 (2), 281-301.
Baiman, S., & Rajan, M. (2002). Incentive issues in inter-firm relationships. Accounting, Organizations
and Society , 27, 213-238.
Ben-Daya, M., & Raouf, A. (1994). Inventory models involving lead time as a decision variable. Journal
of the Operational Research Society Vol. 45, No. 5 , 579-582.
Bergman, B., & Klefsjö, B. (2010). Quality from customer needs to customer satisfaction. Lund:
Studentlitteratur.
Bhote, K. R. (1988). World class quality: Design of experiments made easier, more cost effective than
SPC. New York: AMA.
Björklund, M., & Paulsson, U. (2007). Seminariesboken - att skriva, presentera och opponera. Lund:
Studentlitteratur.
Blomqvist, K., & Ståhle, P. (2000). Building organizational trust. The 16th IMP-conference. Bath: The
IMP Group.
Blomqvist, K., Hurmelinna, P., & Seppänen, R. (2005). Playing the collaboration game right - balancing
trust and contracting. Technovation , 25, 497-504.
Brito, C. (2001). Towards an institutional theory of the dynamics of industrial networks. Journal of
Business & Industrial Marketing , 16 (3), 150-166.
Bryman, A., & Bell, E. (2007). Business Research Methods. Oxford: Oxford University Press.
Business Dictionary. (2012). Business Dictionary. Hämtat från
http://www.businessdictionary.com/definition/make-or-buy-decision.html den 4 April 2012
Chen, F., Drezner, Z., Ryan, J., & Simchi-Levi, D. (2000). Quantifying the bullwhip effect in a simple
supply chain: The impact of forecasting, lead times and information. Management Science , 46 (3),
436-443.
Christopher, M. (2011). Logistics & Supply Chain Management (Vol. 4). Harlow, Great Britain:
Financial Times - Prentice Hal.
Cousins, P., & Spekman, R. (2003). Strategic supply and the management of inter- and intra-
organisational relationships. Journal of Purchasing & Supply Management , 9, 19-29.

57
Cox, A., Lonsdale, C., Ireland, P., Sanderson, J., & Watson, G. (2001). Supply Chains, Markets and
Power: Mapping buyer and supplier power regimes. London: Routledge.
Da Cunha, C., Agard, B., & Kusiak, A. (2007). Design for cost: module-based mass customization. IEEE
Transactions on Automation and Engineering , 4 (3), 350-359.
Daaboul, J., Da Cunha, C., & Bernard, A. (2011). Design for mass customization: Product variety vs.
process variety. CIRP Annals - Manufacturing Technology , 60, 169-174.
Dahl, R. (1957). The concept of power. Behavioral Science , 2, 201-215.
De Crombrugghe, A., & Le Coq, G. (2003). Guide to Supplier Development. Vienna: United Nations
Industrial Development Organization.
De Treville, S., Shapiro, R., & Hameri, A.-P. (2004). From supply chain to demand chain: the role of
lead time reduction in improving demand chain performance. Journal of Operation Management ,
21, 613-627.
Doggett, M. (2005). Root cause analysis: A framework for tool selection. Quality Management
Journal , 34-45.
Dubois, A. (1998). Organizing Industrial Activities Across Firm Boundaries. London: Routledge.
Dubois, A. (2003). Strategic cost management across boundaries of firms. Industrial Marketing
Management , 32, 365-374.
Dyer, J., & Chu, W. (2011). The determinants of trust in supplier-automaker relationships in the US,
Japan, and Korea. Journal of International Business Studies , 42, 10-27.
Eisenhardt, K. (1989). Agency theory: an assessment and review. The Academy of Management
Review , 14 (1), 57-74.
Eriksson, L. T., & Wiedersheim-Paul, F. (2008). Att utreda forska och rapportera. Liber.
Fairhead, J., & Griffin, R. (2000). The power potential of the less powerful within networks. A political
sensemaking process (PSP) model of rapid network development and dissolution. The 16th IMP-
conference. Bath: The IMP Group.
Fredendall, L. D., Patterson, J. W., Lenhartz, C., & Mitchell, B. C. (2002). What should be changed?
Quality Progress , 50-59.
Gadde, L.-E., & Håkansson, H. (1993). Professional Purchasing. London: Routledge.
Gadde, L.-E., Håkansson, H., & Persson, G. (2010). Supply Network Strategies. Chichester: John Wiley
& Sons Ltd.
Goffee, R., & Jones, G. (1996). What holds the modern company together? Harvard Business Review ,
74 (6), 133-148.
Gunasekaran, A., Patel, C., & Tirtiroglu, E. (2001). Performance measures and metrics in a supply
chain environment. International Journal of Operations & Production Management , 21 (1), 71-87.
58
Haig, B. D. (2005). An Abdicative Theory of Scientific Method Available. Psychological Methods , 371-
388.
Havila, V., Johanson, J., & Thilenius, P. (2004). International relationship triads. International
Marketing Review , 21 (2), 172-186.
Hennet, J.-C., & Arda, Y. (2008). Supply chain coordination: A game-theory approach. Engineering
Applications of Artificial Intelligence , 21, 399-405.
Hines, P., & Rich, N. (1997). The seven value stream mapping tools. International Journal of
Operations & Production Management , 46-64.
Hingley, M. (2005). Power to all friends? Living with imbalance in supplier-retailer relationships.
Industrial Marketing Management , 34, 848-858.
Hofstede, G. (1991). Cultures and organizations: software of the mind. New York: McGraw-Hill.
Håkansson. (2006). Business relationships and networks: consequences for economic policy. The
Antitrust Bulletin , 51 (1), 143-163.
Håkansson, H., & Johansson, J. (1992). A model of industrial networks. i B. Axelsson, & G. Easton,
Industrial networks: a new view of reality. New York: Routledge.
Håkansson, H., & Snehota, I. (1995). Developing Relationships in Business Networks. London:
Routledge.
Håkansson, H., & Waluszewski, A. (2002). Managing Technological Development: IKEA, the
environment and technology. London: Routledge.
Ishikawa, K. (1991). Guide to quality control. Tokyo: Asian Productivity Organisation.
Jennings, D. (1997). Strategic guidelines for outsourcing decisions. Strategic change , 85-96.
Jones, G., & George, J. (1998). The experience and evolution of trust: Implications for cooperation
and teamwork. The Academy of Management Review , 23 (3), 531-546.
Jüttner, U., Christopher, M., & Baker, S. (2007). Demand chain management - Integrating marketing
and supply chain management. Industrial Marketing Management , 377-392.
Kolb, D., & Putnam, L. (1992). The multiple facets of conflict in organizations. Journal of
Organizational Behavior , 13, 311-324.
Lambert, D., & Cooper, M. (2000). Issues in Supply Chain Management. Industrial Marketing
Management , 29, 65-83.
Lazear, E. (1999). Culture and Language. Journal of Political Economy , 107 (6), 95-126.
Lee, H., Padmanabhan, V., & Whang, S. (2004). Information distortion in a supply chain: the bullwhip
effect. Management Science , 50 (12), 1875-1886.

59
Low, B. (1997). Managing business relationships and positions in industrial networks. Industrial
Marketing Management , 26 (2), 189-202.
Luo, Y. (2002). Building trust in cross-cultural collaborations: Toward a contingency perspective.
Journal of Management , 28 (5), 669-694.
MacDuffie, J. (2011). Inter-organizational trust and the dynamics of distrust. Journal of International
Business Studies , 42, 35-47.
Morgan, R., & Hunt, S. (1994). The commitment-trust theory of relationship marketing. Journal of
Marketing , 58 (3), 20-38.
Mölnlycke Health Care. (2012). About us: Mölnlycke Health Care. Hämtat från Mölnlycke Health Care:
http://www.molnlycke.com/com/About/ den 10 Mars 2012
Mölnlycke Health Care. (den 12 04 2012). Mölnlycke Health Care Intranet. Hämtat från Succeed. den
12 04 2012
Nair, A., Narasimhan, R., & Bendoly, E. (2011). Coopetitive buyer-supplier relationship: An
investigation of bargaining power, relational contect, and investment strategies. Decision Sciences
Journal , 42 (1), 93-127.
Nan, S. (2011). Consciousness in culture-based conflict and conflict resolution. Conflict Resolution
Quarterly , 28 (3), 239-262.
Neely, A., Gregory, M., & Platts, K. (2005). Performance measurement system design: A literature
review and research agenda. International Journal of Operations & Production Management , 1228-
1263.
Ouyang, L.-H., Wu, K.-S., & Ho, C.-H. (2007). An integrated vendor-buyer inventory model with quality
improvement and lead time reduction. International Journal of Production Economics , 108, 349-358.
Pahl, J., Voss, S., & Woodruff, D. (2005). Production planning with load dependent lead times. 4OR , 3
(4), 257-302.
Pero, M., Abdelkafi, N., Sianesi, A., & Blecker, T. (2010). A framework for the alignment of new
product development and supply chains. Supply Chain Management , 15 (2), 115-128.
Pfeffer, J., & Salancik, G. (2003). The External Control of Organizations: A Resource Dependence
Perspective. Palo Alto, USA: Stanford University Press.
Ray, S., & Jewkes, E. (2004). Customer lead time management when both demand and price are lead
time sensitive. European Journal of Operational Research , 153, 769-781.
Ritter, T., Wilkinson, I., & Johnston, W. (2004). Managing in complex business networks. Industrial
Marketing Management , 33, 175-183.
Rokkan, A., & Haugland, S. (2002). Developing relational exchange: Effectiveness and power.
European Journal of Marketing , 36 (1), 211-230.
Rosenbloom, B. (1999). Distribution channels. Fort Worth: Dryden Press.

60
Rother, M., & Shook, J. (1999). Learning to see - Value stream mapping to create value and eliminate
muda. Brookline: The lean enterprise institute.
Rousseau, D., Sitkin, S., Burt, R., & Camerer, C. (1998). Not so different after all: A cross-discipline
view of trust. Academy of Management Review , 23, 393-404.
Schein, E. (2004). Organizational culture and leadership (3 uppl.). San Francisco, USA: Jossey-Bass.
Setijono, D., & Dahlgaard, J. (2007). Customer Value as a Key Performance Indicator (KPI) and a Key
Improvement Indicator (KII). Measuring Business Excellence , 44-61.
Sproull, B. (2001). Process problem solving: A guide for mainteance and operations teams. Portland:
Productivity Press.
Stalk, G. (1988). Time - The next source of competitive advantage. Harvard Business Review , 66 (4),
41-51.
Stephen, A., & Coote, L. (2007). Interfirm behavior and goal alignment in relational exchanges.
Journal of Business Research , 60, 285-295.
Trompenaars, F., & Prud'Homme, P. (2004). Managing change across corporate cultures. Oxford:
Capstone Publishing Ltd.
van Weele, A. (2010). Purchasing and Supply Chain Management (Vol. 5). London: Cengage Learning.
Vargas-Hernandéz, J., & Noruzi, M. (2009). An exploration of the organizational culture in the
international business relationships and conflicts era. American Journal of Economics and Business
Administration , 1 (2), 182-193.
Welch, C., & Wilkinson, I. (2005). Network perspectives on interfirm conflict: reassessing a critical
case in international business. Journal of Business Research , 58, 205-213.
Vernimmen, B., Dullaert, W., Willemé, P., & Witlox, F. (2008). Using the inventory-theoretic
framework to determine cost-minimizing supply strategies in a stochastic setting. International
Journal of Production Economics , 115, 248-259.
Zaheer, A., McEvily, B., & Perone, V. (1998). Does trust matter? Exploring the effects of
interorganizational and interpersonal trust on performance. Organization Science , 9 (2), 141-159.
61
Appendix 1 – Interviews This appendix contains all relevant and available information regarding the interviews and
interviewees. Not all interviews were conducted with a template and thus a template cannot be
provided from these interviews.
List of interviewees This is a list of all interviewees excluding the interviewees with the suppliers. These are not
presented due to confidentiality.
Personal at MHC
Ann-Christine Strigén, Raw Material Procurement Director Surgical, Goteborg
Christian Sievert, Global Service Director, Goteborg
Dan Pavlicek, Component planner, Karvina
Daniel Malm, Supply Chain Director - Planning, Goteborg
David Pavlicek, Material Planning Team Leader, Karvina
Katerina Tomaskova, Purchasing Manager,Karvina
Paul Bakker, Procurement Director Components, Manchester
Petra Andersson, Strategic Commodity Manager, Goteborg
Staffan Bröte, Value Stream Director, Goteborg
Sven Nilsson, Project Manager, Goteborg
Thomas Pettersson, Senior Supplier Quality Assurance Engineer, Goteborg
Personal at interviewed companies
Andres Laas, APS Engineer, Autoliv (Together with a group from different divisions)
Jenny Lilliehöök, Purchasing Manager, Volvo Powertrain
Per Siesing, Director of Supply Chain, Flexlink
Peter Lindvist, Corporate Development, Flexlink
Academics
Anna Dubois, Professor at the institution of Industrial Marketing at Chalmers University of
Technology
62
Interview Templates The interviews were semi-structured and the interview templates were only a guide for the
discussions. Not all interviews were done with a template so templates are only available for these
interviews.
Interview template – Suppliers
The goal with the interview is to find out how Mölnlycke Health Care (MHC) can reduce lead time in
collaboration with you as a supplier.
Company introduction
What characterizes the operations of your company? High tech, process / labour intensive, high
product variety, etc.?
o Slitting, perforating
What products are you selling to MHC?
o How long lead time do you promise for those items?
o What does the lead time consist of? Generally…
Where are your factories located?
Change management
Do you have any processes regarding change management? Do you keep track of them and how
many have you done recently?
How do you work with performance improvements?
KPIs
How do you feel about joint (with customers) lead time reduction projects?
o Have you done any before? If so, how did it go? Why did it go so?
o What would trigger your interest for such a project?
What KPI:s do you have on the customer side of your firm?
o What are your target KPI levels?
o How do you work with improving your KPI:s?
o Claims, number of sq meters, produce,
customer satisfaction
Lead times o What requests does MHC have on lead times?
o Have you been able to meet these requirements?
o What affects the possibilities to meet their requirements? Other customers,
production process, MHC demands etc…
o How are MHC requirements in comparison to other customers?
What affects the possibilities to improve the lead times?
o What information from MHC could help you shorten the lead times?
o Can you keep extra stock of MHC goods? Would that decrease lead times? Would it
affect prices? Would it take commitments from MHC?
Finished goods?
Raw material?
63
o Can you see any benefits in reducing the lead times to your customers?
Do you get forecasts?
o How do you manage them?
o Would you want anything to change there?
How close do you work with the planning department?
Operations and planning Do you need to send back orders to MHC often? Wrong specifications etc.
Do you have an automatic system for transferring orders or do you do it manually?
Are resources booked in your system as soon as the order is confirmed? Why/why not?
Do you check the raw material manually?
How is your planning linked to MHC’s planning?
How often do you feel you get emergency orders?
Do you see any weaknesses in the cooperation?
Interview template – MHC Planners The goal with the interview is to understand the material planners’ role.
Planner’s role What does your work consist of and what are your responsibilities? (planning, ordering etc.)
o What authorities do you have; what can you affect?
Can you describe your supplier portfolio?
o Good suppliers?
o Bad suppliers?
Which KPIs are the planner measured on?
What are your biggest issues? (related to material planning, acquisition etc.)
o What consequences do they have?
o How could they be resolved?
How often do you place orders to suppliers?
How does your relation to the supplier look like? (frequency, depth, collaboration on
problem solving etc.)
How do the attributes of the relation affect solving issues related to the supplier?
Would you change anything in your role that could help improve lead times? (New
responsibilities etc.)
When do you contact your suppliers? Only when there are problems?
How is the forecast data quality MHC? Do you feel that the sales persons (at MHC)
understand your position?
Do you get support from the lead buyer when there are problems?
How accurate do you feel the forecasts are?
Lead time How does the length of these affect your work?
What are, according to you, the largest consequences of long lead times?
How could you as a planner support and contribute to the progress of a lead time project?
64
Have you been part of projects that aim to reduce lead time?
Overall Which activities/processes do you see as possible to change in order to shorten lead times?
(both at the supplier and at MHC)
How large amount of your work is manual and how much is automatic?
o Do you double check the automatic orders?
Interview template – External companies Presentation of our thesis
The goal with the interview is to find out how your company work with process
improvements together with your suppliers
The company’s pre requisites The customer’s expectations (quality, time, price – which has the highest priority?)
Demand pattern (fluctuating?)
Geographic placement of suppliers
Lead time from suppliers
Process improvements How do you generally work with improving processes? Is the way of work standardized?
Lead time reduction What priority does this have for your company?
Who (purchasing, supply chain etc.) is responsible for decreasing lead times?
In which phase (product development, choosing suppliers, contract negotiations,
improvement projects for current products) do you see the most potential and where do you
put in the most effort? Why?
Which activities do you focus on when conducting lead time reduction projects? How are
they prioritized?
Supplier relations How is the relationship maintained?
Which contact areas are there between you and the supplier (Purchasing, R&D, quality etc.)?
o What frequency and depth (e-mail, meetings etc.) do these relations have?
o Are there any standardized agendas? What is brought up and why?
o Is this adapted depending on how the relationship is categorized?
Power balance in the relationship?
How do these bullets affect the possibility for conducting lead time reduction projects?
Performance improvements How do you work together with the supplier in order to improve performance (lead times,
stock levels, etc.)?
Have you conducted any joint improvement projects?
o Reactive or proactive?
o Who’s initiative?
o Workflow?

65
Contracts How much emphasis is placed on lead time when designing contracts?
Measurements Which KPI’s are used to measure supplier performance? Why these?
How is target levels set for lead times (or other KPI’s)?
How do you measure and follow up actual performance?
Would it be beneficial with more KPI’s? Which?

66
Appendix 2 – Values for control chart
Sample size n c4 d2
2 0,7979 1,128
3 0,8862 1,693
4 0,9213 2,059
5 0,9400 2,326
6 0,9515 2,534
7 0,9594 2,704
8 0,9650 2,847
9 0,9693 2,970
10 0,9727 3,078
11 0,9754 3,173
12 0,9776 3,258
13 0,9794 3,336
14 0,9810 3,407
15 0,9823 3,472
16 0,9835 3,532
17 0,9845 3,588
18 0,9854 3,640
19 0,9862 3,689
20 0,9869 3,735
21 0,9876 3,778
22 0,9882 3,819
23 0,9887 3,858
24 0,9892 3,895
25 0,9886 3,931

67
Appendix 3 – Calculation format
PRESENT STATE FUTURE STATE ANNUAL SAVINGS
Safety stock Safety stock Safety stockCapital cost Capital cost Capital cost
Product value per unit € 10,00 Product value per unit € 10,00 Decreased tied up capital € 20 000,00
Number of units in stock 5 000 Number of units in stock 3 000 Decreased cost for tied up capital € 230,14
Amount of tied up capital € 50 000,00 Amount of tied up capital € 30 000,00 Warehouse space costDays in stock 30 Days in stock 30 Decreased warehouse space € 2 000,00
Interest rate 14,00% Interest rate 14,00% Cost for obsolescenceAnnual capital cost for tied-up capital € 575,34 Annual capital cost for tied-up capital € 345,21 Decreased obsolescence € 0,00
Cost for damaged goods
Warehouse space cost Warehouse space cost Decreased amount of damaged goods € 0,00
Number of product units in stock 5000 Number of product units in stock 3000
Product units per warehouse space unit 100 Product units per warehouse space unit 100 Total annual savings related to safety stock € 2 230,14
Cost per warehouse space unit € 100,00 Cost per warehouse space unit € 100,00
Annual cost for warehouse space € 5 000,00 Annual cost for warehouse space € 3 000,00 Rush ordersTotal annual savings related to safety stock € 0,00
Cost for obsolescence Cost for obsolescence
Product value per unit € 10,00 Product value per unit € 10,00 Manufacturing and operations planningAmount of obsolete product units 50 Amount of obsolete product units 50 Total annual savings related to safety stock € 0,00
Annual cost for obsolescence € 500,00 Annual cost for obsolescence € 500,00
Lost salesCost for damaged goods Cost for damaged goods Total annual savings related to safety stock € 0,00
Product value per unit € 10,00 Product value per unit € 10,00
Amount of scrapped product units 5 Amount of scrapped product units 5
Annual cost for obsolescence € 50,00 Annual cost for obsolescence € 50,00
Decreased tied up capital € 20 000,00
Total annual cost related to safety stock € 6 125,34 Total annual cost related to safety stock € 3 895,21 Total annual savings € 2 230,14
Rush orders Rush ordersShipping cost per rush order € 150,00 Shipping cost per rush order € 150,00
Man time per rush order 2 Man time per rush order 2
Cost per man time € 60,00 Cost per man time € 60,00
Cost per rush order € 270,00 Cost per rush order € 270,00
Amount of rush orders 5 Amount of rush orders 5
Annual cost for rush orders € 1 350,00 Annual cost for rush orders € 1 350,00
Manufacturing and operations planning Manufacturing and operations planningMan time per re-planning 8 Man time per re-planning 8
Cost per man time € 60,00 Cost per man time € 60,00
Cost per rush order € 480,00 Cost per rush order € 480,00
Amount of re-plannings 5 Amount of re-plannings 5
Annual cost for re-planning € 2 400,00 Annual cost for re-planning € 2 400,00
Lost sales Lost salesSales value per product unit € 15,00 Sales value per product unit € 15,00
Amount of items out-of stock 100 Amount of items out-of stock 100
Annual cost for re-planning € 1 500,00 Annual cost for re-planning € 1 500,00
Total annual cost € 11 375,34 Total annual cost € 9 145,21
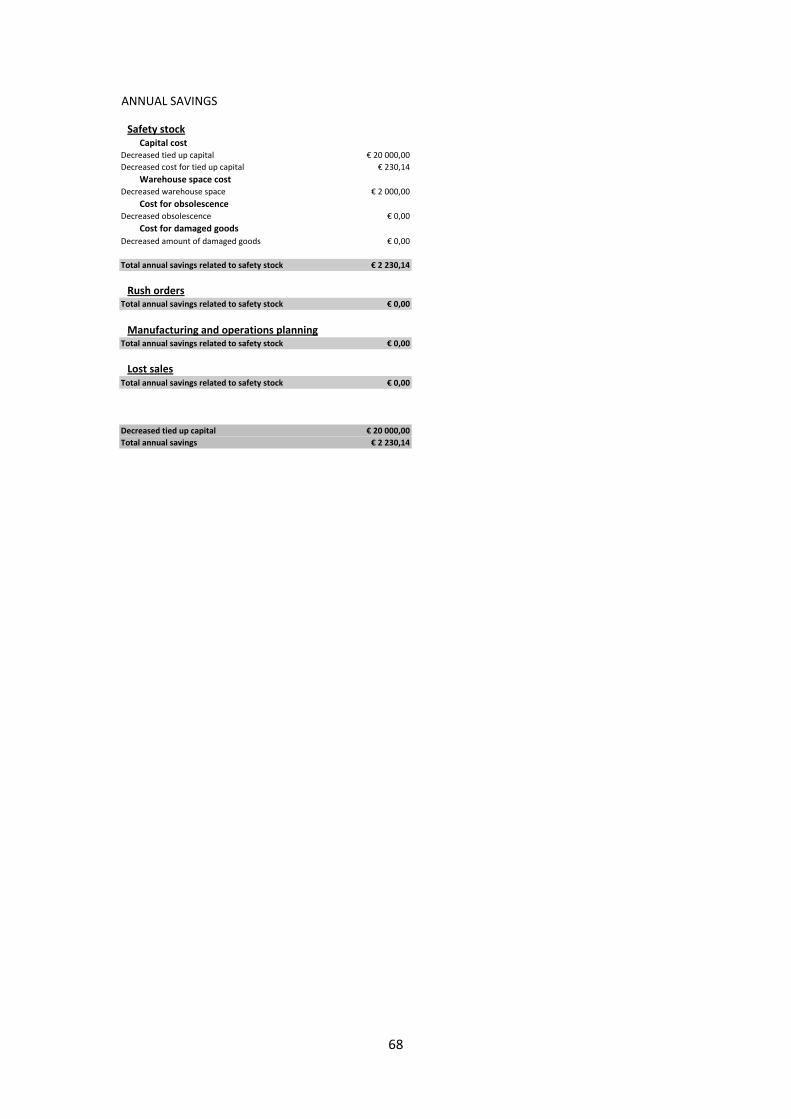
68
PRESENT STATE FUTURE STATE ANNUAL SAVINGS
Safety stock Safety stock Safety stockCapital cost Capital cost Capital cost
Product value per unit € 10,00 Product value per unit € 10,00 Decreased tied up capital € 20 000,00
Number of units in stock 5 000 Number of units in stock 3 000 Decreased cost for tied up capital € 230,14
Amount of tied up capital € 50 000,00 Amount of tied up capital € 30 000,00 Warehouse space costDays in stock 30 Days in stock 30 Decreased warehouse space € 2 000,00
Interest rate 14,00% Interest rate 14,00% Cost for obsolescenceAnnual capital cost for tied-up capital € 575,34 Annual capital cost for tied-up capital € 345,21 Decreased obsolescence € 0,00
Cost for damaged goods
Warehouse space cost Warehouse space cost Decreased amount of damaged goods € 0,00
Number of product units in stock 5000 Number of product units in stock 3000
Product units per warehouse space unit 100 Product units per warehouse space unit 100 Total annual savings related to safety stock € 2 230,14
Cost per warehouse space unit € 100,00 Cost per warehouse space unit € 100,00
Annual cost for warehouse space € 5 000,00 Annual cost for warehouse space € 3 000,00 Rush ordersTotal annual savings related to safety stock € 0,00
Cost for obsolescence Cost for obsolescence
Product value per unit € 10,00 Product value per unit € 10,00 Manufacturing and operations planningAmount of obsolete product units 50 Amount of obsolete product units 50 Total annual savings related to safety stock € 0,00
Annual cost for obsolescence € 500,00 Annual cost for obsolescence € 500,00
Lost salesCost for damaged goods Cost for damaged goods Total annual savings related to safety stock € 0,00
Product value per unit € 10,00 Product value per unit € 10,00
Amount of scrapped product units 5 Amount of scrapped product units 5
Annual cost for obsolescence € 50,00 Annual cost for obsolescence € 50,00
Decreased tied up capital € 20 000,00
Total annual cost related to safety stock € 6 125,34 Total annual cost related to safety stock € 3 895,21 Total annual savings € 2 230,14
Rush orders Rush ordersShipping cost per rush order € 150,00 Shipping cost per rush order € 150,00
Man time per rush order 2 Man time per rush order 2
Cost per man time € 60,00 Cost per man time € 60,00
Cost per rush order € 270,00 Cost per rush order € 270,00
Amount of rush orders 5 Amount of rush orders 5
Annual cost for rush orders € 1 350,00 Annual cost for rush orders € 1 350,00
Manufacturing and operations planning Manufacturing and operations planningMan time per re-planning 8 Man time per re-planning 8
Cost per man time € 60,00 Cost per man time € 60,00
Cost per rush order € 480,00 Cost per rush order € 480,00
Amount of re-plannings 5 Amount of re-plannings 5
Annual cost for re-planning € 2 400,00 Annual cost for re-planning € 2 400,00
Lost sales Lost salesSales value per product unit € 15,00 Sales value per product unit € 15,00
Amount of items out-of stock 100 Amount of items out-of stock 100
Annual cost for re-planning € 1 500,00 Annual cost for re-planning € 1 500,00
Total annual cost € 11 375,34 Total annual cost € 9 145,21