a framework for thinking about informal1)_makar_rubin.pdf · a framework for thinking about...
TRANSCRIPT
82
A FRAMEWORK FOR THINKING ABOUT INFORMAL STATISTICAL INFERENCE7
KATIE MAKAR
The University of Queensland [email protected]
ANDEE RUBIN
TERC [email protected]
ABSTRACT
Informal inferential reasoning has shown some promise in developing students’ deeper understanding of statistical processes. This paper presents a framework to think about three key principles of informal inference – generalizations ‘beyond the data,’ probabilistic language, and data as evidence. The authors use primary school classroom episodes and excerpts of interviews with the teachers to illustrate the framework and reiterate the importance of embedding statistical learning within the context of statistical inquiry. Implications for the teaching of more powerful statistical concepts at the primary school level are discussed. Keywords: Statistics education research; Informal inferential reasoning; Statistical
inquiry; Ill-structured problems; Teacher professional development
To be uncertain is to be uncomfortable, but to be certain is to be ridiculous. - Chinese proverb
1. INTRODUCTION
Today, schools are increasingly being asked to prepare students to be flexible
thinkers, lifelong learners, and to manage complexities of an uncertain world. Together with a dramatic rise in access to information and availability of technological tools, the increased focus on incorporating data into curriculum and on learning statistics in school has been an obvious welcome outcome. Recommendations in the U.S. (National Council of Teachers of Mathematics, 1989, 2000) and Australia (Curriculum Corporation, 2006; Queensland Studies Authority, 2006) have included a much greater emphasis on the teaching of statistics in school. Unfortunately, these recommendations are translated into lessons and assessments that often consist of little more than computation of averages and basic interpretation of graphs (Sorto, 2006). Specifically in primary school, “statistics is frequently portrayed in a very narrow and limited way, which can be encapsulated: every phenomenon can be captured by a bar chart” (Ben-Zvi & Sharett-Amir, 2005, p. 1).
New data visualization tools aimed at middle and high school students (e.g., Finzer, 2001; Konold & Miller, 2005) have provided opportunities and the impetus to include foundational statistical concepts not previously taught to this age, such as inferential reasoning (Ben-Zvi, 2006) and the broader process of statistical investigations (Wild & Pfannkuch, 1999). Konold & Pollatsek (2002) articulated this as “a new level of
Statistics Education Research Journal, 8(1), 82-105, http://www.stat.auckland.ac.nz/serj © International Association for Statistical Education (IASE/ISI), May, 2009
83
commitment to involve students in the analysis of real data to answer practical questions” (p. 259). This commitment goes beyond simple interpretations of graphs and calculations of averages as is commonly taught in schools. The foundational difference in newer approaches to working with data is the shift from learning statistical tools and artefacts (measures, graphs, and procedures) as the focus of instruction, towards more holistic, process-oriented approaches to learning statistics. This move was initiated by the foundational work of Tukey’s (1977) Exploratory Data Analysis (EDA) movement, but is now expanding to concepts that go beyond data analysis techniques. Exploratory Data Analysis is “about looking at data to see what it seems to say” (Tukey, 1977, p. v). It focuses on visual impressions of data as partial descriptions and supports attempts to “look beneath them for new insights” (ibid). More recently, research has focused on understanding attempts not just beneath the data, but also beyond the data, towards thinking and reasoning inferentially with data.
Although early research is showing promising results, little has been written specifically about what an inference-driven approach to learning statistics entails or what is meant by “informal inferential reasoning” in learning statistics. In broad terms, we consider informal inferential reasoning in statistics to be the process of making probabilistic generalizations from (evidenced with) data that extend beyond the data collected. Inferential reasoning will take on different levels of depth and technical detail at different levels of schooling and experience. In this paper, we build on previous research on inferential statistical reasoning to propose a theoretical framework for learning statistics using informal inference as a process of meaning-making and evidence-building. We then use classroom episodes to illustrate this approach in practical terms. Finally, we suggest avenues for teaching informal inferential reasoning that focus on statistics as a process in preference to teaching statistics as artefacts and objects. This discussion is situated within the issues and opportunities that arose in embedding teaching inferential reasoning with data (not always intentionally) into purposeful contexts with primary school students in Years 3 through 5 (ages 7 – 10) in Australia.
2. INFERENTIAL STATISTICAL REASONING
Research in statistics education has long suggested that students have difficulty using
statistical processes appropriately in applied problems. “Inference is so hard that even professional researchers use it inappropriately” (Erickson, 2006, p. 1). For example, research on initial university statistics courses suggests that even students who could successfully implement procedures for hypothesis testing and parameter estimation were unable to use these procedures appropriately in applications (Gardner & Hudson, 1999; Reichardt & Gollob, 1997). Parallel findings in school statistics report difficulties students have appropriately using descriptive statistics and graphs to draw conclusions that make sense in problem contexts in which they are used (Pfannkuch, Budgett, & Parsonage, 2004); this is largely due to an overwhelming focus in schools on constructing graphs without knowing the reasons for doing so (Friel, Curcio, & Bright, 2001).
There has been a dramatic shift in statistics education research over the past few years from a focus on procedures—calculating a mean, interpreting box plots, comparing groups—towards a greater focus on statistical reasoning and thinking. One area of focus has been on reasoning about variation and distributions within the context of making meaning of the data (e.g., Cobb, 1999). Bakker and his colleagues (Bakker & Gravemeijer, 2004) have argued that by focusing on shape, students are able to shift their attention on holistic aspects of distributions. Konold and his colleagues (Konold et al., 2002) and others have argued for the need to focus learners on the modal clump (e.g.,
84
Bakker, 2004; Cobb, 1999; Makar & Confrey, 2005) and aggregates (Konold, Higgins, Russell, & Khalil, 2003). Despite this research, there is still an overwhelming emphasis in curriculum documents, national standards, and international assessments on statistics as interpreting graphs and finding averages (e.g., Sorto, 2006).
Although these research studies have often focused on statistical tools, it is important to note that they have situated these tools within statistical processes. It would be of concern if the intensive focus on graphs and calculations in school were simply replaced by a focus on clumps and distribution shapes as tools and artefacts of statistics rather than as embedded in the processes and contexts under investigation. Averages, distributions, variation, samples, modal clumps—these can be studied as objects in themselves, or as tools for understanding processes or group characteristics. It is vital that the focus in using statistical tools is embedded in the reason that we do statistics—to understand underlying phenomena. Certainly these authors are arguing for the latter.
This shift in research from statistical tools to statistical processes has been an important one and has raised new issues. Wild and Pfannkuch (1999) wrote extensively about the statistical investigation cycle and the dispositions and thinking that align with these processes. Research by Hancock, Kaput, and Goldsmith (1992) highlighted the challenges students encountered in connecting their statistical questions to the data needed as evidence, and then again linking their conclusions back to the questions under investigation. They argued that this part of the statistical process is largely ignored in school and needs greater attention. Focusing on investigating phenomena entails understanding the statistical investigation cycle as a process of making inferences. That is, it is not the data in front of us that is of greatest interest, but the more general characteristics and processes that created the data. This process is indeed inferential.
This recognition has sparked a great deal of interest in students’ inferential reasoning in statistics and researchers over the last several years have “grappled with the conceptual building blocks for informal inferential reasoning” (Pfannkuch, 2006, p. 1). Like many of our colleagues in this area of research (see Pratt & Ainley, 2008), we would argue that inferential reasoning and statistical investigations cannot be separated. With this in mind, this paper discusses a framework for working to understand building blocks of informal statistical inference and inferential reasoning within a context of statistical investigations. By choosing to illustrate the framework within classrooms that are learning statistics through inquiry and investigation, our goal is not to focus on the distinction between product and process as it relates to inference, but to demonstrate that inferences are meant to be embedded within processes that create them. As such, we discuss both inference and inferential reasoning in this paper without trying to artificially separate these notions. In designing the framework, our aim was to investigate the concepts and processes of statistical inference and inferential reasoning more generally. We wanted to examine the potential of rebalancing the over-emphasis on procedures and calculations in school statistics, and capture the kind of informal inferential reasoning reported by Ben-Zvi and Sharett-Amir (2005) in their research with very young children exploring predictions of the number of baby (milk) teeth lost by their classmates.
3. A FRAMEWORK FOR INFORMAL STATISTICAL INFERENCE
A recent goal in statistics education has been to broaden the concept of inference from
its immediate association with hypothesis testing at the tertiary level, to allow its application to work with children through their making of inferential statements. To separate these inferences which clearly do not involve formal procedures of hypothesis testing, we will adopt the term widely becoming utilized by statistics education
85
researchers: informal statistical inference. We consider in broad terms statistical inference as both an outcome and a reasoned process of creating or testing probabilistic generalizations from data. By formal statistical inference, we refer to inference statements used to make point or interval estimates of population parameters, or formally test hypotheses (generalizations), using a method that is accepted by the statistics and research community. Informal statistical inference is a reasoned but informal process of creating or testing generalizations from data, that is, not necessarily through standard statistical procedures (see Zieffler, Garfield, delMas, & Reading, 2008 for an in-depth discussion of informal reasoning). The use of the word informal here is only meant to emphasize the broad application of inferential reasoning and open the possibility to consider statistical inference outside of formal procedures. Although the teaching of informal inference supports conceptual understanding of later formal statistical inferential processes, the goal is not necessarily to prepare students to do formal statistical inference. We see the potential for informal inference in deepening students’ understanding of the purpose and utility of data more generally with direct applicability to making meaning of their world. Our goal here is not so much to define informal statistical inference as it is to broaden accessibility to inferential reasoning with data.
Initial concepts that we saw as critical included the following: • Notion of uncertainty and variability articulated through language that broke from
the mathematical convention of claims of certainty; • Reliance on the concept of aggregate (as opposed to individual points) through
the use of generalizations about the group; • Acknowledgement of a mechanism or tendency that extended beyond the data at
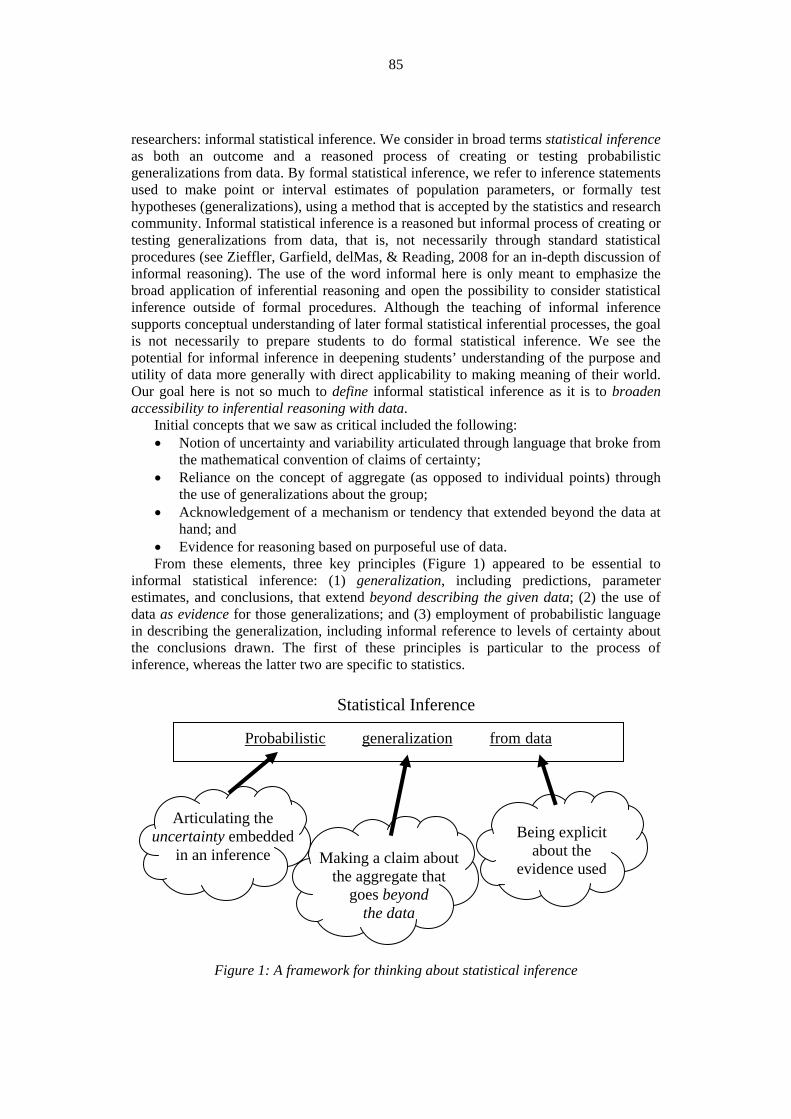
hand; and • Evidence for reasoning based on purposeful use of data. From these elements, three key principles (Figure 1) appeared to be essential to
informal statistical inference: (1) generalization, including predictions, parameter estimates, and conclusions, that extend beyond describing the given data; (2) the use of data as evidence for those generalizations; and (3) employment of probabilistic language in describing the generalization, including informal reference to levels of certainty about the conclusions drawn. The first of these principles is particular to the process of inference, whereas the latter two are specific to statistics.
Figure 1: A framework for thinking about statistical inference
Probabilistic generalization from data
Statistical Inference
Articulating the uncertainty embedded
in an inference Making a claim about the aggregate that
goes beyond the data
Being explicit about the
evidence used
86
3.1. GENERALIZATIONS ‘BEYOND THE DATA’ As in mathematics, statistical generalizations are abstractions from particular cases
(data) to holistic statements that apply to a broader set of cases (population). In a traditional sense, generalizations (inferences) move from a sample to a specified population—for example, inferring from a sample of one class of 12-year-old children to a population of all 12-year-olds in a school. A fundamental difference between descriptive and inferential statistics is the act of looking beyond the data to cases outside of the sample at hand. For example, in some ways a mean is a generalization because it is an abstraction from individual cases to a general property of the aggregate. However, because the mean does not extend beyond the data at hand, we do not consider it to be inferential.
Consequently, EDA, which focuses on “looking at data to see what it seems to say” (Tukey, 1977, p. v) is not necessarily inferential if the focus remains on the data at hand. Dewey (1910) uses the term inference to talk about this move beyond the data: “The exercise of thought is, in the literal sense of that word, inference … it involves a jump, a leap, a going beyond what is surely known to something else accepted on its warrant” (p. 26). Being able to separate description of the data at hand from an inference to the population is not a trivial matter. Researchers like D. Pratt (personal communication, 7 July, 2005) and Pfannkuch (2006) have documented difficulties encountered by teachers and learners in slipping between talking about the sample (data at hand) and population (inference beyond the data). Our hope is that by making explicit the importance of moving beyond the data when making generalizations in statistics, these slippages can be reduced.
Alternatively, a population may be more conceptually defined by describing a mechanism to a process (as in the making of widgets in a factory, see Rubin, Hammerman, & Konold, 2006) or future population not yet existing (as in students who will be in the school in coming years, see Makar & Confrey, 2004). Generalizations may be used to either generate hypotheses or evaluate them. By “evaluate” here, we are not limited to the use of standard statistical tests, but refer to attempts at processes to formally or informally assess the viability of a claim against the given data. Generative hypotheses, on the other hand, are speculative statements which are created by a reasoned process but for which their likelihood has not necessarily been systematically assessed.
3.2. DATA AS EVIDENCE
By data, we refer to evidence that is accepted by the community in which the
evidence is being presented. Data may be numerical, observational, descriptive, or even unrecorded. What is important is that their use as evidence is accepted within the context it is being used. It might be expected that the person making the inference would provide an explanation or argument (implicitly or explicitly) that draws on the data as evidence for the inference. At a very young age, for example, we may be more likely to accept observation as data to encourage initial development of inferential thinking (Ben-Zvi & Sharett-Amir, 2005) and develop a language for explaining and reasoning with data. Later on, we encourage students to critique this type of evidence in preference for more robust and reliable approaches. Hancock et al. (1992) have noted the difficulty that learners have in connecting data collected to the question under investigation and conclusions drawn. Attention to the need to make this connection more explicit may help teachers to better support these links.
87
One type of informal inference is a creative, inductive process in which a learner generates a tentative hypothesis by observing patterns in the data. A potential support for creating tentative hypotheses is through a process of abduction, an inference or theorizing to explain or account for the data in relation to the context. This process, as explained by Galileo (1638), “prepares the mind to understand and ascertain other facts without the need to recourse to experiment” (as cited in Magnani, 2001, p. 37). This focus on context and explanation is important, as noted by Dewey (1910) in saying that “the data at hand cannot supply the solution; they can only suggest it” (p. 12). It is up to the one making the inference to connect the evidence meaningfully to the claim and to explain it in terms of the context.
A powerful approach to improving students’ use of statistical reasoning and thinking is by embedding statistical concepts within a purposeful statistical investigation that brings the context to the forefront (Makar & Confrey, 2007). By focusing on trying to find out something of interest to students, they gain important insight into how statistical tools can be used to argue, investigate, and communicate foundational statistical ideas. Wild and Pfannkuch (1999) argue that a number of elements are central to statistical thinking, including the following: recognizing the need for data; transforming situations and representations into meaningful statistical tools that can provide insight into the problem; having opportunities to recognize, work with, and deepen understanding of variation; envisioning statistics within a framework of its utility to gain insight; and being able to shuttle between the context sphere and statistical sphere. Their inclusion of recognition of the need for data as a type of thinking foundational to statistical thinking is often overlooked, particularly in schools. Perhaps it’s considered trivial, too obvious. After all, without data, no statistics can be done.
3.3. PROBABILISTIC LANGUAGE
Because inferring to a population contains elements of uncertainty, statistical
inferences must contain probabilistic language, implying statistical tendency, and/or level of confidence or uncertainty in a prediction. We are not implying here that an explicit or quantified level of confidence needs be indicated (as is done with confidence intervals), although the idea is related to concepts of chance and our confidence in inferential predictions based on the strength of evidence presented (Rossman, 2008). Because generalizations go beyond the given data, they cannot be stated in absolute terms. The problem of deterministic thinking in statistics has been well documented (e.g., Abelson, 1995). Probabilistic language can be any language appropriate to the situation and level of students to suggest uncertainty in a speculated hypothesis, that a prediction is only an estimate, or that a conclusion does not apply to all cases. For example, in using data to estimate the average height of an eight-year-old, students may suggest the typical height to be ‘around 130-138 cm’ rather than reporting more precisely that the typical height is 132 cm, which may be the mean of the data or value with the highest frequency (mode) from their class (Makar & McPhee, in press). Or a six-year-old child may suggest that the most common way for children at school to travel to school ‘may be’ by bus rather than stating it ‘is’ by bus. Probabilistic language can go beyond simply avoiding deterministic claims, however, as relationships involving overlapping distributions or multiple interpretations of a given distribution also necessitate avoidance of overly conclusive or excessively precise statements (Makar & Confrey, 2004).
Our focus on language in inferential reasoning emphasizes the importance of expressing uncertainty in making inferences. School statistics must work harder from an
88
early age to break the black-and-white approach to making inferences from data. Within statistics education, this is an area that needs a great deal more attention and research.
4. CONTEXT OF EPISODES
Section 5 reports on episodes from the initial phase (18 months) of an ongoing four-
year study investigating processes of teachers’ learning to teach mathematics and statistics through inquiry in a problem-based environment. Although the focus of the larger study is on inquiry, not inference, the data collected provide a number of opportunities to gain insight into teachers’ use of inference in teaching statistical inquiry. The larger study follows a model for design experiments (Cobb, Confrey, diSessa, Lehrer, & Schauble, 2003), where the context is simultaneously studied and improved through iterative cycles. The cycles in the study served several purposes. For the researcher, it provided multiple opportunities to observe and influence the study context. For the teachers, it gave them ongoing experiences to reflect on and improve their ability to teach statistical inquiry. For the students, it allowed opportunities to build on previous learning and engage with statistical inquiry in increasingly sophisticated ways.
Four primary school teachers at a suburban state school in Australia participated in the first year of the study. The teachers volunteered for the study after being identified by their school’s deputy principal (in some cases, with a bit of friendly coercion) and attending a briefing session by the first author. They were all considered to be effective and innovative teachers, in agreement with the idea of including inquiry in mathematics, and interested in learning how to implement statistical inquiry with their students. Although they were all reform-oriented teachers, they represented a broad range of experience – from a teacher in his first year in the classroom to a veteran teacher with over 30 years of experience. After the first year (2006), one teacher (Josh) in the study was transferred and replaced (Elise); another teacher went on leave after the first term in 2007 (Carla).
At the time the reported episodes were analyzed, the study had undergone six cycles over 18 months with a cycle being one school term (lasting about 10 weeks). In each cycle, teachers taught an inquiry-based unit on statistics that they designed themselves or adapted from published units (e.g., Gideon, 1996). These units were not explicitly designed to focus on inference and indeed many did not include any significant use of inferential reasoning as inference was not directly a part of the mathematics syllabus for this age group (Queensland Studies Authority, 2006). For units that did lend themselves to informal statistical inference, we draw attention to ways in which inference played a role in the teachers’ learning to teach statistical inquiry.
In four of the six terms, teachers met with the first author for a full day workshop after which teachers designed and implemented an inquiry unit with their students lasting from one to three weeks (Table 1). Full-day learning seminars were audio or video recorded. Each seminar involved four distinct sessions, each lasting 30-90 minutes. The initial session consisted of a discussion of overarching issues that arose in teaching the units. Next, the teachers would engage in an activity, as learners, aimed at a particular aspect of statistical inquiry. The teachers were given some planning time with resources following this. The day would end with a sharing sessions of plans and expectations for the next unit.
Each term (except in the third cycle), the researcher videotaped several lessons in the units that teachers implemented (60%-75% of lessons), photographed or collected unit artefacts (e.g., lesson plans, student work), recorded researcher observations and reflections, and audio or videotaped follow-up interviews to debrief after the unit. The
89
episodes below draw on relevant aspects of the data that provided insight into the framework described in Section 3.
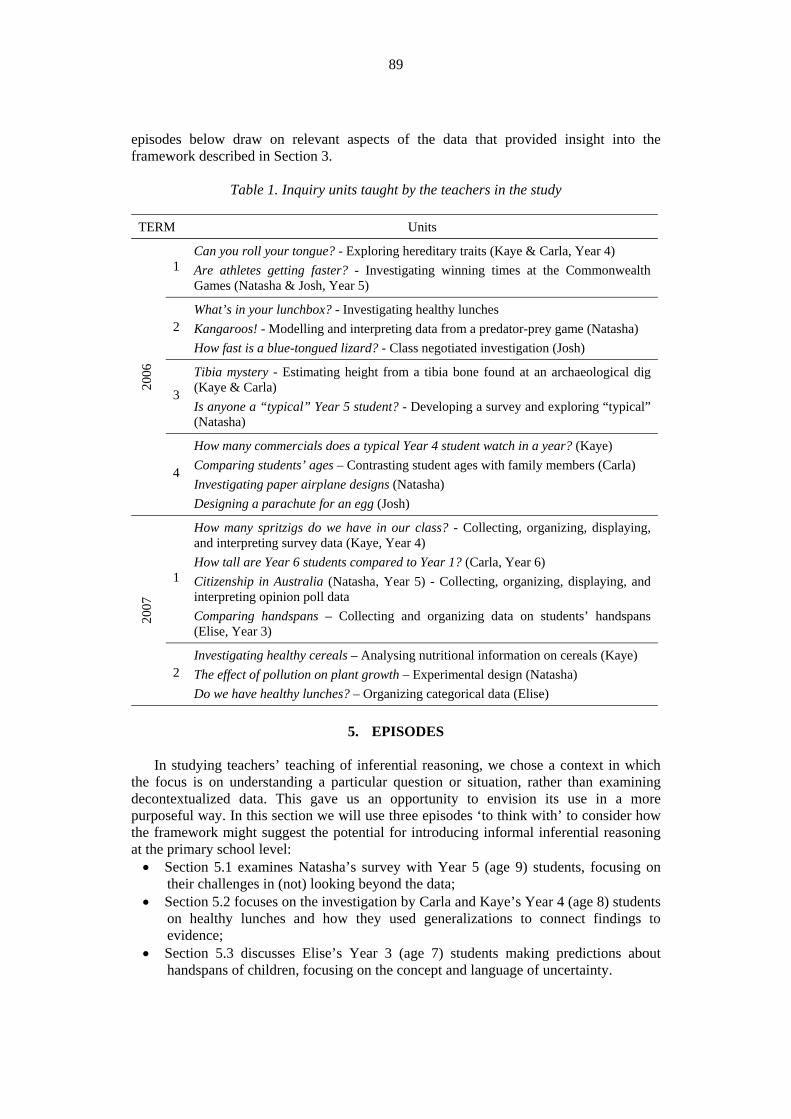
Table 1. Inquiry units taught by the teachers in the study
TERM Units
2006
1 Can you roll your tongue? - Exploring hereditary traits (Kaye & Carla, Year 4) Are athletes getting faster? - Investigating winning times at the Commonwealth Games (Natasha & Josh, Year 5)
2 What’s in your lunchbox? - Investigating healthy lunches Kangaroos! - Modelling and interpreting data from a predator-prey game (Natasha) How fast is a blue-tongued lizard? - Class negotiated investigation (Josh)
3
Tibia mystery - Estimating height from a tibia bone found at an archaeological dig (Kaye & Carla) Is anyone a “typical” Year 5 student? - Developing a survey and exploring “typical” (Natasha)
4
How many commercials does a typical Year 4 student watch in a year? (Kaye) Comparing students’ ages – Contrasting student ages with family members (Carla) Investigating paper airplane designs (Natasha) Designing a parachute for an egg (Josh)
2007
1
How many spritzigs do we have in our class? - Collecting, organizing, displaying, and interpreting survey data (Kaye, Year 4) How tall are Year 6 students compared to Year 1? (Carla, Year 6) Citizenship in Australia (Natasha, Year 5) - Collecting, organizing, displaying, and interpreting opinion poll data Comparing handspans – Collecting and organizing data on students’ handspans (Elise, Year 3)
2 Investigating healthy cereals – Analysing nutritional information on cereals (Kaye) The effect of pollution on plant growth – Experimental design (Natasha) Do we have healthy lunches? – Organizing categorical data (Elise)
5. EPISODES
In studying teachers’ teaching of inferential reasoning, we chose a context in which
the focus is on understanding a particular question or situation, rather than examining decontextualized data. This gave us an opportunity to envision its use in a more purposeful way. In this section we will use three episodes ‘to think with’ to consider how the framework might suggest the potential for introducing informal inferential reasoning at the primary school level: • Section 5.1 examines Natasha’s survey with Year 5 (age 9) students, focusing on
their challenges in (not) looking beyond the data; • Section 5.2 focuses on the investigation by Carla and Kaye’s Year 4 (age 8) students
on healthy lunches and how they used generalizations to connect findings to evidence;
• Section 5.3 discusses Elise’s Year 3 (age 7) students making predictions about handspans of children, focusing on the concept and language of uncertainty.
90
5.1. NATASHA: CHALLENGES IN (NOT) LOOKING BEYOND THE DATA An important tenet of statistical inference is its power to utilize given data to make
predictions, estimate parameters, or draw conclusions about a population or process beyond the data. In order for an inference to be valid, it must incorporate its target – that is, be an inference about a particular population or process for which the data are being used. Pfannkuch (2006) and Pratt (2005) showed that this is not a trivial concept. In this episode, we examine how this slippage between the data and population potentially created challenges in the unit.
Natasha is a teacher of students in Year 5 (age 9). Part of the Year 5 syllabus for social studies is an introduction to government and citizenship. Drawing on the success of the units she designed the previous year which integrated statistics with other content areas, Natasha decided to teach a statistical inquiry unit (her fifth in the study) in which students investigated the opinions of children and adults about their views of Australian rights of citizenship. A pre-constructed survey instrument from a local school resource on citizenship was used to collect data. After preliminary discussion on citizenship in Australia, she introduced the issue they would investigate.
Natasha: Over the last few months, there have been a lot of things in the media about who
has the right to be an Australian citizen and what’s required to become an Australian citizen. So, I thought it might be interesting if we found out what people think. OK? The people being, who?
Student: Us? Natasha: Yes, you people, your parents, people in our community. It might be interesting to
find out what they think. (Class 5N, 8 March 2007) Natasha introduces the purpose of the unit to students to find out “what people think”
about citizenship issues in Australia. She alluded to the ‘people,’ or target of their investigation, as “you people, your parents, people in our community.” By not posing a specific question, it was unclear when she set a goal of finding out “what people think,” whether the intention was to develop hunches, draw conclusions, gather insights, make predictions, or just describe the opinions of those that they would be gathering data about.
Clearly there was no intention to survey an entire community to get this information, so if her intention was to draw conclusions beyond their survey data, Natasha thought it would be important to discuss particular issues that would allow them to use a sample of the data (their survey data) to draw conclusions about the views of the community (beyond the data they collected). Several issues were considered, such as sample size, representativeness, and comparisons.
Natasha: Ok, how many people do you think we would need to survey to get a fairly
good idea of what people in this local community, in this school community, think?
Student: 5? Natasha: Five people! Would that be a really good indication of what people in this
school community think? Students: 55 … 100 or so? … 250? … Maybe 3 or 4 classes? Natasha: Ok, let me clarify I’m not just interested in what kids think. I’m interested in
what parents, and perhaps grandparents of our school community think. Or perhaps aunts and uncles, older people not just those under 18.
Students: 500? … 80%? Natasha: So, 80% of the whole [River] School community? Student: Maybe, one of the teachers from every grade?
91
Natasha: Do you think if you ask all of the teachers what they think, you’d get a good indication of what people in [River] School community think? … Do you think teachers might be completely representative of the community? … Teachers do have a [more liberal] political bias. OK? So maybe just giving it to the teachers it won’t work. …
Student: I was thinking maybe about surveying the adults about the same amount as kids.
Natasha: Ok, so you’d like to see if kids think differently than adults? Good! That would be very interesting, who would like to know that, if kids think differently than adults? [Students respond positively] … Ok, that sounds great. I have printed off two copies of the surveys for each person, one on each side of the form. Why don’t you get an adult to fill out one side? Now it would be good if you didn’t just ask a parent, if you have access to an aunt, an uncle, a grandparent, an elderly neighbour, but with mum and dad’s permission. (Class 5N, 8 March 2007)
Natasha was trying to stress to students that not only was it important to think about
how many people they would need to ask, but also to ensure that their sample was representative of the community (however vaguely defined) that they were describing. It was not clear at this point how the sample would be used to find out the views of the local community – whether it be to explore or predict general views, estimate proportion of people having particular views, or another purpose. Although somewhat vague about the population they would be investigating, Natasha worked to have students consider the validity of the data they were collecting in order to later draw conclusions.
After students collected their data, the unit struggled to make significant progress over the next couple of weeks and a formal ‘conclusion’ was never really made. In reflecting on the unit, Natasha made a number of observations that she felt may have explained this. What is interesting about her explanations is that in some ways they allow us to speculate about possible considerations for supporting children in thinking inferentially about data.
The primary issue, she felt, was that the topic of citizenship was not one that engaged the kids, saying, “They weren’t really interested in it. So they didn’t have their heart in getting to the bottom of something.” This was an interesting comment and suggests that in working to look ‘beyond the data,’ it is not just making a conclusion about data that provides the conceptual muscle to draw inferences, but a conclusion about the situation which the data are meant to represent or signify. Perhaps a focus on an interesting problem and context may influence students’ engagement with being inclined to look beyond the data they have. This further suggests that students need a particular level of complexity to engage with in order to consider possible avenues to connect the data with the context. Natasha spoke at some length about the structure of the data as a factor that limited the students’ ability to connect the data to something beyond graphs.
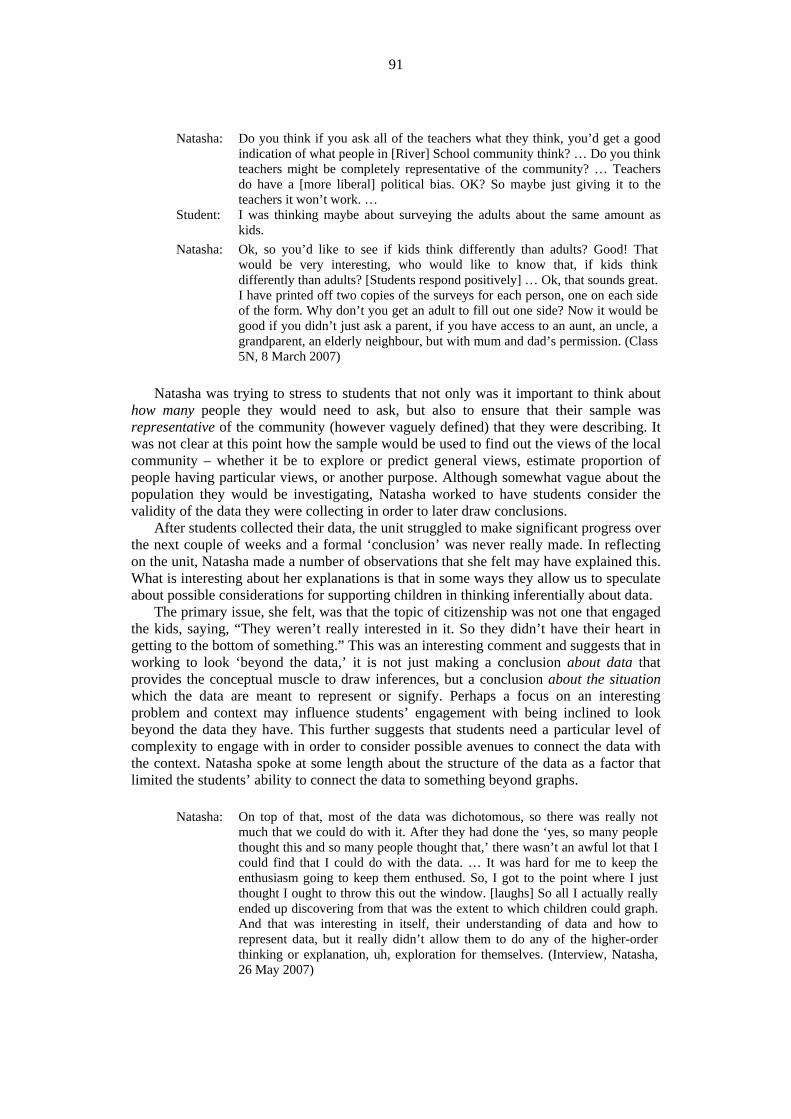
Natasha: On top of that, most of the data was dichotomous, so there was really not
much that we could do with it. After they had done the ‘yes, so many people thought this and so many people thought that,’ there wasn’t an awful lot that I could find that I could do with the data. … It was hard for me to keep the enthusiasm going to keep them enthused. So, I got to the point where I just thought I ought to throw this out the window. [laughs] So all I actually really ended up discovering from that was the extent to which children could graph. And that was interesting in itself, their understanding of data and how to represent data, but it really didn’t allow them to do any of the higher-order thinking or explanation, uh, exploration for themselves. (Interview, Natasha, 26 May 2007)
92
Natasha pondered the lack of complexity of the data as a factor that inhibited the unit from successfully transitioning from describing data to generalizing from the data in order to draw conclusions or make predictions about the beliefs in the community. Another issue she felt was critical was the driver behind the work, the purpose for which they were using the data:
Natasha: I also think that part of that was posing the question. In the studies [teaching
units] that have been successful, [they] started off with quite a clearly posed question and I lost the plot on the government unit because I didn’t pose a clear question, so when I got kind of bogged down with it all, I didn’t have direction. So I didn’t really have direction for the children. And I think that’s what really made that unit hard, too.
Researcher (R): … I know that one of the goals that you had said before, was that you wanted to see how they do with the graphing.
Natasha: … It gave me data to use for graphing, but it would have been no different if I had just done, the old, you know, ‘how many of you play soccer,’ ‘how many of you play netball.’ Whatever. And put that up on the board and had them graph it. … It was just a straightforward graphing unit, it wasn’t really an investigation. (Interview, Natasha, 26 May 2007)
Natasha’s point is that she was not sufficiently focused on answering any particular
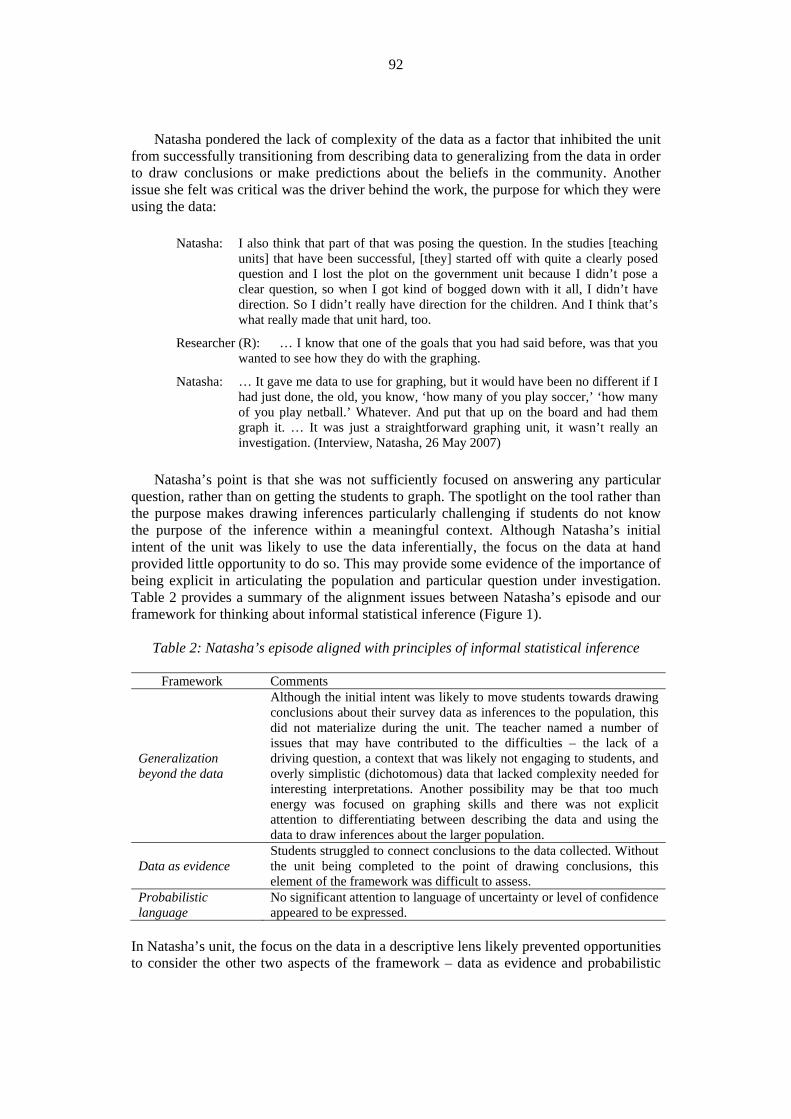
question, rather than on getting the students to graph. The spotlight on the tool rather than the purpose makes drawing inferences particularly challenging if students do not know the purpose of the inference within a meaningful context. Although Natasha’s initial intent of the unit was likely to use the data inferentially, the focus on the data at hand provided little opportunity to do so. This may provide some evidence of the importance of being explicit in articulating the population and particular question under investigation. Table 2 provides a summary of the alignment issues between Natasha’s episode and our framework for thinking about informal statistical inference (Figure 1).
Table 2: Natasha’s episode aligned with principles of informal statistical inference
Framework Comments
Generalization beyond the data
Although the initial intent was likely to move students towards drawing conclusions about their survey data as inferences to the population, this did not materialize during the unit. The teacher named a number of issues that may have contributed to the difficulties – the lack of a driving question, a context that was likely not engaging to students, and overly simplistic (dichotomous) data that lacked complexity needed for interesting interpretations. Another possibility may be that too much energy was focused on graphing skills and there was not explicit attention to differentiating between describing the data and using the data to draw inferences about the larger population.
Data as evidence Students struggled to connect conclusions to the data collected. Without the unit being completed to the point of drawing conclusions, this element of the framework was difficult to assess.
Probabilistic language
No significant attention to language of uncertainty or level of confidence appeared to be expressed.
In Natasha’s unit, the focus on the data in a descriptive lens likely prevented opportunities to consider the other two aspects of the framework – data as evidence and probabilistic
93
language. This suggests that the focus on generalization beyond the data is foundational to the other aspects of inferential reasoning. 5.2. CARLA AND KAYE: USING GENERALIZATIONS TO CONNECT
CONCLUSIONS TO EVIDENCE Two Year 4 (ages 8-9) teachers, Carla and Kaye, developed an inquiry unit in Term 2
(their second data inquiry unit in the study) to investigate whether students had healthy lunches. The unit was designed to tie in with a set of lessons on healthy eating as part of the Health curriculum. Because their previous (first) unit had been more structured (with students being given the investigation questions and guided through the inquiry cycle), Carla and Kaye decided to make this unit more student-directed, where students (in collaborative groups of 3-4 students) would develop questions to investigate, decide on appropriate data to collect, do their own analysis, and present their findings to the class. As students were preparing their findings to present to the class, the teachers found that groups were struggling to connect their conclusions to the data, as well as link the data back to the question under investigation. In a resource book they were using (Gideon, 1996), Carla and Kaye found mention of generalizations as part of the process of communicating conclusions that provided them with an idea to help students make these connections.
In an interview at the end of the lunchbox unit, Carla and Kaye spoke about the role that ‘making generalizations’ had in helping students draw connections and for using their investigation as a launching point for generating new hypotheses.
Kaye: I found some still needed support [making generalizations]. They didn’t have
any trouble collecting the data. They’re quite happy to go out and do that. But then when the data comes back, actually looking at what they need to specifically [answer the question] … they collected all this lovely data, and they might have collected boys and girls and things like that, but the original question was ‘Do students in Year 6 eat healthier than students in Year 2?’ … I said [to students], ‘This is extra. If you’ve collected that data, when you present the data, these are extra things, so you might be able to, once you’ve answered your question as such with a generalization, you can then go back and use that extra data [boys and girls] to give you extra information, but really, the first thing that, the first task that you’ve got to get around is that this is your question, and this is what you’re setting out to collect that data on.’
Carla: And my guys, we actually, they quite liked at the end when they were doing their presenting, when we asked them, when I asked them, or the kids asked the questions, um like ‘if you had collected this extra data, what other generalizations might you … have made?’ and I think that was a good link. … I was happy with that, ‘what if’ [questions]. That’s what I was hoping for. (Interview, Carla and Kaye, 17 July 2006)
For these teachers as well as their students, generalizations played an important role in
supporting understanding of two important processes. They supported students in making conclusions for the question at hand (connecting investigation questions to data collected and subsequent findings), and in seeing how conclusions and data (actual and potential) can also generate novel hypotheses and questions to investigate, particularly when students work to explain their findings (abduction). Although Carla’s use of generalizations often didn’t extend beyond the data, this term helped students move from a focus on individual points towards a more aggregate view of the data. Carla further
94
discussed how the class discussions of their generalizations helped students situate their data investigation within the larger context of peer pressure and body image.
Carla: It led to a discussion, really, on stereotypes and body image. Because my kids
came to the realization that … boys ate more junk food, because, in the upper grades, because girls were watching their figure, but boys could afford to because they did more sport or they used more energy. So, and that led onto our [health] unit discussions which was perfect. [Laughs] Yeah, that was really good. (Interview, Carla and Kaye, 17 July 2006)
Overall, Kaye and Carla recognized that though students tended to struggle making
clear connections between conclusions and the questions under investigation, their use of generalizations to make sense of these connections was a productive avenue for supporting student understanding. This connection not only helped students understand this connection, but helped the teachers in both learning and teaching this concept.
R: Any surprises or unexpected outcomes [in the unit]? Carla: Just that we figured out what generalizations are! There was one day that, last-
, the first time we did it [make generalizations, in the unit in Term 1], it was very, I found it very difficult to, kind of, teach the genre, I suppose, or what is a generalization. I tried, I don’t know. But this time, it was just a matter of saying [to students], ‘Well, what does that graph mean? Or what does it tell me? Ok, I haven’t time to read all those dots, so what does it tell me?’ And the kids would say “Oh, there, there were more girls than boys [who had a healthy lunch].” And it just made it so much easier. Yeah, that was my ‘whew!’ moment.
R: … There was just one day that it just seemed to really click for you. Talking about generalizations, and then how you link it to the data and try to find out, well, ‘How do you know that that’s true?’ What made you decide to-
Carla: Well, I’ve just been battling the whole time, thinking, how can I make it clearer, really, what generalizations are? I don’t know what it was. The kids were not getting it. I think I was standing with a group [in one lesson], they were still all looking at me. I didn’t know how to ask and they didn’t know how to answer me. And then it was just, ‘Ok, well, imagine I didn’t have time,’ like I said, ‘what would that tell me?’ And then I realized, ‘oh, that’s what a generalization is!’ It’s just that more, that simple idea or notion of that made it easier. Yeah. … And then turning it around, ‘If this is your generalization, where did you get that information from?’ That made the big difference. Because then, the kids had to figure out what graph it was. So asking both ways, that was good, that worked well. (Interview, Carla and Kaye, 17 July 2006)
Kaye and Carla further elaborated how using generalizations helped students go
beyond thinking about individual data points towards considering the data as an entity.
Kaye: I guess trying to get them, rather than just saying, ‘there were two people who liked ___,’ we had to come with something, but, um, to answer the question. [Students would say] ‘There were two who did this, and two who did that, and who did that, and four who did this and four who did that.’
Carla: And that’s not a generalization. Kaye: And it’s not really, it does interpret the results, but it’s not an overall
interpretation. (Interview, Carla and Kaye, 17 July 2006)
95
It was unlikely that Carla and Kaye were thinking about generalizations as being ‘beyond the data’ in the sense of making predictions or theorizing about populations or processes. However, their use of generalizations in this unit served as a step in better understanding the process of a statistical investigation themselves. Table 3 provides a summary of the alignment issues between Carla and Kaye’s episode and our framework for thinking about informal statistical inference.
Table 3: Carla and Kaye’s episode aligned with informal statistical inference framework
Framework Comments
Generalization beyond the data
The teachers used the concept of generalization to support students in moving beyond a focus on individual points towards a more aggregate view of the data. Although they did not distinguish between generalizations that interpreted the data at hand (descriptive) and those that stated a generalization beyond the data (inference), their utilization of generalizations may better prepare them to make this distinction later on.
Data as evidence
As with the previous example (Natasha’s Year 5 class), students struggled to connect conclusions to the data they had collected. However, the teachers found that by having students create generalizations, it was easier to then ask them to connect that generalization back to its evidence and to the question that drove the data collection.
Probabilistic language
No significant attention to language of uncertainty or level of confidence was expressed.
5.3. ELISE: USING INFORMAL INFERENCE TO MAKE PREDICTIONS
In a Year 3 (age 7) class early in the year, Elise developed a unit lasting about seven
days that had students complete multiple cycles of collecting and organizing data on the handspans (distance from thumb to smallest finger on an outstretched hand) of students in their class. To find their handspan, students each traced their hand on paper, drew a line to connect the end of their thumb with the farthest tip of their smallest finger, and then measured this handspan with a centimeter ruler. They created their own methods to collect and record the data of their classmates. This process was not straightforward, but through sharing ideas and challenges encountered, students came up with a process of recording each student’s handspan next to their name (not in any order). In one lesson, after students had collected and recorded their data, Elise began probing students to consider how the data might help them find out more about their class’s handspans.
Elise: What I’d like for us to think about this morning is finding out how many
children have the smallest handspan, how many children have the biggest handspan, how many people have different measurements for their handspans. So I want you in some way, to go and find that information, so that you can share it with somebody. (Class 3E, 8 March 2007)
Elise worked hard not to tell students how to organize their data, but rather used
skillful questioning to encourage students to seek more efficient and purposeful ways to organize their data. In the first iteration of collecting and organizing their data, students chose to organize the names and handspans of the students in their class as a list (Figure 2a). To encourage the students to organize the data further, Elise probed the class to find a
96
more efficient way to find out the shortest handspan, the longest handspan, as well as the most common handspan measurement than to search through the data each time.
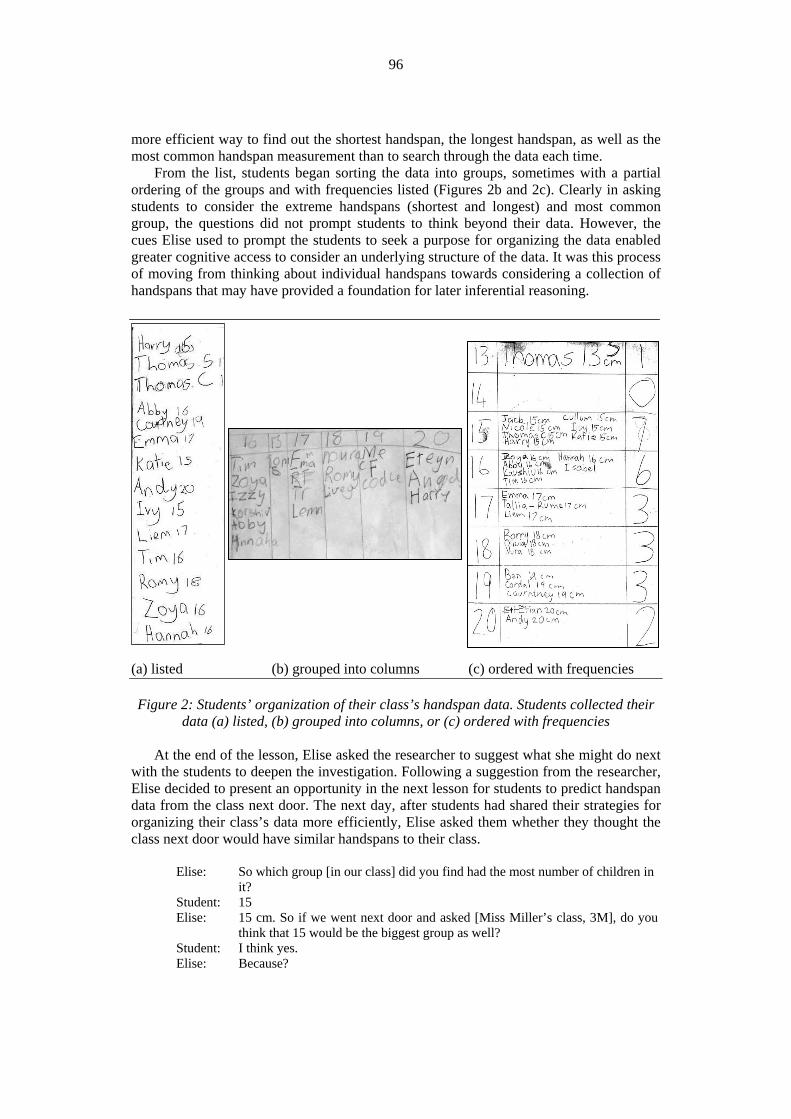
From the list, students began sorting the data into groups, sometimes with a partial ordering of the groups and with frequencies listed (Figures 2b and 2c). Clearly in asking students to consider the extreme handspans (shortest and longest) and most common group, the questions did not prompt students to think beyond their data. However, the cues Elise used to prompt the students to seek a purpose for organizing the data enabled greater cognitive access to consider an underlying structure of the data. It was this process of moving from thinking about individual handspans towards considering a collection of handspans that may have provided a foundation for later inferential reasoning.
(a) listed (b) grouped into columns (c) ordered with frequencies
Figure 2: Students’ organization of their class’s handspan data. Students collected their data (a) listed, (b) grouped into columns, or (c) ordered with frequencies
At the end of the lesson, Elise asked the researcher to suggest what she might do next
with the students to deepen the investigation. Following a suggestion from the researcher, Elise decided to present an opportunity in the next lesson for students to predict handspan data from the class next door. The next day, after students had shared their strategies for organizing their class’s data more efficiently, Elise asked them whether they thought the class next door would have similar handspans to their class.
Elise: So which group [in our class] did you find had the most number of children in
it? Student: 15 Elise: 15 cm. So if we went next door and asked [Miss Miller’s class, 3M], do you
think that 15 would be the biggest group as well? Student: I think yes. Elise: Because?
97
Student: Because … [our class is] about average height and taller people will probably have bigger hands and smaller will have smaller hands.
Elise: So you think that children in 3E [our class] are average size children? And you’re going to suggest that children in 3M [the class next door] are probably average sized children. Do you think that anyone in 3M is likely to have a handspan shorter than 13 cm? … Do you think that some children in 3M would have handspans longer than ours? (Class 3E, 9 March 2007)
The class ran out of time at that point, but the discussion gave Elise an idea to extend
the investigation further by asking Miss Miller, the teacher next door, to have her students trace their hands onto paper, just as Elise’s class had done to collect their own data. The next week, Elise presented her class with an opportunity to organize 3M’s data and compare them to their own.
Elise: If we went next door, would that be true of the class next door? Would we
also find that 15cm was the largest handspan group? Would we also find that 20 was the longest? … Some of you were saying yes, and some of you were saying no. So I did a bit of a tricky thing. I actually went next door and on Friday I got Miss Miller to draw, for the kids next door to actually [trace] their handspans. (Class 3E, 13 March 2007)
After measuring the neighboring class’s handspans, Elise asked students to work in
their groups to decide how they might plan to collect, record, and organize this new data, then to share their ideas with the class. One student described her group’s idea to set up rows for each measurement and list the names of students with that measurement in the row (as in Figure 2c).
Student: So we’re sort of mixing all the ideas. We’re mixing the columns idea, the
number idea, and the how many … Elise: Now, how did you know to start with thirteen there at the top? Student: Well because we already know, we’ve already answered one of your questions
[about our class] which is which was shortest which was longest, which was Fletcher and Greg was the longest and Eddie is the shortest, so we knew that nothing was under Eddie’s, which is Eddie’s is 13. That must mean we must start with 13. (Class 3E, 30 March 2007)
Elise noted that in listing their measurement categories, Beth had not included a
column for 14.
Elise: Why did you think there would be no one with 14? Beth: Because I didn’t really think anyone in 3M would have a big enough hand or
small enough hand to make it 14. Elise: Nobody in [our class] had 14 did they? Beth: No. So I was guessing about kind of the same amount of numbers. (Class 3E,
30 March 2007) The responses in the excerpts above and later in the lesson suggested to the researcher
that for many of the students, their predictions about the distribution of handspans in another class would be the same as, and perhaps even identical to, the distribution of handspans in their own class. Later, as students were beginning to organize the data that they had collected from the class next door, one of the students noted with surprise that the data from 3M differed from what she expected, “I just got a bit surprised when I found that someone had [a handspan of] 12” (Class 3E, 30 March 2007).
98
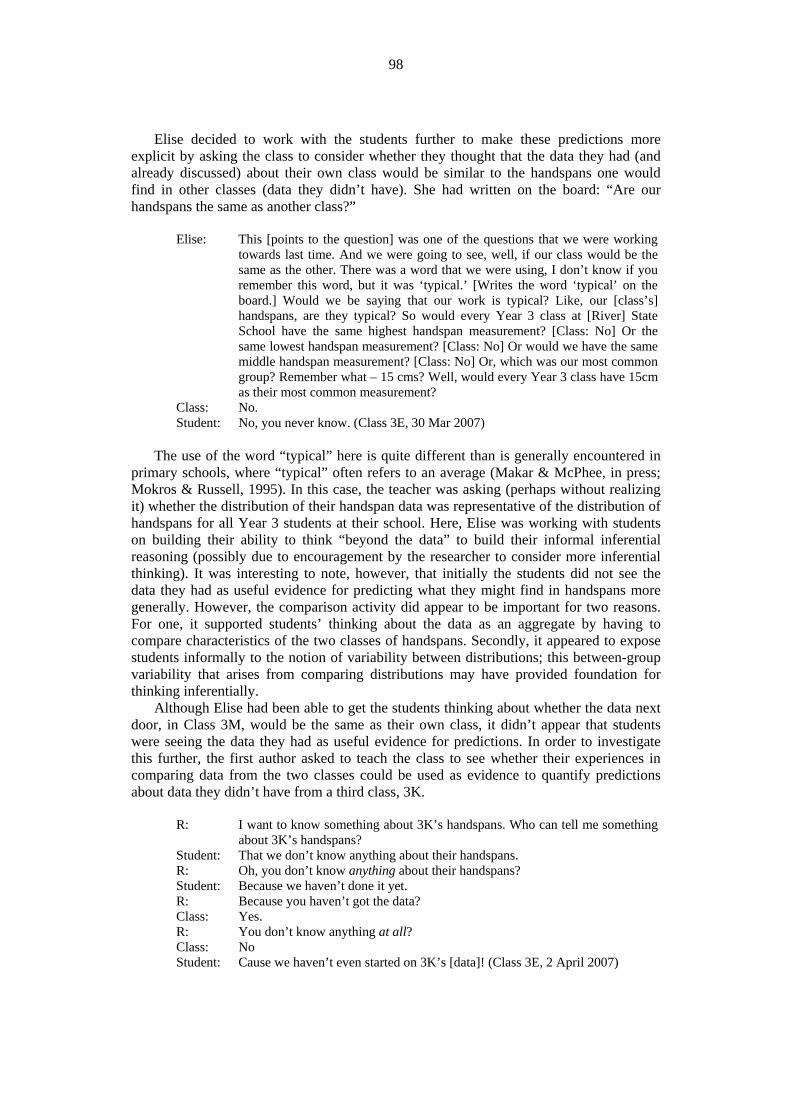
Elise decided to work with the students further to make these predictions more explicit by asking the class to consider whether they thought that the data they had (and already discussed) about their own class would be similar to the handspans one would find in other classes (data they didn’t have). She had written on the board: “Are our handspans the same as another class?”
Elise: This [points to the question] was one of the questions that we were working
towards last time. And we were going to see, well, if our class would be the same as the other. There was a word that we were using, I don’t know if you remember this word, but it was ‘typical.’ [Writes the word ‘typical’ on the board.] Would we be saying that our work is typical? Like, our [class’s] handspans, are they typical? So would every Year 3 class at [River] State School have the same highest handspan measurement? [Class: No] Or the same lowest handspan measurement? [Class: No] Or would we have the same middle handspan measurement? [Class: No] Or, which was our most common group? Remember what – 15 cms? Well, would every Year 3 class have 15cm as their most common measurement?
Class: No. Student: No, you never know. (Class 3E, 30 Mar 2007)
The use of the word “typical” here is quite different than is generally encountered in
primary schools, where “typical” often refers to an average (Makar & McPhee, in press; Mokros & Russell, 1995). In this case, the teacher was asking (perhaps without realizing it) whether the distribution of their handspan data was representative of the distribution of handspans for all Year 3 students at their school. Here, Elise was working with students on building their ability to think “beyond the data” to build their informal inferential reasoning (possibly due to encouragement by the researcher to consider more inferential thinking). It was interesting to note, however, that initially the students did not see the data they had as useful evidence for predicting what they might find in handspans more generally. However, the comparison activity did appear to be important for two reasons. For one, it supported students’ thinking about the data as an aggregate by having to compare characteristics of the two classes of handspans. Secondly, it appeared to expose students informally to the notion of variability between distributions; this between-group variability that arises from comparing distributions may have provided foundation for thinking inferentially.
Although Elise had been able to get the students thinking about whether the data next door, in Class 3M, would be the same as their own class, it didn’t appear that students were seeing the data they had as useful evidence for predictions. In order to investigate this further, the first author asked to teach the class to see whether their experiences in comparing data from the two classes could be used as evidence to quantify predictions about data they didn’t have from a third class, 3K.
R: I want to know something about 3K’s handspans. Who can tell me something
about 3K’s handspans? Student: That we don’t know anything about their handspans. R: Oh, you don’t know anything about their handspans? Student: Because we haven’t done it yet. R: Because you haven’t got the data? Class: Yes. R: You don’t know anything at all? Class: No Student: Cause we haven’t even started on 3K’s [data]! (Class 3E, 2 April 2007)
99
It seemed clear from their responses that the children did not see the data they had already worked with from their own class and another class as potential information about data from a new class. The researcher pushed them further to try to see their data as evidence for making an inference about unknown data.
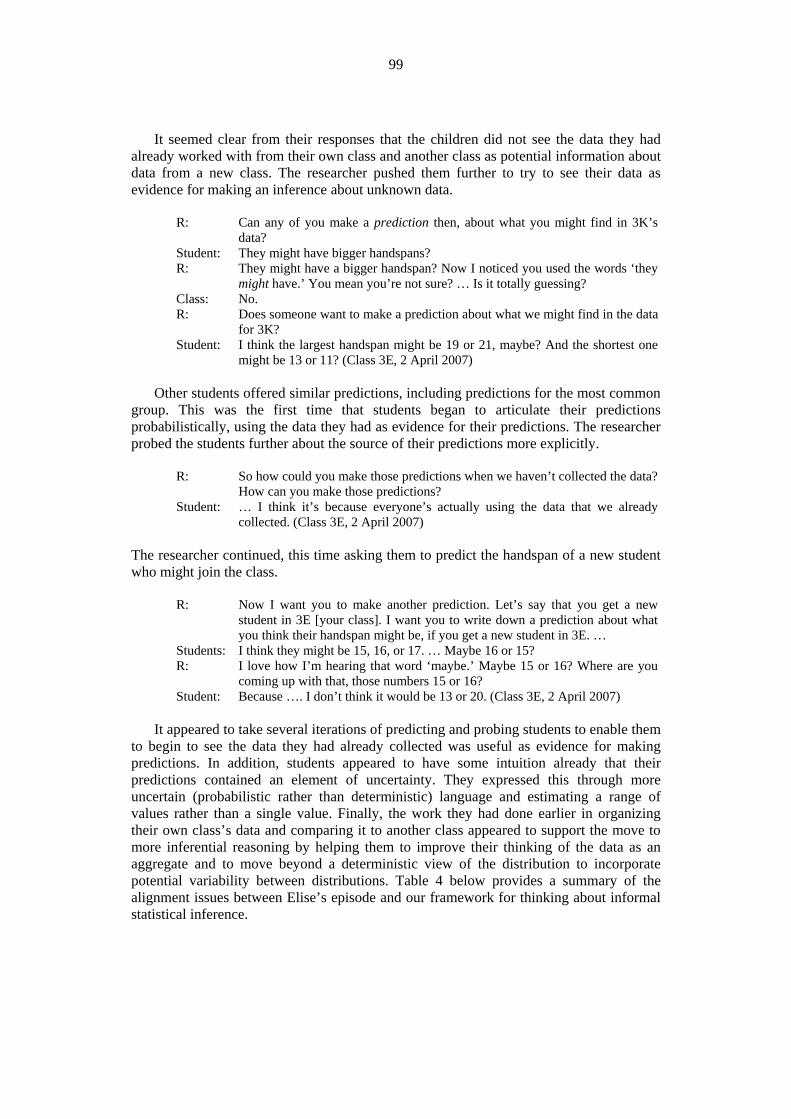
R: Can any of you make a prediction then, about what you might find in 3K’s
data? Student: They might have bigger handspans? R: They might have a bigger handspan? Now I noticed you used the words ‘they
might have.’ You mean you’re not sure? … Is it totally guessing? Class: No. R: Does someone want to make a prediction about what we might find in the data
for 3K? Student: I think the largest handspan might be 19 or 21, maybe? And the shortest one
might be 13 or 11? (Class 3E, 2 April 2007) Other students offered similar predictions, including predictions for the most common
group. This was the first time that students began to articulate their predictions probabilistically, using the data they had as evidence for their predictions. The researcher probed the students further about the source of their predictions more explicitly.
R: So how could you make those predictions when we haven’t collected the data?
How can you make those predictions? Student: … I think it’s because everyone’s actually using the data that we already
collected. (Class 3E, 2 April 2007)
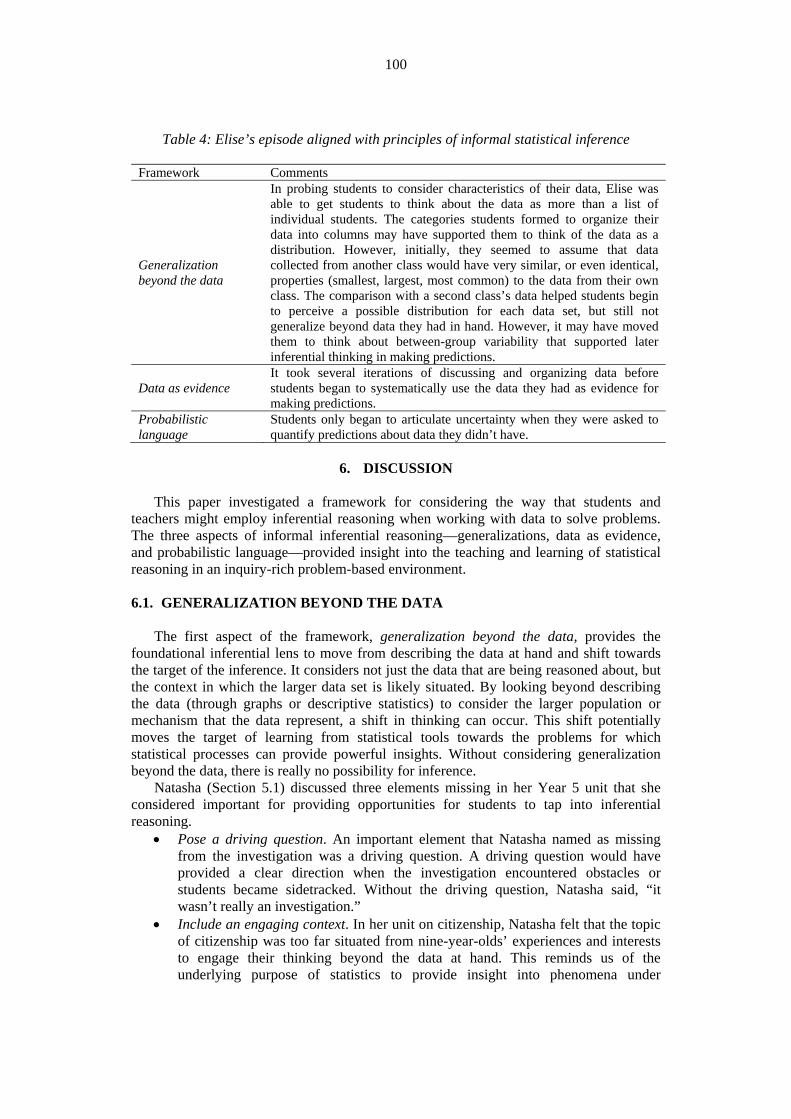
The researcher continued, this time asking them to predict the handspan of a new student who might join the class.
R: Now I want you to make another prediction. Let’s say that you get a new
student in 3E [your class]. I want you to write down a prediction about what you think their handspan might be, if you get a new student in 3E. …
Students: I think they might be 15, 16, or 17. … Maybe 16 or 15? R: I love how I’m hearing that word ‘maybe.’ Maybe 15 or 16? Where are you
coming up with that, those numbers 15 or 16? Student: Because …. I don’t think it would be 13 or 20. (Class 3E, 2 April 2007)
It appeared to take several iterations of predicting and probing students to enable them
to begin to see the data they had already collected was useful as evidence for making predictions. In addition, students appeared to have some intuition already that their predictions contained an element of uncertainty. They expressed this through more uncertain (probabilistic rather than deterministic) language and estimating a range of values rather than a single value. Finally, the work they had done earlier in organizing their own class’s data and comparing it to another class appeared to support the move to more inferential reasoning by helping them to improve their thinking of the data as an aggregate and to move beyond a deterministic view of the distribution to incorporate potential variability between distributions. Table 4 below provides a summary of the alignment issues between Elise’s episode and our framework for thinking about informal statistical inference.
100
Table 4: Elise’s episode aligned with principles of informal statistical inference
Framework Comments
Generalization beyond the data
In probing students to consider characteristics of their data, Elise was able to get students to think about the data as more than a list of individual students. The categories students formed to organize their data into columns may have supported them to think of the data as a distribution. However, initially, they seemed to assume that data collected from another class would have very similar, or even identical, properties (smallest, largest, most common) to the data from their own class. The comparison with a second class’s data helped students begin to perceive a possible distribution for each data set, but still not generalize beyond data they had in hand. However, it may have moved them to think about between-group variability that supported later inferential thinking in making predictions.
Data as evidence It took several iterations of discussing and organizing data before students began to systematically use the data they had as evidence for making predictions.
Probabilistic language
Students only began to articulate uncertainty when they were asked to quantify predictions about data they didn’t have.
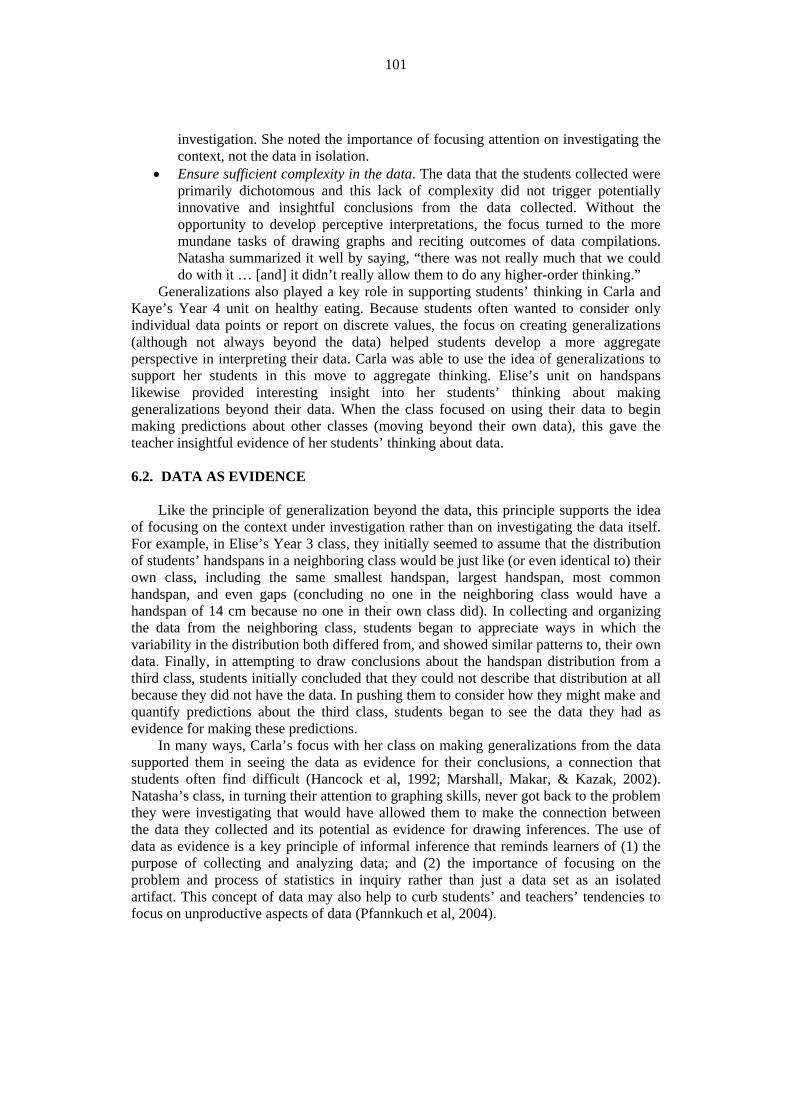
6. DISCUSSION
This paper investigated a framework for considering the way that students and
teachers might employ inferential reasoning when working with data to solve problems. The three aspects of informal inferential reasoning—generalizations, data as evidence, and probabilistic language—provided insight into the teaching and learning of statistical reasoning in an inquiry-rich problem-based environment.
6.1. GENERALIZATION BEYOND THE DATA
The first aspect of the framework, generalization beyond the data, provides the
foundational inferential lens to move from describing the data at hand and shift towards the target of the inference. It considers not just the data that are being reasoned about, but the context in which the larger data set is likely situated. By looking beyond describing the data (through graphs or descriptive statistics) to consider the larger population or mechanism that the data represent, a shift in thinking can occur. This shift potentially moves the target of learning from statistical tools towards the problems for which statistical processes can provide powerful insights. Without considering generalization beyond the data, there is really no possibility for inference.
Natasha (Section 5.1) discussed three elements missing in her Year 5 unit that she considered important for providing opportunities for students to tap into inferential reasoning.
• Pose a driving question. An important element that Natasha named as missing from the investigation was a driving question. A driving question would have provided a clear direction when the investigation encountered obstacles or students became sidetracked. Without the driving question, Natasha said, “it wasn’t really an investigation.”
• Include an engaging context. In her unit on citizenship, Natasha felt that the topic of citizenship was too far situated from nine-year-olds’ experiences and interests to engage their thinking beyond the data at hand. This reminds us of the underlying purpose of statistics to provide insight into phenomena under
101
investigation. She noted the importance of focusing attention on investigating the context, not the data in isolation.
• Ensure sufficient complexity in the data. The data that the students collected were primarily dichotomous and this lack of complexity did not trigger potentially innovative and insightful conclusions from the data collected. Without the opportunity to develop perceptive interpretations, the focus turned to the more mundane tasks of drawing graphs and reciting outcomes of data compilations. Natasha summarized it well by saying, “there was not really much that we could do with it … [and] it didn’t really allow them to do any higher-order thinking.”
Generalizations also played a key role in supporting students’ thinking in Carla and Kaye’s Year 4 unit on healthy eating. Because students often wanted to consider only individual data points or report on discrete values, the focus on creating generalizations (although not always beyond the data) helped students develop a more aggregate perspective in interpreting their data. Carla was able to use the idea of generalizations to support her students in this move to aggregate thinking. Elise’s unit on handspans likewise provided interesting insight into her students’ thinking about making generalizations beyond their data. When the class focused on using their data to begin making predictions about other classes (moving beyond their own data), this gave the teacher insightful evidence of her students’ thinking about data.
6.2. DATA AS EVIDENCE
Like the principle of generalization beyond the data, this principle supports the idea
of focusing on the context under investigation rather than on investigating the data itself. For example, in Elise’s Year 3 class, they initially seemed to assume that the distribution of students’ handspans in a neighboring class would be just like (or even identical to) their own class, including the same smallest handspan, largest handspan, most common handspan, and even gaps (concluding no one in the neighboring class would have a handspan of 14 cm because no one in their own class did). In collecting and organizing the data from the neighboring class, students began to appreciate ways in which the variability in the distribution both differed from, and showed similar patterns to, their own data. Finally, in attempting to draw conclusions about the handspan distribution from a third class, students initially concluded that they could not describe that distribution at all because they did not have the data. In pushing them to consider how they might make and quantify predictions about the third class, students began to see the data they had as evidence for making these predictions.
In many ways, Carla’s focus with her class on making generalizations from the data supported them in seeing the data as evidence for their conclusions, a connection that students often find difficult (Hancock et al, 1992; Marshall, Makar, & Kazak, 2002). Natasha’s class, in turning their attention to graphing skills, never got back to the problem they were investigating that would have allowed them to make the connection between the data they collected and its potential as evidence for drawing inferences. The use of data as evidence is a key principle of informal inference that reminds learners of (1) the purpose of collecting and analyzing data; and (2) the importance of focusing on the problem and process of statistics in inquiry rather than just a data set as an isolated artifact. This concept of data may also help to curb students’ and teachers’ tendencies to focus on unproductive aspects of data (Pfannkuch et al, 2004).
102
6.3. PROBABILISTIC LANGUAGE Finally, the third principle of informal statistical inference is the use of probabilistic
language to articulate uncertainty and level of confidence in making predictions. The use of probabilistic language as a critical aspect of informal inference was most apparent in Elise’s Year 3 class (age 7) when they were using the data they had collected on handspans to make predictions about the distribution of handspans in a neighboring classroom for which they had not collected data. Once they made the connection between using their own data as evidence to make predictions, their language changed to include notions of uncertainty and level of confidence. For example, students incorporated phrases like ‘might be 13 or 11 [cm]’ for the smallest handspan or ‘around 15 to 16 [cm]’ for the most common handspan. Additionally, students broadened their predictions from a single point to a range of values to articulate their uncertainty and also to improve the level of confidence in their prediction. The language of uncertainty may have also allowed students to take the risk in making their predictions without worrying about possibly being ‘wrong.’ When you consider the difficulty that even university students have in moving away from making absolutist-type conclusions that communicate a more deterministic perspective of inferences from data (Abelson, 1995), the ability of these young students to articulate some uncertainty in making their predictions is very encouraging.
7. CONCLUSION
Informal inferential reasoning (IIR) has been highlighted in a number of studies as a
potential pathway for deepening learners’ understanding of statistical processes and outcomes (see Ben-Zvi, 2006; Pfannkuch, 2006; Rubin et al., 2006; and research reported in Ainley & Pratt, 2007 and Pratt & Ainley, 2008). In addition, IIR may provide new opportunities to infuse powerful statistical concepts very early in the school curriculum (Ben-Zvi & Sharett-Amir, 2005) and return the focus of statistics to a tool for insight into understanding problems rather than only a collection of graphs, calculations, and procedures (Sorto, 2006). This paper presents a potential framework for better understanding key principles of informal inferential reasoning. By focusing on inference as the process of making probabilistic generalizations from data, the framework can be used to support teachers in understanding the importance of working with students to think beyond the data at hand, towards using that data as evidence for making predictions about a larger process or population. Also important is to articulate predictions with probabilistic rather than deterministic language in order to communicate both the uncertainty and the level of confidence of a prediction. The principles that underlie the framework further have the potential to both help students make better connections between the data collected and the problem under investigation, and to help deter the overly rigid stance that often accompanies statistical conclusions. The framework is also potentially useful to support the research community in “grappling with the conceptual building blocks for informal inferential reasoning” (Pfannkuch, 2006, p. 1) and to provide directions for further research on specific elements of informal statistical inference.
ACKNOWLEDGEMENTS
The research and writing of this paper was funded by The University of Queensland,
Education Queensland, and the Australian Research Council (LP0776703). The authors wish to thank Jim Hammerman, Cliff Konold, and Arthur Bakker for discussions that
103
were critical to early thinking on this topic, the teachers in the project who were so generous in contributing their time and insights, SRTL colleagues who encouraged, critiqued and discussed the use of the model with us at SRTL-5 and ICOTS-6, and the anonymous reviewers who suggested many improvements to the paper.
REFERENCES
Abelson, R. (1995). Statistics as principled argument. Hillsdale, NJ: Lawrence Erlbaum
Associates. Ainley, J., & Pratt, D. (Eds.) (2007). Reasoning about Informal Inferential Statistical
Reasoning: A collection of current research studies. Proceedings of the Fifth International Research Forum on Statistical Reasoning, Thinking, and Literacy (SRTL-5), University of Warwick, UK.
Bakker, A. (2004). Design research in statistics education: On symbolizing and computer tools. Utrecht, the Netherlands: CD Beta Press.
Bakker, A., & Gravemeijer, K. (2004). Learning to reason about distribution. In D. Ben-Zvi & J. Garfield (Eds.), The challenge of developing statistical literacy, reasoning, and thinking. Dordrecht, the Netherlands: Kluwer Academic Publisher.
Ben-Zvi, D. (2006). Using Tinkerplots to scaffold students’ informal inference and argumentation. In A. Rossman & B. Chance (Eds.), Working Cooperatively in Statistics Education. Proceedings of the Seventh International Conference on Teaching Statistics, Salvador, Brazil. [CDROM]. Voorburg, The Netherlands: International Statistical Institute. [Online: http://www.stat.auckland.ac.nz/~iase/publications/17/2D1_BENZ.pdf ]
Ben-Zvi, D., & Sharett-Amir, Y. (2005). How do primary school students begin to reason about distributions? In K. Makar (Ed.), Reasoning about distributions: A collection of recent research studies. Proceedings of the Fourth International Research Forum for Statistical Reasoning, Thinking and Literacy (SRTL-4), University of Auckland (New Zealand). Brisbane: University of Queensland.
Cobb, P. (1999). Individual and collective mathematical development: The case of statistical data analysis. Mathematical Thinking and Learning, 1(1), 5-43.
Cobb, P., Confrey, J., diSessa, A., Lehrer, R., & Schauble, L. (2003). Design experiments in educational research. Educational Researcher, 32(1), 9-13.
Curriculum Corporation (2006). National Statements of Learning in Mathematics. Melbourne: Author.
Dewey, J. (1910/1997). How we think. Mineola, NY: Dover. Erickson, T. (2006). Using simulation to learn about inference. In A. Rossman & B.
Chance (Eds.), Working Cooperatively in Statistics Education. Proceedings of the Seventh International Conference on Teaching Statistics, Salvador, Brazil. [CDROM]. Voorburg, The Netherlands: International Statistical Institute. [Online: http://www.stat.auckland.ac.nz/~iase/publications/17/7G2_ERIC.pdf]
Finzer, W. (2001). Fathom! (Version 1.16) [Computer Software]. Emeryville, CA: KCP Technologies.
Friel, S. N., Curcio, F. R., & Bright, G. W. (2001). Making sense of graphs: Critical factors influencing comprehension and instructional implications. Journal for Research in Mathematics Education, 32(2), 124-158.
Gardner, H., & Hudson, I. (1999). University students’ ability to apply statistical procedures. Journal of Statistics Education, 7(1). [Online: www.amstat.org/publications/jse/secure/v7n1/gardner.cfm]
104
Gideon, J. (Ed.) (1996). Teach-Stat activities: Statistics investigations for grades 3-6. Parsippany, NJ: Dale Seymour Publications.
Hancock, C., Kaput, J. J., & Goldsmith, L. T. (1992). Authentic inquiry into data: Critical barriers to classroom implementation. Educational Psychologist, 27(3), 337-364.
Konold, C., Higgins, T., Russell, S. J., & Khalil, K. (2003). Data seen through different lenses. Unpublished manuscript.
Konold, C., & Miller, C. (2005). Tinkerplots (v. 1.0). Emeryville, CA: Key Curriculum Press.
Konold, C., & Pollatsek, A. (2002). Data analysis as the search for signals in noisy processes. Journal for Research in Mathematics Education, 33(4), 259-289.
Konold, C., Robinson, A., Khalil, K., Pollatsek, A., Well, A., Wing, R., et al. (2002). Students’ use of modal clumps to summarize data. In B. Phillips (Ed.), Developing a statistically literate society: Proceedings of the Sixth International Conference on Teaching Statistics, Cape Town, South Africa. [CD-ROM]. Voorburg, The Netherlands: International Statistical Institute.
[Online: http://www.stat.auckland.ac.nz/~iase/publications/1/8b2_kono.pdf] Magnani, L. (2001). Abduction, reason, and science: Processes of discovery and
explanation. New York: Kluwer Academic Publisher. Makar, K., & Confrey, J. (2004). Secondary teachers’ reasoning about comparing two
groups. In D. Ben-Zvi & J. Garfield (Eds.), The challenge of developing statistical literacy, reasoning, and thinking (pp. 353-373). Dordrecht, the Netherlands: Kluwer Academic Publisher.
Makar, K., & Confrey, J. (2005). “Variation-talk”: Articulating meaning in statistics. Statistics Education Research Journal, 4(1), 27-54. [Online: http://www.stat.auckland.ac.nz/~iase/serj/SERJ4(1)_Makar_Confrey.pdf]
Makar, K., & Confrey, J. (2007). Moving the context of modeling to the forefront. In W. Blum, P. Galbraith, H-W. Henn, & M. Niss (Eds.), Modelling and applications in mathematics education: The 14th ICMI Study (pp. 485-490). New York: Springer.
Makar, K., & McPhee, D. (in press). Young children’s explorations of average in an inquiry classroom. Paper to be presented at the 32nd annual conference of the Mathematics Education Research Group of Australasia, Massey University, Wellington NZ, 5-9 July 2009.
Marshall, J., Makar, K., & Kazak, S. (2002). Young urban students’ conceptions of data uses, representation, and analysis. In D. S. Mewborn, P. Sztajn, D. Y. White, H. G. Wiegel, R. L. Bryant, & K. Nooney (Eds.), Proceedings of the Twenty-fourth Annual Meeting of the North American Chapter of the International Group for the Psychology of Mathematics Education (PME-NA24), Athens GA (USA), Vol. 3, pp. 1293-1304. Columbus, OH: ERIC Clearinghouse, Mathematics and Environment Education.
Mokros, J., & Russell, S. J. (1995). Children’s concepts of average and representativeness. Journal for Research in Mathematics Education, 26(1), 20-39.
National Council of Teachers of Mathematics. (1989). Curriculum and evaluation standards for school mathematics. Reston, VA: Author.
National Council of Teachers of Mathematics. (2000). Principles and standards for school mathematics. Reston, VA: Author.
Pfannkuch, M. (2006). Informal inferential reasoning. In A. Rossman & B. Chance (Eds.), Working Cooperatively in Statistics Education. Proceedings of the Seventh International Conference on Teaching Statistics, Salvador, Brazil. [CDROM]. Voorburg, The Netherlands: International Statistical Institute. [Online: http://www.stat.auckland.ac.nz/~iase/publications/17/6A2_PFAN.pdf]
105
Pfannkuch, M., Budgett, S., & Parsonage, R. (2004, July). Comparison of data plots: Building a pedagogical framework. Paper presented at the Tenth Meeting of the International Congress on Mathematics Education, Copenhagen, Denmark.
Pratt, D., & Ainley, J. (Eds.) (2008). Introducing the special issue on informal inference. Statistics Education Research Journal, 7(2), 3-4. [Online: http://www.stat.auckland.ac.nz/~iase/serj/SERJ7(2)_Pratt_Ainley.pdf]
Queensland Studies Authority (2006). Essential learnings and standards (Year 3, 5, 7, and 9. Spring Hill QLD: Author.
Reichardt, C. S., & Gollob, H. F. (1997). When confidence intervals should be used instead of statistical significance tests, and vice versa. In L. L. Harlow. S. A. Mulaik, & J. H. Steiger (Eds.), What if there were no significance tests? (Vol. I, pp. 259-284). Mahwah, NJ: Lawrence Erlbaum Associates.
Rossman, A. (2008). Reasoning about informal statistical inference: One statistician’s view. Statistics Education Research Journal, 7(2), 5-19. [Online: http://www.stat.auckland.ac.nz/~iase/serj/SERJ7(2)_Rossman.pdf]
Rubin, A., Hammerman, J., & Konold, C. (2006). Exploring informal inference with interactive visualization software. In A. Rossman & B. Chance (Eds.), Working Cooperatively in Statistics Education. Proceedings of the Seventh International Conference on Teaching Statistics, Salvador, Brazil. [CDROM]. Voorburg, The Netherlands: International Statistical Institute. [Online: http://www.stat.auckland.ac.nz/~iase/publications/17/2D3_RUBI.pdf]
Sorto, M. A. (2006). Identifying content knowledge for teaching statistics. In A. Rossman & B. Chance (Eds.), Working Cooperatively in Statistics Education. Proceedings of the Seventh International Conference on Teaching Statistics, Salvador, Brazil. [CDROM]. Voorburg, The Netherlands: International Statistical Institute. [Online: http://www.stat.auckland.ac.nz/~iase/publications/17/C130.pdf]
Tukey, J. (1977). Exploratory data analysis. Reading, MA: Addison-Wesley. Wild, C. J., & Pfannkuch, M. (1999). Statistical thinking in empirical enquiry.
International Statistical Review, 67(3), 223-265. Zieffler, A., Garfield, J., delMas, R., & Reading, C. (2008). A framework to support
research on informal inferential reasoning. Statistics Education Research Journal, 7(2), 40-58. [Online: http://www.stat.auckland.ac.nz/~iase/serj/SERJ7(2)_Zieffler.pdf]
KATIE MAKAR School of Education
The University of Queensland, QLD 4072 Australia