a free press is bad news for corruption - · pdf filea free press is bad news for corruption...
TRANSCRIPT
Journal of Public Economics 87 (2003) 1801–1824www.elsevier.com/ locate/econbase
A free press is bad news for corruptiona b ,*Aymo Brunetti , Beatrice Weder
aState Secretariat for Economic Affairs, Bern, Basel, SwitzerlandbUniversity of Mainz, Mainz, Germany
Received 2 June 1999; received in revised form 13 June 2001; accepted 25 June 2001
Abstract
This paper tests the proposition that a free press may be a powerful control on corruption.We find evidence of a significant relationship between more press freedom and lesscorruption in a large cross-section of countries. This result is robust to specification andsample and the relationship is not sensitive to the choice of a particular measure ofcorruption or of press freedom. Furthermore we present evidence which suggests that thedirection of causation runs from higher press freedom to lower corruption. 2002 Elsevier B.V. All rights reserved.
Keywords: Corruption; Press freedom
JEL classification: O1; O57; H11; D73
1. Introduction
Freedom of speech and a free press are generally considered important humanrights and powerful controls against government malfeasance. An independentpress is probably one of the most effective institutions to uncover trespassing bygovernment officials. The reason is that any independent journalist has a strongincentive to investigate and uncover stories on wrongdoing. Countries with a freepress should, therefore, ceteris paribus, have less corruption than countries where
*Corresponding author. Tel.:149-613-1392-0144; fax:149-613-1392-5053.E-mail address: [email protected] (B. Weder).
0047-2727/02/$ – see front matter 2002 Elsevier B.V. All rights reserved.PI I : S0047-2727( 01 )00186-4
1802 A. Brunetti, B. Weder / Journal of Public Economics 87 (2003) 1801–1824
the press is controlled and censored. This paper presents an empirical evaluation ofthis proposition.
The paper is motivated by recent research which has shown that highercorruption is detrimental to economic performance and which has lead to a general
1acceptance that corruption is one of the central issues in development policy. Thishas given rise to the question of how differences in corruption across countries canbe explained and a few recent studies started to explore possible determinants ofcorruption in small country samples. This paper argues that of the probablecontrols on bureaucratic corruption a free press is likely to be among the mosteffective ones — a proposition that is supported in an empirical analysis of a largecross-section of countries as well as by evidence from time series.
The paper is organized as follows. Section 2 reviews possible determinants ofcorruption discussed in the literature and explains how press freedom could affectcorruption. Section 3 describes the main data, the specifications estimated and theeconometric approach. Section 4 shows cross-section empirical results for a rangeof specifications. Section 5 tests the sensitivity of results to alternative measures ofcorruption and press freedom. Section 6 presents some panel data evidence andSection 7 concludes.
2. Determinants of corruption and the role of press freedom
In theory the incidence of corruption can be explained by three types ofdeterminants, which also reflect the different approaches in the literature. The firstfocuses on the role of internal mechanisms and incentives within the bureaucracyin controlling corruption. A second branch stresses the role of external mecha-nisms in checking corruption, such as an independent judiciary or watch body.Finally, the third branch argues that corruption can be explained by more indirectfactors, such as culture or the level of rents that can be appropriated. In thiscategorization press freedom is an external control mechanism on corruption.Before discussing the role of press freedom we briefly summarize the potentialother determinants of corruption in each of the three categories. This motivates ourchoice of control variables in the specifications used in the empirical analysis.
1The costs of corruption have been a topic of academic debate for a long time (see, e.g.,Rose-Ackerman, 1975). Case studies such as Klitgaard (1988) and De Soto (1989) helped to popularizethe notion that corruption is a major obstacle to growth in developing countries. This notion has beenconfirmed in a series of recent empirical cross-country studies. Mauro (1995) showed that corruptionnegatively affects rates of investment. Knack and Keefer (1995) and Brunetti et al. (1998) find thatcorrupt institutions lower growth through lower accumulation of resources as well as misallocation ofresources. Mauro (1996) shows that corruption distorts the allocation of public expenditures andJohnson et al. (1998) find that countries with more corruption have a larger informal sector. Forsurveys of research on the economic effects of corruption see, e.g., Bardhan (1997) or Tanzi (1994).
A. Brunetti, B. Weder / Journal of Public Economics 87 (2003) 1801–1824 1803
2.1. Determinants of corruption
Internal controls include all systems and incentives that control corruptionwithin the bureaucracy. Corruption tends to be high in an administrativeenvironment where there is a lack of explicit standards of performance which arestrictly enforced and in an environment where the individual bureaucrat is poorlysupervised. Rauch and Evans (2000) argue that an important aspect of internalcontrol is whether the recruitment and promotion process in the bureaucracy isbased on meritocracy or on nepotism. Less nepotism tends to reduce theprobability that internal control is eliminated by collusion among bureaucrats.Rauch and Evans (2000) test this point by constructing an index of meritocraticrecruitment and promotion and showing that it is significantly associated withcorruption in a sample of less developed countries. Van Rijckeghem and Weder(2001) argue that a low level of public sector wages compared to wages in theprivate sector increases the incentives for bureaucrats to accept bribes. In anempirical test of this hypothesis they find a negative relationship between the levelof public sector wages and corruption for a sample of less developed countries.
External control of corruption is exercised by individuals or organizationsoutside the administration. In a working system of checks and balances this ismainly performed by the judiciary power. A court system where corruptbureaucrats can be easily and effectively sued sharply reduces the potentialrewards of corruption. In countries with less-developed checks and balances otherparts of the society can play the role of external controller. Rahman (1986)describes such a mechanism in the case of Singapore where citizens committeeswere established which enable citizens to vent their grievances and seek redress.An empirical analysis of the effects of external control on corruption is difficultsince there are few convincing empirical measures for cross-country differences ofthe power of external control mechanisms. Empirical studies such as Ades and DiTella (1999) therefore use rather indirect measures such as the general level ofdevelopment and education to capture the ability of the civil society to controlgovernment performance. We argue that a free press is another potentiallypowerful external control on corruption.
Finally, indirect determinants of corruption identified in the literature includeculture and the level of distortions in the economy. Lee (1986) for instancesuggests that a culture of bureaucratic elitism may lead to a disassociation of civilservants with the rest of society and breed corruption. Tanzi (1994) argues that theabsence of a culture of arms-length relationships may lead to corruption becomingsystemic. Shleifer and Vishny (1993) suggest that more ethnically diversecountries are prone to particularly harmful forms of corruption. In an empiricalstudy Mauro (1995) indeed finds evidence of a positive relationship betweenethnolinguistic fractionalization and corruption. A second indirect determinant ofcorruption are distortive policies. Tanzi (1994) for example suggests that govern-ment interventions in free markets create rents and lead to a sharp rise in
1804 A. Brunetti, B. Weder / Journal of Public Economics 87 (2003) 1801–1824
corruption payments. Kaufman (1997) tests the relationship between an indicatorof regulatory discretion and corruption and finds a strong correlation in a smallsample of developing countries. Ades and Di Tella (1999) generalize thisargument by pointing out that monopolistic powers of bureaucrats are an importantprecondition for the occurrence of corruption. They also provide empirical cross-country evidence that more competition is associated with less corruption.
2.2. Press freedom and corruption
This paper focuses on a particular mechanism of external control, namely, pressfreedom. A free press is potentially a highly effective mechanism of externalcontrol on corruption because it works not only against extortive but also againstcollusive corruption.
Extortive corruption means that the government official has the discretionarypower to refuse or delay a service (say a business license or the approval of a newconstruction project) in order to extract a rent from the private agent in the form ofa bribe. Hindricks et al. (1999) describe extortion in a model analyzingmechanisms against tax evasion and they argue that this is a particularly seriousform of corruption, Klitgaard (1988) provides drastic examples in his case study ofthe corruption structures in the Philippine tax system. He describes how taxpayerswere extorted simply to receive the treatment legally due to them. Differentstrategies were applied by dishonest bureaucrats to extort taxpayers. For example,the tax inspector would assess an unrealistically high payment on the taxpayer. Inthe Philippine legal framework it was very costly and time-consuming to appealand in addition the taxpayer in many cases was not sure, what the correct duereally was. The tax assessor could take advantage of this situation by extorting apayment in exchange for the correct assessment.
Faced with such blackmailing the taxpayer has the option of either paying thebribe or complaining to a higher official or the judiciary, i.e., use channels ofinternal or external control. By fighting extortion the private agents help inlimiting corruption. This is rather likely to occur as the private agent has a strongincentive to do something against this kind of corruption. However, if the costs ofappealing are very high which means that the formal mechanisms of internal andexternal control are not working well, the taxpayer might in fact be better off bysurrendering to the extortion. A free and active press constitutes an additionalchannel of external control which can substantially reduce the costs of fightingextortive corruption. A firm can reveal (or credibly threaten to reveal) thebureaucrat’s behavior to a journalist and the (potential) media reports will raise thecosts for the bureaucrat as the probability of being detected and punished isincreased. In particular it will be much harder for an administration to keep upineffective internal control mechanisms such as low penalties or ineffectiveexternal control mechanisms such as a weak judiciary if this fact is likely to be
A. Brunetti, B. Weder / Journal of Public Economics 87 (2003) 1801–1824 1805
regularly reported in the media. For extortive corruption the press, therefore,reinforces the reaction possibilities of the private sector by providing a platformfor voicing complaints.
The second form,collusive corruption has been rather extensively treated in thetheoretical literature on tax evasion (see, e.g., Besley and McLaren, 1993 orFlatters and MacLeod, 1995). With collusive corruption the incentives aresomewhat different than with extortion. The official again has some discretionarypower in her application of rules. Take for instance a customs inspector who hasinformation about the value of a firm’s imports. For a ‘fee’ she could make a dealwith the firm’s management to reduce the overall tariff liability of the company.This is unlikely to be detected by other officials — unless there are very goodinternal control systems in place — and the firm also has no incentive to report thecorruption. Again, Klitgaard (1988) describes an example of this form ofcorruption in the Philippine tax system; there this kind of corruption is calledarreglo (arrangement). In a typical case the taxpayer would submit a return withunderstated income or too many deductions. If the tax collector discovered these‘errors’, arreglo frequently occurred. The taxpayer would for example pay half ofthe correct taxes and of the other half two-thirds would be paid as a bribe to thetax collector whereas the taxpayer could keep the rest.
In this form of corruption the private agent cooperates in the corrupt act andalways pays the bribe. Obviously, this is much more difficult to fight than extortivecorruption as the arrangement is beneficial for both, the bureaucrat and the firmand they will do everything to hide it. In contrast to extortive corruption theprivate agent can, therefore, not be trusted to help fighting this illegal action. Afree press is probably the most effective institution to control collusive corruption.Independent journalists have incentives to actively investigateany wrongdoing.Other outside bodies, such as the judiciary or even watchdog bodies such asanti-corruption commissions may be less effective, unless their internal incentivestructures are closely aligned with the goal of discovering and prosecutingcorruption. There is a substantial danger that internal control agencies will beincluded in the arrangements and get a share of the pie. It may be much harder forthe architects of corrupt arrangements to apply the same strategy to journalists. Ifthe press is free and competitive it might be possible to buy some journalists butthis only increases the incentives for other journalists to detect such arrangementsand publicize this. The more involved a corrupt arrangement the more fame aninvestigative journalists can earn by uncovering it. As long as there is free entry injournalism and in publishing — which is one of the defining features of a freepress — it will be difficult to form an effective cartel which encompasses alljournalists.
Therefore, in theory press freedom can help to fight extortive corruption andmay be a particularly effective institution to fight collusive corruption where clientand bureaucrat have a mutual interest in the corrupt act.
1806 A. Brunetti, B. Weder / Journal of Public Economics 87 (2003) 1801–1824
3. Data and empirical strategy
This section presents the data on press freedom and corruption, derives thespecifications tested in the empirical analysis, and explains the econometric
2methodology used.
3.1. Measure of press freedom
Our mainmeasure of press freedom is assembled by Freedom House, a thinktank that is known for having published widely used indexes for political rightsand civil liberties for the last 25 years. Since 1996 Freedom House in addition hascompiled expanded indices of press freedom for 145 countries based on expertsopinions, findings of international human rights groups and press organizations,analysis of publications and news services and reports of governments on relatedsubjects. The motivation for collecting this kind of information derives fromArticle 19 of the Universal Declaration of Human Rights, which postulates that‘‘everyone should have the right to freedom of opinion and expression’’. The ideais to gain a comprehensive assessment of press freedom by not focusingexclusively on actual incidents of censorship like for instance arrests or assassina-tions of journalists but on the overall structure of the news delivery system.Therefore, several dimensions of potential violations of press freedom are
3evaluated.
1. Laws and regulations that influence media content reflects ‘‘our judgment ofthe degree of actual impact on press freedom ( . . . ), not simply the ceremonialcommitment to press freedom’’. For instance, ‘‘if private broadcast media areowned by government with no dissent allowed, the rating will be 15 (i.e., theworst score)’’ but if ‘‘a government that owns all broadcast media may permitwidely pluralist ideas, even active dissent from government positions’’ then therating will be more favorable.
2. Political influence over media content captures ‘‘political pressure on thecontent of both privately owned and government media and takes into accountthe day-to-day conditions in which journalist work’’. It also includes ‘‘threatsfrom organized crime’’ which may lead to self-censorship.
3. Economic influence over media content: reflects ‘‘competitive pressures in theprivate sector that distort reportage as well as economic favoritism or reprisalsby government for unwanted press coverage’’.
4. Repressive actions: measures actual acts which constitute violations of pressfreedom. For instance, arrests, murders or suspensions of journalists, physicalviolence against journalists or facilities, self-censorship, arrests, harassment,expulsion, etc.
2Data sources, descriptive statistics and correlations are in Appendix A.3Source of quotes: Freedom House (1997).
A. Brunetti, B. Weder / Journal of Public Economics 87 (2003) 1801–1824 1807
All four categories are rated for both, the freedom of print media and thefreedom of broadcast media. In the first three categories countries are rated on ascale from 0 to 15 (0 meaning absence of violation of press freedom and 15meaning the highest degree of such violation). The fourth category is rated from 0to 5. The overall measure of press freedom is the sum of these eight subcompo-nents, and ranges from 0 (equals total freedom of the press) to 100 (equals thehighest degree of violation of press freedom). For instance in 1997 Norway with arating of 5 was the country with the freest press. Most OECD countries are in thequintile with the best ratings. At the bottom end we find North Korea, Iraq, andBurma with a rating of 100 each. Many of the countries of the Former SovietUnion fall in the fourth quintile together with a few of the East Asian tigers.Overall the world wide picture is one of rather high degrees of violations of press
4freedom; the world wide average of the index is 46 points.
3.2. Measures of corruption
Measuring corruption is obviously tricky because of it’s illegal nature. It isfurther complicated by a wide range of definitions of a corrupt act. And finally,there seem to be many different expressions of corruption, which range fromroutine ‘tips’ and ‘speed money’ to complicated schemes of favors betweenbusinessmen and civil servants.
Data on corruption levels across countries are available from various sources,which are all based on surveys of experts or entrepreneurs. Our main measure ofcorruption is an indicator collected by the International Country Risk Guide(ICRG). This firm produces annual ratings of corruption levels by using surveysamong country experts. The indicator ranges from 0 to 6. A low score means that‘‘high government officials are likely to demand special payments’’ and ‘‘illegalpayments are generally expected throughout lower levels’’ in the form of ‘‘bribesconnected with import and export licenses, exchange controls, tax assessment,
5policy protection, or loans’’. Of all such country risk services ICRG covers by far
4Restrictions of press freedom come in many guises. In many countries, the press is regulatedthrough an array of laws which claim to protect national security, personal privacy or even ‘the truth’.To take a few examples: In 13 Latin American countries journalists can be penalized for insulting orviolating the privacy of officials. Exposing illegal actions by a government official may thus be chargedagainst the journalist rather than the official. In Uganda, a bill could impose 5 years of imprisonmentand large fines for a journalist publishing (unspecified) ‘false’ or ‘aggravating’ information. InColombia a regulatory commission has the authority to take television news programs off the air toprotect the nations ‘honor’. In Bolivia and Botswana laws are planned that impose ethical standards forthe press to regulate alleged ‘abuse’. In Malawi a law denies journalists the right to protect their newssources. The press in Gambia is hit with high start-up fees and extreme penalties for libel areconsidered in Brazil and Congo. In 1996, 46 journalist are known to have been murdered on the job and372 arrested. See Freedom House (1997) for a more detailed discussion.
5See Knack and Keefer (1995).
1808 A. Brunetti, B. Weder / Journal of Public Economics 87 (2003) 1801–1824
the largest number of countries. We use the average for 1994–1998 which isavailable for 128 countries. In addition we use corruption measures from threealternative sources (World Bank, Institute for Management Development andTransparency International) which are discussed below.
3.3. Specification
As noted above, the theoretical and empirical literature have identified a numberof determinants of corruption. On the one hand there are direct internal andexternal control mechanisms. On the other hand there are more indirect deter-minants such as distortions and sociological determinants of higher corruption.This suggests that estimates of corruption should at least include proxies for thedirect control mechanisms which leads to our following preferred specification:
CORR 5b 1b PRESS1b BUREAU 1b RULE 1´ . (1)i 0 1 i 2 i 3 i i
We are mainly interested in the sign and the significance ofb which we expect1
to be significantly negative since a higher value of CORR means less corruptionand a higher value of PRESS means less press freedom. The indicator of internalcontrol BUREAU is a measure of the quality of the bureaucracy. The variable isprovided annually for a large number of countries by ICRG based on evaluations
6from country experts. It indicates the degree of ‘‘autonomy [of the bureaucracy]from political pressure’’ the ‘‘strength and expertise to govern without drasticchanges in policy or interruptions in government services’’ as well as the existenceof ‘‘established mechanisms for recruiting and training’’. A higher value of thisindicator means better quality of the bureaucracy so that we expectb to be2
positive. RULE is our measure of external control and is also provided by ICRG.The indicator marks the presence of ‘‘sound political institutions, a strong courtsystem, and provisions for an orderly succession of power’’ and reflects the degreeto which ‘‘citizens of a country are willing to accept the established institutions tomake and implement laws and adjudicate disputes’’. This broad measure coversnot only external control through checks and balances but also the degree to whichcitizens exercise control power. The higher this indicator the better established isthe rule of law so that we expectb to be positive. These variables are available3
for a large number of countries, which allows us to estimate this specification evenfor corruption measures where we have relatively small country samples.
6Sources and precise description of data for control variables are in Appendix A. To reduceendogeneity problems the timing of independent variables is chosen such that they are long averagesfor a period (10–15 years) previous to the corruption measure.
A. Brunetti, B. Weder / Journal of Public Economics 87 (2003) 1801–1824 1809
In addition, we test a second, broad specification which includes a number ofthe other potentially relevant determinants of corruption discussed above:
CORR5b 1b PRESS1b BUREAU 1b RULE 1b GDPi 0 1 i 2 i 3 i 4 i (2)1b HUMCAP1b TRADE 1b BLACK 1b ETHNIC 1´ .5 i 6 i 7 i 8 i i
This specification includes two more proxies for external control, two proxiesfor distortions and one proxy for cultural factors. GDP and HUMCAP measure thelevel of per capita GDP in 1995 (calculated at purchasing power parity), and theeducational attainment. Both of these variables proxy for external controls sincethe ability of civil society to judge government performance and act as an externalcontrol on corruption in the administration tends to increase with the level ofdevelopment (see, e.g., Ades and Di Tella, 1999). We therefore expectb andb4 5
to be positive. TRADE and BLACK are proxies for distortions and restrictions ofcompetition in an economy. TRADE measures the exposure of an economy toforeign trade and is defined as the sum of exports and imports as a percentage ofGDP. For instance Ades and Di Tella (1999) argue that open countries are subjectto larger competitive pressure that in turn reduces monopolistic rents and thuscorruption.b is therefore expected to be positive. BLACK measures the black6
market premium on foreign exchange and is a broad indicator of the degree ofgovernment-created distortions in an economy and we expectb to be negative.7
Finally ETHNIC measures the degree of ethnolinguistic diversity which is a proxyfor the cultural background of a country. Mauro (1995) has found a positivecorrelation between this variable and corruption and we expectb to be negative.8
This second specification captures almost all relevant variables discussed inSection 2.
3.4. Econometric methodology
The dependent variable is the corruption measure from ICRG. We use a shortaverage of this index (1994–1998) in order to match the timing with our mainmeasure of press freedom while avoiding shocks which would be particular to 1year (e.g., a financial crisis) and which might affect corruption ratings that arebased on subjective evaluations. The dependent variable is therefore a continuousvariable and this allows estimates using ordinary least squares. An alternativestrategy would be to use the last available value of corruption as dependentvariable. In this case the dependent variable can only take on integer values andthe ordered probit model is the appropriate method. In the econometric analysis wealso show estimates for an ordered probit model for corruption values in a singleyear.
1810 A. Brunetti, B. Weder / Journal of Public Economics 87 (2003) 1801–1824
We conduct tests to determine whether the relationship between press freedomand corruption is driven by outliers or by the difference between developed andless developed countries. We test extensively for robustness to measurement ofboth the corruption and the press freedom variables. White’s test for heteroskedas-ticity in the residuals of the basic specification rejects the null of no heteroskedas-ticity, thus all standard errors of coefficients are calculated using White (1980)correction.
A potential criticism is that press freedom may be endogenous since corruptregimes may tend to limit press freedom. In theory this effect should only berelevant where corruption is systemic, i.e., where all journalists participate in therevenues from corruption or where there is a political machine and extremerepression. In all other cases the causality is likely to run from press freedom tocorruption rather than the other way around. The reason is, that journalists haveincentives to uncover corruption and it is unlikely that all journalists can bebrought to cooperate in corrupt arrangements. Such a cartel would be difficult tosustain in an environment with many independent journalists and high reputationalprofits from uncovering corrupt arrangements.
On the empirical level we address this issue of endogeneity in three ways. Firstwe exclude the countries with highly repressive regimes from the sample. Secondwe use several instruments for press freedom and finally we exploit the time seriesdimension of alternative data set on press freedom. It should be said from thebeginning that we cannot fully resolve the issue of causality since we have onlyimperfect instruments and little time series variation to work with.
4. The cross-section results
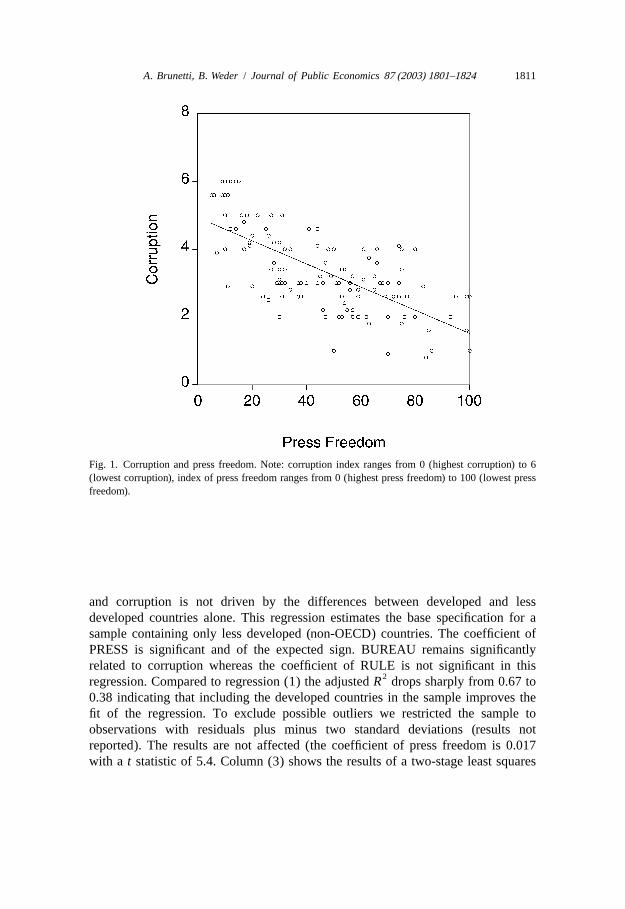
Fig. 1 shows a scatterplot that illustrates the close relationship betweencorruption and press freedom. Recall that the negative relationship observed in thefigure implies that less corruption is associated with more press freedom.Inspection of the raw data suggests that there exist no important outliers.
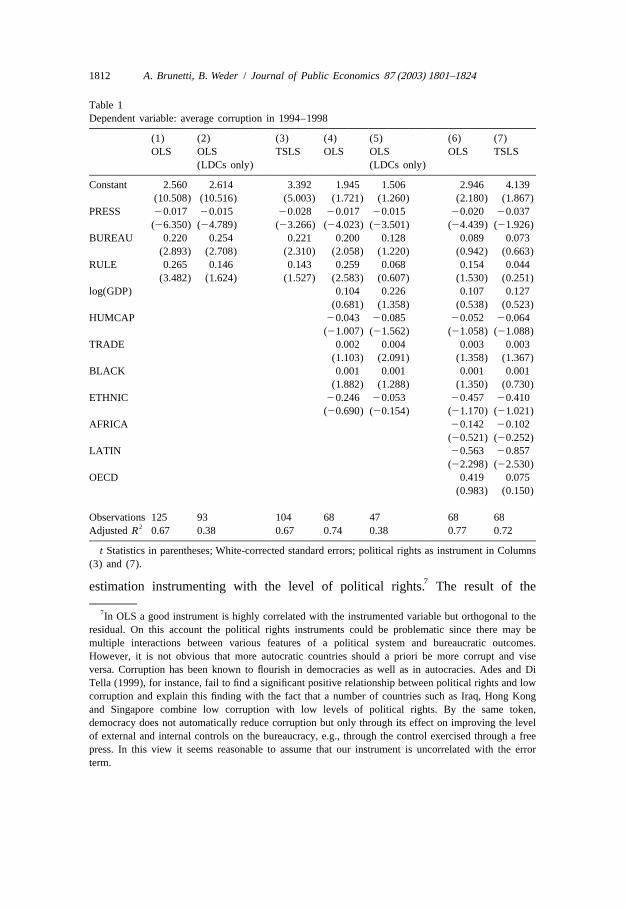
Table 1 presents the cross-section results. The dependent variable is the averagecorruption level from 1994 to 1998. Column (1) shows the result for the basespecification which includes 125 countries. The coefficient of the indicator of pressfreedom has the expected negative sign and is significant at conventionalconfidence levels. The coefficients of both control variables have a positive signand are significant at the 1% level. This indicates that, as expected, corruption islower in countries with a well-working bureaucracy and in countries with awell-established rule of law. The base specification explains two-thirds of thevariation in the corruption levels between countries.
Column (2) documents that the significant relationship between press freedom
A. Brunetti, B. Weder / Journal of Public Economics 87 (2003) 1801–1824 1811
Fig. 1. Corruption and press freedom. Note: corruption index ranges from 0 (highest corruption) to 6(lowest corruption), index of press freedom ranges from 0 (highest press freedom) to 100 (lowest pressfreedom).
and corruption is not driven by the differences between developed and lessdeveloped countries alone. This regression estimates the base specification for asample containing only less developed (non-OECD) countries. The coefficient ofPRESS is significant and of the expected sign. BUREAU remains significantlyrelated to corruption whereas the coefficient of RULE is not significant in this
2regression. Compared to regression (1) the adjustedR drops sharply from 0.67 to0.38 indicating that including the developed countries in the sample improves thefit of the regression. To exclude possible outliers we restricted the sample toobservations with residuals plus minus two standard deviations (results notreported). The results are not affected (the coefficient of press freedom is 0.017with a t statistic of 5.4. Column (3) shows the results of a two-stage least squares
1812 A. Brunetti, B. Weder / Journal of Public Economics 87 (2003) 1801–1824
Table 1Dependent variable: average corruption in 1994–1998
(1) (2) (3) (4) (5) (6) (7)OLS OLS TSLS OLS OLS OLS TSLS
(LDCs only) (LDCs only)
Constant 2.560 2.614 3.392 1.945 1.506 2.946 4.139(10.508) (10.516) (5.003) (1.721) (1.260) (2.180) (1.867)
PRESS 20.017 20.015 20.028 20.017 20.015 20.020 20.037(26.350) (24.789) (23.266) (24.023) (23.501) (24.439) (21.926)
BUREAU 0.220 0.254 0.221 0.200 0.128 0.089 0.073(2.893) (2.708) (2.310) (2.058) (1.220) (0.942) (0.663)
RULE 0.265 0.146 0.143 0.259 0.068 0.154 0.044(3.482) (1.624) (1.527) (2.583) (0.607) (1.530) (0.251)
log(GDP) 0.104 0.226 0.107 0.127(0.681) (1.358) (0.538) (0.523)
HUMCAP 20.043 20.085 20.052 20.064(21.007) (21.562) (21.058) (21.088)
TRADE 0.002 0.004 0.003 0.003(1.103) (2.091) (1.358) (1.367)
BLACK 0.001 0.001 0.001 0.001(1.882) (1.288) (1.350) (0.730)
ETHNIC 20.246 20.053 20.457 20.410(20.690) (20.154) (21.170) (21.021)
AFRICA 20.142 20.102(20.521) (20.252)
LATIN 20.563 20.857(22.298) (22.530)
OECD 0.419 0.075(0.983) (0.150)
Observations 125 93 104 68 47 68 682AdjustedR 0.67 0.38 0.67 0.74 0.38 0.77 0.72
t Statistics in parentheses; White-corrected standard errors; political rights as instrument in Columns(3) and (7).
7estimation instrumenting with the level of political rights. The result of the
7In OLS a good instrument is highly correlated with the instrumented variable but orthogonal to theresidual. On this account the political rights instruments could be problematic since there may bemultiple interactions between various features of a political system and bureaucratic outcomes.However, it is not obvious that more autocratic countries should a priori be more corrupt and viseversa. Corruption has been known to flourish in democracies as well as in autocracies. Ades and DiTella (1999), for instance, fail to find a significant positive relationship between political rights and lowcorruption and explain this finding with the fact that a number of countries such as Iraq, Hong Kongand Singapore combine low corruption with low levels of political rights. By the same token,democracy does not automatically reduce corruption but only through its effect on improving the levelof external and internal controls on the bureaucracy, e.g., through the control exercised through a freepress. In this view it seems reasonable to assume that our instrument is uncorrelated with the errorterm.
A. Brunetti, B. Weder / Journal of Public Economics 87 (2003) 1801–1824 1813
estimates remain largely unchanged compared with the previous estimates the size8of the coefficient on press freedom is larger.
Column (4) includes other variables that could impact on corruption. Thecoefficient PRESS is again significant at conventional confidence levels and thecoefficients of BUREAU and RULE remain positive and significant. The coeffi-cient of the logarithm of GDP per capita has the expected positive sign whereasthe measure of human capital is negatively related with corruption. Bothcoefficients are however, insignificant. The coefficients of the two variables thatproxy for distortions in the economy are both insignificant. Whereas TRADE hasthe expected positive sign, the positive coefficient of BLACK is unexpected.Finally the proxy for the degree of cultural fractionalization ETHNIC has theexpected negative sign but is insignificant. Adding these explanatory variables
2only marginally improves the fit of the regression (the adjustedR increases from0.67 to 0.74) but comes at the cost of reducing the sample size significantly.Column (5) reduces the sample to the less developed countries and shows that therelationship between press freedom and corruption holds also for within this set ofcountries in the extended specification.
Column (6) show the results of another sample test; it checks whether there aredifferences among continents that are not captured in the explanatory variablesused in the broad specification. The result on press freedom is unchanged and onlythe Latin American continent dummy is significant. Finally, Column (7) shows thetwo-stage least-square estimates for this specification. Again the results are largelyunchanged, although the significance of the indicator of press freedom dropssomewhat.
Given that all other control variables are insignificant, and that sample size is aconsideration in the following sections, we will estimate the base specification inthe remainder of this paper.
Overall the results presented in Table 1 indicate that there is a close relationshipbetween press freedom and corruption which is robust to specification and samplevariation. Furthermore, the effect of press freedom on corruption is sizable. Theabsolute value of the coefficient varies between 0.017 and 0.028 for the fullsample of countries. This means that an improvement of 46 points in the pressfreedom indicator (that is a move of the average country to full press freedom)
9could reduce corruption by about 1 point. With the mean corruption at 3.4 (on ascale from 0 (highest) to 6 (lowest corruption)) this implies that a complete moveto press freedom would lead to a dramatic reduction of corruption in the average
8Tests for nonlinear relationships did not produce better fits of the data.9Alternatively, a improvement of press freedom by one standard deviation decreases corruption by
about 0.5 points.
1814 A. Brunetti, B. Weder / Journal of Public Economics 87 (2003) 1801–1824
country. This does not include any indirect effects that higher press freedom mighthave through improving other bureaucratic controls and other external controls.
We conducted additional tests of sensitivity to specification not reported in thetables. We included in the base specification one by one, inflation, governmentconsumption, a different measure of openness (provided by Sachs and Warner,1995) and a different measure of human capital (secondary school enrollment) asfurther determinants of corruption. However, these variables were insignificant and
10the result on press freedom was unchanged. We substituted BUREAU with moredirect measures of internal controls, namely an index of meritocracy and ofrelative salaries between civil servants and private sector employees (bothprovided by Rauch and Evans (2000)). Both indicators are only available for 35less developed countries and the results are similar to those obtained in Table 1,Column (2), for the sample of developing countries.
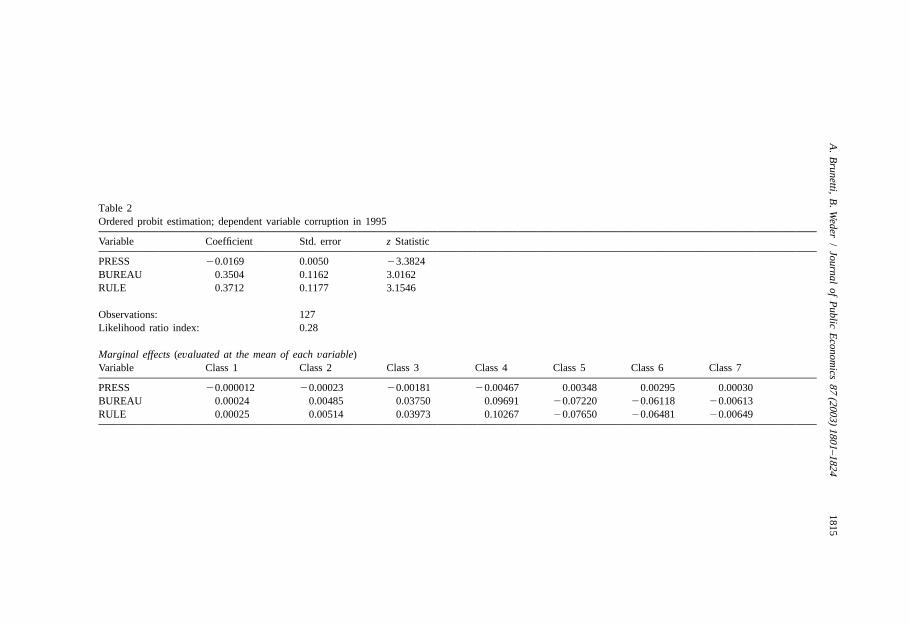
We now turn to an alternative estimation model. The corruption measure used inTable 1 is a continuous variable by virtue of averaging 4 years of an orderedvariable that can only take on discrete values between 0 and 6. However, onecould argue that averaging does not really change the discrete nature of themeasure which could be interpreted simply as an ordering. This interpretationwould be pertinent if the indicators were based on country rankings rather thannumerical ratings, but most expert surveys provide explicit numerical ratings withthe understanding that they are linear. Supposedly it is for this reason that theliterature on determinants of corruption has so far treated the corruption indicatorsas a continuous variable and has used OLS estimates. However, under theinterpretation of an ordered variable, OLS would not be appropriate since thismethod treats the difference from one value to the next equally, although it is onlya ranking. To address this issue, and test its influence on the results, in Table 2 weshow results of ordered probit estimates of the basic specification using thecorruption value for one single year.
The equations show that press has the expected negative sign and thez valueindicates that it is significant at conventional levels. The same applies to the othertwo control variables. The interpretation of coefficients in the ordered probit modelis not straightforward (see Greene, 1997), therefore in the bottom panel we showthe marginal effects of the changes in the regressors. Since in all classes themarginal effects are evaluated at the mean of the respective explanatory variablethe sign must change when moving from lower to higher classes. Take for instancea large value of PRESS. If our reasoning is correct this should reduce theprobability for a country to have high corruption ratings (e.g., classes 1 or 2) andvice versa for small values of PRESS. The signs of the marginal effects displayedin Table 2 show that this is indeed the case as these effects are negative for the
10The finding on inflation is consistent with Braun and Di Tella (2000).
A.
Brunetti,
B.
Weder
/Journal
ofP
ublicE
conomics
87 (2003) 1801–18241815
Table 2Ordered probit estimation; dependent variable corruption in 1995
Variable Coefficient Std. error z Statistic
PRESS 20.0169 0.0050 23.3824BUREAU 0.3504 0.1162 3.0162RULE 0.3712 0.1177 3.1546
Observations: 127Likelihood ratio index: 0.28
Marginal effects (evaluated at the mean of each variable)Variable Class 1 Class 2 Class 3 Class 4 Class 5 Class 6 Class 7
PRESS 20.000012 20.00023 20.00181 20.00467 0.00348 0.00295 0.00030BUREAU 0.00024 0.00485 0.03750 0.09691 20.07220 20.06118 20.00613RULE 0.00025 0.00514 0.03973 0.10267 20.07650 20.06481 20.00649
1816 A. Brunetti, B. Weder / Journal of Public Economics 87 (2003) 1801–1824
low classes of corruption and switch to positive in the high classes. The signs ofthe marginal effects are as expected for the other two control variables as well. Inthe remainder of the paper we only report the OLS results because they can beinterpreted more readily. Using ordered probit estimations does not alter anyresults.
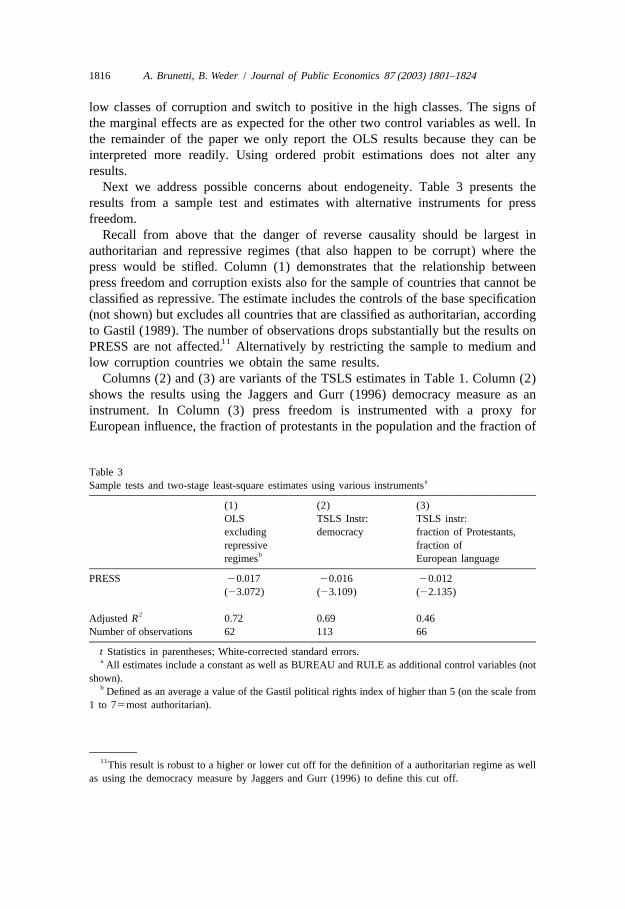
Next we address possible concerns about endogeneity. Table 3 presents theresults from a sample test and estimates with alternative instruments for pressfreedom.
Recall from above that the danger of reverse causality should be largest inauthoritarian and repressive regimes (that also happen to be corrupt) where thepress would be stifled. Column (1) demonstrates that the relationship betweenpress freedom and corruption exists also for the sample of countries that cannot beclassified as repressive. The estimate includes the controls of the base specification(not shown) but excludes all countries that are classified as authoritarian, accordingto Gastil (1989). The number of observations drops substantially but the results on
11PRESS are not affected. Alternatively by restricting the sample to medium andlow corruption countries we obtain the same results.
Columns (2) and (3) are variants of the TSLS estimates in Table 1. Column (2)shows the results using the Jaggers and Gurr (1996) democracy measure as aninstrument. In Column (3) press freedom is instrumented with a proxy forEuropean influence, the fraction of protestants in the population and the fraction of
Table 3aSample tests and two-stage least-square estimates using various instruments
(1) (2) (3)OLS TSLS Instr: TSLS instr:excluding democracy fraction of Protestants,repressive fraction of
bregimes European language
PRESS 20.017 20.016 20.012(23.072) (23.109) (22.135)
2AdjustedR 0.72 0.69 0.46Number of observations 62 113 66
t Statistics in parentheses; White-corrected standard errors.a All estimates include a constant as well as BUREAU and RULE as additional control variables (not
shown).b Defined as an average a value of the Gastil political rights index of higher than 5 (on the scale from
1 to 75most authoritarian).
11This result is robust to a higher or lower cut off for the definition of a authoritarian regime as wellas using the democracy measure by Jaggers and Gurr (1996) to define this cut off.
A. Brunetti, B. Weder / Journal of Public Economics 87 (2003) 1801–1824 1817
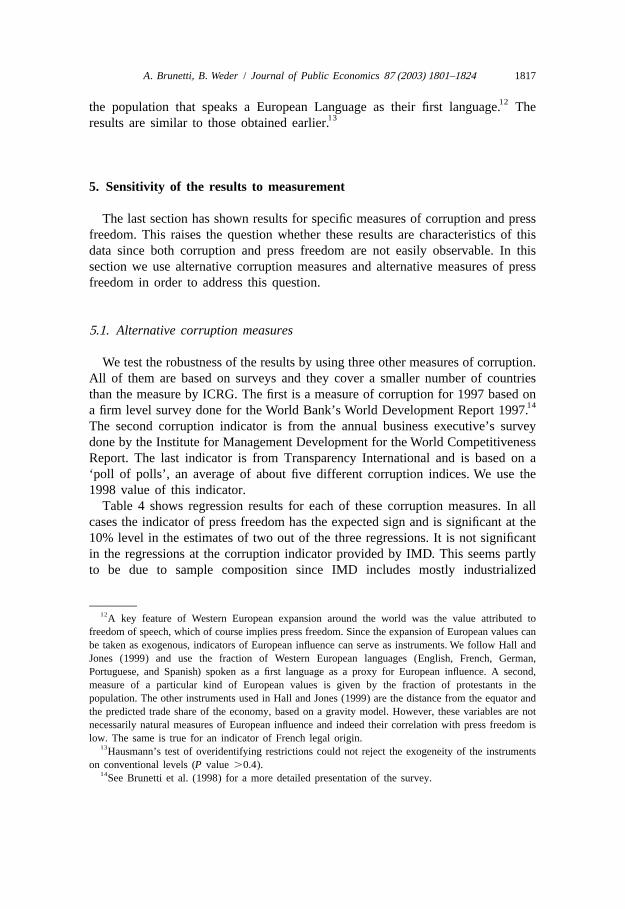
12the population that speaks a European Language as their first language. The13results are similar to those obtained earlier.
5. Sensitivity of the results to measurement
The last section has shown results for specific measures of corruption and pressfreedom. This raises the question whether these results are characteristics of thisdata since both corruption and press freedom are not easily observable. In thissection we use alternative corruption measures and alternative measures of pressfreedom in order to address this question.
5.1. Alternative corruption measures
We test the robustness of the results by using three other measures of corruption.All of them are based on surveys and they cover a smaller number of countriesthan the measure by ICRG. The first is a measure of corruption for 1997 based on
14a firm level survey done for the World Bank’s World Development Report 1997.The second corruption indicator is from the annual business executive’s surveydone by the Institute for Management Development for the World CompetitivenessReport. The last indicator is from Transparency International and is based on a‘poll of polls’, an average of about five different corruption indices. We use the1998 value of this indicator.
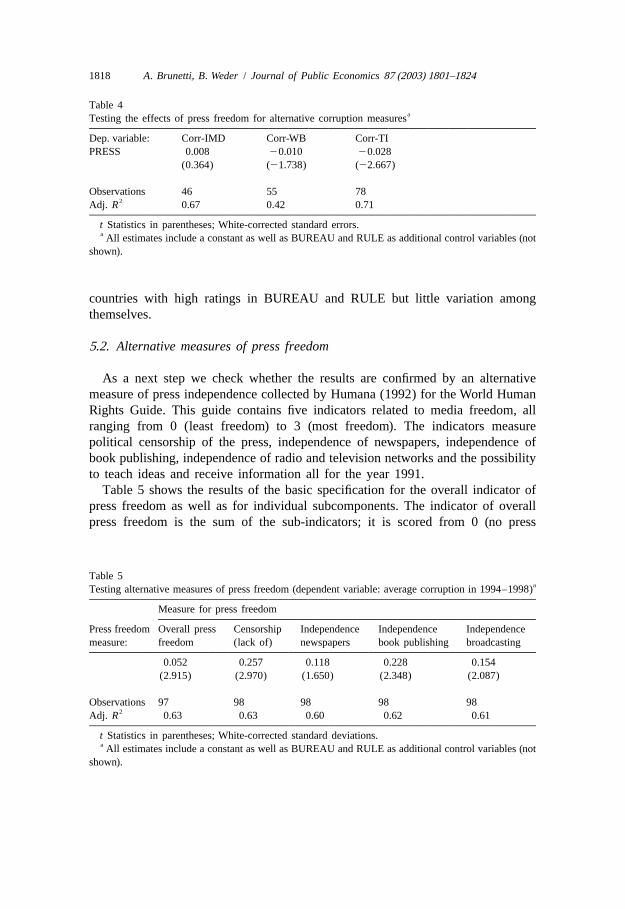
Table 4 shows regression results for each of these corruption measures. In allcases the indicator of press freedom has the expected sign and is significant at the10% level in the estimates of two out of the three regressions. It is not significantin the regressions at the corruption indicator provided by IMD. This seems partlyto be due to sample composition since IMD includes mostly industrialized
12A key feature of Western European expansion around the world was the value attributed tofreedom of speech, which of course implies press freedom. Since the expansion of European values canbe taken as exogenous, indicators of European influence can serve as instruments. We follow Hall andJones (1999) and use the fraction of Western European languages (English, French, German,Portuguese, and Spanish) spoken as a first language as a proxy for European influence. A second,measure of a particular kind of European values is given by the fraction of protestants in thepopulation. The other instruments used in Hall and Jones (1999) are the distance from the equator andthe predicted trade share of the economy, based on a gravity model. However, these variables are notnecessarily natural measures of European influence and indeed their correlation with press freedom islow. The same is true for an indicator of French legal origin.
13Hausmann’s test of overidentifying restrictions could not reject the exogeneity of the instrumentson conventional levels (P value .0.4).
14See Brunetti et al. (1998) for a more detailed presentation of the survey.
1818 A. Brunetti, B. Weder / Journal of Public Economics 87 (2003) 1801–1824
Table 4aTesting the effects of press freedom for alternative corruption measures
Dep. variable: Corr-IMD Corr-WB Corr-TIPRESS 0.008 20.010 20.028
(0.364) (21.738) (22.667)
Observations 46 55 782Adj. R 0.67 0.42 0.71
t Statistics in parentheses; White-corrected standard errors.a All estimates include a constant as well as BUREAU and RULE as additional control variables (not
shown).
countries with high ratings in BUREAU and RULE but little variation amongthemselves.
5.2. Alternative measures of press freedom
As a next step we check whether the results are confirmed by an alternativemeasure of press independence collected by Humana (1992) for the World HumanRights Guide. This guide contains five indicators related to media freedom, allranging from 0 (least freedom) to 3 (most freedom). The indicators measurepolitical censorship of the press, independence of newspapers, independence ofbook publishing, independence of radio and television networks and the possibilityto teach ideas and receive information all for the year 1991.
Table 5 shows the results of the basic specification for the overall indicator ofpress freedom as well as for individual subcomponents. The indicator of overallpress freedom is the sum of the sub-indicators; it is scored from 0 (no press
Table 5aTesting alternative measures of press freedom (dependent variable: average corruption in 1994–1998)
Measure for press freedom
Press freedom Overall press Censorship Independence Independence Independencemeasure: freedom (lack of) newspapers book publishing broadcasting
0.052 0.257 0.118 0.228 0.154(2.915) (2.970) (1.650) (2.348) (2.087)
Observations 97 98 98 98 982Adj. R 0.63 0.63 0.60 0.62 0.61
t Statistics in parentheses; White-corrected standard deviations.a All estimates include a constant as well as BUREAU and RULE as additional control variables (not
shown).
A. Brunetti, B. Weder / Journal of Public Economics 87 (2003) 1801–1824 1819
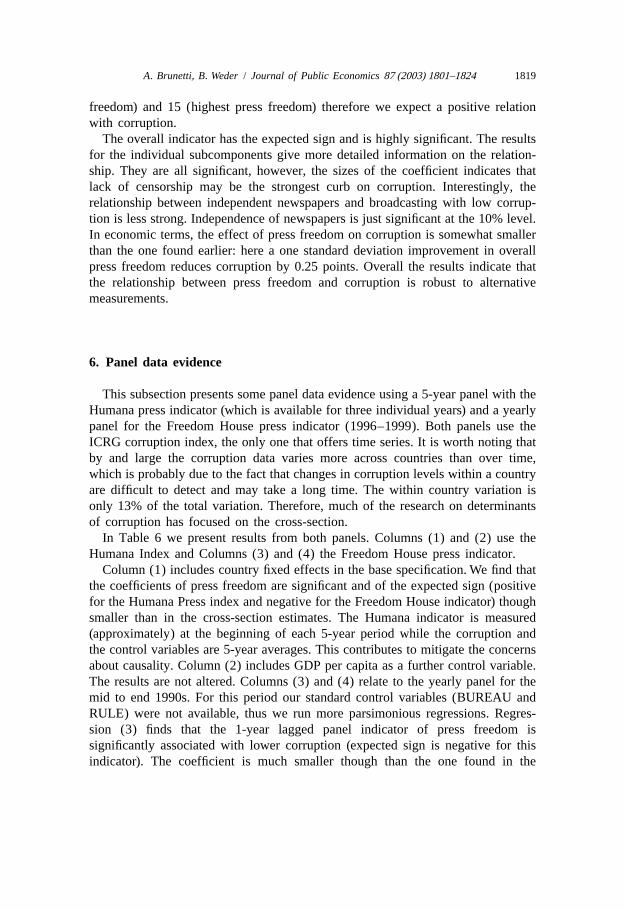
freedom) and 15 (highest press freedom) therefore we expect a positive relationwith corruption.
The overall indicator has the expected sign and is highly significant. The resultsfor the individual subcomponents give more detailed information on the relation-ship. They are all significant, however, the sizes of the coefficient indicates thatlack of censorship may be the strongest curb on corruption. Interestingly, therelationship between independent newspapers and broadcasting with low corrup-tion is less strong. Independence of newspapers is just significant at the 10% level.In economic terms, the effect of press freedom on corruption is somewhat smallerthan the one found earlier: here a one standard deviation improvement in overallpress freedom reduces corruption by 0.25 points. Overall the results indicate thatthe relationship between press freedom and corruption is robust to alternativemeasurements.
6. Panel data evidence
This subsection presents some panel data evidence using a 5-year panel with theHumana press indicator (which is available for three individual years) and a yearlypanel for the Freedom House press indicator (1996–1999). Both panels use theICRG corruption index, the only one that offers time series. It is worth noting thatby and large the corruption data varies more across countries than over time,which is probably due to the fact that changes in corruption levels within a countryare difficult to detect and may take a long time. The within country variation isonly 13% of the total variation. Therefore, much of the research on determinantsof corruption has focused on the cross-section.
In Table 6 we present results from both panels. Columns (1) and (2) use theHumana Index and Columns (3) and (4) the Freedom House press indicator.
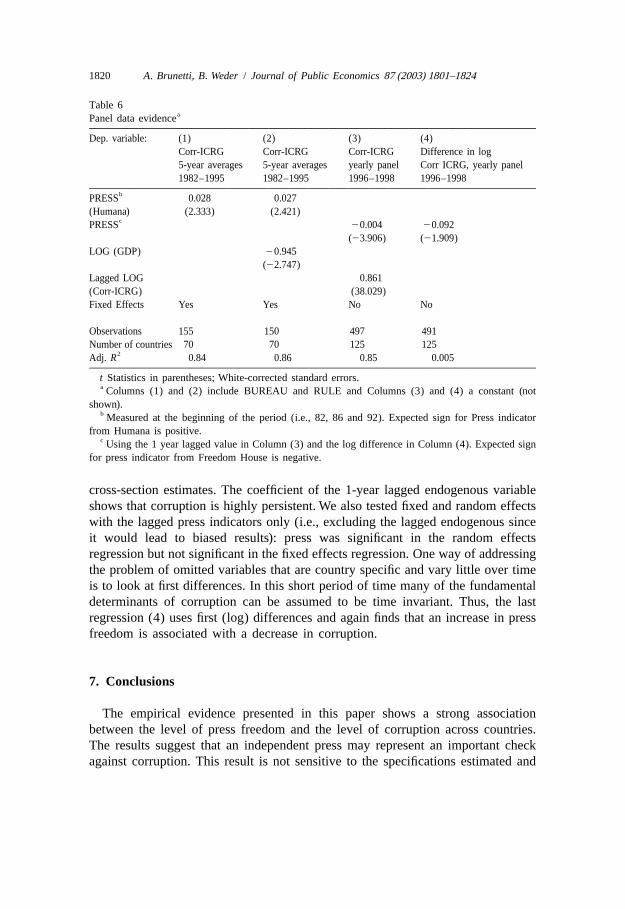
Column (1) includes country fixed effects in the base specification. We find thatthe coefficients of press freedom are significant and of the expected sign (positivefor the Humana Press index and negative for the Freedom House indicator) thoughsmaller than in the cross-section estimates. The Humana indicator is measured(approximately) at the beginning of each 5-year period while the corruption andthe control variables are 5-year averages. This contributes to mitigate the concernsabout causality. Column (2) includes GDP per capita as a further control variable.The results are not altered. Columns (3) and (4) relate to the yearly panel for themid to end 1990s. For this period our standard control variables (BUREAU andRULE) were not available, thus we run more parsimonious regressions. Regres-sion (3) finds that the 1-year lagged panel indicator of press freedom issignificantly associated with lower corruption (expected sign is negative for thisindicator). The coefficient is much smaller though than the one found in the
1820 A. Brunetti, B. Weder / Journal of Public Economics 87 (2003) 1801–1824
Table 6aPanel data evidence
Dep. variable: (1) (2) (3) (4)Corr-ICRG Corr-ICRG Corr-ICRG Difference in log5-year averages 5-year averages yearly panel Corr ICRG, yearly panel1982–1995 1982–1995 1996–1998 1996–1998
bPRESS 0.028 0.027(Humana) (2.333) (2.421)
cPRESS 20.004 20.092(23.906) (21.909)
LOG (GDP) 20.945(22.747)
Lagged LOG 0.861(Corr-ICRG) (38.029)Fixed Effects Yes Yes No No
Observations 155 150 497 491Number of countries 70 70 125 125
2Adj. R 0.84 0.86 0.85 0.005
t Statistics in parentheses; White-corrected standard errors.a Columns (1) and (2) include BUREAU and RULE and Columns (3) and (4) a constant (not
shown).b Measured at the beginning of the period (i.e., 82, 86 and 92). Expected sign for Press indicator
from Humana is positive.c Using the 1 year lagged value in Column (3) and the log difference in Column (4). Expected sign
for press indicator from Freedom House is negative.
cross-section estimates. The coefficient of the 1-year lagged endogenous variableshows that corruption is highly persistent. We also tested fixed and random effectswith the lagged press indicators only (i.e., excluding the lagged endogenous sinceit would lead to biased results): press was significant in the random effectsregression but not significant in the fixed effects regression. One way of addressingthe problem of omitted variables that are country specific and vary little over timeis to look at first differences. In this short period of time many of the fundamentaldeterminants of corruption can be assumed to be time invariant. Thus, the lastregression (4) uses first (log) differences and again finds that an increase in pressfreedom is associated with a decrease in corruption.
7. Conclusions
The empirical evidence presented in this paper shows a strong associationbetween the level of press freedom and the level of corruption across countries.The results suggest that an independent press may represent an important checkagainst corruption. This result is not sensitive to the specifications estimated and
A. Brunetti, B. Weder / Journal of Public Economics 87 (2003) 1801–1824 1821
for alternative measures of corruption and press freedom. Theoretical considera-tions, estimations with various instruments as well as panel data evidence suggestthat the causation runs from more press freedom to less corruption. All in all theresults indicate that press freedom might be an important check on corruption.
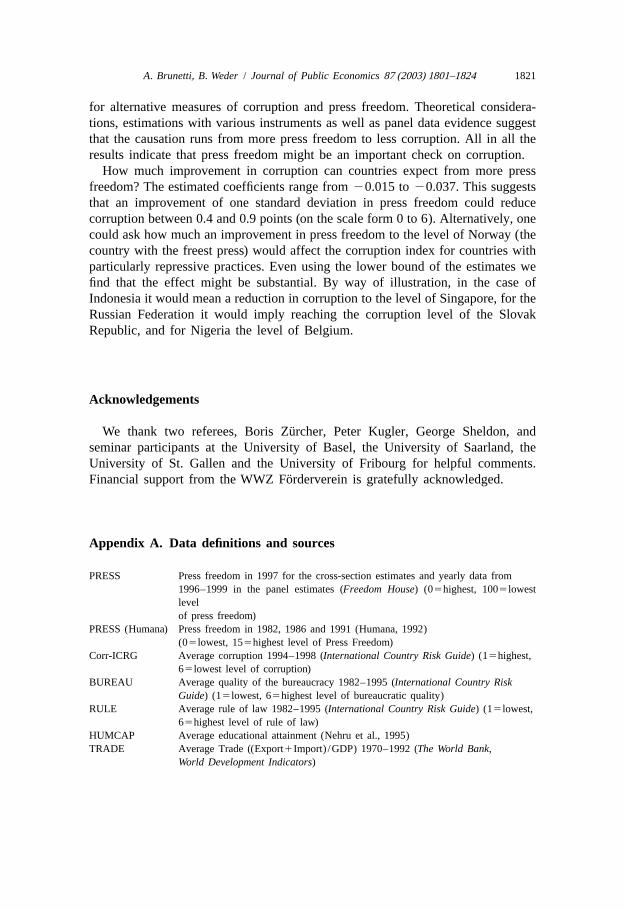
How much improvement in corruption can countries expect from more pressfreedom? The estimated coefficients range from20.015 to20.037. This suggeststhat an improvement of one standard deviation in press freedom could reducecorruption between 0.4 and 0.9 points (on the scale form 0 to 6). Alternatively, onecould ask how much an improvement in press freedom to the level of Norway (thecountry with the freest press) would affect the corruption index for countries withparticularly repressive practices. Even using the lower bound of the estimates wefind that the effect might be substantial. By way of illustration, in the case ofIndonesia it would mean a reduction in corruption to the level of Singapore, for theRussian Federation it would imply reaching the corruption level of the SlovakRepublic, and for Nigeria the level of Belgium.
Acknowledgements
¨We thank two referees, Boris Zurcher, Peter Kugler, George Sheldon, andseminar participants at the University of Basel, the University of Saarland, theUniversity of St. Gallen and the University of Fribourg for helpful comments.
¨Financial support from the WWZ Forderverein is gratefully acknowledged.
Appendix A. Data definitions and sources
PRESS Press freedom in 1997 for the cross-section estimates and yearly data from1996–1999 in the panel estimates (Freedom House) (05highest, 1005lowestlevelof press freedom)
PRESS (Humana) Press freedom in 1982, 1986 and 1991 (Humana, 1992)(05lowest, 155highest level of Press Freedom)
Corr-ICRG Average corruption 1994–1998 (International Country Risk Guide) (15highest,65lowest level of corruption)
BUREAU Average quality of the bureaucracy 1982–1995 (International Country RiskGuide) (15lowest, 65highest level of bureaucratic quality)
RULE Average rule of law 1982–1995 (International Country Risk Guide) (15lowest,65highest level of rule of law)
HUMCAP Average educational attainment (Nehru et al., 1995)TRADE Average Trade ((Export1Import) /GDP) 1970–1992 (The World Bank,
World Development Indicators)
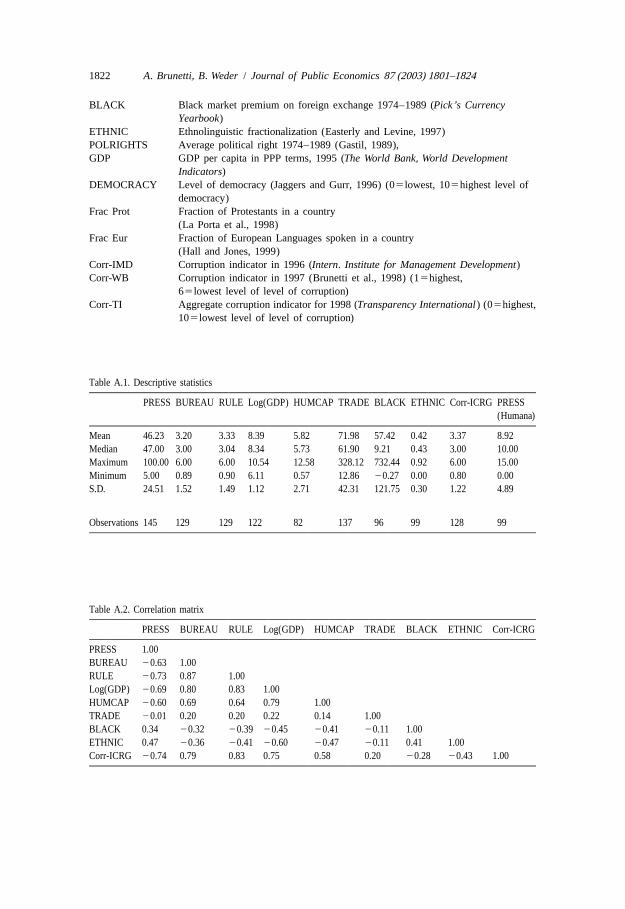
1822 A. Brunetti, B. Weder / Journal of Public Economics 87 (2003) 1801–1824
BLACK Black market premium on foreign exchange 1974–1989 (Pick’ s CurrencyYearbook)
ETHNIC Ethnolinguistic fractionalization (Easterly and Levine, 1997)POLRIGHTS Average political right 1974–1989 (Gastil, 1989),GDP GDP per capita in PPP terms, 1995 (The World Bank, World Development
Indicators)DEMOCRACY Level of democracy (Jaggers and Gurr, 1996) (05lowest, 105highest level of
democracy)Frac Prot Fraction of Protestants in a country
(La Porta et al., 1998)Frac Eur Fraction of European Languages spoken in a country
(Hall and Jones, 1999)Corr-IMD Corruption indicator in 1996 (Intern. Institute for Management Development)Corr-WB Corruption indicator in 1997 (Brunetti et al., 1998) (15highest,
65lowest level of level of corruption)Corr-TI Aggregate corruption indicator for 1998 (Transparency International) (05highest,
105lowest level of level of corruption)
Table A.1. Descriptive statistics
PRESS BUREAU RULE Log(GDP) HUMCAP TRADE BLACK ETHNIC Corr-ICRG PRESS(Humana)
Mean 46.23 3.20 3.33 8.39 5.82 71.98 57.42 0.42 3.37 8.92Median 47.00 3.00 3.04 8.34 5.73 61.90 9.21 0.43 3.00 10.00Maximum 100.00 6.00 6.00 10.54 12.58 328.12 732.44 0.92 6.00 15.00Minimum 5.00 0.89 0.90 6.11 0.57 12.86 20.27 0.00 0.80 0.00S.D. 24.51 1.52 1.49 1.12 2.71 42.31 121.75 0.30 1.22 4.89
Observations 145 129 129 122 82 137 96 99 128 99
Table A.2. Correlation matrix
PRESS BUREAU RULE Log(GDP) HUMCAP TRADE BLACK ETHNIC Corr-ICRG
PRESS 1.00BUREAU 20.63 1.00RULE 20.73 0.87 1.00Log(GDP) 20.69 0.80 0.83 1.00HUMCAP 20.60 0.69 0.64 0.79 1.00TRADE 20.01 0.20 0.20 0.22 0.14 1.00BLACK 0.34 20.32 20.39 20.45 20.41 20.11 1.00ETHNIC 0.47 20.36 20.41 20.60 20.47 20.11 0.41 1.00Corr-ICRG 20.74 0.79 0.83 0.75 0.58 0.20 20.28 20.43 1.00
A. Brunetti, B. Weder / Journal of Public Economics 87 (2003) 1801–1824 1823
References
Ades, A., Di Tella, R., 1999. Rents, competition and corruption. American Economic Review 89,982–993.
Bardhan, P., 1997. Corruption and development. Journal of Economic Literature 25, 1320–1346.Besley, T., McLaren, J., 1993. Taxes and bribery: the role of wage incentives. Economic Journal 103,
119–141.Braun, M., Di Tella, R., 2000. Inflation and Corruption, mimeo, Harvard University.Brunetti, A., Kisunko, G., Weder, B., 1998. Credibility of rules and economic growth: evidence from a
worldwide survey of the private sector. World Bank Economic Review 12, 353–384.De Soto, H., 1989. In: The Other Path. Harper & Row, New York.Easterly, W., Levine, R., 1997. Africa’s growth tragedy: policies and ethnic divisions. Quarterly Journal
of Economics 112, 1203–1250.Flatters, F., MacLeod, B., 1995. Administrative corruption and taxation. International Tax and Public
Finance 2, 397–417.Freedom House, 1997. Press Freedom World Wide, www.freedomhouse.org/Press/Press97/ratings97.Gastil, R., 1989. In: Freedom in the World: Political Rights and Civil Liberties 1988–1989. Freedom
House, Lanham.Greene, W., 1997. In: Econometric Analysis, 3rd Edition. Prentice-Hall International, London.Hall, R., Jones, C., 1999. Why do some countries produce so much more output per worker than others?
Quarterly Journal of Economics 110, 495–525.Hindricks, J., Keen, M., Muthoo, A., 1999. Corruption, extortion and evasion. Journal of Public
Economics 74, 395–430.Humana, C., 1992. In: World Human Rights Guide, 3rd Edition. Oxford University Press, New York,
Oxford.Jaggers, K., Gurr, T., 1996. Polity III: Regime Type and Political Authority, 1800–1994, mimeo
Inter-University Consortium for Political and Social Research, Ann Arbor.Johnson, S., Kaufman, D., Zoido-Lobaton, P., 1998. Regulatory discretion and the unofficial economy.
American Economic Review Papers and Proceedings 88, 387–392.Kaufman, D., 1997. Corruption: the facts. Foreign Policy 107, 114–131.Klitgaard, R., 1988. In: Controlling Corruption. University of California Press, Berkeley, CA.Knack, S., Keefer, P., 1995. Institutions and economic performance: cross-country tests using
alternative institutional measures. Economics and Politics 7, 207–227.La Porta, R., Lopez-de-Silanes, F., Shleifer, A., Vishny, R., 1998. The Quality of Government. NBER
Working Paper 6727. National Bureau of Economic Research, Cambridge, MA.Lee, R., 1986. Bureaucratic corruption in Asia: the problem of incongruence between legal norms and
folk norms. In: Carino, A. (Ed.), Bureaucratic Corruption in Asia: Causes, Consequences, andControls. NMC Press, Quezon City.
Mauro, P., 1995. Corruption and Growth. Quarterly Journal of Economics 110, 681–712.Mauro, P., 1996. The effects of corruption on growth, investment and government expenditure. Journal
of Public Economics 69, 263–279.Nehru, V., Swanson, E., Dubey, A., 1995. A new database on human capital stock: sources,
methodology and results. Journal of Development Economics 46, 379–401.Rahman, R., 1986. Legal and administrative measures against bureaucratic corruption in Asia. In:
Carino, A. (Ed.), Bureaucratic Corruption in Asia: Causes, Consequences, and Controls. NMC Press,Quezon City.
Rauch, J., Evans, P., 2000. Bureaucratic structures and economic performance in less developedcountries. Journal of Public Economics 75, 49–71.
Rose-Ackerman, S., 1975. The economics of corruption. Journal of Political Economy 83, 187–203.
1824 A. Brunetti, B. Weder / Journal of Public Economics 87 (2003) 1801–1824
Sachs, J., Warner, A., 1995. Economic reform and the process of global integration. Brookings Papersof Economic Activity 1, 1–118.
Shleifer, A., Vishny, R., 1993. Corruption. Quarterly Journal of Economics 108, 599–617.Tanzi, V., 1994. Corruption, Governmental Activities and Markets. IMF Working Paper 94/99.
International Monetary Fund, Washington, DC.Van Rijckeghem, C., Weder, B., 2001. Corruption and the rate of temptation: do low wages in the civil
service cause corruption. Journal of Development Economics 65, 307–331.White, H., 1980. A heteroskedasticity-consistent covariance matrix estimator and a direct test for
heteroskedasticity. Econometrica 48, 817–838.