a function of x is a relation in which no two ordered pairs have the same x-value. x f(x) does the...
TRANSCRIPT

A function of x is a relation in which no two ordered pairs have the same
x-value.
x f(x)
Does the information given define a function ?
a 1
b 4
c 4
d 3
x f(x) x f(x) x f(x)
a 1
b 2
c 3
d 4
a 5
1 6
2 5
1 -6
2 -5
3 4
a 4
b 5
c 4
b 5
Yes; no two ordered pairs
have the same x-value.
No; two ordered pairs
have the same x-
value.
No; several ordered pairs
have the same x-values.
Yes; no two ordered pairs
have the same x-value.

Math 8H
Heath 12.3Exponential Functions
Heath Algebra 1 McDougal Littell JoAnn Evans
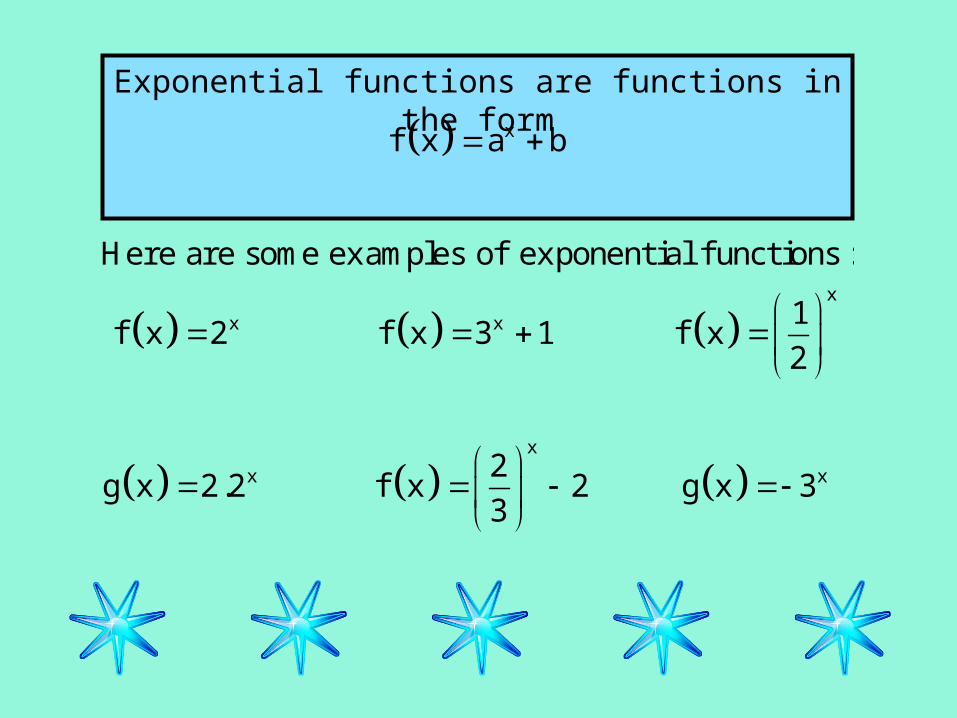
Exponential functions are functions in the form xf x a b
x
x x
x
x x
Here are some examples of exponential f unctions :
1f x 2 f x 3 1 f x
2
2g x 2.2 f x 2 g x 3
3
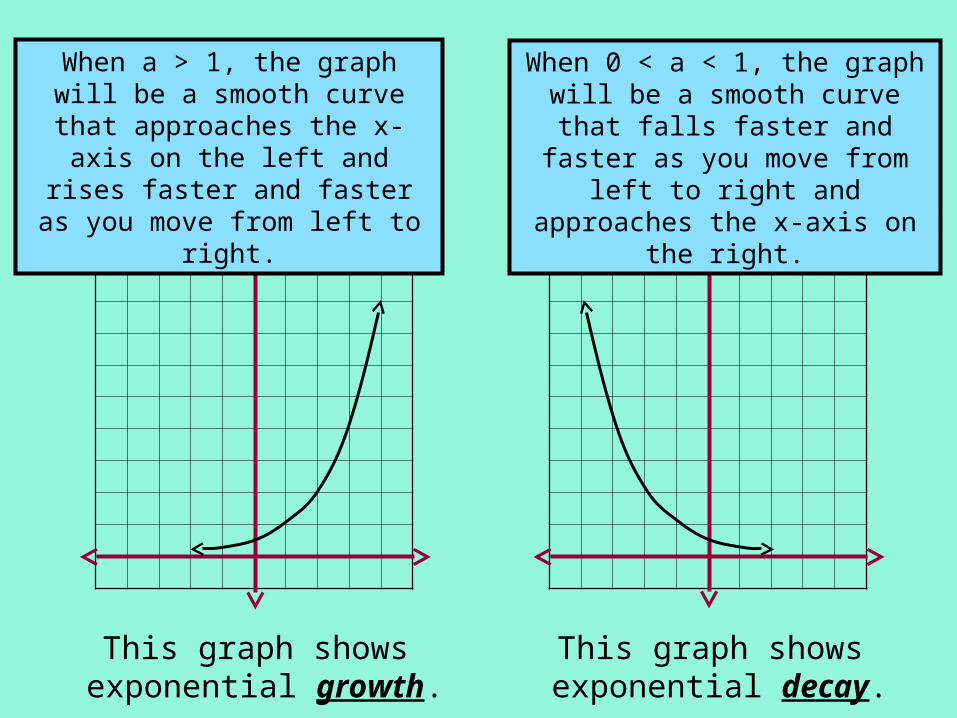
When a > 1, the graph will be a smooth curve that
approaches the x-axis on the left and rises faster and faster
as you move from left to right.
When 0 < a < 1, the graph will be a smooth curve that falls faster and faster as you move from left to right and
approaches the x-axis on the right.
This graph shows exponential growth.
This graph shows exponential decay.
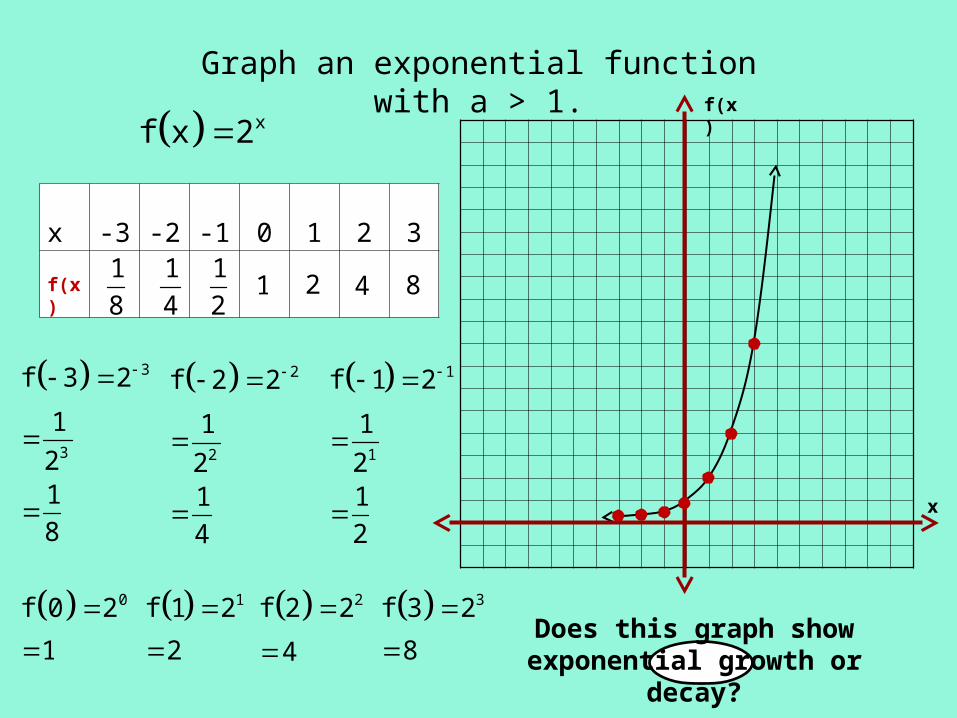
Graph an exponential function with a > 1.
x -3 -2 -1 0 1 2 3
f(x)
xf x 2
14
2f 2 2
2
1
2
14
0f 0 2
1
12
12
1f 1 2
1
1
2
1
1f 1 2
2 2f 2 2
4 3f 3 2
8
2 4 8
18
3f 3 2
3
1
2
18
Does this graph show exponential growth or
decay?
f(x)
x

x -3 -2 -1 0 1 2 3
f(x)
x -3 -2 -1 0 1 2 3
f(x)
Transformation of an Exponential Function
xf x 2 3
14
12
1 2 4 818
This function shifted the graph of f(x)=2x three units UP.
Look at the table of values for the previous graph f(x) =
2x.
How will the table of values for the new function be
different?
13
41
32
4 5 7 111
38
Each y-value will be 3 greater than in the previous
graph.
f(x)
x xf x 2

Transformation of an Exponential Function
xf x 2 2
This function shifted the graph of
f(x)=2x two units DOWN.
Look at the table of values for the original graph f(x) =
2x.
How will the table of values for the new function be
different?x -3 -2 -1 0 1 2 3
3
14
112
1 0 2 67
18
Each y-value will be 2 less than in the original graph.
f(x)
x xf x 2

x
When a number, b, is added or subtracted to
f x a , it causes a vertical shif t.
x xThe graph of f x 3 5 will shif t the graph of f x 3
5 units UP
x xThe graph of f x 4 3 will shif t the graph of f x 4
3 units DOWN
x x
1 1The graph of f x 1 will shif t the graph of f x
2 2
1 unit UP

Transformation of an Exponential Function
x 1f x 2
This function shifted the graph of f(x)=2x one unit
to the left.
What transformation do you think this graph will show?
x -3 -2 -1 0 1 2 3
12
1 2 4 8 1614
3 1 42 2 16
2 1 1 12 2
2
0 1 12 2 2
2 1 32 2 8
3 1 2 12 2
4
1 1 02 2 1
1 1 22 2 4
f(x)
x

Graph an exponential function with a < 1.
x -3 -2 -1 0 1 2 3
x
1f x
2
2
2
2
1
212
2
2
1
2
4 2
212
112
1
1
1
2
112
14
18
3
3
2
1
312
3
3
1
2
8
Does this graph show exponential growth or
decay?
8 4
012
11
12
12
2
12
14
3
12
18
f(x)
x
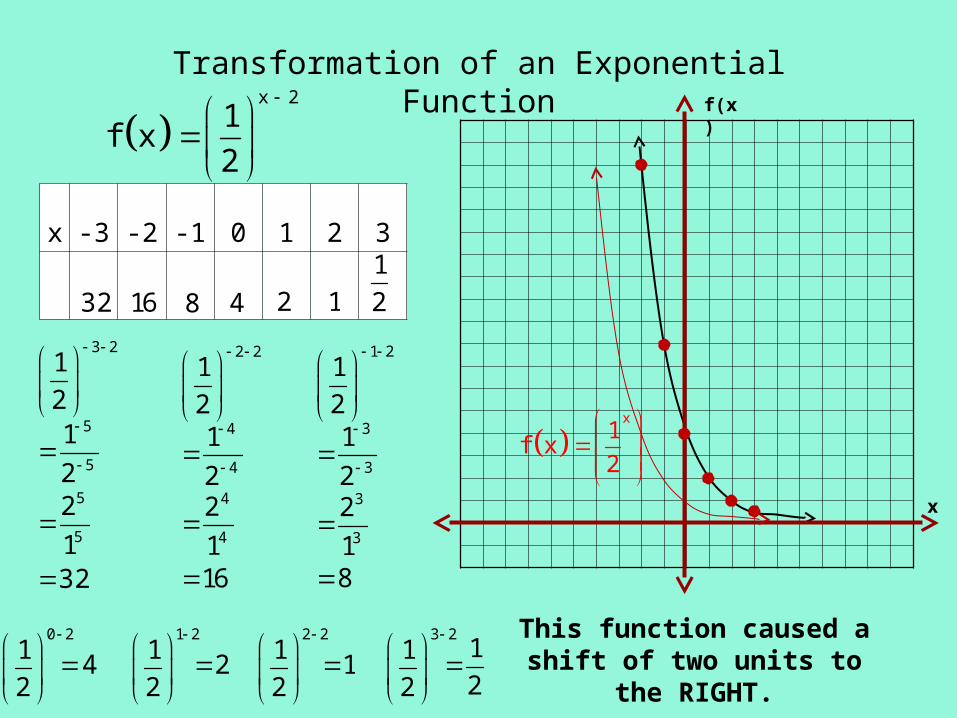
Transformation of an Exponential Function
x -3 -2 -1 0 1 2 3
x 2
1f x
2
4
4
2
1
2 212
4
4
1
2
16 8
3
3
2
18
1 212
3
3
1
2
4 2 112
5
5
2
1
3 212
5
5
1
2
32
32 16
0 212
41 2
12
22 2
12
13 2
12
12
This function caused a
shift of two units to the RIGHT.
f(x)
x
x
1f x
2

x
x
To sketch the graph of
f x 2
refl ect the graph of
f x 2
in the x-axis.
xf x 2
xf x 2
One graph is a reflection of another graph in the x-axis if the two graphs are
mirror images of each other.
x
1Now graph f x
2
f(x)
x

Describe the relationship between the graph of function f and the graph of function g.
x x
x x
x x 1
x x
x x 2
x x
f x 3 g x 3 4
f x 5 g x 5 2
f x 2 g x 2
f x 6 g x 6
f x 2.1 g x 2.1
1 1f x g x
2 2
Vertical shift; 4 units UP
Vertical shift; 2 units DOWN
Horizontal shift; 1 unit RIGHTReflection
Horizontal shift; 2 units LEFT
Reflection

Extra Practice:
x 1f x 3
f(x)
x -3 -2 -1 0 1
f(x)
13
1 3 919

x 2f x 1.5
x -1 0 1 2 3 4
f(x) .4 .7 1 1.5.3 2.25