a fuzzy logic approach for anomaly detection in energy
TRANSCRIPT

A Fuzzy Logic Approach for AnomalyDetection in Energy Consumption Data
Muriel Hol10161740
Bachelor thesisCredits: 18 EC
Bachelor Opleiding Kunstmatige Intelligentie
University of AmsterdamFaculty of ScienceScience Park 904
1098 XH Amsterdam
SupervisorAysenur Bilgin
Institute for Logic, Language and ComputationFaculty of Science
University of AmsterdamScience Park 107
1098 XG Amsterdam
June 24th, 2016
1

Summary
Due to the need of better energy management in buildings, various research is done in the fieldof forecasting energy consumption for anomaly detection. Although SVM and ANN dominatein this field, improvement with the use of Fuzzy Logic is proposed. This approach providesa transparent process that allows information about the anomaly and hence targeted manage-ment. Additionally, it enhances the adaptability of the system to increase performance and allowapplication on a larger scale. For this investigation, a Fuzzy Inference System and AnomalyDetection method are applied. The performance on forecasting and anomaly detection are in-vestigated, while meeting the challenges in this field of research.
Acknowledgement
I wish to express my sincere gratitude to Aysenur Bilgin for the extensive supervision and sup-port in the creation of this thesis.

Contents
1 Introduction 3
2 Literature Review 42.1 Forecasting and Anomaly Detection . . . . . . . . . . . . . . . . . . . . . . . . . . . . 4
2.2 Fuzzy Inference System . . . . . . . . . . . . . . . . . . . . . . . . . . . . . . . . . . . 5
2.3 Fuzzy Anomaly Detection . . . . . . . . . . . . . . . . . . . . . . . . . . . . . . . . . 7
2.4 Scaling of the system . . . . . . . . . . . . . . . . . . . . . . . . . . . . . . . . . . . . 7
3 Method 83.1 Data . . . . . . . . . . . . . . . . . . . . . . . . . . . . . . . . . . . . . . . . . . . . . 8
3.1.1 Data pre-processing . . . . . . . . . . . . . . . . . . . . . . . . . . . . . . . . 9
3.2 Constructing the Fuzzy Inference System . . . . . . . . . . . . . . . . . . . . . . . . . 9
3.3 Forecasting . . . . . . . . . . . . . . . . . . . . . . . . . . . . . . . . . . . . . . . . . 10
3.4 Anomaly Classification . . . . . . . . . . . . . . . . . . . . . . . . . . . . . . . . . . . 11
3.5 Scaling of the system . . . . . . . . . . . . . . . . . . . . . . . . . . . . . . . . . . . . 13
4 Results 134.1 Forecasting and Anomaly Detection . . . . . . . . . . . . . . . . . . . . . . . . . . . . 13
4.2 Scaling of the system . . . . . . . . . . . . . . . . . . . . . . . . . . . . . . . . . . . . 14
5 Evaluation 145.1 Forecasting . . . . . . . . . . . . . . . . . . . . . . . . . . . . . . . . . . . . . . . . . 14
5.2 Anomaly Detection . . . . . . . . . . . . . . . . . . . . . . . . . . . . . . . . . . . . . 15
5.3 Relation . . . . . . . . . . . . . . . . . . . . . . . . . . . . . . . . . . . . . . . . . . . 15
5.4 Up scaling the system . . . . . . . . . . . . . . . . . . . . . . . . . . . . . . . . . . . . 16
6 Discussion 16
7 Conclusion 17
8 Future Work 17
Appendices 20
Appendix A Merging of Fuzzy Sets 21Appendix B Code fragments 23
B.1 Example rule inference code FRBS in R . . . . . . . . . . . . . . . . . . . . . . . . . . 23
B.2 Example code for inference system with 9 fuzzy sets values . . . . . . . . . . . . . . . . 23
Appendix C Linear correlation of the features 26
Appendix D List of Holidays 26
Appendix E Addresses of the buildings 26
2
1 Introduction
Perez-Lombard et al. (2008) address the concerns about the rapid worldwide growth of energyconsumption, particularly the rising energy consumption in buildings. This rise is caused by pop-ulation growth, improved indoor comfort and services, and increased time spent inside buildings(Perez-Lombard et al., 2008). Additionally, economic growth is causing a rise in the require-ment of energy in buildings in the service sector such as schools, hospitals and recreationalbuildings. With regard to Europe, buildings consume 40% of the entire energy consumption andnon-residential buildings comprise the majority of this. (ODYSEE, 2015b).
Katipamula and Brambley (2005) state that buildings waste 15 to 30% of energy due to deficientmanagement, which can be prevented by the utilisation of automated fault detection and diag-nostics (FDD). FDD systems detect abnormal behaviour and provide explicit information aboutthe cause of the problem in order to enable targeted management. Chandola and Kumar (2009)describe this detection of abnormal behaviour as anomaly detection.
The demand for better energy management in buildings through anomaly detection has resultedin various studies in the field of forecasting energy consumption (Zhao and Magoules, 2012).The energy consumption of a building is influenced by complex features such as the buildingsmaterials, the user’s schedule, the weather and subjectivity in indoor comfort. Therefore, it is achallenging task which asks for algorithms that handle non-linearity and uncertainty.
Artificial Neural Networks(ANN) and Support Vector Machines (SVM) are the most frequentlyused algorithms because they perform well with non-linear data (De Nadai and van Someren(2015) ; Zhao and Magoules (2012). Both methods are referred to as “black-box” algorithms,which means that no knowledge of the data is needed in order to tune and use them, and resultsare produced without having knowledge of causalities (Rocha et al., 2010). This can be anadvantage in complex problems. However, as stated in the previous paragraph, informationabout the cause of the anomaly is valuable for building energy management.
The detection of anomalies in energy data requires an algorithm that handles uncertain and non-linear data and enables transparency of the process. Fuzzy Logic satisfies these requirements.The founder of Fuzzy Logic is Lotfi A. Zadeh, who introduced Fuzzy Sets (Zadeh, 1965). Zadehdescribes a fuzzy set as ” a class with continuum grades of membership”. This means that avalue can belong to a set with a degree of membership. For example, in the class of temperature,instead of water being cold or warm, it has 0.2 membership to the cold set and 0.8 membershipto the warm set. This allows for coping with uncertainties. Because the fuzzy sets are labelledwith a linguistic term, a descriptive and transparent process is automatically provided.
Wijayasekera et al. (2014) have shown that high accuracies for anomaly detection can be achievedwhen Fuzzy Logic is applied. Rocha et al. (2010) strengthen the argumentation for exploringFuzzy Logic by stating that although complex algorithms like neural networks and support vectormachines seem to dominate with regard to high accuracies, non-complex transparent algorithmsenable good knowledge of the process. This can be exploited by tuning and manipulating theprocess, which can induce equivalent or even better performance as complex algorithms.
For buildings in the service sector of The Netherlands, gas consumption comprises the largestshare in energy consumption (ODYSEE, 2015a). Gas is severely affected by the weather, whichis an uncertain feature. Therefore, the aim of this study is to investigate how Fuzzy Logiccan improve anomaly detection and enable linguistic description of the identified anomaliesregarding gas consumption data.
This will be investigated in 3 different stages: firstly it is investigated how Fuzzy Logic performsin forecasting, secondly it is investigated how Fuzzy Logic performs on anomaly detection and
3
finally it is investigated if the Fuzzy Anomaly Detection System performs on larger scale.
Additionally, this paper will provide a framework for the components in this field of researchwhich are (1) generating and prepossessing forecasting data, (2) constructing a Fuzzy AnomalyDetection system and (3) providing results in a critical and correct manner.
2 Literature Review
2.1 Forecasting and Anomaly Detection
De Nadai and van Someren (2015) used time series data for gas consumption forecasting andadditionally applied an Auto-Regressive Integrated Moving Average model for the generation offeatures that enhance forecasting performance. They supplied an ANN with this generated datain order to create a hybrid model. High accuracies were yielded (De Nadai and van Someren,2015).
Forecasting using time-series data is a frequently used method for anomaly detection and is suit-able for energy consumption data. A data point is classified as an anomaly when the differencebetween the predicted and actual value is above a certain threshold. Time series data can havecontextual attributes such as relative time features, and behavioural attributes such as weatherfeatures (Chandola and Kumar, 2009). Based on De Nadai and van Someren (2015), Lodewe-gen (June 2015) investigated the use of time series data for ANNs using the same data. Hisnon-hybrid approach and extensive explanation of the data allows for a good reference point forthe use of Fuzzy Logic vice ANN.
The aim of anomaly detection is to classify the anomalies with high accuracy. Two methods formeasuring the performance are proposed: the anomaly classification score and the forecastingerrors. While considerable research is done on the prediction of energy consumption (Zhao andMagoules, 2012), few equivalent research was found on anomaly detection accuracies. This isbecause labelled data is rarely available (Zhao and Magoules, 2012).
The evaluation of the anomaly detection performance can be handled with the injection ofsynthetically created anomalous data (Wijayasekera et al. (2014); De Nadai and van Someren(2015). Lodewegen (June 2015) used the 3 sigma rule for the detection of anomalies. As ex-plained in Chandola and Kumar (2009), this assumes that an anomaly is a data point that hasa value more than 3 times the standard deviation away from the data’s mean value. Lodewe-gen (June 2015) evaluates the anomaly detection of the ANN by means of showing plots of thedistance between the predicted value of the anomalies and the value of the anomalies.
These evaluation methods do not provide enough information to measure anomaly classificationscores. In an extensive survey on anomaly detection, Chandola and Kumar (2009) state that”Defining a normal region that encompasses every possible normal behavior is very difficult. Inaddition, the boundary between normal and anomalous behavior is often not precise. Thus ananomalous observation that lies close to the boundary can actually be normal, and vice versa.”(p.3). When few and very anomalous synthetic anomalies are used for evaluation, or whendistance between anomalies and predicted values is empirically analysed, this problem is notchallenged.
Additionally, using forecasting for anomaly detection is a supervised task that requires labelleddata in order to confirm that the training data is free of anomalies. However, labelling the data asanomalous or normal is an expensive task that is mostly done manually. Based on assumptions,semi-supervised methods can classify a subset of the data as sufficient for training. Moreover,the assumption that the training data is clean, ”constitutes a fundamental concept underlying theuse of anomaly detection techniques” (Wijayasekera et al., 2014), p. 1832).
4
Therefore, a method for labelling the data and calculating classification scores using a significantamount of anomalies with different anomalous values will be proposed in this project.
Chandola and Kumar (2009) address the problem characteristics that should be anticipatedwithin the domain of anomaly detection. The four problem characteristics described are (1) thenature of the data, (2) the type of the anomaly, (3) if the data is labelled as normal or abnormaland (4) the format in which the anomaly is reported. As introduced, from these characteristicscan be inferred that Fuzzy Logic is a good candidate for the anomaly detection in gas consump-tion data. Additionally, these characteristic will serve as a guideline for the construction of aFuzzy Anomaly Detector.
2.2 Fuzzy Inference System
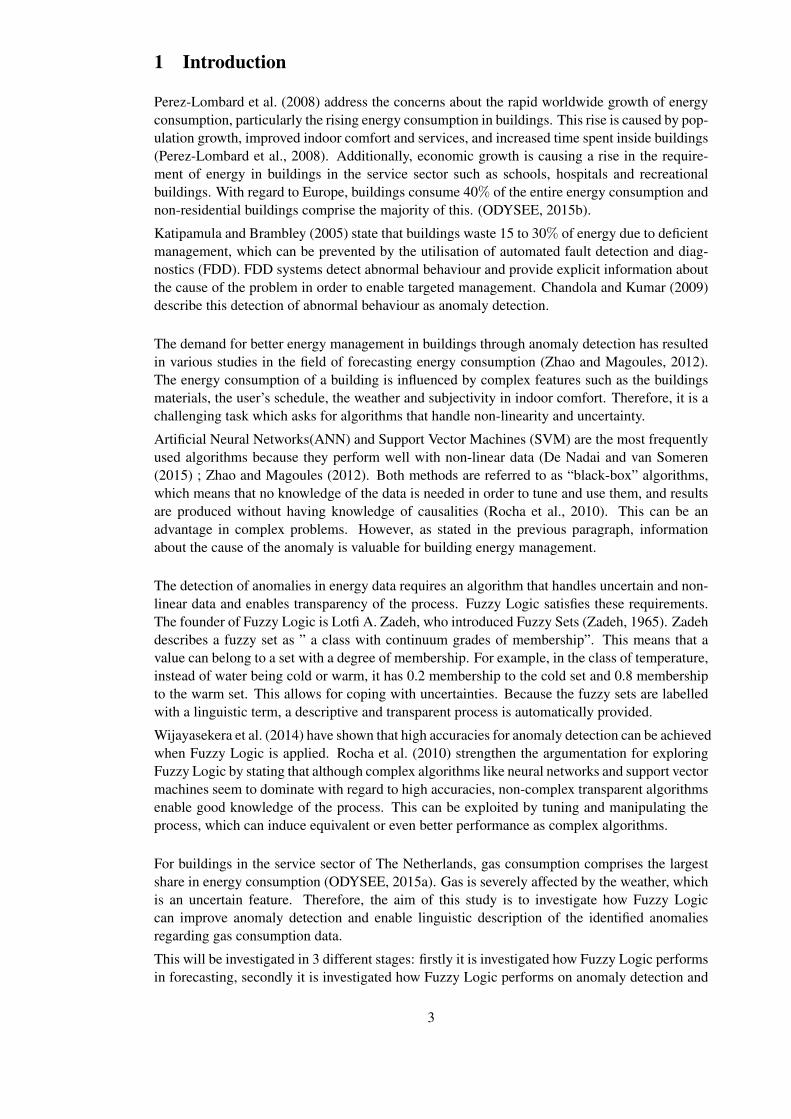
A Fuzzy Inference System (FIS), frequently named a Fuzzy Rule-Based System, consist of 5components: (1) The Fuzzifier, (2) Rule Base, (3) Data Base, (4) Inference System and (5)Defuzzifier (Sanz et al., 2012). Figure 1 provides an overview of the data flow within the FIS.
Figure 1: A Fuzzy Inference System.
FuzzifierIn order for the Inference System to readthe data, it has to be Fuzzified. TheFuzzifier transforms a crisp value intofuzzy values with corresponding mem-bership. For example; the value 5of the variable ”temperature” is trans-formed into the fuzzy value ”cold” withmembership µ
cold
(5). This is achievedthrough a membership function, in thiscase µ
cold
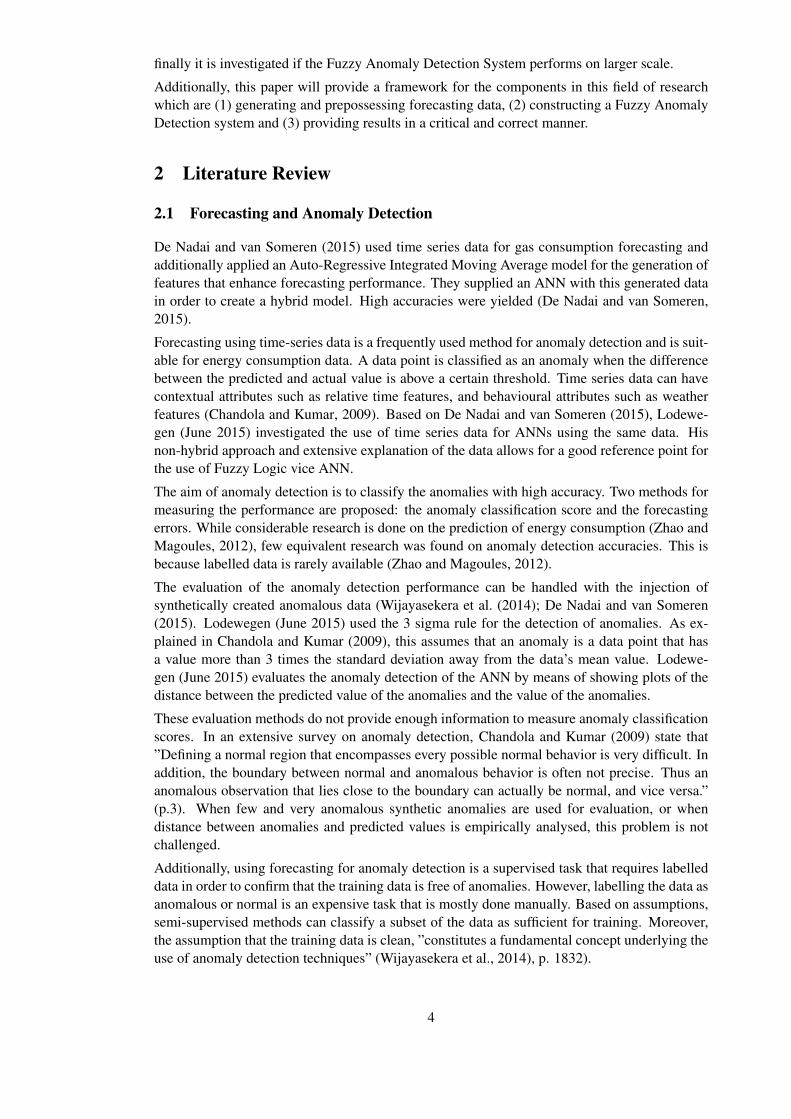
. When there are more fuzzy values of the variable ”temperature” such as ”warm”or ”hot”, then this data point will have a membership to those sets as well. The degrees ofmembership can range from 0 to 1 (Zadeh, 1965). Figure 2 shows an example of membershipfunctions for the fuzzy values ’cold’, ’warm’ and ’hot’ of the fuzzy variable ’temperature’. Themembership functions are Gaussian.
Figure 2: An example of the fuzzy sets of a temperaturevariable with Gaussian membership functions.
Rule BaseThe second component that is needed for theinference is the Rule Base. A Mamdani typeRule Base is in the format of IF-THEN rules,an example is: IF temperature IS cold ANDradiation IS low THEN gas consumption IShigh. Applications of Mamdani type RuleBases have the advantage of being easily ad-justable to a specific problem because it al-lows various Fuzzy Inference Systems. More-over, this rule formatting is very descriptivewhich enables sufficient description of the de-tected anomalies (Alcala et al., 1999). There-fore, this project will avail from the Mamdanitype of Fuzzy Rules.
Alcala et al. (1999) provide an extensiveoverview of the various methods for con-structing a Fuzzy Rule Base. One of the methods they propose is an ad-hoc method constructedby Wang and Mendel (1992). They state that this method is renowned because of its ”simplic-
5

ity and good performance” (p.11). The Method is referred to as the ”WM” method. The WMmethod consists of 4 major steps (Wang and Mendel, 1992):
i Fuzzy Partitioning: For each input variable, its numerical domain is partitioned into Nequal subspaces. To each subspace, a membership function and an appropriate fuzzy setvalue is assigned.
ii Rule generation: Each data point in the training data is fuzzified by applying the createdmembership functions to the data. All combinations of sets which the data point hasnonzero membership to, will be used for the creation of rules. The sets of the features willbe the antecedents of the rules with the corresponding output set as the consequent.
iii Assigning of importance degree to each rule: The most used method for assigning an im-portance degree to a rule is either taking the smallest membership value of the antecedents(MIN operator), or the product of all the antecedents (PRODUCT operator). These oper-ators are called the T-norm.
iv Eliminated competing rules: when multiple rules have the same antecedents, only the rulewith the highest importance degree is kept into the Rule Base.
Data BaseThe data base stores the membership function and the linguistic values of the fuzzy sets. Theseshould be the same membership functions and fuzzy sets as used for the fuzzification.
Inference SystemThe inference system takes a fuzzy data point and checks all the rules that match the sets thatthis data point has membership to. When such a rule is found, the membership to the antecedentsets is combined with the product or minimum operator. This combination is the firing strengthor weight of the rule, as regards to that specific data point. Summarised, for each data pointthe inference system infers a weight for each matching rule. These weights will be used for thedefuzzification process.
Figure 3: Defuzzification method used for this project, based on Wang and Mendel (1992).
DefuzzifierThe defuzzifier calculates the predicted numerical output value. This value is a combinationof the rule weights and a selected characteristic of the output fuzzy set (Alcala et al., 1999).Wang and Mendel (1992) used the centroid of the fuzzy set as characteristic. Based on theirdefuzzification formula, figure 3 illustrates the defuzzification method used for this project. The
6
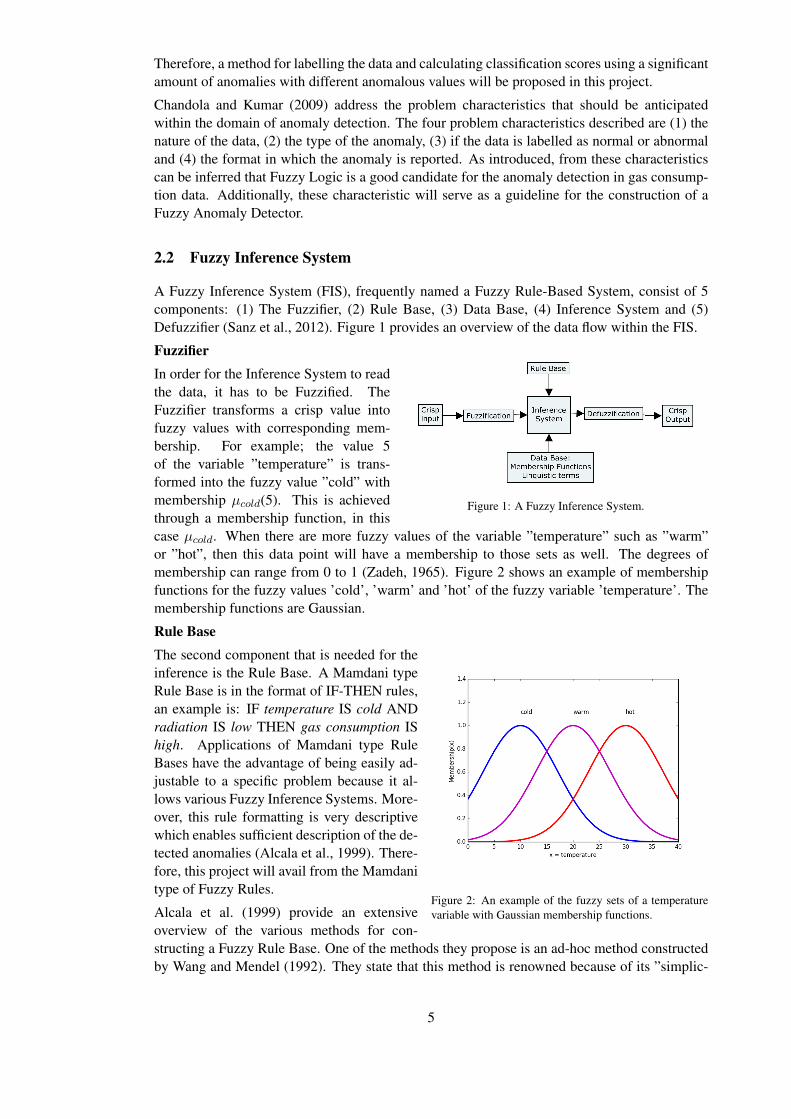
centroid of area calculation is based on the formula provided by Klinkhachorn (2000). Figure 4shows a description and illustration of this calculation. In this project, 1 million is used as thevalue of m.
2.3 Fuzzy Anomaly Detection
Figure 4: Calculation of the centroids of a fuzzy set area based onKlinkhachorn (2000).
As mentioned in the intro-duction, anomaly detection isthe detection of abnormal be-haviour. Alcala et al. (1999)state that ”Fuzzy Rules that areautomatically generated fromdata sets, represent the be-haviour of the system ” (p. 4).In addition, Wijayasekera et al.(2014) address that the strengthwith which a data point firesthe rules, indicates to what ex-tend the data point behaves nor-mally. Hence, instead of us-ing the predicted values, theFuzzy Anomaly Detection sys-tem will use the firing strengthsfor the classification.
The fourth problem character-istic addressed by Chandolaand Kumar (2009) was the for-mat in which the anomaly is re-ported. This refers to Katipamula and Brambley (2005) that address the importance of informa-tion provision of the FDD systems. The linguistic output of the anomaly creates understandingof the cause of the problem and therefore enables action. Wijayasekera et al. (2014) providea framework for this, and have shown that the linguistic output of Fuzzy Anomaly DetectionSystems is valuable.
2.4 Scaling of the system
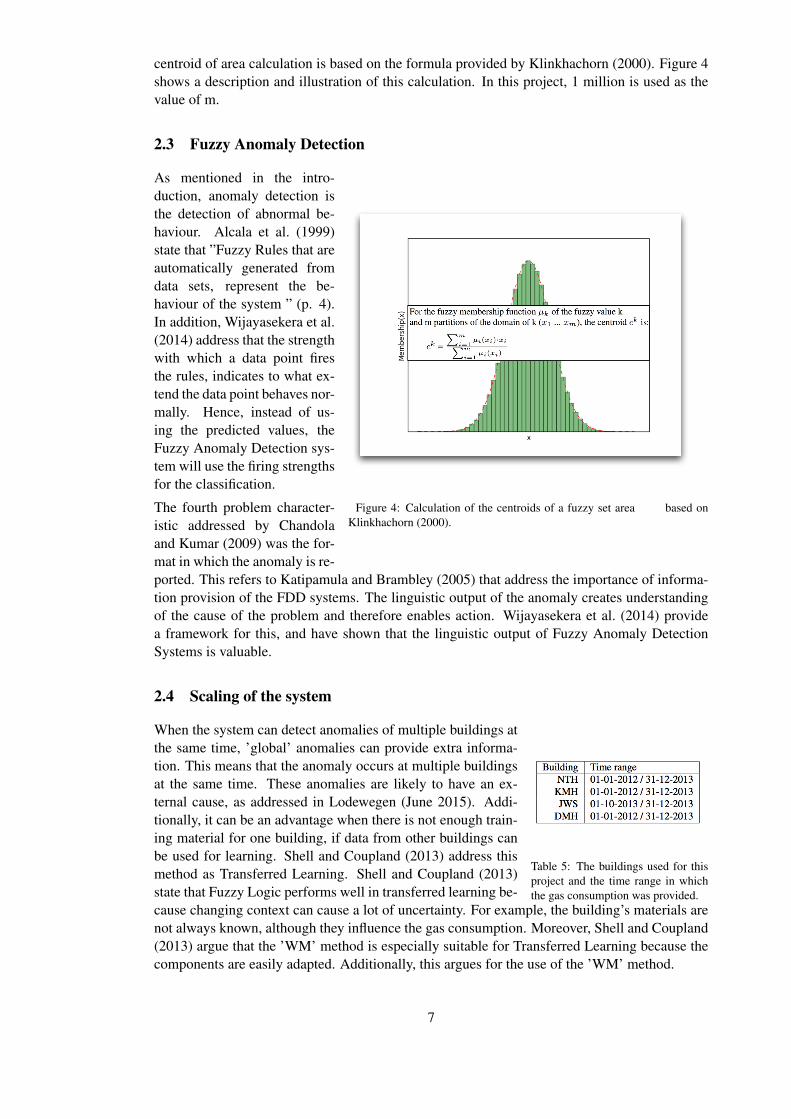
Table 5: The buildings used for thisproject and the time range in whichthe gas consumption was provided.
When the system can detect anomalies of multiple buildings atthe same time, ’global’ anomalies can provide extra informa-tion. This means that the anomaly occurs at multiple buildingsat the same time. These anomalies are likely to have an ex-ternal cause, as addressed in Lodewegen (June 2015). Addi-tionally, it can be an advantage when there is not enough train-ing material for one building, if data from other buildings canbe used for learning. Shell and Coupland (2013) address thismethod as Transferred Learning. Shell and Coupland (2013)state that Fuzzy Logic performs well in transferred learning be-cause changing context can cause a lot of uncertainty. For example, the building’s materials arenot always known, although they influence the gas consumption. Moreover, Shell and Coupland(2013) argue that the ’WM’ method is especially suitable for Transferred Learning because thecomponents are easily adapted. Additionally, this argues for the use of the ’WM’ method.
7
3 Method
The components of the method are (1) The construction and preparation of the data, (2) Theconstruction of a Fuzzy Inference System, (3) Forecasting, (4) The construction of a FuzzyAnomaly Detection Method and (5) the scaling of the system to multiple buildings.
3.1 Data
The data provided for this project is data of the same years and buildings as used in the study ofLodewegen (June 2015). The buildings are 4 educational HvA 1 buildings, the abbreviations andtime frames are displayed in table 5. The data contains gas consumption rates, and additionallyfor the NTH and KMH building the electricity consumption.
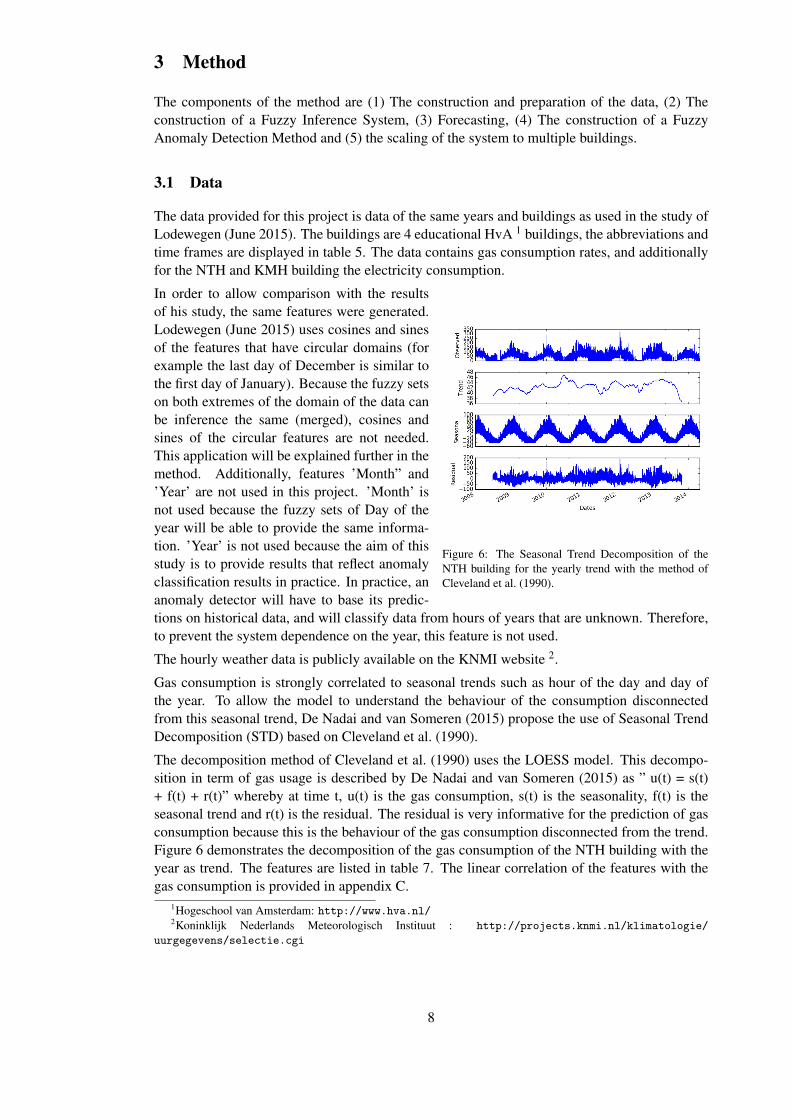
Figure 6: The Seasonal Trend Decomposition of theNTH building for the yearly trend with the method ofCleveland et al. (1990).
In order to allow comparison with the resultsof his study, the same features were generated.Lodewegen (June 2015) uses cosines and sinesof the features that have circular domains (forexample the last day of December is similar tothe first day of January). Because the fuzzy setson both extremes of the domain of the data canbe inference the same (merged), cosines andsines of the circular features are not needed.This application will be explained further in themethod. Additionally, features ’Month” and’Year’ are not used in this project. ’Month’ isnot used because the fuzzy sets of Day of theyear will be able to provide the same informa-tion. ’Year’ is not used because the aim of thisstudy is to provide results that reflect anomalyclassification results in practice. In practice, ananomaly detector will have to base its predic-tions on historical data, and will classify data from hours of years that are unknown. Therefore,to prevent the system dependence on the year, this feature is not used.
The hourly weather data is publicly available on the KNMI website 2.
Gas consumption is strongly correlated to seasonal trends such as hour of the day and day ofthe year. To allow the model to understand the behaviour of the consumption disconnectedfrom this seasonal trend, De Nadai and van Someren (2015) propose the use of Seasonal TrendDecomposition (STD) based on Cleveland et al. (1990).
The decomposition method of Cleveland et al. (1990) uses the LOESS model. This decompo-sition in term of gas usage is described by De Nadai and van Someren (2015) as ” u(t) = s(t)+ f(t) + r(t)” whereby at time t, u(t) is the gas consumption, s(t) is the seasonality, f(t) is theseasonal trend and r(t) is the residual. The residual is very informative for the prediction of gasconsumption because this is the behaviour of the gas consumption disconnected from the trend.Figure 6 demonstrates the decomposition of the gas consumption of the NTH building with theyear as trend. The features are listed in table 7. The linear correlation of the features with thegas consumption is provided in appendix C.
1Hogeschool van Amsterdam: http://www.hva.nl/2Koninklijk Nederlands Meteorologisch Instituut : http://projects.knmi.nl/klimatologie/
uurgegevens/selectie.cgi
8

3.1.1 Data pre-processing
Missing values in the data are handled using linear interpolation and duplicate data points areremoved. In order to allow the system not to learn incorrectly from days that were consideredholidays for the HvA, the week of the day is set to a Sunday for the holidays listed in appendixD.
Table 7: The features used for this project, based on Lodewe-gen (June 2015) and De Nadai and van Someren (2015).
The data is labelled as normal or anomalousby using the 3 sigma rule on the gas con-sumption. The size of the data sets after la-belling is displayed in table 8.
3.2 Constructing the Fuzzy Infer-ence System
The Rule Base and Data Base were gen-erated with the frbs package in R (Rizaet al., 2015);(R Core Team, 2016) using themethod of Wang and Mendel (1992). Thecode used is provided in appendix B1. Theoutput produced in R contains a linguisticand integer version of the Mamdani typeFuzzy Rules, the membership function val-ues and types, and the confidence degree ofthe rules.
Table 8 : The number of data points in the data sets.
In order to be able to influence theinference process, the inferencesystem was implemented outsideof the frbs package scope 3.
This ability of influencing is desir-able because the WM method inthe frbs package only allows thesame number of partitioning set for every feature. However, some features show clearly differ-ent patterns that others (figure 9).
The data in 9a shows that approximately the first 20% and the last 5% of the hours of the dayhave the same values. This represents the night time when educational buildings are not oftenused. The data in 9b shows that approximately the first 50% of the days of the week have thesimilar values. These are the weekdays. The 6th day of the week is low, because it is a weekendday. However, the 7th day of the week shows high values. Lodewegen (June 2015) addressedthat this is because the building management pre-heats the building on Sunday, in order to havegood temperature comfort levels on Monday. The data in 9c shows that approximately the firstand last 5% of the data has similar values, because of the weather, the last day of the year issimilar to the first day of the year.
Based on the plots of the data, fuzzy sets of some features are ”merged”. This means that themaximum membership to one of the merged sets accounts for all those sets. Figure 10 showshow 9 fuzzy set values of Gaussian membership functions of features ”Day of the year” and”Day of the week” will be merged. The figures of the merging for all number of values areprovided in appendix A.
3Python Software Foundation. Python Language Reference, version 3.5.1. Available at http://www.python.org
9
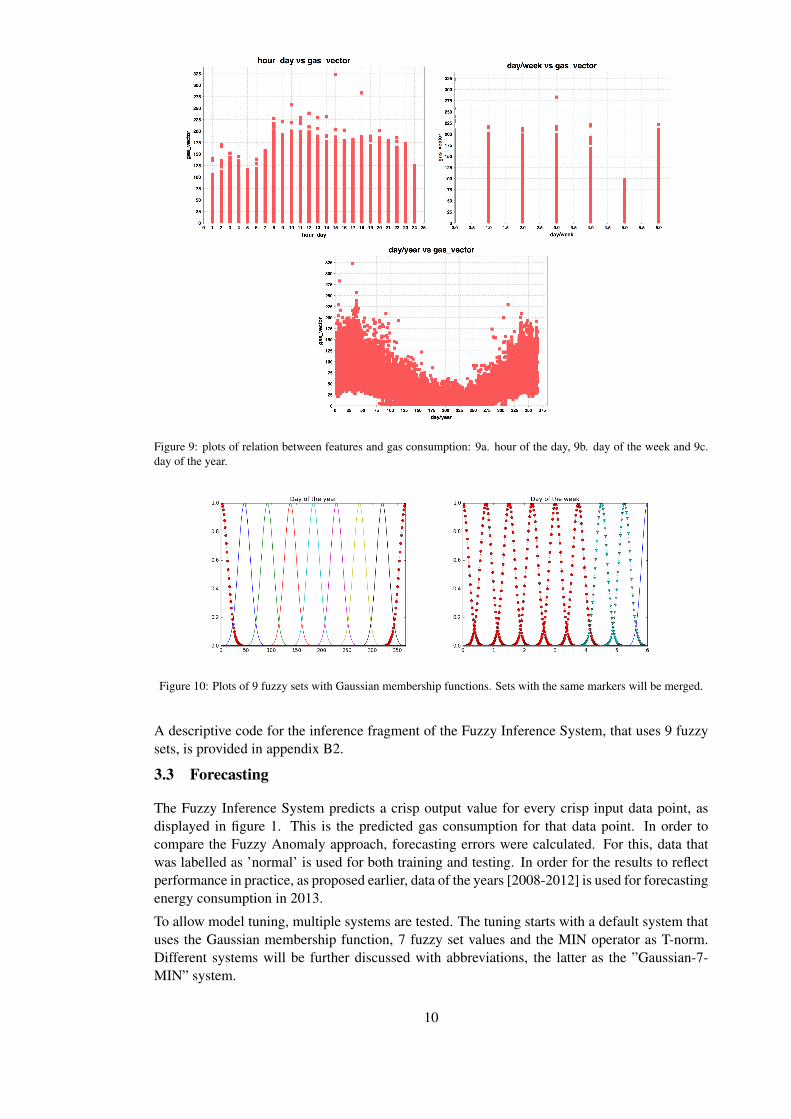
Figure 9: plots of relation between features and gas consumption: 9a. hour of the day, 9b. day of the week and 9c.day of the year.
Figure 10: Plots of 9 fuzzy sets with Gaussian membership functions. Sets with the same markers will be merged.
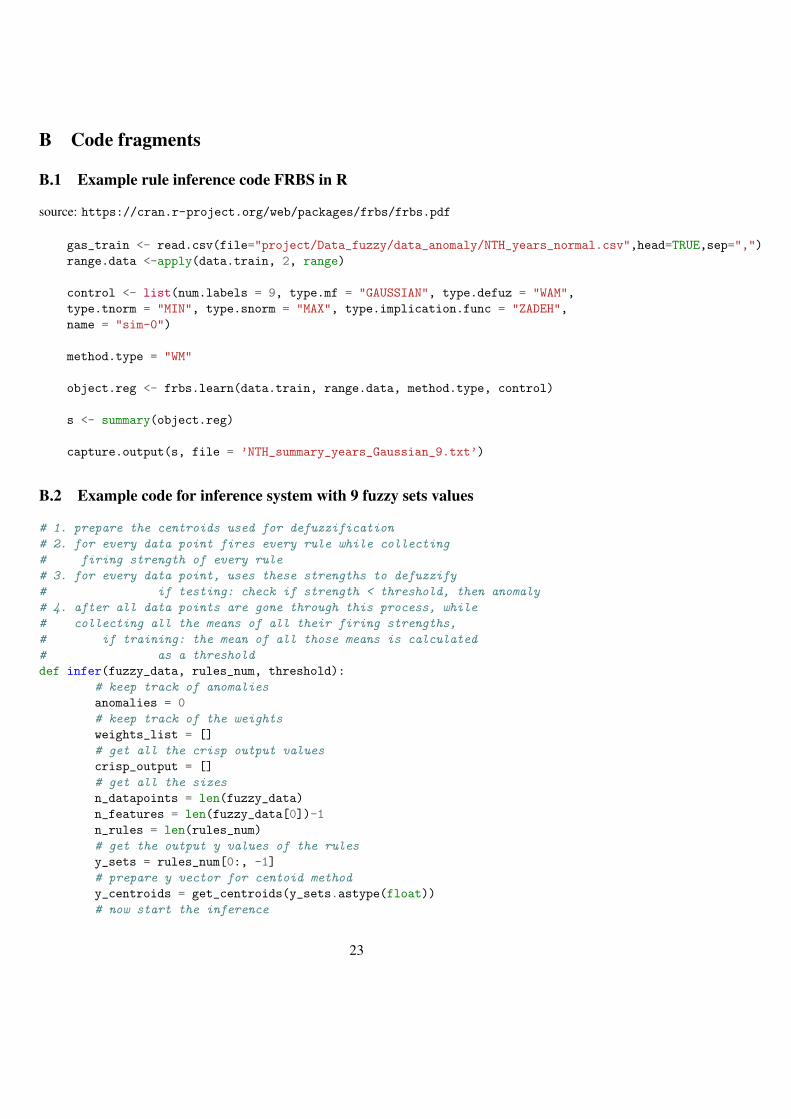
A descriptive code for the inference fragment of the Fuzzy Inference System, that uses 9 fuzzysets, is provided in appendix B2.
3.3 Forecasting
The Fuzzy Inference System predicts a crisp output value for every crisp input data point, asdisplayed in figure 1. This is the predicted gas consumption for that data point. In order tocompare the Fuzzy Anomaly approach, forecasting errors were calculated. For this, data thatwas labelled as ’normal’ is used for both training and testing. In order for the results to reflectperformance in practice, as proposed earlier, data of the years [2008-2012] is used for forecastingenergy consumption in 2013.
To allow model tuning, multiple systems are tested. The tuning starts with a default system thatuses the Gaussian membership function, 7 fuzzy set values and the MIN operator as T-norm.Different systems will be further discussed with abbreviations, the latter as the ”Gaussian-7-MIN” system.
10

Figure 11: Forecasting flow charts: 10a The system is trained on data from [2008-2012] and tested on data from theyear 2013; 10b: The data is divided into train and test set using k-fold cross validation.
Firstly, the membership function is tuned by replacing the Gaussian membership function of thedefault system with a Triangle or Trapezoidal membership function. The membership functionthat gave the lowest errors was used for further tuning. Secondly, the T-norm is tuned by tryingboth the MIN and PROD operator. The best T-norm is used for further tuning. Finally, thenumber of fuzzy set values is tuned trying less and more uneven number of sets until the lowesterror is produced. The order in which the different system characteristics are tuned is arbitrarilychosen. Figure 11a displays the flow chart of the data in this forecasting phase.
The system that performed the best was used for 5-fold-cross validation, using the data of allyears for sub-sampling. Figure 11b displays the flow chart of the data in this validation phase.This allows for comparison with the performance of the ANN developed by Lodewegen (June2015). Moreover, if the year 2013 is by chance relatively easy or hard to predict, this bias is nowruled out. The training sets consists of 80% of the data and the test sets of the remaining 20%.
3.4 Anomaly Classification
In order to bridge the gap between forecasting and anomaly classification results, the samesystems for the system tuning, as appointed in the previous paragraph, are used for anomalyclassification. This will reveal the direct relation between forecasting and classification perfor-mance. For the classification, a threshold is needed that divides the normal data points from theanomalous ones.
As proposed by Wijayasekera et al. (2014), this threshold will be retrieved from the strengths,or so-called weights, with which the anomalous data points fire the rules in the Rule Base. Asillustrated on page 5, these fuzzy weights are produced by the inference system. They reflectthe grade to which the data points behave normally (Wijayasekera et al., 2014). Therefore,the weights of an anomalous data point should be low. Figure 12 demonstrates the differencebetween the weights of the normal and anomalous data points of the NTH building in the years[2008-2012].
11

Figure 12: The difference between the weights of the normal and anomalous data points of the NTH building in theyears [2008-2012]. The mean weights is displayed ans shown as the white line.
Figure 13 contains the pseudo code of the Anomaly Classification process. The 3 phases arethreshold calculation, anomaly classification and calculation of the the scores.
Figure 13: Pseudo code of the Anomaly Classification process
12
3.5 Scaling of the system
To allow application of the system for multiple buildings at the same time, the Fuzzy System istrained with data of all four buildings displayed in table 5.
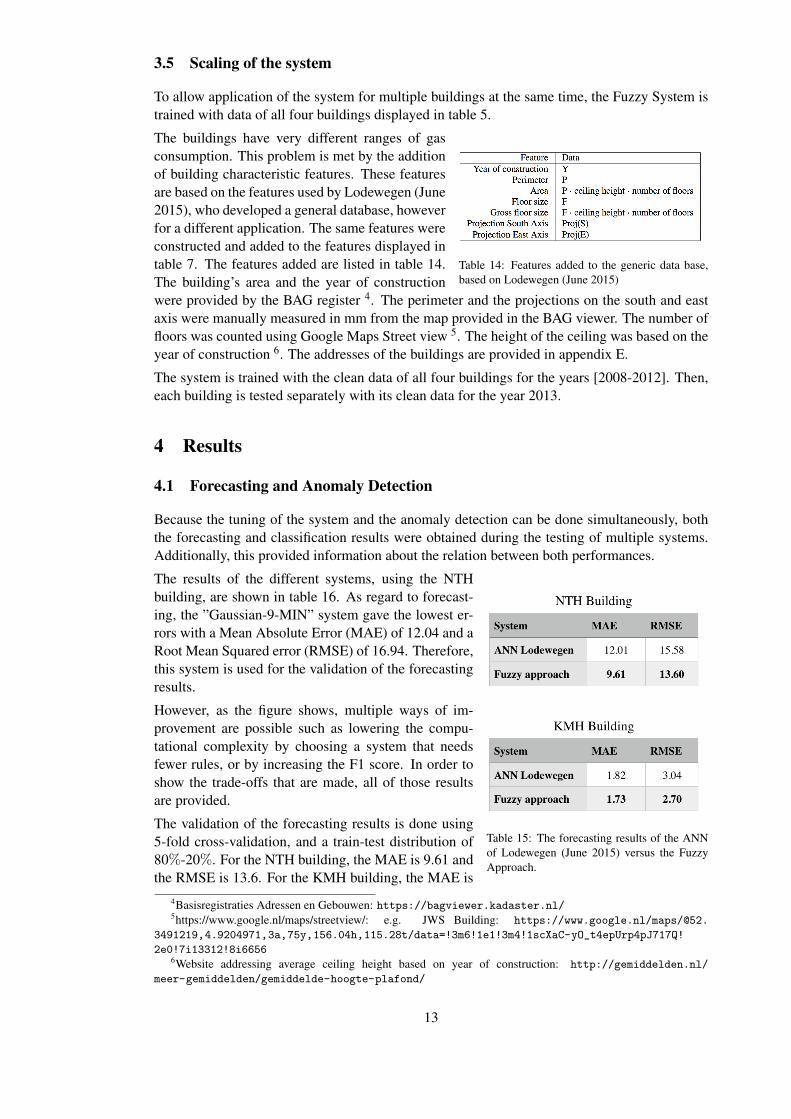
Table 14: Features added to the generic data base,based on Lodewegen (June 2015)
The buildings have very different ranges of gasconsumption. This problem is met by the additionof building characteristic features. These featuresare based on the features used by Lodewegen (June2015), who developed a general database, howeverfor a different application. The same features wereconstructed and added to the features displayed intable 7. The features added are listed in table 14.The building’s area and the year of constructionwere provided by the BAG register 4. The perimeter and the projections on the south and eastaxis were manually measured in mm from the map provided in the BAG viewer. The number offloors was counted using Google Maps Street view 5. The height of the ceiling was based on theyear of construction 6. The addresses of the buildings are provided in appendix E.
The system is trained with the clean data of all four buildings for the years [2008-2012]. Then,each building is tested separately with its clean data for the year 2013.
4 Results
4.1 Forecasting and Anomaly Detection
Because the tuning of the system and the anomaly detection can be done simultaneously, boththe forecasting and classification results were obtained during the testing of multiple systems.Additionally, this provided information about the relation between both performances.
Table 15: The forecasting results of the ANNof Lodewegen (June 2015) versus the FuzzyApproach.
The results of the different systems, using the NTHbuilding, are shown in table 16. As regard to forecast-ing, the ”Gaussian-9-MIN” system gave the lowest er-rors with a Mean Absolute Error (MAE) of 12.04 and aRoot Mean Squared error (RMSE) of 16.94. Therefore,this system is used for the validation of the forecastingresults.
However, as the figure shows, multiple ways of im-provement are possible such as lowering the compu-tational complexity by choosing a system that needsfewer rules, or by increasing the F1 score. In order toshow the trade-offs that are made, all of those resultsare provided.
The validation of the forecasting results is done using5-fold cross-validation, and a train-test distribution of80%-20%. For the NTH building, the MAE is 9.61 andthe RMSE is 13.6. For the KMH building, the MAE is
4Basisregistraties Adressen en Gebouwen: https://bagviewer.kadaster.nl/5https://www.google.nl/maps/streetview/: e.g. JWS Building: https://www.google.nl/maps/@52.
3491219,4.9204971,3a,75y,156.04h,115.28t/data=!3m6!1e1!3m4!1scXaC-yO_t4epUrp4pJ717Q!
2e0!7i13312!8i66566Website addressing average ceiling height based on year of construction: http://gemiddelden.nl/
meer-gemiddelden/gemiddelde-hoogte-plafond/
13

Table 16: The results of different Inference Systems.
1.73 and the RMSE is 2.70. These results are compared with the results of Lodewegen (June2015) in table 15.
4.2 Scaling of the system
Table 17: The results ofgeneric forecasting, using theseparate buildings as test sets.
The system was trained on clean data of all buildings in the years[2008-2012] and tested on the data of separate buildings in the year2013. The results of the testing are shown in table 17. It has beentested if the size of the test set or the range of the gas consumptiondata showed a relation with these results. However, this was not thecase.
5 Evaluation
5.1 Forecasting
Table 18: The results of the T-tests.
In order to be able to test if the validated re-sults are significantly better than the results ofthe ANN of Lodewegen (June 2015), a statis-tical T-test was performed. It is stated thatH0 : µError(ANN) = µError(Fuzzy) and H1 :µError(ANN) 6= µError(Fuzzy). We want thechance that H0 is true to be lower than 0.25%. Thiswould mean that the probability of the mean of the errors of the Fuzzy Approach being equal tothe mean of the errors of the ANN, is significantly small. The T-test of the MAE of the NTHbuilding is as follows:
i The standard deviation (std) of the 5 cross validation results = 0.1432.
ii The degrees of freedom is the number of tests-1 = 4.
14
iii T = µMAE(Fuzzy)�µMAE(ANN)std(Fuzzy) ·
pn = 9.6053�12.01
0.1432 ·p5 = -37.544.
iv When T is negative and kTk > critical value, then H0 is rejected. This ’critical value’ canbe looked up in the Table of critical t values (A. and Finlay, 2009). When you want theprobability of H0 to be lower then 0.25%, then the critical value is 5.598.
v Since kTk = 37.544 > 5.598, H0 is rejected. Hence, the MAE of the NTH building of theFuzzy Approach is significantly lower.
The results of the t-tests are displayed in table 18.
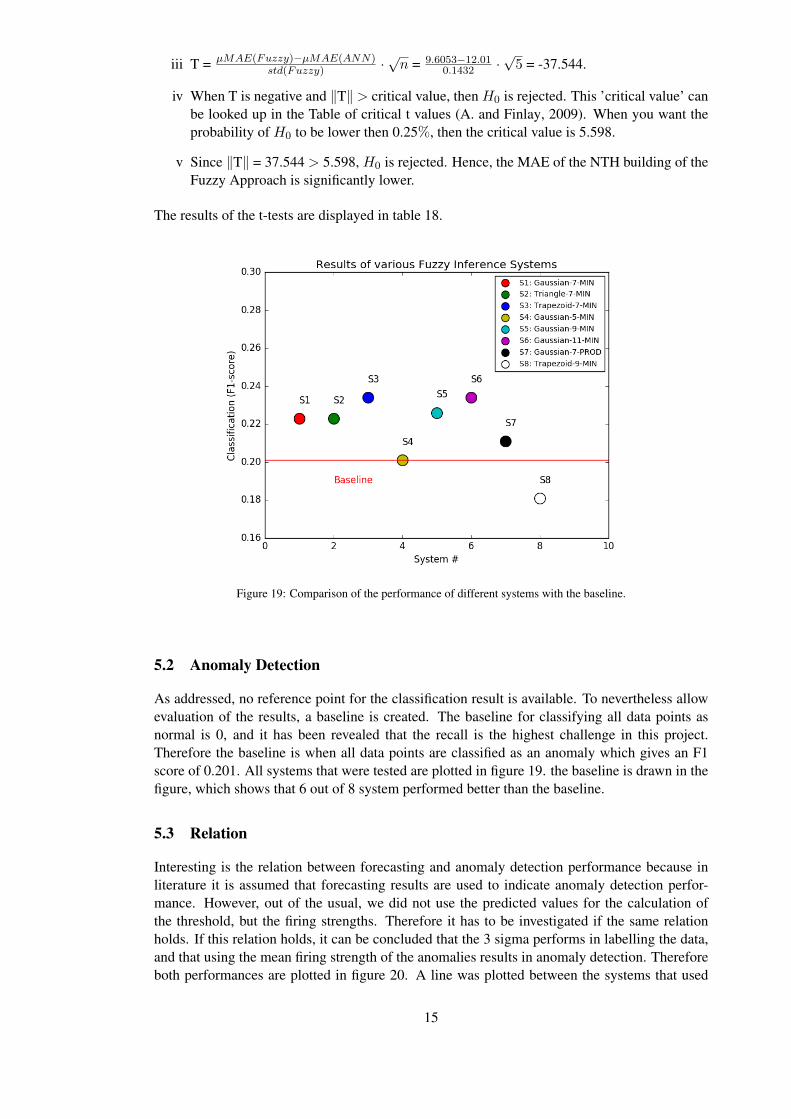
Figure 19: Comparison of the performance of different systems with the baseline.
5.2 Anomaly Detection
As addressed, no reference point for the classification result is available. To nevertheless allowevaluation of the results, a baseline is created. The baseline for classifying all data points asnormal is 0, and it has been revealed that the recall is the highest challenge in this project.Therefore the baseline is when all data points are classified as an anomaly which gives an F1score of 0.201. All systems that were tested are plotted in figure 19. the baseline is drawn in thefigure, which shows that 6 out of 8 system performed better than the baseline.
5.3 Relation
Interesting is the relation between forecasting and anomaly detection performance because inliterature it is assumed that forecasting results are used to indicate anomaly detection perfor-mance. However, out of the usual, we did not use the predicted values for the calculation ofthe threshold, but the firing strengths. Therefore it has to be investigated if the same relationholds. If this relation holds, it can be concluded that the 3 sigma performs in labelling the data,and that using the mean firing strength of the anomalies results in anomaly detection. Thereforeboth performances are plotted in figure 20. A line was plotted between the systems that used
15

the same membership function. This was done because it seems that results show a negativecorrelation between the MAE and the F1 score, but only when a specific memberships functionis used. This would indicate that forecasting and anomaly detection performance are indeedpositive correlated. However, more systems need to be tested in order to validate this.
Figure 20: Plot of the relation between forecasting and anomaly detection results.
5.4 Up scaling the system
The errors of the test sets are very divergent. Although is was expected that this was causedby the range of the data, there was no relation found of this. Also, data was plotted to detectstrange behaviour in some of the building’s, but this was not found. The performance for theNTH building when trained on years [2008-2012] and tested on the year 2013, thus when trainedon sole its own historical data, was a MAE of 16.94 and RMSE of 12.04. When trained on datafrom other buildings as well, the errors are 30.22 respectively 24.46. This is an increment ofapproximately 50%. Additionally, the errors of the other test sets were much higher. Therefore,performance on a larger scale is not achieved.
6 Discussion
The biggest assumption of this paper lies within the 3 sigma rule. Even though the difference infiring strength between the outliers and the normal data shows that the Fuzzy Anomaly Detectordetects the same anomalies as the 3 sigma rule, this can be because the system was trained withdata that has been cleaned using the 3 sigma rule. Therefore we do not know if the Rule Baseindeed represents normal behaviour. The only way to validate this is to have manually labelledthe data.
The number of different Inference System types and the number of different data sets should behigher in order to validate the relation between forecasting and anomaly detection performance.
16
The Data Base created in R provides the certainty degree of the rules. The results for bothforecasting and anomaly detection were obtained when these certainty degrees were used. Thiswas done by weighting the firing strength of a rule by the certainty degree of the rule that is fired.However, this decreased performance significantly and hence this is not used in this project.
No list of the days that were considered holidays by Lodewegen (June 2015) was available.Therefore minor differences in the data of both studies are possible. Additionally, the gas con-sumption of the KMH, DMH and JWS buildings was provided per 5 minutes, while the gasconsumption of the NTH building was provided per 15 minutes. Bot this project, and the projectof Lodewegen (June 2015), predicted the gas consumption per hour. This means that for somebuildings, the gas consumption data was converted from per 5 minutes to per hour. This projectused the sum of all gas consumption of that hour. It is likely that the other studies used the samemethod, although, it is not assured.
7 Conclusion
A Fuzzy Logic method for Anomaly Detection has been developed that is adaptive to the dataand easy to tune for the number of membership functions, number of fuzzy sets and T-norm.The usage of the Wang and Mendel method contributes to this flexibility.
The Fuzzy Inference System is tuned by evaluating the forecasting results in a manner thatreflects real life performance. The best system that was induced from this was used for validationof the forecasting performance, which proved good results. The results were compared with anArtificial Neural Network constructed by Lodewegen (June 2015).
For the NTH building, the MAE is 9.61 and the RMSE is 13.6. For the KMH building, the MAEis 1.73 and the RMSE is 2.70. A statistical T-test with a significance level of 0.25% has revealedthat the forecasting performance of the Fuzzy Inference System is significantly better than theArtificial Neural Network of Lodewegen (June 2015)
An Anomaly Detection method has been investigated that uses the normal behaviour of the rulebase for anomaly detection. The 3 sigma rule was applied for labelling the data, to enable theRule Base to learn from data points that were labelled as normal. Although the 3 sigma is basedon assumptions, the Fuzzy Anomaly Detection system was able to learn the difference betweenthe data that was labelled as normal and the data that was labelled as anomalous.
In order to meet the challenges in the field of anomaly detection, Anomaly Classification resultswere obtained in a critical manner. A baseline for anomaly detection was constructed which hadan F1 score of 0.201. The best F1 score obtained by the Fuzzy Anomaly Detector was 0.234.
Hence, it can be concluded that by benefiting from the transparency of Fuzzy Logic and util-isation of energy consumption data, anomaly detection can be improved using a Fuzzy Logicapproach.
The scalability of the system was investigated. However, results did not induce good perfor-mance on larger scales. More research in this field needs to be conducted.
A bridge between Anomaly Detection and Forecasting has been made and a reference point forobtaining critical results is provided. This results in a demand for further research in this field.
8 Future Work
In this project, one method for constructing a threshold for anomaly detection is proposed. How-ever, more options are to be investigated such as using the predicted values for constructing aconfidence band, or by using the firing strength of the normal data points. The effect on the
17

classification performance would be valuable information.
The Wang and Mendel method used in this project can be improved using the improved versionproposed by Casillas et al. (2000). This ”Cooperative Rule” approach could enhance perfor-mance and time efficiency of the system.
In order to allow utilisation of the approach, a combined system should be implemented toenhance ease of research.
In order to increase the performance of the generic system, more building characteristics needto be explored for the enrichment of the data. Additionally, the cause of the divergence in theresults in this section should be investigated.
De Nadai and van Someren (2015) increase performances of the ANN by creating a Hybridmodel. An Auto-Regressive Integrated Moving Average forecasting method is used for generat-ing features for the ANN. Future work will be to investigate the performance of the Fuzzy Logicapproach by the creation of such a Hybrid system.
18

References
Agresti. A. and B. Finlay. Statistical Methods for the Social Sciences. 4th edition. Chapter 6.Pearson Education International, Upper Saddle River, New Jersey., 2009.
R. Alcala, J. Casillas, O. Cordon, F. Herrera, and S.J.I. Zwir. Techniques for learning and tuningfuzzy rule-based systems for linguistic modeling and their application. In In C. Leondes (Ed.),Knowledge, pages 889–941. Academic Press, 1999.
J. Casillas, O. Cordon, and F. Herrera. Improving the wang and mendel’s fuzzy rule learningmethod by inducing cooperation among rules. Proceedings of the 8th Information Processingand Management of Uncertainty in Knowledge-Based Systems Conference, pages 1682–1688,2000.
V. Chandola and V. Kumar. Anomaly detection: A survey. ACM Computing Surveys, 51:0–58,2009. doi: 10.1145/1541880.1541882.
R. B. Cleveland, W. S. Cleveland, J. E. McRae, and I. Terpenning. Stl: A seasonal-trend decom-position procedure based on loess. Journal of Official Statistics, 6 1:3–73, 1990.
M. De Nadai and M. van Someren. Short-term anomaly detection in gas consumption througharima and artificial neural network forecast. Procs. 2015 ieee workshop on environmental,energy, and structural monitoring systems, pages 250–255, 2015.
S. Katipamula and R.B Brambley. Review article: Methods for fault detection, diagnostics, andprognostics for building systems—a review, part i. HVACR Research, 11:3–25, 2005.
P. Klinkhachorn. Cpe521. fuzzy logic: Defuzzification[pdf]. West Virginia University, ComputerScience and Electrical Engineering, 2000. URL http://www.csee.wvu.edu/classes/
cpe521/presentations/DEFUZZ.pdf.
J. Lodewegen. Saving energy in buildings using an artificial neural network for outlier detection.B.Sc Thesis. University of Amsterdam., June 2015.
ODYSEE. Energy efficiency trends and policies in the netherlands. Brochure,2015a. URL http://www.odyssee-mure.eu/publications/national-reports/
energy-efficiency-netherlands.pdf.
ODYSEE. Energy efficiency trends and policies in the household and ter-tiary sectors: An analysis based on the odyssee and mure databases.Brochure, 2015b. URL http://www.odyssee-mure.eu/publications/br/
energy-efficiency-trends-policies-buildings.pdf.
L. Perez-Lombard, J. Ortiz, and C. Pout. A review on buildings energy consumption information.Energy and Buildings, 40:394–398, 2008.
R Core Team. R: A Language and Environment for Statistical Computing. R Foundation forStatistical Computing, Vienna, Austria, 2016. URL https://www.R-project.org/.
L.S. Riza, C. Bergmeir, F. Herrera, and J.M. Benıtez. frbs: Fuzzy rule-based systems forclassification and regression in R. Journal of Statistical Software, 65(6):1–30, 2015. URLhttp://www.jstatsoft.org/v65/i06/.
A. Rocha, J.P. Papa, and L.A.A. Meira. How far you can get using machine learning black-boxes.Conference on Graphics, Patterns and Images, 16:1530–1834, 2010.
19

F. Sanz, J. Ramırez, and R. Correa. Fuzzy inference systems applied to theanalysis of vibrations in electrical machines, fuzzy inference system - the-ory and applications. 2012. doi: 10.5772/37448. URL http://www.
intechopen.com/books/fuzzy-inference-system-theory-and-applications/
fuzzy-inference-systems-applied-to-the-analysis-of-vibrations-in-electric-machines.
J. Shell and S. Coupland. Fuzzy transfer learning: Methodology and application. InformationSciences, 293:59–79, 2013.
L.X. Wang and J.M. Mendel. Generating fuzzy rules by learning from examples. Systems, Manand Cybernetics, 22 6:1414–1427, 1992.
D. Wijayasekera, O. Linda, M. Manic, and C. Rieger. Mining building energy managementsystem data using fuzzy anomaly detection and linguistic descriptions. IEEE Transactions onIndustrial Informatics, 10:1829–1839, 2014.
L.A. Zadeh. Fuzzy sets. Information and Control, 9:338–353, 1965.
H. Zhao and F. Magoules. A review on the prediction of building energy consumption. Renew-able and Sustainable Energy Reviews, 16:3586–3592, 2012.
20

A Merging of Fuzzy Sets
Merging of Fuzzy Sets with 5 values. Sets marked with dots are merged.
Merging of Fuzzy Sets with 7 values.
21
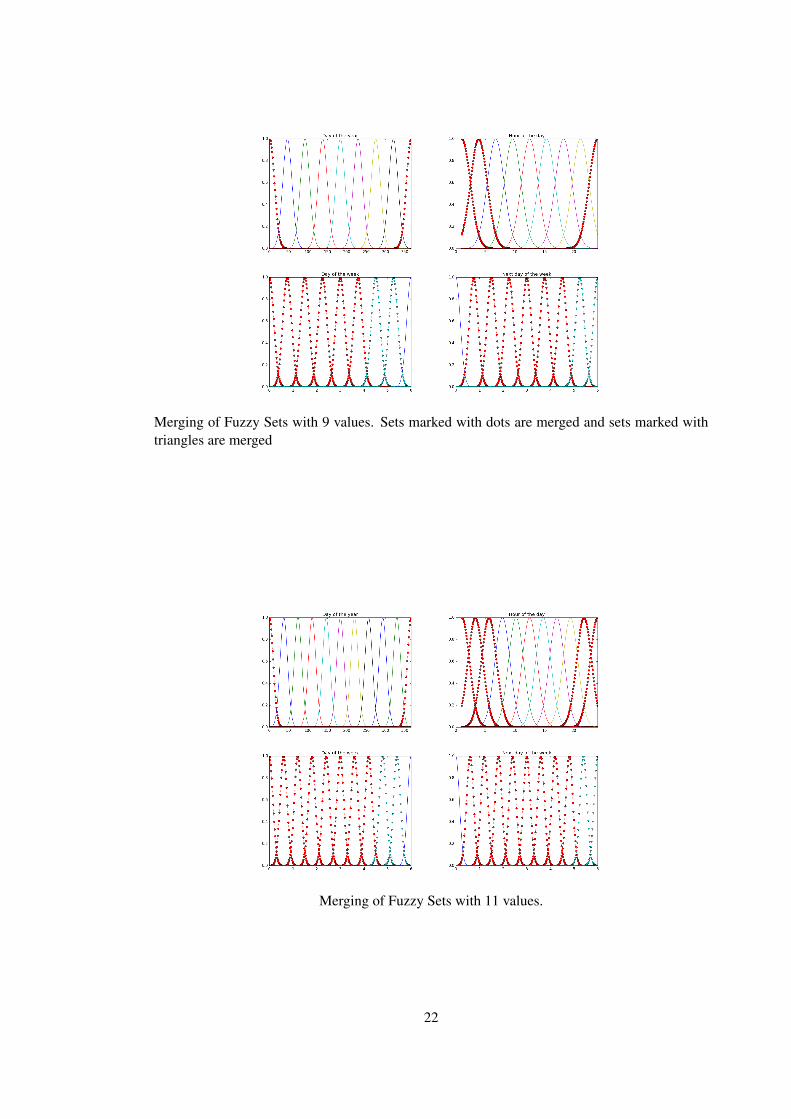
Merging of Fuzzy Sets with 9 values. Sets marked with dots are merged and sets marked withtriangles are merged
Merging of Fuzzy Sets with 11 values.
22
B Code fragments
B.1 Example rule inference code FRBS in R
source: https://cran.r-project.org/web/packages/frbs/frbs.pdf
gas_train <- read.csv(file="project/Data_fuzzy/data_anomaly/NTH_years_normal.csv",head=TRUE,sep=",")
range.data <-apply(data.train, 2, range)
control <- list(num.labels = 9, type.mf = "GAUSSIAN", type.defuz = "WAM",
type.tnorm = "MIN", type.snorm = "MAX", type.implication.func = "ZADEH",
name = "sim-0")
method.type = "WM"
object.reg <- frbs.learn(data.train, range.data, method.type, control)
s <- summary(object.reg)
capture.output(s, file = ’NTH_summary_years_Gaussian_9.txt’)
B.2 Example code for inference system with 9 fuzzy sets values
# 1. prepare the centroids used for defuzzification
# 2. for every data point fires every rule while collecting
# firing strength of every rule
# 3. for every data point, uses these strengths to defuzzify
# if testing: check if strength < threshold, then anomaly
# 4. after all data points are gone through this process, while
# collecting all the means of all their firing strengths,
# if training: the mean of all those means is calculated
# as a threshold
def infer(fuzzy_data, rules_num, threshold):
# keep track of anomalies
anomalies = 0
# keep track of the weights
weights_list = []
# get all the crisp output values
crisp_output = []
# get all the sizes
n_datapoints = len(fuzzy_data)
n_features = len(fuzzy_data[0])-1
n_rules = len(rules_num)
# get the output y values of the rules
y_sets = rules_num[0:, -1]
# prepare y vector for centoid method
y_centroids = get_centroids(y_sets.astype(float))
# now start the inference
23

# for every data point
for i in range(n_datapoints):
# get the data point
data_point = fuzzy_data[i]
# fire every rule
# and get all the rule weights
strengths = []
for j in range(n_rules):
# initialize firing strength
strength = 1.0
rule = rules_num[j]
#get feature of datapoint
for k in range(n_features):
feature = data_point[k]
# get corresponding set value
set_value = rule[k]
# get intitial membership values
membership = feature[set_value-1]
# merge winters (days of the year)
if k == 4:
if set_value == 1 or set_value == 9:
membership = np.max([feature[0], feature[8]])
# merge day 1,2, 3 and 4 of the week = weekday
elif k == 3:
if set_value < 6:
membership = np.max([feature[0], feature[1], feature[2],
feature[3],feature[4],feature[5]])
elif set_value == 7 or set_value == 8:
membership = np.max([feature[6], feature[7]])
# merge day 2,3, 4 and 5 of the next day of we ek = weekday
elif k == 11:
if set_value < 7 and set_value > 1:
membership = np.max([feature[1],feature[2], feature[3],
feature[4], feature[5]])
elif set_value == 8 or set_value == 9:
membership = np.max([feature[7], feature[8]])
# merge the nights together (hour of the day)
elif k == 8:
if set_value < 3 or set_value == 9:
membership = np.max([feature[0], feature[1], feature[8]])
# update rule strength using min operator
strength = min(strength,membership)
# collect this strength to list with all rule strengths
strengths.append(strength)
# after firing of all the rules, collect mean strength of the data point
weights_list.append(np.mean(strengths))
# check if the data point is an anomaly
if(np.mean(strengths)) < threshold:
24

anomalies = anomalies +1
# defuzziefy using the pre calculated centroids
crisp = defuzziefy(strengths, y_centroids)
# collect crisp output
crisp_output.append(crisp)
# if training: save weights in csv file so that threshold can be calculated
# and weights can be plotted
pd.DataFrame(weights_list).to_csv(’weights_outliers.csv’, delimiter=’,’)
# return the predicted values and the number of anomalies
return crisp_output, anomalies
25
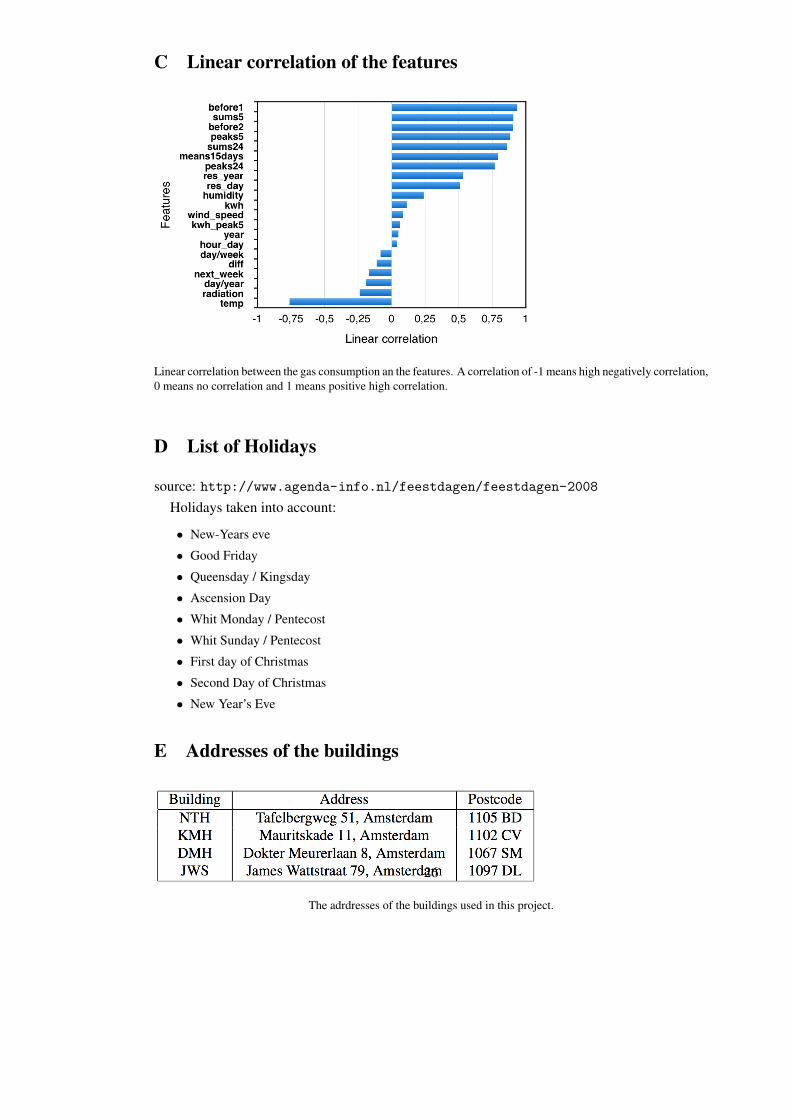
C Linear correlation of the features
Linear correlation between the gas consumption an the features. A correlation of -1 means high negatively correlation,0 means no correlation and 1 means positive high correlation.
D List of Holidays
source: http://www.agenda-info.nl/feestdagen/feestdagen-2008Holidays taken into account:
• New-Years eve
• Good Friday
• Queensday / Kingsday
• Ascension Day
• Whit Monday / Pentecost
• Whit Sunday / Pentecost
• First day of Christmas
• Second Day of Christmas
• New Year’s Eve
E Addresses of the buildings
The adrdresses of the buildings used in this project.
26