a fuzzy logic stock trading system based on technical analysis
TRANSCRIPT

Regis UniversityePublications at Regis University
All Regis University Theses
Summer 2011
A Fuzzy Logic Stock Trading System Based OnTechnical AnalysisSammy ZeigenbeinRegis University
Follow this and additional works at: https://epublications.regis.edu/theses
Part of the Computer Sciences Commons
This Thesis - Open Access is brought to you for free and open access by ePublications at Regis University. It has been accepted for inclusion in All RegisUniversity Theses by an authorized administrator of ePublications at Regis University. For more information, please contact [email protected].
Recommended CitationZeigenbein, Sammy, "A Fuzzy Logic Stock Trading System Based On Technical Analysis" (2011). All Regis University Theses. 474.https://epublications.regis.edu/theses/474

Regis University College for Professional Studies Graduate Programs
Final Project/Thesis
Disclaimer
Use of the materials available in the Regis University Thesis Collection (“Collection”) is limited and restricted to those users who agree to comply with the following terms of use. Regis University reserves the right to deny access to the Collection to any person who violates these terms of use or who seeks to or does alter, avoid or supersede the functional conditions, restrictions and limitations of the Collection. The site may be used only for lawful purposes. The user is solely responsible for knowing and adhering to any and all applicable laws, rules, and regulations relating or pertaining to use of the Collection. All content in this Collection is owned by and subject to the exclusive control of Regis University and the authors of the materials. It is available only for research purposes and may not be used in violation of copyright laws or for unlawful purposes. The materials may not be downloaded in whole or in part without permission of the copyright holder or as otherwise authorized in the “fair use” standards of the U.S. copyright laws and regulations.

A FUZZY LOGIC STOCK TRADING SYSTEM
BASED ON TECHNICAL ANALYSIS
A THESIS
SUBMITTED ON 16TH OF JUNE, 2011
TO THE DEPARTMENT OF INFORMATION SYSTEMS
OF THE SCHOOL OF COMPUTER & INFORMATION SCIENCES
OF REGIS UNIVERSITY
IN PARTIAL FULFILLMENT OF THE REQUIREMENTS OF MASTER OF
SCIENCE IN SOFTWARE ENGINEERING AND DATABASE TECHNOLOGIES
APPROVALS
Richard Blumenthal, Thesis Advisor
Donald J. Ina, Faculty of Record
Nancy Birkenheuer

A FUZZY LOGIC STOCK TRADING SYSTEM ii
Abstract
Technical analysis of financial markets involves analyzing past price movements in order to
identify favorable trading opportunities. The objective of this research was to demonstrate that a
fuzzy logic stock trading system based on technical analysis can assist average traders in
becoming successful by optimizing the use of technical indicators and trading rules that experts
use to identify when to buy and sell stock. Research of relevant literature explored the current
state of knowledge in methodologies for developing and validating trading systems using
technical indicators and fuzzy logic trading systems, providing guidelines for the development
and evaluation of the system. Evaluation of the system confirmed that fuzzy logic can have a
positive contribution to a successful trading system, and that once a successful trading system
has been developed and verified an average trader can be successful by simply following the
trading system’s buy and sell signals. The trader need not be an expert at interpreting the
underlying technical indicators or react to price movements emotionally. The trading decisions
are made by the trading system, so the only decision that the average trader need make is
whether there is enough confidence in the system to commit real money in live trading.
Suggestions for future research include improvements in accuracy and flexibility, and
investigation of additional trading models and filters.

A FUZZY LOGIC STOCK TRADING SYSTEM iii
Acknowledgements
I would like to express sincere gratitude to my wife Manja for her love, support, patience,
understanding, and encouragement.
I would especially like to thank my thesis advisor Rick Blumenthal for his editorial
feedback, direction, advice, and motivation.
I would like to thank Don Ina for his professional guidance and supervision throughout
the thesis process.
I would like to express appreciation to Nancy Birkenheuer for her always responsive
support and assistance with academic and administration issues.
I would like to thank the faculty of Regis University and the National University of
Ireland, Galway for their high-quality instruction.

Table of Contents
Abstract ........................................................................................................................................... ii Acknowledgements ........................................................................................................................ iii
Table of Contents ........................................................................................................................... iv List of Figures ................................................................................................................................ vi List of Tables .................................................................................................................................. 2 Chapter 1 – Introduction ................................................................................................................. 3 Chapter 2 – Review of Literature and Research ............................................................................. 6
2.1 Introduction ........................................................................................................................... 6 2.2 Technical analysis ................................................................................................................. 6
2.2.1 Chart analysis ................................................................................................................. 7 2.2.2 Technical indicators ..................................................................................................... 10
2.2.2.1 Trend-following indicators ................................................................................... 11 2.2.2.2 Momentum indicators ........................................................................................... 12
2.2.2.3 Moving averages ................................................................................................... 13 2.2.2.4 Moving average convergence divergence ............................................................. 16
2.2.2.5 Directional movement indicator and average directional movement index ......... 17 2.2.2.6 Price channel breakout .......................................................................................... 18 2.2.2.7 Stochastic .............................................................................................................. 19
2.2.2.8 Relative strength index ......................................................................................... 20 2.2.2.9 Momentum and rate of change ............................................................................. 21
2.2.2.10 Bollinger bands ................................................................................................... 22 2.2.2.11 On-balance-volume ............................................................................................. 23
2.3 Trading system development .............................................................................................. 24
2.3.1 Trading strategies ......................................................................................................... 25
2.3.1.1 Investment timing models ..................................................................................... 26 2.3.1.2 Trend-following strategies .................................................................................... 27 2.3.1.3 Counter-trend strategies ........................................................................................ 30
2.3.1.4 Entries and exits .................................................................................................... 31 2.3.1.5 Combining technical indicators ............................................................................ 33
2.3.1.6 Data sets ................................................................................................................ 33 2.3.2 Optimization ................................................................................................................ 34
2.3.3 Testing, evaluation, & analysis .................................................................................... 37 2.4 Fuzzy logic .......................................................................................................................... 40
2.4.1 Fuzzy sets ..................................................................................................................... 40 2.4.2 Fuzzy systems .............................................................................................................. 42
2.4.3 Fuzzy applications ....................................................................................................... 49 2.5 Fuzzy logic trading ............................................................................................................. 53 2.6 Conclusions ......................................................................................................................... 58
Chapter 3 – Methodology ............................................................................................................. 60 3.1 Introduction ......................................................................................................................... 60 3.2 Trading system development .............................................................................................. 60
3.2.1 Data management......................................................................................................... 62 3.2.2 Technical indicators ..................................................................................................... 62 3.2.3 Trading models ............................................................................................................ 63

A FUZZY LOGIC STOCK TRADING SYSTEM v
3.2.3.1 Fuzzy model membership functions ..................................................................... 66
3.2.4 Trading strategies ......................................................................................................... 72 3.2.5 Trading simulation ....................................................................................................... 73 3.2.6 Strategy optimization ................................................................................................... 76
3.3 Trading system evaluation .................................................................................................. 81 3.3.1 Data collection methodology ....................................................................................... 81 3.3.2 Evaluation methodology .............................................................................................. 83
3.3.2.1 Evaluation example ............................................................................................... 84 Chapter 4 – Project Analysis and Results ..................................................................................... 88
4.1 Data collected...................................................................................................................... 88 4.2 Optimized portfolio strategies............................................................................................. 88 4.3 Test set profit summaries .................................................................................................... 89
4.3.1 Test set 401 profit summaries ...................................................................................... 90
4.3.2 Test set 411 profit summaries ...................................................................................... 90 4.3.3 Test set 441 profit summaries ...................................................................................... 91
4.3.4 Test set 801 profit summaries ...................................................................................... 92 4.3.5 Test set 811 profit summaries ...................................................................................... 93
4.4 Successful portfolios ........................................................................................................... 94 Chapter 5 – Conclusions ............................................................................................................... 96
5.1 Research findings ................................................................................................................ 96
5.2 Lessons learned ................................................................................................................... 96 5.3 Limitations .......................................................................................................................... 97
5.4 Future research .................................................................................................................... 98 References ................................................................................................................................... 100 Annotated Bibliography .............................................................................................................. 104

List of Figures
Figure 1 - Intel stock chart .............................................................................................................. 7 Figure 2 - Chart bars ....................................................................................................................... 8
Figure 3 - Bearish flag .................................................................................................................... 9 Figure 4 - Inverted head and shoulders ......................................................................................... 10 Figure 5 - DJIA 15-month simple moving average ...................................................................... 14 Figure 6 - Whirlpool MACD ........................................................................................................ 16 Figure 7 - S&P 500 stock index ADX .......................................................................................... 18
Figure 8 - IBM fast breakout system trends.................................................................................. 19 Figure 9 - Treasury bonds 1600 14-week stochastic .................................................................... 20 Figure 10 - S&P 100 stock index RSI ........................................................................................... 21 Figure 11 - Treasury bonds 40-day momentum ............................................................................ 22
Figure 12 - Dow industrials Bollinger bands ................................................................................ 23 Figure 13 - S&P 500 index OBV .................................................................................................. 24
Figure 14 - Water temperature membership functions ................................................................. 41 Figure 15 - Levels of logic supporting approximate reasoning .................................................... 42
Figure 16 - Car cruise controller fuzzy functions ......................................................................... 44 Figure 17 - Car cruise controller fuzzy output functions .............................................................. 45 Figure 18 - Standard membership functions ................................................................................. 47
Figure 19 - Comparing Tall and very Tall at 5 ½ feet .................................................................. 48 Figure 20 - Fuzzy logic controller ................................................................................................ 49
Figure 21 - New product pricing model ........................................................................................ 50 Figure 22 - Neural network with fuzzy pre-processor .................................................................. 52 Figure 23 - Fuzzy categories for Federal Reserve policy based on discount rate......................... 53
Figure 24 - System block diagram ................................................................................................ 61
Figure 25 - Membership functions for Fuzzy Threshold input variables ..................................... 67 Figure 26 - Membership functions for Overbought/Oversold input variables ............................. 70 Figure 27 - Membership functions for Signal output variable ...................................................... 71
Figure 28 - Trading model ............................................................................................................ 72 Figure 29 - Trading strategy ......................................................................................................... 73
Figure 30 - Trading simulation, control tab .................................................................................. 74 Figure 31 - Trading simulation, data tab ....................................................................................... 75
Figure 32 - Trading simulation, graph tab .................................................................................... 76 Figure 33 - Strategy optimizer, control tab ................................................................................... 77 Figure 34 - Strategy optimizer, data tab ........................................................................................ 78 Figure 35 - Genetic optimizer fitness example, Epoch vs. Fitness ............................................... 80
Figure 36 - Create strategy test set ................................................................................................ 81 Figure 37 - Example strategy test set ............................................................................................ 82

A FUZZY LOGIC STOCK TRADING SYSTEM 2
List of Tables
Table 1 - Technical indicator classification .................................................................................. 33 Table 2 - Comparison of defuzzification methods ........................................................................ 46
Table 3 - Fuzzy linguistic hedges and their approximate meanings ............................................. 48 Table 4 – Development and evaluation methodology .................................................................. 60 Table 5 - Trading model parameter and rule default values ......................................................... 63 Table 6 - Data set naming convention .......................................................................................... 84 Table 7 - Example portfolio stock strategy selection based on highest efficiency factor............. 85
Table 8 - Example portfolio stock strategy evaluations................................................................ 86 Table 9 - Example walk-forward strategy test set evaluation summary ....................................... 86 Table 10 - Example DIA & SPY strategy selections based on highest efficiency factor ............. 87 Table 11 - Data collection hours ................................................................................................... 88
Table 12 - Test set portfolio strategies summary .......................................................................... 88 Table 13 - Test set 401 profit summaries ...................................................................................... 90
Table 14 - Test set 411 profit summaries ...................................................................................... 91 Table 15 - Test set 441 profit summaries ...................................................................................... 91
Table 16 - Test set 801 profit summaries ...................................................................................... 92 Table 17 - Test set 811 profit summaries ...................................................................................... 93 Table 18 - Successful portfolios ................................................................................................... 95

A FUZZY LOGIC STOCK TRADING SYSTEM 3
Chapter 1 – Introduction
Technical analysis of financial markets involves analyzing past price movements in order
to identify favorable trading opportunities. Traders commonly use a variety of technical
indicators (Schwager, 1999, p. 110) to make buying and selling decisions. A technical indicator
is a mathematical formula that calculates a series of price based data points that represent a
pattern over some period of time. A technical indicator usually has a set of corresponding trading
rules based on trigger conditions that signal a buy, sell, or hold bias for each data point.
Many regard technical analysis as more of an art than a science. There are hundreds of
technical indicators. Interpretation of signal trigger conditions can be subjective. Some indicators
work better than others, consistently signaling the best times to buy and sell. It is usually
advisable to use multiple indicators in combination to provide a more balanced approach for a
variety of trading conditions. Expert traders are skilled at interpreting the various technical
indicators and applying trading rules, while average traders can find it difficult to duplicate the
success of experts due to the complexity involved (Colby & Meyers, 1988, pp. iii, 17; Edwards
& Magee, 1992, pp. 12, 345-348; Murphy, 1999, pp. 11, 17; Schwager, 1999, pp. 7-16).
Emotions are the cause of many common errors that traders make including overtrading,
buying too early, and selling too late. A mechanical trading system can help traders avoid many
common errors by eliminating emotion from trading. A mechanical trading system can reduce
the complexity of trading by implementing a consistent trading strategy, providing trading
signals based on technical analysis of a stock’s current trading conditions (Schwager, 1999, p.
227-228).
There has been considerable research on using fuzzy logic techniques for trading
(Ahmad, Gayar, & Elazim, 2006; Cheung & Kaymak, 2007; Doeksen, Abraham, Thomas, &

A FUZZY LOGIC STOCK TRADING SYSTEM 4
Paprzycki, 2005; Dourra & Siy, 2002; Gamil, El-fouly, & Darwish, 2007; Ghandar,
Michalewicz, Schmidt, To, & Zurbrugg, 2009; Khcherem & Bouri, 2009; Li & Yang, 2008;
Zhou & Dong, 2004). A number of trading systems have been developed that make use of fuzzy
logic techniques. Scribner Software’s (2010) TekView Explorer software uses fuzzy logic to
create and back-test trading strategies. VonAltrock (1997, pp. 211-220) used the fuzzyTECH
software to create a fuzzy logic stock analysis system that incorporated technical chart analysis
to make buy and sell decisions.
This research seeks to demonstrate that a fuzzy logic trading system based on technical
analysis can assist traders in becoming successful by optimizing the use of technical indicators
and trading rules that expert traders use when trading stock, thereby reducing the complexity for
average traders. The resulting trading system will be a valuable tool that average traders can use
to successfully trade stocks even though they may not necessarily be expert traders.
The objective of this research is to develop a stock trading system that uses fuzzy logic to
identify when to buy or sell a stock based on technical analysis. The resulting system will then be
evaluated to determine if its use can assist traders in becoming successful at trading stocks.
This research will contribute to the fields of technical analysis and software engineering
by providing a detailed account of the analysis and development of such a system. The proposed
system is essentially a solution to the problem of time series analysis (Murphy, 1999, pp. 18-19)
as applied to stock prices. The system could serve as a basis for evaluating solutions to other
time series analysis problems, by adapting it for use with other data sets and developing
prediction models for specific problem domains.
Chapter 2 outlines the research and review of relevant literature; i.e. basic principles of
technical analysis of financial markets, using technical indicators to make trading decisions,

A FUZZY LOGIC STOCK TRADING SYSTEM 5
methodologies for developing and validating trading systems, basic elements of fuzzy logic, and
using fuzzy logic in trading systems.
Chapter 3 explains the methodology used to carry out the research, developing and
evaluating a fuzzy logic stock trading system based on technical analysis, guided by the current
state of knowledge provided by the literature review outlined in chapter 2.
Chapter 4 presents analysis and results achieved from the research data collected, and
discusses insights and observations relevant to the project.
Chapter 5 provides interpretation of the data as it relates to the research objective and
presents the research findings, lessons learned, limitations and shortcomings identified, and the
need for further research.

A FUZZY LOGIC STOCK TRADING SYSTEM 6
Chapter 2 – Review of Literature and Research
2.1 Introduction
The design of a fuzzy logic stock trading system based on technical analysis integrates
concepts of technical analysis of financial markets with elements of fuzzy logic from the
artificial intelligence field. Technical indicators used to make trading decisions form the
foundation of the system along with the methodologies for developing and validating trading
systems. Fuzzy logic principles enhance the trading decision logic of the system with fuzzy
versions of traditional technical indicators.
2.2 Technical analysis
Technical analysis of financial markets involves analyzing past price movements in order
to identify favorable trading opportunities. One of the primary tools of technical analysis is the
chart which displays price, and usually volume, in a simple time series graph as illustrated in
Figure 1. A trader that uses technical analysis is often referred to as a technician or chart analyst.
In the commodity and financial markets, it is estimated that for about one third to seventy
percent of the time, prices tend to trade in a sideways or range-bound pattern. When not range-
bound, prices tend to display powerful and sustainable trends, offering traders low risk and high
reward opportunities. Since market trends offer the best profit opportunities, the objective of
chart interpretation is to identify price patterns that indicate significant trends and impending
trend changes. Trend refers to the general direction the market is moving. Markets, however, do
not move in a straight line. They move in a series of zigzags that resemble a series of waves with
peaks and troughs. The direction of those peaks and troughs constitute the market trend. An
uptrend is defined by a succession of higher highs and higher lows, where each relative high is
higher than the preceding high and each relative low is higher than the preceding low. Price

A FUZZY LOGIC STOCK TRADING SYSTEM 7
dropping below a previous low serves as a warning or clue that the uptrend may be ending.
Similarly, a downtrend is defined by a succession of lower lows and lower highs. Price breaking
above a previous high signals a possible end to the downtrend. A flat, horizontal, sideways, or
trendless market movement reflects a relative balance in price action, and is commonly referred
to as a trading range (Colby & Meyers, 1988, p. 5; Murphy, 1999, pp. 42,49-51; Schwager,
1999, p. 33; Weissman, 2005, pp. 10-11).
Figure 1 - Intel stock chart (Murphy, 1999, p. 42)
2.2.1 Chart analysis
Market technicians analyze patterns in price charts to gauge whether the price is trending
up or down, in a trading range, or breaking to the up or down side. Charts typically display price
on the upper portion of the graph and other data such as volume on the lower portion of the
graph. A common format for the price graph displays bars (Renz, 2004, pp. 40-42; Schwager,
1999, pp. 17-19) that indicate the price open, high, low, and close values, as shown in Figure 2.
Each bar represents one data point in time, such as daily, weekly, or monthly.

A FUZZY LOGIC STOCK TRADING SYSTEM 8
Figure 2 - Chart bars (Renz, 2004, p. 41)
An example chart pattern is the bearish flag formation (Renz, 2004, pp. 58-59) shown in
Figure 3 that starts with an uninterrupted down trend followed by a trading range lasting for
some period of time. The horizontal support and resistance lines can slope up or down slightly
but are usually roughly parallel. Price breaking below support with a corresponding surge in
volume usually indicates that the down trend is about to resume.

A FUZZY LOGIC STOCK TRADING SYSTEM 9
Figure 3 - Bearish flag (Renz, 2004, p. 59)
The inverted head and shoulders pattern, as shown in Figure 4, is a bottoming formation
that can present a buying opportunity. Price breaking above the neckline with high volume
signals a turnaround in the trend, and an opportunity to buy at the start of the new uptrend
(Edwards & Magee, 1992, pp. 80-84; Renz, 2004, pp. 75-77).

A FUZZY LOGIC STOCK TRADING SYSTEM 10
Figure 4 - Inverted head and shoulders (Renz, 2004, p. 77)
2.2.2 Technical indicators
The application of technical analysis based on chart analysis depends on individual
interpretation. Without clearly defined rules, technical analysis procedures are subject to
different interpretations and applications and thus cannot be utilized unambiguously by different
people (Colby & Meyers, 1988, p. 12; Schwager, 1999, p. 14).
Traders frequently supplement chart analysis with a variety of statistical calculations,
called technical indicators, to evaluate price activity and make buying and selling decisions
(Colby & Meyers, 1988, p. 5; Schwager, 1999, p. 110). A technical indicator is a mathematical
formula that calculates a series of price based data points that represent a pattern over some
period of time. A technical indicator usually has a set of corresponding trading rules based on
trigger conditions that signal a buy, sell, or hold bias for each data point. For example, the
moving average is a widely used technical indicator calculated by taking the average of the price
over a certain number of the most recent time periods (Murphy, 1999, pp. 195-198). A stock

A FUZZY LOGIC STOCK TRADING SYSTEM 11
price moving above its 30 day moving average might trigger a buy signal and price moving
below its 30 day moving average might trigger a sell signal.
Mathematical technical indicators usually fall into one of two categories, trend-following
indicators and mean reversion or counter-trend indicators. Trend-following indicators such as
moving averages profit when prices trend either up or down for a relatively long period of time.
Mean reversion indicators such as momentum oscillators capitalize on prices becoming
overextended followed by reversion back to the mean (Weissman, 2005, pp. 16-17).
The following includes discussions of just a few technical indicators commonly
referenced in the literature. A more complete reference for these and many more technical
indicators can be found in Achelis (2001, pp. 45-373), Colby & Meyers (1988, pp. 61-572), and
Murphy (1999, pp. 195-263), where each indicator is explained along with its interpretation,
calculation, and examples.
2.2.2.1 Trend-following indicators
Trend following indicators, such as moving averages, are lagging indicators. They work
very well during significant price trends, providing good low risk profit opportunity in major
trends. They do not predict future price changes; they simply indicate what the most recent price
trend is. The buy and sell signals that they generate always occur late. They do not generate
signals until after a trend has been established. The trader will always miss the first part of a
price move and may surrender significant portions of profit before an opposite signal is given
when the trend reverses. The tradeoff of sensitivity will determine how fast signals are generated.
Less data included in the calculation of the indicator increase sensitivity and generate faster
signals, resulting in quicker response to trend reversals and tend to maximize profit on valid
signals but also generate more false signals (Achelis, 2001, p. 33; Schwager, 1999, p. 229).

A FUZZY LOGIC STOCK TRADING SYSTEM 12
2.2.2.2 Momentum indicators
A central concept in technical analysis is momentum which represents the rate of change
of price, or price velocity, and is a leading indicator of a change in trend direction. Typically a
major market cycle starts a new uptrend with very high and rising momentum. The positive price
velocity gradually tapers off until the price reaches its peak. This is referred to as bullish
exhaustion (Colby & Meyers, 1988, p. 5).
Price based momentum indicators (also called oscillators) represent the rate of change of
price movement by performing some calculations on past price data over some period time, the
look-back period, and comparing the current price with the price data over the look-back period.
It is important to note that momentum indicators represent momentum trends, not price trends.
Momentum and price do not always trend together, they may diverge. For example, a momentum
indicator may make a bearish reversal and decline even though the price continues to trend
higher but at a slower rate of change. Since momentum reversals do not always coincide with a
corresponding price reversal, one should not assume a price reversal when momentum reverses
(Miner, 2009, p. 11).
As market trends weaken, prices can become choppy and move sideways for several
weeks or months, and trend-following indicators become less useful. Momentum oscillators can
be very useful when prices are trading sideways in a trading range. Some momentum indicators
have zones of extreme high and low values that can give signals in advance of an actual top or
bottom. The zones are usually partitioned at high and low cut-off points to identify overbought,
oversold, and neutral regions. They can generate trading signals when price becomes
overextended in the overbought or oversold zones, when the oscillator is in an overbought or
oversold zone and diverges from price, or when the oscillator crosses the zero (midpoint) line.

A FUZZY LOGIC STOCK TRADING SYSTEM 13
Momentum indicator signals are usually used as prerequisite conditions in combination with
other indicators to provide a confirmation of bullish, bearish, or neutral mode. Oscillator signals
work best when traded in the direction of the underlying market trend (Colby & Meyers, 1988, p.
15-16; Murphy, 1999, pp. 225-251).
Miner (2009, pp. 12-47) advocates a momentum strategy using two time frames, where
trading signals are generated in the direction of the larger time frame momentum, if not in the
overbought or oversold region, following a smaller time frame momentum reversal. Most
common momentum indicators can be used for this strategy such as stochastic (Stoch), relative
strength index (RSI), and moving average convergence divergence (MACD).
2.2.2.3 Moving averages
The moving average is one of the most versatile and widely used technical indicators, and
is commonly used as the basis for trend following systems. The moving average is calculated by
taking the average of the price over a certain number of the most recent time periods. The closing
price is most commonly used to calculate moving averages. The moving average is a trend
follower, its purpose is to signal when an old trend has ended or a new trend has begun, and track
the progress of the current trend (Murphy, 1999, pp. 195-198).
Moving averages can be used to determine the general direction or trend of a market
based on its recent price movement. Moving averages represent smoothed price series data over
a period of time, making trends and meaningful turning points more obvious. Longer-term
investors typically use the 200-day moving average, buying when price moves above the 200-
day moving average and selling when price moves below the 200-day moving average. This
simple method is also commonly used to complement other confirming technical indicators
(Colby & Meyers, 1988, pp. 14-15; Renz, 2004, p. 92).

A FUZZY LOGIC STOCK TRADING SYSTEM 14
Of the many variations of moving averages, the simple moving average is the most
widely used and easiest to calculate because it gives equal weighting to each data point within
the data set. The moving average generates trading signals when the price crosses the moving
average, a buy signal when price crosses above the moving average and a sell signal when the
price moves below the moving average. The problem with longer-term moving averages is that
they lag price changes making them slow to respond to changing trends. Shorter-term moving
averages have quicker response but can generate more false signals. The linear weighted moving
average and exponential moving average can reduce lag by giving a larger weighing factor to
more recent data (Murphy, 1999, pp. 199-202; Weissman, 2005, p. 18).
Figure 5 illustrates a 15-month simple moving average of the Dow Jones Industrial
Average (DJIA) over about a 30 year period, from1970 through late 1999. Buy signals are shown
with up-arrows when the price crosses above the moving average and sell signals are shown with
down-arrows when the price crosses below the moving average (Achelis, 2001, pp. 203-204).
Figure 5 - DJIA 15-month simple moving average (Achelis, 2001, p. 204)

A FUZZY LOGIC STOCK TRADING SYSTEM 15
One method to try to avoid moving average false signals is to wait a certain period of
time after a signal is given before acting on the signal (Weissman, 2005, p. 19). For example, a
buy signal might be generated when price moves above the moving average for three consecutive
days.
Another popular method to filter out moving average false signals is to require a certain
amount of penetration beyond the moving average, usually referred to as moving average
envelopes. The envelopes are offset above and below the moving average by a certain amount
(Weissman, 2005, p. 21). For example, a sell signal might be generated when price moves below
the moving average by three percent. Envelopes can also be used as a countertrend indicator by
viewing the penetration beyond the envelope as an indication that the market has overextended
with the expectation that it will eventually revert back toward the moving average (Murphy,
1999, p. 207; Weissman, 2005, p. 21).
Comparing two moving averages works especially when you may not have other
technical clues, such as for rounding tops and bottoms (Renz, 2004, p. 93). The two moving
average crossover method generates a signal when a shorter moving average crosses a longer-
term moving average. For example, a buy signal might be generated when the 10-day moving
average crosses above the 20-day moving average. The three moving average crossover requires
three moving averages to be aligned before a signal is generated. For example, in order to
generate a buy signal, the 5-day moving average must cross above a 10-day moving average, and
the 10-day moving average must cross above the 20-day moving average. Common time periods
for the three moving average crossover method include 5-10-20-day and 4-9-18-day time periods
(Murphy, 1999, pp. 203-206; Weissman, 2005, pp. 23-24).
A FUZZY LOGIC STOCK TRADING SYSTEM 16
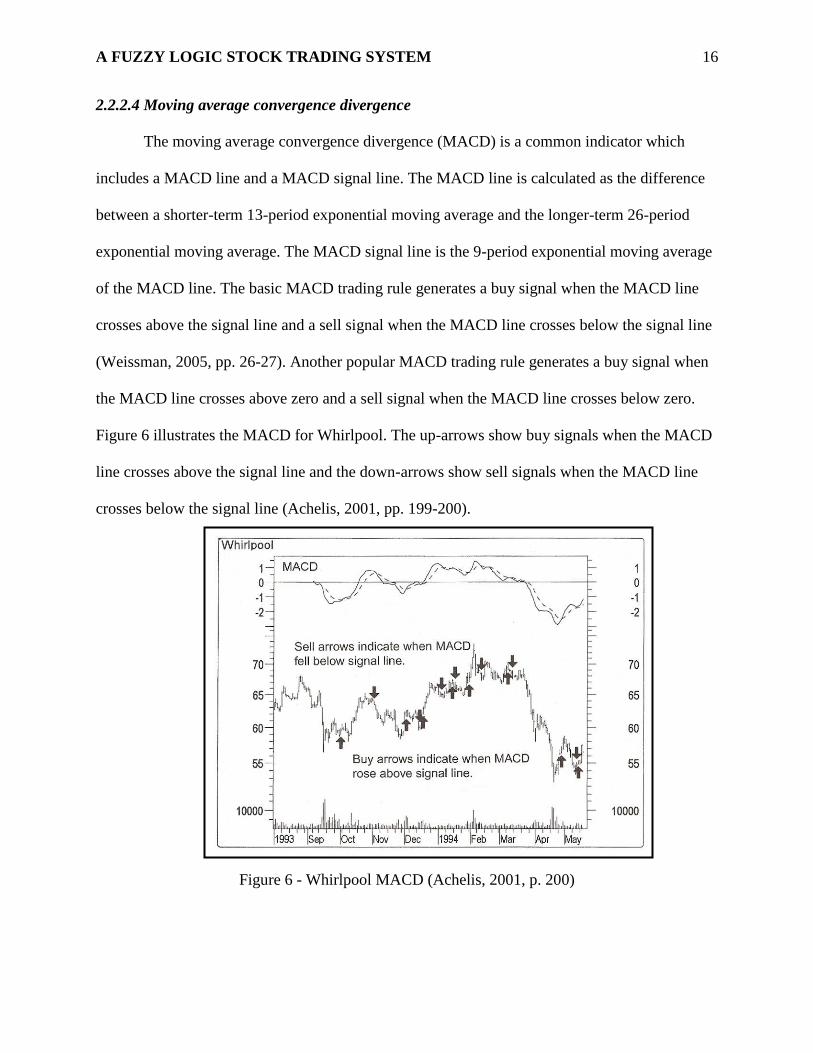
2.2.2.4 Moving average convergence divergence
The moving average convergence divergence (MACD) is a common indicator which
includes a MACD line and a MACD signal line. The MACD line is calculated as the difference
between a shorter-term 13-period exponential moving average and the longer-term 26-period
exponential moving average. The MACD signal line is the 9-period exponential moving average
of the MACD line. The basic MACD trading rule generates a buy signal when the MACD line
crosses above the signal line and a sell signal when the MACD line crosses below the signal line
(Weissman, 2005, pp. 26-27). Another popular MACD trading rule generates a buy signal when
the MACD line crosses above zero and a sell signal when the MACD line crosses below zero.
Figure 6 illustrates the MACD for Whirlpool. The up-arrows show buy signals when the MACD
line crosses above the signal line and the down-arrows show sell signals when the MACD line
crosses below the signal line (Achelis, 2001, pp. 199-200).
Figure 6 - Whirlpool MACD (Achelis, 2001, p. 200)

A FUZZY LOGIC STOCK TRADING SYSTEM 17
2.2.2.5 Directional movement indicator and average directional movement index
The directional movement indicator (DMI) attempts to measure market strength and
direction. It uses each period’s net directional movement, which is the largest part of a period’s
range that is outside the previous period’s range. There are separate calculations for positive
movement (+DI) and negative movement (-DI). When +DI is greater than -DI, the market is
trending higher and when –DI is greater than +DI, the market is trending lower. A buy signal is
generated when the DMI crosses above the zero line and a sell signal when the DMI crosses
below the zero line. The average direction movement index (ADX), plotted on a 0-100 scale, and
is an index of the relative strength of the trend, measuring the degree of directional movement. It
is derived by applying a 9-period smoothing of the result of dividing the difference between the
absolute value of +DI and DI by the sum of +DI and DI. A rising ADX line means the market is
trending and a falling ADX line indicates a non-trending market. Figure 7 illustrates the ADX for
the S&P 500 Stock Index. The ADX falling from above 40 (down-arrow) indicates the beginning
of a sideways trading range and the ADX rising from below 20 (up-arrow) indicates continuation
of the trend (Murphy, 1999, pp. 384-387; Weissman, 2005, pp. 27-28).

A FUZZY LOGIC STOCK TRADING SYSTEM 18
Figure 7 - S&P 500 stock index ADX (Murphy, 1999, p. 384)
2.2.2.6 Price channel breakout
The channel breakout is a simple trend following trading system that generates signals
when a trend is already established. Trading signals are generated when the price exceeds the
highest high or lowest low of the past n periods (Weissman, 2005, p. 30). Figure 8 illustrates a
fast breakout system for IBM where n=7 days. Up-arrows show buy signals when price breaks to
the up side and down-arrows show sell signals when price breaks to the down side. The signals
occur early at the beginning of major trends, but many false signals occur when price action
moves sideways. A slower breakout system where n=40 would reduce false signals but signal
later at the start of major trends (Schwager, 1999, pp. 234-237).

A FUZZY LOGIC STOCK TRADING SYSTEM 19
Figure 8 - IBM fast breakout system trends (Schwager, 1999, p. 235)
2.2.2.7 Stochastic
The Stochastic oscillator is based on the observation that prices usually close toward their
upper range during up-trends and toward their lower range during down-trends. It is plotted on a
0 to 100 percent scale and measures where the closing price is in relation to the total price range
for a certain period of time. A high reading means price is closer to the top of the range and a
low reading means price is closer to the bottom of the range. The stochastic oscillator provides
trading signals based on prices reaching these temporarily unsustainable overbought or oversold
extremes. Stochastic comes in two versions, fast stochastic and the more popular slow stochastic,
with lines called %K and %D charted on a 0 to 100 scale. Trading signals are generated when the
faster %K line crosses the slower %D line in an overbought or oversold region. Usually, the
overbought region is between 70 and 80, and the oversold region is between 30 and 20. Figure 9
illustrates a 14-week stochastic of Treasury Bonds. A buy signal (up-arrow) occurs when %K
crosses above %D in the oversold zone (below 20), and a sell signal (down-arrow) occurs when

A FUZZY LOGIC STOCK TRADING SYSTEM 20
%K crosses below %D in the overbought zone (above 80) (Murphy, 1999, pp. 246-249;
Weissman, 2005, p. 32).
Figure 9 - Treasury bonds 1600 14-week stochastic (Murphy, 1999, p. 248)
2.2.2.8 Relative strength index
The relative strength index (RSI) is a very popular oscillator that is plotted on a 0 to 100
scale, with overbought boundary typically set at 70 and oversold boundary set at 30. A buy
signal is generated when the RSI extends below the oversold boundary and then rises above that
lower boundary. A sell signal is generated when the RSI extends above the overbought boundary
and then falls below that upper boundary. The most popular time periods for the RSI are the 9-
day and 14-day versions, although 5, 7, 21, and 28-day versions are used as well. The time
period determines the amount of smoothing of the RSI line. The relative strength is calculated as:
RS = (average of x-days’ up closes) / (average of x-days’ down closes) where x is the time
period, shorter time periods resulting in more RSI volatility. The RSI is then calculated as: RSI =
100 – (100 / (1+RS)). Figure 10 illustrates a 14-day RSI for the S&P 100 Stock Index where the
RSI dipping below and then rising back above the oversold level of 30 generates a buy signal. A

A FUZZY LOGIC STOCK TRADING SYSTEM 21
sell signal is generated when the RSI peaks above and then drops below the overbought level of
70 (Murphy, 1999, pp. 239-246; Weissman, 2005, p. 33).
Figure 10 - S&P 100 stock index RSI (Murphy, 1999, p. 241)
2.2.2.9 Momentum and rate of change
The momentum indicator is an oscillator that subtracts price n periods ago from the
current price, where 10 periods is the most common time period used. A buy signal is generated
when momentum crosses above zero and a sell signal is generated when momentum crosses
below zero. Except for the calculation, the rate of change (ROC) indicator is very similar to
momentum, providing the same signal triggers. The ROC is calculated by dividing the current
price by the price n periods ago. Figure 11 illustrates a 40-day momentum for Treasury Bonds. A
buy signal occurs when the momentum crosses above the zero line and a sell signal occurs when
the momentum line crosses below the zero line. The moving average can be used to confirm the
momentum signals (Murphy, 1999, pp. 228-234; Weissman, 2005, pp. 34-35).

A FUZZY LOGIC STOCK TRADING SYSTEM 22
Figure 11 - Treasury bonds 40-day momentum (Murphy, 1999, p. 232)
2.2.2.10 Bollinger bands
Bollinger bands are constructed by calculating the standard deviation of price over some
period of time, typically 20 time periods, and then adding and subtracting two standard
deviations to a 20-period simple moving average. By using two standard deviations, 95-97% of
the price data will be contained within the upper and lower price bands. Bollinger bands expand
during high price volatility and can indicate that the current trend may be ending when the bands
are unusually far apart. Bollinger bands contract during low price volatility and can indicate that
a new trend may be starting. Price extending beyond the upper or lower band usually indicates an
unsustainable extreme. When used as a counter trend indicator, price crossing above the upper
band generates a sell signal and price crossing below the lower band generates a buy signal, as
illustrated in the Dow industrials Bollinger bands of Figure 12. Bollinger bands work best in
combination with overbought/oversold oscillators (Murphy, 1999, pp. 209-211; Weissman, 2005,
pp. 36-37).

A FUZZY LOGIC STOCK TRADING SYSTEM 23
Figure 12 - Dow industrials Bollinger bands (Murphy, 1999, p. 210)
2.2.2.11 On-balance-volume
The on-balance-volume (OBV) indicator incorporates a measure of market psychology
and participation in a trend by weighing price action with its volume. The OBV can confirm the
quality of the current price trend by moving in the same direction as price or warn of an
impending reversal by diverging from the price action. The OBV above its long-term moving
average indicates an up-trend and the OBV below its long-term moving average indicates a
down-trend. Figure 13 illustrates the S&P 500 Index, OBV, and their 200-day moving averages.
The OBV fell below its 200-day moving average in mid-1998 as its moving average started to
flatten out even though the S&P 500 Index continued to go higher. This divergence was a
warning of an impending price reversal that developed about a year later (Murphy, 1999, pp.
165-166; Stridsman, 2001, pp. 229-230,263).

A FUZZY LOGIC STOCK TRADING SYSTEM 24
Figure 13 - S&P 500 index OBV (Stridsman, 2001, p.230)
2.3 Trading system development
Technical analysis can be divided into two distinct areas. Chart analysis as outlined in
section 2.2.1 is subject to the visual interpretation of historical price patterns. Chart reading is
largely an art, and success mostly depends on the skill of the individual chartist. Although very

A FUZZY LOGIC STOCK TRADING SYSTEM 25
useful and powerful, the validity of chart interpretation cannot be objectively quantified and
statistically verified, severely limiting its use as a basis for mechanical trading systems. The
statistical analyst quantifies these subjective principals to incorporate them into mechanical
trading systems. Mathematical technical indicators as outlined in section 2.2.2 provide objective
technical analysis because the buy and sell signals they generate are based on objective and
immutable rules making them well suited for mechanical trading systems by removing the
subjective human element in trading (Murphy, 1999, p. 11; Weissman, 2005, p. 4).
2.3.1 Trading strategies
Many regard technical analysis as more of an art than a science. There are hundreds of
technical indicators. Interpretation of signal trigger conditions can be subjective. Some indicators
work better than others, consistently signaling the best times to buy and sell (Colby & Meyers,
1988, p. iii; Murphy, 1999, pp. 11, 17; Schwager, 1999, pp. 7-16).
Emotions are the cause of many common errors that traders make including overtrading,
buying too early, and selling too late. A mechanical trading system can help traders avoid many
common errors by eliminating emotion from trading. A mechanical trading system can be a
useful tool to reduce the complexity of trading based on technical analysis by implementing a
consistent trading strategy that provides signals based on technical analysis of a stock’s current
trading conditions. System design should concentrate on entry and exit timing for trades. It is
usually advisable to use multiple indicators in combination to provide a more balanced approach
for a variety of trading conditions. Categories used to classify trading systems include trend-
following and counter-trend approaches. Each has its advantages and disadvantages depending
on market conditions, so a combined approach can be incorporated into a trading strategy in
order to take advantage of different market conditions (Schwager, 1999, pp. 226-252).

A FUZZY LOGIC STOCK TRADING SYSTEM 26
Trend following systems typically have a lower percentage of winning trades, but the
winning trades tend to be very profitable and losing trades tend to experience small losses. Since
prices are range-bound more often than they trend, counter trend systems typically have a higher
percentage of winning trades than trend-following systems. However, with smaller profits on
winning trades and larger losses on loosing trades, their profit to loss ratios and overall
performance are often inferior (Weissman, 2005, pp. 50,73).
2.3.1.1 Investment timing models
A trading system is made up of a set of trading rules that are used to generate trading
signals and a set of parameters that can be varied to determine the timing of the trading signals.
A trading rule can also include a filter, such as time delay, to provide confirmation before
generating a signal. It is usually best to limit system rules and parameters to a minimum as long
as it doesn’t degrade system performance (Schwager, 1999, pp. 255-256).
In order to achieve consistently good performance, an investment timing model needs an
effective discipline that goes with trends and avoids significant losses. There is virtually no limit
to the number of trading systems that can be devised based on a variety of source data and
trading rules. A precise set of trading rules to deal with all kinds of market behavior should be
developed and tested leaving no room for doubt, uncertainty, or confusion. It should tightly
control investment risks while allowing maximum profits to accumulate. It must effectively
handle risk and reward trade-offs in all kinds of market conditions. Although using the 200-day
moving average or the 13-week momentum time frame is common, different markets have
different cyclical characteristics. Using computers, market technicians can construct timing
models with short-term and long-term attributes that match the cycles of the market. Testing a

A FUZZY LOGIC STOCK TRADING SYSTEM 27
wide range of time frames can determine which moving average or momentum time frame is
best (Colby & Meyers, 1988, pp. 4-17).
A common theme in the literature is that trend-following systems work well in trending
markets and not so well in non-trending markets. Conversely, counter-trend or mean reversion
systems work best in non-trending markets and not so well in trending markets. A reasonable
trading approach then would be to use trend-following trading models when the market is
trending and counter-trend trading models in non-trending markets, filtered by an indicator that
signals whether the market is trending or not. Although results vary, directional movement index
(DMI), average direction movement index (ADX), and long-term (200-day) moving averages are
often cited as indicators that can provide such trending signals (Katz & McCormick, 2000, pp.
85,102-103,131; Murphy, 1999, pp. 384-387,390; Ruggiero, 1997, pp. 48,59,78-80,215,263;
Stridsman, 2001, pp. 70,234,241-242,250-253; Weissman, 2005, pp. 27-29,56-58).
2.3.1.2 Trend-following strategies
Trend-following strategies typically involve some variation of moving averages or
breakout models. Moving averages capitalize on the assumption that, once established, a trend
will continue. The underlying concept of breakout systems is the ability of a market to move to
new highs or lows indicating the potential for continuation of the trend in the direction of the
breakout (Katz & McCormick, 2000, pp. 74-75; Schwager, 1999, pp. 228-234).
There are a variety of moving average calculations including simple moving averages,
exponential moving averages, and front-weighted triangular moving averages. Moving averages
provide a very simple means of smoothing the normal short term price fluctuations so that price
trends are easier to distinguish. Moving averages work well when price is trending, but not so
well when in non-trending markets where price action is choppy or moving sideways. In non-

A FUZZY LOGIC STOCK TRADING SYSTEM 28
trending markets, price can cross a moving average often producing buy and sell signals in rapid
succession, so the trader never knows which penetration is the one preceding either the renewal
of a trend or confirmation of a reversal. A trend-following model can use moving averages to
trigger a buy signal when price crosses above the moving average, and a sell signal when the
price crosses below the moving average. However, moving averages always lag the
corresponding transitions in price which tend to trigger signals late resulting in the early portion
of new trends being missed. Shorter-term moving averages are more sensitive than longer-term
moving averages. Using raw price crossing the moving average can sometimes cause spurious
signals due to normal price variations, resulting in high trading costs due to frequent trading.
This problem can be reduced by using two moving averages with different time periods. A buy
signal is triggered when the faster moving average crosses above the slower moving average, and
a sell signal is triggered when the faster moving average crosses below the slower moving
average. Another approach is to use a filter that confirms the trend, such as price moving past the
moving average by a certain amount, or for a certain number of time periods (Edwards & Magee,
1992, pp. 484-487; Katz & McCormick, 2000, pp. 109-131; Schwager, 1999, pp. 45-50,229-
234).
The most simple trend filter is a long-term moving average, such as the 200-day moving
average, where trading only in the direction of the long-term moving average significantly
improves results. The directional slope method can work better in prolonged trends than the
moving average crossover technique because it can reduce the number of false signals, and can
use less data and more up-to-date data. When the moving average directional slope changes from
one day to the next, an up move triggers a buy signal and a down move triggers a sell signal.
Another moving average crossover method can trigger a buy signal when the faster moving

A FUZZY LOGIC STOCK TRADING SYSTEM 29
average crosses above the slower moving average, and a sell signal is triggered when the price
crosses below the faster moving average, resulting in a quicker exit. A similar technique can be
applied to the directional slope method, by triggering a buy signal on the up move of the slower
moving average and a sell signal on the down move of the faster moving average (Stridsman,
2001, pp. 70, 87,228).
Breakouts models trigger a buy signal when the price breaks above an upper band or
threshold level, and a sell signal when the price breaks below a lower band or threshold level.
The primary difference in breakout models is how the band or threshold levels are calculated.
Channel breakout models can use threshold levels based on the highest highs and lowest lows for
the last n-periods of data, where the value chosen for n will determine the sensitivity of the
system and how fast or slow it will respond to price breakouts. Channel breakout threshold levels
can also be based on price volatility, where the bands expand as volatility increases and contract
when volatility decreases. Placement of the threshold levels will determine how effective a
breakout model will be. The bands should be placed such that they signal a breakout into a new
major trend but do not trigger false signals on normal price volatility during non-trending
sideways price movement. If the bands are too wide, a breakout model will trigger a signal late
and may miss a significant portion of a trend. If the bands are set too narrow, a breakout model
will trigger frequent signals, resulting in higher trading costs due to a large number of trades but
little profit. The look-back period used to calculate the upper and lower threshold levels can be
different, which can improve the system during flat or neutral markets in times of consolidation.
In order to reduce false breakout signals, a breakout model can use a trending indicator to filter
breakout signals, such as the Directional Movement Index (DMI) which indicates if prices are
trending or not. If prices are trending, the breakout signals are used to make trades. If prices are

A FUZZY LOGIC STOCK TRADING SYSTEM 30
not trending, breakout signals are ignored (Katz & McCormick, 2000, pp. 83-108; Ruggiero,
1997, pp. 76-83; Schwager, 1999, pp. 234-237; Stridsman, 2001, p. 98).
2.3.1.3 Counter-trend strategies
Counter-trend strategies try to anticipate price by identify turning points. Oscillators are
popular counter-trend indicators that fluctuate quasi-cyclically within a limited range. Oscillators
provide indications of price momentum and exhaustion. Momentum refers to the rate at which
price changes when price is moving strongly in one direction. Weakening trends usually have
decreasing momentum which indicates a possible trend reversal. Exhaustion occurs when price
becomes excessively high indicating an overbought condition or excessively low indication an
oversold condition, which may precede a price reversal. A popular oscillator is the Moving
Average Convergence Divergence (MACD) and MACD-Histogram (MACD-H). The MACD is
computed by subtracting a longer moving average from a shorter moving average, typically
exponential moving averages. The moving average of the MACD is called the signal line. The
MACD-H is computed by subtracting the signal line from the MACD. A buy signal is triggered
when the oscillator crosses above the signal line, and a sell signal is triggered when the oscillator
crosses below the signal line. The Stochastic and Relative Strength Index (RSI) oscillators signal
overbought and oversold conditions using scaled values between 0 and 100. A buy signal is
triggered when the oscillator moves below the oversold threshold, and then moves back above
that oversold threshold. A sell signal is triggered when the oscillator moves above the
overbought threshold, and then moves back below that overbought threshold. Oscillators work
best when price is in a trading range (non-trending). In order to reduce false signals during
trending markets, a counter-trend model can use a trending indicator to filter signals, such as the
Directional Movement Index (DMI) which indicates if prices are trending or not. If prices are

A FUZZY LOGIC STOCK TRADING SYSTEM 31
trending, the counter-trend signals can be ignored. Another approach would be to use an
oscillator signal as a filter, confirming trend exhaustion on price reversal (Katz & McCormick,
2000, pp. 133-152; Schwager, 1999, pp. 110-119).
2.3.1.4 Entries and exits
Transaction costs are usually accessed per trade, so total transaction costs increase
proportionally with the number of trades. Slippage is the difference between the expected buy or
sell price and the actual buy or sell price, dependant on price movement and order execution
delay. Stock trading accounts commonly restrict trading until funds have settled, typically after
selling stock, for a certain time period. There does not seem to be universal agreement among
experts whether realistic trading practicalities such as transaction costs, slippage, and trading
restrictions should be accounted for when developing trading systems. Some (Murphy, 1999, p.
498; Stridsman, 2001, p.17) suggest that trading costs should not be considered when designing
and testing a trading system, the goal should be on capturing as many and as large favorable
moves as possible while spending as little time in the market as possible to reduce risk. Others
(Katz & McCormick, 2000, p. 89; Schwager, 1999, pp. 258-260) argue that trading costs should
be accounted for because they impact profitability.
In addition to providing buy and sell timing signals, a trading model should include some
provision for the method of trade entry and exit. In live trading, entry and exit orders are
executed that determine the price of entry or exit. A market order is simply an order to buy or
sell at the prevailing price, ensuring that the order will be filled quickly. Market orders are
typically used when timing is important but may experience slippage, which can be either in
favor or against a trade. A buy stop order will buy at or above the specified stop price, and a sell
stop order will sell at or below the specified stop price. A buy stop order can be used as a

A FUZZY LOGIC STOCK TRADING SYSTEM 32
confirmation filter to a buy signal in trend-following systems, ensuring that price is moving up
before entering a trade. A sell stop order can be used to limit losses due to price moving against a
trade. Slippage can be significant when prices are moving rapidly. A buy limit order will buy at
or below the specified limit price and a sell limit order will sell at or above the specified limit
price. A buy limit order can be used in countertrend systems to ensure entry into a trade is at a
good known price without slippage. A sell limit order can be used to lock in profits when price
moves above a specified price (Murphy, 1999, pp. 403-405; Katz & McCormick, 2000, pp. 71-
74).
The main goals of an exit strategy are to limit losses incurred on loosing trades and
maximize profits in winning trades. A money management exit or stop loss exit typically uses a
sell stop order to exit the trade if price drops below a specified amount. The stop price is usually
set to the maximum amount of risk that can be tolerated for that trade, but can also be set based
on a threshold such as a trend line or support/resistance level. A trailing exit uses a trailing stop
which adjusts up as the price moves in favor of the trade, then exists the trade when price falls
below the stop price. A profit target exit usually uses a sell limit order to close a trade that has
made a specific amount of profit. This exit strategy can increase the percentage of winning
trades, but limits the profit per trade. A time-based exit closes a trade after a certain period of
time, which indicates a trade has not moved enough to trigger another exit, and can be combined
with other exit strategies. A signal exit closes a trade due to a sell signal triggered by the trading
model based on its internal technical indicators and trading rules (Katz & McCormick, 2000, pp.
281-288; Ruggiero, 1997, pp. 131-132; Stridsman, 2001, p.70). The setting of sell stop orders
depends on the price of the stock and its habits. Lower priced stocks need a wider stop because

A FUZZY LOGIC STOCK TRADING SYSTEM 33
they tend to make larger percentage moves. Higher priced stocks tend to be less volatile, so
narrower stops can be used (Edwards & Magee, 1992, p. 401).
2.3.1.5 Combining technical indicators
Technical indicators can be classified based on what type of information they provide.
When developing trading models, it is usually advisable to use multiple indicators in
combination to provide a more balanced approach for various trading conditions. However, it is
not advisable to use multiple indicators that provide the same information as that would
contribute redundant information to the model and cause other indicators to appear less
important than they really are. Technical indicators can be checked for redundant information
visually on charts. If they provide essentially the same trading signals, they should not be used
simultaneously in a trading model. Table 1 classifies the technical indicators outlined in section
2.2.2 (Colby & Meyers, 1988, p. 36; StockCharts.com, 2010; Stridsman, 2001, p. 227).
Table 1 - Technical indicator classification (StockCharts.com, 2010)
Category Technical Indicator
Trend Moving averages
Moving average convergence divergence (MACD)
Directional movement indicator (DMI)
Average directional movement index (ADX)
Price channel breakout
Momentum Stochastic
Relative strength index (RSI)
Momentum and rate of change (ROC)
Bollinger bands
Volume On balance volume (OBV)
2.3.1.6 Data sets
The type of historical stock data available will have an impact on which technical
indicators can be used. Many indicators are based on stock price. Historical stock price data can

A FUZZY LOGIC STOCK TRADING SYSTEM 34
be downloaded from the internet at the Yahoo (http://finance.yahoo.com/) or Google
(http://www.google.com/finance) finance web sites, and can be retrieved in Comma Separated
Values (CSV) format. The stock data includes data fields Date, Open, High, Low, Close, and
Volume for each trading day over a specified period of time. Price data from Google is available
in daily or weekly periods. Price data from Yahoo is available in daily, weekly, or monthly
periods.
Using shorter period data usually improves trading performance as it increases sensitivity
to market moves allowing quicker response to trend changes, thus increasing profitability and
reward/risk ratios. Although trading activity increases, the number of trades does not increase
proportionately to the increased number of data points (Colby & Meyers, 1988, p. 34).
2.3.2 Optimization
Optimization is a powerful analytical technique that systematically searches for the
indicator formula that produces the highest or most consistent profit over some historical time
period. Although optimizing a trading strategy over past data does not guarantee that the strategy
will perform the same in future trading, there is enough similarity to make optimization
worthwhile since market behavior and price patterns do not change much over time, particularly
the longer term trends (Colby & Meyers, 1988, pp. 4,18).
A trading model consists of parameters and rules that signal when to buy and sell.
Optimizing a trading model involves finding the best possible set of trading rules and
parameters. The performance of each combination of trading rules and parameters can be
evaluated using a fitness function, which calculates a value that represents model performance.
The calculation of the fitness function can be calculated in any manner desired based on trading
style, risk tolerance, or other trader preferences. Common methods include maximizing profits,

A FUZZY LOGIC STOCK TRADING SYSTEM 35
and may account for other performance metrics such as drawdown, percent winning trades, or
profit to maximum drawdown ratio. An optimization process searches for the best combination
of trading rules and parameters that result in the greatest fitness value as calculated by the fitness
function (Katz & McCormick, 2000, pp. 29-30; Weissman, 2005, p. 127).
Brute force optimization is conceptually simple and effective, and is relatively easy to
implement. A brute force optimizer systematically evaluates every possible combination of rules
and parameters, so it will always find the best possible combination. However, brute force
optimization can become very slow as the number of combinations grows. Therefore, it is a good
choice for small systems that optimize a relatively small number of combinations that can be
evaluated in a reasonable period of time (Katz & McCormick, 2000, pp. 32-34).
User-guided optimization evaluates selected combinations of rules and parameters,
guided by an intelligent user. Brute force style partial optimizations are performed only on
selected combinations. This might involve a variety of methods including evaluation of all
combinations in a selected range of rules and parameters, evaluating only selected rules or
parameters, or perhaps evaluating parameters through a range of values using course increments.
The partial optimization process can be repeated as many times as desired. One of the benefits of
user-guided optimization is that a skilled user may be able to perform an optimization much
faster than brute force optimization by focusing on areas that have the most potential and
avoiding areas that are unlikely to produce good results. User-guided optimization is a good
choice for making minor adjustments to existing systems, or for evaluating sensitivity to rule or
parameter changes (Katz & McCormick, 2000, pp. 34-35).
Genetic optimization simulates the evolutionary processes of random selection and
recombination. Genetic optimizers are good at finding the best solution and work well with

A FUZZY LOGIC STOCK TRADING SYSTEM 36
complex fitness functions. Genetic optimizers are very efficient even when processing a large
number of rule and parameter combinations. They can be orders of magnitude faster than brute
force optimizers. Like user-guided optimization, genetic optimization focuses only on the
important areas but does not need to be guided by an intelligent user. Genetic optimizers are
among the most powerful and are the optimizers of choice when there are many rule and
parameter combinations or a complex fitness function (Katz & McCormick, 2000, pp. 35-
38,257-280).
With today’s computer technology, alternative optimization techniques such as walk-
forward optimization and self-adaptive systems are practical. These systems are optimized on
recent data, then used for live trading for some period of time, then optimized again. This cycle
is repeated indefinitely, resulting in a system that is always optimized using recent data, and live
trading always occurs on out-of-sample data. Self-adaptive systems automate the technique by
optimizing on fixed intervals or some other criteria (Katz & McCormick, 2000, pp. 45-46).
In order to avoid data curve fitting, a trading model should be optimized over a large
representative sample data set to include all types of market environments such as bullish,
bearish, trending, and non-trending. If the sample data set is too small, it is less likely to be
representative of the data in other data sets. Optimization on a small data set may find the best
set of rules and parameters for that data set, but is likely to perform poorly on other data sets as
well as in live trading. To be representative, the sample data set used for optimization should be
as recent as possible so that it reflects current patterns of market behavior, including up trending
and down trending cycles. In order to eliminate performance bias, the data should include an
integer multiple of a full low frequency cycle. For example, given the well-known 4-year stock
market cycle, the data set should include at least 8 years of data (twice the cycle length).

A FUZZY LOGIC STOCK TRADING SYSTEM 37
Optimization should result in a minimum of thirty trades taken, to confirm that the results are not
by chance of just a few trades (Colby & Meyers, 1988, p. 36; Katz & McCormick, 2000, pp. 41-
44; Weissman, 2005, p. 124).
Parameter curve fitting can result from an excessive number of variable parameters and
rules, and as with small sample data sets can impact optimization by working well on in-sample
data but perform poorly on out-of-sample data and live trading. Therefore, trading models should
limit the number of variable parameters and rules to no more than two to five, especially for
small data samples. For a given data sample size, the fewer parameters and rules to optimize, the
more likely the model will be able to filter out randomness and maintain its performance in out-
of-sample tests and live trading. For a sample data set of only a few years of end-of-day data,
even two or three parameters may be excessive (Colby & Meyers, 1988, p. 36; Katz &
McCormick, 2000, pp. 43-45; Weissman, 2005, pp. 124-125).
2.3.3 Testing, evaluation, & analysis
One of the primary benefits of a mechanical trading system is that it provides a means to
back-test, or paper-trade, a trading model without risking real money. Simulations can test the
trading model using user-defined trading rules over historical data to gain insight as to how well
it might perform when applied to live trading (Katz & McCormick, 2000, p. 13).
After a trading model has been optimized on historical in-sample data, it is essential that
it be tested using blind simulation or ex-ante cross validation on a more recent out-of-sample
data set to verify that it consistently maintains its performance results. This critical step will
provide confidence in the trading model before committing it to live trading with real money. If
performance results vary significantly (e.g. excessive drawdown) from in-sample tests, the
parameter set for the trading model should be discarded. Additional verification can be done by

A FUZZY LOGIC STOCK TRADING SYSTEM 38
calculating inferential statistics on both in-sample and out-of-sample tests. These statistics will
indicate the probability that the trading model will maintain its performance in other data
samples and in live trading (Colby & Meyers, 1988, pp. 18-19; Katz & McCormick, 2000, pp.
43-45; Weissman, 2005, pp. 148-150).
Some objective standard of comparison is needed in order to judge the effectiveness of a
technical indicator. The passive buy-and-hold strategy is often used as a performance
comparison, but is not really a good choice since it is dependent on the time period. Almost any
timing tool can outperform buy-and-hold in down markets and most timing tools cannot keep
pace with buy-and-hold in very strong bull markets. A good standard of comparison is the 40-
week simple moving average, where a buy signal occurs when price closes above its 40-week
simple moving average and a sell signal occurs when price closes below its 40-week simple
moving average (Colby & Meyers, 1988, pp. 40-41).
Total profits and maximum equity drawdown are vital measurements of the workability
of a trading model. A model that sustains very large drawdown is not practical even if total
profits are high. A key performance metric is the reward/risk ratio, the ratio of total profit to
maximum equity drawdown (Colby & Meyers, 1988, p. 17). Other data collected that can be
used to evaluate system robustness include total net profit, number of trades, number of days
(average trade duration), maximum drawdown amount (maximum peak-to-valley equity
drawdown), maximum drawdown duration, maximum consecutive losses, profit to maximum
drawdown ratio (higher is better), average profit to average loss ratio (higher is better),
percentage winning trades, and percentage time invested (smaller is better) (Weissman, 2005, pp.
49-50).

A FUZZY LOGIC STOCK TRADING SYSTEM 39
The system should generate output data that can be used to evaluate the trading model
performance, such as gross and net profit, number of winning and losing trades, and maximum
drawdown. The system should also provide a detailed trade-by-trade report, to allow analysis of
the model’s trading style. The trade-by-trade data should include trade entry and exit dates,
prices, quantity, profit or loss per trade, and cumulative profit or loss. Data output should be
formatted so that it can easily be imported into a spreadsheet or other application that supports
statistical analysis, and allow comparison between simulations of different trading models.
Spreadsheets provide a convenient way of sorting and displaying data, and creating graphs and
histograms (Katz & McCormick, 2000, pp. 15-22).
Evaluating the reliability and stability of a trading system requires a statistical analysis of
system performance over live trading and historical test periods. Data should be collected and
analyzed for the total time period of each data set tested and for a moving window of those
periods. Similar statistical traits of the collected data over different time periods would indicate a
robust system and increase confidence that the system would continue to work in the future. The
equity curve should be analyzed to ensure that it is stable and upward sloping. The one year
moving window of equity should be above zero at least seventy percent of the time. When live
trading, two sets of data should be collected. One set should be based on simulated trading and
one set based on actual trading results. Comparing the difference between the two data sets can
reveal valuable information that can be used to improve the system, such as adjusting risk
tolerance, or more accurately estimating slippage (Ruggiero, 1997, pp. 225-237).
The integrity of the system should be verified by reviewing the performance data and by
spot checking the list of trades. Review of performance data should look for anomalies that
might indicate a potential system programming error, such as all buy or all sell signals, all

A FUZZY LOGIC STOCK TRADING SYSTEM 40
winning or all loosing trades, or average length of trades atypically long or short. Spot checking
involves checking trades to verify entry and exit conditions were met, trades were taken at the
correct price, and commissions and slippage were accounted for correctly (Weissman, 2005, p.
121).
2.4 Fuzzy logic
Fuzzy logic attempts to combine the imprecision associated with events and objects to
produce intelligent reasoning systems. It is concerned with the imprecision associated with
describing events or objects, and the uncertainty or vagueness inherent in how they are
characterized. Fuzzy set theory defines how fuzzy sets are organized and the operations allowed
on them. A fuzzy logic system makes logical inferences from a collection of fuzzy sets (Cox,
1995, pp. 63,532-533; Cox, 1999, pp. 6-7).
2.4.1 Fuzzy sets
Fuzzy sets provide a way to represent how well objects satisfy vague descriptions. An
example of this might occur when describing whether a 5'10" person, Nate, is tall. It's not a
question of uncertainty about his height, but that the linguistic term tall does not refer to a clearly
demarked true or false value. You might say that Nate is sort-of tall. Fuzzy set theory allows for
a definition that defines degrees of tallness, treating tall as a fuzzy predicate where the truth
value tall(Nate) is represented by a number between 0 and 1 (Russell & Norvig, 2003, p. 526).
The notation µA(x) denotes the degree of membership value x has with linguistic value
A. There are no clear boundaries between one linguistic value and another. For example, there is
a fuzzy boundary between a person of average height and a tall person, as there is some overlap
of their values within a continuous scale. Even though there may not be universally defined
boundaries between linguistic values, a person 7’ tall would definitely not be considered average

A FUZZY LOGIC STOCK TRADING SYSTEM 41
height. Linguistic values are context dependent; their range of values depends on the variable
they are associated with. For example, the range of values for tall would be quite different when
describing a building verses a person. In order to be mapped into a fuzzy set, a measured (crisp)
value must be converted using a fuzzy membership function. Each linguistic variable value has a
membership function, and the result of the function is a degree of membership on a 0 to 1 scale,
which is the strength of association that the measured (crisp) value has with a linguistic value.
For example, a person 6' in height might be associated with both average and tall, but more
strongly associated with tall (Callan, 2003, pp. 154-155).
Figure 14 illustrates three membership functions for water temperature over a range of 0-
100 °C using the linguistic values cold, warm, and hot. Where the functions overlap, there is a
fuzzy boundary where the temperature in that area maps to membership within both linguistic
values. In the example shown, a temperature of 80 °C would be warm with 0.2 degree of
membership and hot with 0.5 degree of membership. The shape of membership functions depend
on the context of the application, and can be constructed using a number of different shapes
including triangular, normal distribution, and S-shaped, among others (Callan, 2003, pp. 155-
157).
Figure 14 - Water temperature membership functions (Callan, 2003, p.157)

A FUZZY LOGIC STOCK TRADING SYSTEM 42
2.4.2 Fuzzy systems
Fuzzy set theory supports the more general theory of fuzzy logic, which supports the
logical constructs used to create and manipulate fuzzy systems, also known as fuzzy or
approximate reasoning, as shown in Figure 15. In fuzzy or approximate reasoning systems,
knowledge is encoded using fuzzy rules and heuristics in order to deal with imprecise or
ambiguous information. As all rules are evaluated, each rule contributes to resolution of its
output variable, and the resulting fuzzy sets representing each output variable are combined to
find an expected value (Cox, 1995, pp. 63,532-533; Cox, 1999, pp. 6-7).
Figure 15 - Levels of logic supporting approximate reasoning (Cox, 1999, p. 7)
Fuzzy inference systems involve three stages of processing. The first stage, fuzzification,
converts measured crisp input values into linguistic fuzzy variable values. Inference rules of the
form “IF … THEN” process the input fuzzy variables to produce output fuzzy variables.
Defuzzification then combines the output fuzzy variables and converts them into a precise crisp
value (Callan, 2003, p. 157).
The rule antecedent (the IF part) relates to the inputs. It joins variables using fuzzy set
operators such as AND and OR operators. Applying the AND operator results in the minimum

A FUZZY LOGIC STOCK TRADING SYSTEM 43
degree of membership of two linguistic variables. Applying the OR operator results in the
maximum degree of membership of two linguistic variables. For example, if Nate has degree of
membership 0.35 in the tall fuzzy set and 0.75 in the young fuzzy set, “height=tall AND
age=young” would evaluate to a value of 0.35, and “height=tall OR age=young” would evaluate
to a value of 0.75 (Callan, 2003, pp. 158-159).
The rule conclusion (the THEN part) relates to the outputs. Each rule implies a degree of
support for its conclusion. Typically, all rules are evaluated and their implied effects combined to
produce a single crisp output value. For example, assume a car cruise controller that makes
throttle adjustments based on measured speed error and acceleration inputs has fuzzy set input
functions and throttle output function as defined in Figure 16 and has a measured speed error of
0 and an acceleration of 8 when the following two rules fire:
1) IF Speed Error=Zero AND Acceleration= Zero THEN throttle=C (constant)
2) IF Speed Error = Zero AND Acceleration =Positive THEN throttle=RS (reduce
small amount)
From the Speed Error functions, “Speed Error=Zero” results in a degree of membership
1.0. From the Acceleration functions, “Acceleration= Zero” results in a degree of membership
0.2, and “Acceleration =Positive” results in a degree of membership 0.6. Thus, support for the
conclusions from the two rules is as follows:
1) Membership of C is min(1.0,0.2)=0.2
2) Membership of RS is min(1.0,0.6)=0.6

A FUZZY LOGIC STOCK TRADING SYSTEM 44
Figure 16 - Car cruise controller fuzzy functions (Callan, 2003, p.161)
The outputs must be combined to produce a single crisp throttle adjustment value. A
popular defuzzification method is to find the center of gravity. Figure 17 shows the two output
membership functions, cut off at the height corresponding to their output degree of membership.

A FUZZY LOGIC STOCK TRADING SYSTEM 45
The area under each function represents the strength of each conclusion, and the center of gravity
of these combined areas result in the crisp output value. In this example, the center of gravity
calculation results in a throttle adjustment value of -7 in response to the input values speed error
of 0 and acceleration of 8 (Callan, 2003, pp. 159-163).
Figure 17 - Car cruise controller fuzzy output functions (Callan, 2003, p.162)
In some applications, a resulting output linguistic value is sufficient when it is used to
provide a verbal or qualitative answer. In other applications, defuzzification is required because
the output must be a crisp numeric value (VonAltrock, 1997, p. 42), such as in the car cruise
controller example.
In addition to the min-max method of inference in fuzzy systems, used in the car cruise
controller example, decision models can solve many problems by using the fuzzy additive
method where all rules make some contribution to the output (Cox, 1999, pp. 284-303). The
simple combination of fuzzy logic inference principles also can be extended by applying a
weighting factor to each rule, corresponding to its importance relative to other rules
(VonAltrock, 1997, p. 42).
The center-of-maximum defuzzification method is commonly used in fuzzy logic
applications, although other defuzzification methods are more accurate for some applications

A FUZZY LOGIC STOCK TRADING SYSTEM 46
such as the center-of-gravity (also called center-of-area or centroid) defuzzification method used
in the car cruise controller example. To select the proper defuzzification method requires an
understanding of the linguistic meanings that underlies the defuzzification process, best
compromise and most plausible result. The center-of-maximum method determines the most
typical value for each term and then calculates the best compromise of the result. The mean-of-
maximum method produces the most plausible result; it selects the typical value of the term that
is most valid rather than balancing out the different inference results. The center-of-gravity
method finds the balance point by calculating the weighted mean of the fuzzy outputs.
Continuity is an important property of defuzzification methods, where small changes in an input
value cannot cause an abrupt change in an output value. Table 2 provides a comparison of the
defuzzification methods discussed. In decision support systems, the center-of-maximum method
is commonly used for quantitative decisions and the mean-of-maximum method is often used for
qualitative decisions. The mean-of-maximum method is also typically used in pattern recognition
applications (Cox, 1999, pp. 303-328; VonAltrock, 1997, pp. 356-363).
Table 2 - Comparison of defuzzification methods (VonAltrock, 1997, p. 363)
Center-of-Area
(CoA, CoG)
Center-of-
Maximum
(CoM)
Mean-of-
Maximum
(MoM)
Linguistic
Characteristic
Best Compromise Best Compromise Most Plausible
Solution
Fit with Intuition Implausible with
varying MBF
shapes and strong
overlap of MBFs
Good Good
Continuity Yes Yes No
Computational
Efficiency
Very Low High Very High
Applications Control, Decision
Support, Data
Analysis
Control, Decision
Support Data
Analysis
Pattern
Recognition,
Decision Support,

A FUZZY LOGIC STOCK TRADING SYSTEM 47
Data Analysis
As shown in Figure 18 (VonAltrock, 1997, pp. 327-332), most practical fuzzy logic
linguistic variable implementations use standard membership functions (Standard-MBFs) of
linear or spline shape. Input variables may use any of the Standard-MBFs; however most
applications only use the Lambda-Type membership functions for output variables. The
Standard-MBFs have a number of advantages:
They are simple, yet accurate enough to represent most decision systems.
They are easy to interpret.
Implementation is computationally very efficient.
Figure 18 - Standard membership functions (VonAltrock, 1997, p. 327)
Fuzzy set hedges (Cox, 1999, pp. 217-251) play the same role in fuzzy rules that
adjectives and adverbs play in English sentences by modifying the shape of fuzzy set
membership functions. As shown in Table 3, there are several classes of hedge operators; those
that intensify the membership function (very, extremely), that dilute the membership function
(somewhat, rather), that form a complement function (not), and that approximate a fuzzy region
or convert a scalar to a fuzzy set (about, near, close to, approximately).

A FUZZY LOGIC STOCK TRADING SYSTEM 48
Table 3 - Fuzzy linguistic hedges and their approximate meanings (Cox, 1999, p. 218)
HEDGE MEANING
about, around, near, roughly Approximate a scalar
above, more than Restrict a fuzzy region
almost, definitely, positively Contrast intensification
below, less than Restrict a fuzzy region
vicinity of Approximate broadly
generally, usually Contrast diffusion
neighboring, close to Approximate narrowly
not Negate or complement
quite, rather, somewhat Dilute a fuzzy region
very, extremely Intensify a fuzzy region
The dynamic transformation of a membership function is calculated to approximate the
desired linguistic characteristics. For example, the hedge very can intensify a membership
function by squaring it, as illustrated in Figure 19, where a person 5 ½ feet tall would have a
degree of membership 0.56 on the original Tall function, but only 0.28 on the hedged very Tall
function. A person would have to be much taller, over 6 feet, in order to have of membership
0.56 on the very Tall function.
Figure 19 - Comparing Tall and very Tall at 5 ½ feet (Cox, 1999, p. 233)

A FUZZY LOGIC STOCK TRADING SYSTEM 49
2.4.3 Fuzzy applications
Fuzzy logic has been used in many control engineering applications. It has been used to
control subway cars, camera and camcorder autofocus and anti-jitter mechanisms, auto braking
systems, transmission controls, and fuel injectors (Rao & Rao, 1993, p. 29). In an application
traditionally implemented with a conventional proportional-integral-derivative (PID) controller,
Cox (1999, pp. 418-428) illustrated a steam turbine fuzzy logic controller that adjusts a fuel
injector nozzle based on temperature and pressure in a steam containment vessel. Traditionally
PID implementations are based on mathematical process models whereas fuzzy controllers (see
Figure 20) use heuristics encoded in knowledge-based rules.
Figure 20 - Fuzzy logic controller (Cox, 1999, p. 419)

A FUZZY LOGIC STOCK TRADING SYSTEM 50
Cox (1995, pp. 40-42,295-308; 1999, pp. 43,428-474) illustrated how fuzzy logic
approximate reasoning can be used in decision support using a new product pricing model (see
Figure 21) developed for a British retail firm in the mid-1980s. Many imprecise and uncertain
factors are involved in pricing new products such as estimated product demand, competitor
pricing, market price sensitivity, manufacturing costs, spoilage, seasonality, product life cycle,
time to market, product uniqueness, and window of opportunity. This example illustrates the
ability of fuzzy systems to deal with multiple constraints and to model cooperating,
collaborating, and conflicting knowledge from multiple experts in different fields such as
finance, sales and marketing, manufacturing, transportation, and administration.
Figure 21 - New product pricing model (Cox, 1999, p. 430)
VonAltrock (1997, pp. 263-323) developed a number of case studies to show the uses and
benefits of fuzzy logic applications in business, finance, and data analysis using the fuzzyTECH
for Business software application.
Cox (1995, pp. 145-215) illustrated how fuzzy logic can be applied to database queries by
using fuzzy linguistic values in the WHERE clause of an SQL query to more closely match the
intended meaning. For example, “SELECT COMPANY, REVENUES FROM MFGDBMS

A FUZZY LOGIC STOCK TRADING SYSTEM 51
WHERE REVENUES > 600” might be stated using the fuzzy query “SELECT COMPANY,
REVENUES FROM MFGDBMS WHERE REVENUES are HIGH”. A fuzzy set that defines
how to map REVENUES to HIGH would allow the query to return companies with high
revenues, sorted by how well each maps to the fuzzy set.
Fuzzy logic has been used in data mining applications, such as the Environmental
Scenario Search Engine, for querying and mining large environmental data archives, which
allows a user to query the data in meaningful human linguistic terms. For example, a user might
request an example of an atmospheric front near Moscow (with satellite images), how often such
fronts occur, and if they have been increasing in the last 10 years (Zhizhin, Poyda, Mishin,
Medvedev, Kihn, & Lutsarev, 2006).
Knowledge mining and rule discovery methods have been developed to discover
relationships from data sets, such as large databases, in order to create the fuzzy sets and rules of
fuzzy systems that reflect the system behavior within the domain of these sets (Castellano,
Fanelli, & Mencar, 2003; Cox, 1995, pp. 217-242).
Popoola, Ahmad, & Ahmad (2004) developed a method for modeling a noisy time series
using wavelet analysis and fuzzy logic. The method used high- and low-pass filters to divide the
original time series into separate frequency components. The highest frequency (noisy)
components were discarded and fuzzy logic models build for the remaining wavelet components.
The fuzzy models provide single step prediction for each component, and when recombined
provide an aggregate prediction model for the time series. Experiments revealed that the fuzzy-
wavelet model outperformed other models tested.

A FUZZY LOGIC STOCK TRADING SYSTEM 52
Rao & Rao (1993, pp. 30-31) illustrated how fuzzy logic can be used with a neural
network by using a fuzzifier function to pre-process data for the neural network, as shown in
Figure 22.
Figure 22 - Neural network with fuzzy pre-processor (Rao & Rao, 1993, p. 30)
They illustrated this concept with an example application to predict the direction of the
stock market based in part on fiscal policy of the Federal Reserve. As shown in Figure 23, fiscal
policy can be described using fuzzy categories ranging from very accommodative to very tight,
based on the discount rate. For example, a discount rate value of 8% maps to a tight value of 0.8
and an accommodative value of 0.3. These values are normalized to a percentage probability by
dividing each by the total, so the probability of the value being tight is 0.8/1.1=.73 and the
probability of the value being accommodative is 0.3/1.1=.27.
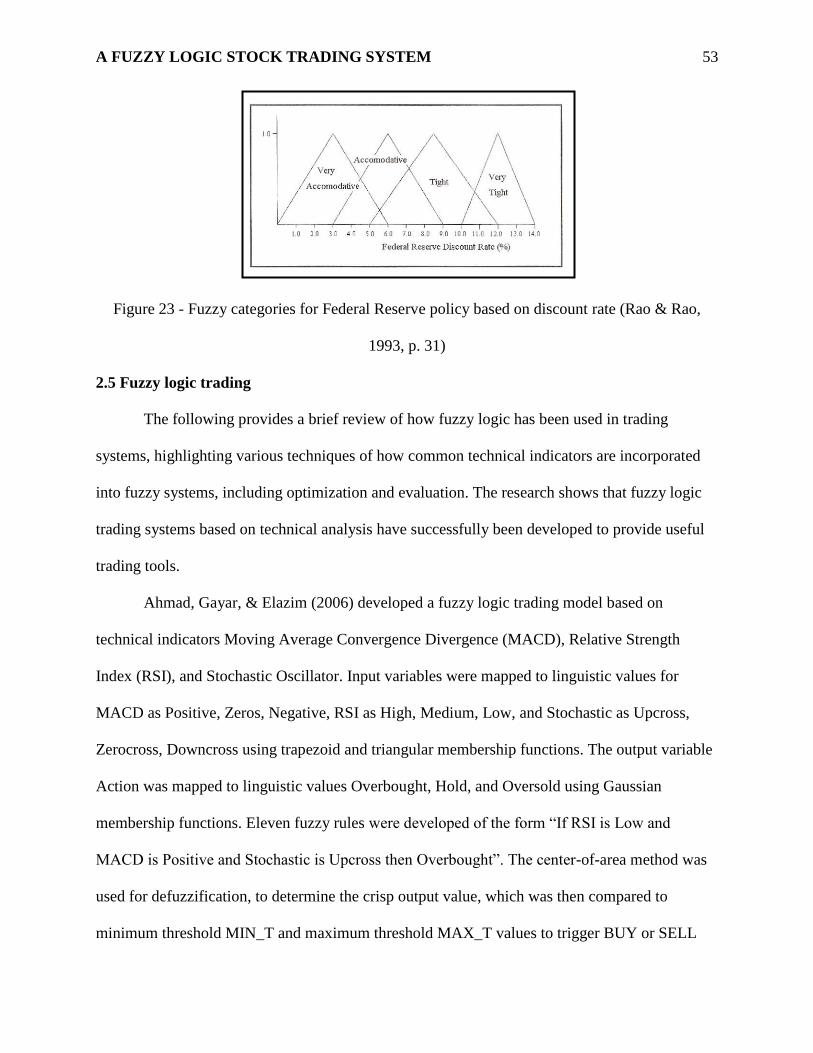
A FUZZY LOGIC STOCK TRADING SYSTEM 53
Figure 23 - Fuzzy categories for Federal Reserve policy based on discount rate (Rao & Rao,
1993, p. 31)
2.5 Fuzzy logic trading
The following provides a brief review of how fuzzy logic has been used in trading
systems, highlighting various techniques of how common technical indicators are incorporated
into fuzzy systems, including optimization and evaluation. The research shows that fuzzy logic
trading systems based on technical analysis have successfully been developed to provide useful
trading tools.
Ahmad, Gayar, & Elazim (2006) developed a fuzzy logic trading model based on
technical indicators Moving Average Convergence Divergence (MACD), Relative Strength
Index (RSI), and Stochastic Oscillator. Input variables were mapped to linguistic values for
MACD as Positive, Zeros, Negative, RSI as High, Medium, Low, and Stochastic as Upcross,
Zerocross, Downcross using trapezoid and triangular membership functions. The output variable
Action was mapped to linguistic values Overbought, Hold, and Oversold using Gaussian
membership functions. Eleven fuzzy rules were developed of the form “If RSI is Low and
MACD is Positive and Stochastic is Upcross then Overbought”. The center-of-area method was
used for defuzzification, to determine the crisp output value, which was then compared to
minimum threshold MIN_T and maximum threshold MAX_T values to trigger BUY or SELL

A FUZZY LOGIC STOCK TRADING SYSTEM 54
signals. These threshold values were dynamically determined base on stock price trend, up,
down, or sideways using a Threshold Fuzzy Model, although they did not provide details. Tests
on the Dow30 Index were performed over select uptrend, downtrend, and sideways markets
using the fuzzy logic trading model and multiple benchmark models based on traditional
technical indicators. Results were evaluated using six different performance parameters and
showed that the fuzzy model outperformed all benchmark models in downtrend and sideways
markets, also performing very well in the uptrend market test.
Cheung & Kaymak (2007) developed a fuzzy logic based trading system that used the
Commodity Channel Index (CCI), Relative Strength Index (RSI), Moving Average Convergence
and Divergence (MACD) and the Bollinger Bands technical indicators, where each indicator
used a fixed set of parameter values. For example, the look-back period for RSI was 20 weeks.
The calculated technical indicator values were mapped into seventeen input fuzzy variables.
Some indicators lead to multiple fuzzy inputs. For example, the RSI provided three values, the
distance to the upper bound, the distance to the lower bound and the distance to the middle line.
The fuzzy output trading signal was mapped to linguistic values Strong Sell, Sell, Buy, and
Strong Buy. Defuzzification of the output used the largest of the maximum (LOM) method
where the output with the largest membership was selected. All input and output membership
functions were Gaussian. Twelve fuzzy rules were defined, each using two technical indicators,
of the form “IF MACDf is low and RSIupper(t) is low and RSIupper(t-1) is high THEN SELL”. The
input and output parameters of the membership functions were optimized using genetic
algorithms, as they are superior to other approaches such as neural networks by providing search
efficiency and global optimization, and allow more flexible fitness functions. The fitness
function was defined as the average return of trades over a number of sliding windows within the

A FUZZY LOGIC STOCK TRADING SYSTEM 55
in-sample data set. Five historical data sets within a ten year period were used, where within each
data set 90% was used for in-sample training and 10% was used for out-of-sample testing.
Performance of the system was evaluated in comparison to benchmark buy-and-hold strategies
and experts of a financial institution using a proprietary trading system. The Sharpe ratio, which
measures the average return per unit risk, was used as the measure of overall performance over
the out-of-sample period. The fuzzy system outperformed the benchmarks in four of the five out-
of-sample testing periods.
Doeksen, Abraham, Thomas, & Paprzycki (2005) looked at stock trading with soft
computing models using neural networks, fuzzy inference systems, and genetic algorithms. The
systems were developed and testing for Intel and Microsoft stock using historical data from 1997
to 2003. Almost all systems significantly outperformed the buy-and-hold strategy. It is
interesting to note that the systems developed for Microsoft significantly outperformed the
systems developed for Intel, which suggests that selecting the right stock may be just as
important as developing the best system.
Dourra & Siy (2002) examined a fuzzy logic system based on the Rate of Change (ROC)
momentum indicator, the stochastic momentum indicator, and the Bollinger Bands indicator,
each using a 30 day look-back period. From these indicators, seven fuzzy input variables were
defined and mapped to linguistic values low, medium, big, and large using bell shaped
membership functions. Based on indicator buy and sell trigger conditions, a set of fuzzy rules
were defined that used the fuzzy input variables to produce a fuzzy output that was also mapped
to linguistic values low, medium, big, and large on a bell shaped membership function. The
fuzzy output was then converted to a crisp value using the center-of-area defuzzification method.
The crisp output value was then compared to an upper trigger level (UTL) to generate a BUY

A FUZZY LOGIC STOCK TRADING SYSTEM 56
signal and a lower trigger level (LTL) to generate a SELL signal. Two trading strategies were
defined, the first dynamically adjusted trigger levels based on system performance, and the
second used constant trigger levels based on risk tolerance. Testing on four stocks showed that
over a three year period the fuzzy system results were excellent, substantially outperforming the
S&P 500.
Gamil, El-fouly, & Darwish (2007) developed a fuzzy logic trading model using moving
averages (MA), for various moving average time frames (10, 20, 50, 70, 100, and 200 day). They
constructed input fuzzy variables of normalized moving averages (NMA) where NMA = (Price –
MA) / Price. They created membership functions to map the NMA crisp values to linguistic
values Low, Normal, and High. The output trade decision was mapped to linguistic values Buy,
Sell, or Hold. Fuzzy rules were of the form “If NMA is High then Decision is Buy”. Genetic
algorithms were used to tune the fuzzy rules for the trading model over a one year period. The
system was then tested using a number of sample stocks over subsequent short-term (1 or 2 day),
medium-term (1 week), and long-term (2 week) periods to assess the model’s trade decision
accuracy in predicting future price movement. Successful prediction was 100% for short-term
tests, 90% for medium-term tests, and 80% for long-term tests.
Ghandar, Michalewicz, Schmidt, To, & Zurbrugg (2009) developed a fuzzy logic based
trading system that dynamically adjusted trading rules based on market conditions. Using their
evolutionary algorithm (EA), the system adapted the rule base to changing market conditions
instead of using a fixed set of rules as most systems do. They developed fuzzy input variables
based on price change, portfolio value, simple moving average, two moving average crossover,
on balance volume, and alpha, mapping them into seven linguistic values ranging from
extremely low to extremely high using triangular membership functions. The output is

A FUZZY LOGIC STOCK TRADING SYSTEM 57
interpreted as a rating of the strength of a buy recommendation for each rule. Rules were of the
form “If price change is high and portfolio value is extremely low then rating is 0.1”. The system
was tested on MSCI Europe listed stocks over the time period from 1990 to 2005. The EA
system was evaluated using a number of performance metrics and compared to a number of
benchmark strategies such as the MCSI Europe index, buy and hold, and price momentum.
Results showed that the EA system outperformed all the benchmark strategies tested. It is
interesting to note that the EA concept presented is similar to the walk-forward optimization and
self-adaptive systems optimization techniques discussed by Katz & McCormick (2000, pp. 45-
46).
Khcherem & Bouri (2009) used VonAltrock’s (1997) fuzzyTECH software to develop a
fuzzy model with return, stochastic oscillator, momentum, advance/decline, and new
advance/new decline fuzzy variables. The data set used was daily data for 25 firms listed on the
Tunisian Stock Exchange from 2001 to 2008. They defined membership functions using low,
medium, and high functions for each input variable. They used the first half of the data set as in-
sample training data to develop the inference rules using the fuzzyTECH software. The output
linguistic value was a buy, hold, or sell recommendation. Testing on the remaining out-of-sample
data set showed model accuracy up to 93.26%.
Li & Yang (2008) studied a neuro-fuzzy system applied to the stochastic indicator for
four Asian stock markets. The stochastic parameters were mapped to input fuzzy variables and
the output was mapped to a fuzzy variable Trend, where a BUY signal was generated when the
Trend was above a buy threshold value and a SELL signal was generated when the Trend was
below a sell threshold value. A neural network was used to generate and optimize membership
functions and the fuzzy rule set from training data over a two year period from 2003 to 2004.

A FUZZY LOGIC STOCK TRADING SYSTEM 58
Training was stopped when the model had a rate of return greater than that of a buy and hold
strategy in order to avoid over-fitting the model to the training data set. The model was then
evaluated on the testing data set over the two year period from 2005 to 2006 against benchmark
buy and hold and standard stochastic indicator trading models. Evaluation was based on yearly
returns, profit factor, Sharpe ratio, cumulative wealth, maximum drawdown, and average
drawdown. The results showed that the neuro-fuzzy system outperformed both benchmark
trading models in all of the Asian stock markets tested.
Zhou & Dong (2004) investigated using fuzzy logic to detect technical patterns in stock
charts. They used Gaussian kernel-based smoothing and pattern templates based on consecutive
local extrema for head-and-shoulders, broadening tops and bottoms, triangle tops and bottoms,
and rectangle tops and bottoms. For each pattern, a set of crisp condition variables based on the
local extrema defined the pattern. The crisp condition values were converted to fuzzy values
using trapezoid membership functions, and the total pattern fuzzy membership value was
calculated as the average of the membership values for all the condition variables. The results of
their investigation showed that their approach was able to detect subtle differences within a
clearly defined pattern template, providing improved precision in detecting technical patterns
compared to visual pattern analysis by average investors.
2.6 Conclusions
The review of literature provided information relevant to this project in the following
areas:
Basic principles of technical analysis of financial markets - the concepts of trend and
momentum, chart analysis, and mathematical technical indicators.

A FUZZY LOGIC STOCK TRADING SYSTEM 59
Using technical indicators to make trading decisions - how technical indicators are used
by stock traders, and how various technical indicators are calculated, indicator model
parameters that can be varied to affect the trading model, and trigger conditions for buy
and sell signals.
Methodologies for developing and validating trading systems - timing models for trend
following and counter-trend trading strategies, combining technical indicators,
optimization, and evaluation.
Basic elements of fuzzy logic - fuzzy sets, fuzzy inference systems, and fuzzy system
applications.
Using fuzzy logic in trading systems - how fuzzy logic has been applied to trading stocks
using technical indicators including optimization techniques, defining linguistic meaning
for technical indicator parameters, fuzzy rules that represent the behavior of indicator
models, and interpretation of fuzzy output into a buy or sell signal.
Examining the literature in these areas provided information that guided the design and
development of a fuzzy logic stock trading system based on technical analysis.

A FUZZY LOGIC STOCK TRADING SYSTEM 60
Chapter 3 – Methodology
3.1 Introduction
A two phase methodology was undertaken to develop and evaluate the fuzzy logic
trading system based on technical analysis, named Fuzzy Tech, using the guidelines outlined in
Table 4.
Table 4 – Development and evaluation methodology
Phase Guidelines
Development
Historical stock price data
Trading models based on technical indicators
Trend-following and counter-trend trading models
Money management exit models
Combine trading models into trading strategies
Trading strategies used for simulated or live trading
Trading strategy parameter and rule optimization
Evaluation
Genetic optimization is best overall
Walk-forward optimization is practical
Optimize over large representative recent in-sample data set, multiple of 4-year cycle
Test over more recent out-of-sample data to verify consistent performance results
Optimize using a minimum number of parameters and rules
Optimization should result in a minimum of thirty trades taken
Maximize profits and minimize drawdown
Compare performance against 200-day moving average
3.2 Trading system development
A block diagram of the system developed with its major components is illustrated in
Figure 24.

A FUZZY LOGIC STOCK TRADING SYSTEM 61
Figure 24 - System block diagram

A FUZZY LOGIC STOCK TRADING SYSTEM 62
3.2.1 Data management
The WWW module manages access to historical daily stock price data (Date, Open,
High, Low, Close, and Volume) from the Google and Yahoo financial internet web sites. The
MySQL Database module manages access to locally stored historical daily stock price data and
trading strategy data. The Data Manager manages access to historical daily stock price data and
trading strategy data via the WWW and MySQL Database modules. An internal cache of
historical stock data improves system performance by minimizing access to those slower access
methods. When data is requested, the Data Manager attempts to access the data from internal
cache first, then from the local database, and finally from the internet as required.
3.2.2 Technical indicators
Technical indicator modules were built for the following popular technical indicators
discussed in section 2.2.2:
Simple Moving Average
Exponential Moving Average
MACD
Price Channel
Stochastic
Relative Strength Index
Rate of Change
Bollinger Bands
On Balance Volume

A FUZZY LOGIC STOCK TRADING SYSTEM 63
3.2.3 Trading models
A standard buy-and-hold trading model, ten standard trading models, and ten
corresponding fuzzy trading models were developed based on the technical indicators. Four exit
models were also developed to provide sell signals based on money management criteria
discussed in section 2.3. Table 5 lists the trading models developed, along with their
corresponding parameter and rule default values.
Table 5 - Trading model parameter and rule default values
Trading Model Name Trading Model Parameters Value Min Max Inc Trading Model Rules Enabled
Buy And Hold BUY on start date TRUE
SELL on end date TRUE
Bollinger Bands Lookback period (days) 20 5 300 5 BUY if price closes above upper band
TRUE
Band standard deviations 2 0.5 3.5 0.5 SELL if price closes below
lower band
TRUE
BUY if price closes below lower band
FALSE
SELL if price closes above
upper band
FALSE
Exponential Moving
Average
Lookback period (days) 30 5 300 5 BUY if close above moving
average
TRUE
SELL if close below moving
average
TRUE
BUY if today's moving
average above yesterday's moving average
TRUE
SELL if today's moving
average below yesterday's
moving average
TRUE
MACD Slow lookback period (days) 26 13 39 1 BUY if histogram is positive TRUE
Fast lookback period (days) 12 7 18 1 SELL if histogram is
negative
TRUE
Signal lookback period
(days)
9 4 14 1 BUY if MACD line is
positive
TRUE
SELL if MACD line is
negative
TRUE
BUY if Signal line is positive TRUE
SELL if Signal line is negative
TRUE
On Balance Volume OBV moving average
lookback period (days)
30 5 300 5 BUY if OBV moves above
OBV moving average
TRUE
SELL if OBV moves below OBV moving average
TRUE
Price Channel Lookback period (days) 10 5 300 5 BUY if closing price moves
above highest high
TRUE
SELL if closing price moves
below lowest low
TRUE

A FUZZY LOGIC STOCK TRADING SYSTEM 64
Rate of Change Lookback period (days) 12 2 300 2 BUY if ROC moves above
mid-point (100) level
TRUE
SELL if ROC moves below mid-point (100) level
TRUE
Relative Strength Index Lookback period (days) 14 3 50 1 BUY if RSI moves from
below oversold level to
above oversold level
TRUE
Oversold level 25 10 40 5 SELL if RSI moves from above overbought level to
below overbought level
TRUE
Overbought level 75 60 90 5 BUY if RSI moves above mid-point (50) level
TRUE
SELL if RSI moves below
mid-point (50) level
TRUE
Simple Moving Average
Crossover
Moving average #1 lookback
period (days)
10 5 100 5 BUY if moving average #1
above moving average #2
TRUE
Moving average #2 lookback period (days)
30 10 300 5 SELL if moving average #1 below moving average #2
TRUE
Simple Moving Average Lookback period (days) 200 5 300 5 BUY if close above moving
average
TRUE
SELL if close below moving average
TRUE
BUY if today's moving
average above yesterday's moving average
FALSE
SELL if today's moving
average below yesterday's
moving average
FALSE
Stochastic %K lookback period (days) 5 1 30 1 BUY if %K moves from below oversold level to
above oversold level
TRUE
%K smoothing lookback
period (days, 1=fast stochastic, 3=slow
stochastic)
3 1 5 1 SELL if %K moves from
above overbought level to below overbought level
TRUE
%D lookback period (days) 3 1 10 1 BUY if %D moves from
below oversold level to above oversold level
TRUE
Oversold level 25 10 40 5 SELL if %D moves from
above overbought level to
below overbought level
TRUE
Overbought level 75 60 90 5 BUY if %K moves above %D
TRUE
SELL if %K moves below
%D
TRUE
Fuzzy Bollinger Bands Lookback period (days) 20 5 300 5 IF BB_UPPER IS High
THEN Signal IS Buy
TRUE
Band standard deviations 2 0.5 3.5 0.5 IF BB_LOWER IS Low
THEN Signal IS Sell
TRUE
Fuzzy BB Threshold 5 1 25 1 IF BB_LOWER IS Low THEN Signal IS Buy
TRUE
IF BB_UPPER IS High
THEN Signal IS Sell
TRUE
IF BB_UPPER IS Normal THEN Signal IS Hold
TRUE
IF BB_LOWER IS Normal
THEN Signal IS Hold
TRUE

A FUZZY LOGIC STOCK TRADING SYSTEM 65
Fuzzy Exponential Moving
Average
Lookback period (days) 30 5 300 5 IF EMA IS High THEN
Signal IS Buy
TRUE
Fuzzy EMA Threshold 5 1 25 1 IF EMA IS Normal THEN Signal IS Hold
TRUE
IF EMA IS Low THEN
Signal IS Sell
TRUE
Fuzzy MACD Slow lookback period (days) 26 13 39 1 IF HISTOGRAM IS High THEN Signal IS Buy
TRUE
Fast lookback period (days) 12 7 18 1 IF HISTOGRAM IS Low
THEN Signal IS Sell
TRUE
Signal lookback period (days)
9 4 14 1 IF MACD_LINE IS High THEN Signal IS Buy
TRUE
Fuzzy MACD Threshold 5 1 25 1 IF MACD_LINE IS Low
THEN Signal IS Sell
TRUE
IF SIGNAL_LINE IS High THEN Signal IS Buy
TRUE
IF SIGNAL_LINE IS Low
THEN Signal IS Sell
TRUE
Fuzzy On Balance Volume OBV moving average
lookback period (days)
30 5 300 5 IF OBV IS High THEN
Signal IS Buy
TRUE
Fuzzy OBV Threshold 5 1 25 1 IF OBV IS Normal THEN Signal IS Hold
TRUE
IF OBV IS Low THEN
Signal IS Sell
TRUE
Fuzzy Price Channel Lookback period (days) 10 5 300 5 IF PC_UPPER IS High THEN Signal IS Buy
TRUE
Fuzzy PC Threshold 5 1 25 1 IF PC_UPPER IS Normal
THEN Signal IS Hold
TRUE
IF PC_UPPER IS Low THEN Signal IS Sell
TRUE
IF PC_LOWER IS Low
THEN Signal IS Sell
TRUE
IF PC_LOWER IS Normal THEN Signal IS Hold
TRUE
IF PC_LOWER IS High
THEN Signal IS Buy
TRUE
Fuzzy Rate Of Change Lookback period (days) 12 2 300 2 IF ROC IS High THEN Signal IS Buy
TRUE
Fuzzy ROC Threshold 5 1 25 1 IF ROC IS Normal THEN
Signal IS Hold
TRUE
IF ROC IS Low THEN Signal IS Sell
TRUE
Fuzzy Relative Strength Index
Lookback period (days) 14 3 50 1 IF RSI IS Overbought THEN Signal IS Sell
TRUE
Oversold level 25 10 40 5 IF RSI IS Neutral THEN
Signal IS Hold
TRUE
Overbought level 75 60 90 5 IF RSI IS Oversold THEN Signal IS Buy
TRUE
Fuzzy Simple Moving
Average Crossover
Moving average #1 lookback
period (days)
10 5 100 5 IF SMA IS High THEN
Signal IS Buy
TRUE
Moving average #2 lookback period (days)
30 10 300 5 IF SMA IS Normal THEN Signal IS Hold
TRUE
Fuzzy SMA Threshold 5 1 25 1 IF SMA IS Low THEN
Signal IS Sell
TRUE
Fuzzy Simple Moving Average
Lookback period (days) 30 5 300 5 IF SMA IS High THEN Signal IS Buy
TRUE
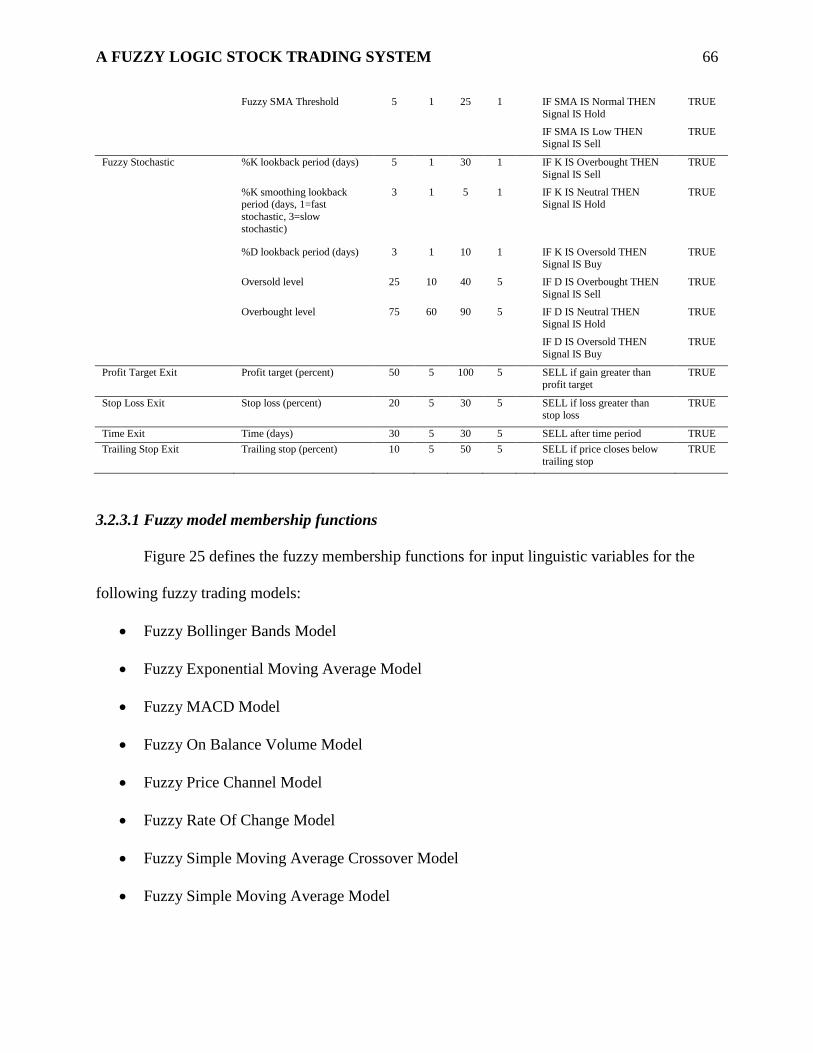
A FUZZY LOGIC STOCK TRADING SYSTEM 66
Fuzzy SMA Threshold 5 1 25 1 IF SMA IS Normal THEN
Signal IS Hold
TRUE
IF SMA IS Low THEN Signal IS Sell
TRUE
Fuzzy Stochastic %K lookback period (days) 5 1 30 1 IF K IS Overbought THEN
Signal IS Sell
TRUE
%K smoothing lookback period (days, 1=fast
stochastic, 3=slow
stochastic)
3 1 5 1 IF K IS Neutral THEN Signal IS Hold
TRUE
%D lookback period (days) 3 1 10 1 IF K IS Oversold THEN Signal IS Buy
TRUE
Oversold level 25 10 40 5 IF D IS Overbought THEN
Signal IS Sell
TRUE
Overbought level 75 60 90 5 IF D IS Neutral THEN Signal IS Hold
TRUE
IF D IS Oversold THEN
Signal IS Buy
TRUE
Profit Target Exit Profit target (percent) 50 5 100 5 SELL if gain greater than profit target
TRUE
Stop Loss Exit Stop loss (percent) 20 5 30 5 SELL if loss greater than stop loss
TRUE
Time Exit Time (days) 30 5 30 5 SELL after time period TRUE
Trailing Stop Exit Trailing stop (percent) 10 5 50 5 SELL if price closes below
trailing stop
TRUE
3.2.3.1 Fuzzy model membership functions
Figure 25 defines the fuzzy membership functions for input linguistic variables for the
following fuzzy trading models:
Fuzzy Bollinger Bands Model
Fuzzy Exponential Moving Average Model
Fuzzy MACD Model
Fuzzy On Balance Volume Model
Fuzzy Price Channel Model
Fuzzy Rate Of Change Model
Fuzzy Simple Moving Average Crossover Model
Fuzzy Simple Moving Average Model
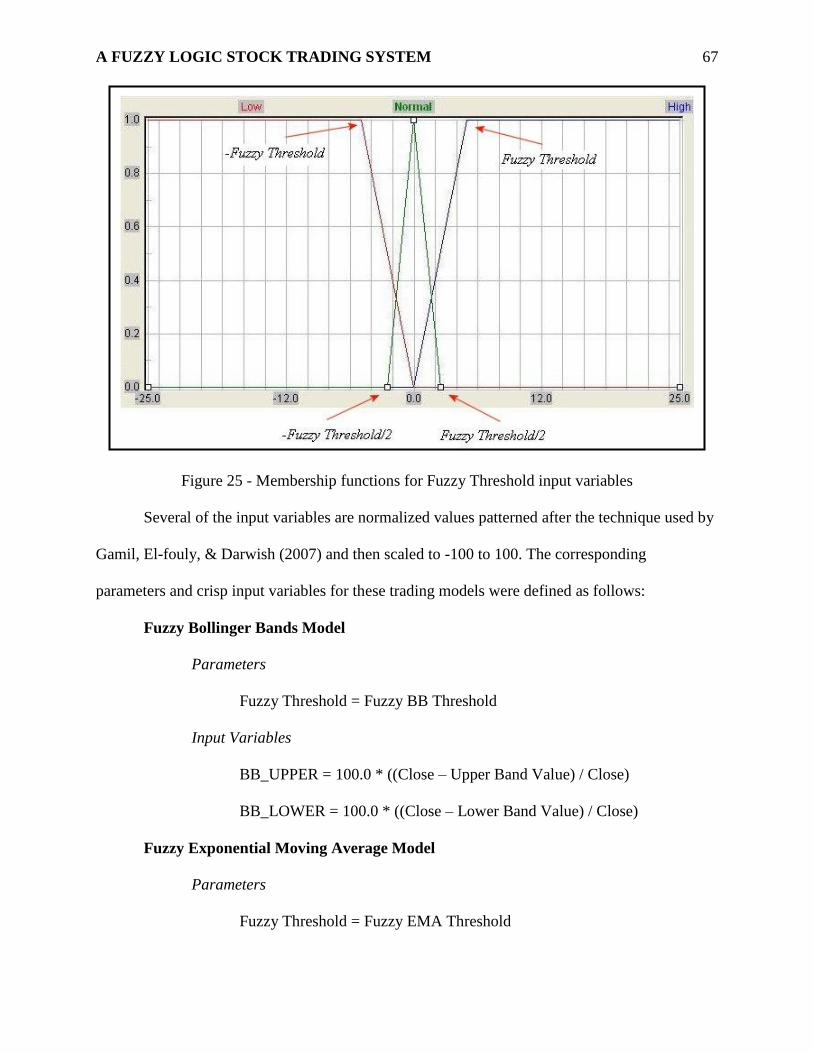
A FUZZY LOGIC STOCK TRADING SYSTEM 67
Figure 25 - Membership functions for Fuzzy Threshold input variables
Several of the input variables are normalized values patterned after the technique used by
Gamil, El-fouly, & Darwish (2007) and then scaled to -100 to 100. The corresponding
parameters and crisp input variables for these trading models were defined as follows:
Fuzzy Bollinger Bands Model
Parameters
Fuzzy Threshold = Fuzzy BB Threshold
Input Variables
BB_UPPER = 100.0 * ((Close – Upper Band Value) / Close)
BB_LOWER = 100.0 * ((Close – Lower Band Value) / Close)
Fuzzy Exponential Moving Average Model
Parameters
Fuzzy Threshold = Fuzzy EMA Threshold

A FUZZY LOGIC STOCK TRADING SYSTEM 68
Input Variables
EMA = 100.0 * ((Close – EMA Value) / Close)
Fuzzy MACD Model
Parameters
Fuzzy Threshold = Fuzzy MACD Threshold
Input Variables
HISTOGRAM = Histogram Value
MACD_LINE = MACD Line Value
SIGNAL_LINE = Signal Line Value
Fuzzy On Balance Volume Model
Parameters
Fuzzy Threshold = Fuzzy OBV Threshold
Input Variables
OBV = 100.0 * ((OBV Value – OBV SMA) / OBV Value)
Fuzzy Price Channel Model
Parameters
Fuzzy Threshold = Fuzzy PC Threshold
Input Variables
PC_UPPER = 100.0 * ((Close – Highest High) / Close)
PC_LOWER = 100.0 * ((Close – Lowest Low) / Close)
Fuzzy Rate Of Change Model
Parameters
Fuzzy Threshold = Fuzzy ROC Threshold
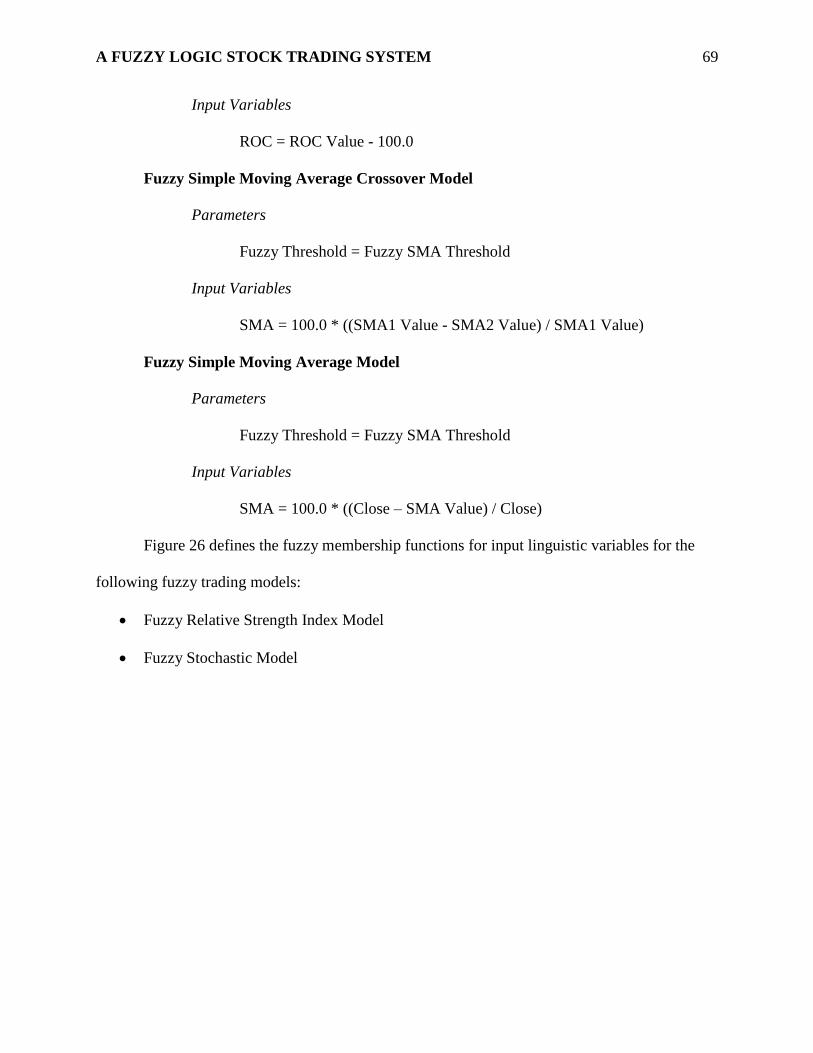
A FUZZY LOGIC STOCK TRADING SYSTEM 69
Input Variables
ROC = ROC Value - 100.0
Fuzzy Simple Moving Average Crossover Model
Parameters
Fuzzy Threshold = Fuzzy SMA Threshold
Input Variables
SMA = 100.0 * ((SMA1 Value - SMA2 Value) / SMA1 Value)
Fuzzy Simple Moving Average Model
Parameters
Fuzzy Threshold = Fuzzy SMA Threshold
Input Variables
SMA = 100.0 * ((Close – SMA Value) / Close)
Figure 26 defines the fuzzy membership functions for input linguistic variables for the
following fuzzy trading models:
Fuzzy Relative Strength Index Model
Fuzzy Stochastic Model

A FUZZY LOGIC STOCK TRADING SYSTEM 70
Figure 26 - Membership functions for Overbought/Oversold input variables
The Mid-Oversold and Mid-Overbought level values were defined as follows:
Mid-Oversold level = 50 - ((50 – Oversold level) / 2.0)
Mid-Overbought level = 50 + ((Overbought level - 50) / 2.0).
The corresponding parameters and crisp input variables for these trading models were
defined as follows:
Fuzzy Relative Strength Index Model
Parameters
Oversold level
Overbought level
Input Variables
RSI = RSI Value

A FUZZY LOGIC STOCK TRADING SYSTEM 71
Fuzzy Stochastic Model
Parameters
Oversold level
Overbought level
Input Variables
K = %K Value
D = %D Value
Figure 27 defines the fuzzy membership functions for the Signal output linguistic
variable for all fuzzy trading models. The rule that generates the greatest firing strength provides
the resulting sell, hold, or buy trading signal.
Figure 27 - Membership functions for Signal output variable
As shown in Figure 28, a trading model is defined by its underlying technical indicator,
parameters, and rules, which are used to generate trading signals.

A FUZZY LOGIC STOCK TRADING SYSTEM 72
Figure 28 - Trading model
3.2.4 Trading strategies
As shown in Figure 29, a trading strategy is constructed by combining one or more
trading models, which generates a composite trading signal based on the trading signals of the
component trading models. When editing a trading strategy, right-clicking in the models area
allows adding a trading model. To delete a model, select it and press the delete key.

A FUZZY LOGIC STOCK TRADING SYSTEM 73
Figure 29 - Trading strategy
3.2.5 Trading simulation
As shown in Figure 30, trading simulation allows back-testing a trading strategy over a
period of time to determine its performance results, which can be saved in a Comma Separated
Values (CSV) formatted file for later analysis.

A FUZZY LOGIC STOCK TRADING SYSTEM 74
Figure 30 - Trading simulation, control tab
As shown in Figure 31, trading simulation provides detailed trading activity based on
trading strategy trading signals.

A FUZZY LOGIC STOCK TRADING SYSTEM 75
Figure 31 - Trading simulation, data tab
As shown in Figure 32, trading simulation provides a graphical view of the closing price
with trading signals (up arrow=buy, down arrow=sell), and a graphical view of the account
equity curve.

A FUZZY LOGIC STOCK TRADING SYSTEM 76
Figure 32 - Trading simulation, graph tab
3.2.6 Strategy optimization
Strategy optimization attempts to find the best combination of trading model parameters
and rules by running trade simulations over a period of time using different combinations of
trading model parameters and rules. Each trading model parameter value is varied over its
minimum to maximum range by its increment value, and trading rules enabled or disabled (see

A FUZZY LOGIC STOCK TRADING SYSTEM 77
Figure 28). As shown in Figure 33, there are a number of parameters that control strategy
optimization, including transaction cost, sell settle days, starting cash, date range, fitness
function, filters, and optimization method.
Figure 33 - Strategy optimizer, control tab
The fitness function calculates a fitness value for each resulting strategy, which can be
used to compare the performance of different strategies. Filters discard strategies that do not

A FUZZY LOGIC STOCK TRADING SYSTEM 78
meet the selected filter criteria. The Optimization methods available are exhaustive brute force
(100%), random samples (10-75%), or genetic.
When optimization is complete, the data tab is populated with the resulting strategies, as
shown in Figure 34. The table can be sorted by clicking a column header, shown here with the
resulting optimized strategy list sorted by profit drawdown ratio.
Figure 34 - Strategy optimizer, data tab

A FUZZY LOGIC STOCK TRADING SYSTEM 79
The time required to optimize a strategy can be significantly affected by the optimization
parameters, such as date range, optimization method, and the number of trading model parameter
and rule combinations. For example, in Figure 33, 100% optimization of a strategy composed of
a MACD trading model over an 8 year period required about 2.8 hours for 228,096 parameter
and rule combinations. Using the genetic optimization method with a population size of 100 for
50 epochs reduced optimization time to about 5.4 minutes. There is some trade-off when using
the genetic optimization method. In exchange for the speed increase (5.4 minutes vs. 2.8 hours),
the genetic optimizer did not find the very best strategy. The top 3 strategies found by the 100%
optimization had fitness values 10.06, 9.10, and 8.18. As shown in Figure 35, 10 test runs of the
genetic optimizer found strategies with fitness value about 8 most of the time (9 of 10 times) and
about 9 only once. The optimizer converged on a solution mid-way through the optimization
most of the time.

A FUZZY LOGIC STOCK TRADING SYSTEM 80
Figure 35 - Genetic optimizer fitness example, Epoch vs. Fitness
Adding a trailing stop exit model to the example strategy increases the parameter and rule
combinations to 4,561,920, and would require an estimated 50 hours to optimize. Using the
genetic optimization method with a population size of 100 for 50 epochs reduced optimization
time to about 8.4 minutes. This example confirms the suggestion in section 2.3.2 that overall the

A FUZZY LOGIC STOCK TRADING SYSTEM 81
genetic optimizer is a good option when there are a large number of parameter and rule
combinations, or when there are a large number of optimizations to perform.
3.3 Trading system evaluation
3.3.1 Data collection methodology
Create Strategy Test Set, as shown in Figure 36, automates the process of creating a set of
test data for a group of stocks. For each stock, buy-and-hold and 200-day simple moving average
benchmark strategies are created and trading strategies for the 10 standard trading models and
the 10 fuzzy trading models are created, as shown in Figure 37. Each of the trading strategies are
optimized for the in-sample date range, and trading simulation run on all strategies for the in-
sample and out-of-sample date ranges. For each stock, performance data for each trading
simulation is collected in a CSV file for further analysis.
Figure 36 - Create strategy test set

A FUZZY LOGIC STOCK TRADING SYSTEM 82
Figure 37 - Example strategy test set
Each trading strategy was combined with profit target and stop loss exit models, as well
as a simple moving average model. Strategy optimizer and trading simulation used $7 transaction
cost, $10,000 starting cash, and 3 sell settle days. Strategy optimizer used profit drawdown ratio
as the fitness function; filters were set to ensure optimized strategies were profitable, included a
minimum of 30 trades, and a maximum drawdown of 30 percent. Strategies were optimized
using the genetic optimization method with population of 100 over 50 epochs.
Strategy test set data were collected for two groups of stocks, DOW30 and S&P100,
which are stock market indices that represent 30 and 100 respectively leading publicly owned
companies based in the United States.

A FUZZY LOGIC STOCK TRADING SYSTEM 83
Some stocks were excluded due to insufficient historical stock price data available, as
noted below.
DOW30 stocks included:
AA, AXP, BA, BAC, CAT, CSCO, DD, DIS, GE, HD, HPQ, IBM, INTC, JNJ,
JPM, KO, MCD, MMM, MRK, MSFT, PFE, PG, T, TRV, UTX, VZ, WMT,
XOM
DOW30 stocks excluded:
CVX, KFT
S&P100 stocks included:
AA, AAPL, ABT, AEP, ALL, AMGN, AVP, AXP, BA, BAC, BAX, BHI, BK,
BMY, BRK.B, C, CAT, CL, CMCSA, COF, COP, COST, CPB, CSCO, CVS,
DD, DELL, DIS, DOW, DVN, EMC, ETR, EXC, F, FCX, FDX, GD, GE, GILD,
HAL, HD, HNZ, HON, HPQ, IBM, INTC, JNJ, JPM, KO, LMT, LOW, MCD,
MDT, MMM, MO, MRK, MS, MSFT, NKE, NOV, NSC, NWSA, ORCL, OXY,
PEP, PFE, PG, QCOM, RF, SLB, SLE, SO, T, TGT, TWX, TXN, UNH, USB,
UTX, VZ, WAG, WFC, WMB, WMT, WY, XOM, XRX
S&P100 stocks excluded:
AMZN, CVX, GOOG, GS, KFT, MA, MET, MON, NYX, PM, RTN, S, UPS
3.3.2 Evaluation methodology
Data were collected over a 12 year period from 9/30/1998 to 9/30/2010 using a walk-
forward optimization approach with out-of-sample evaluation over a recent 4-year cycle via a
sliding window of 1-year periods. The performance of a portfolio of the 10 best unique stock
strategies were evaluated and compared to benchmark strategies.

A FUZZY LOGIC STOCK TRADING SYSTEM 84
Data sets were evaluated using an OPTIMIZE-VERIFY-EVALUATE methodology,
where strategy test sets were optimized over in-sample data, then verified (optional) over more
recent out-of-sample data, and then finally evaluated over another set of even more recent out-of-
sample data. In data sets that used no verification period, strategies were selected for the
portfolio based on highest profit drawdown ratio. In data sets that did use a verification period,
strategies were selected for the portfolio based on highest efficiency factor, which is calculated
by multiplying the profit drawdown ratio from the OPTIMIZE and VERIFY data. The efficiency
factor represents a measure of how well an optimized stock strategy maintains its performance in
subsequent trading simulation, with the expectation that a strategy with high efficiency would
continue to perform well in future live or simulated trading.
Data were collected for five data sets, using the naming convention shown in Table 6
based on the number of years for each of the OPTIMIZE-VERIFY-EVALUATE date ranges.
The EVALUATE date range was constant for each data set, over a 4-year cycle via a sliding
window of 1-year periods, from 9/30/2006 to 9/30/2010.
Table 6 - Data set naming convention
Test Set Name OPTIMIZE (years) VERIFY (years) EVALUATE (years)
401 4 0 1
411 4 1 1
441 4 4 1
801 8 0 1
811 8 1 1
3.3.2.1 Evaluation example
Strategy test set evaluation can be illustrated with an example. Table 7 illustrates stock
strategy selection (highlighted and numbered) based on highest efficiency factor for S&P100 test
set data with in-sample OPTIMIZE data from 9/30/2000 to 9/30/2004 and out-of-sample

A FUZZY LOGIC STOCK TRADING SYSTEM 85
VERIFY data from 9/30/2004 to 9/30/2008. Note that stocks are not selected for the portfolio
more than once in order to ensure portfolio diversification.
Table 7 - Example portfolio stock strategy selection based on highest efficiency factor
Name
Starting
Date
Ending
Date
Percent
Yearly
Profit
Percent
Max
Drawdown
Profit
Drawdown
Ratio
Number
Of
Trades Efficiency
01 WY FuzzyStochasticModel 10/2/2000 9/30/2004 20.60 5.32 12.34 30.00 43.07
01 WY FuzzyStochasticModel 9/30/2004 9/30/2008 10.65 10.18 3.49 31.00 43.07
02 LMT FuzzyStochasticModel 10/2/2000 9/30/2004 50.99 10.96 7.57 66.00 37.24
02 LMT FuzzyStochasticModel 9/30/2004 9/30/2008 13.71 8.86 4.92 97.00 37.24
03 NSC StandardBolingerBandsModel 10/2/2000 9/30/2004 53.51 14.62 6.93 44.00 35.69
03 NSC StandardBolingerBandsModel 9/30/2004 9/30/2008 32.26 15.45 5.15 41.00 35.69
04 OXY FuzzyStochasticModel 10/2/2000 9/30/2004 61.30 16.11 10.86 44.00 31.93
04 OXY FuzzyStochasticModel 9/30/2004 9/30/2008 52.41 19.96 2.94 37.00 31.93
05 HAL StandardPriceChannelModel 10/2/2000 9/30/2004 40.87 25.16 5.00 65.00 31.30
05 HAL StandardPriceChannelModel 9/30/2004 9/30/2008 40.25 15.23 6.26 69.00 31.30
06 BAX FuzzyStochasticModel 10/2/2000 9/30/2004 24.57 8.23 6.43 46.00 29.39
06 BAX FuzzyStochasticModel 9/30/2004 9/30/2008 14.45 8.96 4.57 54.00 29.39
07 GILD FuzzyStochasticModel 10/2/2000 9/30/2004 105.35 7.82 9.73 33.00 26.66
07 GILD FuzzyStochasticModel 9/30/2004 9/30/2008 13.40 11.28 2.74 19.00 26.66
08 WFC FuzzyMacdModel 10/2/2000 9/30/2004 26.08 12.59 6.04 35.00 26.52
08 WFC FuzzyMacdModel 9/30/2004 9/30/2008 28.35 14.63 4.39 34.00 26.52
HAL FuzzyBolingerBandsModel 10/2/2000 9/30/2004 53.35 21.29 7.02 68.00 25.34
HAL FuzzyBolingerBandsModel 9/30/2004 9/30/2008 20.33 16.08 3.61 70.00 25.34
GILD FuzzyMacdModel 10/2/2000 9/30/2004 152.61 27.93 10.62 36.00 24.74
GILD FuzzyMacdModel 9/30/2004 9/30/2008 20.84 17.36 2.33 13.00 24.74
09 TGT FuzzyStochasticModel 10/2/2000 9/30/2004 26.10 4.45 14.27 30.00 23.40
09 TGT FuzzyStochasticModel 9/30/2004 9/30/2008 3.98 9.00 1.64 24.00 23.40
HAL FuzzyRelativeStrengthIndexModel 10/2/2000 9/30/2004 45.39 25.13 5.24 63.00 22.17
HAL FuzzyRelativeStrengthIndexModel 9/30/2004 9/30/2008 30.55 14.13 4.23 68.00 22.17
WY StandardMacdModel 10/2/2000 9/30/2004 27.94 8.53 7.81 43.00 21.63
WY StandardMacdModel 9/30/2004 9/30/2008 11.56 15.23 2.77 40.00 21.63
10 CVS FuzzyStochasticModel 10/2/2000 9/30/2004 24.22 7.77 9.84 31.00 21.25
10 CVS FuzzyStochasticModel 9/30/2004 9/30/2008 10.15 14.03 2.16 51.00 21.25
Each selected portfolio stock strategy is then evaluated with out-of-sample EVALUATE
data from 9/30/2008 to 9/30/2009. With a starting value of $10,000 for each strategy, Table 8
shows the value at the end of the trading simulation period for the optimized strategies portfolio
in the “Strategy Value” column, and totaled on row “Portfolio Value”. The portfolio stocks are
also evaluated using benchmark buy-and-hold and 200-day simple moving average trading
simulations. In this example, the optimized portfolio strategies outperformed buy-and-hold and
200-day moving average benchmark strategies of the same portfolio stocks.
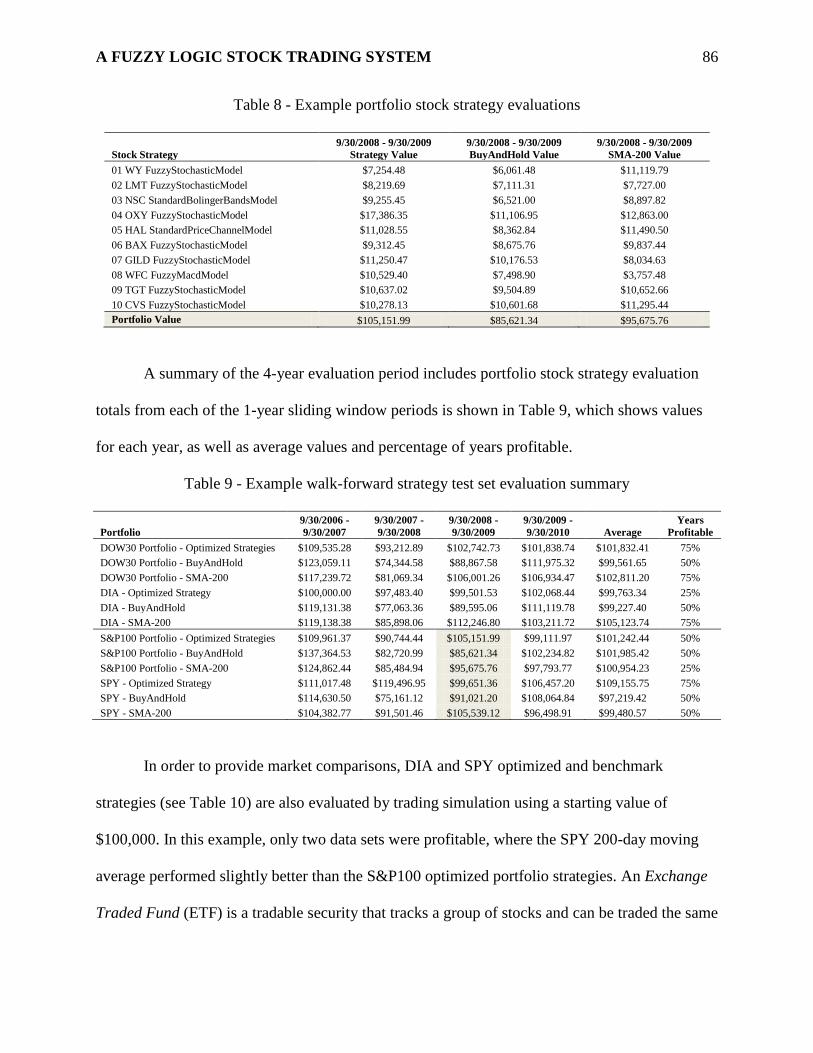
A FUZZY LOGIC STOCK TRADING SYSTEM 86
Table 8 - Example portfolio stock strategy evaluations
Stock Strategy
9/30/2008 - 9/30/2009
Strategy Value
9/30/2008 - 9/30/2009
BuyAndHold Value
9/30/2008 - 9/30/2009
SMA-200 Value
01 WY FuzzyStochasticModel $7,254.48 $6,061.48 $11,119.79
02 LMT FuzzyStochasticModel $8,219.69 $7,111.31 $7,727.00
03 NSC StandardBolingerBandsModel $9,255.45 $6,521.00 $8,897.82
04 OXY FuzzyStochasticModel $17,386.35 $11,106.95 $12,863.00
05 HAL StandardPriceChannelModel $11,028.55 $8,362.84 $11,490.50
06 BAX FuzzyStochasticModel $9,312.45 $8,675.76 $9,837.44
07 GILD FuzzyStochasticModel $11,250.47 $10,176.53 $8,034.63
08 WFC FuzzyMacdModel $10,529.40 $7,498.90 $3,757.48
09 TGT FuzzyStochasticModel $10,637.02 $9,504.89 $10,652.66
10 CVS FuzzyStochasticModel $10,278.13 $10,601.68 $11,295.44
Portfolio Value $105,151.99 $85,621.34 $95,675.76
A summary of the 4-year evaluation period includes portfolio stock strategy evaluation
totals from each of the 1-year sliding window periods is shown in Table 9, which shows values
for each year, as well as average values and percentage of years profitable.
Table 9 - Example walk-forward strategy test set evaluation summary
Portfolio
9/30/2006 -
9/30/2007
9/30/2007 -
9/30/2008
9/30/2008 -
9/30/2009
9/30/2009 -
9/30/2010 Average
Years
Profitable
DOW30 Portfolio - Optimized Strategies $109,535.28 $93,212.89 $102,742.73 $101,838.74 $101,832.41 75%
DOW30 Portfolio - BuyAndHold $123,059.11 $74,344.58 $88,867.58 $111,975.32 $99,561.65 50%
DOW30 Portfolio - SMA-200 $117,239.72 $81,069.34 $106,001.26 $106,934.47 $102,811.20 75%
DIA - Optimized Strategy $100,000.00 $97,483.40 $99,501.53 $102,068.44 $99,763.34 25%
DIA - BuyAndHold $119,131.38 $77,063.36 $89,595.06 $111,119.78 $99,227.40 50%
DIA - SMA-200 $119,138.38 $85,898.06 $112,246.80 $103,211.72 $105,123.74 75%
S&P100 Portfolio - Optimized Strategies $109,961.37 $90,744.44 $105,151.99 $99,111.97 $101,242.44 50%
S&P100 Portfolio - BuyAndHold $137,364.53 $82,720.99 $85,621.34 $102,234.82 $101,985.42 50%
S&P100 Portfolio - SMA-200 $124,862.44 $85,484.94 $95,675.76 $97,793.77 $100,954.23 25%
SPY - Optimized Strategy $111,017.48 $119,496.95 $99,651.36 $106,457.20 $109,155.75 75%
SPY - BuyAndHold $114,630.50 $75,161.12 $91,021.20 $108,064.84 $97,219.42 50%
SPY - SMA-200 $104,382.77 $91,501.46 $105,539.12 $96,498.91 $99,480.57 50%
In order to provide market comparisons, DIA and SPY optimized and benchmark
strategies (see Table 10) are also evaluated by trading simulation using a starting value of
$100,000. In this example, only two data sets were profitable, where the SPY 200-day moving
average performed slightly better than the S&P100 optimized portfolio strategies. An Exchange
Traded Fund (ETF) is a tradable security that tracks a group of stocks and can be traded the same

A FUZZY LOGIC STOCK TRADING SYSTEM 87
way individual stocks can. DIA is an ETF that tracks the DOW30 market index. SPY is an ETF
that tracks the S&P500 market index, used because no S&P100 ETF with sufficient historical
data was available.
Table 10 - Example DIA & SPY strategy selections based on highest efficiency factor
Name
Starting
Date
Ending
Date
Percent
Yearly
Profit
Percent
Max
Drawdown
Profit
Drawdown
Ratio
Number
Of
Trades Efficiency
01 DIA FuzzyStochasticModel 10/2/2000 9/30/2004 7.56 5.05 4.82 35.00 3.52
01 DIA FuzzyStochasticModel 9/30/2004 9/30/2008 2.85 13.22 0.73 46.00 3.52
02 SPY FuzzyRelativeStrengthIndexModel 10/2/2000 9/30/2004 4.61 3.47 4.53 36.00 2.22
02 SPY FuzzyRelativeStrengthIndexModel 9/30/2004 9/30/2008 0.79 6.15 0.49 72.00 2.22
DIA StandardBolingerBandsModel 10/2/2000 9/30/2004 9.34 20.18 1.68 42.00 2.05
DIA StandardBolingerBandsModel 9/30/2004 9/30/2008 8.01 19.96 1.22 21.00 2.05
DIA StandardRelativeStrengthIndexModel 10/2/2000 9/30/2004 6.73 12.51 1.72 40.00 0.86
DIA StandardRelativeStrengthIndexModel 9/30/2004 9/30/2008 0.75 5.80 0.50 25.00 0.86
SPY FuzzyRateOfChangeModel 10/2/2000 9/30/2004 8.48 15.24 2.17 36.00 0.11
SPY FuzzyRateOfChangeModel 9/30/2004 9/30/2008 0.45 27.03 0.05 22.00 0.11
DIA FuzzyBolingerBandsModel 10/2/2000 9/30/2004 2.10 11.34 0.67 33.00 0.04
DIA FuzzyBolingerBandsModel 9/30/2004 9/30/2008 0.33 16.96 0.06 34.00 0.04

A FUZZY LOGIC STOCK TRADING SYSTEM 88
Chapter 4 – Project Analysis and Results
4.1 Data collected
The data collected are a result of approximately 4,360 hours of continuous computing, as
shown in Table 11. Equipment used for data collection included a suite of up to five
contemporary personal computers.
Table 11 - Data collection hours
Data set type
Approximate
hours per data set Data sets Hours
S&P100 8-year optimize 400 4 1600
DOW30 8-year optimize 150 4 600
S&P100 4-year optimize 180 9 1620
DOW30 4-year optimize 60 9 540
Total Hours 4,360
4.2 Optimized portfolio strategies
Table 12 summarizes the optimized portfolio strategies selected for all of the data sets
collected. It shows that the fuzzy strategies dominated the standard strategies, based on the
following observations:
Fuzzy strategy selection (81.1%) far exceeded that of the standard strategies (18.9%).
The top three strategies are fuzzy strategies, and represent 76% of all strategies selected.
The top six strategies, those selected more than two percent of the time, represent 94% of
all strategies selected, with four of the six being fuzzy strategies.
Table 12 - Test set portfolio strategies summary
Portfolio Strategy Count Percent
Fuzzy Stochastic 167 43.9%
Fuzzy Relative Strength Index 63 16.6%
Fuzzy MACD 58 15.3%
Standard MACD 30 7.9%

A FUZZY LOGIC STOCK TRADING SYSTEM 89
Standard Stochastic 30 7.9%
Fuzzy Price Channel 9 2.4%
Standard Bollinger Bands 6 1.6%
Fuzzy Bollinger Bands 4 1.1%
Fuzzy Exponential Moving Average 3 0.8%
Fuzzy Rate Of Change 2 0.5%
Standard Relative Strength Index 2 0.5%
Fuzzy On Balance Volume 1 0.3%
Fuzzy Simple Moving Average Crossover 1 0.3%
Standard Price Channel 1 0.3%
Standard Rate Of Change 1 0.3%
Standard Simple Moving Average Crossover 1 0.3%
Standard Simple Moving Average 1 0.3%
Fuzzy Strategies 308 81.1%
Standard Strategies 72 18.9%
Total Strategies 380 100.0%
4.3 Test set profit summaries
The following tables present profit summaries, as a percentage, for the five data sets
collected, as outlined in section 3.3.2. Each table shows the profit for each 1-year sliding
window, the yearly average of the 4-year period, and the percentage of years profitable. The
optimized strategy portfolios will be analyzed in comparison to market benchmarks as well as
alternative trading portfolios.
Note that the values for the DIA and SPY BuyAndHold and SMA-200 portfolios are the
same in each of the tables, since these portfolios are not dependent on the test set portfolios.
From the DIA and SPY BuyAndHold portfolios, it can be seen that year 1 was a strong up year
for the markets, year 2 was a strong down year, year 3 was a moderate down year, and year 4
was a moderate up year.

A FUZZY LOGIC STOCK TRADING SYSTEM 90
4.3.1 Test set 401 profit summaries
Table 13 shows the profit summaries for test set 401, with a 4-year optimization period
and no verification period.
Table 13 - Test set 401 profit summaries
Portfolio
9/30/2006 -
9/30/2007
Profit - yr 1
9/30/2007 -
9/30/2008
Profit - yr 2
9/30/2008 -
9/30/2009
Profit - yr 3
9/30/2009 -
9/30/2010
Profit - yr 4
Average
Profit
Years
Profitable
DOW30 Portfolio - Optimized Strategies 9.0% -7.9% 1.1% -1.5% 0.2% 50%
DOW30 Portfolio - BuyAndHold 20.4% -24.8% -4.1% 14.1% 1.4% 50%
DOW30 Portfolio - SMA-200 15.9% -17.0% 10.4% 8.5% 4.5% 75%
DIA - Optimized Strategy 9.5% -18.8% -10.6% 0.6% -4.8% 50%
DIA - BuyAndHold 19.1% -22.9% -10.4% 11.1% -0.8% 50%
DIA - SMA-200 19.1% -14.1% 12.2% 3.2% 5.1% 75%
S&P100 Portfolio - Optimized Strategies 21.4% -4.2% 14.4% 3.3% 8.7% 75%
S&P100 Portfolio - BuyAndHold 38.7% -26.1% -8.6% 2.4% 1.6% 50%
S&P100 Portfolio - SMA-200 22.3% -20.4% -5.9% -1.1% -1.3% 25%
SPY - Optimized Strategy 4.5% -10.1% 1.4% 4.6% 0.1% 75%
SPY - BuyAndHold 14.6% -24.8% -9.0% 8.1% -2.8% 50%
SPY - SMA-200 4.4% -8.5% 5.5% -3.5% -0.5% 50%
The DOW30 optimized portfolio performed poorly, with 0.2% average profit and 50%
profitable years, although it did better than DIA optimized strategy and buy-and-hold which lost
on average. It did limit losses during down years (2 and 3) but did not perform well in up years
(1 and 4). DIA SMA-200 performed best in the group, with 5.1% average profit and 75%
profitable years.
The S&P100 optimized portfolio performed well, with 8.7% average profit and 75%
profitable years, beating all other portfolios. It minimized losses in down year 2, and profited
well in down year 3 and in up years (1 and 4).
4.3.2 Test set 411 profit summaries
Table 14 shows the profit summaries for test set 411, with a 4-year optimization period
and 1-year verification period.

A FUZZY LOGIC STOCK TRADING SYSTEM 91
Table 14 - Test set 411 profit summaries
Portfolio
9/30/2006 -
9/30/2007
Profit - yr 1
9/30/2007 -
9/30/2008
Profit - yr 2
9/30/2008 -
9/30/2009
Profit - yr 3
9/30/2009 -
9/30/2010
Profit - yr 4
Average
Profit
Years
Profitable
DOW30 Portfolio - Optimized Strategies 12.0% -4.0% -5.7% -2.2% 0.0% 25%
DOW30 Portfolio - BuyAndHold 25.0% -20.1% -7.8% 10.2% 1.8% 50%
DOW30 Portfolio - SMA-200 20.6% -16.4% 3.0% 3.5% 2.7% 75%
DIA - Optimized Strategy 5.8% -23.5% -1.3% 2.3% -4.2% 50%
DIA - BuyAndHold 19.1% -22.9% -10.4% 11.1% -0.8% 50%
DIA - SMA-200 19.1% -14.1% 12.2% 3.2% 5.1% 75%
S&P100 Portfolio - Optimized Strategies 6.6% -5.6% 1.2% 9.1% 2.8% 75%
S&P100 Portfolio - BuyAndHold 16.6% -18.9% -4.2% 21.2% 3.7% 50%
S&P100 Portfolio - SMA-200 9.0% -20.1% -5.6% 14.0% -0.7% 50%
SPY - Optimized Strategy 14.4% -12.7% 0.0% 0.9% 0.6% 50%
SPY - BuyAndHold 14.6% -24.8% -9.0% 8.1% -2.8% 50%
SPY - SMA-200 4.4% -8.5% 5.5% -3.5% -0.5% 50%
The DOW30 optimized portfolio performed poorly, with 0% average profit and 25%
profitable years, although it did better than DIA optimized strategy and buy-and-hold which lost
on average. It did limit losses during down years (2 and 3), did reasonably well in up year 1, but
lost in up year 4. DIA SMA-200 performed best in the group, with 5.1% average profit and 75%
profitable years.
The S&P100 optimized portfolio had modest gains, with 2.8% average profit and 75%
profitable years, and did better than SPY optimized strategy, buy-and-hold, and SMA-200
portfolios. It limited losses during down year 2, had a slight gain in down year 3, modest gains in
up year 1, and good gains in up year 4. S&P100 portfolio buy-and-hold performed best in the
group, with 3.7% average profit and 50% profitable years.
4.3.3 Test set 441 profit summaries
Table 15 shows the profit summaries for test set 441, with a 4-year optimization period
and 4-year verification period.
Table 15 - Test set 441 profit summaries
Portfolio
9/30/2006 -
9/30/2007
Profit - yr 1
9/30/2007 -
9/30/2008
Profit - yr 2
9/30/2008 -
9/30/2009
Profit - yr 3
9/30/2009 -
9/30/2010
Profit - yr 4
Average
Profit
Years
Profitable

A FUZZY LOGIC STOCK TRADING SYSTEM 92
DOW30 Portfolio - Optimized Strategies 9.5% -6.8% 2.7% 1.8% 1.8% 75%
DOW30 Portfolio - BuyAndHold 23.1% -25.7% -11.1% 12.0% -0.4% 50%
DOW30 Portfolio - SMA-200 17.2% -18.9% 6.0% 6.9% 2.8% 75%
DIA - Optimized Strategy 0.0% -2.5% -0.5% 2.1% -0.2% 25%
DIA - BuyAndHold 19.1% -22.9% -10.4% 11.1% -0.8% 50%
DIA - SMA-200 19.1% -14.1% 12.2% 3.2% 5.1% 75%
S&P100 Portfolio - Optimized Strategies 10.0% -9.3% 5.2% -0.9% 1.2% 50%
S&P100 Portfolio - BuyAndHold 37.4% -17.3% -14.4% 2.2% 2.0% 50%
S&P100 Portfolio - SMA-200 24.9% -14.5% -4.3% -2.2% 1.0% 25%
SPY - Optimized Strategy 11.0% 19.5% -0.3% 6.5% 9.2% 75%
SPY - BuyAndHold 14.6% -24.8% -9.0% 8.1% -2.8% 50%
SPY - SMA-200 4.4% -8.5% 5.5% -3.5% -0.5% 50%
The DOW30 optimized portfolio had only slight gains, with 1.8% average profit and 75%
profitable years, although it did better than DIA optimized strategy and buy-and-hold which lost
on average. It limited losses during down year 2, had a modest gain in down year 3, modest gains
in up year 1, and slight gains in up year 4. DIA SMA-200 performed best in the group, with
5.1% average profit and 75% profitable years.
The S&P100 optimized portfolio also had only slight gains, with 1.2% average profit and
50% profitable years, although it did better than SPY buy-and-hold and SMA-200 which lost on
average. It limited losses during down year 2, had reasonable gains in down year 3, reasonable
gains in up year 1, but a slight loss in up year 4. The SPY optimized strategy performed best in
the group, with 9.2% average profit and 75% profitable years.
4.3.4 Test set 801 profit summaries
Table 16 shows the profit summaries for test set 801, with an 8-year optimization period
and no verification period.
Table 16 - Test set 801 profit summaries
Portfolio
9/30/2006 -
9/30/2007
Profit - yr 1
9/30/2007 -
9/30/2008
Profit - yr 2
9/30/2008 -
9/30/2009
Profit - yr 3
9/30/2009 -
9/30/2010
Profit - yr 4
Average
Profit
Years
Profitable
DOW30 Portfolio - Optimized Strategies 8.5% -3.4% 5.1% -0.2% 2.5% 50%
DOW30 Portfolio - BuyAndHold 25.0% -18.9% -10.6% 12.8% 2.1% 50%
DOW30 Portfolio - SMA-200 19.4% -17.9% 12.7% 7.2% 5.3% 75%
DIA - Optimized Strategy 0.0% 5.4% 4.6% 9.7% 4.9% 75%
DIA - BuyAndHold 19.1% -22.9% -10.4% 11.1% -0.8% 50%

A FUZZY LOGIC STOCK TRADING SYSTEM 93
DIA - SMA-200 19.1% -14.1% 12.2% 3.2% 5.1% 75%
S&P100 Portfolio - Optimized Strategies 6.6% -3.2% 6.9% 0.2% 2.6% 75%
S&P100 Portfolio - BuyAndHold 15.1% -14.5% -8.2% -5.1% -3.2% 25%
S&P100 Portfolio - SMA-200 -0.2% -14.0% 11.5% 0.1% -0.6% 50%
SPY - Optimized Strategy 7.7% 4.3% 0.0% 4.4% 4.1% 75%
SPY - BuyAndHold 14.6% -24.8% -9.0% 8.1% -2.8% 50%
SPY - SMA-200 4.4% -8.5% 5.5% -3.5% -0.5% 50%
The DOW30 optimized portfolio had modest gains, with 2.5% average profit and 50%
profitable years, although it did better than DIA buy-and-hold which lost on average. It limited
losses during down year 2, but not in down year 3, modest gains in up year 1, and a slight loss in
up year 4. DOW30 SMA-200 performed best in the group, with 5.3% average profit and 75%
profitable years.
The S&P100 optimized portfolio had modest gains, with 2.6% average profit and 75%
profitable years, although it did better than SPY buy-and-hold and SMA-200 which lost on
average. It limited losses during down year 2, had a nice gain in down year 3, modest gains in up
year 1, and a very slight gain in up year 4. The SPY optimized portfolio performed best in the
group, with 4.1% average profit and 75% profitable years.
4.3.5 Test set 811 profit summaries
Table 17 shows the profit summaries for test set 801, with an 8-year optimization period
and 1-year verification period.
Table 17 - Test set 811 profit summaries
Portfolio
9/30/2006 -
9/30/2007
Profit - yr 1
9/30/2007 -
9/30/2008
Profit - yr 2
9/30/2008 -
9/30/2009
Profit - yr 3
9/30/2009 -
9/30/2010
Profit - yr 4
Average
Profit
Years
Profitable
DOW30 Portfolio - Optimized Strategies -6.4% -0.3% -0.8% -2.5% 0%
DOW30 Portfolio - BuyAndHold -27.8% -7.6% 3.0% -10.8% 33%
DOW30 Portfolio - SMA-200 -19.0% 0.4% 1.5% -5.7% 67%
DIA - Optimized Strategy 0.0% 3.0% -0.2% 0.9% 33%
DIA - BuyAndHold -22.9% -10.4% 11.1% -7.4% 33%
DIA - SMA-200 -14.1% 12.2% 3.2% 0.5% 67%
S&P100 Portfolio - Optimized Strategies 3.5% 0.0% 2.6% 2.0% 67%
S&P100 Portfolio - BuyAndHold -14.9% -12.5% 2.6% -8.3% 33%
S&P100 Portfolio - SMA-200 -14.4% -13.5% -0.6% -9.5% 0%
SPY - Optimized Strategy -4.1% 4.1% -1.1% -0.3% 33%

A FUZZY LOGIC STOCK TRADING SYSTEM 94
SPY - BuyAndHold -24.8% -9.0% 8.1% -8.6% 33%
SPY - SMA-200 -8.5% 5.5% -3.5% -2.2% 33%
Note that this data set is incomplete; no data was collected for year 1. This is because for
this test set, the EVALUATE period of 9/30/2006 to 9/30/2007 would require the OPTOMIZE
period to start 9/30/1997, but data were only collected over a 12 year period from 9/30/1998 to
9/30/2010. Therefore, this test set cannot be fully analyzed. However, it appears that the DOW30
optimized portfolio would likely not have performed well, although the S&P100 optimized
portfolio likely would have.
4.4 Successful portfolios
Based on section 2.3.3, a portfolio can be considered successful when its average profit is
greater than zero and it is profitable in at least 75% of the years in the four year cycle. Table 18
summarizes the successful portfolios from all the test sets, resulting in the following
observations:
Most of the portfolios in the top half of the list did not use a verification period.
The SPY optimized strategy appears three times in the list, while DIA optimized strategy
appears only once.
The S&P100 optimized portfolio appears three times in the list, while DOW30 optimized
portfolio appears only once near the bottom with only 1.8% average profits.
It is interesting that DOW30 SMA-200 portfolio appears four times. This portfolio is
made up of the stocks selected during the DOW30 portfolio optimization, but uses the
SMA-200 strategy instead of the portfolio optimized strategies. In other words, the
optimization selects the stocks but not the strategies. The S&P100 SMA-200 portfolio did
not appear in the list.

A FUZZY LOGIC STOCK TRADING SYSTEM 95
It is interesting to note that DIA SMA-200 is on the list, but SPY SMA-200 is not.
Table 18 - Successful portfolios
Portfolio
Test
Set Average Profit
SPY - Optimized Strategy 441 9.2%
S&P100 Portfolio - Optimized Strategies 401 8.7%
DOW30 Portfolio - SMA-200 801 5.3%
DIA - SMA-200 ALL 5.1%
DIA - Optimized Strategy 801 4.9%
DOW30 Portfolio - SMA-200 401 4.5%
SPY - Optimized Strategy 801 4.1%
DOW30 Portfolio - SMA-200 441 2.8%
S&P100 Portfolio - Optimized Strategies 411 2.8%
DOW30 Portfolio - SMA-200 411 2.7%
S&P100 Portfolio - Optimized Strategies 801 2.6%
DOW30 Portfolio - Optimized Strategies 441 1.8%
SPY - Optimized Strategy 401 0.1%
A FUZZY LOGIC STOCK TRADING SYSTEM 96
Chapter 5 – Conclusions
5.1 Research findings
The results of section 4.2 show that as a group the fuzzy trading strategies in the
developed trading system significantly outperformed the standard trading strategies, and thus
significantly improved overall performance of the system. This confirms that fuzzy logic can
have a positive contribution to a successful trading system.
The results of section 4.4 show that the developed system produced a number of
successful trading portfolios, which confirms that once a successful trading system has been
developed and verified, an average trader can be successful by simply following the trading
system’s buy and sell signals. The trader need not be an expert at interpreting the underlying
technical indicators, or react to price movements emotionally. The trading decisions are made by
the trading system, so the only decision that the average trader need make is whether there is
enough confidence in the system to commit real money in live trading.
5.2 Lessons learned
Different stocks have different price pattern cycles and the same strategy does not work
the same for all stocks, so each stock must be evaluated to determine what strategy works best
for that stock. When the trading system creates strategy test sets, it selects the best stock trading
strategies which include not only the trading strategy but the corresponding stock as well. This
confirms that selecting the right stock may be just as important as the trading strategy (Doeksen,
Abraham, Thomas, & Paprzycki, 2005).
Successful trading strategies developed and verified over one time period are no
guarantee that they will continue to perform well in other time periods. In order to maximize
profits and achieve consistently good performance, a trading system should tightly control

A FUZZY LOGIC STOCK TRADING SYSTEM 97
investment risks (Colby & Meyers, 1988, pp. 4-17) in order to avoid significant losses. This
research diversified investment with portfolios consisting of ten stocks in order to reduce overall
risk of significant losses resulting from a single loosing stock strategy.
5.3 Limitations
The results of section 4.4 show the successful portfolios for the 4-year period tested via
1-year sliding windows. In order to increase confidence in a trading system, it can be tested over
other time periods to verify that it maintains consistent performance, before committing real
money in live trading.
The process to create a strategy test set is fully automated in the system developed, but
the process to evaluate, summarize, and analyze the results is a manual process. A significant
reduction in time and effort would result by automating more of the evaluation process.
Construction of strategy test sets as designed allow only limited options. It would be more
flexible to allow selection of which trading models to include when combining trading models
into a trading strategy.
The results of section 4.1 shows that the time required to create a strategy test set can be
significant, mainly due to optimization time. Possible ways to reduce optimization time might
include:
Reduce the number of stocks in the data collection group, and possibly reduce the
number of stocks in the optimized portfolio. This could be achieved while maintaining
portfolio diversification by using ETFs such as DIA and SPY as well as other market
index or sector ETFs, instead of individual company stocks. The results of section 4.4
seem to support this idea as the optimized strategies of the index ETFs DIA and SPY
performed quite well.

A FUZZY LOGIC STOCK TRADING SYSTEM 98
Distribute processing over multiple computers. This would enable adding computers to
reduce execution time, roughly in inverse proportion.
Reduce the number of trading strategies in the test set. The results of section 4.2 show a
concentration of selected strategies in relatively few strategies. Reducing the number of
strategies in the test set from twenty to the top six strategies would significantly reduce
processing time.
5.4 Future research
As noted in section 4.4, a significant number of successful portfolios did not use a
verification period. This seems to contradict conventional wisdom (Colby & Meyers, 1988, pp.
18-19; Katz & McCormick, 2000, pp. 43-45; Weissman, 2005, pp. 148-150) that verification is
essential. It also suggests the need to further investigate alternate ways to calculate efficiency
factor used in this research, to improve correlation between efficiency factor and maintained
performance.
The top strategies as shown in section 4.2 tend be shorter-term trading strategies resulting
in relative active trading. In order to allow more flexibility in trading styles, future research
could investigate including more optimization filters, such as average trade duration, to allow
longer-term as well as shorter-term trading preferences.
Future research might develop additional trading models based on other technical
indicators, as well as other trading models that may not correspond to an underlying technical
indicator, such as up x-days consecutively and x-week highs/lows.
This research did not investigate the use of trend filters. Additional research might
develop a trend model that signals whether the market is trending or not. This trend filter could
signal a trading strategy to use trend-following trading models when price is trending and

A FUZZY LOGIC STOCK TRADING SYSTEM 99
counter-trend trading models when price is not trending (Katz & McCormick, 2000, pp. 85,102-
103,131; Murphy, 1999, pp. 384-387,390; Ruggiero, 1997, pp. 48, 59, 78-80,215,263; Stridsman,
2001, pp. 70,234,241-242,250-253; Weissman, 2005, pp. 27-29, 56-58). The trend filter could
also be used to signal a trading strategy to only trade in the direction of the trend (Stridsman,
2001, pp. 70, 87,228).

A FUZZY LOGIC STOCK TRADING SYSTEM 100
References
Achelis, S. (2001). Technical analysis from A to Z (2nd
ed.). New York: McGraw Hill.
Ahmad, S., Gayar, N., & Elazim, H. (2006). A fuzzy engine model for efficient stock market
prediction. Proceedings of the 5th WSEAS Int. Conf. on COMPUTATIONAL
INTELLIGENCE, MAN-MACHINE SYSTEMS AND CYBERNETICS, Venice, Italy,
November 20-22, 2006. Retrieved June 2, 2010, from http://www.wseas.us/e-
library/conferences/2006venice/papers/539-672.pdf
Callan, R. (2003). Artificial intelligence. New York: Palgrave Macmillan.
Castellano, G., Fanelli, A., & Mencar, C. (2003). Design of transparent Mamdani fuzzy inference
systems. In Design and Application of Hybrid intelligent Systems, IOS Press, Amsterdam,
The Netherlands, 468-476. Retrieved January 16, 2010, from
http://www.di.uniba.it/~castellano/papers/HIS2003.pdf.
Cheung, W. & Kaymak, U. (2007). A fuzzy logic based trading system. 3rd European
Symposium on Nature-inspired Smart Information Systems. Retrieved January 16, 2010,
from http://www.nisis.risk-
technologies.com/events/symp2007/papers/BB25_p_kaymak.pdf.
Colby, R. & Meyers, T. (1988). The encyclopedia of technical market indicators. New York:
Irwin Professional Publishing.
Cox, E. (1995). Fuzzy logic for business and industry. Rockland, MA: Charles River Media, Inc.
Cox, E. (1999). The fuzzy systems handbook: A practitioner’s guide to building, using, and
maintaining fuzzy systems (2nd
ed.). San Diego, CA: Academic Press.

A FUZZY LOGIC STOCK TRADING SYSTEM 101
Doeksen, B., Abraham, A., Thomas, J., & Paprzycki, M. (2005). Real stock trading using soft
computing models, IEEE International Conference on Information Technology: Coding
and Computing (ITCC'05), USA, IEEE Computer Society, pp. 162-167. Retrieved
January 16, 2010, from http://www.softcomputing.net/itcc05_03.pdf.
Dourra, H. & Siy, P. (2002). Investment using technical analysis and fuzzy logic. Fuzzy Sets and
Systems, 2002. 127: pp. 221-240. Retrieved June 2, 2010, from
http://sedok.narod.ru/s_files/poland/Dourra_Siy.pdf.
Edwards, R. & Magee, J. (1992). Technical analysis of stock trends (6th
ed.). Boston: John
Magee Inc.
Gamil, A., El-fouly, R., & Darwish, N. (2007). Stock technical analysis using multi agent and
fuzzy logic. Proceedings of the World Congress on Engineering 2007 Vol I, WCE 2007,
July 2 - 4, 2007, London, U.K. Retrieved January 16, 2010, from
http://www.iaeng.org/publication/WCE2007/WCE2007_pp142-147.pdf.
Ghandar, A., Michalewicz, Z., Schmidt, M., To, T., and Zurbrugg, R. (2009). Computational
intelligence for evolving trading rules. Evolutionary Computation, IEEE Transactions on,
13(1):71-86. Retrieved June 2, 2010, from
http://www.finheuristics.com/doc/technicalpaper.pdf.
Katz, J. & McCormick, D. (2000). The encyclopedia of trading strategies. New York: McGraw-
Hill.
Khcherem & Bouri. (2009). Fuzzy logic and investment strategy. Global Economy & Finance
Journal Vol. 2 No. 2 September 2009, pp. 22-37. Retrieved June 2, 2010, from
http://wbiaus.org/2.Fatma-Lestet.pdf.

A FUZZY LOGIC STOCK TRADING SYSTEM 102
Li, J. & Yang J. (2008). A trading decision support system based on neuro-fuzzy technique:
Evidence from Asian stock market. Journal of International Management Studies,
February 2008, pp. 235-242. Retrieved June 2, 2010, from
http://www.jimsjournal.org/28%20Jia-Hao%20Li.pdf.
Miner, R. (2009). High probability trading strategies: Entry to exit tactics for the forex, futures,
and stock markets. Hoboken, N.J.: John Wiley & Sons, Inc.
Murphy, J. (1999). Technical analysis of the financial markets: A comprehensive guide to
trading methods and applications. New York: New York Institute of Finance.
Popoola, A., Ahmad, S. & Ahmad, K. (2004). A fuzzy-wavelet method for analyzing non-
stationary time series. In Proc. of The 5th Int. Conf. on Recent Advances in Soft
Computing (December 16-18, 2004, Nottingham, UK). Retrieved March 3, 2010, from
http://www.computing.surrey.ac.uk/grid/fingrid/papers_files/Reports/12.pdf.
Rao, V. & Rao, H. (1993). C++ neural networks and fuzzy logic. New York: Management
Information Source, Inc.
Renz, C. (2004). The investor’s guide to technical analysis. New York: McGraw-Hill.
Ruggiero, M. (1997). Cybernetic trading strategies: Developing a profitable trading system with
state-of-the-art technologies. New York: John Wiley & Sons, Inc.
Russell, S. & Norvig, P. (2003). Artificial Intelligence: A modern approach (2nd
ed.). Upper
Saddle River, N.J.: Pearson Educational, Inc.
Schwager, J. (1999). Getting started in technical analysis. New York: John Wiley & Sons, Inc.
Scribner Software. (2010). TekView Explorer. Retrieved February 20, 2010, from
http://scribnersoftware.com/.

A FUZZY LOGIC STOCK TRADING SYSTEM 103
Stridsman, T. (2001). Trading systems that work: Building and evaluating effective trading
systems. New York: McGraw-Hill.
StockCharts.com. (2010). Multicollinearity. Retrieved May 27, 2010, from
http://stockcharts.com/school/doku.php?id=chart_school:trading_strategies:multicollinearity.
VonAltrock, C. (1997). Fuzzy logic & neurofuzzy applications in business & finance. Upper
Saddle River, N.J.: Prentice-Hall, Inc.
Weissman, R. (2005). Mechanical trading systems: Pairing trader psychology with technical
analysis. Hoboken, N.J.: John Wiley & Sons, Inc.
Zhizhin, M., Poyda, A., Mishin, D., Medvedev, D., Kihn, E., & Lutsarev, V. (2006). Scenario
search on the grid of environmental data sources. MSR Technical Report, July 2006.
Retrieved February 7, 2010, from http://research.microsoft.com/pubs/68030/tr-2006-
72.pdf.
Zhou, X. & Dong, M. (2004, July/August). Can fuzzy logic make technical analysis 20/20?
Financial Analysts Journal, Vol. 60, No. 4, pp. 54-73. Retrieved January 16, 2010, from
http://www.cs.wayne.edu/~mdong/fuzzytech.pdf.

A FUZZY LOGIC STOCK TRADING SYSTEM 104
Annotated Bibliography
Achelis, S. (2001). Technical analysis from A to Z (2nd
ed.). New York: McGraw Hill.
This book covers a comprehensive list of technical indicators, providing detailed
explanations of how each works including calculations and interpretations. The author’s
detailed example calculations are particularly useful for anyone developing software
implementations.
Ahmad, S., Gayar, N., & Elazim, H. (2006). A fuzzy engine model for efficient stock market
prediction. Proceedings of the 5th WSEAS Int. Conf. on COMPUTATIONAL
INTELLIGENCE, MAN-MACHINE SYSTEMS AND CYBERNETICS, Venice, Italy,
November 20-22, 2006. Retrieved June 2, 2010, from http://www.wseas.us/e-
library/conferences/2006venice/papers/539-672.pdf
This paper presents a fuzzy engine model that combines popular technical indicators with
fuzzy logic to predict stock price movement. The authors found that the fuzzy engine
model performed well compared to traditional indicators by providing more reliable buy
and sell signals.
Callan, R. (2003). Artificial intelligence. New York: Palgrave Macmillan.
This book introduces a range of artificial intelligence topics. The author introduces fuzzy
logic modeling as one approach to reasoning under uncertainty using illustrative
examples.
Castellano, G., Fanelli, A., & Mencar, C. (2003). Design of transparent Mamdani fuzzy inference
systems. In Design and Application of Hybrid intelligent Systems, IOS Press, Amsterdam,
The Netherlands, 468-476. Retrieved January 16, 2010, from
http://www.di.uniba.it/~castellano/papers/HIS2003.pdf.

A FUZZY LOGIC STOCK TRADING SYSTEM 105
This paper presents a technique to automatically design fuzzy system rules and input
functions based on available data. The authors illustrate the technique and the trade-off
between transparency and accuracy when training the system to an available data set by
selecting the maximum number of desired rules.
Cheung, W. & Kaymak, U. (2007). A fuzzy logic based trading system. 3rd European
Symposium on Nature-inspired Smart Information Systems. Retrieved January 16, 2010,
from http://www.nisis.risk-
technologies.com/events/symp2007/papers/BB25_p_kaymak.pdf.
This paper presents a successful fuzzy logic based trading system that uses popular
technical indicators, and optimized using a genetic algorithm and historical data. The
authors justify using genetic optimization over neural networks because of the increased
flexibility in fitness function and efficient search over large solution space without the
potential drawback that neural networks have to converge on local optima.
Colby, R. & Meyers, T. (1988). The encyclopedia of technical market indicators. New York:
Irwin Professional Publishing.
This book provides a thorough background of technical analysis concepts and technical
indicators. The authors include a comprehensive list of technical indicators, explaining
formulas to calculate and rules to interpret buy and sell trigger conditions. They also
discuss how technical indicators can be used to development and validate trading
systems.
Cox, E. (1995). Fuzzy logic for business and industry. Rockland, MA: Charles River Media, Inc.

A FUZZY LOGIC STOCK TRADING SYSTEM 106
This book focuses on the application of fuzzy logic using actual models and case studies
from business and industry. The author provides practical examples using modeling
concepts and software used in real world applications.
Cox, E. (1999). The fuzzy systems handbook: A practitioner’s guide to building, using, and
maintaining fuzzy systems (2nd
ed.). San Diego, CA: Academic Press.
This book provides a comprehensive introduction to fuzzy logic and fuzzy systems
design. The author includes a number of real world examples of fuzzy system
applications, as well as some software implementations.
Doeksen, B., Abraham, A., Thomas, J., & Paprzycki, M. (2005). Real stock trading using soft
computing models, IEEE International Conference on Information Technology: Coding
and Computing (ITCC'05), USA, IEEE Computer Society, pp. 162-167. Retrieved
January 16, 2010, from http://www.softcomputing.net/itcc05_03.pdf.
This paper compares performance of trading systems using neural networks, fuzzy logic,
and genetic algorithms. The authors found that picking the correct stock is as important
as building the best system. They also found that transaction costs can be significant in
trading systems.
Dourra, H. & Siy, P. (2002). Investment using technical analysis and fuzzy logic. Fuzzy Sets and
Systems, 2002. 127: pp. 221-240. Retrieved June 2, 2010, from
http://sedok.narod.ru/s_files/poland/Dourra_Siy.pdf.
This paper presents a fuzzy logic trading system based on several technical indicators.
The authors found that the system tested on four company stocks substantially
outperformed the S&P 500.

A FUZZY LOGIC STOCK TRADING SYSTEM 107
Edwards, R. & Magee, J. (1992). Technical analysis of stock trends (6th
ed.). Boston: John
Magee Inc.
This book provides a comprehensive foundation of technical analysis that covers the
time-tested as well as contemporary trading and investing techniques. The authors cover
the analysis of stock trends, chart analysis and technical patterns, and much more.
Gamil, A., El-fouly, R., & Darwish, N. (2007). Stock technical analysis using multi agent and
fuzzy logic. Proceedings of the World Congress on Engineering 2007 Vol I, WCE 2007,
July 2 - 4, 2007, London, U.K. Retrieved January 16, 2010, from
http://www.iaeng.org/publication/WCE2007/WCE2007_pp142-147.pdf.
This paper presents a fuzzy logic trading system based on technical analysis. Input fuzzy
variables are based on several simple moving averages with varying look-back periods.
The authors found that by tuning the system with genetic algorithms satisfactory results
were achieved.
Ghandar, A., Michalewicz, Z., Schmidt, M., To, T., and Zurbrugg, R. (2009). Computational
intelligence for evolving trading rules. Evolutionary Computation, IEEE Transactions on,
13(1):71-86. Retrieved June 2, 2010, from
http://www.finheuristics.com/doc/technicalpaper.pdf.
This paper presents a fuzzy logic trading system that uses an evolutionary algorithm to
adapt trading rules dynamically based on market conditions. The authors found that the
evolutionary approach was a significant improvement over fixed rule-based strategies.
Katz, J. & McCormick, D. (2000). The encyclopedia of trading strategies. New York: McGraw-
Hill.

A FUZZY LOGIC STOCK TRADING SYSTEM 108
This book explores methodologies for trading system development and evaluation. The
authors take a systematic approach for trading strategy development, back-testing, and
optimization techniques.
Khcherem & Bouri. (2009). Fuzzy logic and investment strategy. Global Economy & Finance
Journal Vol. 2 No. 2 September 2009, pp. 22-37. Retrieved June 2, 2010, from
http://wbiaus.org/2.Fatma-Lestet.pdf.
This paper presents a fuzzy logic trading system using technical indicators that was tested
on the Tunisian stock exchange. The authors found that for 25 stocks tested, the system
had 93.26% accuracy.
Li, J. & Yang J. (2008). A trading decision support system based on neuro-fuzzy technique:
Evidence from Asian stock market. Journal of International Management Studies,
February 2008, pp. 235-242. Retrieved June 2, 2010, from
http://www.jimsjournal.org/28%20Jia-Hao%20Li.pdf.
This paper presents a neuro-fuzzy trading system based on the stochastic technical
indicator. The authors tuned the system using a neural network and tested it on Asian
stock markets and found that it outperformed benchmark buy-and-hold and traditional
stochastic strategies.
Miner, R. (2009). High probability trading strategies: Entry to exit tactics for the forex, futures,
and stock markets. Hoboken, N.J.: John Wiley & Sons, Inc.
This book outlines a practical trading plan that the author has developed in over twenty
year experience. The author explains how to use simple pattern and timing strategies to
identify trend reversal, including a multiple time frame momentum strategy.

A FUZZY LOGIC STOCK TRADING SYSTEM 109
Murphy, J. (1999). Technical analysis of the financial markets: A comprehensive guide to
trading methods and applications. New York: New York Institute of Finance.
This book provides an excellent reference on the concepts of technical analysis and their
application. The author describes many technical indicators, including examples using
charts as well as clear explanations.
Popoola, A., Ahmad, S. & Ahmad, K. (2004). A fuzzy-wavelet method for analyzing non-
stationary time series. In Proc. of The 5th Int. Conf. on Recent Advances in Soft
Computing (December 16-18, 2004, Nottingham, UK). Retrieved March 3, 2010, from
http://www.computing.surrey.ac.uk/grid/fingrid/papers_files/Reports/12.pdf.
This paper presents a time series analysis approach using wavelet analysis and fuzzy
modeling. The authors demonstrate a fuzzy-wavelet prediction method to create fuzzy
rules from a decomposed non-stationary time series and found that the fuzzy-wavelet
approach performs better than pure fuzzy modeling.
Rao, V. & Rao, H. (1993). C++ neural networks and fuzzy logic. New York: Management
Information Source, Inc.
This book provides C++ programming examples for neural networks and fuzzy logic.
The authors cover some background theory of the technologies used in the examples.
Renz, C. (2004). The investor’s guide to technical analysis. New York: McGraw-Hill.
This book provides an introduction to the basic concepts of technical analysis and chart
interpretation. The author uses straightforward examples that clearly illustrate practical
trading strategies using chart pattern analysis.

A FUZZY LOGIC STOCK TRADING SYSTEM 110
Ruggiero, M. (1997). Cybernetic trading strategies: Developing a profitable trading system with
state-of-the-art technologies. New York: John Wiley & Sons, Inc.
This book explains how advanced technologies such as neural networks, fuzzy logic,
genetic algorithms, and others can be used to develop tradable market timing systems.
The author illustrates how these technologies can be incorporated into traditional
technical analysis strategies to greatly improve standard trading system performance.
Russell, S. & Norvig, P. (2003). Artificial Intelligence: A modern approach (2nd
ed.). Upper
Saddle River, N.J.: Pearson Educational, Inc.
This book introduces basic ideas in artificial intelligence. The author includes a brief
overview of fuzzy sets using a simple example.
Schwager, J. (1999). Getting started in technical analysis. New York: John Wiley & Sons, Inc.
This book explains the basic concepts of technical analysis such as trends, trading ranges,
and chart patterns. The author’s clear and simple explanations provide a framework for
using technical analysis as the basis for trend-following and counter-trend mechanical
trading systems.
Scribner Software. (2010). TekView Explorer. Retrieved February 20, 2010, from
http://scribnersoftware.com/.
This internet web site is home of the TekView Explorer investment software. The web
site discusses how fuzzy logic is used in the software to create and back-test trading
strategies.
Stridsman, T. (2001). Trading systems that work: Building and evaluating effective trading
systems. New York: McGraw-Hill.

A FUZZY LOGIC STOCK TRADING SYSTEM 111
This book provides guidelines for designing and evaluating rule-based mechanical
trading systems. The author discusses risk and money management techniques to
maximize profit and minimize risk.
StockCharts.com. (2010). Multicollinearity. Retrieved May 27, 2010, from
http://stockcharts.com/school/doku.php?id=chart_school:trading_strategies:multicollinearity.
This internet web page presents the concept of multicollinearity, using the same type of
information more than once. The author discusses the problem of a trading strategy
composed of multiple technical indicators that contribute redundant information.
VonAltrock, C. (1997). Fuzzy logic & neurofuzzy applications in business & finance. Upper
Saddle River, N.J.: Prentice-Hall, Inc.
This book illustrates the use of fuzzy logic in the design of business and financial
applications, and includes a demonstration version of the author’s fuzzyTECH software.
The author presents numerous case studies and explains the use of the software in the
implementation of fuzzy systems.
Weissman, R. (2005). Mechanical trading systems: Pairing trader psychology with technical
analysis. Hoboken, N.J.: John Wiley & Sons, Inc.
This book examines the development of mechanical trading systems using technical
analysis. The author discusses many related issues such as back-testing, risk
management, and optimization.
Zhizhin, M., Poyda, A., Mishin, D., Medvedev, D., Kihn, E., & Lutsarev, V. (2006). Scenario
search on the grid of environmental data sources. MSR Technical Report, July 2006.
Retrieved February 7, 2010, from http://research.microsoft.com/pubs/68030/tr-2006-
72.pdf.

A FUZZY LOGIC STOCK TRADING SYSTEM 112
This paper presents a system for distributed querying and mining of large environmental
data archives. The authors describe how the system uses fuzzy logic to allow users to
query the data in meaningful human linguistic terms.
Zhou, X. & Dong, M. (2004, July/August). Can fuzzy logic make technical analysis 20/20?
Financial Analysts Journal, Vol. 60, No. 4, pp. 54-73. Retrieved January 16, 2010, from
http://www.cs.wayne.edu/~mdong/fuzzytech.pdf.
This paper presents a fuzzy logic-based method to detect technical patterns in stock
charts. The authors found that the approach can detect subtle differences by using clearly
defined pattern templates.