a gap analysis in service quality of thai … … · a gap analysis in service quality of thai...
TRANSCRIPT
A GAP ANALYSIS IN SERVICE QUALITY OF THAI LOGISTICS
SERVICE PROVIDERS
Chatwadee Tansakul†and Jirachai Buddhakulsomsiri School of Manufacturing Systems and Mechanical Engineering,
Sirindhorn International Institute of Technology, Thammasat University,
Pathum Thani, 12121, THAILAND
+662-501-3505, Email: [email protected] and [email protected]
Thananya Wasusri, Papusson Chaiwat and Taweesak Kritjaroen Graduate School of Management and Innovation,
King Mongkut’s University of Technology Thonburi
Bangkok, 10140, THAILAND
+662-470-8000, Email: [email protected], papusson.cha@ kmutt.ac.th
and taweesak@ kmutt.ac.th
Abstract Logistics service industry is one of the important flows that have been freed among AEC
member countries since 2013. The market for logistics service providers (LSPs) will become
more competitive due to its ease in entering the business. Thus, service quality of Thai LSPs
should be evaluated to see whether their performance could meet the users’ expectation. This
paper involves an analysis on the current state of Thai LSPs service quality. The focus is on
road transportation. Service quality is modeled using SERVQUAL for measuring five
different aspects of quality both from the users’ expectation and LSPs’ performance. A field
survey is conducted to collect data using personal in-depth interviews. Then, a gap analysis is
performed using statistical analyses to identify the service quality aspects that need to be
improved. Comparison results between users’ expectation and LSPs’ perception of user
expectation show that Thai LSPs has a reasonable understanding of the customer needs in all
service quality aspects. Comparisons between LSPs’ performance and users’ expectation
reveal that there are two significant and most important gaps that both users and LSPs agree
on, which include information technology (IT) system capability and reliability in basic
services such as delivery order fulfillment. Improving IT capability will require a significant
investment, while basic services can be improved through training and better logistics
management. In addition, the comparison results indicate other service quality aspects that
users see significant gaps, while LSPs do not. These gaps may due to insufficient or
ineffective communication or perhaps, the gaps really exist, which mean that LSPs
overestimate their performance on these aspects.
Keywords: Logistics service providers, Service quality, SERVQUAL, gap analysis
1. INTRODUCTION The ASEAN Economic Community (AEC), which will be effective in 2015, has ten
member countries, including Indonesia, Malaysia, Philippines, Singapore, Thailand, Brunei,
Vietnam, Laos, Myanmar and Cambodia. The concept of this collaboration is “Single market
and Production base.” Five free flows that have been or will be shared among AEC countries
are goods, services, skilled labors, capital, and investment. The AEC population is
approximately 590 million (about 9% of world population) with $149 billion in GDP. AEC’s
free market will increase regional economic prosperity and stability and reduce development
Proceedings of the 4th International Conference on Engineering, Project, and Production Management (EPPM 2013)
537

gaps among member countries. It also creates easy market access and more trading partners,
and attracting foreign investors to ASEAN.
Logistics service is one of the industries that have already been liberalized among AEC
members since 2013. This has increased the competitiveness in the logistics service market.
To survive, logistics service providers (LSPs) must concentrate on the quality of logistics
service provided to customers. Performance of logistics business among different countries
has been well studied and reported. The World Bank first distributed the Logistics
Performance Index (LPI) in 2007. LPI is created as a comprehensive index to help countries
identify challenges and opportunities they face in trade logistics performance by conducting
the survey every two years. The trade logistics profiles of up to 155 countries are compared
using LPI. Logistics performance are rated on a scale of 1 (worst) to 5 (best) by more than
1,000 international freight forwarders, who rated eight foreign countries that their companies
serve most frequently. Six components of LPI include:
1. Effective processes of Customs, including speed, simplicity, and predictability of
formalities.
2. Quality of infrastructure, i.e. ports, railroads, roads, information technology.
3. Ease of International shipments
4. Competency of logistics services, such as transport operators and customs brokers.
5. Ability to track and trace consignments.
6. Timeliness of shipping to the consignees within the expected delivery time.
Singapore is the leader in logistics performance in the world and AEC members with an
LPI score at 4.13. Malaysia ranks second in AEC with LPI score at 3.49, while Thailand is
third, as shown in Table 1. Thailand is ranked at 38th out of 155 countries with score at 3.18 of
5. Brunei has no data record for LPI in World Bank. In Table 2, the performance of Thai
logistics performance has dropped from rank 31st in 2007 to 35th in 2010, before ended up at
rank 38th in 2012. Logistics competence, tracking and tracing and timeliness indices are the
ones that contribute to decline in performance.
Table 1: Ranking of AEC countries in Logistics Performance Index*
Country
LPI
World
Rank
LPI
Score Customs Infrastructure
International
shipments
Logistics
competence
Tracking
&
tracing
Timeliness
Singapore 1 4.13 4.10 4.15 3.99 4.07 4.07 4.39
Malaysia 29 3.49 3.28 3.43 3.40 3.45 3.54 3.86
Thailand 38 3.18 2.96 3.08 3.21 2.98 3.18 3.63
Philippines 52 3.02 2.62 2.80 2.97 3.14 3.30 3.30
Vietnam 53 3.00 2.65 2.68 3.14 2.68 3.16 3.64
Indonesia 59 2.94 2.53 2.54 2.97 2.85 3.12 3.61
Cambodia 101 2.56 2.30 2.20 2.61 2.50 2.77 2.95
Lao PDR 109 2.50 2.38 2.40 2.40 2.49 2.49 2.82
Myanmar 129 2.37 2.24 2.10 2.47 2.42 2.34 2.59
Table 2: Thailand in Logistics Performance Index in different years*
Year LPI
Rank
LPI
Score Customs Infrastructure
International
shipments
Logistics
competence
Tracking
& tracing Timeliness
2007 31.00 3.31 3.03 3.16 3.24 3.31 3.25 3.91
2010 35.00 3.29 3.02 3.16 3.27 3.16 3.41 3.73
2012 38.00 3.18 2.96 3.08 3.21 2.98 3.18 3.63
* Source: Logistics Performance Index, World Bank (2012)
Proceedings of the 4th International Conference on Engineering, Project, and Production Management (EPPM 2013)
538

With the upcoming AEC, Thai LSPs need to consider both as threat and opportunity. As
threat, foreign investors who have high technology, excellent management skills, and
overwhelming investment fund can enter market easily. Especially, Singapore LSPs and
investors have much knowledge, variety of service, staff professionalism, and fund.
Additionally, the AEC’s new restriction for foreign investment share can be 70% in 2013. As
opportunity, Thai LSPs can expand their market and become the logistics center as most of
AEC countries are connected by land. Thus, road transportation would become the essential
transport mode (Banomyong et al., 2008). Therefore, Thailand can use the advantage of its
location that connects with half of AEC countries. In addition, majority of transportation
mode used in Thailand is road, which estimates about 80% (NESDB, 2012). Moreover, local
knowledge of road transportation network, local operation and activities will remain an
important role in logistics business in Thailand.
The number of LSPs registered with the Department of Business Development in
Thailand was 18,399 in 2011 and 80% of them are small and medium enterprises (SME) with
capital investment less than five million THB (NESDB, 2012). To survive in this market in
AEC, LSPs not only have to be able to satisfy the customer requirement, but LSPs also have
to improve their service quality and competitive advantage. The focus of the paper is to
evaluate the current service quality performance of Thai LSPs. Specifically, the objective is to
perform gap analysis between LSPs perspective and industrial enterprises user perspective
toward LSPs service quality so as to identify important rooms for improvement.
The next section contains literature reviews of previous research studies involving
logistics performance measurement, logistics service quality, and SERVQUAL. Section 3
describes research methodology. Survey results are provided in Section 4, and finally,
conclusions are discussed in Section 5.
2. REVIEWS OF LITERATURE
2.1 SERVQUAL SERVQUAL was developed as an instrument for measuring service quality by
Parasuraman et al. (1985). It was first used in marketing, and later used in other fields.
Initially, SERVQUAL has ten dimensions. It has then been further developed into five
generic dimensions (Udo et al. 2011) as follows:
Tangible: appearance of physical facilities, equipment and personnel before using service
Reliability: ability to perform promised services dependably and accurately
Responsiveness: willingness to help customers and prompt in providing services
Assurance: knowledge and courtesy of employees and their abilities to convey trust and
confidence
Empathy: caring, individualized attention that a service provider gives to its customers.
SERVQUAL dimensions should be used only as a basic framework. Hence, the
dimensions could be modified to suit specific requirements of the services being evaluated
(Gilbert and Wong, 2003). Thus, SERVQUAL is sometimes needed to be revised and refined
to fit with the contexts. Below, Figure 1 illustrates a standard SERVQUAL model of
perceived service quality. SERVQUAL evaluates the company performance through
satisfaction of customer in each dimension by looking at the different between actual service
performance that customer receive and expected service performance from words of mouth,
personal needs and past experience.
Proceedings of the 4th International Conference on Engineering, Project, and Production Management (EPPM 2013)
539
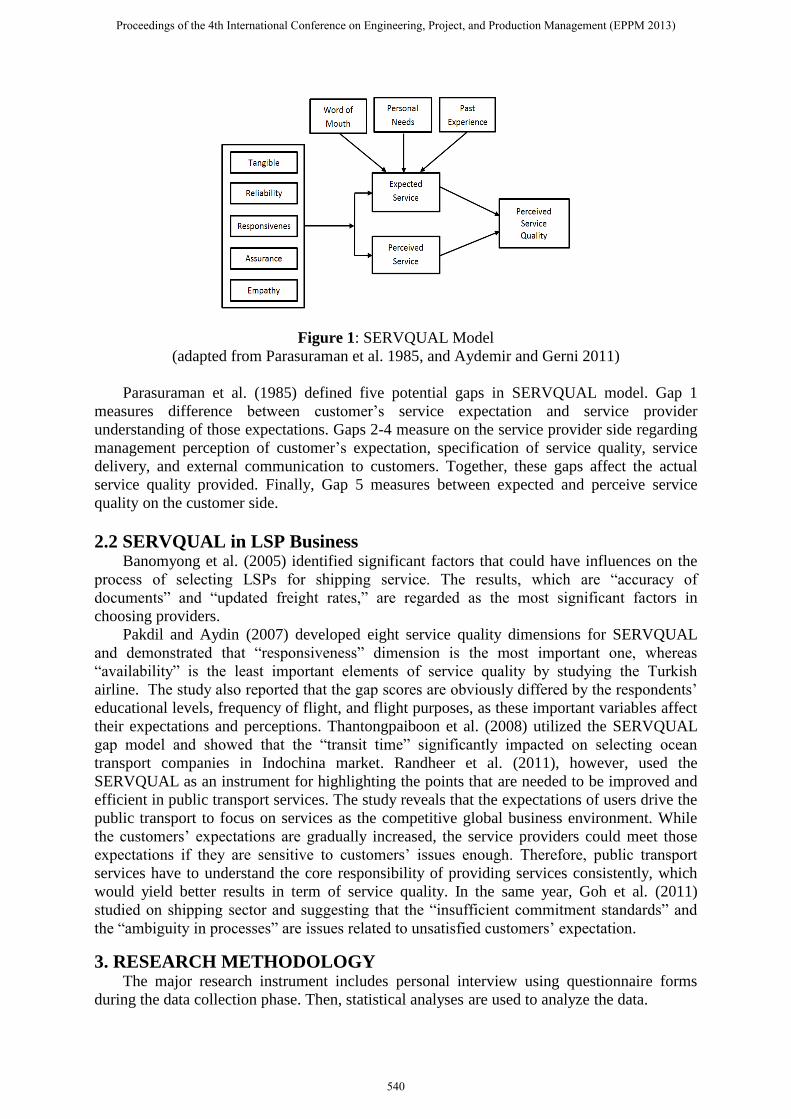
Figure 1: SERVQUAL Model
(adapted from Parasuraman et al. 1985, and Aydemir and Gerni 2011)
Parasuraman et al. (1985) defined five potential gaps in SERVQUAL model. Gap 1
measures difference between customer’s service expectation and service provider
understanding of those expectations. Gaps 2-4 measure on the service provider side regarding
management perception of customer’s expectation, specification of service quality, service
delivery, and external communication to customers. Together, these gaps affect the actual
service quality provided. Finally, Gap 5 measures between expected and perceive service
quality on the customer side.
2.2 SERVQUAL in LSP Business Banomyong et al. (2005) identified significant factors that could have influences on the
process of selecting LSPs for shipping service. The results, which are “accuracy of
documents” and “updated freight rates,” are regarded as the most significant factors in
choosing providers.
Pakdil and Aydin (2007) developed eight service quality dimensions for SERVQUAL
and demonstrated that “responsiveness” dimension is the most important one, whereas
“availability” is the least important elements of service quality by studying the Turkish
airline. The study also reported that the gap scores are obviously differed by the respondents’
educational levels, frequency of flight, and flight purposes, as these important variables affect
their expectations and perceptions. Thantongpaiboon et al. (2008) utilized the SERVQUAL
gap model and showed that the “transit time” significantly impacted on selecting ocean
transport companies in Indochina market. Randheer et al. (2011), however, used the
SERVQUAL as an instrument for highlighting the points that are needed to be improved and
efficient in public transport services. The study reveals that the expectations of users drive the
public transport to focus on services as the competitive global business environment. While
the customers’ expectations are gradually increased, the service providers could meet those
expectations if they are sensitive to customers’ issues enough. Therefore, public transport
services have to understand the core responsibility of providing services consistently, which
would yield better results in term of service quality. In the same year, Goh et al. (2011)
studied on shipping sector and suggesting that the “insufficient commitment standards” and
the “ambiguity in processes” are issues related to unsatisfied customers’ expectation.
3. RESEARCH METHODOLOGY The major research instrument includes personal interview using questionnaire forms
during the data collection phase. Then, statistical analyses are used to analyze the data.
Proceedings of the 4th International Conference on Engineering, Project, and Production Management (EPPM 2013)
540
3.1 Questionnaires Two semi-construct questionnaire forms, LSPs and user forms, are developed. During
development process, the questionnaires are pretested by in-depth interviews with experts
from academic institute and five experts from several industrial organizations. After
adjustment and revisions, a pilot test on the questionnaires is conducted with a focus group for
the final tune-up and preliminary data analysis (i.e. reliability test). Then, the final forms of
questionnaires are used to collect data from the perspective respondents (LSPs and users) via
personal interviews, phone interviews, postal mail, and e-mail.
Each of the two questionnaire forms contain two main parts that are used in this study.
The first part is general demographic information and the second part is about service quality
(SERVQUAL) evaluation. In the SERVQUAL part, LSPs’ service quality is evaluated in
terms of expected performance (E) and perceived performance (P), by the LSP respondents
(self-evaluation) and by their users. Five-point likert scale is used to rate the service quality
ranking from the value of 1 (poor performance) to 5 (excellent performance). Cronbach’s
alpha is used for reliability test in this study. The values are greater than 0.8 for both forms
indicating the questionnaires are reliable.
3.1.1 LSP questionnaire form The first part contains 15 questions for collecting general information about LSP
companies, including:
Demographic information of the organization and respondent, authorized capital,
nationality of the company, annual income, number of employees and their education
level
Criteria for choosing other LSPs as subcontractor
Assets of the company and outsource company which are classified into two types: (1)
physical facilities, and (2) information technology and software system, equipment, and
devices that facilitate the services e.g. RFID, GPS tracking, barcode, e-customs, etc.
Types of services offerings, i.e. customs, warehousing, road transport, rail transport, air
transport, in-land waterway transport, coastal and ocean transport, consulting services,
value-added services, such as labeling, packaging, and others.
Competitive advantages provided to customers, and key performance indicator (KPI)
included in the service agreements.
Method for receiving and handling customers’ complaints
Logistics strategies of the company in the short term, intermediate, and long term.
The second part of LSP form is for SERVQUAL. There are 26 items, each of which
measures a service quality aspect from the five SERVQUAL dimensions: five items each for
Tangibles, Reliability, Responsiveness, and Empathy, and six items for Assurance.
3.1.2 User questionnaire form Similar to the LSP form, the first part contains general information of the industrial
enterprise user, including:
Demographic information, industrial sectors, market proportion of revenue, authorized
capital, annual revenue and current number of employees.
Reasons for outsourcing logistics activity, channels for finding LSP, and factors in
choosing LPS.
Types and proportion of logistics services used.
Estimated percentage of logistics cost per revenue.
The SERVQUAL part of the user form is the same as that of the LSP form.
Proceedings of the 4th International Conference on Engineering, Project, and Production Management (EPPM 2013)
541
3.2 Data Collection Data collection was performed from December 2012 to March 2013 at on-site
interviews, related seminar and exhibitions, organized workshop, and focus group. The total
number of responses is 190 respondents. After screening, there are 162 responses with
complete information, 72 of which are from LSPs and 90 from users.
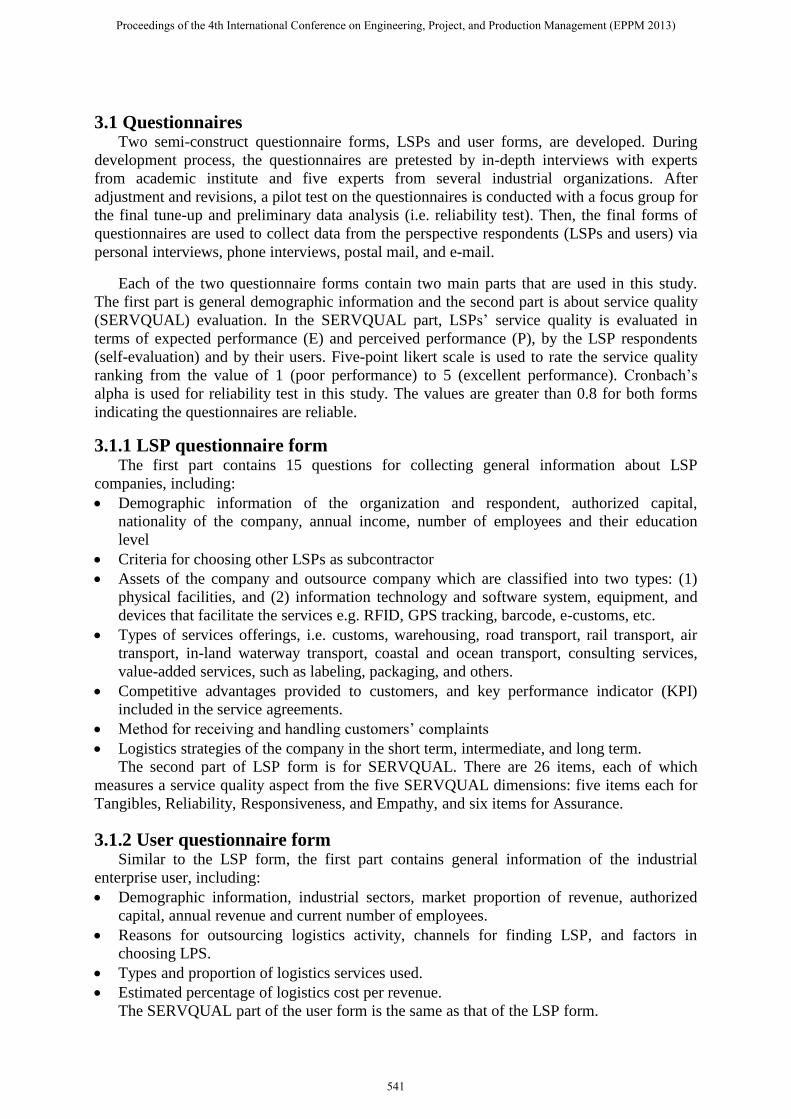
3.3 Gaps in Service Quality Gap analysis is suitable for company applying and distinguishing which processes need
to be improved. SERVQUAL gap model was introduced by Parasuraman et al. (1985) which
consist of five gaps. For this study, only Gaps 1, 3, and 5 are of interested, and are rearranged
into new order as shown in Figure 3.
Figure 3: The measured gaps in SERVQUAL model
Gap 1 involves the communication between LSPs and users regarding the service quality
expectation. That is, this gap compares the expectation score from the LSP form and the
expectation score from the user form. Gap 2 is for measuring service performance before
service (expected performance) and actual service (perceived performance) from LSPs
perspective, i.e. comparing performance and expectation score from LSP form. Finally, Gap 3
measures service quality from user perspective. It is similar to Gap 2, but the data are taken
from the user form.
3.5 Data analysis
Two statistical analyses including ANOVA and Chi-square test were conducted.
ANOVA is conducted by using the expectation and performance scores from both
questionnaire forms as the response. The factors include the following:
(1) P-E: a factor indicating whether a score is from performance score or expectation
score.
(2) LSP-User: a factor indicating whether a score is from LSP form or user form.
(3) ServQual: a factor indicating the five dimensions of SERVQUAL
(4) Item(ServQual): a factor indicating 26 questions in the SERVQUAL section. This
factor is nested within ServQual factor, i.e. Questions 1-5, 6-10, 11-15, and 22-26 are
for Tangibles, Reliability, Responsiveness, and Empathy, respectively; and Questions
16-21 are for Assurance.
Proceedings of the 4th International Conference on Engineering, Project, and Production Management (EPPM 2013)
542
(5) Respondent(LSP-User): A block effect indicating the respondent that the score come
from. This is also a factor nested within LSP-user factor, i.e. respondent No. 1-72 are
LSPs, and respondent No. 73-162 are users.
A small p-value from an F-statistic in ANOVA would indicate that a factor is significant.
The three Gaps are evaluated using a Tukey’s multiple comparisons on the average score
grouped by the interaction term between E-P and LSP-user. With Tukey’s comparisons, there
are six possible pairwise comparisons, three of them that capture the three Gaps are of
interest. That is, for each item of the SERVQUAL dimensions, the hypotheses tested are as
given below:
Where µ𝐸,𝐿𝑆𝑃 denote the average expectation score of an item from LSP form, and so on.
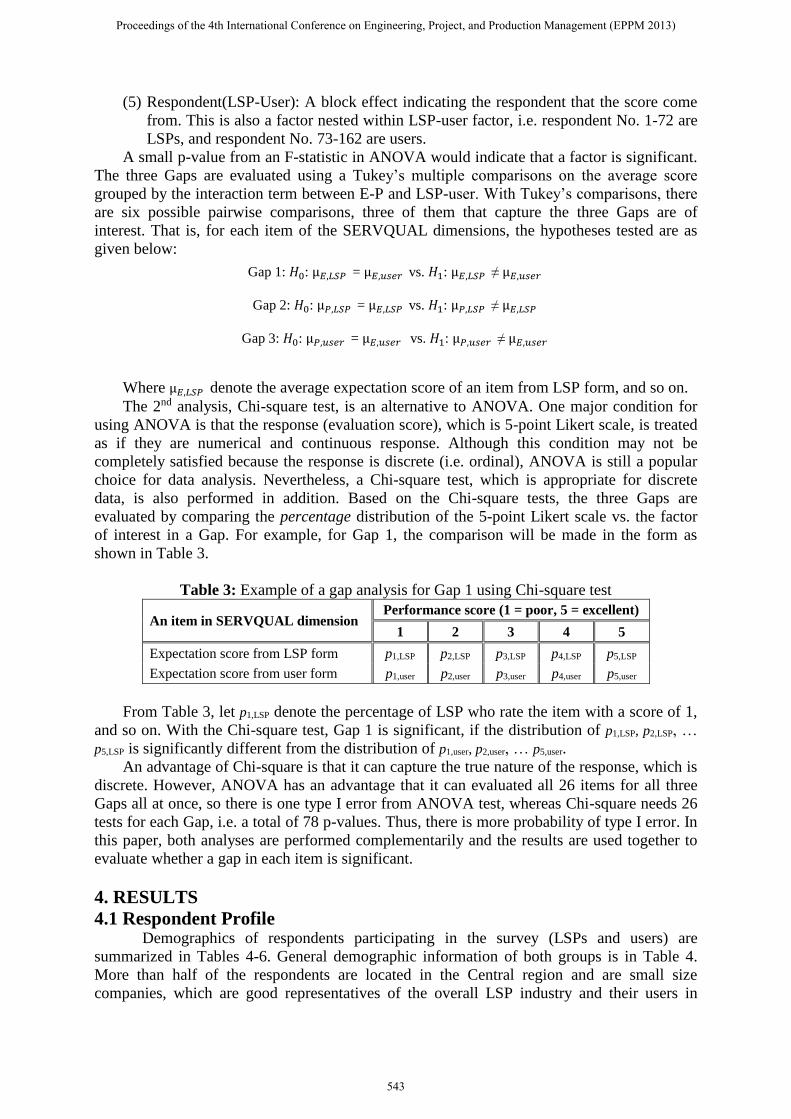
The 2nd analysis, Chi-square test, is an alternative to ANOVA. One major condition for
using ANOVA is that the response (evaluation score), which is 5-point Likert scale, is treated
as if they are numerical and continuous response. Although this condition may not be
completely satisfied because the response is discrete (i.e. ordinal), ANOVA is still a popular
choice for data analysis. Nevertheless, a Chi-square test, which is appropriate for discrete
data, is also performed in addition. Based on the Chi-square tests, the three Gaps are
evaluated by comparing the percentage distribution of the 5-point Likert scale vs. the factor
of interest in a Gap. For example, for Gap 1, the comparison will be made in the form as
shown in Table 3.
Table 3: Example of a gap analysis for Gap 1 using Chi-square test
An item in SERVQUAL dimension Performance score (1 = poor, 5 = excellent)
1 2 3 4 5
Expectation score from LSP form p1,LSP p2,LSP p3,LSP p4,LSP p5,LSP
Expectation score from user form p1,user p2,user p3,user p4,user p5,user
From Table 3, let p1,LSP denote the percentage of LSP who rate the item with a score of 1,
and so on. With the Chi-square test, Gap 1 is significant, if the distribution of p1,LSP, p2,LSP, …
p5,LSP is significantly different from the distribution of p1,user, p2,user, … p5,user.
An advantage of Chi-square is that it can capture the true nature of the response, which is
discrete. However, ANOVA has an advantage that it can evaluated all 26 items for all three
Gaps all at once, so there is one type I error from ANOVA test, whereas Chi-square needs 26
tests for each Gap, i.e. a total of 78 p-values. Thus, there is more probability of type I error. In
this paper, both analyses are performed complementarily and the results are used together to
evaluate whether a gap in each item is significant.
4. RESULTS
4.1 Respondent Profile Demographics of respondents participating in the survey (LSPs and users) are
summarized in Tables 4-6. General demographic information of both groups is in Table 4.
More than half of the respondents are located in the Central region and are small size
companies, which are good representatives of the overall LSP industry and their users in
Gap 1: 𝐻0: µ𝐸,𝐿𝑆𝑃 = µ𝐸,𝑢𝑠𝑒𝑟 vs. 𝐻1: µ𝐸,𝐿𝑆𝑃 ≠ µ𝐸,𝑢𝑠𝑒𝑟
Gap 2: 𝐻0: µ𝑃,𝐿𝑆𝑃 = µ𝐸,𝐿𝑆𝑃 vs. 𝐻1: µ𝑃,𝐿𝑆𝑃 ≠ µ𝐸,𝐿𝑆𝑃
Gap 3: 𝐻0: µ𝑃,𝑢𝑠𝑒𝑟 = µ𝐸,𝑢𝑠𝑒𝑟 vs. 𝐻1: µ𝑃,𝑢𝑠𝑒𝑟 ≠ µ𝐸,𝑢𝑠𝑒𝑟
Proceedings of the 4th International Conference on Engineering, Project, and Production Management (EPPM 2013)
543
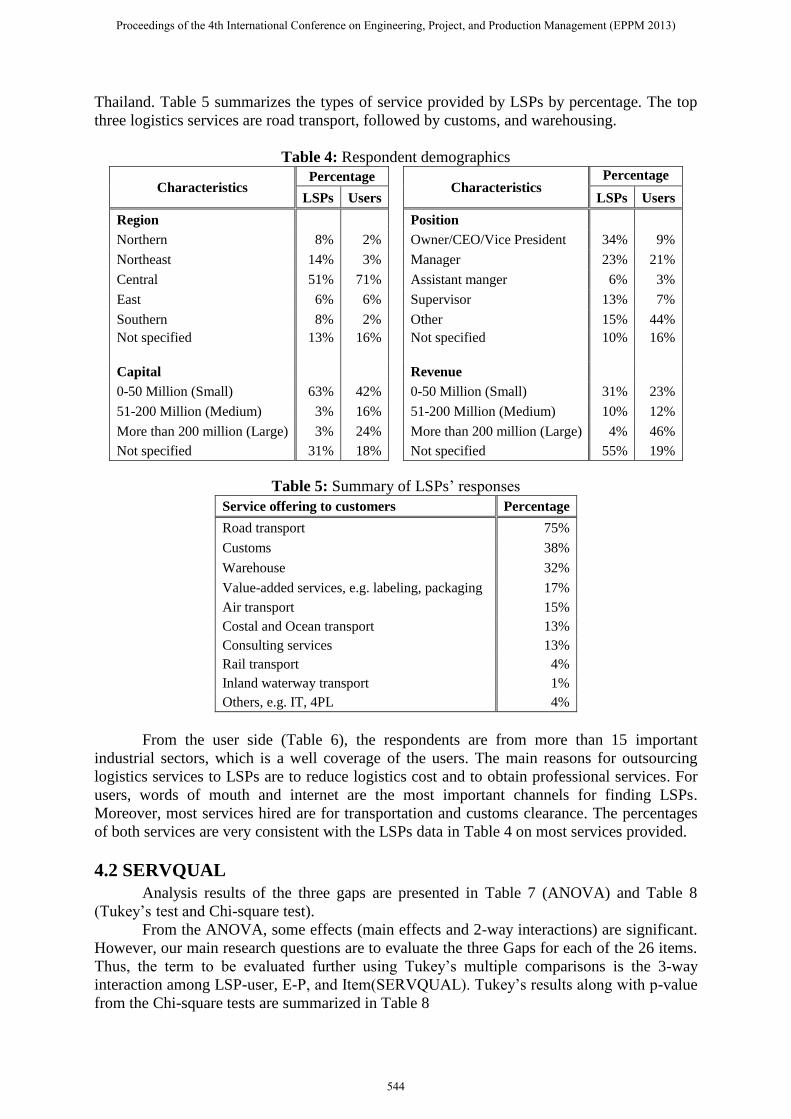
Thailand. Table 5 summarizes the types of service provided by LSPs by percentage. The top
three logistics services are road transport, followed by customs, and warehousing.
Table 4: Respondent demographics
Characteristics Percentage
Characteristics Percentage
LSPs Users LSPs Users
Region
Position
Northern 8% 2% Owner/CEO/Vice President 34% 9%
Northeast 14% 3% Manager 23% 21%
Central 51% 71% Assistant manger 6% 3%
East 6% 6% Supervisor 13% 7%
Southern 8% 2% Other 15% 44%
Not specified
13%
16%
Not specified
10%
16%
Capital
Revenue
0-50 Million (Small) 63% 42% 0-50 Million (Small) 31% 23%
51-200 Million (Medium) 3% 16% 51-200 Million (Medium) 10% 12%
More than 200 million (Large) 3% 24% More than 200 million (Large) 4% 46%
Not specified 31% 18% Not specified 55% 19%
Table 5: Summary of LSPs’ responses
Service offering to customers Percentage
Road transport 75%
Customs 38%
Warehouse 32%
Value-added services, e.g. labeling, packaging 17%
Air transport 15%
Costal and Ocean transport 13%
Consulting services 13%
Rail transport 4%
Inland waterway transport 1%
Others, e.g. IT, 4PL 4%
From the user side (Table 6), the respondents are from more than 15 important
industrial sectors, which is a well coverage of the users. The main reasons for outsourcing
logistics services to LSPs are to reduce logistics cost and to obtain professional services. For
users, words of mouth and internet are the most important channels for finding LSPs.
Moreover, most services hired are for transportation and customs clearance. The percentages
of both services are very consistent with the LSPs data in Table 4 on most services provided.
4.2 SERVQUAL
Analysis results of the three gaps are presented in Table 7 (ANOVA) and Table 8
(Tukey’s test and Chi-square test).
From the ANOVA, some effects (main effects and 2-way interactions) are significant.
However, our main research questions are to evaluate the three Gaps for each of the 26 items.
Thus, the term to be evaluated further using Tukey’s multiple comparisons is the 3-way
interaction among LSP-user, E-P, and Item(SERVQUAL). Tukey’s results along with p-value
from the Chi-square tests are summarized in Table 8
Proceedings of the 4th International Conference on Engineering, Project, and Production Management (EPPM 2013)
544
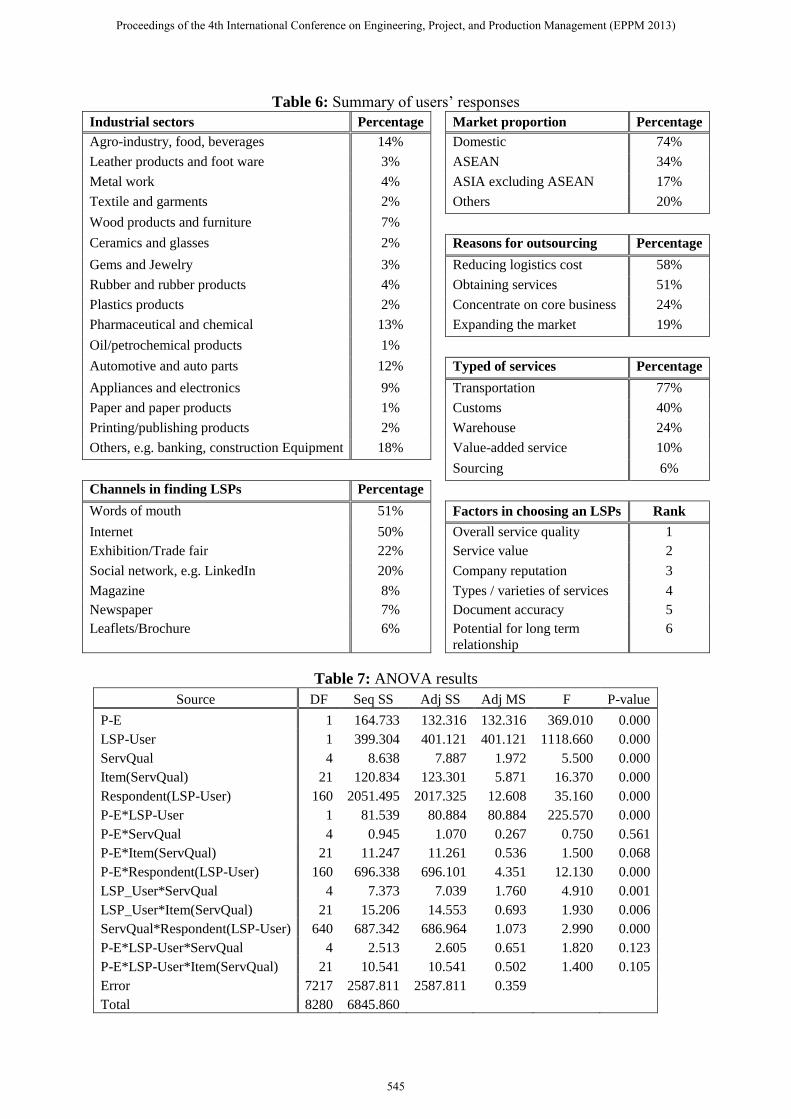
Table 6: Summary of users’ responses
Industrial sectors Percentage Market proportion Percentage
Agro-industry, food, beverages 14% Domestic 74%
Leather products and foot ware 3% ASEAN 34%
Metal work 4% ASIA excluding ASEAN 17%
Textile and garments 2% Others 20%
Wood products and furniture 7%
Ceramics and glasses 2% Reasons for outsourcing Percentage
Gems and Jewelry 3% Reducing logistics cost 58%
Rubber and rubber products 4% Obtaining services 51%
Plastics products 2% Concentrate on core business 24%
Pharmaceutical and chemical 13% Expanding the market 19%
Oil/petrochemical products 1%
Automotive and auto parts 12% Typed of services Percentage
Appliances and electronics 9% Transportation 77%
Paper and paper products 1% Customs 40%
Printing/publishing products 2% Warehouse 24%
Others, e.g. banking, construction Equipment 18% Value-added service 10%
Sourcing 6%
Channels in finding LSPs Percentage
Words of mouth 51% Factors in choosing an LSPs Rank
Internet 50% Overall service quality 1
Exhibition/Trade fair 22% Service value 2
Social network, e.g. LinkedIn 20% Company reputation 3
Magazine 8% Types / varieties of services 4
Newspaper 7% Document accuracy 5
Leaflets/Brochure 6% Potential for long term
relationship
6
Table 7: ANOVA results
Source DF Seq SS Adj SS Adj MS F P-value
P-E 1 164.733 132.316 132.316 369.010 0.000
LSP-User 1 399.304 401.121 401.121 1118.660 0.000
ServQual 4 8.638 7.887 1.972 5.500 0.000
Item(ServQual) 21 120.834 123.301 5.871 16.370 0.000
Respondent(LSP-User) 160 2051.495 2017.325 12.608 35.160 0.000
P-E*LSP-User 1 81.539 80.884 80.884 225.570 0.000
P-E*ServQual 4 0.945 1.070 0.267 0.750 0.561
P-E*Item(ServQual) 21 11.247 11.261 0.536 1.500 0.068
P-E*Respondent(LSP-User) 160 696.338 696.101 4.351 12.130 0.000
LSP_User*ServQual 4 7.373 7.039 1.760 4.910 0.001
LSP_User*Item(ServQual) 21 15.206 14.553 0.693 1.930 0.006
ServQual*Respondent(LSP-User) 640 687.342 686.964 1.073 2.990 0.000
P-E*LSP-User*ServQual 4 2.513 2.605 0.651 1.820 0.123
P-E*LSP-User*Item(ServQual) 21 10.541 10.541 0.502 1.400 0.105
Error 7217 2587.811 2587.811 0.359
Total 8280 6845.860
Proceedings of the 4th International Conference on Engineering, Project, and Production Management (EPPM 2013)
545
Note: *
indicate
small p-
value
from
Chi-
square
test, and **
indicate
significa
nt gap
from
Tukey’s
comparis
ons
Table 8: Summary of gap analysis results for SERVQUAL from Tukey’s comparisons and Chi-square tests
Dimensions Gap 1 Gap 2 Gap 3
E-LSP E-user Tukey Chi-Sq P-LSP E-LSP Tukey Chi-Sq P-user E-user Tukey Chi-Sq
Tangible
Appearance of physical facilities 4.17 4.06
0.868 4.29 4.17
0.198 3.54 4.06 ** 0.003* Availability of resource 4.38 4.10
0.131 4.40 4.38
0.950 3.66 4.10 ** 0.001*
Utilization of resources 4.03 3.97
0.745 4.12 4.03
0.683 3.58 3.97 ** 0.011*
IT system and capability 4.12 3.88
0.184 3.69 4.12
0.034* 3.40 3.88 ** 0.018*
Staff sufficiency 4.38 4.16
0.694 4.24 4.38
0.503 3.56 4.16 ** 0.001*
Reliability Basic services 4.31 4.07
0.625 4.31 4.31
0.040* 3.64 4.07 ** 0.006*
Value-added service 3.98 3.71
0.036* 3.77 3.98
0.490 3.36 3.71
0.068
Document 4.31 4.06
0.145 4.24 4.31
0.805 3.63 4.06 ** 0.005* Time 4.54 4.24
0.181 4.40 4.54
0.735 3.80 4.24 ** 0.001*
Safety 4.58 4.69
0.138 4.48 4.58
0.872 3.79 4.69 ** 0.001*
Responsiveness
Provide enough information to customers 4.41 4.03 ** 0.005* 4.14 4.41
0.026* 3.53 4.03 ** 0.003*
Fast and easy ordering process 4.32 4.05
0.168 4.18 4.32
0.572 3.61 4.05 ** 0.037* Fast document processing 4.31 4.14
0.489 4.21 4.31
0.585 3.64 4.14 ** 0.002*
Ability to provide short service time 4.30 3.94 ** 0.018* 4.31 4.30
0.857 3.57 3.94
0.215
Quick respond to customer claims 4.29 4.02
0.198 4.22 4.29
0.861 3.45 4.02 ** 0.009*
Assurance
Reputation/creditability of LSPs 4.27 4.14
0.239 4.46 4.27
0.193 3.80 4.14
0.093
Compliance to standards 3.98 3.95
0.151 3.87 3.98
0.063 3.62 3.95
0.177
Clear policy on warranty, security 4.22 4.17
0.530 4.29 4.22
0.760 3.66 4.17 ** 0.007*
Regular performance review 4.10 3.91
0.469 3.98 4.10
0.608 3.58 3.91
0.147
Staff competency 4.12 4.11
0.035* 4.06 4.12
0.475 3.45 4.11 ** 0.000*
Staff professionalism 4.44 4.20
0.186 4.43 4.44
0.659 3.63 4.20 ** 0.000*
Empathy
Understanding specific customers' needs 4.40 4.12
0.164 4.44 4.40
0.504 3.45 4.12 ** 0.000*
Ability to accommodate special needs 4.28 3.85
0.008* 4.19 4.28
0.649 3.43 3.85 ** 0.015* Flexibility in adapting to customer needs 4.18 4.00
0.314 4.19 4.18
0.708 3.59 4.00 ** 0.079
Personal attention 4.36 3.99
0.030* 4.32 4.36
0.439 3.54 3.99 ** 0.023*
Assessing customers' future needs 4.08 4.08 0.099 4.19 4.08 0.187 3.45 4.08 ** 0.000*
Proceedings of the 4th International Conference on Engineering, Project, and Production Management (EPPM 2013)
546

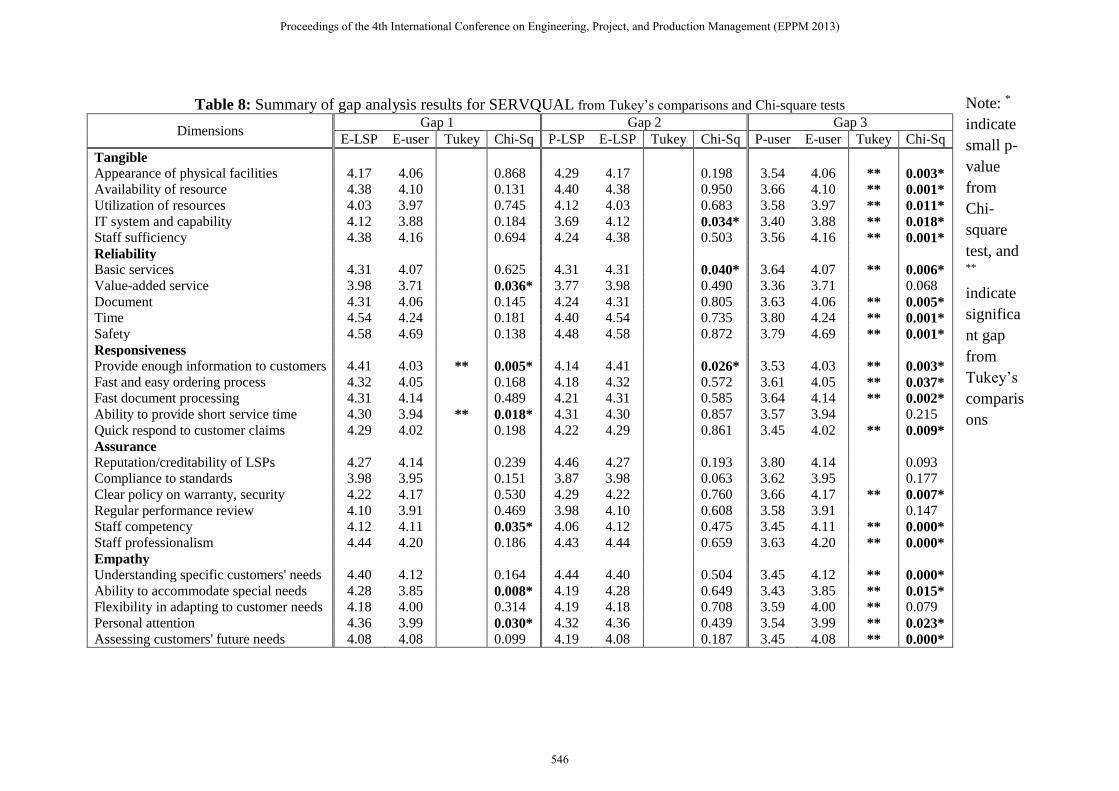
4.2.1 Gap 1 From the results, LSPs seem to understand their users’ expectation in Tangible
dimension well because there is no gap in all items from both ANOVA and Chi-square tests.
However, in the other four SERQUAL dimension, there are 1-2 items that have small p-
values indicating statistical significant gaps. For example, the first item in Responsiveness,
“provide enough information to customers,” is an item with significant gap from both
ANOVA and Chi-square test. A closer look at the mean expectation scores from LSPs and
that of the users for these items reveals that these gaps are relatively unimportant because all
significant differences come from LSPs overestimating the user expectations, which should
not be an issue in term of understanding service quality.
4.2.2 Gap 2 Gap 2 measures the difference between user expectation and the quality of service
provided from LSP perspectives. In other words, a significant gap implies that LSPs think
they perform under expectation in that item. The results from ANOVA show that none of the
items has a gap. However, Chi-square tests show significant gaps in three items: IT system
capability (Tangible), basic services (Reliability), and providing enough information for
customers (Responsiveness). A closer look at the scores shows that there are the first two gaps
are important because these items have lower performance scores than expectation scores.
That is, LSPs think that they underperform both in terms of their IT system capability and the
reliability of their basic services.
For the “providing enough information” item, although the p-value from Chi-square
test is small, the gap is not important. This is because the gap simply comes from the
differences in the percentages of responses, between performance and expectation, that give
rating score of 4 and 5, which is not that much of a difference (see Table 9).
Table 9: Percentage distribution of a significant gap in a Responsiveness item
Provide enough information to customers Performance score (1 = poor, 5 = excellent)
1 2 3 4 5
Performance in LSP perspective 0% 1% 6% 54% 39%
User expectation in LSP perspective 1% 0% 17% 34% 47%
4.2.3 Gap 3 This is the most important gap because it measures the expectation and perception of
service quality received from user perspective towards LSPs service performance. From the
results, both ANOVA and Chi-square tests indicate that all items in all dimensions are
significant except five items which include value-added services (Reliability), short service
time (Responsiveness), LSPs reputation, standard and certification, regular performance
review (Assurance). Additionally, flexibility in customer need (Empathy) only appears
significant from the Chi-square test.
4.2.4 Discussion
The results in Table 6 can be categorized into three cases according the significance of
Gap 2 and Gap 3. Note that Gap 1 is not considered further because the significant gaps only
come from LSPs overestimating the user expectation, which is not a concern.
Case 1 involves service quality aspects having small p-value for both Gap 2 and Gap
3, and without LPSs overestimating the user expectation. There are two service quality
aspects that fall into this case: IT system capability (Tangible) and basic services (Reliability).
Proceedings of the 4th International Conference on Engineering, Project, and Production Management (EPPM 2013)
547
These are the aspects which both LSPs and user agree that they have significantly lower
service quality performance than expectation. Thus, LSPs should consider them as the highest
priority rooms for improvement. For IT system, LSPs should consider add capability such as
Global Positioning System (GPS) for customer for tracking and tracing their products, RFID
instead of barcode, and software systems for transportation management and warehouse
management, etc. This will unavoidably involve significant investment. Therefore, LSPs
should ensure that the added capability align with their core service that will make them serve
customers better. For basic services, LSPs should focus on improving their processing service
(e.g. order fulfillment process), truck efficiency (e.g. loading and unloading, pickup and
delivery) and warehouse operation (e.g. storing, order picking, consolidation and sorting).
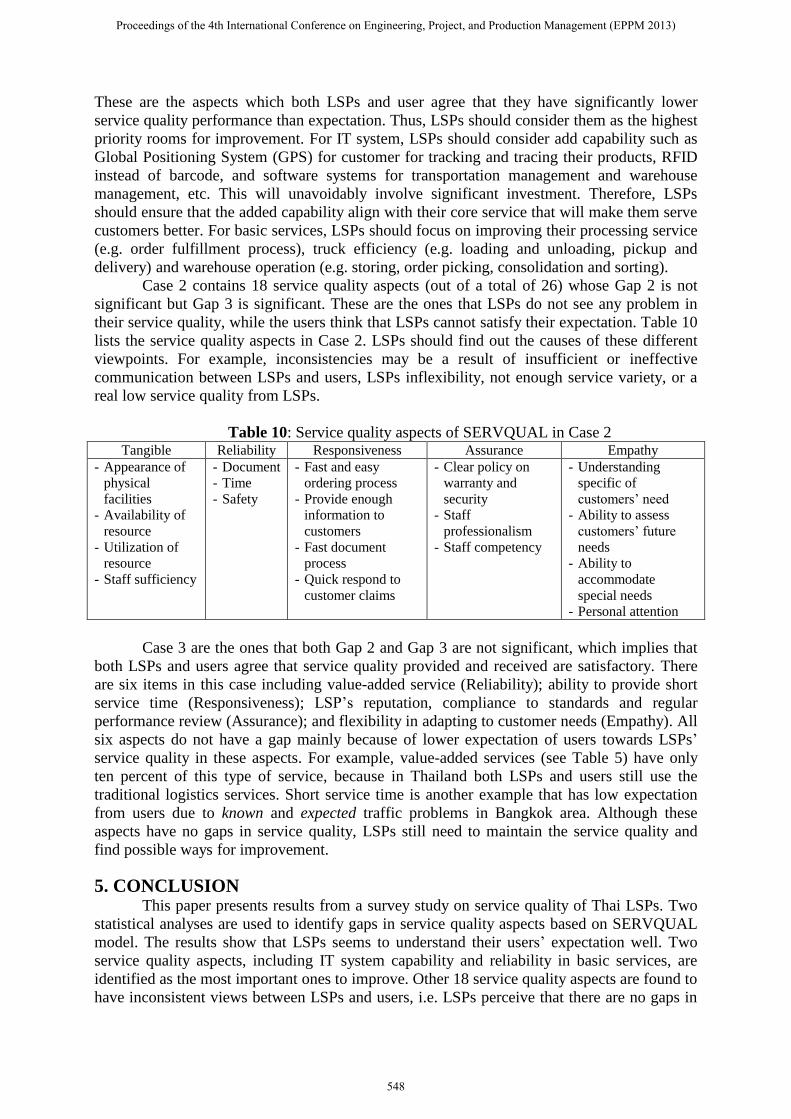
Case 2 contains 18 service quality aspects (out of a total of 26) whose Gap 2 is not
significant but Gap 3 is significant. These are the ones that LSPs do not see any problem in
their service quality, while the users think that LSPs cannot satisfy their expectation. Table 10
lists the service quality aspects in Case 2. LSPs should find out the causes of these different
viewpoints. For example, inconsistencies may be a result of insufficient or ineffective
communication between LSPs and users, LSPs inflexibility, not enough service variety, or a
real low service quality from LSPs.
Table 10: Service quality aspects of SERVQUAL in Case 2 Tangible Reliability Responsiveness Assurance Empathy
- Appearance of
physical
facilities
- Availability of
resource
- Utilization of
resource
- Staff sufficiency
- Document
- Time
- Safety
- Fast and easy
ordering process
- Provide enough
information to
customers
- Fast document
process
- Quick respond to
customer claims
- Clear policy on
warranty and
security
- Staff
professionalism
- Staff competency
- Understanding
specific of
customers’ need
- Ability to assess
customers’ future
needs
- Ability to
accommodate
special needs
- Personal attention
Case 3 are the ones that both Gap 2 and Gap 3 are not significant, which implies that
both LSPs and users agree that service quality provided and received are satisfactory. There
are six items in this case including value-added service (Reliability); ability to provide short
service time (Responsiveness); LSP’s reputation, compliance to standards and regular
performance review (Assurance); and flexibility in adapting to customer needs (Empathy). All
six aspects do not have a gap mainly because of lower expectation of users towards LSPs’
service quality in these aspects. For example, value-added services (see Table 5) have only
ten percent of this type of service, because in Thailand both LSPs and users still use the
traditional logistics services. Short service time is another example that has low expectation
from users due to known and expected traffic problems in Bangkok area. Although these
aspects have no gaps in service quality, LSPs still need to maintain the service quality and
find possible ways for improvement.
5. CONCLUSION This paper presents results from a survey study on service quality of Thai LSPs. Two
statistical analyses are used to identify gaps in service quality aspects based on SERVQUAL
model. The results show that LSPs seems to understand their users’ expectation well. Two
service quality aspects, including IT system capability and reliability in basic services, are
identified as the most important ones to improve. Other 18 service quality aspects are found to
have inconsistent views between LSPs and users, i.e. LSPs perceive that there are no gaps in
Proceedings of the 4th International Conference on Engineering, Project, and Production Management (EPPM 2013)
548
these aspects, whereas users see significant gaps. These items need further investigation to
find out the cause of the inconsistency.
ACKNOWLEDGMENT This research study was supported by Thailand Research Fund (TRF) and National
Research Council of Thailand (NRCT) no. RDG5550027 and the Bangchak Petroleum PCL
under “The Bangchak Graduate Scholarship” Program, fund no. BC-SIIT-G-SIY12/002.
REFERENCES
Aydemir, S.D., and Gerni, C. (2011) Measuring Service Quality of Export Credit Agency In
Turkey By Using Servqual, Procedia Social and Behavioral Sciences, 24, 1663-1670.
Banomyong, R., Ritthironk, N., and Varadejsatitwong, P. (2005) Selecting logistics providers
in Thailand: A shippers’ perspective, Proceeding of the 10th International Symposium
on Logistics 3-5 July 2005, Lisbon, 568-573.
Banomyong, R., Sopadang, A. and Ramingwong, S. (2009) Assessing Thailand’s Logistics
Potential in the Greater Mekong Sub-Region: The Case of the North-South Economic
Corridor, APIEMS.
Department of Business Development (2012)
http://www.nesdb.go.th/Portals/0/tasks/dev_logis/seminar/logis54/data05.pdf
Department of Trade Negotiations (2012)
http://www.dtn.go.th/filesupload/aec/images/logis29-05-55.pdf
Ghobadian, A., Speller, S. and Jones, M. (1994) Service Quality: Concepts and Models,
International Journal of Quality and Reliability Management, 11, 43-66.
Gilbert, D., and Wong, R.K.C. (2003) Passenger expectations and airline service: a Hong
Kong based study, Tourism Management, 24, 519–532.
Goh, M., Desouza, R. and Garg, M. (2011) Assessing trade friendliness of logistics services
in ASEAN, Asia Pacific Journal of Marketing and Logistics, 23, 773-792.
Kettinger, W.J., and Lee, C.C. (1994) Perceived service quality and user satisfaction with the
information services function, Decision Sciences, 25, 737-766.
Lai, K.H., Ngai, E.W.T., and Cheng, T.C.E. (2002) Measures for evaluating supply chain
performance in transport logistics, Transportation Research Part E, 38, 439-456.
Mentzer, J.T., Myers, M.B., and Cheung, M.S. (2004) Global market segmentation for
logistics service, Industrial Marketing Management, 33, 15-20.
Office of the National Economic and Social Development Board (NESDB) (2012) Thailand’s
Logistics Report 2011,
http://www.nesdb.go.th/Portals/0/tasks/dev_logis/report/data_1255030412.pdf.
Pakdil, F., and Aydin, O. (2007) Expectations and perceptions in airline services: An analysis
using weighted SERVQUAL scores, Journal of Air Transport Management, 13, 229-
237.
Parasuraman, A., Zeithaml, V.A., and Berry, L.L. (1985) A Conceptual Model of Service
Quality and Its Implications for Future Research, Journal of Marketing, 49, 41-50.
Randheer, K., AL-Motawa, A., and Vijay, P. (2011) Measuring Commuter’s Perception on
Service Quality Using SERVQUAL in Public Transportation, International Journal of
Marketing Studies, 3, 1.
Thantongpaiboon, C., and Wassusri, T. (2008) Ocean Transport service quality assessment,
Proceedings of the 13th International Symposium on Logistics.
Too, L., and Earl, G. (2009) “Public Transport Service Quality and Sustainable Development:
a Community Stakeholder Perspective, Sustainable Development, 18, 51-61.
Proceedings of the 4th International Conference on Engineering, Project, and Production Management (EPPM 2013)
549
Udo, G.J., Bagchi, K.K., and Kirs, P.J. (2011) Using SERVQUAL to assess the quality of e-
learning experience, Computers in Human Behavior, 27, 1272-1283.
Yee, H.L., and Daud, D. (2011) Measuring Customer Satisfaction in the Parcel Service
Delivery: A Pilot Study in Malaysia, Business and Economic Research, 1, 2162-4860.
Proceedings of the 4th International Conference on Engineering, Project, and Production Management (EPPM 2013)
550