a gene cluster involved in stress tolerance,...
TRANSCRIPT

1
A GENE CLUSTER INVOLVED IN STRESS TOLERANCE, (P)PPGPP METABOLISM AND GENETIC COMPETENCE IN Streptococcus mutans
By
KINDA CHIKERE SEATON
A DISSERTATION PRESENTED TO THE GRADUATE SCHOOL OF THE UNIVERSITY OF FLORIDA IN PARTIAL FULFILLMENT
OF THE REQUIREMENTS FOR THE DEGREE OF DOCTOR OF PHILOSOPHY
UNIVERSITY OF FLORIDA
2013

2
© 2013 Kinda Chikere Seaton

3
To my baby Kymani, you changed my world, Miguel, mom, dad, sister and family.

4
ACKNOWLEDGMENTS
Firstly, I would like to thank my mentor Dr. Robert Burne, for all the guidance with
my project and providing a great work environment for research. I would also like to
thank my committee members Dr. Jeannine Brady, Dr. Brian Cain and Dr. Paul Gulig for
all their input, constructive criticisms and suggestions that assisted with my project and
helped to develop my critical thinking skills as a scientist.
I am also grateful to the entire Burne lab for all the support and exchange of
ideas over the years and making work an enjoyable but productive environment. I
would especially like to thank Dr. Sang-Joon Ahn, for all the time, patience and
dedication in guiding me with this project and teaching me good scientific techniques. I
would like to specially thank Ann Sagstetter Decker for all of her help with generating
some of the data. To Christopher Browngardt, the lab manager, thanks for keeping
everything in order and being a supportive friend. Thank you to Justin Kaspar and
Qiang Guo for continuing the work that was started and generating new ideas and
results. Special thanks to Matt Watts for all the good discussions and help with all things
computer related. I would also like to thank Dr. Lin Zeng, Dr. Sara Palmer, Zachary
Moye and Dr. Jang-Nam Kim for all the advice and ideas for trouble-shooting and
performing experiments. You have all played a part in making the work successful. I
would like to acknowledge the funding sources as well. This work was supported by the
NIH Training grant T32 DE07200 in Oral Biology and T32 Training Grant T32AI007110-
29 in Infectious Diseases.
I would finally like to thank my family and friends, firstly my parents who have been
very supportive of my entire educational career and always pushed me to do better and
always strive for excellence. Special thanks to my “baby” sister Jamila, who has been

5
my biggest supporter and confidante when I needed it. To my aunts and uncles, thanks
for the endless support and love throughout the years. To Miguel, thank you for all the
love and support in the past few years.

6
TABLE OF CONTENTS page
ACKNOWLEDGMENTS .................................................................................................. 4
LIST OF TABLES ............................................................................................................ 9
LIST OF FIGURES ........................................................................................................ 11
LIST OF ABBREVIATIONS ........................................................................................... 15
ABSTRACT ................................................................................................................... 17
CHAPTER
1 INTRODUCTION .................................................................................................... 19
Streptococcus mutans and Dental Caries ............................................................... 19 Virulence Factors of S. mutans ............................................................................... 21
Adhesion and Biofilm Formation ....................................................................... 21 Carbohydrate Metabolism ................................................................................ 23
Acidogenicity .................................................................................................... 24 Aciduricity ......................................................................................................... 26
Environmental Stresses in the Oral Cavity and Strategies of S. mutans to Overcome These Stresses .................................................................................. 29
Oxidative Stress Tolerance .............................................................................. 29
Two Component Systems ................................................................................ 30 Quorum Sensing .............................................................................................. 31
Genetic Competence ........................................................................................ 33 Bacteriocins and Immunity Proteins ................................................................. 38 Nutrient Limitation and (p)ppGpp Production ................................................... 41
Enzymatic Control of (p)ppGpp Metabolism ..................................................... 43 Summary ................................................................................................................ 45 Specific Aims .......................................................................................................... 46
2 MATERIALS AND METHODS ................................................................................ 50
Growth Conditions .................................................................................................. 50 Growth Assays ........................................................................................................ 50 Biofilm Assays ........................................................................................................ 51 DNA Manipulation and Construction of Mutants. .................................................... 52
PCR Ligation: Insertion Mutagenesis ............................................................... 52
Splice Overlap Extension Mutagenesis ............................................................ 52 Complementation ............................................................................................. 53
Construction of Promoter Fusions .................................................................... 54

7
Transformation Assays. .......................................................................................... 55
Measurement of (p)ppGpp Accumulation ............................................................... 56 RNA Manipulation ................................................................................................... 57
RNA Extraction. ................................................................................................ 57
qRT-PCR .......................................................................................................... 57 Semi-quantitative-Reverse Transcriptase PCR ................................................ 58 RNA Sequencing .............................................................................................. 58 Short-Read Alignments .................................................................................... 59
Transcript Predictions ....................................................................................... 59 Prediction of Small RNAs and Targets ............................................................. 60 Statistical Analysis for Differential Expression .................................................. 61 Microarray Experiments.................................................................................... 61 S. mutans Microarray Data Analysis. ............................................................... 62
Biochemical Assays ................................................................................................ 62 Chloramphenicol Acetyltransferase Assay. ...................................................... 62
β-Galactosidase Assay ..................................................................................... 63
Protein Manipulation ............................................................................................... 64 Protein Purification ........................................................................................... 64 Electrophoretic Mobility Shift Assay (EMSA) .................................................... 65
Fluorescent Polarization Assay ........................................................................ 66
3 CHARACTERIZATION OF THE SMU0835-837 OPERON AND ITS ROLE ON GROWTH, BIOFILM FORMATION AND STRESS TOLERANCE IN Streptococcus mutans ............................................................................................ 76
Introduction ............................................................................................................. 76
Results .................................................................................................................... 78 Transcriptional Organization of the SMu0835-837 Operon. ............................. 78
SMu0835 (RcrR) Is the Dominant Regulator of the Operon . ........................... 79 Growth Characteristics of the Mutants.............................................................. 80
Discussion .............................................................................................................. 82
4 REGULATION OF relPRS AND THE EFFECTS OF SMU0835-0837 ON relPRS AND (p)ppGpp LEVELS........................................................................................ 103
Introduction ........................................................................................................... 103 Results .................................................................................................................. 104
SMu0835-837 Influence relP Expression and Vice Versa. ............................. 104
Effect of SMu0835-0837 on (p)ppGpp Levels ................................................ 105
Effect of Oxidative Stressors on (p)ppGpp Pools ........................................... 105 Effect of Oxidative Stressors on relP Promoter Activity .................................. 106
Discussion ............................................................................................................ 106
5 THE EFFECT OF SMU0835-0837 ON THE COMPETENCE REGULON ............ 119
Introduction ........................................................................................................... 119 Results .................................................................................................................. 120

8
Competence Defect in rcrRPQ Mutants. ........................................................ 120
SMu0835-7(rcrRPQ) Affect comX and comY Expression............................... 122
Differences in Growth of Mutant Strains in the Presence of CSP ................... 123
Discussion ............................................................................................................ 124
6 REGULATION OF GENE EXPRESSION AND COMPETENCE BY THE SMU0835 (RcrR) protein ...................................................................................... 138
Introduction ........................................................................................................... 138 Results .................................................................................................................. 139
Identification of RcrR Binding Sites ................................................................ 139 Mutations in the Predicted Binding Sites Affect Binding of the RcrR Protein .. 141 Mutations in the Binding Site of the rcrR Promoter Affect Competence. ........ 142 Effect of the Mutations on Promoter Activity. .................................................. 142
Mutations in the rcrR Binding Site Affect comX, comS and comYA Expression .................................................................................................. 143
Effect of the Mutations in the rcrR Binding Site on rcrR and rcrP Expression 143
Mutations in the Predicted RcrR Binding Site Affects Growth in CSP ............ 144
Global Regulation by the RcrR Regulator....................................................... 145 RcrR Has A Weak Interaction With the comX and relP Promoter Region ...... 145
Discussion ............................................................................................................ 146
7 SUMMARY AND FUTURE DIRECTIONS ............................................................ 177
The Role of RcrRPQ in Stress Tolerance ............................................................. 177
Novel Factors Affecting (p)ppGpp Metabolism ..................................................... 180
The Role of RcrRPQ on Genetic Competence and DNA Uptake .......................... 182
Linkage of RcrRPQ to Stress Tolerance, (p)ppGpp and Competence .................. 184 Future Studies ...................................................................................................... 187 Summary .............................................................................................................. 187
APPENDIX: ZONE OF INHIBITION ............................................................................ 196
LIST OF REFERENCES ............................................................................................. 197
BIOGRAPHICAL SKETCH .......................................................................................... 218

9
LIST OF TABLES
Table page 2-1 List of strains ...................................................................................................... 70
2-2 List of plasmids used .......................................................................................... 71
2-3 List of primers ..................................................................................................... 72
2-4 List of real-time primers ...................................................................................... 74
2-5 List of primers and oligos for EMSA and FP analysis ......................................... 75
3-1 Percentage of labeled PrcrR DNA shifted with unlabeled competitor PrcrR DNA .................................................................................................................... 94
3-2 Table showing growth characteristics of the non-polar mutants versus the wild-type strain in BHI ......................................................................................... 95
3-3 Table showing growth characteristics of the polar mutant versus the wild-type strain in BHI. ....................................................................................................... 96
3-4 Table showing growth characteristics of the wild-type versus the non-polar strains at pH 5.5 ................................................................................................. 97
3-5 Table showing growth characteristics of the polar mutant versus the wild-type strain at pH 5.5 ................................................................................................... 98
3-6 Table showing growth characteristics of the mutants versus the wild-type strain with aeration ............................................................................................. 99
3-7 Table showing growth characteristics of the mutants versus the wild-type strain with 25 mM paraquat .............................................................................. 100
4-1 Percent change in GP4 (ppGpp) and GP5 (pppGpp) accumulation of mutant strains compared to the wild-type strain. .......................................................... 115
5-1 Summary showing mutant strains, SMu0835-837 mRNA expression levels and transformation efficiency compared to the wild-type strain. ....................... 127
5-2 Transformation efficiency of the wild-type and various mutants strains in the presence or absence of added CSP ................................................................. 128
5-3 Table showing growth characteristics of the mutants versus the wild-type strain in BHI. ..................................................................................................... 136
5-4 Table showing growth characteristics of the mutants versus the wild-type strain in BHI + 2µM CSP................................................................................... 137

10
6-1 Percentage of DNA shifted with different PCR products of the promoter of rcrR ................................................................................................................... 154
6-2 Percentage of DNA shifted with different annealed oligos in the promoter of rcrR ................................................................................................................... 155
6-3 Percentage of labeled PrcrR DNA shifted with unlabeled oligo competitors of PrcrR DNA .......................................................................................................... 156
6-4 Percentage of PWT DNA vs. PNBS1 DNA shifted at different protein concentrations .................................................................................................. 157
6-5 Percentage of PWT DNA vs. PBBS DNA shifted at different protein concentrations .................................................................................................. 158
6-6 Transformation efficiency of the wild-type and SOE mutants strains in the presence or absence of added CSP ................................................................. 160
6-7 Genes differentially regulated in the ∆835np strain vs. wild-type strain via microarray analysis ........................................................................................... 172
6-8 Genes differentially regulated in the ∆835np strain vs wild-type strain via RNA-seq analysis. ............................................................................................ 173
6-9 Genes differentially regulated in the ∆835p strain vs wild-type strain via RNA-seq analysis. ..................................................................................................... 175
7-1 List of organisms with genes encoding RcrRPQ homologues linked to RelPRS homologues and their GeneBank Locus ID ........................................ 194
7-2 Summary of mutants with deletions in the rcrQ 3’ region showing transformation efficiency compared to the wild-type strain ............................... 195

11
LIST OF FIGURES
Figure page 1-1 Comparison of the competence pathways between Streptococcus
pneumoniae and Streptococcus mutans ............................................................ 47
1-2 Schematic showing the regulation of (p)ppGpp by RelA and SpoT in Gram-negative bacteria. ............................................................................................... 48
1-3 Schematic of the genes encoding the three (p)ppGpp enzymes in S. mutans ... 49
2-1 Schematic showing the process for making insertion:deletion mutants via PCR ligation mutagenesis .................................................................................. 67
2-2 Schematic showing the process for making point mutations via splice overlap extension PCR .................................................................................................... 68
2-3 Gel image showing size-difference in PCR products generated from the SOE mutants vs. WT using MAMA primers. ............................................................... 69
3-1 Schematic diagram of the SMu0835-0839 (rcrRPQ) gene cluster and the relPRS operon in S. mutans UA159. .................................................................. 86
3-2 RT-PCR using cDNA generated from the SMu0836 reverse primer.. ................. 87
3-3 RT-PCR using cDNA generated from the SMu0837 reverse primer. .................. 88
3-4 RealTime-RT-PCR showing rcrQ mRNA levels. ................................................ 89
3-5 RealTime-RT-PCR showing tpx mRNA levels. ................................................... 90
3-6 RealTime-RT-PCR showing SMu0836(rcrP) mRNA levels ................................ 91
3-7 RealTime-RT-PCR showing NP Kanamycin mRNA levels. ................................ 92
3-8 EMSA showing binding of biotinylated PrcrR DNA with purified RcrR protein.. .... 93
3-9 EMSA showing competitive binding of 5 fmol biotinylated PrcrR DNA and unlabeled PrcrR DNA with 1.25 pmoles of purified RcrR protein.. ........................ 94
3-10 Growth comparison of wild-type and non-polar mutant strains in BHI. ............... 95
3-11 Growth comparison of wild-type and polar mutant strains in BHI. ...................... 96
3-12 Growth of the non-polar mutants versus the wild-type strain at pH 5.5 .............. 97
3-13 Growth of the polar mutant strain versus the wild-type strain at pH 5.5. ............. 98
12
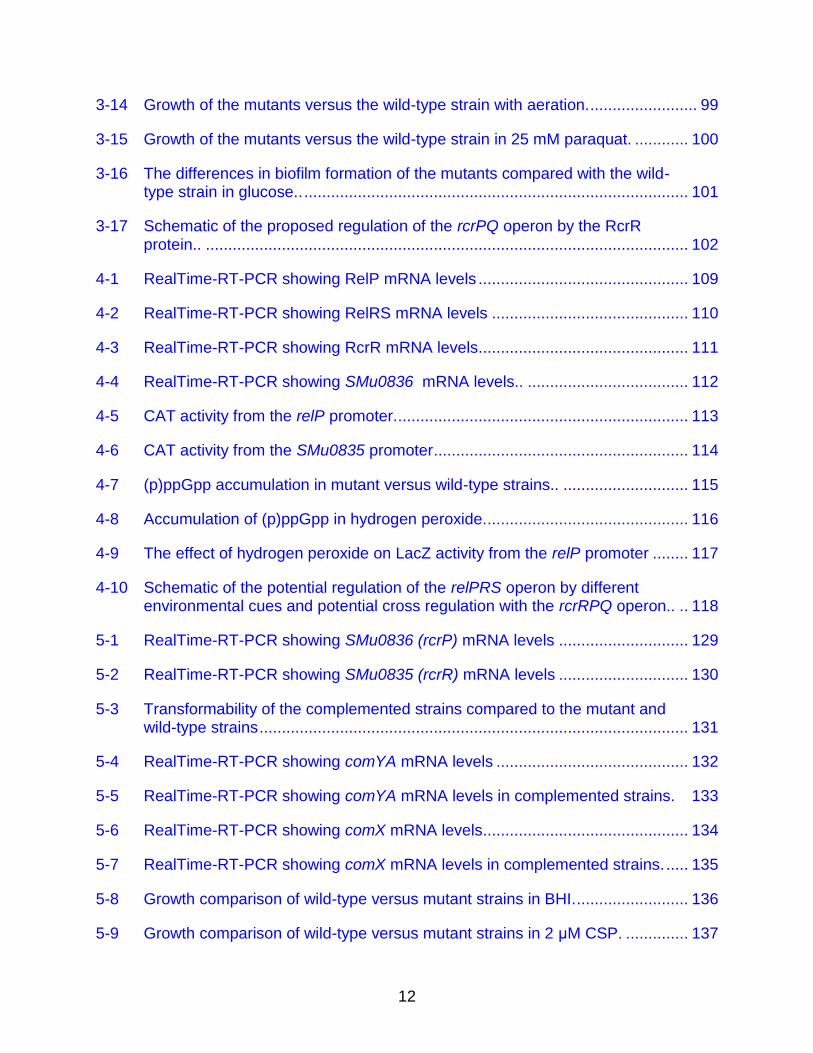
3-14 Growth of the mutants versus the wild-type strain with aeration. ........................ 99
3-15 Growth of the mutants versus the wild-type strain in 25 mM paraquat. ............ 100
3-16 The differences in biofilm formation of the mutants compared with the wild-type strain in glucose.. ...................................................................................... 101
3-17 Schematic of the proposed regulation of the rcrPQ operon by the RcrR protein.. ............................................................................................................ 102
4-1 RealTime-RT-PCR showing RelP mRNA levels ............................................... 109
4-2 RealTime-RT-PCR showing RelRS mRNA levels ............................................ 110
4-3 RealTime-RT-PCR showing RcrR mRNA levels ............................................... 111
4-4 RealTime-RT-PCR showing SMu0836 mRNA levels.. .................................... 112
4-5 CAT activity from the relP promoter. ................................................................. 113
4-6 CAT activity from the SMu0835 promoter ......................................................... 114
4-7 (p)ppGpp accumulation in mutant versus wild-type strains.. ............................ 115
4-8 Accumulation of (p)ppGpp in hydrogen peroxide. ............................................. 116
4-9 The effect of hydrogen peroxide on LacZ activity from the relP promoter ........ 117
4-10 Schematic of the potential regulation of the relPRS operon by different environmental cues and potential cross regulation with the rcrRPQ operon.. .. 118
5-1 RealTime-RT-PCR showing SMu0836 (rcrP) mRNA levels ............................. 129
5-2 RealTime-RT-PCR showing SMu0835 (rcrR) mRNA levels ............................. 130
5-3 Transformability of the complemented strains compared to the mutant and wild-type strains ................................................................................................ 131
5-4 RealTime-RT-PCR showing comYA mRNA levels ........................................... 132
5-5 RealTime-RT-PCR showing comYA mRNA levels in complemented strains. 133
5-6 RealTime-RT-PCR showing comX mRNA levels .............................................. 134
5-7 RealTime-RT-PCR showing comX mRNA levels in complemented strains. ..... 135
5-8 Growth comparison of wild-type versus mutant strains in BHI. ......................... 136
5-9 Growth comparison of wild-type versus mutant strains in 2 μM CSP. .............. 137

13
6-1 EMSA showing binding of biotinylated regions of PrcrR DNA with purified RcrR protein. .................................................................................................... 152
6-2 Schematic of the promoter region of the rcrRPQ operon in S. mutans UA159. ......................................................................................................................... 153
6-3 EMSA showing binding of biotinylated PCR products of PrcrR with purified RcrR protein.. ................................................................................................... 154
6-4 EMSA showing binding of biotinylated oligos of PrcrR DNA with purified RcrR protein. ............................................................................................................. 155
6-5 EMSA showing competitive binding of biotinylated regions of PrcrR DNA with unlabeled regions of Prcr DNA and purified RcrR protein. ................................. 156
6-6 EMSA showing binding of biotinylated PNBS1 mutated regions of PrcrR DNA with purified RcrR protein ................................................................................. 157
6-7 EMSA showing binding of biotinylated PBBS mutated regions of PrcrR DNA with purified RcrR protein ................................................................................. 158
6-8 EMSA showing binding of biotinylated PNBS2 mutated regions of PrcrR DNA with purified RcrR protein.. ............................................................................... 159
6-9 β-galactosidase activity from rcrR promoters that contained various mutations. ....................................................................................................... 161
6-10 RealTime-RT-PCR showing comYA mRNA levels in strains with mutations in the RcrR binding site. ....................................................................................... 162
6-11 RealTime-RT-PCR showing comS mRNA levels in strains with mutations in the RcrR binding site.. ...................................................................................... 163
6-12 RealTime-RT-PCR showing comX mRNA levels in strains with mutations in the RcrR binding site.. ...................................................................................... 164
6-13 RealTime-RT-PCR showing rcrR mRNA levels in strains with mutations in the RcrR binding site ........................................................................................ 165
6-14 RealTime-RT-PCR showing rcrP mRNA levels in the strains with mutations in the RcrR binding site.. ...................................................................................... 166
6-15 Growth comparison of wild-type and mutant strains in BHI.. ............................ 167
6-16 Growth comparison of wild-type vs. mutant strains in 2 μM CSPe. .................. 168
6-17 Growth comparison of wild-type vs. SJ354 in 2 μM CSP. ................................. 169

14
6-18 EMSA showing binding of the relP promoter with purified RcrR protein. positive and negative controls for RcrR protein.. .............................................. 170
6-19 EMSA showing binding of the comX promoter with purified RcrR protein. . .... 171
7-1 Schematic of the working model showing the regulation of relP and comX by RcrRPQ under rcr repressing conditions.. ........................................................ 189
7-2 Schematic of the working model showing the regulation of relP and comX by RcrRPQ under rcr derepressing conditions.. .................................................... 190
7-3 Schematic of the working model showing the regulation of the competence pathway and the RelPRS –dependent production of (p)ppGpp by rcrRPQ. ..... 191
7-4 Schematic showing the presence of a putative peptide. Peptide 1 in the 3’ region of SMu0837 (rcrQ). ................................................................................ 192
7-5 Schematic showing the presence of a putative peptide. Peptide 2 in the 3’ region of SMu0837 (rcrQ). ................................................................................ 193

15
LIST OF ABBREVIATIONS
ΩKm Polar kanamycin resistance gene cassette
ABC ATP-binding cassette
ATP Adenosine triphosphate
BCA Bicinchoninic acid
BCAA Branch chained amino acids
BHI Brain heart infusion
BIP Bacteriocin immunity protein
BM Base media
BP Base pairs
CAT Chloramphenicol acetyl transferase
CSP Competence stimulating peptide
DTNB Dithionitrobenzoic acid
DTT Dithiothreitol
dsDNA double stranded DNA
EDTA Ethylenediaminetetraacetic acid
EMSA Electrophoretic mobility shift assay
GTP Guanosine triphosphate
HK Histidine Sensor Kinase
IDV Integrated density values
kDA kiloDalton
MAMA Mismatch amplification mutation assay
MarR Multiple antibiotic resistance regulator
NPKm Non-polar kanamycin resistance cassette
O/N Overnight

16
OD Optical density
ONPG ortho-Nitrophenyl-β-galactosidase
PAGE Polyacrylamide gel electrophoresis
PCR Polymerase chain reaction
PEP-PTS Phosphoenolpyruvate:sugar phosphotransferase system
ppGpp/GP4 Guanosine 3', 5'-bispyrophosphate / tetraphosphate
pppGpp/GP5 Guanosine 3'-diphosphate, 5-'triphosphate / pentaphosphate
qRT-PCR Quantitative real-time polymerase chain reaction
QS Quorum sensing
RBS Ribosome binding site
RNAP RNA polymerase
ROS Reactive oxygen species
RR Response regulator
RT-PCR Reverse transcription polymerase chain reaction
SDS Sodium dodecyl sulfate
ssDNA Single stranded DNA
SOE Splice extension overlap
TCA Tricarboxylic acid
TCS Two-component system
TLC Thin layer chromatography
XIP ComX inducing peptide
17
Abstract of Dissertation Presented to the Graduate School of the University of Florida in Partial Fulfillment of the Requirements for the Degree of Doctor of Philosophy
A GENE CLUSTER INVOLVED IN STRESS TOLERANCE, (P)PPGPP METABOLISM
AND GENETIC COMPETENCE IN Streptococcus mutans
By
Kinda Seaton
May 2013
Chair: Robert A. Burne Major: Medical Sciences, Immunology and Microbiology
Dental caries is one of the most common infectious diseases, and costs associated
with oral care can exceed $70 billion annually. Streptococcus mutans, the primary
etiological agent of dental caries, has evolved multiple strategies to become established
as a constituent of pathogenic biofilms and to cause caries. One of the key factors
contributing to the virulence of S. mutans is its ability to tolerate environmental stresses
and to thrive at low pH, when the growth of many other plaque bacteria is inhibited. The
studies provided here identified a previously uncharacterized gene locus, SMu0835-7,
that was renamed rcrRPQ for rel-competence-related that is involved in stress
tolerance, (p)ppGpp metabolism and genetic competence. RcrR (SMu0835) encodes a
multiple antibiotic resistance family transcriptional regulator (MarR), an autogenous
dominant regulator of the operon, and rcrPQ (SMu0836-7) encode ATP-dependent
efflux pumps. Mutations in rcrPQ affected the ability of the organism to grow, especially
at low pH and in the presence of oxidative stresses. Optimal expression of relP, which
encodes the synthetase that is the primary source of (p)ppGpp during exponential
growth, required rcrRPQ and the levels of (p)ppGpp accumulated in exponentially
18
growing cells were also affected in rcrRPQ mutants. It was also found that oxidative
stressors caused an increase in (p)ppGpp pools in a RelPRS-dependent manner.
Various mutations made in the rcrRPQ operon led to changes in the ability of the
cells to be transformed with exogenous DNA. Replacement of rcrR with a non-polar
antibiotic resistance cassette resulted in over expression of rcrPQ s and rendered the
strain non-transformable with exogenous DNA. Transcriptional analysis revealed that
the expression of comYA, comX and comS, which are critical for competence and DNA
uptake, were dramatically altered in these mutants. Global transcriptional profiling of
the various rcrR mutants also revealed that the genes in the competence pathway were
those that were most differentially regulated. Collectively, the data support that the
rcrRPQ gene products play a critical role in physiologic homeostasis and stress
tolerance by linking (p)ppGpp metabolism, acid and oxidative stress tolerance, and
genetic competence of S. mutans.

19
CHAPTER 1 INTRODUCTION
Streptococcus mutans and Dental Caries
Streptococcus mutans is a Gram-positive facultative anaerobe belonging to the
viridans streptococci group. The name “viridans” streptococci is derived from the green
halo formed around colonies on blood agar plates, indicative of their α-hemolytic activity
(49). The viridans streptococci are catalase-negative cocci that form chains and can be
further divided into the mutans, mitis, salivarius, anginosus and sanguinus groups. The
mutans group consists of Streptococcus mutans, Streptococcus sobrinus,
Streptococcus cricetus, Streptococcus rattus, Streptococcus downeii, Streptococcus
ferus, Streptococcus macacae, and can be differentiated from the other groups by their
ability to ferment mannitol and sorbitol. S. mutans can be further sub- divided into 4
serotypes c, e, f and k based on the cell wall rhamnose–glucose polysaccharides (134,
204).
The oral microbiome is diverse with over 600 taxa present (56). Oral streptococci
constitute approximately 23% of cultivable bacteria, and the mutans streptococci
comprise 2-5% of the population isolated from healthy individuals (29). Dental caries is
considered one of the most common bacterial infections in humans, and studies show
that 90% of Americans over the age of 20 have dental caries in their permanent teeth
(25). In addition to the pain and discomfort associated with dental caries, the disease
poses an economic burden for treatment in the United States, with costs for oral health
care treatment exceeding $70 billion annually (134). S. mutans is the one of the
etiological agents of dental caries and is implicated in infective endocarditis (80, 92,
104). It was originally isolated from carious lesions by Clarke in 1924 (43). In Western

20
populations and developed countries, the most common serotype isolated from the oral
cavity is serotype c (70-80%), followed by serotype e (20%), while f and k account for
less than 5% (162). However, serotype f and k are the most common serotype isolated
from endocarditis plaques (161). Abranches et al. showed that strains that were
serotype e and f were more invasive of coronary endothelial cells than strains that were
serotype c (2). S. mutans is able to cause disease primarily based on its metabolism,
whereas some other bacteria have typical virulence factors such as toxins or effectors
that cause disease and damage to the host.
S. mutans has mechanisms to adhere to the tooth surface, accumulate in biofilms,
produce acid and tolerate the acid it generates (20). S. mutans is highly effective at
producing acids from the fermentation of a wide range of dietary carbohydrates, causing
a decrease in pH of the oral biofilms and demineralization of the tooth. It is the
accumulation of acids that causes demineralization of the tooth enamel that leads to
dental caries and tooth decay (20, 134). In addition, S. mutans is particularly acid
tolerant (aciduric), and able to grow and to carry out glycolysis at pH values that are well
below that needed to damage the tooth mineral. In fact, the property of aciduricity is
considered a major contributor to the role of S. mutans in the initiation and progression
of carious lesions, and aciduricity is a general property of caries-associated bacteria.
S. mutans utilizes many systems to adapt to the oral environment and outcompete
other species in a biofilm to cause disease when the conditions are favorable. The oral
cavity is continuously changing and can become a hostile environment for bacteria to
survive, with rapid variations in pH, oxygen tension and nutrient availability. Bacteria
must be able to respond to these fluctuations in order to survive. Carlsson first

21
described the “feast and famine” lifestyle of oral bacteria to illustrate that these
organisms are confronted with extended periods during which saliva is the primary
nutrient source, interspersed with comparatively short intervals where nutrients from
dietary sources are abundant (38). S. mutans lives on the tooth surface at high cell
density in dental plaque, and the structure and composition of the plaque are strongly
influenced by factors such as pH and nutrient availability. S. mutans aggregates to form
a protective biofilm and hence contributes to the pathogenicity of S. mutans to establish
itself as one of the dominant bacteria in cariogenic dental plaque (33, 217). There are
four main requirements for S. mutans to become cariogenic. The bacteria have to be
able to adhere to the tooth surface and form biofilms, accumulate in sufficient numbers
to produce damage to the host, generate acid by fermentation and tolerate the acidic
environment it generates.
Virulence Factors of S. mutans
Adhesion and Biofilm Formation
Bacteria are able to adhere to the tooth pellicle, which is primarily formed from
salivary glycoproteins that adhere to the tooth surface and form a thin film. S. mutans
adheres to the tooth surface through sucrose-dependent and sucrose-independent
interactions. Sucrose-independent adhesion is mediated through a surface adhesin
P1(SpaP) also known as antigen I/II, which facilitates binding of S. mutans to the
salivary pellicle (51, 115, 139), and mutants deficient in SpaP were not able to adhere to
saliva-coated surfaces (30). The antigen I/II family of proteins share 7 domains, and
Bleiweis et al. demonstrated that the alanine-rich region or A-region was able to bind
salivary agglutinin (50). The proline-rich domain was also thought to be responsible for
the interaction of P1(SpaP) with salivary components (20). Other surface-associated

22
proteins such as WapA (Antigen III) and BrpA have been implicated in the formation of
biofilm independently of sucrose. A mutant that lacks the gene encoding the WapA
protein had perturbed biofilm architecture (244), and Wen et al. showed that mutants
deficient in brpA had significantly lower biofilm formation when cells were grown in
glucose (230).
In the presence of sucrose, dental plaque biofilm becomes irreversibly bound by
the formation of glucans and fructans (59). Sucrose is the primary substrate for the
glucosyltransferases (GTFs) GtfB, GtfC and GtfD. The GTF enzymes consist of a
glucan binding domain (20) and possess sucrase activity that split sucrose into glucose
and fructose (159, 240). The glucose moiety is added to a growing polymer of glucan to
synthesize water-soluble and water-insoluble glucans (160). The water-insoluble
glucans have a higher degree of branching and are predominantly α-1,3-linked whereas
the water-soluble glucans are linked primarily by α-1,6-glycosidic linkages. GtfB and
GtfC synthesize the water insoluble glucans, while GtfD primarily synthesizes water
soluble glucans. Mutants lacking GTF enzymes had diminished cariogenicity in rodents
as well (111). Glucans help to facilitate adhesion to the tooth through hydrogen bonding
of the glucan polymers to the salivary pellicle (20). S. mutans can become coated with
glucans in the presence of sucrose, and it is hypothesized that S. mutans can attach to
glucans within the dental plaque (20). Other glucan-binding proteins (GBPs) found on
the cell surface are thought to assist in the adherence and biofilm formation process by
binding glucans or mediating dextran-dependent aggregation (20, 21). The levels of
GbpB correlate with biofilm formation (151), and a mutant that had the gbpA gene
inactivated had changes to the architecture of sucrose-dependent biofilm (21).
23
Carbohydrate Metabolism
There is a correlation of dental caries development and dietary sugar intake (36).
Evidence accumulated in the mid 1800s showed a link between bacterial sugar
metabolism to acid production and tooth decay (140). Therefore, proteins that are
involved in sugar metabolism are considered potential virulence factors of S. mutans.
These include fructosyltransferase (Ftf), which catalyzes the synthesis of fructans that
function as a nutrient reserve (234, 235), a fructanase (FruA), which breaks down
fructans for energy use (35) and an extracellular dextranase (DexA), which may help
contribute to the synthesis and breakdown of glucans (210). During periods of excess
sugar intake, S. mutans accumulates intracellular and extracellular polysaccharides
(IPS and EPS). IPS are glycogen-like storage polymers and contribute to caries
formation and survival during nutrient starvation (34, 208), and EPS are rapidly
synthesized when sucrose is present in the diet. The DltA-D enzymes, which are
orthologous to the D-alanine-activating enzymes in Bacillus subtilis, are involved in the
accumulation of intracellular polysaccharides that can be used as an energy reserve
(82).
At low sugar concentrations, the phosphoenolpyruvate (PEP) sugar:
phosphotransferase system (PTS) is the major system for the uptake of sugars in the
cell (97, 118, 224). An incoming sugar must be phosphorylated by the PTS. A
phosphate group is transferred to the sugar-specific enzyme and finally to the incoming
sugar. The PEP-PTS internalizes a wide variety of sugars including glucose, fructose,
mannose, sucrose and lactose. The PEP-PTS consists of two proteins, Enzyme I (E1)
and HPr, which is a heat stable phosphocarrier protein. There are also sugar-specific
permeases known as Enzyme II (EII) complex, which consist of the EIIA, EIIB and EIIC

24
domains. A phosphate group from a PEP molecule is transferred to EI, which
phosphorylates HPr at His-15. The phosphate group is then transferred to the sugar-
specific EIIA and B domains, and then transferred to the incoming sugar for transport by
EIIC membrane domain (118, 182). The internalized sugar can be metabolized by
various enzymes to end-products which include glucose, and can enter the glycolytic
pathway (242).
Carbon catabolite repression (CCR) involves networks that activate or silence
genes in response to carbohydrate source and availability. CCR is controlled by HPr
and CcpA, which is a transcriptional regulator, in low-G+C content Gram-positive
bacteria. During conditions that can induce CCR such as excess glucose, an HPr
kinase that is activated by specific glycolytic intermediates, such as fructose-1,6-
bisphosphate (F-1,6-bP) or glucose-6-phosphate, can phosphorylate HPr at serine-46 at
the expense of ATP. HPr-(Ser-46-P) forms a complex with CcpA that stimulates CcpA
binding to conserved catabolite responsive elements (CRE) in the promoters of a variety
of genes to control their activity (3, 120). CcpA can regulate sporulation, antibiotic
resistance and expression of virulence attributes.
Acidogenicity
In 1940 Stephan showed a rapid decline in plaque pH after a sugar rinse that was
linked to the production of lactic acid by bacteria (212). S. mutans can produce lactate,
formate, acetate and ethanol as fermentation by-products from glycolysis. The
acidogenicity of S. mutans causes a reduction of plaque pH, and sustained plaque pH
values below 5.5 favor the demineralization of enamel and dental caries (120). Lactic
acid has a low pKa and is able to demineralize the tooth surface more effectively than
other end products such as formate or acetate. The distribution of the fermentation

25
products changes as growth conditions change. When there is an excess of
carbohydrate source, lactic acid is the dominant glycolytic end-product whereas
formate, acetate and ethanol are predominant in glucose limiting conditions (238). S.
mutans has the ability to open a lactate gate which protects the bacteria from sugar
killing. The opening of the lactate gate enables the rapid movement of carbohydrates
through glycolysis and more efficient movement of lactic acid out of the cells. The
production of lactate is controlled by the NAD-dependent lactate dehydrogenase (LDH)
(38). When there is an excess of carbohydrate source, NADH levels can build-up as a
result of glycolysis. LDH is activated by fructose 1,6-bisphosphate, a glycolytic
intermediate, to catalyze the conversion of pyruvate to lactate, generating NAD+ from
NADH. Mutations in ldh appear to be lethal in S. mutans, probably because of the
accumulation of glycolytic intermediates and an imbalance in NADH/NAD+ (42, 88).
Strains that have reduced LDH activity have reduced cariogenicity (42, 65, 102).
In carbohydrate-limiting conditions, S. mutans is able to survive and the major end
products shift from lactate to formate, acetate and ethanol and ldh is not induced. The
shift in glycolytic end-products is controlled by the pyruvate formate lyase enzyme
(PFL), which can convert pyruvate and coenzyme A (CoA) into formate and acetyl-CoA.
However, PFL is not active when oxygen is present, and the pyruvate dehydrogenase
complex (PDH) is active (39). Pyruvate can then be converted to acetyl-CoA and CO2
and NADH is generated (18). Acetyl-CoA can be converted to acetyl-phosphate (acetyl-
P). Acetate can then be produced from acetyl-P yielding one molecule of ATP by the
enzyme acetate kinase (39). The inactivation of pdh impairs the survival of the bacteria
in limiting sugar (37).

26
Aciduricity
In addition to the generation of acids, S. mutans is able to tolerate low pH, which
distinguishes it from many other oral bacteria and gives it a selective advantage to
become a dominant colonizer over other oral bacteria that cannot endure acid as well
(118). The bacteria are able to retain glycolytic capabilities at pH values as low as 4.4
(27). The pH of saliva is around neutral, which is optimal for the growth of most oral
bacteria (143). However, after an intake of dietary sugars, the pH rapidly decreases as
a result of the metabolism of the dietary sugars. S. mutans has many strategies to cope
and function at this low pH.
F-ATPase. The major mechanism for coping with the low pH is through the
extrusion of protons by the F-ATPase (H+-translocating ATPase), which maintains the
internal pH more alkaline compared to the environment (26). Acid-sensitive glycolytic
enzymes are protected through the acid tolerance response, and a ΔpH for bioenergetic
processes is maintained. Studies have shown that as the pH falls, the activity of the
membrane bound F1F0 -ATPase proton pump increases, helping to maintain the pH at
Δ0.5-1 relative to the external environment (81, 215). The optimal pH for the F-ATPase
enzyme in S. mutans is 6.0, compared to less acid-tolerant bacteria where the optimal
pH for the ATPase enzymes is more neutral (184). Also, it has been shown that the F-
ATPase can function as an ATP synthase in starved cells at low pH. A sudden drop in
pH causes a rapid increase in ATP levels, which was demonstrated to be the result of
the F-ATPase acting as an ATP synthase (203). Therefore, the F-ATPase may not only
be playing role in proton extrusion, but may play a role in generating ATP for growth
(203).
Shift in membrane profile. The fatty acid profile of the membrane shifts from short-

27
chained saturated fatty acids to mono-unsaturated fatty acids and longer chains as the
pH falls (69). The change in the fatty acid membrane profile leads to decreased
permeability to protons, which may influence the activity of the F-ATPase (188). The
fabM gene product is responsible for the generation of mono-unsaturated fatty acids
(68), and mutants lacking this gene, were more sensitive to low pH and unable to
maintain ∆pH. The fabM mutants also exhibited reduced virulence in a rat caries model
compared to the parental strain (68).
Membrane biogenesis is critical to stress tolerance as well. Strains that had
mutations to genes encoding proteins involved in D-alanyl-lipoteichoic acid synthesis
and phospholipid metabolism were incapable of surviving at low pH (31, 241). A strain
with a mutation in the ffh gene, which encodes a homologue of the eukaryotic signal
recognition particle (SRP), was incapable of growing at pH 5 (109). In addition, the
membrane-localized chaperone YidC, which is involved in the assembly of membrane
proteins, had impaired growth in a variety of stress conditions, including low pH (84,
120).
Alkaline generation. Some oral bacteria are able to produce ammonia by urease
enzymes or the arginine deiminase system (ADS) in response to a drop in pH (120).
These organisms are able to convert urea or arginine to produce CO2 and ammonia. S.
mutans lacks urease and the ADS pathway, so it is not able to generate alkali as
efficiently, but it does possess an analogous system. The agmatine deiminase system
(AgDS), which is able to convert agmatine, a derivative of arginine, to produce
putrescine, ammonia and CO2. The AgDS is expressed at relatively low levels and
does not appear to cause a significant rise in the pH of the environment, as is seen with

28
the ADS system (72, 73). The ammonia produced from the AgDS in S. mutans may be
important in increasing the cytoplasmic pH and generating ATP to extrude protons,
especially when the bacteria are faced with an acid challenge (73, 74).
Induction of genes for DNA repair. The glycosidic bonds of deoxyribonucleotides
are unstable at low pH, so a buildup in acid can cause loss of purines and pyrimidines
from DNA due to protonation of the base followed by the cleavage of the glycosyl bond
that leave abasic sites (AP) (132). There is an induction of the DNA repair AP
endonucleases, which recognize these AP sites in response to low pH (77). Molecular
chaperones which are induced for bacteria to cope with different stresses, prevent
aggregation and accumulation of improperly folded proteins that may be toxic for the
bacteria. In S. mutans, the molecular chaperones GroEL and DnaK are rapidly induced
by acid shock (99), and mutants that had low levels of the genes encoding these
chaperones had impaired capacity to grow at low pH, and even hydrogen peroxide.
The induction of DnaK is maintained throughout acidic conditions, and it is proposed
that DnaK has a role in the biogenesis of F-ATPase (100, 121). There is also the
induction of another stress protein, ClpP peptidase, which may be involved in acid
tolerance by preventing the accumulation of denatured proteins and modulating the
stability of transcriptional regulators (121). Trigger factor RopA, is a ribosome-
associated peptidyl-proly cis-trans isomerase molecular chaperone that is conserved in
most bacteria. Trigger factor in S. mutans is upregulated in response to a deficiency of
luxS, which affects acid and oxidative stress tolerance and biofilm formation. The
expression of ropA was also increased in cells stimulated by the competence
stimulating peptide and in populations grown in biofilms which suggest that it may have

29
a role in stress tolerance, competence development, and biofilm formation. Mutants
deficient in ropA also had diminished tolerance to low pH and oxidative stress (232).
Environmental Stresses in the Oral Cavity and Strategies of S. mutans to Overcome These Stresses
Oxidative Stress Tolerance
Oxygen is a critical environmental factor that affects the composition of oral
biofilms. Exposure to oxygen severely impaired biofilm formation in S. mutans and
altered cell surface biogenesis, which may be due to changes in the exopolysaccharide
metabolism or in cell-to-cell adherence (5). S. mutans is a facultative anaerobe and can
metabolize oxygen, but it is catalase-negative, lacks a complete TCA cycle and
respiratory chain, and has a limited capacity to metabolize reactive oxygen species
(ROS). Streptococci do not possess cytochromes and do not carry out oxidative
phosphorylation. Most of the respiration is carried out by NADH oxidases, which reduce
molecular oxygen to oxidize NADH to NAD+ and H2O2 (142). S. mutans is constantly
exposed to oxidative stress agents. These stresses include ROS from host defenses,
peroxide-containing oral hygiene products, Fenton chemistry [(1) Fe2+ + H2O2 Fe 3+ +
OH● + OH- ; (2) Fe3+ + H2O2 Fe2+ + OOH● + H+ ] and the production of hydrogen
peroxide by other oral bacteria (118). ROS are generated inside the cell during
respiration from single cell electron reductions of oxygen from the host and other oral
bacteria. Even though S. mutans lacks a catalase enzyme, it does have a superoxide
dismutase, NADH peroxidase, glutathione reductase and alkyl hydroperoxide reductase
to help cope with oxygen stress (142). NADH peroxidase can convert NADH +H+ H2O2
to NAD++ 2H2O (142). Iron ions stimulate the generation of toxic ROS such as hydroxyl
radicals and hydrogen peroxide from the Fenton reaction. Dpr is a member of the iron-

30
binding protein family, which allows the concentration of free iron ions to be kept low
and hence plays an important role for oxygen tolerance by S. mutans (239). There are
other genes found in the S. mutans genome that encode proteins belong to the OxyR,
PerR and OhrR families that have been implicated in responding to oxidative stress
(118).
Two Component Systems
Two-component systems (TCS) are important for S. mutans to monitor and adapt
to changing environmental conditions. TCS allow bacteria to modulate gene expression
based on a wide variety of environmental signals, such as osmotic shock, pH variations,
host-pathogen interaction and other stresses (24). TCS consist of a membrane-bound
histidine sensor kinase (HK) that detects environmental signals and undergoes
autophosphorylation. The other component in TCS is usually a cytosolic DNA-binding
response regulator (RR) that binds to the promoter regions of genes to alter their
expression. The HK domain detects environmental signals, which results in
autophosphorylation at a specific histidine residue, creating a high-energy phosphoryl
group that is transferred to a specific aspartate residue within the N-terminal half of the
cognate RR. Phosphorylation induces a conformational change in the regulatory
domain resulting in activation of the RR. The activated RR then regulates gene
expression by acting as a DNA-binding transcriptional regulator to activate or repress
genes (214). There are fourteen putative TCS found in the S. mutans UA159 genome.
ComCDE encodes one of the TCS, which are involved in the development of
competence, biofilm formation, bacteriocin production and (p)ppGpp metabolism (9,
205).

31
Quorum Sensing
Bacteria can communicate in a cell-cell dependent manner through quorum
sensing (QS). Quorum sensing bacteria interact with each other by releasing and
responding to the accumulation of chemical signal molecules called autoinducers (228).
Bacteria utilize these signals to coordinate their behavior on a population-wide basis.
The first quorum-sensing system was described in the bioluminescent organism, Vibrio
fischeri (85). In this bacterium, quorum sensing is controlled by LuxR and LuxI, where
LuxI is the autoinducer synthase that produces an acyl-homoserine lactone (AHL).
When the signal reaches a critical threshold extracellularly, it is internalized and bound
by LuxR, and the complex activates the transcription of the operon encoding luciferase
(228). In Gram-negative bacteria, QS is controlled by small molecules called
autoinducers (AI), which can be AHLs or other molecules whose production is
dependent on S-adenosylmethionine (SAM) as a substrate (228). AIs are produced
intracelluarly and are able to diffuse across the inner and outer membranes freely.
When the concentrations of AI reach a critical level, they can bind cytoplasmic
receptors. The receptors that have AI bound can then regulate genes in the QS
regulon. Some Gram-negative bacteria are also able to detect AIs by TCS.
In Gram-positive bacteria, QS is controlled by TCSs. There are no known
regulatory processes that involve the N-acyl homoserine lactone-like signal molecule
(AHL) or the LuxI-LuxR system found in Gram-negative bacteria (228). The signaling
peptides are referred to as autoinducing peptides (AIP). AIPs are produced
intracellularly, processed and secreted, unlike Gram-negative bacteria where the AIs
are diffusible across the membrane. When the extracellular concentrations reach a
critical level they are detected by the HK domain of TCSs to activate the RR and genes
32
in the QS regulon.
The LuxS system, which can mediate communication within and between
species, is controlled by the luxS gene encoding the autoinducer AI-2. The luxS gene
encodes the AI-2 synthetase and is highly conserved across Gram-negative and Gram-
positive bacteria and present in about half of the sequenced bacterial genomes (228).
LuxS is involved in the catabolism of S-adenosylmethionine and converts ribose
homocysteine into 4,5-dihydroxy-2,3-pentanedione, which is the precursor for AI-2. The
luxS gene in S. mutans appears to have an important regulatory role and impacts
virulence. Strains that were defective in luxS had impaired biofilm formation compared
to the wild-type strain (231) and the production of bacteriocins was affected (154).
Some Gram-positive organisms such as Bacillus subtilis, have two autoinducing
peptides that function in a network that allow the organism to commit to either
competence or sporulation, which are two mutually exclusive lifestyles (228). The
competence pathway, which will be described in more detail below, is activated by a
secreted factor ComX, that is detected by a histidine sensor kinase ComP, which
autophosphorylates the response regulator ComA (141). Phosphorylated ComA
regulates the transcription of genes necessary for the development of competence.
ComA has an antagonist protein, RapC, which when bound to ComA inhibits the
development of competence (206). Another autoinducer, competence and sporulation
factor (CSF) encoded by phrC is secreted and at low internal concentrations CSF binds
to the RapC promoter and disrupts RapC binding to ComA, thus promoting the
development of competence (206). At high levels, CSF inhibits the ComP-ComA
signaling cascade through an unknown mechanism, decreasing the development of

33
competence and promoting sporulation. So the same CSF signal can cause the
bacteria to commit to either competence or sporulation depending on its internal
concentration.
In S. mutans the induction of competence is one of the main QS systems and is
controlled by the accumulation and sensing of peptides by the ComCDE TCS system
described below. Biofilm formation, the acid tolerance response and bacteriocin
production are controlled by quorum sensing as well.
Genetic Competence
Some bacteria encode genetically programmed machinery to take up DNA from
their environment, which is known as genetic competence. The phenomenon was first
described by Griffith in 1928 where he observed that he could transfer a virulence factor
from a virulent strain to an avirulent strain of Streptococcus pneumoniae. The
substance extracted from S. pneumoniae isolated from diseased mice was able to
change the morphology of an avirulent strain (71). Avery et al. noted that the substance
was DNA (17). Genetic competence and DNA uptake have been linked to adaptation
and survival by providing resources and increasing genetic diversity in bacterial species.
Competence has been shown to increase the survival of S. pneumoniae when
challenged with an antibiotic stress, and the induction of competence is also regulated
by increased frequency of translations errors (61, 213).
In S. pneumoniae, one of the better studied model organisms for the regulation of
competence, the competence regulon is controlled in a quorum sensing-like manner,
mediated by a 17-aa peptide signaling molecule called competence stimulating peptide
(CSP) (87, 144). CSP is derived from ComC, which is a 45-aa protein that is processed
post-translationally. ComC is exported by an ATP-binding cassette transporter ComAB,

34
which cleaves the leader peptide after the Gly-Gly motif to the processed 17-aa peptide
CSP (94). CSP is sensed by the TCS system consisting of comD, which encodes the
histidine kinase sensor, and come, which encodes the response regulator (176). ComE
controls the expression of comX, which encodes an alternative sigma factor (114),
potentially through a direct interaction at the ComE-binding site present within the comX
promoter. The ComX alternative sigma factor is able to activate genes that have the
comX- box consensus sequence in their promoter region. These genes include the late
competence genes encoding proteins involved in DNA uptake and internalization such
as comYA (136, 138). ComW was identified as another factor that plays a role in
regulating competence by controlling the stabilization and activation of ComX. ComW
prevents ClpP-dependent degradation of ComX, thereby activating competence (144).
ComW is also believed to activate the competence pathway through unknown
mechanisms.
The genes encoding the proteins involved in DNA uptake are considered late
competence genes and include comEA, comFA, the comYA operon and the genes
encoding the proteins involved in the processing of internalized single-stranded DNA
such as coiA, recA and ssbB (53, 112). In Gram-positive bacteria, the ComG proteins
span the cell wall and form the assembly of a pseudopilus and ATPase. In S. mutans,
comG is part of a nine-gene operon with comYA that make up the genes encoding the
proteins for forming the pseudopilus (52). Disassembly of the pseudopilus opens a cell
wall channel and enables dsDNA to diffuse from the surface to the DNA binding protein,
ComEA, which is found in the cytoplasmic membrane (112). In S. pneumoniae and B.
subtilis, dsDNA is bound preferentially over ssDNA and has about 200–fold higher

35
transformation activity in S. pneumoniae for reasons that are not completely understood
(45). Once the dsDNA is bound, fragmentation of the dsDNA to ssDNA by EndA occurs
(52) and ssDNA fragments are transported across the membrane and the non-
transported strand is degraded (45). A highly conserved cytoplasmic membrane
channel ComEC, which is present in all known competent bacteria, enables the
transport of ssDNA across the cytoplasmic membrane. The ComFA protein is a DEAD-
box helicase that is involved in DNA translocation into the cytoplasm in B. subtilis (112).
Other proteins such as DprA are involved in protecting the ssDNA from endonucleases,
and one of the putative functions of SsbB is to prevent back diffusion by binding the
ssDNA (15). The RecA protein is required for recombination of the ssDNA. The CoiA
protein is also a late competence protein that is implicated in DNA uptake in S.
pneumoniae (54). Plasmid DNA that has no homologous regions to the transforming
bacteria is still transported and processed the same as chromosomal DNA in
streptococci. However, it requires recirculization, which makes it less efficient to
transform compared to chromosomal DNA (52).
In S. mutans, competence, biofilm formation and stress tolerance have been
intimately linked. Mutations in the genes of the competence pathway caused
attenuated virulence and reduced cariogenicity in rodents (130), and similar mutations
in the competence pathway caused reduced biofilm formation (129, 178). The
competence pathway in S. mutans has some similarity to the competence pathway in
S. pneumonia, but the comCDE genes in S. mutans appear to have evolved from a
different ancestral gene and appear to be more closely related to genes in S.
pneumoniae and related organisms that control the production of bacteriocins (144). In
36
fact, the ComCDE system has been shown to regulate the bacteriocins (which are
described in more detail below) (110). Additionally, there are no ComE binding sites in
the promoter region of comX, and studies thus far indicate there is no direct binding of
ComE to the comX promoter (95), so the precise mechanism of the ComDE-dependent
regulation of comX and competence is enigmatic. The active form of CSP is considered
a 21-mer (128, 130). However, a processed 18-aa peptide form that has 3 amino acids
cleaved is more active in inducing competence (177). Recently, it has been shown that
a membrane-associated protease SepM is responsible for the final processing of the
21-mer to the 18-mer form (93).
There are also other signals and factors that influence competence development
and DNA uptake in S. mutans, many of which are unknown (Figure 1-1). In
Streptococcus thermophilus, a ComR/S system, which consists of an Rgg-type
regulator and autoregulatory peptide ComS, was shown to be the main regulator of
comX (66). Morrison et al. identified a similar ComR/S system in S. mutans and
Streptococcus pyogenes (149), and it has been shown that ComRS acts as the
proximal regulator of comX in these streptococci. The ComR regulator is required to
activate comX and induce competence through an autoregulatory signal, comX inducing
peptide (XIP), which is processed from the ComS protein. The comS gene is located
immediately downstream of comR. ComS is a 17-aa precursor that is exported through
unknown exporters, but is processed extracellularly to the heptamer XIP. XIP is
imported through the OPP permease and complexes with ComR to regulate comX and
activate competence. ComR activated by XIP can regulate comS, to induce an
autoregulatory feedback loop. The Morrison group showed that the promoter activity of
37
comX required both XIP and comR (149). They could not detect comX promoter activity
in strains that had comS or comR mutated. Khan et al. were able to identify the
heptamer XIP in late exponential phase culture supernates of S. mutans that were
grown in defined media further demonstrating that the processed heptamer is generated
(105). There is a comX consensus sequence present in the promoter regions of both
comR and comX, suggesting that there is direct interaction of ComR with the promoter
region of comX. A recent publication shows that ComR is able to bind to the promoter
of comS and comX in the presence of XIP and other peptides in S. thermophilus (67). A
potential ComR binding site was also identified in the promoter region of comX and
comS in S. mutans. Of note, the mutans group is the only Streptococcus group to have
both the ComCDE and ComRS system. The other competent streptococci either have
the ComCDE system or the ComRS system exclusively (86). In fact, the two systems
are activated in different conditions in S. mutans. The ComCDE and CSP pathway is
able to activate comX and competence in rich medium, whereas the ComRS pathway
and XIP are active in chemically defined media (55, 207). This further demonstrates that
the competence pathway in S. mutans is regulated by diverse signals and
environmental conditions.
Other pathways that control competence in S. mutans include the serine protease
HtrA, which has a negative effect on competence, but these effects can be suppressed
by the addition of CSP to cultures (6). In S. pneumoniae the negative effects of HtrA on
competence could be attenuated when there is an increased frequency of translational
errors and misfolded proteins (213). It was hypothesized that the structure of CSP
resembled misfolded proteins and thus becomes a target for HtrA (63), causing a

38
negative effect on competence. The addition of excess CSP was able to overcome the
negative effects of HtrA degradation. Ahn et al. also showed that the development of
competence and the genes in the competence pathway are influenced by the CiaRH
two component system and may be regulating competence through unknown
mechanisms (8). Deletions in ciaRH caused loss of transformability and affected the
expression of some of the genes in the competence pathway. The late competence
genes in S. mutans, such as comYA are also under the influence of the IrvR and IrvA
transcriptional regulators, which act independently of comX and are dependent on the
cell density of the population. IrvR is a transcriptional regulator that represses the
expression of irvA, which encodes another transcriptional regulator that directly
represses the late competence genes (167). So the IrvA and IrvR regulators serve as
another mechanism of control of competence in S. mutans. Other factors, including the
VicRK TCS, HdrMR, also influence transformation efficiency and com gene expression
in ways that have not been completely elucidated (200).
Bacteriocins and Immunity Proteins
Bacteriocins are ribosomally-produced antimicrobial peptides produced by some
bacteria, to compete against bacteria of similar species for common resources (48).
Unlike other antibiotics, such as penicillin and tetracycline, bacteriocins have a relatively
narrow spectrum. Most bacteriocins are very potent and can exhibit antibacterial
activity at nM concentrations. In Gram-positive bacteria, bacteriocins are pore-forming
and are generally classified into two classes, lantibiotics (class I) and non-lantibiotics
(class II) (49). The lantibiotic group usually interacts with lipid II and inhibits cell wall
synthesis, whereas the non-lantibiotic group disrupts membrane potential and causes
essential molecules to escape (166). Lantibiotics contain post-translationally modified

39
residues and are characterized by dehydrated amino acids and intramolecular thioether
bonds that create lanthionine and methyllanthionine residues within the bacteriocin
molecule. Lantibiotics are very stable and highly resistant to inactivation under a wide
range of environmental stresses (166). The lantibiotics may be further classified based
on their tertiary structures such as Type A, which are linear or Type B which are
globular. The type A lantibiotics kill susceptible cells primarily through membrane pore
formation. Non-lantibiotics consist of non-modified residues except the presence of
disulfide bridges. The non-lantibiotics group is further divided; the Class IIa, IIb, IIc and
IId bacteriocins. The Class IIa bacteriocins contain an N-terminus consensus sequence
(YGNGVxCxxxxCxVxWxxA). Class IIb consists of bacteriocins whose activity is
dependent on the action of two different peptides. Class IIc bacteriocins are cyclic
bacteriocins with a ring structure formed in a head-to-tail manner. The Class IId
bacteriocins consist of linear non-pediocin-like one-peptide bacteriocins (49).
Bacteriocins produced by S. mutans are usually referred to as mutacins (79) and
may help it compete against other oral streptococci in early dental plaque and maintain
colonization of the tooth surface (155). The mutacins are from both the lantibiotic and
non-lantibiotic group, but are primarily from the non-lantibiotic group (11, 103). The
lantibiotic mutacins have a wide spectrum against Gram-positive bacteria, and the non-
lantibiotic group is primarily active against closely related species. The lantibiotic group
of mutacins can be divided into mutacin I, II and II (89, 186), whereas the non-lantibiotic
group are mutacins IV, V, VI and N (19, 78, 185, 237) and are present in every S.
mutans strain analyzed thus far (155). One of the main identifying features is the
presence of a conserved peptide leader region with a glycine-glycine motif. The non-

40
lantibiotic group is primarily controlled in a quorum sensing like manner and is regulated
by the ComCDE pathway, whereas the lantibiotic mutacins are probably regulated by
the ScnRK-like sensory system. The non-lantibiotic bacteriocins and the regulation of
competence have considerable overlap. Dufour et al. hypothesized that the non-
lantibiotic bacteriocin CipB functions as a regulator for the transcription of genes in the
competence pathway, and a cipB mutant was poorly transformable (57). In addition,
some of the mutacins were shown to be activated by CSP, which included the gene
encoding CipB (110, 175, 225). Cvitkovitch et al. show that purified ComE protein is
able to interact with the promoter of a number of bacteriocins which include nlmAB and
nlmD (95).
There are other proteins, such as HdRM and BrsRM, which are referred to as
LytTR regulatory systems that regulate mutacin production independently of ComCDE
(168). The LytTR systems consist of a membrane-bound protein inhibitor that
antagonizes the activity of an associated LytTR family transcriptional regulator (R). The
mutacins are influenced by environmental cues such as nutrient availability and oxygen.
Transcriptional analysis shows that the bacteriocins are the most upregulated genes in
response to aeration (7).
To prevent the bacteria from killing themselves with their own bacteriocins, the
organism has genes encoding bacteriocin immunity proteins (BIPS), often found in the
same operon or downstream of the bacteriocin-encoding gene. In general, BIPS act
specifically towards their cognate bacteriocin (166). The mechanisms for conferring
immunity are not clear, and there appears to be a variety of ways in which immunity
proteins can act. For class II bacteriocins, transporter proteins that can extrude the

41
bacteriocins seem to also be involved in conferring immunity. For example immunity to
nisin is conferred through the sequestering of the bacteriocins and expulsion through
ABC exporters (189, 211). Some BIPS bind to the bacteriocin-receptor complex to
block pore formation by the bacteriocins (169). In S. mutans, the BIPS affect
antimicrobial sensitivity (150). There is also the induction of the gene encoding an
immunity protein, CipI, in response to high levels of CSP, to protect the cells against
CipB, which is also induced in response to high levels of CSP (175).
Nutrient Limitation and (p)ppGpp Production
During periods of amino acid starvation, there is an induction of the stringent
response, which involves the accumulation of the nutritional alarmones, guanosine 3’-
diphosphate, 5’-triphosphate (pppGpp or GP5), and guanosine 3’,5’-bispyrophosphate
(ppGpp or GP4) collectively known as (p)ppGpp (40). (P)ppGpp is synthesized by
enzymatic phosphorylation of GDP or GTP from ATP [(197) (Figure1-2]. The induction
of (p)ppGpp synthesis is important in regulating the physiology and metabolism of
bacteria that are sensitive to constantly changing environments (183). In the absence
of this functional stringent response there is an increase in translational errors and the
limited energy resources are rapidly depleted. The accumulation of (p)ppGpp alters the
expression of a large number of genes in bacteria by downregulating genes for
macromolecular biosynthesis while upregulating genes for protein degradation, amino
acid biosynthesis and stress tolerance (22, 23, 190, 218, 223). Therefore, the
accumulation of (p)ppGpp is important in maintaining genomic stability by inhibiting
DNA replication and serves as a mechanism to limit excessive protein synthesis during
nutrient limitations until favorable conditions are restored (218). In Escherichia coli,
(p)ppGpp helps maintain genomic integrity by resolving conflicts between replication
42
and transcription, by stalling RNAP in concert with DksA (108) and by inhibiting
primase, which is essential for the DNA replication machinery (226). The induction of
(p)ppGpp also inhibits translation by repressing transcription of tRNA, rRNA and
ribosomal proteins.
The accumulation of (p)ppGpp causes a reduction in GTP levels and an increase
in ATP levels. The reduction in GTP levels occurs through the inhibition of IMP
dehydrogenase by (p)ppGpp, which is the first enzyme in GTP biosynthesis. This leads
to an increase in IMP, a precursor for ATP synthesis, resulting in elevated levels of
ATP. GTP and ATP are well known gauges for the energy capacity of the cell, and one
group demonstrated in B. subtilis that the position of either an adenine (A) or guanine
(G) at the transcriptional start site determined the regulation of a gene by (p)ppGpp
accumulation (222). Since the levels of ATP are increased during a (p)ppGpp-induced
stringent response, the genes where transcription started with an A were positively
regulated by (p)ppGpp levels, whereas those that started with G were negatively
regulated by (p)ppGpp pools. Interestingly, some of these genes involved in positive
regulation by (p)ppGpp accumulation and started with A were those involved in
branched-chain amino acid synthesis, whereas genes involved in energy metabolism
were under negative regulation by (p)ppGpp levels (222).
CodY is a GTP-sensing global nutritional repressor that is highly conserved in
Firmicutes. In B. subtilis, CodY regulates branched- chain amino acid operon
expression, and there have been reports that show a connection between CodY and
(p)ppGpp levels (96). The reduction of GTP levels during a stringent response is
sensed by CodY, and causes its deactivation leading to derepression of genes such as

43
the BCAA operon (96). However, in S. mutans inactivation of the (p)ppGpp synthetase
enzymes did not alleviate CodY repression (124).
Enzymatic Control of (p)ppGpp Metabolism
In Gram-negative bacteria, there are two enzymes responsible for controlling
(p)ppGpp production: a synthetase enzyme called RelA and a hydrolase enzyme called
SpoT, with weak synthetase activity (70, 183) (Figure 1-2). RelA synthetase enzyme
activity is induced by the binding of uncharged tRNAs to the ribosomal A-site during
amino acid starvation (83, 147). The cell is able to sense the inability of tRNA
aminoacylation to keep up with protein synthesis as is seen in amino acid starvation or
inhibitors of aminoacyl tRNA synthases. SpoT appears to be responsible for basal
(p)ppGpp production and (p)ppGpp degradation, but is responsible for (p)ppGpp
synthesis in response to other stresses such as fatty acid starvation or carbon source
starvation(201). Bacteria need to balance the levels of (p)ppGpp to regulate growth; an
overproduction of (p)ppGpp inhibits growth by inducing a stringent response while too
little production (p)ppGpp impairs the ability of the cells to respond effectively to
nutritional stresses. Both the N-terminal and C-terminal domains of Rel/SpoT enzymes
(RSH) enzymes are responsible for regulation of enzyme activity, particularly, the C-
terminal domain, which is involved in oligomerization and regulation of the RelA protein
(75). The catalytic sites of monofunctional RelA enzymes have a conserved acidic triad
of residues ExDD (183, 194).
In most Gram-positive bacteria there is a single bi-functional RelA enzyme which
has both (p)ppGpp synthetase and (p)ppGpp hydrolase activity (158, 195). The RelA
enzyme is regulated by conformational switching between synthetase on/hydrolase off
and synthetase off/hydrolase on states (91). Unlike the monofunctional RelA enzyme

44
found in Gram-negative bacteria, the bifunctional RelA enzyme found in Gram-positive
bacteria has a conserved basic RxKD triad in its synthase catalytic site. The N-terminal
domain of the bifunctional RelA protein has both synthase and hydrolase activity (98).
The C-terminal domain plays a role in regulation through interaction with the N-terminal
domain so that only one activity remains on while the other is switched off, and
deletions in the C-terminus resulted in higher synthase activity (153). It appears that the
function of RelA is not dependent on ribosomes and uncharged tRNAs like the Gram-
negative RelA enzyme, but the presence of uncharged tRNAs upregulates the activity of
the enzyme (16, 152). Recently it has been shown that S. mutans has two additional
(p)ppGpp enzymes, RelP and RelQ, which have synthetase domains but no hydrolase
domains (122) (Figure 1-3). Subsequently homologues of RelQ and RelP were found in
B. subtilis (163) and identified in other streptococci and other Gram-positive bacteria
(122). In Enterococcus faecalis, the RelQ homologue appears to be linked to
vancoymycin resistance, where the relQ mutant was more sensitive to vancomycin than
the parental strain(1, 106). In S. mutans, the relQ operon is cotranscribed with other
genes, ppnK, pta and rluE, whose products are involved in acetate metabolism in the
TCA cycle. The ppnK gene encodes an NAD kinase, rluE encodes a psuedouridine
synthetase and pta encodes a phosphotransacetylase. Deletions of the various genes
in the relQ operon caused the cells to grow slower than the parental strain in oxidative
and acid stresses. The accumulation of (p)ppGpp was also decreased in the pta mutant,
whereas higher levels of (p)ppGpp accumulation were seen in the ΔrelQ mutant (106).
RelP appears to be responsible for the bulk of the (p)ppGpp production under
non-stringent conditions, whereas RelA is required for a mupirocin-induced stringent
45
response (123). Of note, relP is part of an operon encoding a TCS, called relRS, and a
mutant lacking the relRS genes grows faster than the wild-type strain (122). The
accumulation of (p)ppGpp by RelPRS plays a significant role in growth control of S.
mutans and is regulated by different environmental signals than RelA. It appears that S.
mutans has a different mechanism of regulating (p)ppGpp production from other
bacteria by combining intracellular and extracellular signals through a TCS and multiple
synthetases. In order for S. mutans to survive and thrive in the hostile and variable
conditions of the oral cavity, one hypothesis suggests that (p)ppGpp modulation through
RelPRS is a mechanism for S. mutans to sense environmental signals to limit growth
and balance the production of storage compounds. However, much is still unknown
about how these two novel synthetases are regulating (p)ppGpp production in S.
mutans.
Summary
Comparisons of the transcriptional profiles of S. mutans growing with aeration
versus anaerobically revealed that many genes are regulated by oxygen or redox
potential, including bacteriocin-encoding genes, comX and relP (7) and the SMu0835-
SMu0839 gene cluster (Oralgen database http://www.oralgen.lanl.gov) (SMU.921-
SMU.925 GeneBank Locus tag) located immediately upstream of relP. In addition, our
lab reported that the uncharacterized SMu0835-837 genes were up-regulated in
response to mupirocin treatment in a (p)ppGpp-dependent manner (164), identifying a
possible connection of this gene cluster to (p)ppGpp and stress tolerance.
Given the importance of (p)ppGpp metabolism, competence and stress pathways
in the regulation of critical homeostatic and virulence pathways in S. mutans and the
potential regulatory overlap of relP and SMu0835-0839, we investigated the role of the

46
SMu0835-0837 gene cluster in growth, (p)ppGpp metabolism, stress tolerance and
genetic competence (199).
Specific Aims
Assess the role of the SMu0835-0839 gene cluster in growth, biofilm formation and stress tolerance.
Identify the basis for regulation of relPRS and the effects of SMu0835-0837 on relPRS and (p)ppGpp levels.
Determine the role of the SMu0835-0837 on the competence regulon
Some of the work presented here has already been published by the author of the
dissertation, Kinda Seaton, in the Journal of Bacteriology.

47
A)
B)
Figure 1-1. Comparison of the competence pathways between Streptococcus
pneumoniae and Streptococcus mutans. A) Competence pathway in Streptococcus pyogenes. B) Competence pathway in Streptococccus mutans.

48
Figure 1-2. Schematic showing the regulation of (p)ppGpp by RelA and SpoT in Gram-
negative bacteria. RelA can synthesize the production of (p)ppGpp from GDP or GDP and ATP. SpoT can hydrolyze (p)ppGpp to GDP or GTP.

49
Figure 1-3. Schematic of the genes encoding the three (p)ppGpp enzymes in S. mutans

50
CHAPTER 2 MATERIALS AND METHODS
Growth Conditions
Escherichia coli strains were grown in Luria broth supplemented with
chloramphenicol (20 μg ml-1) or ampicillin (100 µg ml-1), when necessary. E. coli strains
were grown at 37°C with continuous shaking at 250 rpm. S. mutans UA159 and its
derivatives were maintained in brain heart infusion (BHI) medium (Difco Laboratories,
Detroit, MI) supplemented with kanamycin (1 mg ml-1), spectinomycin (1 mg ml-1) or
erythromycin (2 μg ml-1) when necessary at 37°C in a 5% CO2 atmosphere.
For biofilm assays, a semi-defined biofilm medium (BM) (135) supplemented with 10
mM sucrose or 20 mM glucose was used.
For (p)ppGpp accumulation assays, a chemically defined medium, FMC (221),
supplemented with 0.3% glucose was used.
Growth Assays
For growth studies, cultures were grown overnight in BHI broth at 37ºC in a 5%
CO2 atmosphere with antibiotics when appropriate, then diluted 1:50 into fresh BHI
broth and grown to mid-exponential phase (OD600 = 0.5). The cultures were then diluted
1:100 in 350 μl of BHI broth in multi-well plates, overlaid with sterile mineral oil and
placed in a Bioscreen C growth monitor (OY Growth Curves AB Ltd., Helsinki, Finland)
at 37ºC. The optical density (OD600) was measured every 30 min for 24 hours with
shaking for 10 s before each reading.
Low pH. To assess the ability of the mutants to grow at low pH, cells were grown
overnight in BHI broth with appropriate antibiotics when necessary for mutants, diluted
1:50 into fresh BHI and grown to mid-exponential phase at 37ºC in a 5% CO2

51
atmosphere. The cells were then diluted 1:100 in BHI broth that was acidified to pH 5.5
with HCl, 350 µl of each sample was added to multi-well plates, with a sterile mineral oil
overlay and growth was monitored in a Bioscreen C.
Oxidative stress. When effects of air on growth were assessed, no mineral oil
overlay was utilized. For analysis of oxidative stress tolerance, the cells were grown to
OD600 = 0.5 in BHI broth at 37ºC in a 5% CO2 atmosphere. The cultures were then
diluted 1:100 in BHI broth containing 25 mM paraquat (methyl viologen; Sigma-Aldrich,
St. Louis, MO) or 0.003% hydrogen peroxide, each well was overlaid with sterile mineral
oil and growth was monitored in a Bioscreen C.
Growth in CSP. To analyze growth in CSP, the procedure described above was
used. When the cells reached OD600 = 0.5 in BHI broth, the cultures were diluted 1:100
in BHI broth containing 2 μM synthetic CSP (174) (97% purity), overlaid with sterile
mineral oil and growth monitored in the Bioscreen C.
Biofilm Assays
S. mutans strains were grown to mid-exponential phase in BHI broth at 37ºC in a
5% CO2 atmosphere. The cells were diluted 1:100 in BM supplemented with either 20
mM glucose or 10 mM sucrose and 200 μl transferred to polystyrene microtiter plates.
The cells were incubated in a 5% CO2 atmosphere at 37ºC for 24 or 48 h. The medium
was decanted, and the plates were washed twice with 200 μl of sterile water to remove
planktonic and loosely-bound cells. The adherent bacteria were stained with 60 μl of
0.1% crystal violet for 15 min. After rinsing twice with 200 μl of water, the bound dye
was extracted from the stained biofilm using 200 μl of ethanol:acetone (8:2) solution,
twice. The extracted dye was diluted into 1.6 ml of ethanol:acetone solution. Biofilm
formation was quantified by measuring the absorbance of the solution at OD 575 nm.

52
DNA Manipulation and Construction of Mutants.
Plasmid DNA was isolated from E. coli using the QIAprep Spin Plasmid Kit
(Qiagen Inc., Valencia, CA). Cloning was carried out using established protocols (196) .
Restriction and DNA modifying enzymes were purchased from Life Technologies Inc.
(Rockville, MD) or New England Biolab (Beverley, MA).
PCR Ligation: Insertion Mutagenesis
A series of mutant strains (Table 2-1) was derived from S. mutans UA159 using
PCR ligation mutagenesis procedures with the insertion of either a polar (ΩKm) or non-
polar (NPKm) kanamycin resistance cassette to replace the genes (8). Primers were
used to amplify the regions flanking the genes of interest (Table 2-3). The PCR products
and pALH123 or omega Km (Table 2-2) when desired, were digested with BamHI and
ligated. The ligated mixture was transformed into competent S. mutans (Figure 2-1).
Transformants were selected on BHI agar with 1 mg ml-1 kanamycin. Screening for
mutants was done via PCR using A and D primers (Table 2-3) to observe for the correct
size on 0.8% agarose gels. Colonies that had the correct size were restreaked on fresh
BHI agar plates with 1 mg ml-1 kanamycin. DNA sequencing using primers outside the
region of cloning (Table 2-3) was done to ensure that the correct mutation had been
introduced and that no secondary mutations were created in the genes immediately
upstream or downstream of the insertion site during recombination.
Splice Overlap Extension Mutagenesis
A series of mutant strains (Table 2-1) was derived from S. mutans UA159 using
splice overlap extension (SOE) to make point mutations in different regions (90).
Briefly, primers with the desired base changes (Table 2-3) and primers that matched a
sequence located 0.5 kbp upstream and downstream of the sequence of interest were

53
used to amplify DNA and generate two PCR products (Figure 2-2). Selected pairs of
PCR products with 20-bp identity that included the desired mutations were subjected to
PCR for 5 cycles in the absence of added primers. A second PCR of 30 cycles using
the A and D outer primers (Table 2-3, Figure 2-2) was performed to generate a 1-kbp
product that had the desired mutations. The final PCR product was run on an agarose
gel to ensure correct size then the fragment was excised, gel purified (Qiagen) and
transformed into competent S. mutans with a suicide plasmid harboring an internal
fragment of the lacG gene and an erythromycin (Em) resistance (Emr) determinant
(242). Transformants were selected on BHI agar with erythromycin. Mismatch
Amplification Mutation Assay (MAMA) PCR was done to screen for isolates that have
the desired mutations (41). The MAMA PCR reaction included 20 nM of a primer that
has a mismatch in the 3’ end that can only amplify wild-type DNA, along with10 nM of
the A primer and 30 nM D primer (Table 2-2). If the desired mutation is present, then a
longer product (~ 1kb) will be made, but if the wild-type is present, a shorter PCR
product (~0.5kb) is made (Figure 2-3). PCR products were run on an agarose gel, and
isolates that had the correct size were restreaked. DNA sequencing was used to
ensure that the correct mutation had been introduced and that no mutations were
created in the genes immediately upstream or downstream of the insertion site during
recombination.
Complementation
To complement some of the mutations made in the rcrRPQ operon, the genes that
were mutated were amplified from a wild-type strain. The amplified DNA was cloned
into the pDL278 vector and introduced into the mutant strains. A PCR amplification
which included approximately 200 bp 5’ of the ATG start codon and 50-bp 3’ of the stop

54
codon of the gene was generated from the wild-type strain (Table 2-3). The regions 5’
of the ATG start codon were included to ensure all the regulatory elements including the
promoter and transcription initiation site were present. The PCR product and the
pDL278 plasmid were digested with BamHI and SacI. The digested PCR product and
plasmid were gel purified with a Qiagen DNA purification kit, ligated and transformed
into appropriate S. mutans strains. Transformants were selected on BHI plates
containing 1 mg ml-1 of spectinomycin. The isolates were screened using primers
specific to pDL278 and run on an agarose gel to check for the correct size and
presence of the insert. Colonies with the correct size were sequenced to ensure that
complementation of the gene(s) was correct. For strains that had severely impaired
transformation efficiency, the complementation and mutagenesis of the genes were
done concurrently and plated with 1mg ml-1 kanamycin to select for the presence of the
kanamycin resistance cassette and 1mg ml-1 spectinomycin to select for the
complementation on the plasmid. DNA sequencing was done to verify the integrity of
the strains.
Construction of Promoter Fusions
For construction of the CAT strains, various DNA regions containing 350 bp and
150 bp upstream of the ATG start site, which included the promoter regions of the
SMu0835 and relP genes, were amplified via PCR. The PCR products along with the
pJL105 plasmid were digested with SacI and BamHI and purified using a Qiagen Gel
purification kit. The digested PCR products were ligated with the digested pJL105
integration vector, which has a staphylococcal chloramphenicol acetyltransferase gene
(cat) gene that lacks a promoter and ribosome binding site (RBS) (243). The pJL105
vector has sequence homology to the mtlA and phnA genes, which facilitates double

55
cross-over recombination and integration of the inserted DNA in single copy in the S.
mutans chromosome. The cat-promoter fusions were transformed into wild-type and
mutant strains of S. mutans and plated on BHI agar plates containing 1 mg ml-1
spectinomycin. The integrity of the strains was verified by PCR and DNA sequencing.
For construction of the LacZ strains, a similar technique was used as described
above for constructing the CAT strains. However, the promoter regions were cloned
into the pMZ integration vector which carries a staphylococcal beta-galactosidase gene
(lacZ) gene that lacks a promoter and ribosome binding site (RBS) (243). The vector
also has homology to the mtlA and phnA genes which also facilitates double cross-over
recombination and integration of inserted DNA (133). The lacZ promoter fusions were
transformed into S. mutans and plated on BHI plates containing 1 mg ml-1 kanamycin.
The integrity of the strains was verified using PCR and DNA sequencing.
Transformation Assays.
Overnight cultures were diluted 1:20 in 200 µl of BHI broth in polystyrene microtiter
plates. The cells were grown to OD600 = 0.15 in a 5% CO2 atmosphere. When desired,
100 nM of synthetic competence stimulating peptide (CSP) (8), was added, cells were
incubated for 10 min and 0.5 µg of purified plasmid pDL278, which harbors a
spectinomycin resistance (Spr) gene, was added to the culture. After 2.5 h incubation
at 37°C, transformants and total CFU were enumerated by plating appropriate dilutions
on BHI agar plates with or without the addition of 1 mg ml-1 spectinomycin, respectively.
CFU were counted after 48 h of incubation, and transformation efficiency was
expressed as the percentage of transformants among the total viable cells. In some
cases, these experiments were repeated with pMSP3535 (Emr) and JL105 (Spr) to
56
assess the ability to uptake various types of plasmid DNA and to analyze homologous
versus non-homologous recombination.
Measurement of (p)ppGpp Accumulation
The measurement of accumulation of (p)ppGpp in S. mutans was done as
described elsewhere (122). Briefly, cells from an overnight culture were diluted 1:25
into the chemically-defined medium FMC to OD600= 0.2. Cells were labeled with 32P-
orthophosphate for 1 hour at 37ºC, harvested, and (p)ppGpp was extracted with formic
acid (122). If desired, 0.003% hydrogen peroxide was added to the samples at the
same time as the label. To harvest the labeled cells, the samples were centrifuged at
1400 xg for 2 min and the supernates decanted. The cell pellets were then washed with
500 μl of FMC to remove any excess 32P-orthophosphate. To extract the (p)ppGpp, the
cells pellets were resuspended in equal volumes of 13 M formic acid and FMC (~20 μl
each), followed by a series of 3 free thaw cycles on a dry ice/ethanol and thaw 42°C
bath, and the cells centrifuged at 1000 xg. Following the extraction, the CPM/μl of the
supernatant fraction was measured in a scintillation counter, and 2.0 x 10⁵ CPM of each
sample was spotted onto polyethyleneimine (PEI) cellulose plate (Selecto Scientific,
Suwanee, GA) for thin-layer chromatography (TLC). Solutes were resolved using 1.5 M
KH2PO4 buffer that had been acidified to pH 3.4 with phosphoric acid. Labeled
compounds were detected by exposing the PEI plate with a maximum sensitivity film
(Kodak, Rochester, NY) overnight at -80°C (122). The accumulation of GP4 and GP5
was quantified using the AlphaEase FC Fluorochem 8900 (Alpha Innotech, USA)
Imaging System Spot Denso Analysis tool. The density of the spots was quantified as
integrated density value per area (IDV).

57
RNA Manipulation
RNA Extraction.
Three colonies from each strain were grown overnight in BHI broth, diluted 1:50 in
fresh BHI, grown to OD600 = 0.5, harvested and immediately treated with RNAprotect ®
reagent from Qiagen (Qiagen Inc., Valencia, CA). Total RNA was extracted using
phenol (pH 4.3) (1), DNaseI treated and further purified with the RNeasy mini kit
(Qiagen Inc., Valencia, CA). RNA concentration was measured in triplicate using a
spectrophotometer and run on a gel to assess integrity.
qRT-PCR
Real time PCR was done as detailed by Ahn et al. (6). Purified RNA (1 μg) was
used to generate cDNA from gene specific primers according to the Superscript III first-
strand synthesis (Invitrogen, Gaithersburg, MD) reverse transcription protocol. The
gene specific primers were designed with Beacon Designer 4.0 software and standard
curves for each gene were prepared (Table 2-4). The standard curve was generated
using eight 10-fold serial dilutions of the PCR products to determine the starting amount
for each cDNA template, based on its threshold cycle. The concentrations of purified
PCR products were measured at OD260, and the copies/ml for standard curves were
calculated according to the formula: copies/ml = (6.023 x 10²³ x C x OD260) / MWt,
where C = 5 x 10⁻⁵ g/ml for DNA and MWt = the molecular weight of the PCR product
(base pairs x 6.56 x 10² g). The standards were prepared in the concentrations of 108
copies/µl. Triplicates of each cDNA sample along with cDNA controls for each of the
triplicate isolates analyzed were subjected to Real-time PCR. Real-Time PCR reactions
were carried out using an iCycler iQ real-time PCR detection system (Bio-Rad,
Hercules, CA) and iQSYBR green supermix (Bio-Rad) according to the protocol

58
provided by the supplier. The thermocycling program was set for 40 cycles of 95°C for
10 s and 60°C for 45 s, with an initial cycle at 95°c for 30 s. The accumulation of PCR
products was detected after each cycle by monitoring the increase in fluorescence of
the reporter dye from dsDNA binding SYBR green. Data were collected and analyzed
using the software and graphics provided by iCycler iQ.
Semi-quantitative-Reverse Transcriptase PCR
Reverse Transcriptase PCR (RT-PCR) was done using gene specific real-time
primers (Table 2-4) on 1 μg of RNA that was purified as described above. A PCR
reaction of 25 cycles was performed on the cDNAs generated using various
combinations of primers (Table 2-4) to analyze the different transcripts made in the
SMu0835-0839 gene cluster. A positive control using wild-type chromosomal DNA and
the same primer sets was also used. The PCR reactions were run on a 0.8% agarose
gel to analyze size and quantity.
RNA Sequencing
The RNA-sequencing protocol and analysis described below was published by Lin
Zeng et al. (“Gene regulation by CcpA and Catabolite Repression Explored by RNA-seq
in Streptococcus mutans”, In Press)
Total RNA was isolated and purified from the various strains as described above
(Qiagen). To remove 16S and 23S rRNAs, 10 µg of high-quality total RNA was
processed using the MICROBExpressTM Bacterial mRNA Enrichment Kit (Ambion of Life
Technologies, Grand Island, NY), twice, before precipitating with ethanol and
resuspending in 25 µl of nuclease-free water. The final quality of enriched mRNA
samples was analyzed using an Agilent Bioanalyzer (Agilent Technologies, Santa Clara,
CA). cDNA libraries were generated from the enriched mRNA samples using the

59
TruSeq Illumina kit (Illumina, San Diego, CA), following instructions from the supplier.
Deep sequencing was performed at the Cornell University Life Sciences Core
Laboratories Center (Ithaca, NY).
Short-Read Alignments
Approximately 20 million short-reads were obtained for each sample. Because the
aligner BWA (125) allowed a few gaps for efficient alignment of millions of reads of
approximately 100 bp, shorter reads consisting mostly of sequencing adapters would
not be mapped. After removing adapter sequences from each short-read (146) and
trimming of the 3’-ends by quality scores (198), the resulting sequences were mapped
onto the reference genome of strain UA159 (GenBank accession no. AE014133) using
the short-read aligner. Mapped short-read alignments were then converted into
readable formats using SAMTOOLS (126).
Transcript Predictions
RNA transcripts were inferred by applying a hidden Markov model to site-wise
expression levels (145). A pileup command of BWA was used to convert the short-read
alignments into pileup values, which were taken as the site-wise expression levels along
the genome. Site-wise expression levels are a list of non-negative integers that
represent numbers of short-reads mapped to a particular genomic position. For the
transcript inference program, ParseRNAseq, the following options were used: “-c 10 -b
25 -force gp”, which binned expression levels into 25 parts and allowed 10 emission
states for relative expression intensity. Genes that were annotated in close proximity
were used as the predicted parts of a transcript, while no information regarding the
precise transcription initiation- or stop-sites were pursued in this study. For similar
reasons, the orientation of each transcript could not be verified solely based on RNA-

60
seq data; instead we used the information of annotated genes to determine the
strandedness of predicted transcripts.
Prediction of Small RNAs and Targets
Although our RNA-seq protocol did not specifically enrich non-coding small RNAs
in the cDNA preparation, small RNAs were retained in the RNA samples as only
ribosomal RNAs were depleted using specific oligonucleotides. Consequently, it was
difficult to discriminate cDNA originated from small non-coding RNAs from that of
mRNAs, as expression of non-coding RNA is often masked by the expression of
neighboring background mRNAs. Therefore, we utilized RNAz (76), a program that uses
homologous sequences and RNA secondary structures to predict putative non-coding
small RNAs. Because sequence alignment was a critical step for finding small RNAs
via this approach, intergenic regions that also included up- and down-stream sequences
were extracted, BLAST-searched against a database of bacterial genomes (12), and the
resultant sequence alignments were further refined using a program named MUSCLE
(58). Subsequently, RNAz was applied to the alignments for scoring intergenic regions
for putative small RNAs (76, 227). Target genes for each candidate small RNA were
predicted using RNAplex (219) and RNAplfold (28), and the resultant genes were then
used to perform functional category enrichment tests based on their scores by these
two programs. In addition, we employed a method of Rho-independent terminator (RIT)
identification to help identify candidate small RNAs (107), which were subsequently
scored using RNAz, and a transcriptional signal-based method to identify intergenic
sRNA transcription units (TUs) (209).

61
Statistical Analysis for Differential Expression
The R package DESeq (13) was used to determine differential gene expression on
the basis of the negative binomial model (193). Detailed steps for analyzing RNA-seq
data for differentially expressed genes were utilized as described elsewhere (170).
Briefly, short-reads aligned to a particular annotated gene in the reference genome
were counted, generating a table of read counts of all the open-reading frames.
Statistical software R of the R package DEseq (220) was then employed to infer
differentially expressed genes in various biological conditions. To normalize expression
levels among different samples, total sequencing depths for each sample were
estimated as the median of the ratios of the sample’s counts to geometric mean across
all samples, as detailed elsewhere (13, 192).
Microarray Experiments.
S. mutans UA159 microarrays were provided by The Institute for Genomic
Research (TIGR). The microarrays consisted of 1,948 70-mer oligonucleotides
representing 1,960 open reading frames printed four times on the surface of each
microarray slip. A reference RNA that had been isolated from 100 ml of UA159 cells
grown in BHI broth to an OD600 of 0.5 was used in every experiment. The experimental
strains consisted of S. mutans UA159, and mutant derivatives Δ835np, Δ836p, Δ835-
837np (Table 2-1) grown in BHI to OD600=0.5 in quadruplicate for each strain. All RNA
was purified as described above and used to generate cDNA by the protocol provided
by TIGR (http://pfgrc.tigr.org/protocols.shtml) with minor modifications. The 2:1 dTTP to
aminoacyl-dUTP was used. Superscript III reverse transcriptase (Invitrogen) was used
to increase cDNA yields. Purified cDNAs from experimental groups were coupled with
indocarbocyanine (Cy3)-dUTP, while reference cDNA was coupled with

62
indodicarbocyanine (Cy5)-dUTP (Amersham Biosciences, Piscataway, NJ). The
amount of in co-operated dye was measured for each sample using the
spectrophotometer. The Cy3-labeled experimental cDNA samples were mixed in equal
quantity to the Cy5-labeled reference cDNA samples and the subsequent mixture
hybridized to the microarray slides. Hybridization was carried out with a Maui four-
chamber hybridization system (BioMicro Systems, Salt Lake City, UT) for 16 h at 42°C.
The slides were then washed by using TIGR protocols and scanned using a GenePix
scanner (Axon Instruments Inc, Union City, CA).
S. mutans Microarray Data Analysis.
After the slides were scanned, single-channel images were loaded into TIGR
Spotfinder software (http://www.tigr.org/software/) and overlaid. A spot grid was created
according to TIGR specifications and manually adjusted to fit all spots within the grid,
and then the intensity values of each spot were determined. Data were normalized
using Microarray Data Analysis Software (MIDAS) (http://www.tigr.org/software/) by
used LOWESS and iterative log mean centering with default settings, followed by in-
slide replicate analysis. Statistical analysis was carried out using BRB Array Tools
(http://linus.nci.nih.go/BRB-ArrayTools.html) with a cutoff P value of 0.001 for class
prediction and class comparison.
Biochemical Assays
Chloramphenicol Acetyltransferase Assay.
Strains carrying promoter-cat gene fusions were grown from overnight cultures
that were inoculated with appropriate antibiotics and diluted 1:30 in 50 ml of fresh BHI
broth in a 5% CO2 atmosphere at 37ºC to OD600 = 0.5. Cells were centrifuged, and the
pellets were resuspended in 750 μl of 10 mM Tris pH 7.8. Protein was extracted by

63
bead-beating in the presence of 500 μl glass beads (0.1mm diameter) for 20 s twice,
with a 2 min interval on ice. The cell lysates were centrifuged at 4000 x g for 10 min,
and the supernates were used for measuring CAT activity by the method of Shaw (202).
Briefly, 10-50 μl of the cell lysates were added to 950-990 μl of a prewarmed solution
containing 0.4 mg ml-1 of DTNB and 200 μl Acetyl-coA (4 mg ml-1). Chloramphenicol (5
µl from a 5 mM stock) was added to the samples immediately before reading, and the
rates were tabulated via the spectrophotometer which measures the rate of change in
OD of the samples per second over a 2 min interval. The concentration of protein was
measured using the bicinchoninic acid assay (Thermo Scientific). CAT activity was
expressed as nmoles of chloramphenicol acetylated min-1 (mg protein)-1. CAT specific
activity = (Average Rate/13.6) x (1/Sample volume) x (1/protein concentration) x 106
β-Galactosidase Assay
β-galactosidase activity was measured according to the protocol of Miller (245).
Strains carrying promoter-lacZ gene fusions were grown in 5 ml of BHI broth in a 5%
CO2 atmosphere at 37ºC to OD600 = 0.5 in triplicates. Cells (1.5 ml) were centrifuged,
and the pellets were resuspended in 1.3 ml of Buffer Z (60 mM Na2HPO4, 40 mM
NaH2PO4, 10 mM KCl, 1 mM MgSO4, with freshly added 50 mM β-mercaptoethanol).
Cells (500 µl) were permeabilized by high speed vortexing for 1 min with 25 µl of
toluene:acetone solution (1:9 v/v), and the 800 μl left over was used to measure OD600.
The permeabilized cells were transferred to a 37⁰C water bath, and 100 μl of
prewarmed ONPG (4 mg ml-1 in 0.1M Na-Phosphate buffer pH 7.5) was added to the
cells and the time recorded. After a yellow color change was observed, the reaction
was stopped with 1 M Na2CO3 solution and the time for the color change to occur
64
recorded. The cells were briefly centrifuged, and the OD550 and OD420 measured. The
specific activity was calculated as Miller units. Miller units = 2000 x (OD420 – 1.75 x
OD550) /Time (min) / OD600
To assess the promoter activity of relP in hydrogen peroxide, the wild-type strain
carrying the relP-lacZ fusion was grown in triplicates in 5 ml of BHI broth in a 5% CO2
atmosphere at 37ºC to OD600 = 0.2. Hydrogen peroxide (0.003%) was added to 2.5 ml
of each sample and the other 2.5 ml was left untreated. The cells were incubated for 1 h
in a 5% CO2 atmosphere at 37ºC before harvesting. The measurement of β-
galactosidase activity was performed as described above.
Protein Manipulation
Protein Purification
An N-terminally His6-tagged RcrR protein was obtained by amplifying the entire
rcrR structural gene from S. mutans UA159 and cloning it in-frame in pQE30 (Qiagen)
using DH10B E. coli cells. Clones were sequenced to ensure no errors had been
introduced. The cells were grown from an overnight culture to an OD600 of 0.5 with
ampicillin to ensure no loss of the plasmid. The protein was overproduced by induction
with 100 mM sterile isopropyl-β-D-thiogalactopyranoside (IPTG) for 4 hours and purified
as a soluble protein in a Ni2+ affinity column using the protocol recommended by the
supplier (Qiagen). Briefly, to obtain the purified protein, the induced E. coli cells were
harvested and resuspended in a lysis buffer containing 50 mM NaH2PO4, 300 mM NaCl,
10 mM imidazole adjusted to pH 8 with NaOH. The cells were lysed using mechanical
force with 500 μl of glass beads for 30 s twice. The cells were centrifuged at 14, 000 x
g for 10 min at 4°C. The cell lysates were incubated with 1 ml of Ni2+ -NTA resin
(Qiagen) for ~1 h at 4°C, then the slurry was loaded on to a column. The column was
65
then washed 2 times with 4X the volume of the slurry with a wash solution containing 50
mM NaH2PO4, 300 mM NaCl and 20 mM imidazole, followed by 2 washes 4X the
volume of the slurry with a solution containing 40 mM imidazole to remove nonspecific
binding. An elution buffer (450 μl) containing 500 mM imidazole was added to the
column 6 times, for a total of 6 eluate fractions. The protein concentration of the
different eluate fractions were then assessed via Bradford assay, and the fractions were
run on a 12% SDS denaturing polyacrylamide gel to check for purity and size of the
protein. The proteins were then dialyzed using a Slide-A-Lyzer 10 kDA Dialysis
Cassette (Thermo Scientific, Waltham, MA) in 2.1 L of Binding Buffer to exclude
fragments smaller than 10 kDA. The dialyzed protein was quantified via Bradford assay
and 1 μg of protein was run on a 12% denaturing polyacrylamide gel to check for
integrity of the protein.
Electrophoretic Mobility Shift Assay (EMSA)
An electrophoretic mobility shift assay (EMSA) was carried out by using a
previously published protocol (3). DNA fragments containing the promoter region of
rcrR and other genes were amplified via PCR using biotinylated primers (Table 2-5).
The PCR product was gel purified (Qiagen) and quantified using a spectrophotometer.
Five fmol of biotinylated DNA probe was used with different concentrations of purified
recombinant His6-tagged S. mutans RcrR protein in a 10 µl reaction mixture containing
10 mM HEPES (pH 7.9), 50 mM KCl, 5 mM MgCl2, 1 mM EDTA, 5 mM dithiothreitol, 2
µg poly (dI-dC) and 10% glycerol. After incubation at room temperature for 40 min, the
DNA-protein samples were resolved in a 4% [(30:1) acrylamide:bis-acrylamide] non-
denaturing, low–ionic strength polyacrylamide gel at 65 V for about 1 hour. The
samples were transferred to Genescreen plus hybridization transfer membrane

66
(Perkinelmer Life Sciences, Boston, MA) that was preincubated for 10 min in TBS buffer
using a semi-dry transfer apparatus. The signals were detected using a
chemiluminescent nucleic acid detection kit (Thermo Scientific) and an AlphaEase FC
(Fluorochem 8900) imaging system as recommended by the supplier.
Fluorescent Polarization Assay
Forward and reverse complementary oligos that were 38 bp and 55 bp, which
included the RcrR binding site were synthesized and labeled with 6-FAM (IDTDNA) at
the 5’ end (Table 2-5). The forward and reverse oligos were annealed using equal
amounts (12.5 pmoles) of oligos. The annealing was done in an annealing buffer (10
mM Tris pH 7.5, 1 mM EDTA, 50 mM NaCl) @ 95⁰C for 2 min, then gradual cooling to
room temperature over a 45 min period. Annealed fluorescently labeled probe (10
fmoles) was used with different concentrations of purified recombinant His6-tagged S.
mutans RcrR protein in a 200 µl reaction mixture containing 10 mM HEPES (pH 7.9), 50
mM KCl, 5 mM MgCl2, 1 mM EDTA, 5 mM dithiothreitol, 2 µg poly (dI-dC) and 10%
glycerol in a microtiter plate. After incubation at room temperature for 10 min, the
samples in the microtiter plate were analyzed in a Synergy 2 plate reader (Biotek,
Winooski,VT). The change in fluorescence polarization of the DNA with the addition of
increasing concentrations of RcrR protein was measured. Binding constants were then
calculated based on non linear regression analysis tools using the Gene5 program
(Biotek) and the Prism statistical software.

67
Figure 2-1. Schematic showing the process for making insertion:deletion mutants via
PCR ligation mutagenesis

68
Figure 2-2. Schematic showing the process for making point mutations via splice overlap extension PCR

69
Figure 2-3. Gel image showing size-difference in PCR products generated from the SOE mutants vs. WT using MAMA primers.

70
Table 2-1. List of strains
Strain Relevant Characteristics Source or reference
E. coli strains: DH10B General cloning strain Invitrogen S. mutans strains: UA159 Wild-type ATCC 700610 Δ835np ΔSMu0835(rcrR)::NPKmr
This study Δ835p ΔSMu0835 (rcrR)::ΩKmr
This study Δ836np ΔSMu0836(rcrP):: NPKmr This study Δ836p ΔSMu0836 (rcrP):: ΩKmr This study ∆837np ∆SMu0837 (rcrQ)::NP Kmr This study ∆837p ΔSMu0837 (rcrQ):: ΩKmr This study Δ835-837np ΔSMu0835, ΔSMu0836,
ΔSMu0837:: NPKmr, This study
Δ836-837np ΔSMu0836, ΔSMu0837:: NPKmr This study 835+/∆835np (SJ361) ∆SMu0835::NPKmr harboring
pDL278-SMu0835 This study
835+/∆835p (SJ362) ∆SMu0835::ΩKmr harboring pDL278-SMu0835
This study
835+/∆835-7np (SJ360) ∆SMu0835-7::NPKmr harboring pDL278-SMu0835
This study
835+/wt (SJ354) UA159 harboring pDL278-SMu0835
This study
Δtpx Δ tpx:: NPKmr This study ΔrelA ΔrelA:: Emr (122) ΔrelP ΔrelP:: NPKmr (122) ΔrelRS ΔrelRS:: NPKmr (122) ΔrelAPQ ΔrelA, ΔrelP, ΔrelQ ::Emr NPKmr
Tetr (122)
NBS1 GAGAACTA-TTTTCCCC This study NBS2 AGGAATCA-TTTTCCCC This study BBS TCA-CCC; CTA-CCC This study UA159::P835-cat Spr, Kmr; This study ΔrelP ::P835-cat Spr, Kmr This study UA159::PrelP-cat Spr, Kmr This study Δ836p ::PrelP-cat Spr, Kmr This study UA159 :: P835-lacZ Kmr This study UA159 ::PNBS1-lacZ Kmr This study UA159 ::PNBS2-lacZ Kmr This study ∆835p:: P835-cat Kmr This study ∆835p:: PNBS1-cat Kmr This study ∆835p:: PNBS2-cat Kmr This study
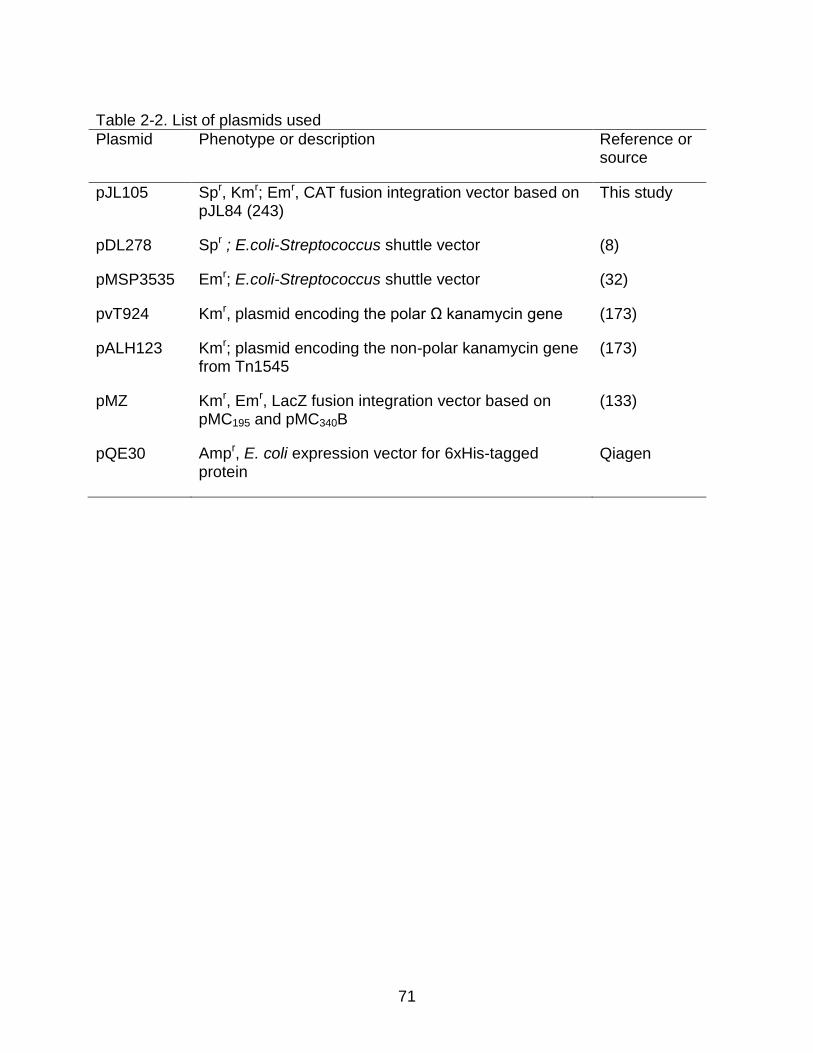
71
Table 2-2. List of plasmids used
Plasmid Phenotype or description Reference or source
pJL105 Spr, Kmr; Emr, CAT fusion integration vector based on pJL84 (243)
This study
pDL278 Spr ; E.coli-Streptococcus shuttle vector (8)
pMSP3535 Emr; E.coli-Streptococcus shuttle vector (32)
pvT924 Kmr, plasmid encoding the polar Ω kanamycin gene (173)
pALH123 Kmr; plasmid encoding the non-polar kanamycin gene from Tn1545
(173)
pMZ Kmr, Emr, LacZ fusion integration vector based on pMC195 and pMC340B
(133)
pQE30 Ampr, E. coli expression vector for 6xHis-tagged protein
Qiagen

72
Table 2-3. List of primers Primer Sequence Application
SMu0835- A 5’-GATGGCTTCTCCCAAACATCC-3’ Inactivation of SMu0835 (rcrR)
SMu0835-B- BamHI 5’-TTAAATTCAGGATCCGGCTCCTTCA-3’ Inactivation of SMu0835 (rcrR)
SMu0835-C- BamHI 5’-GGAAGGTTTGGATCCAAATCAAACA-3’ Inactivation of SMu0835 (rcrR)
SMu0835-D 5’-CACCTGACGCTGTCTTGGA-3’ Inactivation of SMu0835 (rcrR) SMu0836- A 5’-GCGCCCCTAGGTCTTACCAA-3’ Inactivation of SMu0836 (rcrP) SMu0836-B- BamHI 5’-CCCATTCTTGGATCCTTAGACGTT-3’ Inactivation of SMu0836 (rcrP) SMu0836-C- BamHI 5’-ATGACTAAGGGATCCGTAGCCCAAC-3’ Inactivation of SMu08356 (rcrP) SMu0836-D 5’-GTCGCTGCAAGAGCTCCATT-3’ Inactivation of SMu0836 (rcrP) SMu0837- A 5’-GTTCCACTGGCTCAGGAAAA-3’ Inactivation of SMu0837 (rcrQ) SMu0837-B- BamHI 5’-CATCTCTGGATCCCGGTCAG-3’ Inactivation of SMu0837 (rcrQ) SMu0837-C- BamHI 5’-TGGCTTCGGATCCGATCTCT-3’ Inactivation of SMu0837 (rcrQ) SMu0837-D 5’-ACGGAGTCAAAAATCCCAAT-3’ Inactivation of SMu0837 (rcrQ) SMu0839- A 5’-TTGTTATTTTTGGCTGCTTTTT-3’ Inactivation of SMu0839 (cipI) SMu0839-B- BamHI 5’-CATATCTTTGGATCCACCTAAAATA-3’ Inactivation of SMu0839 (cipI) SMu0839-C- BamHI 5’-TTATTGTCTGGATCCTTTTATTATGG-3’ Inactivation of SMu0839 (cipI) SMu0839-D 5’CGCACAGCGCTTTAATTCTT-3’ Inactivation of SMu0839 (cipI)
SMu0835-seq FW 5’-CCGCTAAAGACGACAAGAGC-3’ Sequencing of ∆SMu0835 strains SMu0835-seq- RV 5’-AGCCCGAACAACACGAACAC-3' Sequencing of ∆SMu0835 strains SMu0836-seq FW 5’-CCGCTAAAGACGACAAGAGC-3’ Sequencing of ∆SMu0836 strains SMu0836-seq RV 5’-AACCAAAGCACCAGCAAAGT-3’ Sequencing of ∆SMu0836 strains SMu0837-seq FW 5’-TTTACCGCGTGCTTTAGTTTCT-3’ Sequencing of ∆SMu0837 strains SMu0837-seq RV 5’-ACTTTCTTGTGCATTTGCCTCT-3’ Sequencing of ∆SMu0837 strains P835 FW- SacI 5’-GCCAGTCTTAGAGCTCAGTCAGAAG-3’ SMU0835 promoter amplification P835 RV- BamHI 5’-CTCCTTCATGGATCCACCTCACTTT-3’ SMU0835 promoter amplification PRelP FW- SacI 5’AGATAATGCTGAGCTCTTTGTGGTT-3’ relP promoter amplification PRelP RV- BamHI 5’-CTTGTGACATGGATCCTCCTTCTTA-3’ relP promoter amplification phnA-AS 5’-GATTCCATTCATAAGCACAT-3’ Sequencing of promoter fusion
strains lacZ RV 5’- TCAGAAAATTCTGCAAGAGATTCA-3’ Sequencing of lacZ promoter
fusion strains Cat-5’LT RV 5’-TCGTTTGTTGGTTCAAATAA-3’ Sequencing of cat promoter
fusion strains

73
Table 2-3. Continued Primer Sequence Application
SMu0835 FW-BamHI 5’-AAGTGAGGGGATCCTATGAAGGAG-3’ Amplification of SMu0835 gene to make recombinant protein
SMu0835 RV-HindIII 5’-ATTTTAAACAAGCTTTACTCCTTCTT-3’ Amplification of SMu0835 gene to make recombinant protein
BS A 5’-ACAAGAGCTGATTGACGTTTCATA-3’ Point mutations in PSMu0835 (rcrR) BS D 5’-ATGCCCCATTCTTTAGCATTTAGA-3’ Point mutations in PSMu0835 (rcrR) NBS1 B 5’-
TGAGAATATTATAAGGGGAAAAATGAAAACTATTA-3’
Point mutations in PSMu0835 (rcrR)
NBS1 C 5’-TAATAGTTTTCATTTTTCCCCTTATAATATTCTCA-3’
Point mutations in PSMu0835 (rcrR)
BBS B- RV 5’-AGAATATTATAAGGGTTCTCATGAAAACTATTATAATGAGGCCTTAAACTATTG-3’
Point mutations in PSMu0835 (rcrR)
BBS C- FW 5’-CAATAGTTTAAGGCCTCATTATAATAGTTTTCATGAGAACCCTTATAATATTCT-3’
Point mutations in PSMu0835 (rcrR)
BS1 MAMA 5’-ATCATTATAATAGTTTTCATGAGAACTG-3’ Screen for point mutations in PSMu0835 (rcrR)
BS2 MAMA 5’-TTCTCCTTGACAATAGTTTAAGGAATCG-3’ Screen for point mutations in PSMu0835 (rcrR)
BS seq FW 5’-ATCTCTTATCTTGCGCTGTTTG-3’ Sequencing of strains
BS seq RV 5’-CGACTGCTCCTGTCCATTCAT-3’ Sequencing of strains
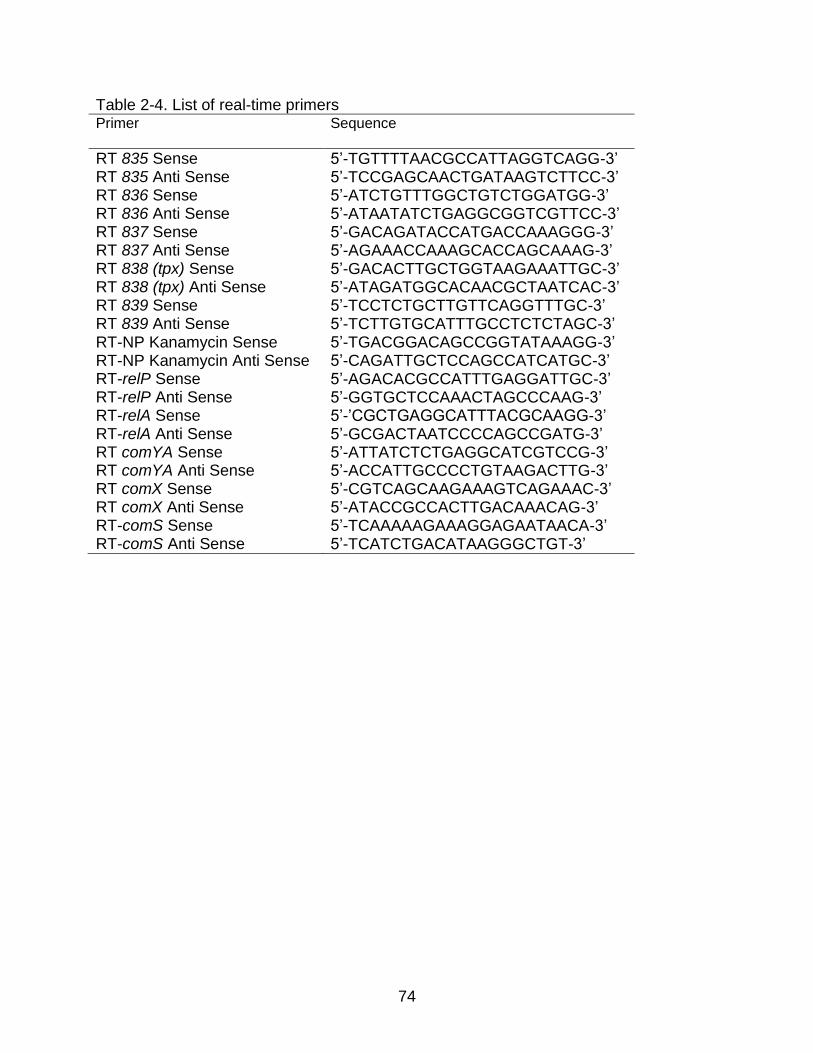
74
Table 2-4. List of real-time primers Primer
Sequence
RT 835 Sense 5’-TGTTTTAACGCCATTAGGTCAGG-3’ RT 835 Anti Sense 5’-TCCGAGCAACTGATAAGTCTTCC-3’ RT 836 Sense 5’-ATCTGTTTGGCTGTCTGGATGG-3’ RT 836 Anti Sense 5’-ATAATATCTGAGGCGGTCGTTCC-3’ RT 837 Sense 5’-GACAGATACCATGACCAAAGGG-3’ RT 837 Anti Sense 5’-AGAAACCAAAGCACCAGCAAAG-3’ RT 838 (tpx) Sense 5’-GACACTTGCTGGTAAGAAATTGC-3’ RT 838 (tpx) Anti Sense 5’-ATAGATGGCACAACGCTAATCAC-3’ RT 839 Sense 5’-TCCTCTGCTTGTTCAGGTTTGC-3’ RT 839 Anti Sense 5’-TCTTGTGCATTTGCCTCTCTAGC-3’ RT-NP Kanamycin Sense 5’-TGACGGACAGCCGGTATAAAGG-3’ RT-NP Kanamycin Anti Sense 5’-CAGATTGCTCCAGCCATCATGC-3’ RT-relP Sense 5’-AGACACGCCATTTGAGGATTGC-3’ RT-relP Anti Sense 5’-GGTGCTCCAAACTAGCCCAAG-3’ RT-relA Sense 5’-’CGCTGAGGCATTTACGCAAGG-3’ RT-relA Anti Sense 5’-GCGACTAATCCCCAGCCGATG-3’ RT comYA Sense 5’-ATTATCTCTGAGGCATCGTCCG-3’ RT comYA Anti Sense 5’-ACCATTGCCCCTGTAAGACTTG-3’ RT comX Sense 5’-CGTCAGCAAGAAAGTCAGAAAC-3’ RT comX Anti Sense 5’-ATACCGCCACTTGACAAACAG-3’ RT-comS Sense 5’-TCAAAAAGAAAGGAGAATAACA-3’ RT-comS Anti Sense 5’-TCATCTGACATAAGGGCTGT-3’

75
Table 2-5. List of primers and oligos for EMSA and FP analysis Primer Sequence
P835-FW_biotin
5’-/5Biosg/GCCAGTCTTAGAAAGTAGTCAGAAG-3’
P835-RV 5’-CTCCTTCATAAAAACACCTCACTTTT-3’
PrelP-FW_biotin
5’-/5Biosg/AGATAATGCTAGGCTTTTTGTGGTT-3’
PrelP-RV 5’-CTTGTGACATAATTCATCCTTCTTA-3’ PcomX-FW_biotin
5’-/5Biosig/CATACCCTGCTTTATCTTGAAT-3’
PcomX-RV 5’-CTATTACGATGACCTCCTTTTATAAT-3’
RS1+13 FW 5’ –AGCCGTTACGTAGTTTTCATGAGAACTAA- 3’
RS1 plus RV 5’- AATATTATAATAGTTCTCATGAAAACTATTATAATGAT- 3’ RS 1 plus FW 5’-ATCATTATAATAGTTTTCATGAGAACTATTATAATATT-3’
RS 1 plus RV 5’-AATATTATAATAGTTCTCATGAAAACTATTATAATGAT-3’
RS 1 plus RV- biotin
5’-/5Biosg/AATATTATAATAGTTCTCATGAAAACTATTATAATGAT-3’
RS 1 plus RV- 6FAM
5’-/56FAM/AATATTATAATAGTTCTCATGAAAACTATTATAATGAT-3’
RS 2 plus FW 5’-TGACAATAGTTTAAGGAATCATTATAATAGTTTTCATGAGAACTATTATAATATT-3’
RS 2 plus RV 5’-AATATTATAATAGTTCTCATGAAAACTATTATAATGATTCCTTAAACTATTGTCA-3’
RS 2 plus RV- biotin
5’-/5Biosg/AATATTATAATAGTTCTCATGAAAACTATTATAATGATTCCTTAAACTATTGTCA-3’

76
CHAPTER 3 CHARACTERIZATION OF THE SMU0835-837 OPERON AND ITS ROLE ON
GROWTH, BIOFILM FORMATION AND STRESS TOLERANCE IN Streptococcus mutans
Introduction
S. mutans is able to survive, persist and compete with other bacteria, and
eventually cause disease when conditions are favorable. Therefore, it is critical to
understand the mechanisms that S. mutans utilizes to adapt to stress. The metabolism
of (p)ppGpp is an important stress adaptation pathway. The amount of (p)ppGpp
accumulated plays a significant role in controlling the physiology of the cell and affects
certain virulence attributes in S. mutans (98, 122, 123). The discovery of the additional
synthetase enzymes, particularly RelP, the dominant producer of (p)ppGpp under non-
stringent conditions, shows that there are other signals and factors regulating (p)ppGpp
metabolism than was previously known. The signals regulating RelA-dependent
(p)ppGpp production are pretty well known, but the signals regulating RelP-dependent
(p)ppGpp production have not been revealed. However, it was found that the
expression of the relPRS operon was upregulated in cells grown with aeration (7). The
SMu0835-0839 gene cluster was upregulated in aeration as well and in a mupirocin-
induced stringent response (4, 123). The genes in the SMu0835-0839 cluster encode
products that are typically involved in stress tolerance as well. The linkage to stress
tolerance and response to similar environmental signals provided the basis for potential
regulatory overlap of relP and SMu0835-0837. In order to elucidate pathways that are
involved in stress responses and factors influence RelP-dependent (p)ppGpp
production in S. mutans, the SMu0835-0839 gene cluster was closely examined. We
characterized a variety of mutants lacking some or all of these genes. Figure 3-1 shows
77
a schematic of the operon. SMu0835, which we designated rcrR for rel competence
related (rcrR) gene is predicted to encode a cytoplasmic transcriptional regulator with a
winged helix-turn-helix DNA binding motif and is identified (Oralgen, Los Alamos) as a
member of the multiple antibiotic resistance (MarR) family of transcriptional regulators
(10). MarR-type regulators are widely distributed in bacteria and regulate many
functions, including resistance to xenobiotics and oxidative stressors, and expression of
virulence genes (64). For example, the E. coli MarR protein modulates the expression
of multiple genes that impact resistance to a variety of antibiotics and to oxidative stress
(14, 181). SMu0836 (rcrP) and SMu0837(rcrQ) are apparently co-transcribed with
SMu0835 and are annotated (Oralgen, Los Alamos) as transmembrane ATP-Binding
Cassette (ABC) transporters that function as multidrug/protein/lipid transport systems.
The ATP-binding cassette and transmembrane domains of both proteins are located on
a single polypeptide and are classified as Type 6 transporters (62), which include homo-
and hetero-meric ABC transporters that typically function as exporters involved in the
externalization of toxic compounds or peptides. The highly conserved ATP-binding
Walker A sequence and Walker B magnesium-binding sequences, as well as the
signature LSGGQ sequence, found in ABC transporters are conserved in both ORFs.
Notably, we could identify MarR-like regulators that are linked to two similar ABC
transporters in multiple other streptococcal species and in other Firmicutes (Table 7-1).
SMu0838 (tpx) encodes a thiol peroxidase that was shown by microarray analysis
to be up-regulated in response to growth with aeration, compared to anaerobically-
growing cells (7). Thiolperoxidases can protect bacteria against oxidative stress by
breaking down hydrogen peroxide and organic hydroperoxides. The Tpx protein

78
contains the 2 cysteine residues that form the conserved CXXC motif and that are
oxidized by hydroperoxides to form a sulfenic acid. Notably, there are other proteins in
S. mutans that contain the FX4 CXXC motif that are involved in responses to aeration,
including SMu0629, which modulates the activity of the AtlA autolysin (7). SMu0839
(cipI) was shown by Levesque and co-workers (175) to encode a bacteriocin immunity
protein. Bacteriocin immunity proteins are generally integral membrane proteins that
confer protection against certain classes of antimicrobial agents and often enhance
stress tolerance (150). In S. mutans, CipI plays a protective role against the CipB
bacteriocin-like protein, which appears to function intracellularly and contributes to cell
death following exposure to high levels of competence stimulating peptide (CSP) (175).
Results
Transcriptional Organization of the SMu0835-837 Operon.
A collection of mutants was made by allelic exchange using either polar or non-
polar antibiotic resistance cassettes (Table 2-1). Reverse transcriptase PCR (RT-PCR)
and quantitative RealTime® RT-PCR were used to determine if genes could be co-
transcribed and to measure stable transcript levels of the genes in the SMu0835-0839
operon in the Δ835np, Δ836np, Δ836p and Δ837np mutants, respectively. RT-PCR
revealed that SMu0835 can be co-transcribed with SMu0836 and SMu0837 as a
polycistronic operon (Figure 3-2, Figure 3-3).
Consistent with the RT-PCR results, expression of SMu0837(rcrQ) was down-
regulated nearly 1000-fold in the polar Δ836p mutant compared to the parental strain
(Figure 3-4). In contrast, expression of SMu0838 (tpx) or SMu0839 (cipI) was not
significantly altered in the Δ836p mutant compared to the wild-type strain (Figure 3-5).
The lack of influence of polar insertions in SMu0836-7 on tpx mRNA levels was

79
consistent with our inability to detect a product in RT-PCR reactions using primers that
would amplify across the SMu0837-tpx intergenic region (data not shown), indicating
that these genes are not part of the SMu0835-7 operon.
Interestingly, the expression of SMu0836(rcrP) and SMu0837(rcrQ) was
significantly up-regulated (~100-fold) in the mutant carrying a non-polar insertion in the
SMu0835 gene (Δ835np) compared to the wild-type strain (Figure 3-4, Figure 3-6),
adding further support that these three genes constitute an operon and revealing that
the MarR-like protein may repress expression of this operon. To further demonstrate
that SMu0835 was autogenously regulated, we measured mRNA levels of the non-polar
kanamycin resistance gene that was used to replace SMu0835 in the Δ835np strain,
lacking the MarR-like regulator, and compared it to expression levels in the Δ836np
mutant, which has an intact MarR-like regulator. This non-polar kanamycin resistance
cassette lacks a promoter (8), so its expression was driven by the SMu0835 promoter in
both the ∆835np and ∆836np strains. Consistent with the RealTime-PCR results, the
expression of the non-polar kanamycin marker was about 100-fold higher in the Δ835np
mutant than in the Δ836np mutant (Figure 3-7), adding additional support for the
hypothesis that the SMu0835 protein is a negative regulator of the SMu0835-0837
operon. Also of interest is that the magnitude of induction of the operon associated with
loss of the SMu0835 protein indicates that the genes are significantly repressed during
exponential growth in rich medium. Notably, though, the expression of this operon was
not differentially expressed as a function of growth phase (data not shown).
SMu0835 (RcrR) Is the Dominant Regulator of the Operon .
Based on the qRT-PCR analysis and sRT-PCR experiments it appears that RcrR
is the dominant regulator of the operon and therefore EMSAs were done to analyze

80
whether purified RcrR protein (rRcrR) was able to bind to DNA amplified from the region
5’ of the ATG start site of rcrR. Purified RcrR protein was able to impede the migration
of a DNA fragment that included 140-bp in front of the ATG start site of rcrR at low
quantities (2 pmoles) (Figure 3-8). The shift of the 140-bp DNA fragment was observed
as little as 0.65 pmoles of RcrR protein. Other DNA fragments that included regions
containing 250 and 200–bp upstream of the rcrR ATG start site were all were impeded
by 5 pmoles of purified RcrR protein (data not shown). Cold competition assays were
done using biotinylated DNA and unlabeled DNA of the same region in different ratios
with 1.25 pmoles of rRcR protein. The amount of biotinylated DNA that was shifted
decreased with increasing concentrations of unlabeled DNA, indicative of competitive
binding to the purified protein (Figure 3-9). When 50 times more unlabeled DNA was
added there was only an approximate 30% shift in biotinylated DNA compared to an
approximate 88% shift with no competition (Table 3-1).
Growth Characteristics of the Mutants.
The growth of the various mutants (Table 2-1) was monitored in BHI broth. All of
the mutants constructed using the non-polar cassette displayed a modestly extended
lag phase and slightly slower growth rate than the wild-type strain. The wild-type strain
had a doubling time of about 46 min ± 1.5 min, whereas the non-polar mutants had
doubling times of about 51 min ± 3.5 min (Figure 3-10). However, the final optical
density attained by the non-polar mutants was consistently lower than the parental
strain. Notably, the Δ836p polar mutant, which would not express either ABC
transporter, exhibited much slower growth (67 min ± 7min) and lower final yields than
the non-polar mutants or parental strain (Figure 3-11). Both the polar and non-polar tpx

81
mutants had growth rates similar to the non-polar mutants, so the effects of the loss of
the ABC transporters were independent of the level of expression of tpx or cipI.
To test if the mutants were sensitive to low pH, the strains were grown in BHI broth
that was acidified to pH 5.5 with HCl (Figure 3-12). All of the mutants had a slower
growth phenotype than the wild-type strain. Importantly, the Δ836p mutant grew very
poorly at pH 5.5 and showed very little cell accumulation even after 26 hours (Figure 3-
13). Exposure to oxygen has been shown to alter growth and biofilm formation by S.
mutans (4) and some of the genes in the SMu0835-839 gene cluster were up-regulated
in response to oxygen (7). The growth phenotype of the mutants was assessed in BHI
without an oil overlay, thus exposing the cells to air during growth, or in medium
containing 25 mM paraquat, a superoxide generating agent, with an oil overlay.
Because cells could not grow in the presence of paraquat without oil overlay was
added. The Δ836p polar mutant again had a slower growth rate than the other strains.
In addition, the 836np and 837np mutants displayed a slow growth phenotype when
the cells were exposed to air (Figure 3-14). Interestingly, the ΔrelP mutant exhibited
significantly faster growth and a shorter lag phase than the wild-type strain in medium
containing paraquat or in cultures that were grown with exposure to air (Figure 3-15).
S. mutans has the ability to form biofilms, an essential process in establishment,
persistence and pathogenesis. Efflux pumps have been shown to be required for
biofilm formation in certain organisms and compounds that can inhibit efflux pumps can
affect the ability of bacteria to form biofilms (113). We evaluated if the various mutants
had impaired biofilm formation in microtiter plates in BM broth containing sucrose or
glucose. Biofilm formation was quantified at 24 and 48 h to take into account the effects

82
of the slower growth phenotypes of some of the mutants. There were no significant
differences seen in biofilm formation after 24 or 48 h when the strains were grown in
sucrose (data not shown). However, when the strains were grown in glucose, the
∆835np mutant, which overexpresses the ABC exporters and the Δ836p mutant, lacking
both ABC transporters, formed less biofilm than the other strains at 48 h (Figure 3-16).
Collectively, these data highlight the requirement of the ABC transporters for stress
tolerance and biofilm formation, but also show that loss of both transporters is required
to observe changes in the phenotypes of interest.
Discussion
The ability of S. mutans to survive and persist in the continually-varying conditions
in the oral cavity is intimately associated with its pathogenicity (33), so understanding
how the organism adapts to these often challenging conditions can facilitate the
development of novel strategies to compromise the persistence or virulence of this
important human pathogen. The results presented here show that the products of the
previously uncharacterized SMu0835-0837 operon, which we now designate as the
rcrRPQ operon, for rel-competence-related genes, play a major role in the regulation of
growth and stress tolerance. Although tpx and cipI participate in particular aspects of
stress tolerance and the response to CSP, respectively (175), we focused on the
rcrRPQ operon because deletion of tpx or cipI had no significant effects on growth,
stress tolerance or gene expression under the conditions we tested. We also found no
evidence to support that tpx or cipI were part of the rcrRPQ operon or had an influence
on relP expression.
The data presented here demonstrate that the RcrP (SMu0836) and RcrQ
(SMu0837) exporters are critical for tolerance of the two environmental stresses that
83
have the greatest influence on the composition (120), biochemical activities and
pathogenic potential of oral biofilms, oxidative and acid stress. Strains lacking the
RcrPQ transporters grew substantially slower than the parental strain in air or in the
presence of the superoxide generator paraquat. Likewise, mutants lacking these
transporters were more acid-sensitive than the parental strain, as evidenced by slower
growth at pH 5.5. The RcrPQ transporters were also necessary for proper biofilm
formation, another attribute associated with the pathogenicity of S. mutans. While it is
not yet established if the RcrP and RcrQ pumps are able to function as a heterodimeric
complex, as many ABC porters do (62), RcrP and RcrQ clearly have redundancy in
function, since deletion of only one of the exporters caused modest phenotypic changes
compared to those seen in strains carrying mutations that affected the expression of
both gene products.
ABC efflux transporters play many roles in bacteria, including extrusion of
antibiotics and export in a wide range of compounds, including, metals, peptides and
lipids (148). As noted earlier, RcrPQ have a structure typical of ABC export proteins
and are annotated as multi-drug/protein/lipid transport systems. The simplest
explanation for the growth defects of strains lacking both exporters would be that RcrP
and RcrQ are each capable of externalizing a substance or class of compounds that
accumulates in growing cells, particularly in aerobic conditions or at low pH.
Interestingly, the RcrQ protein is predicted to have a fumarate lyase regulatory domain
(Oralgen). Growth of S. mutans in air alters metabolism toward heterofermentative
growth and impacts the transcriptional profiles of the cells, including enhancing the
expression of the genes for pyruvate dehydrogenase and the partial TCA cycle, which in

84
the case of S. mutans could lead to enhanced fumarate production (7). We tested if
mutants lacking the ABC transporters were more sensitive to the presence of fumarate,
but this was not the case (data now shown). Notably, aeration also increases the
production of peptide antibiotics (mutacins) by S. mutans, so the transporters could play
a role in externalization of peptides with antimicrobial activity, which may account for the
smaller zone of inhibition with the strain lacking the RcrPQ porters (Appendix A). We
are currently testing the hypothesis that RcrQP participate in the transport of selected
peptide-based moieties.
Notwithstanding, multiple findings presented in this chapter reveal that the
RcrRPQ system in S. mutans has key functions in cellular homeostasis, gene regulation
and quorum sensing that extend well beyond simply pumping a deleterious substance
from inside the cell. RcrR (SMu0835) is the dominant regulator of the rcrRPQ operon,
repressing the production of the genes for the RcrP and RcrQ transporters under all
conditions tested here. Overexpression or uncontrolled expression of efflux pumps can
affect bacterial homeostasis and physiology by imposing a metabolic burden on the
bacteria or by hyper-secretion of signaling molecules (131), so it is critical that genes
encoding efflux pumps are properly regulated. Of note, the ∆835np (rcrR-) strain had
poor biofilm formation in glucose after 48 hours, which may be attributable to the
overexpression of the ABC pumps, although we cannot exclude that RcrR is influencing
the expression of other genes, such as the com genes, to affect biofilm formation. We
did not find evidence to support that derepression of the rcrR operon occurs as a
function of growth phase (data not shown), so we propose that accumulation of a

85
specific compound or class of compounds, perhaps those exported by the ABC pumps,
could serve as an allosteric regulator of the RcrR transcriptional repressor (Figure 3-17).
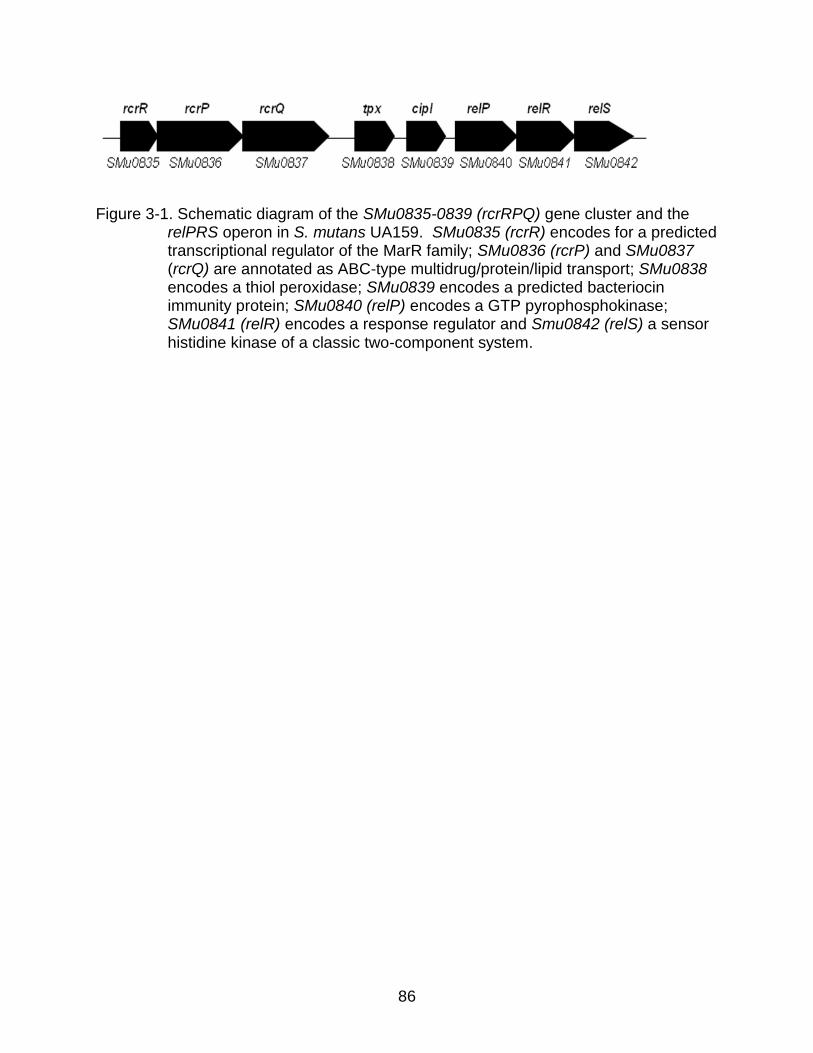
86
Figure 3-1. Schematic diagram of the SMu0835-0839 (rcrRPQ) gene cluster and the
relPRS operon in S. mutans UA159. SMu0835 (rcrR) encodes for a predicted transcriptional regulator of the MarR family; SMu0836 (rcrP) and SMu0837 (rcrQ) are annotated as ABC-type multidrug/protein/lipid transport; SMu0838 encodes a thiol peroxidase; SMu0839 encodes a predicted bacteriocin immunity protein; SMu0840 (relP) encodes a GTP pyrophosphokinase; SMu0841 (relR) encodes a response regulator and Smu0842 (relS) a sensor histidine kinase of a classic two-component system.

87
Figure 3-2. RT-PCR using cDNA generated from the SMu0836 reverse primer. Reverse
transcription was performed on 1 μg of purified RNA using the SMU0836 real-time reverse primer. PCR amplification was performed on the cDNA generated using the SMu0835-FW and the SMu0836-RV primers. Chromosomal DNA from the wild-type strain was also amplified as a positive control. + is the positive control; S is the PCR product from the cDNA generated; - is a negative control from a reaction with no RT enzyme.

88
Figure 3-3. RT-PCR using cDNA generated from the SMu0837 reverse primer. Reverse transcription was performed on 1 μg of purified RNA using the SMU0837 real-time reverse primer. PCR amplification was performed on the cDNA generated using the SMu0836-FW and the SMu0837-RV primers. Chromosomal DNA from the wild-type strain was also amplified as a positive control. +, is the positive control; S is the PCR product from the cDNA generated, - is a negative control from a reaction with no RT enzyme.
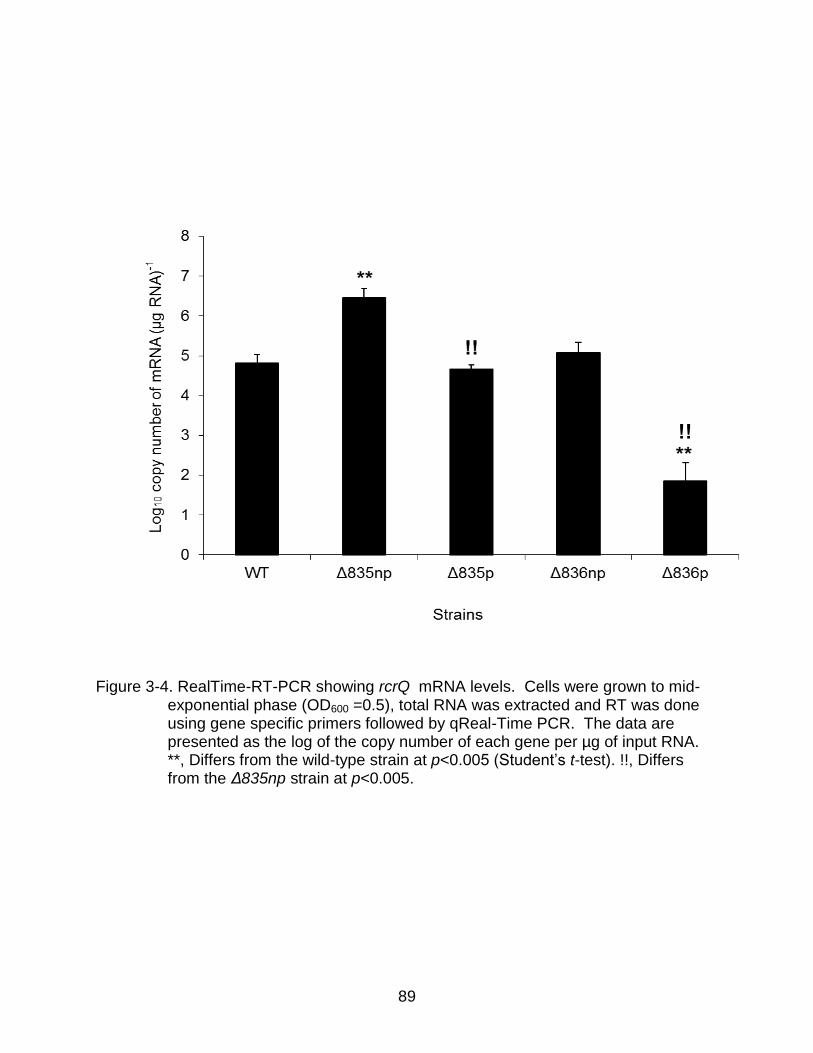
89
Figure 3-4. RealTime-RT-PCR showing rcrQ mRNA levels. Cells were grown to mid-exponential phase (OD600 =0.5), total RNA was extracted and RT was done using gene specific primers followed by qReal-Time PCR. The data are presented as the log of the copy number of each gene per µg of input RNA. **, Differs from the wild-type strain at p<0.005 (Student’s t-test). !!, Differs from the Δ835np strain at p<0.005.
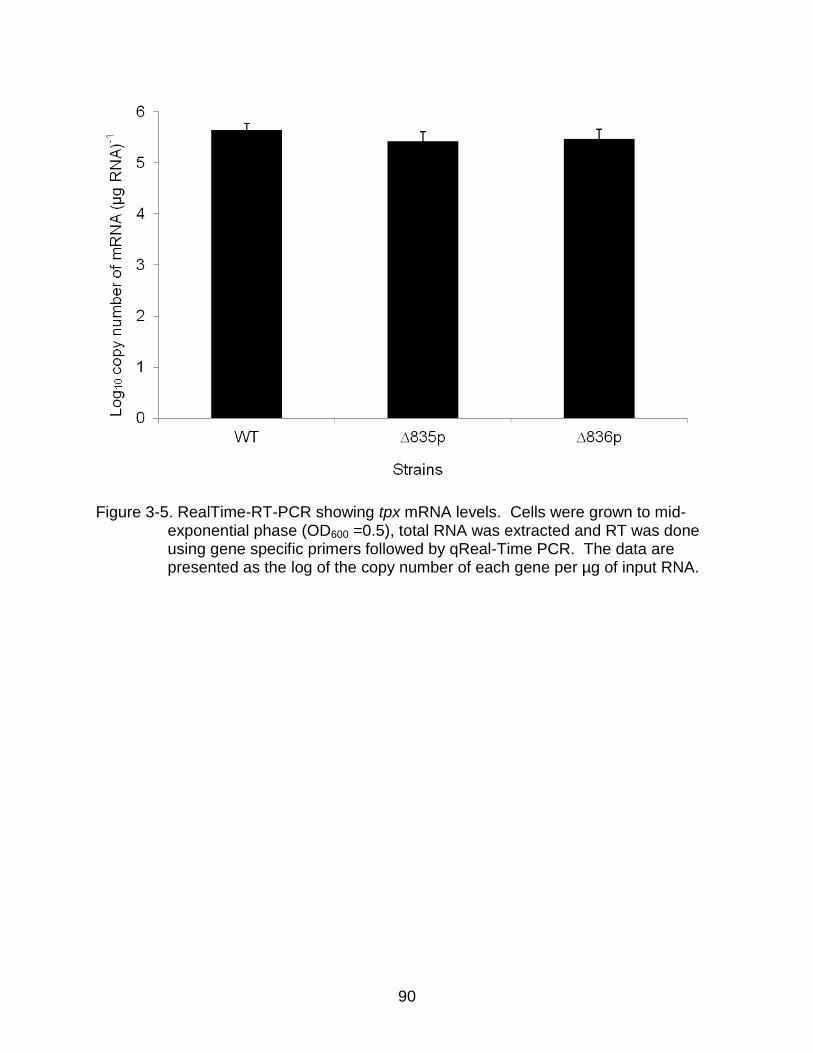
90
Figure 3-5. RealTime-RT-PCR showing tpx mRNA levels. Cells were grown to mid-
exponential phase (OD600 =0.5), total RNA was extracted and RT was done using gene specific primers followed by qReal-Time PCR. The data are presented as the log of the copy number of each gene per µg of input RNA.

91
Figure 3-6. RealTime-RT-PCR showing SMu0836(rcrP) mRNA levels. Cells were
grown to mid-exponential phase (OD600 =0.5), total RNA was extracted and RT was done using gene specific primers followed by qReal-Time PCR. The data are presented as the log of the copy number of each gene per µg of input RNA. **, Differs from the wild-type strain at p< 0.005 (Student’s t-test). !!, Differs from the Δ835np strain at p<0.005.
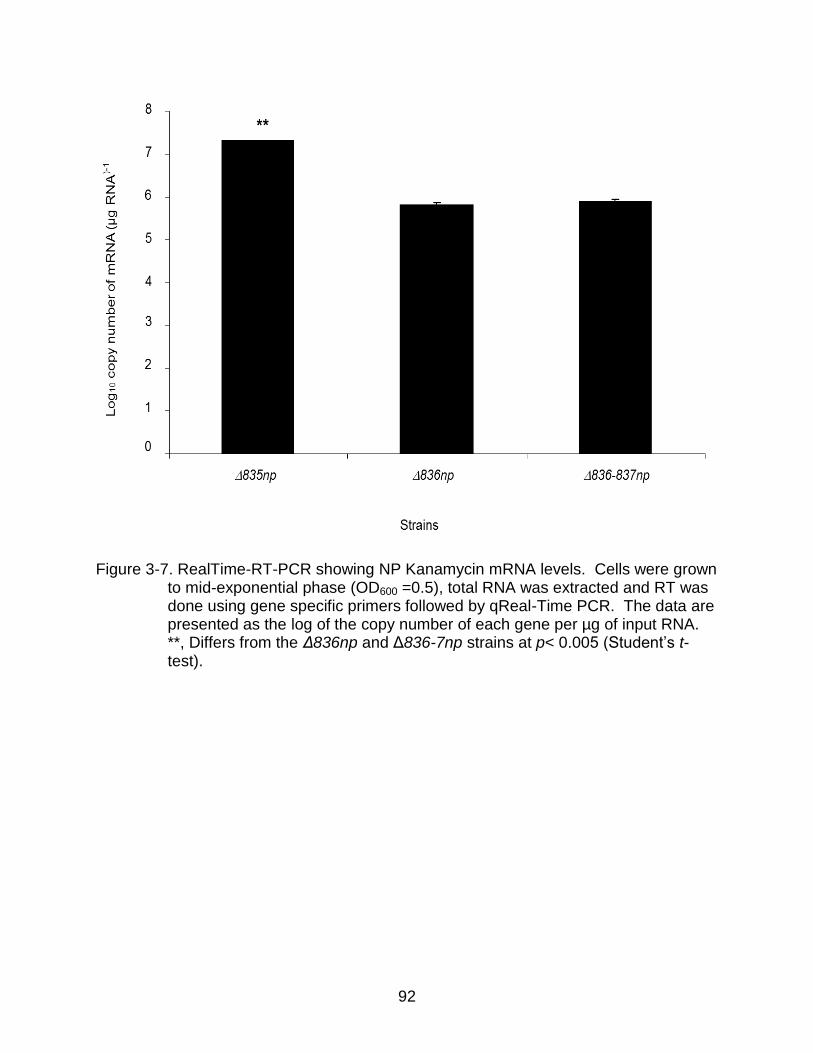
92
Figure 3-7. RealTime-RT-PCR showing NP Kanamycin mRNA levels. Cells were grown
to mid-exponential phase (OD600 =0.5), total RNA was extracted and RT was done using gene specific primers followed by qReal-Time PCR. The data are presented as the log of the copy number of each gene per µg of input RNA. **, Differs from the Δ836np and Δ836-7np strains at p< 0.005 (Student’s t-test).

93
Figure 3-8. EMSA showing binding of biotinylated PrcrR DNA with purified RcrR protein. Purified RcrR protein of various concentrations (0, 2.5, 5, 10, 20 pmoles) was added to 5 fmoles of biotinylated PrcrR DNA in a binding reaction for 40 min. The reactions were run on a non-denaturing polyacrylamide gel and the signal observed via chemiluminescence. The data are a representative of n= 7 EMSAs. There was a similar trend observed in all cases.

94
Figure 3-9. EMSA showing competitive binding of 5 fmol biotinylated PrcrR DNA and unlabeled PrcrR DNA with 1.25 pmoles of purified RcrR protein. Various concentrations of unlabeled DNA containing the same region as the biotinylated region were used. The first lane is the no protein control. The reactions were done for 40 min at room temperature. The reactions were run on a non-denaturing polyacrylamide gel and the signal observed via chemiluminescence. The data are a representative of n=3 EMSAs. There was a similar trend observed in all cases.
Table 3-1. Percentage of labeled PrcrR DNA shifted with unlabeled competitor PrcrR DNA
0 x unlabeled DNA 10 x unlabeled DNA 50 x unlabeled DNA 100 x unlabeled DNA
88% shift 71% shift 30% shift 30% shift
% shift calculated as % reduction in the integrated density value (IDV) of the DNA bands compared to the IDV of unshifted DNA band with no protein.

95
Figure 3-10. Growth comparison of wild-type and non-polar mutant strains in BHI. The
strains were grown in triplicate to mid-exponential phase in BHI broth, diluted 1:100 and transferred to fresh BHI broth, overlaid with sterile mineral oil and
placed in a Bioscreen C at 37°C to monitor growth. WT, diamonds; 835np,
squares; 837np X’s; 836np, triangles. The results are representative of three independent experiments performed triplicate.
Table 3-2. Table showing growth characteristics of the non-polar mutants versus the wild-type strain in BHI
Strain WT Δ835np Δ836np Δ837np Final OD 0.9 ± 0.017
0.84 ± 0.05
0.80 ± 0.08
0.82 ± 0.03
Doubling Time (min)
46 ± 1.5
47 ± 1
50 ± 0.7
48 ± 3
Lag time (h) 2 3 3 3

96
Figure 3-11. Growth comparison of wild-type and polar mutant strains in BHI. Strains
were grown as described in Figure 3-10. WT, diamonds; 836p, squares. The results are representative of three independent experiments performed triplicate.
Table 3-3. Table showing growth characteristics of the polar mutant versus the wild-type
strain in BHI.
Strain WT Δ836p
Final OD 0.9 ± 0.02
0. 78 ± 0.03
Doubling Time (min) 46 ± 1.5
57 ± 7 *
Lag time (h) 2 3
*, Differs from the wild-type strain at p< 0.05 (Student’s t-test)

97
Figure 3-12. Growth of the non-polar mutants versus the wild-type strain at pH 5.5. Cells were grown in triplicate to mid- exponential phase in BHI broth, diluted 1:100 in BHI broth acidified to pH 5.5, covered with sterile mineral oil and
placed in a Bioscreen C at 37°C to monitor growth. WT, diamonds; 835np ,
squares; 837np X’s; 836np, triangles. The results are representative of three independent experiments performed triplicate
Table 3-4. Table showing growth characteristics of the wild-type versus the non-polar strains at pH 5.5
Strain WT Δ835np Δ836np Δ837np
Final OD 0.64 ± 0.03
0.65 ± 0.04
0.62 ± 0.19
0.65 ± 0.05
Doubling Time (min)
98 ± 7
109 ± 29
135 ± 13, *
103± 24
*, Differs from the wild-type strain at p< 0.05 (Student’s t-test)

98
Figure 3-13. Growth of the polar mutant strain versus the wild-type strain at pH 5.5.
Strains were grown as in Figure 3-10. WT, diamonds; 836p, squares. The results are representative of three independent experiments performed triplicate.
Table 3-5. Table showing growth characteristics of the polar mutant versus the wild-type strain at pH 5.5
Strain WT Δ836p Final OD 0.64 ± 0.03
0.09 ± 0.01
Doubling Time (min)
98 ± 7
412 ± 117**
**, Differs from the wild-type strain at p< 0.005 (Student’s t-test).

99
Figure 3-14. Growth of the mutants versus the wild-type strain with aeration. Cells were
grown in triplicate to mid-exponential phase in BHI broth then diluted 1:100 in
fresh BHI broth and placed in a Bioscreen C at 37⁰C to monitor growth
without the use of mineral oil. WT, diamonds; Δ835np, squares; 836np,
triangles; Δ837np, *; Δ836p, Xs. The results are representative of three
independent experiments performed in at least triplicate.
Table 3-6. Table showing growth characteristics of the mutants versus the wild-type strain with aeration
Strain WT Δ835np Δ836np Δ836p Δ837np Final OD 0.63 ± 0.03 0.56 ±0.04 0.39 ± 0.06
0.36 ± 0.07
0.40 ± 0.07
Doubling Time (min)
38 ± 2
42 ± 2
83 ± 3 **
88 ± 13 **
95 ± 15 **
**, Differs from the wild-type strain at p< 0.005 (Student’s t-test)
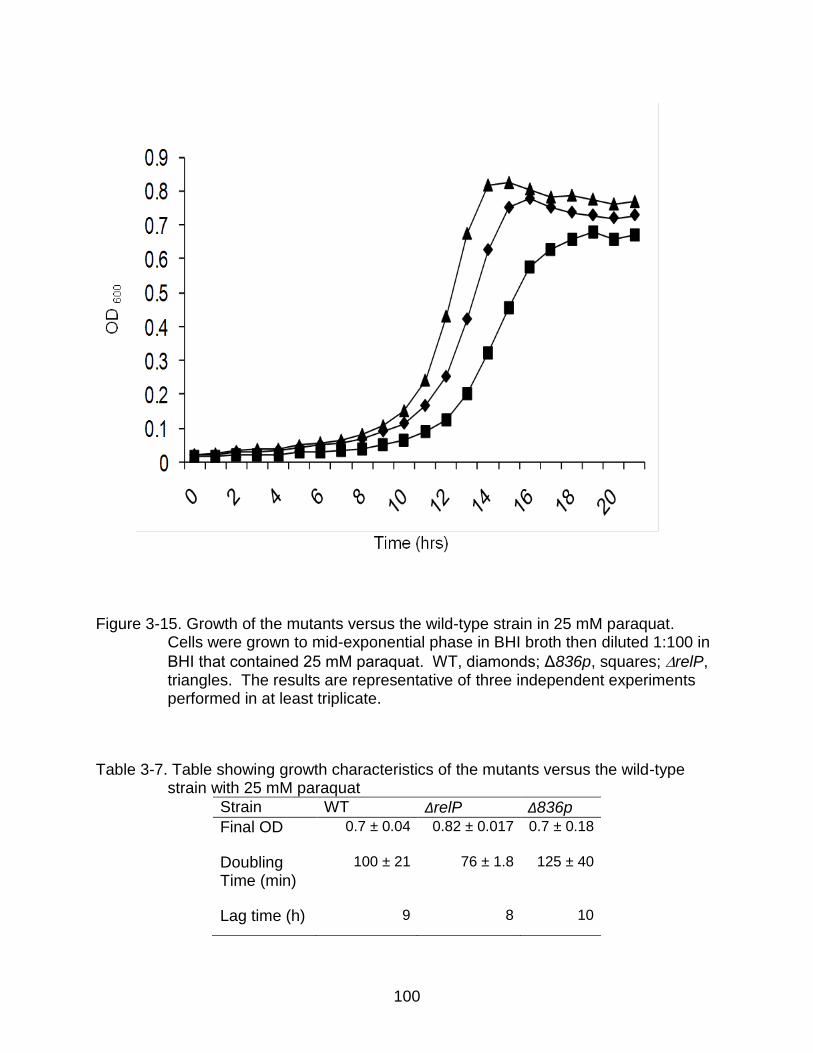
100
Figure 3-15. Growth of the mutants versus the wild-type strain in 25 mM paraquat. Cells were grown to mid-exponential phase in BHI broth then diluted 1:100 in
BHI that contained 25 mM paraquat. WT, diamonds; Δ836p, squares; relP, triangles. The results are representative of three independent experiments performed in at least triplicate.
Table 3-7. Table showing growth characteristics of the mutants versus the wild-type strain with 25 mM paraquat
Strain WT ΔrelP Δ836p
Final OD 0.7 ± 0.04
0.82 ± 0.017
0.7 ± 0.18
Doubling Time (min)
100 ± 21
76 ± 1.8
125 ± 40
Lag time (h) 9 8 10

101
Figure 3-16. The differences in biofilm formation of the mutants compared with the wild-
type strain in glucose. Cells were grown to OD600 =0.5 in BHI broth then diluted 1:100 into BM supplemented with 20 mM glucose in microtiter plates. Biofilm formation was quantified after 48 h as described in the methods section. The results are representative of three independent experiments performed in at least triplicate. *, Differs from the wild-type at p<0.05.

102
Figure 3-17. Schematic of the proposed regulation of the rcrPQ operon by the RcrR protein. A. The RcrR protein represses the operon under normal conditions. B. Under stress conditions, the accumulation of signals causes the RcrR protein to lose its repressing capabilities leading to derepression of the operon.

103
CHAPTER 4 REGULATION OF relPRS AND THE EFFECTS OF SMU0835-0837 ON relPRS AND
(p)ppGpp LEVELS
Introduction
The regulation of (p)ppGpp metabolism is critical for maintaining homeostasis in
the cell and adapting to changes in nutrient availability. Virulence and other stress
pathways have been linked to (p)ppGpp production in a variety of bacterial species (98).
In addition, deletions of relA affected biofilm formation, a virulence property of S.
mutans (119). The fact that there are three enzymes governing (p)ppGpp production in
S. mutans suggests that (p)ppGpp metabolism is based on diverse signals. It was
previously thought that nutrient availability was the main signal regulating (p)ppGpp
metabolism, but the identification of the additional synthases, RelP and RelQ, suggests
that other environmental signals regulate (p)ppGpp metabolism (122). The
accumulation of (p)ppGpp in the absence of relA under non-stringent conditions also
indicates that there are other factors influencing (p)ppGpp production in a dominant way
(122). RelP was the major producer of (p)ppGpp under non-stringent conditions, and
Lemos et al. also showed that overexpressing relP in a strain that lacks the (p)ppGpp
hydrolase, caused growth arrest of the cells (122). These data demonstrate that
production of (p)ppGpp by RelP is of significant importance in regulating the physiology
of the cell. relP is co-transcribed with relRS, which encodes a TCS, and (p)ppGpp
accumulation was also affected in a relRS mutant under non-stringent conditions (122) .
The relRS mutant grew faster than the wild-type strain, indicating that (p)ppGpp levels
were lower in this strain (122). The linkage of the RelRS TCS to RelP and (p)ppGpp
production demonstrates that RelP-dependent production of (p)ppGpp is probably
controlled by relP transcript levels unlike RelA which is regulated allosterically at the

104
enzymatic level. Since RelP-dependent production of (p)ppGpp is linked to the RelRS
TCS, it also suggests that extracellular signals control RelPRS- dependent (p)ppGpp
metabolism. However, these signals have not yet been identified. The upregulation of
relPRS in aeration detected via microarray analysis (4) indicates that relPRS is
regulated at the transcriptional level, and oxidative stress may be one of the signals to
regulate (p)ppGpp metabolism.
Interestingly, members of our group showed that SMu0838 (tpx) and SMu0839
(cipI) were upregulated in aeration as well (4). The SMu0835-837 operon was up-
regulated during a mupirocin-induced stringent response in a (p)ppGpp-dependent
manner (164), i.e., with no induction of these genes in a relA mutant. Therefore, the
expression of the relP and SMu0835-7 operons may be coordinated with one another in
response to particular stresses or signals.
Results
SMu0835-837 Influence relP Expression and Vice Versa.
In order to test if the SMu0835-0837 operon exerted an effect on the expression of
relPRS, qRT-PCR was performed to compare the amount of mRNA expressed from the
relPRS operon in the wild-type strain with that in various mutant strains. The
expression level of the relP operon in the Δ835np and Δ836p mutants, which either
overexpress or do not express the exporters, respectively, was approximately half that
measured in the wild-type strain, whereas the expression of relP and relRS in the
Δ837np and Δ839 mutant was similar to that in wild-type strain (Figure 4-1, Figure 4-2).
Similarly, qRT-PCR analysis was done to measure the expression of SMu0835 and
SMu0836 in a relP mutant strain and it was noted that the expression these genes was
approximately three-fold lower in the strains lacking relP or relRS, compared to the wild-

105
type strain (Figure 4-3, Figure 4-4). In contrast, the expression of SMu0835 and
SMu0836 was similar in a ΔrelA mutant and the wild-type strain (data not shown), an
expected finding given the knowledge that RelA does appear to contribute significantly
to (p)ppGpp pools under non-stringent conditions in exponentially growing cells (122).
To verify the qRT-PCR results, the promoter for relP was fused to a promoterless
chloramphenicol acetyltransferase (cat) gene and CAT activity was measured in
exponentially-growing cells. Consistent with the qRT-PCR data, relP promoter activity
was lower in the Δ836p mutant than in the wild-type background (Figure 4-5). Using a
cat-gene fusion as described above, SMu0835 promoter activity was analyzed in the
ΔrelP genetic background and found to be 1.5-fold lower than in the wild-type genetic
background (Figure 4-6). Thus, the cat fusion data were consistent with the qRT-PCR
data showing that expression of the SMu0835-7 operon was decreased significantly in
the ΔrelP and ΔrelRS mutants, and vice versa.
Effect of SMu0835-0837 on (p)ppGpp Levels
To verify that the changes in relP expression noted in the SMu0835-7 operon
mutants were associated with alterations in the levels of (p)ppGpp in cells, alarmone
production was monitored in exponentially-growing cells in the wild-type strain and
selected mutants. The results demonstrated that (p)ppGpp production was adversely
affected by loss of constituents encoded by the SMu0835-7 operon, consistent with the
changes in relP mRNA levels and relP promoter activity in these same mutants (Figure
4-7, Table 4-1).
Effect of Oxidative Stressors on (p)ppGpp Pools
RelP is the principal source of (p)ppGpp in exponentially-growing cells and it
appears that the RelPRS system functions to slow the growth of the bacteria in

106
response to signals associated with stress, especially oxidative stress (Figure 3-15).
The strain lacking relP and relRS, grew considerably faster than the wild-type strain
when exposed to paraquat and aeration as noted in Figure 3-15. The accumulation of
(p)ppGpp in the presence of hydrogen peroxide was tested. There was a significant
increase in both ppGpp (GP4) and pppGpp (GP5) levels when 0.003% hydrogen
peroxide was present during the labeling of the cells (Figure 4-8). The accumulation of
GP4 and GP5, appeared to be dependent on RelPRS. There was no accumulation in
GP4 or GP5 in mutants lacking relP or relRS in response to hydrogen peroxide (Figure
4-8). However, there were no significant changes in the ∆relA and ∆relQ mutant,
suggesting that this accumulation of (p)ppGpp in response to aeration is predominantly
relPRS dependent.
Effect of Oxidative Stressors on relP Promoter Activity
Since there was an increase in the amount of (p)ppGpp accumulated in response
to hydrogen peroxide and the transcription of relP was up in aeration, β-galactosidase
experiments examining the effects of hydrogen peroxide on the relP promoter were
done. Consistent with the (p)ppGpp accumulation data, there was a significant increase
in relP promoter activity when the cells were exposed to hydrogen peroxide compared
to the cells that were not (Figure 4-9). The activity of the relP promoter was 164 ± 9
Miller units when exposed to hydrogen peroxide compared to an activity of 112 ± 5
Miller units when not exposed to stress.
Discussion
The overlap between control of expression of the rcr operon and the relP operon is
of considerable interest. The underlying basis for the retention of multiple (p)ppGpp
synthases in S. mutans and in certain other prokaryotes remains largely enigmatic, but

107
a reasonable explanation for the retention or acquisition of RelP and the RelRS system
during evolution has been disclosed in this study. In particular, the evidence supports
that the RelRS two-component system may sense oxidative stressors or by-products of
oxidative metabolism as a signal to stimulate (p)ppGpp production by activating
production of RelP. In previous studies done in our lab, it was shown that the
production of (p)ppGpp by RelP plays a significant role in regulating the growth of S.
mutans in exponentially growing cells (122). It was also shown that overexpression of
relP in a strain lacking (p)ppGpp hydrolase activity could induce growth arrest (122). Of
particular interest here was the substantially faster growth rate of the ΔrelP mutant
strain in the presence of paraquat (Figure 3-15), likely arising from a failure of the
mutant to accumulate (p)ppGpp through RelP activity. There is also a clear induction of
(p)ppGpp in response to hydrogen peroxide stress, and the data show that RelPRS is
the major producer of (p)ppGpp under these conditions. We propose that RelP-
dependent production of (p)ppGpp in cells exposed to oxidative stress functions to slow
the growth of the cells. Since S. mutans does not have a complete respiratory chain,
has a limited repertoire of enzymes to detoxify reactive oxygen species and displays
much better growth in conditions of lower oxygen tension, RelPRS may help to protect
the cells from exhausting limited resources, from overproducing metabolites that are
toxic, and from acquiring deleterious mutations.
In E. coli, it has been shown that (p)ppGpp plays a role in resistance to an intrinsic
peptide by inducing efflux pumps to extrude the peptide (180). Interestingly, the RcrPQ
pumps in S .mutans are also induced in response to an increase in (p)ppGpp pools
during a mupirocin-induced stringent response (164). Both the rcrRPQ and relPRS

108
gene products appear to be modulating growth in response to aeration and, based on
our CAT assays and real-time PCR analysis, the products of these two operons can
exert an effect on the expression of each other. Thus, as part of our working model, we
hypothesize that the RcrPQ export apparatus could play a role in externalizing the
compound(s) that is detected by RelRS in quorum-sensing fashion to control the growth
of S. mutans populations in response to elevated redox or reactive oxygen species
(Figure 4-10). Such a feedback loop could at least partially explain the interdependence
of relP and rcr operon expression and the decrease in (p)ppGpp levels in the mutant
lacking the RcrPQ porters. This and other potential mechanisms controlling rcr and relP
cross-regulation are presently under investigation. We propose, as part of our working
model that the regulation of relP by rcrRPQ may be through the RcrR regulator binding
to the relP promoter as well. Since rcrRPQ is responsive to high levels of (p)ppGpp, the
regulation of the operon may be tied to RelP dependent (p)ppGpp levels.

109
Figure 4-1. RealTime-RT-PCR showing RelP mRNA levels. Cells were grown to mid-
exponential phase (OD600 =0.5), total RNA was extracted and RT was done using gene specific primers followed by qReal-Time PCR. The data represent the fold-change in copy numbers of the mutant strains compared to the wild-type strain where the wild-type value was set to 1.0 *, Differs from the wild-type at p< 0.05 (Student’s t-test).

110
Figure 4-2. RealTime-RT-PCR showing RelRS mRNA levels. Cells were grown to mid-
exponential phase (OD600 =0.5), total RNA was extracted and RT was done using gene specific primers followed by qReal-Time PCR. The data represent the fold-change in copy numbers of the mutant strains compared to the wild-type strain where the wild-type value was set to 1.0 *, Differs from the wild-type at p< 0.05 (Student’s t-test).
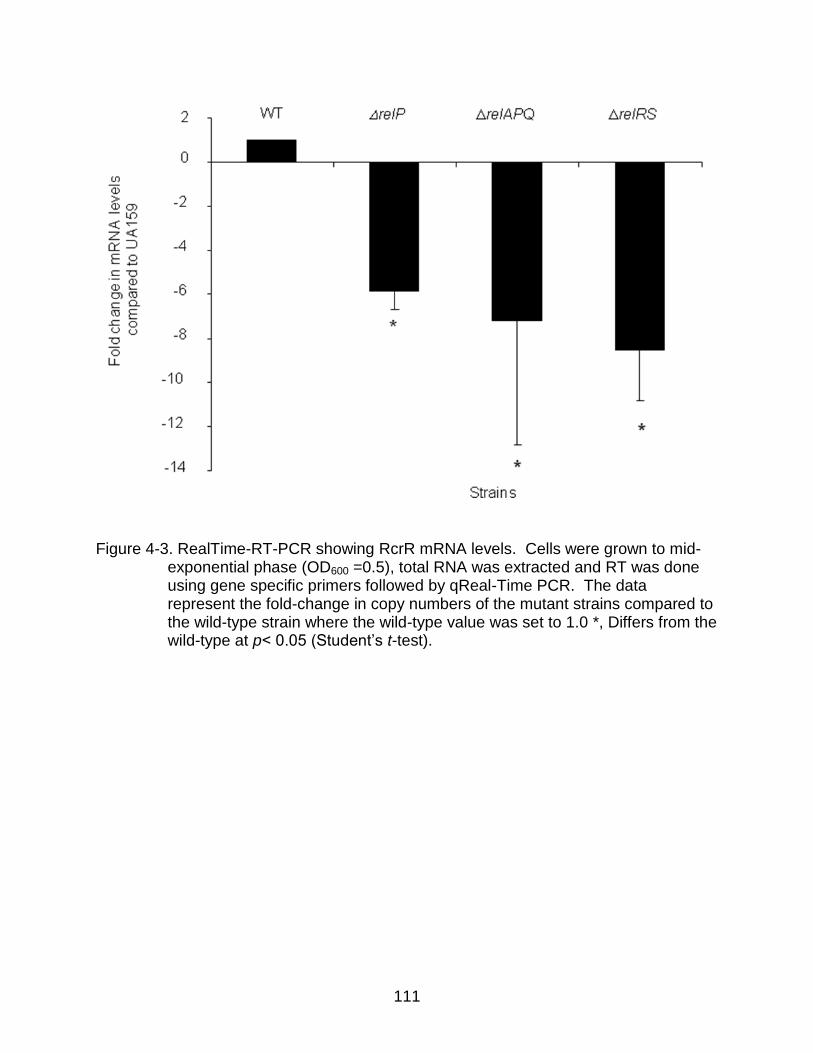
111
Figure 4-3. RealTime-RT-PCR showing RcrR mRNA levels. Cells were grown to mid-
exponential phase (OD600 =0.5), total RNA was extracted and RT was done using gene specific primers followed by qReal-Time PCR. The data represent the fold-change in copy numbers of the mutant strains compared to the wild-type strain where the wild-type value was set to 1.0 *, Differs from the wild-type at p< 0.05 (Student’s t-test).

112
Figure 4-4. RealTime-RT-PCR showing SMu0836 mRNA levels. Cells were grown to mid-exponential phase (OD600 =0.5), total RNA was extracted and RT was done using gene specific primers followed by qReal-Time PCR. The data represent the fold-change in copy numbers of the mutant strains compared to the wild-type strain where the wild-type value was set to 1.0.

113
Figure 4-5 CAT activity from the relP promoter. The relP promoter was fused to a promoterless cat gene in the pJL105 integration vector. The cat-promoter
fusion was transformed into the wild-type and 836p strains. In all cases cells were grown to mid -exponential phase (OD600 = 0.5) and CAT specific activity was measured as described in the methods section. The results are from three independent experiments performed in at least triplicate. *, Differs from the wild-type, p< 0.05 (Student’s t-Test)

114
Figure 4-6 CAT activity from the SMu0835 promoter. The SMu0835 promoter was
fused to a promoterless cat gene in the pJL105 integration vector. The cat-
promoter fusion was transformed into the wild-type and 836p strains. In all cases cells were grown to mid -exponential phase (OD600 = 0.5) and CAT specific activity was measured as described in the methods section. The results are from three independent experiments performed in at least triplicate. *, Differs from the wild-type, p< 0.05 (Student’s t-Test).

115
Figure 4-7. (p)ppGpp accumulation in mutant versus wild-type strains. Cells were grown to OD600 = 0.2 in FMC and labeled with 32P-orthophosphate. The cells were incubated for 1 h and (p)ppGpp was extracted using 13M formic acid. 2 x 10⁵ CPM of each sample was spotted to PEI-cellulose plates for TLC in 1.5 M KH2PO4 buffer. The data are a representative of n= 4 experiments. There was a similar trend observed in all cases.
Table 4-1. Percent change in GP4 (ppGpp) and GP5 (pppGpp) accumulation of mutant strains compared to the wild-type strain.
Strain % Change in IDV* of GP4 compared to the wild-type strain
% Change in IDV* of GP5 compared to the wild-type strain
∆relP 10% Reduction 43% Reduction ∆835np 26% Reduction 62% Reduction ∆836p 30% Reduction 45% Reduction
*IDV= Integrated Density Value of the Spots
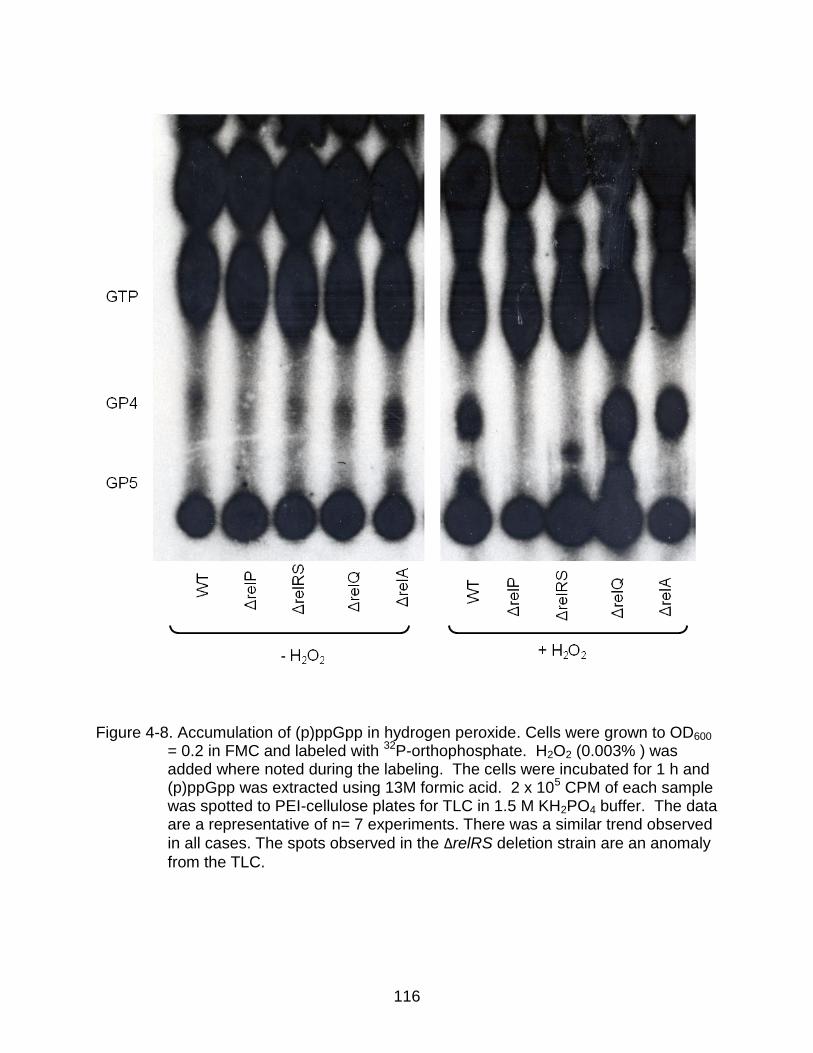
116
Figure 4-8. Accumulation of (p)ppGpp in hydrogen peroxide. Cells were grown to OD600
= 0.2 in FMC and labeled with 32P-orthophosphate. H2O2 (0.003% ) was added where noted during the labeling. The cells were incubated for 1 h and (p)ppGpp was extracted using 13M formic acid. 2 x 10⁵ CPM of each sample was spotted to PEI-cellulose plates for TLC in 1.5 M KH2PO4 buffer. The data are a representative of n= 7 experiments. There was a similar trend observed
in all cases. The spots observed in the ΔrelRS deletion strain are an anomaly
from the TLC.

117
Figure 4-9. The effect of hydrogen peroxide on LacZ activity from the relP promoter. The relP promoter was fused to a promoterless lacZ gene in the pMZ integration vector. The lacZ-promoter fusion was transformed into the wild-type strain. In all cases cells were grown to OD600 = 0.2. H2O2 (0.003%) was added to some of the samples and incubated for 1 hr. LacZ activity was measured as described in the methods section. The results are from three independent experiments performed in at least triplicate. **, Differs from the wild-type, p< 0.005 (Student’s t-Test)

118
Figure 4-10. Schematic of the potential regulation of the relPRS operon by different environmental cues and potential cross regulation with the rcrRPQ operon. Under stress conditions, the rcr operon is derepressed to upregulate rcrPQ encoding the exporters causing the extrusion of substances. The RelRS TCS may be sensing these substances in addition to oxidative stress to regulate (p)ppGpp production by RelP.
119
CHAPTER 5 THE EFFECT OF SMU0835-0837 ON THE COMPETENCE REGULON
Introduction
S. mutans is naturally competent, and elements of the competence regulon have
been linked to stress tolerance and biofilm formation (127, 129). The induction of
competence is a specifically timed event linked to the accumulation of peptide signals
and environmental stresses. Studies done with S. mutans have shown that
competence and acid tolerance, one of the key virulence factors of S. mutans, are
intimately linked. In particular, mutants lacking components of the competence
signaling pathway had a diminished ability to grow at low pH (127). The simplest
description of the model for development of competence in some streptococci involves
quorum sensing of a secreted peptide by a two-component system, which triggers a
cascade of expression of early and late competence genes involved in DNA uptake and
recombination. However, recent studies reveal that the mechanisms underlying the
regulation of the competence pathway in S. mutans are more complex, and that much
remains to be understood about the signals, signal transduction systems and additional
regulatory pathways affecting competence (8). It is now known that another peptide
signaling pathway, ComRS, is the proximal regulator of comX in S. mutans (149).
Previous work done in our lab revealed that multiple signals are required for efficient
activation of competence genes through the CiaRH and ComDE two-component
systems. ComDE regulates competence by sensing CSP levels, whereas CiaRH
appears to be involved in sensing as-yet-undefined signals in a CSP-independent
manner. The expression of comYA and comX are only highly induced when both CSP
and horse serum (HS) are present, compared to the addition of CSP or HS alone,

120
indicating that signals present in HS, possibly additional peptides, regulate competence
genes in conjunction with CSP. (8). Therefore, there are multiple parallel systems
regulate the competence network in S. mutans.
In addition to the slow growth phenotype observed in the various strains with
rcrRPQ mutations, a loss in the ability to take up DNA was seen in the ∆835np strain,
and a hyper transformable phenotype was observed in the ∆835p strain. Therefore, the
mutations in the rcrRPQ operon appeared to affect the ability of the cells to uptake
DNA. In addition, the CipI immunity protein, which is encoded downstream of the
rcrRPQ operon, is upregulated in high levels of CSP. The relPRS operon, which based
on our data is linked to rcrRPQ opero, is also affected by high levels of CSP. Based on
these data, the linkage of the rcrRPQ operon to the competence regulon and the ability
of the rcrRPQ mutants to take up DNA were carefully assessed.
Results
Competence Defect in rcrRPQ Mutants.
The transformation efficiency of the mutants was strongly dependent on the
expression of rcrR and on the expression levels of the rcrPQ, which encode the
exporters (Table 5-1). Specifically, when compared with the wild-type strain, the Δ836p
mutant, lacking both ABC exporters, had lower transformation efficiency when CSP was
provided (~10 fold decrease), but higher transformation efficiency than the parental
strain in the absence of CSP (~100 fold increase) (Table 5-1, 5-2). Of particular
interest, we were unable to obtain even a single transformant of the Δ835np strain,
which lacks the MarR-like regulator and overexpresses the ABC porter genes (Figure 5-
1, Figure 5-2), as well as the strain lacking all three genes (835-7np), regardless of
whether exogenous CSP was added or not (Table 5-1, 5-2). We also attempted to

121
transform the Δ835np and 835-7np mutants with plasmid pMSP3535 (32), which like
pDL278 is a shuttle vector, but it carries an erythromycin marker instead of
spectinomycin resistance, as well as with the pJL105 integration vector (Table 2-1). In
no case were transformants isolated (data not shown).
Interestingly, we also analyzed a mutant in which the ΩKm marker (8) was used to
replace the SMu0835 gene (835polar). qRT-PCR analysis of the ∆835p polar mutant
revealed that rcrP and rcrQ were expressed at levels similar to the wild-type strain
(Table 5-1, Figure 3-2, Figure 3-3, Figure 5-1). We determined that the expression of
the genes downstream of the polar marker did not arise from an internal promoter in
rcrR, since cloning of the 3’ portion of the rcrP gene behind a reporter gene gave no
detectable expression in S. mutans (data not shown). Instead, since loss of RcrR
caused roughly a 100-fold increase in the transcription of SMu0836-7 (Table 5-1, Figure
3-2, Figure 5-1), we believe that high level activation of the SMu0835 promoter in the
strain lacking the MarR-like regulator leads to more read-through of the terminator in the
ΩKm element. Thus, if the ΩKm terminator was roughly 99% efficient, then the
observed results would be expected. Importantly, the 835polar strain, lacking the
MarR regulator but expressing the exporters at levels that were essentially the same as
the wild-type strain, was hyper-transformable (Table 5-1, Table 5-2). In particular, even
in the absence of exogenously added sCSP nearly 104-fold more transformants were
obtained than with the wild-type strain (Table 5-1, Table 5-2).
To determine if the results were due to loss of the MarR-like transcriptional
repressor, as well as to changes in the transcription of the ABC porter genes, we
introduced a wild-type copy of the SMu0835 gene expressed from its own promoter on

122
the shuttle plasmid pDL278 into the ∆835p, ∆835np and ∆835-837np mutant strains
(Table 1, Figure 5-2). Complementation of the ∆835np and ∆835p mutants, strains
835+/∆835np (SJ361) and 835+/∆835p (SJ362), restored wild-type transformation
efficiency and wild-type levels of SMu0836 gene expression (Figure 5-1, Figure 5-2,
Table 5-2). However, introduction of the MarR-like regulator into the strain lacking all
three genes in strain 835+/∆835-7np (SJ360), which still lacked the SMu0836/7
transporters, did not restore transformation (Figure 5-3, Table 5-1). Clearly, then, the
absolute expression levels of the ABC transporter genes, as well as the presence of the
MarR-like regulator, are critical for competence development. Since it is not possible to
control the level of expression of complementing genes in S. mutans with any precision,
we did not complement the mutant strains with the ABC transport genes in this study.
Thus, a more reliable picture of the contribution of these gene products to stress
tolerance and their impact on competence was garnered by contrasting the behaviors of
the various polar and non-polar mutants, and complemented strains. Once the
substrate(s) for the porters is identified, efficiency of translocation of the substrate(s) by
particular mutants can be correlated with phenotype.
SMu0835-7(rcrRPQ) Affect comX and comY Expression.
To begin to understand the basis for the changes in the transformation efficiency
in strains with aberrant expression of the genes for the MarR-like regulator and ABC
transporters, we measured the expression of comD, comX and comYA in the different
mutant strains by qRT-PCR (8, 156). ComD is the response regulator in the two-
component system involved in sensing of CSP, comX encodes an alternative sigma
factor that is under the control of ComD, and comYA is required for competence
development and is transcriptionally activated by ComX. The qRT-PCR analysis

123
showed that the expression of comD was not affected in the mutant strains compared to
the wild-type strain (data not shown). In contrast, the expression of comYA was down-
regulated nearly 15-fold in the non-transformable Δ835np and 835-837np mutants,
and up-regulated by more than 100-fold in the hyper-transformable ∆835p polar strain
(Figure 5-4, Figure 5-5). Interestingly, the expression of comX was up-regulated nearly
100-fold in both the 835np and ∆835p mutant strains (Figure 5-6, Figure 5-7), but the
effect on comY expression in these strains was markedly different. Therefore, the
effects of mutations in, or changes in the expression levels of, Smu-0835-7 may affect
competence by interfering with ComX activation of comY. Also relevant is that
complementation analysis revealed that the 835+/∆835np and 835+/∆835p strains
expressed wild-type levels of comX and comYA (Figure 5-5, Figure 5-7).
Differences in Growth of Mutant Strains in the Presence of CSP
High levels of CSP (2 μM) have been shown to cause growth inhibition of the wild-
type strain of S. mutans. The CSP-induced growth inhibition has been shown to be
linked to comX levels, the induction of CipB bacteriocin and its immunity protein CipI,
which is encoded downstream of the rcrRPQ operon (175). In S. pneumoniae
competent cells produce lytic factors, such as bacteriocins which are targeted against
non-competent cells, as a phenomenon known as “pneumococcal fratricide”(44).
However, some of the mechanisms for growth inhibition are not known. The growth of
the mutants lacking rcrRPQ was tested with and without the addition of 2 μM CSP.
Interestingly, the ∆835p strain, which is hypertransformable, was more sensitive to
CSP-induced growth inhibition than the wild-type strain (Figure 5-8, Figure 5-9). The
wild-type strain had a lag time of 5 hours whereas the Δ835p strain had a lag time of 15

124
hours. However, the ∆835np strain, which is non- transformable, and the ∆836p strains
were more resistant to growth inhibition by CSP than the wild-type strain (Figure 5-8,
Figure 5-9). In fact, high levels of CSP impacted the growth of these strains very little.
The wild-type strain had a final OD of 0.5 whereas the ∆835np strain had a final OD of
0.7.
Discussion
Work presented herein adds a novel dimension to the control of genetic
competence in S. mutans, and likely in other naturally-competent streptococci, by
demonstrating that the RcrRPQ system plays a dominant role in modulating com gene
expression and transformation in S. mutans. Notably, even after the addition of HS and
CSP, no transformants could be obtained in the 835np mutant strain. The
transformation deficiency of the ∆835np strain was associated with decreased
expression of comYA and aberrant regulation of comX (Figure 5-4, Figure 5-6). The
addition of SMu0835 (rcrR) back into the ∆835np and ∆835p strains restored wild-type
levels of comX and comYA expression and wild-type transformation efficiency, whereas
complementation of the ∆835-837np strain did not restore transformability. One
explanation for the lack of transformation in the 835+/∆835-837np strain could be due to
the expression levels of rcrR. In the 835+/∆835-837np stain, rcrR was not expressed at
wild-type levels, but was actually overexpressed when present on plasmid pDL278
(Figure 5-1). Interestingly, we also constructed a strain in which we overexpressed rcrR
in a wild-type genetic background (Table 5-2, Figure 5-2). In this case, a reduction in
transformation efficiency (data not shown) and comYA expression (Figure 5-5) were
noted. Therefore, the complete lack of transformability in the 835+/∆835-837np

125
complemented strain, versus the behavior of the strain lacking only the ABC porter
genes (∆835-837np) may be related to overexpression of rcrR. Collectively, then, the
data support the idea that RcrR has the ability to influence the expression of the com
genes and transformation independently of the ABC transporters.
We propose that the way in which RcrR impacts competence is by negatively
regulating the expression of a factor that interferes with ComX activation of comY.
Specifically, it is established that ComX is required for activation of comYA expression
in response to CSP. However, particular mutants lacking RcrR (Figures 5-4 to 5-7)
display up-regulation of comX with concurrent down-regulation of comY. The simplest
explanation for these findings is that RcrR represses the expression of an anti-sigma
factor, similar to the model in Streptococcus pneumoniae in which ComX activity is
negatively controlled by the ComW anti-sigma factor, blocking activation of late com
gene expression (137, 216). Also, the lytic behavior of the cells in the presence of high
concentrations of CSP was previously shown to be dependent on ComX (175).
However, in both the ∆835np and ∆835p strains, comX levels were high but had
opposite growth phenotypes in the presence of high CSP (Figure 5-8, Figure 5-9). Of
note, the levels of comYA and transformation efficiency were more indicative of the lytic
behavior. High levels of comYA corresponded with higher transformation efficiency and
more susceptibility to growth inhibition by CSP.
The effect of the rcr system on comY and competence appears not only to be
affected by RcrR, but also to depend strongly on the level of expression of the rcrPQ
genes. In fact, one of the more intriguing aspects of this study is that defects in
transformation are evident both with the loss of, and the overproduction of, the ABC

126
porters. In particular, the ∆835polar mutant, which has no RcrR but expresses levels of
rcrPQ that are similar to the wild-type strain, for reasons explained in the results section,
has an opposite phenotype to that of the ∆835np strain, which overexpresses the rcrPQ
genes by >100-fold. In this case, the ∆835p polar mutant was hypertransformable and
displayed up-regulation of comY, whereas the ∆835np strain could not be transformed,
even when exogenous CSP was provided, and had low comY expression.
Furthermore, the ∆836p polar mutant, which had lost both porters, had reduced
transformation efficiency compared to the wild-type strain, reinforcing that the
appropriate expression of the exporters is necessary for efficient transformation.
The complementation data with the rcrR gene provide further evidence that
appropriate levels of the RcrPQ porters and proper regulation of the rcrRPQ operon are
necessary for efficient transformation. In addition, overexpression of the genes
encoding the porters, displayed a complete loss of transformation, as was seen in the
∆835np strain where the ABC porters are also overexpressed (199). Consequently,
whatever the RcrPQ exporters are externalizing is necessary for proper regulation and
development of competence. Of note, we tested the transformation efficiency of a
ΔcomC/Δ835p double knockout strain and observed a hypertransformable phenotype,
as was seen in the strain carrying only the Δ835p mutation, so the RcrPQ porters are
probably not affecting the production or secretion of ComC. Also, the signal(s) being
exported by these transporters have the potential to act from inside and/or outside the
cell, since rcrPQ expression can neither be too high or too low if efficient transformation
of cells is to occur.

127
Table 5-1. Summary showing mutant strains, SMu0835-837 mRNA expression levels and transformation efficiency compared to the wild-type strain.
Strain SMu0835 Expression
SMu0836 Expression
SMu0837 Expression
Transformation Efficiency +CSP
Transformation Efficiency –CSP
Δ835np Deleted 100-fold Increase
100-fold Increase
None* None
Δ835p Deleted Wild-type levels
Wild-type levels
10-fold Increase
104-fold Increase
Δ835-837np Deleted Deleted Deleted None None Δ836p Wild-type
levels Deleted 1000-fold
Decrease 10-fold Decrease 100-fold Increase
Δ836-837np Wild-type levels
Deleted Deleted 10-fold Decrease 100-fold Increase
835+/∆835np Wild-type levels
Wild-type levels
Wild-type levels
Wild-type levels Wild-type levels
835+/∆835p Wild-type levels
Wild-type levels
Wild-type levels
Wild-type levels Wild-type levels
835+/∆835-837np
10-fold Increase
Deleted Deleted None None
* None = Zero transformants were detected when 0.04 ml of the transformation mixture was plated directly onto selective medium

128
Table 5-2. Transformation efficiency of the wild-type and various mutants strains in the presence or absence of added CSP
Strain % Transformants* + CSP % Transformants – CSP
UA159 1.7 x 10⁻³ 1.44 x 10⁻⁶ Δ835np 0 0 Δ835p 4.0 x 10⁻² 1.0 x 10⁻² Δ835-837np 0 0 Δ836p 1.87 x 10⁻⁴ 2.39 x 10⁻⁴ Δ836-837np 1.61 x 10⁻⁴ 1.24 x 10⁻⁴ Δtpx np 3.25 x 10⁻³ 2.26 x 10⁻⁶
% transformants = (number of transformants/total viable bacteria) x 100. +CSP, exogenous CSP added; -CSP, no CSP added.

129
Figure 5-1. RealTime-RT-PCR showing SMu0836 (rcrP) mRNA levels. Cells were
grown to mid-exponential phase (OD600 =0.5), total RNA was extracted and RT was done using gene specific primers followed by qReal-Time PCR. The data presented as the copy number of each gene per µg of input RNA. *, Differs from the wild-type at P < 0.05 (Student’s t-test). These data were generated by Ann Sagstetter Decker in the summer of 2010, who was a dental student doing research on the rcrRPQ operon and competence

130
Figure 5-2. RealTime-RT-PCR showing SMu0835 (rcrR) mRNA levels. Cells were
grown to mid-exponential phase (OD600 =0.5), total RNA was extracted and RT was done using gene specific primers followed by qReal-Time PCR. The data presented as the copy number of each gene per µg of input RNA.*, Differs from the wild-type at p< 0.05 (Student’s t-test). **, Differs from the wild-type at p<0.005. These data were generated by Ann Sagstetter Decker in the summer of 2010, who was a dental student doing research on the rcrRPQ operon and competence.
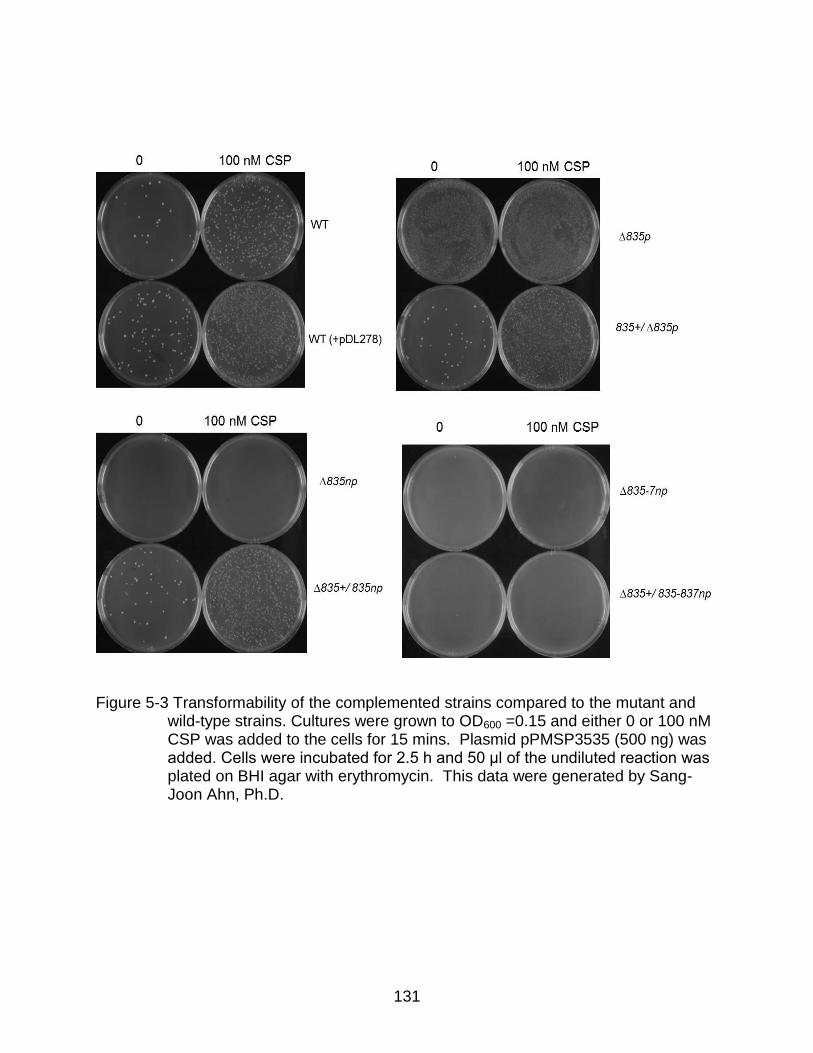
131
Figure 5-3 Transformability of the complemented strains compared to the mutant and wild-type strains. Cultures were grown to OD600 =0.15 and either 0 or 100 nM CSP was added to the cells for 15 mins. Plasmid pPMSP3535 (500 ng) was added. Cells were incubated for 2.5 h and 50 μl of the undiluted reaction was plated on BHI agar with erythromycin. This data were generated by Sang-Joon Ahn, Ph.D.

132
Figure 5-4. RealTime-RT-PCR showing comYA mRNA levels. Cells were grown to mid-exponential phase (OD600 =0.5), total RNA was extracted and RT was done using gene specific primers followed by qReal-Time PCR. The data presented as the copy number of each gene per µg of input RNA. *, Differs from the wild-type at p < 0.05 (Student’s t-test).

133
Figure 5-5. RealTime-RT-PCR showing comYA mRNA levels in complemented strains.
Cells were grown to mid-exponential phase (OD600 =0.5), total RNA was extracted and RT was done using gene specific primers followed by qReal-Time PCR. The data presented as the copy number of each gene per µg of input RNA. *, Differs from the wild-type at p<0.05. These data were generated by Ann Sagstetter Decker in the summer of 2010, who was a dental student doing research on the rcrRPQ operon and competence
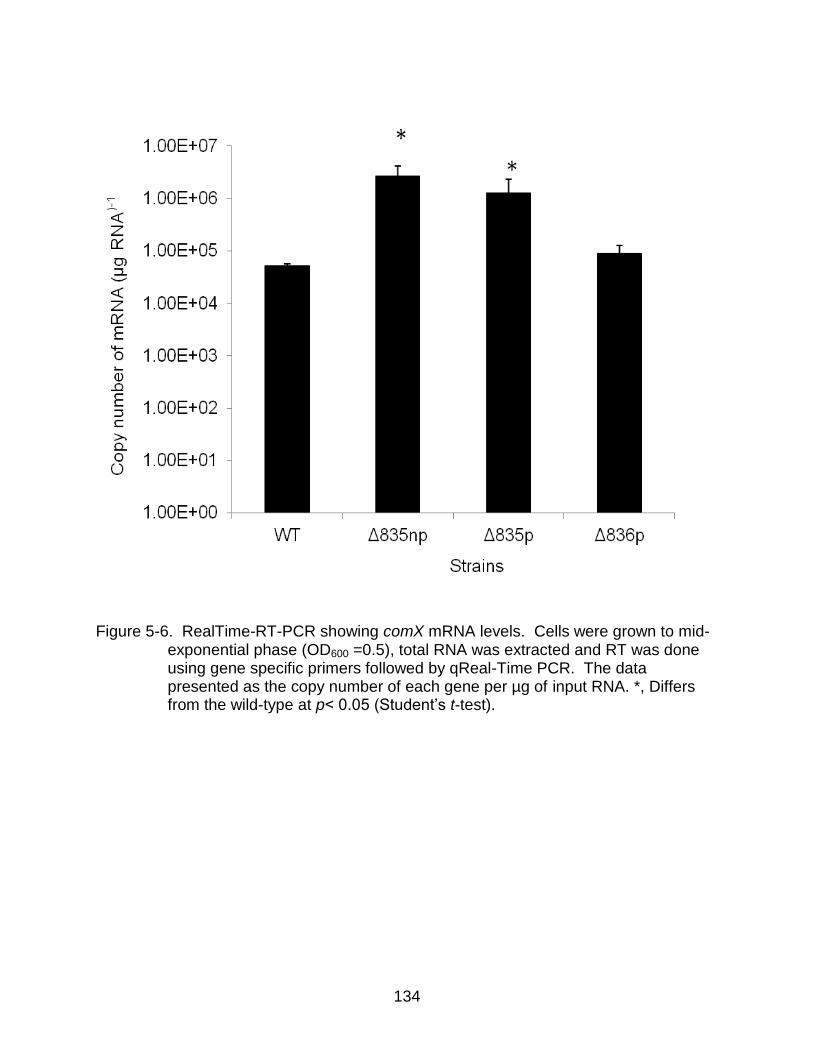
134
Figure 5-6. RealTime-RT-PCR showing comX mRNA levels. Cells were grown to mid-exponential phase (OD600 =0.5), total RNA was extracted and RT was done using gene specific primers followed by qReal-Time PCR. The data presented as the copy number of each gene per µg of input RNA. *, Differs from the wild-type at p< 0.05 (Student’s t-test).

135
Figure 5-7. RealTime-RT-PCR showing comX mRNA levels in complemented strains. Cells were grown to mid-exponential phase (OD600 =0.5), total RNA was extracted and RT was done using gene specific primers followed by qReal-Time PCR. The data presented as the copy number of each gene per µg of input RNA. *, Differs from the wild-type at p < 0.05 (Student’s t-test). This data were generated by Ann Sagstetter Decker in the Summer of 2010, who was a dental student doing research on the rcrRPQ operon and competence.

136
Figure 5-8. Growth comparison of wild-type versus mutant strains in BHI. The strains were grown in triplicate to mid-exponential phase in BHI broth, diluted 1:100 and transferred to fresh BHI broth, overlaid with sterile mineral oil and placed
in a Bioscreen C at 37°C to monitor growth. WT, diamonds; 835np ,
squares; 835 p triangles. The results are representative of three independent experiments performed triplicate.
Table 5-3. Table showing growth characteristics of the mutants versus the wild-type strain in BHI.
Strain WT Δ835np Δ835p Final OD 0.8 ± 0.02
0.78 ± 0.02
0.68 ± 0.027
Doubling Time (min)
41 ± 1.7
61± 8.5
101 ± 19.4
Lag time (h) 3 3 5
OD
600
Time (hrs)

137
Figure 5-9. Growth comparison of wild-type versus mutant strains in 2 μM CSP. The strains were grown in triplicate to mid-exponential phase in BHI broth, diluted 1:100 and transferred to fresh BHI broth containing 2 µM CSP, overlaid with sterile mineral oil and placed in a Bioscreen C at 37°C to monitor growth.
WT, diamonds; 835np , squares; 835p triangles. The results are representative of three independent experiments performed triplicate.
Table 5-4. Table showing growth characteristics of the mutants versus the wild-type strain in BHI + 2µM CSP.
Strain WT Δ835np Δ835p Final OD 0.51 ± 0.06
0.73 ± 0.02
0.54 ± 0.07
Doubling Time (min)
136 ± 9
69 ± 3, **
143 ± 34
Lag time (h) 3 3.5 15
**, Differs from the wild-type strain, at P<0.005.

138
CHAPTER 6 REGULATION OF GENE EXPRESSION AND COMPETENCE BY THE SMU0835
(RcrR) PROTEIN
Introduction
Our studies thus far have identified an uncharacterized operon which we named
rcrRPQ for rel competence related, which is involved in stress tolerance, (p)ppGpp
metabolism and competence. The rcrRPQ operon encodes a predicted DNA binding
protein from the MarR family of transcriptional regulators (RcrR) and two predicted ABC
efflux pumps are encoded by rcrP and rcrQ. It was found that loss of or changes in the
expression levels of the rcrRPQ operon elicited profound effects on the ability of the
bacteria to be transformed with chromosomal or plasmid DNA and on the expression of
selected early and late competence genes. RcrR was shown to be the dominant
regulator of the operon, and a deletion of the rcrR gene with a non-polar kanamycin
resistance marker (∆835np) caused the upregulation of the genes encoding the rcrPQ
efflux pumps by ~100-fold. Of note, the ∆835np mutant strain was no longer able to
take up DNA and the expression of comYA, which is critical for the development of
competence, was greatly reduced compared to the wild-type strain; even though comX
mRNA levels were very high. In contrast, a strain carrying a replacement of rcrR with a
polar kanamycin resistance cassette (∆835p) was constitutively hypertransformable,
and the comX and comYA genes were both significantly upregulated. Interestingly,
expression of the rcrPQ genes encoding the exporters in the ∆835p strain was similar to
wild-type levels for reasons explained in Chapter 5 (199). Therefore, based on the
phenotype displayed by the ∆835p and ∆835np strains, the tight regulation of the
production of the RcrPQ efflux pumps by RcrR and also RcrR itself appear to play
critical roles in the regulation of competence development. Additionally, in a strain

139
where extra copies of the gene encoding the rcrR regulator were expressed on the
pDL278 plasmid in a wild-type background (SJ354, Table 2-1), no transformants were
obtained in the absence of exogenous CSP (Figure 5-3), suggesting that this regulator
plays a key role in regulating the rcrRPQ operon and potentially other genes. However,
the mechanisms by which the rcrRPQ operon exerts multiple effects on competence
gene expression and how these gene products integrate competence with stress
tolerance and (p)ppGpp metabolism have not yet been identified.
MarR-type regulators have been shown to control the expression of many genes,
often those encoding efflux pumps, and have been shown to be important in stress
tolerance and adaptation to environmental stresses (60). Most MarR regulators prevent
gene expression by sterically interfering with RNA polymerase binding to the promoter
to block transcription (172). Since the previous findings show that RcrR has such a
profound effect on the rcrRPQ operon, DNA uptake and expression of competence
genes, it is essential to understand the mechanism by which RcrR regulates gene
expression and the physiology of the organism. Here, we examine the interactions of
the RcrR protein with potential target sequences in S. mutans and show that RcrR has
both direct and indirect roles in controlling competence, growth and stress tolerance.
Results
Identification of RcrR Binding Sites
Given the critical impact of the rcrRPQ genes on key virulence-related
phenotypes, dissecting the basis for regulation of the rcr operon and competence genes
by the RcrR protein is an essential step toward understanding alternative mechanisms
controlling the development of competence and regulating key aspects of cellular
physiology. Using EMSAs with purified recombinant RcrR (rRcrR) protein, it was shown

140
that a relatively small amount (2 pmoles) of rRcrR was able to impede the migration of a
140-bp PCR product containing the promoter region of rcrRPQ (Figure 6-1). To examine
more directly the interaction of RcrR with the rcr operon promoter region, we
demonstrated that DNA fragments that included as little as 87-bp immediately upstream
of the rcrR ATG start codon (data not shown) could be shifted with apparent high affinity
by purified rRcrR in EMSAs.
To further understand the interaction of RcrR with the promoter region of rcrRPQ,
we utilized RegPrecise (http://regprecise.lbl.gov/RegPrecise/browse_regulogs.jsp) to identify
a potential psuedopalindromic RcrR target ,TAGTTTTCATGAGAACTA (Figure 6-2) 51-
bp upstream of the start codon of rcrR, designated here as RS1. Another 15-bp region
(TAGTTTAAGGAATCA), designated RS2, was identified directly upstream of RS1
(Figure 6-2). A biotinylated DNA fragment that included only RS1 was not shifted by
rRcrR (Figure 6-3), but rRcrR was able to alter the electrophoretic mobility of a PCR
product that included RS1 plus 13 random base pairs added to the 5’ end of the probe
(Table 2-5, Figure 6-3). When the RegPrecise predicted binding site RS1 and the
potential weaker binding site RS2 were both included in the target DNA, >80% of the
DNA shifted when10 pmoles of rRcrR protein were present (Figure 6-3, Table 6-1).
There was also a shift in DNA when an annealed 38-bp biotinylated oligonucleotide that
only included the RegPrecise predicted site RS1, or a 55-bp oligonucleotide that
included both predicted sites (Table 2-5), was combined with purified rRcrR protein
(Figure 6-4, Table 6-2). The 55-bp fragment appeared to be bound slightly more
efficiently than the 38-bp fragment as >80% of the former shifted with 5 pmoles of RcrR
protein compared with approximately 46% of the latter. Unlabeled, annealed 38-bp and

141
55-bp probes were added in increasing proportions to 5 fmol of biotinylated 55-bp probe
and 1 pmol of purified protein. Both unlabeled probes were able to decrease the amount
of biotinylated DNA that was shifted (Figure 6-5, Table 6-3). In addition, preliminary
results assessing binding via fluorescence polarization using the same 38- and 55-bp
annealed probes that had been tagged with 6-FAM at the 5’ end of the reverse primer
indicated that the calculated binding constants for the two fragments exposed to
identical concentrations of rRcrR did not differ substantially; the estimated Kd for the 55-
bp fragment was 0.1 μM and the Kd for the 38-bp fragment was 0.06 μM.
Mutations in the Predicted Binding Sites Affect Binding of the RcrR Protein
Based on the results of the EMSAs detailed above, various mutations were
introduced into the RS1 and RS2 binding sites in the 5’ region of the rcrRPQ operon in
the S. mutans chromosome via splice overlap extension PCR and transformation (Table
2-1), and all mutations were confirmed by PCR and sequencing. Subsequently, DNA
from the promoter regions of the various mutant strains was obtained by PCR to
investigate the effect of the mutations on the ability of rRcrR protein to bind. When the
PCR product derived from the NBS1 strain, which had mutations in RS1, was used, a
decrease in the amount of shifting was observed (Figure 6-6, Table 6-4). When DNA
from the promoter region of the BBS strain, containing mutations in both binding sites
was used, there was about a 50% shift with 2.5 pmoles of protein and less than 50%
shift with 1.5 pmoles of protein, compared to 90% of the product derived from the wild-
type organism (Figure 6-7, Table 6-5). However, when the probe was derived from the
NBS2 strain, which had mutations only in the secondary predicted binding site (RS2),
there was no difference in the proportion of DNA shifted compared to the wild-type DNA
(Figure 6-8).

142
Mutations in the Binding Site of the rcrR Promoter Affect Competence.
Given the impact that perturbations in expression of any of the rcrRPQ genes has
on competence and the relatively inefficient binding observed for rRcrR to the mutated
binding sites in vitro, the transformation efficiency of the strains harboring the mutated
binding sites was assessed with and without addition of exogenous synthetic CSP. The
NBS1 strain, which has mutations in RS1 only (Table 2-1), displayed a 23-fold increase
in transformation efficiency in the absence of added CSP compared to the wild-type
strain (Table 6-6). This hypertransformable phenotype was similar to that observed for
the ∆835p strain (199). However, there was no difference between the NBS1 mutant
and the parental strain in transformation efficiency when 100 nM CSP was added to the
cultures (Table 6-6). Strain BBS, which had mutations in both RS1 and RS2, yielded no
transformants in the absence of exogenous CSP (Table 6-6), but a similar number of
transformants as the wild-type strain when CSP was included. Thus, mutation of the
predicted binding sites for RcrR influenced the transformation phenotypes. We
hypothesized that the different effects of the binding site mutations were associated with
different expression levels of the operon, because some mutations affect only RcrR
binding while others affect RcrR binding and promoter activity.
Effect of the Mutations on Promoter Activity.
To test the hypothesis that the mutations might impact both RcrR binding and
promoter activity, lacZ-promoter fusions were made with DNA from the promoter
regions of strains WT, NBS1 and BBS. β-galactosidase assays showed that there was
increased activity with the PBBS promoter from the strain with mutations in both RS1 and
RS2 (159 ±15 Miller units) compared to the PWT promoter (69 ±7.3 Miller units) (Figure
6-9), but only a slightly elevated level of expression from the PNBS1 promoter (88 ± 7.4
143
Miller units). Therefore, the activity of the rcrRPQ promoter is affected differently in the
binding site mutants, and this in turn influences the competence phenotype. We also
concluded that the way that RNA polymerase interacts with the promoters in the BBS
and NBS1 strains is different resulting in variations in the promoter activity.
Mutations in the rcrR Binding Site Affect comX, comS and comYA Expression
To determine if the phenotypes of the binding site mutants could be associated
with com gene expression levels, we used qRT-PCR to measure the mRNAs for comX,
comS and comYA, which are critical genes in the development of competence. The
NBS1 strain, which was hyper-transformable, had an approximate 30-fold increase in
the expression of comYA and about a 20-fold increase in expression of comS,
compared to the wild-type strain (Figure 6-10, Figure 6-11). The magnitude of the
change in expression of comYA and comS was similar to that observed in the ∆835p
strain [(199), Figure 6-10]. There was also about a 4-fold increase in comX expression
in the NBS1 strain compared to the wild-type strain (Figure 6-12). The levels of comYA
were slightly lower in the BBS strain, albeit not statistically different from the wild-type
strain (Figure 6-10), following a trend similar to that observed for the ∆835np strain
(199).
Effect of the Mutations in the rcrR Binding Site on rcrR and rcrP Expression
Previously, we showed that the expression of the com genes was dependent on
the expression of the rcrRPQ operon (199). Mutations in the RcrR binding site affected
the ability of rRcrR to bind efficiently, and β-galactosidase activity from promoters with
mutations in the RcrR binding site was significantly higher than activity from the wild-
type promoter. Therefore we used qRT-PCR to measure the mRNAs for rcrR and rcrP
in the NBS1 strains and the BBS strains. There was no significant difference in the

144
expression of rcrR or rcrP in the NBS1 strain or the BBS strain compared to the wild-
type expression levels (Figure 6-13, Figure 6-14).
Mutations in the Predicted RcrR Binding Site Affects Growth in CSP
Physiologically high concentrations of CSP (2 μM) have been shown to cause
apparent inhibition of growth of S. mutans (57, 187, 233), in part due to cell lysis and the
induction of the CipB bacteriocin. Of note, the CipI protein confers resistance to CipB
and is encoded about 1 kbp downstream of rcrRPQ. Our previous findings show that
strains with mutations in the rcrRPQ operon grew differently than the wild-type strain in
the presence of 2 μM CSP. In particular, and consistent with the transformation
phenotypes, the ∆835np strain was resistant to CSP-induced growth inhibition, whereas
the ∆835p strain was hypersensitive to CSP. Interestingly, the NBS1 strain was more
sensitive to CSP, as noted by a slight decrease in growth rate with a minimum doubling
time of 87 ± 6 min, compared to the wild-type strain with a minimum doubling time of 82
± 10min (Figure 6-15, Figure 6-16). However, the wild-type strain attained a final OD600
= 0.55 ± 0.012, whereas the NBS1 strain reached a final OD600 of only 0.45 ± 0.07. The
BBS strain was more resistant to CSP induced growth inhibition (Figure 6-16) when
compared to the parental strain, with a final yield of OD600 = 0.7 ± 0.011 in CSP and
minimum doubling time of 56 ± 3 min (p-value <0.005 compared to the wild-type
doubling time). Of note, expression of rcrR from its cognate promoter on a multi-copy
plasmid in a wild-type genetic background also conferred resistant to CSP-induced
growth inhibition (Figure 6-17), with the overexpressing strain achieving a final yield of
OD600 = 0.85, compared to the wild-type strain with a final yield of OD600 = 0.65.

145
Global Regulation by the RcrR Regulator
Mutations of rcrR and aberrant expression the RcrPQ exporters affect genes in the
competence pathway and impacts (p)ppGpp metabolism (199). Here, we utilized RNA -
seq and microarray analysis to show that numerous genes that are critical for the
development of competence are regulated by the rcrRPQ genes (Tables 6-7,6-8,6-9).
The most upregulated regulated genes in the hypertransformable ∆835p strain were
comX, comY, comF, and comEA, but in the non-transformable ∆835np strain (Table 6-
9) comYA was among the most downregulated genes in a microarray study (Table 6-7).
Our previous qRT-PCR studies also showed that comYA, comX and comS are affected
by mutations in the rcrRPQ operon (199) and that a strain that overexpresses rcrR also
causes a decrease in transformation and diminished sensitivity to growth inhibition by
CSP (Figure 6-16, Figure 6-17).
RcrR Has A Weak Interaction With the comX and relP Promoter Region
Since the deletion of rcrR had dramatic effects on the expression of many of the
genes in the competence pathway and other genes, we scanned for genes with RS1/2
sites and conducted EMSAs to determine if the effects on the expression of particular
genes could be exerted directly by the binding of RcrR to the promoter regions of these
genes. The promoter regions of relP, comX and comY had sequences with weak
similarity to the RS1 binding site based on the wMATCHER software analysis to find
target sequences. Purified rRcrR protein was able to bind to the promoters of comX,
and relP, albeit with apparently lower affinity than to the promoter of the rcrRPQ operon
(Figure 6-18, Figure 6-19) as well as comYA (data not shown). Specifically, there was
approximately a 10% shift of the comX and relP promoter regions when 20 pmoles of
rRcrR was utilized, compared to 100% shift with 10 pmol of rRcrR when the rcrRPQ

146
promoter was the target. As a negative control, we utilized the promoter of fruA,
encoding a polysaccharide hydrolase that is not affected by mutations in the rcr genes,
and observed no shift in mobility even with as much as 100 pmol of purified protein.
Discussion
The development of competence by S. mutans is a tightly regulated process that is
influenced by multiple regulatory factors and inputs, many of which have yet to be
characterized. Competence is considered to be a stress response and its induction in
bacteria has been linked to translational errors, (p)ppGpp production, antibiotic stress,
bacteriocin production and oxidative stress (61, 175, 199). The rcrRPQ operon is also
involved in stress tolerance, particularly oxidative stress, and has a profound effect on
competence; constituting a regulatory circuit for competence that was previously
undiscovered (199). The studies described in this chapter provide novel insights into the
mechanisms by which the products of the rcrRPQ operon integrate competence stress
tolerance and growth regulation with genetic competence.
The simplest model for regulation of the rcrRPQ operon is that the RcrR regulator
binds the promoter region of rcr to repress the operon. Based on the EMSA data, the
Regprecise predicted binding site (RS1) TAGTTTTCATGAGAACTA is the major binding
site, since oligonucleotides containing that region were sufficient to support rRcrR
binding. The sequence of RS1 is similar to typical MarR binding sites, which usually
consist of palindromic or psuedopalindromic sequences (236). Further support for the
model was gleaned by demonstrating that mutations in RS1 caused attenuated binding
of the rRcrR protein in vitro and had effects in vivo on transformation efficiency, growth
and gene expression that were similar to what would be predicted for loss of RcrR. The
weaker predicted binding site (RS2), TAGTTTAAGGAATCA does not appear to be

147
necessary for binding, at least in vitro, since mutations made only in that site did not
affect rRcrR binding. Mutations in RS2 also did not affect the organism in any
discernable way. However, when both predicted binding sites are present, a greater
percentage of DNA is shifted, perhaps reflecting that binding can be enhanced by the
second binding site through cooperative interactions. We also noted that rRcrR
binding, like that of many regulators of the MarR family, bound more efficiently when
additional sequences of 5 to 30-bp were provided adjacent to the binding site (236).
Mutations to the binding site in the promoter region of rcrRPQ operon caused the
strains to have differences in transformability and aberrant expression of the com genes
compared to the wild-type strain. Based on our previous findings that revealed a
dominant role for the RcrR protein on transformation and expression of the rcr operon
and com genes (199), we conclude that the inability of RcrR to bind effectively to its
target sequences to control rcrRPQ operon expression levels resulted in the changes in
transformability, com gene expression and growth. However, we did not detect any
significant changes in the expression of the rcrRPQ operon in the NBS1 and BBS
strains via qRT-PCR (Figure 6-13, Figure 6-14) even though we detected higher
promoter activity in these strains compared to the wild-type strain. We posit using gene
fusion that the qRT-PCR was not sufficiently sensitive to measure biologically significant
changes in the expression of the operon, and that even small fluctuations in the
expression levels of rcrRPQ may account for observable differences in transformation
efficiency and com gene expression. A large increase in the expression of rcrPQ was
seen in the ∆835np strain because the gene encoding RcrR was disrupted which
resulted in complete derepression of the operon (199). Notably, the BBS strain which

148
had the highest promoter activity as a result of derepression, had a similar phenotype to
the ∆835np strain. In addition, in the SJ354 strain, where there were extra copies of
rcrR expressed in a wild-type genetic background, there was not a huge impact on the
expression of rcrPQ, but there was a significant effect on growth in CSP, transformation
efficiency and comYA levels (199). Our previous findings also indicate that any changes
to the levels of the gene encoding RcrR affected transformability and the expression of
some of the com genes (199). Collectively, these data show the important role that
RcrR and efficient binding of RcrR to its cognate DNA sequences have on
transformation and expression of the competence genes.
Consistent with the phenotype displayed with strains harboring various mutations
in rcrR, microarray and RNA-seq revealed that genes in the competence pathway are
the most differentially regulated when there are mutations in rcrR. The basis for this
change in expression could be due to a weak interaction of RcrR with the promoters of
these genes, since weak binding of rRcrR protein in vitro to the comX and comYA
promoters was observed. Many MarR type regulators have co-factors, such as
biochemical intermediates or other small molecules that may be present in vivo that
affect binding to DNA to control gene expression (172). Therefore, there may be other
factors in vivo that affect binding of RcrR to the com genes that were absent in the
EMSA analysis so RcrR could probably play a significant role in regulating com genes.
Importantly, the rcrRPQ operon was shown to be involved in stress tolerance and its
expression was enhanced in response to environmental insult (123, 199).
Consequently, as part of our working model (Figure 7-1), the impact of RcrR on com
gene expression may be enhanced when rcrRPQ become derepressed.

149
The difference in growth phenotype of the mutant strains in CSP is more than
likely linked to the changes in expression of the competence genes in these strains. It
has been previously shown that inactivation of certain com genes analyzed in this study
cause the cells to become insensitive to CSP induced growth inhibition (175). Also, we
have observed that expression of the com genes becomes insensitive to added CSP in
the rcrRPQ mutants, unlike in the wild-type strain where com genes are induced by
CSP (data not shown). Of note, comX mRNA levels were high in strains that were both
resistant and sensitive to CSP-induced growth inhibition, which is a surprising finding
since it is believed that the induction of comX correlates with lysis and growth inhibition
by CSP (117). However, the levels of comY correlate well with the sensitivity to CSP in
the strains tested here, as does transformation. The sensitive strains such as ∆835p
and NBS1 were hypertransformable and had high levels of comYA compared with the
resistant strains, such as BBS and ∆835np, which had lower levels of comYA and were
poorly- or non-transformable. Our previous findings (199) and the transcriptional
profiling with rcrR mutants presented in this study clearly show that the activity of ComX
is affected in the CSP-resistant ∆835np strain, even though comX expression is high
comY levels are low (199). Therefore, it appears that ComX-dependent activation of
comY and other downstream genes is critical for growth sensitivity to CSP. It is known
that fratricide or cell death is necessary for the induction of competence in S.
pneumoniae biofilms (229) and we also see a correlation with transformability and
sensitivity to CSP. The induction of bacteriocins was also linked to cell lysis and growth
inhibition with high levels of CSP (175, 233). The rcrRPQ operon also appears to be
impacting the expression of the bacteriocin genes and bacteriocin production (Ahn et

150
al.. manuscript in preparation) and the RNA-seq data show that at least two bacteriocin-
related genes were upregulated in the ∆835p strain (Table 6-9). Therefore, the effect
that the rcrRPQ operon exerts on the bacteriocins and their immunity proteins may be
part of the explanation for the differences in growth in CSP.
While the data clearly provide evidence of a direct role for RcrR in competence
regulation, the expression levels of the genes encoding the rcrPQ pumps, which are
under the dominant control of RcrR, must be acknowledged as a major factor controlling
late com gene expression and transformation efficiency (199). An ∆836p strain, which
lacks rcrP and expresses 1000-fold lower levels of rcrQ ABC pumps than the ∆836np
strain, had higher levels of comYA and higher transformation efficiency than the wild-
type strain without additional CSP (199). In addition, we have data showing that
overexpression of the ABC exporters causes a dramatic reduction in transformation
efficiency and affects the expression of the competence genes (Ahn et al., manuscript in
preparation). These data further support our hypothesis that the efflux pumps may be
extruding a compound necessary to activate competence. This signal could function in a
similar manner to the competence sporulation factor (CSF) in B. subtilis (141, 206) or
act as an anti-anti-sigma factor that interferes with a factor, such as ComW, that impairs
ComX stability and activation of comYA, as seen in S. pneumoniae (137, 216). The
inability of RcrR to bind efficiently to the promoter of the rcr operon and differences in
promoter activity could result in slight alterations in the amount of localization of the
substrate(s) in the NBS1 and BBS strains. The signal(s) probably need to be balanced
carefully where slight fluctuations in their localization can result in differences in the
expression of the competence genes and transformation efficiency. Current efforts are

151
focused on identifying small molecules that RcrPQ are extruding and other factors that
interact with RcrR.
In conclusion, the current findings in this chapter in addition to our previous
findings show that tight control of the rcrRPQ operon by RcrR interacting with its binding
site in the promoter region strongly influences the expression of the competence genes
and transformation. We also show RcrR is a master regulator and may directly influence
com gene expression, as well as relP, by interacting with their promoters. The potential
for RcrR to interact with the relP promoter may be one of the explanations for the
linkage of the rcrRPQ operon to (p)ppGpp metabolism, as previously reported (199). As
part of our working model, we propose that competence and RelP-dependent (p)ppGpp
metabolism are both controlled by RcrR and the rcrRPQ operon to fine tune how the
organism responds to different environmental signals (Figure 7-1,7-2). It is also
reasonable to hypothesize that RcrRPQ and the RcrPQ substrate(s) could play an
important role in bi-stable behavior associated with CSP and competence, as well as
influencing decisions by the cell to become competent or lyses. Thus, RcrRPQ may
provide the potential missing link between the ComRS and CSP signaling pathways, as
well as between bacteriocin production and competence development, as proposed by
Lemme et al., Levesque and co-workers, and the Morrison group (57, 63, 116).
.

152
Figure 6-1. EMSA showing binding of biotinylated regions of PrcrR DNA with purified RcrR protein. Purified RcrR protein of various concentrations (0, 2.5, 5, 10, 20 pmoles, Lanes 1-5) was added to 5 fmoles of biotinylated PrcrR DNA in a binding reaction for 40 min. The reactions were run on a non-denaturing polyacrylamide gel and the signal observed via chemiluminescence.
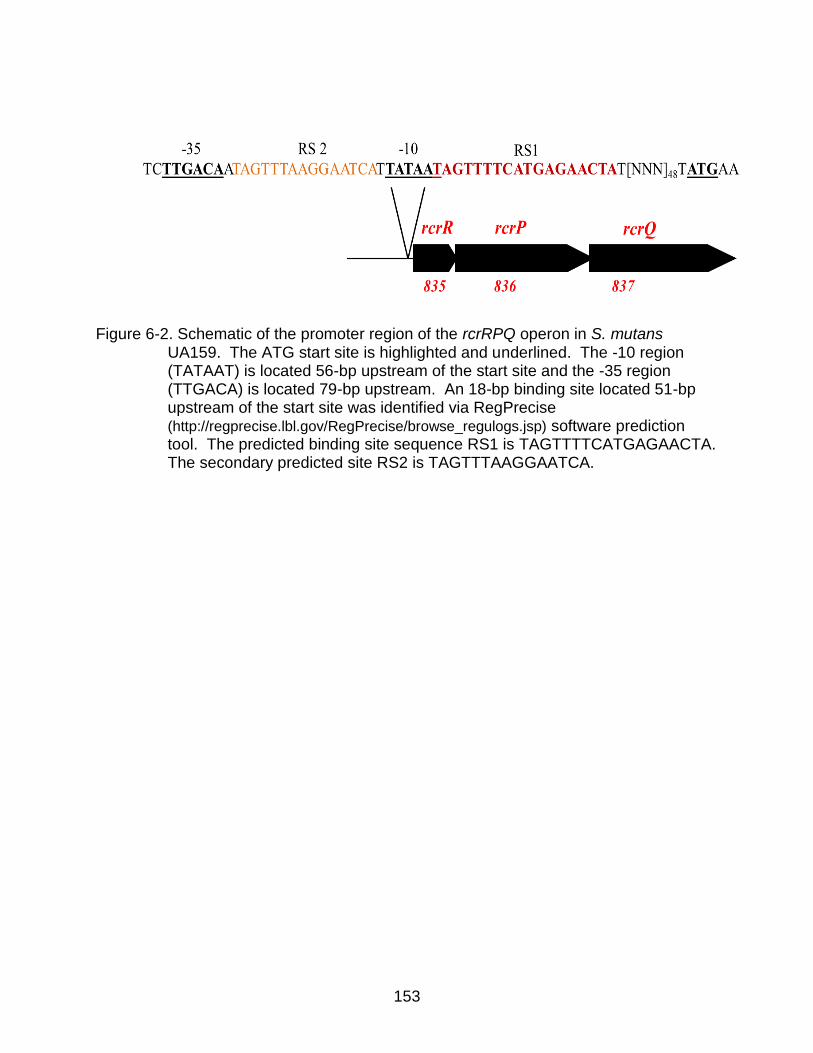
153
Figure 6-2. Schematic of the promoter region of the rcrRPQ operon in S. mutans UA159. The ATG start site is highlighted and underlined. The -10 region (TATAAT) is located 56-bp upstream of the start site and the -35 region (TTGACA) is located 79-bp upstream. An 18-bp binding site located 51-bp upstream of the start site was identified via RegPrecise (http://regprecise.lbl.gov/RegPrecise/browse_regulogs.jsp) software prediction tool. The predicted binding site sequence RS1 is TAGTTTTCATGAGAACTA. The secondary predicted site RS2 is TAGTTTAAGGAATCA.

154
Figure 6-3. EMSA showing binding of biotinylated PCR products of PrcrR with purified
RcrR protein. Purified RcrR protein(10 pmol) was added to 5 fmoles of biotinylated PrcrR PCR products RS, RS1+ random and RS1+2 in a binding reaction for 40 min. The reactions were run on a non-denaturing polyacrylamide gel and the signal observed via chemiluminescence. The data are a representative of n=3 EMSAs. There was a similar trend observed in all cases.
Table 6-1. Percentage of DNA shifted with different PCR products of the promoter of rcrR
RS1 RS1 + random RS1 + 2
0% shift 61% shift 83% shift
% shift calculated as % reduction in the integrated density value (IDV) of the DNA bands compared to the IDV of unshifted DNA band with no protein.

155
Figure 6-4. EMSA showing binding of biotinylated oligos of PrcrR DNA with purified RcrR
protein. Purified RcrR protein of various concentrations was added to 5 fmoles of biotinylated PrcrR DNA fragments 38 bp and 55 bp in a binding reaction for 40 min. The reactions were run on a non-denaturing polyacrylamide gel and the signal observed via chemiluminescence. The data are a representative of n=2 EMSAs. There was a similar trend observed in both cases.
TABLE 6-2. Percentage of DNA shifted with different annealed oligos in the promoter of rcrR
Region 1.5 pmol RcrR 2.5 pmol RcrR 5 pmol RcrR
38- bp 20% shift 20% shift 46% shift
55- bp 43% shift 74% shift 83% shift
% shift calculated as % reduction in the integrated density value (IDV) of the DNA bands compared to the IDV of unshifted DNA band with no protein.

156
Figure 6-5. EMSA showing competitive binding of biotinylated regions of PrcrR DNA with
unlabeled regions of Prcr DNA and purified RcrR protein. Purified RcrR protein (1 pmol) was added to 5 fmoles of biotinylated PrcrR DNA fragment 55 bp with increasing concentration of unlabeled Prcr DNA fragments in a binding reaction for 40 min. The reactions were run on a non-denaturing polyacrylamide gel and the signal observed via chemiluminescence. The data are a representative of n=2 EMSAs. There was a similar trend observed in both cases.
Table 6-3. Percentage of labeled PrcrR DNA shifted with unlabeled oligo competitors of PrcrR DNA
Unlabeled region 0 x unlabeled DNA 10 x unlabeled DNA 50 x unlabeled DNA
38-bp 59% shift 31% shift 10% shift
55-bp 59% shift 27% shift 14% shift
% shift calculated as % reduction in the integrated density value (IDV) of the DNA bands compared to the IDV of unshifted DNA band with no protein.

157
Figure 6-6. EMSA showing binding of biotinylated PNBS1 mutated regions of PrcrR DNA
with purified RcrR protein. Various concentrations of RcrR protein was added to 5 fmoles of biotinylated wild-type PrcrR DNA fragment (PWT) and mutated Prcr DNA fragment (PNBS1) in a binding reaction for 40 min. The reactions were run on a non-denaturing polyacrylamide gel and the signal observed via chemiluminescence. The data are a representative of n=3 EMSAs. There was a similar trend observed in all cases.
Table 6-4. Percentage of PWT DNA vs. PNBS1 DNA shifted at different protein concentrations
Protein concentration % shift of PWT DNA % shift of PNBS DNA
2.5 pmol 54% shift 27% shift
5 pmol 90% shift 46% shift
% shift calculated as % reduction in the integrated density value (IDV) of the DNA bands compared to the IDV of unshifted DNA band with no protein.

158
Figure 6-7. EMSA showing binding of biotinylated PBBS mutated regions of PrcrR DNA with purified RcrR protein. Various concentrations of RcrR protein was added to 5 fmoles of biotinylated wild-type PrcrR DNA fragment (PWT) and mutated Prcr DNA fragment (PBBS) in a binding reaction for 40 min. The reactions were run on a non-denaturing polyacrylamide gel and the signal observed via chemiluminescence. The data are a representative of n=3 EMSAs. There was a similar trend observed in all cases.
Table 6-5. Percentage of PWT DNA vs. PBBS DNA shifted at different protein concentrations
Protein concentration % shift of PWT DNA % shift of PBBS DNA
1.5 pmol 76% shift 5% shift
2.5 pmol 87% shift 29% shift
5 pmol 95% shift 92% shift
% shift calculated as % reduction in the integrated density value (IDV) of the DNA bands compared to the IDV of unshifted DNA band with no protein.

159
Figure 6-8. EMSA showing binding of biotinylated PNBS2 mutated regions of PrcrR DNA
with purified RcrR protein. Various concentrations of RcrR protein was added to 5 fmoles of biotinylated wild-type PrcrR DNA fragment (PWT) and mutated Prcr DNA fragment (PNBS2) in a binding reaction for 40 min. The reactions were run on a non-denaturing polyacrylamide gel and the signal observed via chemiluminescence. The data are a representative of n=2 EMSAs. There was a similar trend observed in both cases.

160
Table 6-6. Transformation efficiency of the wild-type and SOE mutants strains in the presence or absence of added CSP
Strain % Transformants + CSP % Transformants - CSP
UA159 5.29 x 10⁻³ 9.33 x 10⁻⁶ NBS1 3.03 x 10⁻³ 2.18 x 10⁻⁴ NBS2 2.19 x 10⁻³ 4.76 x 10⁻⁶ BBS 1.1 x 10⁻³ 0
% transformants = (number of transformants/total viable bacteria) x 100. +CSP, exogenous CSP.

161
Figure 6-9. β-galactosidase activity from rcrR promoters that contained various
mutations. The rcrR promoters with the different mutations were fused to a promoterless lacZ gene in the pMZ integration vector. The lacZ-promoter fusion was transformed into the wild-type strain. In all cases cells were grown to mid -exponential phase (OD600 = 0.5) and β-galactosidase activity measured as reported in the methods section. The results are from three independent experiments performed in at least triplicate. *, Differs from the wild-type at p< 0.05 (Student’s t-Test). **, Differs from the PWT at p<0.005. !!, Differs from PNBS1 at p<0.005.

162
Figure 6-10. RealTime-RT-PCR showing comYA mRNA levels in strains with mutations in the RcrR binding site. Cells were grown to mid-exponential phase (OD600 =0.5), total RNA was extracted and RT was done using gene specific primers followed by qReal-Time PCR. The data are presented as log of the copy number of each gene per µg of input RNA. *, Differs from the wild-type at p< 0.05 (Student’s t-test). !, Differs from the NBS1 strain at p<0.05 (Student’s t-test).

163
Figure 6-11. RealTime-RT-PCR showing comS mRNA levels in strains with mutations in the RcrR binding site. Cells were grown to mid-exponential phase (OD600 =0.5), total RNA was extracted and RT was done using gene specific primers followed by qReal-Time PCR. The data are presented as log of the copy number of each gene per µg of input RNA. *, Differs from the wild-type at p< 0.05 (Student’s t-test). !, Differs from the NBS1 strain at p<0.05.
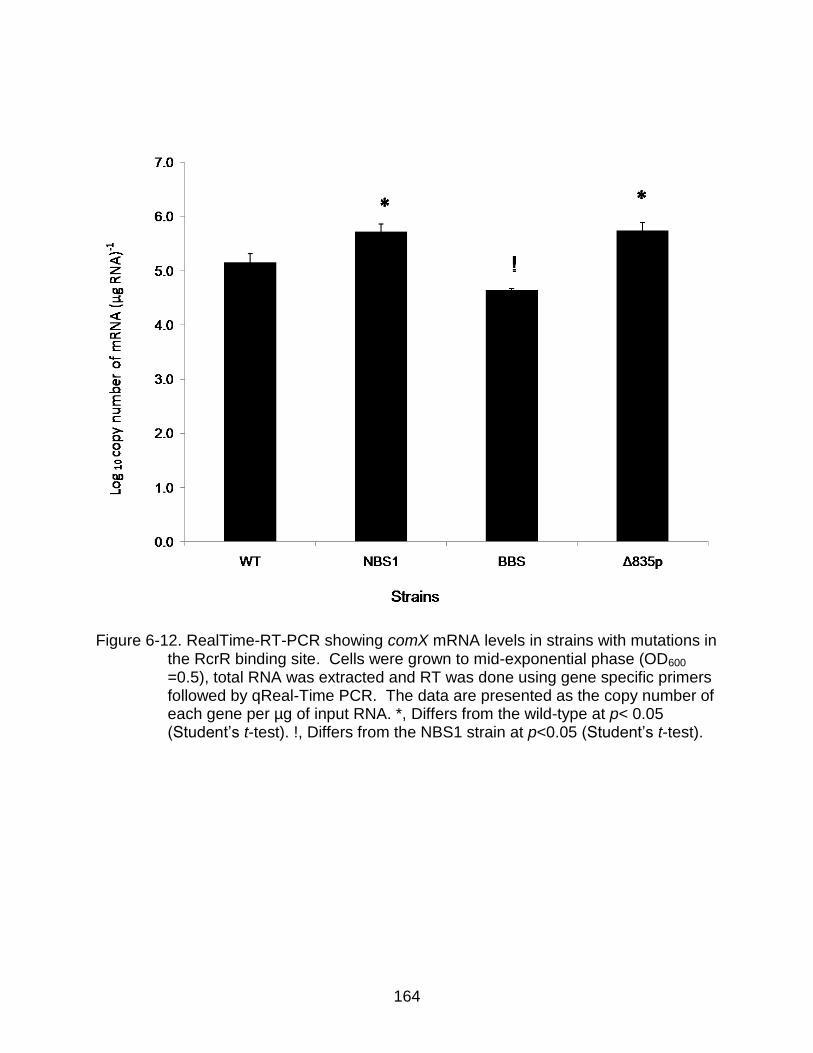
164
Figure 6-12. RealTime-RT-PCR showing comX mRNA levels in strains with mutations in
the RcrR binding site. Cells were grown to mid-exponential phase (OD600 =0.5), total RNA was extracted and RT was done using gene specific primers followed by qReal-Time PCR. The data are presented as the copy number of each gene per µg of input RNA. *, Differs from the wild-type at p< 0.05 (Student’s t-test). !, Differs from the NBS1 strain at p<0.05 (Student’s t-test).

165
Figure 6-13. RealTime-RT-PCR showing rcrR mRNA levels in strains with mutations in the RcrR binding site. Cells were grown to mid-exponential phase (OD600 =0.5), total RNA was extracted and RT was done using gene specific primers followed by qReal-Time PCR. The data are presented as the log of the copy number of each gene per µg of input RNA. **, Differs from the wild-type at p< 0.005 (Student’s t-test).

166
Figure 6-14. RealTime-RT-PCR showing rcrP mRNA levels in the strains with mutations in the RcrR binding site. Cells were grown to mid-exponential phase (OD600 =0.5), total RNA was extracted and RT was done using gene specific primers followed by qReal-Time PCR. The data are presented as the log of the copy number of each gene per µg of input RNA. *, Differs from the wild-type at p< 0.05 (Student’s t-test).

167
Figure 6-15. Growth comparison of wild-type and mutant strains in BHI. The strains
were grown in triplicate to mid-exponential phase in BHI broth, diluted 1:100 and transferred to fresh BHI broth, overlaid with sterile mineral oil and placed in a Bioscreen C at 37 °C to monitor growth. WT, diamonds; NBS1 , squares;
BBS triangles, Δ835np x’s and Δ835p *’s. The results are representative of
three independent experiments performed triplicate.

168
Figure 6-16. Growth comparison of wild-type vs. mutant strains in 2 μM CSP. The
strains were grown in triplicate to mid-exponential phase in BHI broth, diluted 1:100 and transferred to fresh BHI broth containing 2 µM CSP, overlaid with sterile mineral oil and placed in a Bioscreen C at 37 °C to monitor growth.
WT, diamonds; NBS1 , squares; BBS triangles, Δ835np x’s and Δ835p *’s.
The results are representative of three independent experiments performed triplicate. The statistical analysis on the doubling times and final ODs are detailed in the results section describing the growth phenotype.

169
Figure 6-17. Growth comparison of wild-type vs. SJ354 in 2 μM CSP. The strains were
grown in triplicate to mid-exponential phase in BHI broth, diluted 1:100 and transferred to fresh BHI broth containing 2 µM CSP, overlaid with sterile mineral oil and placed in a Bioscreen C at 37 °C to monitor growth. WT, squares; SJ354 . The results are representative of three independent experiments performed triplicate. These data were generated by Ann Sagstetter Decker in the summer of 2010, who was a dental student doing research on the rcrRPQ operon and competence.
0
0.1
0.2
0.3
0.4
0.5
0.6
0.7
0.8
0.9
1
0:0
0:1
6
1:0
0:1
7
2:0
0:1
7
3:0
0:1
7
4:0
0:1
7
5:0
0:1
7
6:0
0:1
7
7:0
0:1
7
8:0
0:1
7
9:0
0:1
7
10
:00
:17
11
:00
:17
12
:00
:17
13
:00
:17
14
:00
:17
15
:00
:17
16
:00
:17
17
:00
:17
18
:00
:17
19
:00
:17
20
:00
:17
21
:00
:17
22
:00
:17
23
:00
:17
24
:00
:17
OD
60
0
Time (h)

170
Figure 6-18. EMSA showing binding of the relP promoter with purified RcrR protein. Various concentrations of RcrR protein was added to 5 fmoles of biotinylated PrelP DNA fragment in a binding reaction, PrcrR and PfruA were added as positive and negative controls for RcrR protein. The reactions were run on a non-denaturing polyacrylamide gel and the signal observed via chemiluminescence. The data are a representative of n=2 EMSAs. There was a similar trend observed in both cases.

171
Figure 6-19. EMSA showing binding of the comX promoter with purified RcrR protein. Various concentrations of RcrR protein was added to 5 fmoles of biotinylated PrelP DNA fragment in a binding reaction, PrcrR and PfruA were added as positive and negative controls for RcrR protein. The reactions were run on a non-denaturing polyacrylamide gel and the signal observed via chemiluminescence. The data are a representative of n=4 EMSAs. There was a similar trend observed in all cases.

172
Table 6-7. Genes differentially regulated in the ∆835np strain vs. wild-type strain via
microarray analysis
Parametric p-value
Fold-change
Unique id Description Gene symbol
1.00E-07 24.8 SMU.1997 putative ComX1, transcriptional regulator of competence-specific genes comX1
< 1e-07 21.5 SMU.922 putative ABC transporter, ATP-binding protein
1.47E-05 11.0 SMU.923 putative ABC transporter, ATP-binding protein
1.15E-05 6.21 SMU.64 Holliday junction DNA helicase RuvB ruvB
1.60E-06 5.31 SMU.65 putative protein tyrosine-phosphatase
0.0014 3.14 SMU.1568 putative maltose/maltodextrin ABC transporter, sugar-binding protein MalX malX
0.0048 3.11 SMU.574c hypothetical protein
0.0006 3.00 SMU.67 putative acyltransferase
0.0004 2.91 SMU.537 tryptophan synthase subunit beta trpB
0.0004 2.90 SMU.66 hypothetical protein
0.0007 2.61 SMU.1056 hypothetical protein
0.003 2.59 SMU.924 thiol peroxidase tpx
0.002 2.54 SMU.534 anthranilate phosphoribosyltransferase trpD
0.0015 2.52 SMU.1079c putative ABC transporter, ATP-binding protein
0.001 2.41 SMU.535 indole-3-glycerol-phosphate synthase trpC
0.0039 0.344 SMU.1968c hypothetical protein
0.002 0.336 SMU.493 formate acetyltransferase (pyruvate formate-lyase 2) pfl2
0.0028 0.041 SMU.1982c hypothetical protein
7.16E-05 0.013 SMU.1985 ABC transporter ComYB comYB

173
Table 6-8. Genes differentially regulated in the ∆835np strain vs wild-type strain via RNA-seq analysis.
Gene ID Gene Description Fold Change (∆835np/WT) P value
SMU.1997c competence-specific sigma factor 37.1 1.80e-273
SMU.922 ABC-type multidrug / protein/ lipid transport system 16.6 9.31e-280
SMU.923 ABC-type multidrug/protein/lipid transport system 13.6 5.04e-246
SMU.09 small RNA binding protein 7.91 9.83e-56
SMU.43
conserved hypothetical protein (possible site-specific DNA-methyltransferase/restriction modification enzyme) 7.76 3.71e-31
SMU.1576c hypothetical protein 7.62 3.26e-21
SMU.44 conserved hypothetical protein 7.39 1.07e-25
SMU.64 Holliday junction DNA helicase 7.30 2.58e-139 SMU.1644c conserved hypothetical protein 7.11 1.20e-96
SMU.46 hypothetical protein 5.36 3.01e-07
SMU.65 protein tyrosine-phosphatase 4.98 1.51e-77
SMU.10 cell-division protein DivIC 4.55 0.0001 SMU.1343c polyketide synthase 4.02 9.74e-07 SMU.1250c hypothetical protein 3.90 6.81-22
SMU.66 conserved hypothetical protein; possible phosphatidylinositol-4-phosphate 5-kinase 3.71 2.65e-36
SMU.533 anthranilate synthase 3.62 3.81e-33 SMU.1161c conserved hypothetical protein 3.49 2.27e-11
SMU.438c (R)-2-hydroxyglutaryl-CoA dehydratase activator-related protein 3.46 6.53e-27
SMU.68 hypothetical protein 3.43 6.04e-12
SMU.534 phosphoribosyl anthranilate transferase 3.25 2.74e-39 SMU.1643c conserved hypothetical protein 3.24 1.06e-08 SMU.1340c
bacitracin synthetase 1/ tyrocidin synthetase III 3.22 2.71e-07
SMU.537 tryptophan synthase 3.22 2.24e-43
SMU.532 anthranilate synthase 3.09 3.93e-39
SMU.928 sensor histidine kinase 0.476 1.09e-06
SMU.463 thioredoxin reductase (NADPH) 0.438 6.04e-26 SMU.1692c pyruvate-formate lyase activating enzyme 0.426 4.65e-25
SMU.540 peroxide resistance protein / iron binding protein 0.422 1.16e-36
SMU.924 thiol peroxidase 0.414 2.42e-24
SMU.179 conserved hypothetical protein (possible oxidoreductase) 0.365 4.21e-10
SMU.494 transaldolase family protein 0.361 5.46e-16

174
Table 6-8. continued
Gene ID Gene Description Fold Change (∆835np/WT) P value
SMU.491 transcriptional regulator 0.356 2.23e-11 SMU.838 glutathione reductase 0.348 1.10e-41 SMU.148 alcohol-acetaldehyde dehydrogenase 0.329 3.05e-10 SMU.1955c co-chaperonin 10kDa 0.322 1.03-27 SMU.495 glycerol dehydrogenase 0.319 2.13e-27 SMU.460 amino acid ABC transporter 0.319 5.13e-22 SMU.629 superoxide dismutase 0.316 7.12e-64 SMU.996 ABC transporter 0.304 7.23e-06 SMU.120 50S ribosomal protein L28 0.302 4.94e-05 SMU.1703c conserved hypothetical protein 0.299 3.45e-07
SMU.961 macrophage infectivity potentiator-related protein 0.297 2.30e-19
SMU.1425c ATP-dependent Clp protease 0.295 4.72e-12 SMU.929c conserved hypothetical protein 0.292 3.35e-40 SMU.82 chaperone protein 0.285 4.56e-14
SMU.493 formate acetyltransferase (pyruvate-formate lyase) 0.282 7.74e-43
SMU.962 acyl-CoA dehydrogenase 0.239 6.88e-45 SMU.496c cysteine synthetase A 0.237 7.36e-17 SMU.1701c conserved hypothetical protein 0.236 0.0001 SMU.80 heat-inducible transcription repressor 0.229 1.43e-18 SMU.594 hypothetical protein 0.210 3.26e-05 SMU.81 co-chaperone protein GrpE 0.209 7.74e-21 SMU.930c transcriptional regulator 0.203 2.52e-09 SMU.457 hypothetical protein 0.146 7.25e-05 SMU.1861c hypothetical protein 0.140 6.12e-05 SMU.934 amino acid ABC transporter 0.112 4.65e-31 SMU.1185c mannitol PTS EII 0.110 5.79e-66 SMU.935 amino acid ABC transporter 0.095 4.32e-30 SMU.933 amino acid ABC transporter 0.094 4.63e-39 SMU.936 amino acid ABC transporter 0.094 2.31e-27 SMU.921 transcriptional regulator 0.080 3.40e-39 SMU.932 conserved hypothetical protein 0.080 1.40e-44 SMU.1395c hypothetical protein 0.038 1.52e-10
The data were generated by Sang-Joon Ahn and collaborator Sang-Chul Choi in the laboratory of Michael Stanhope at the University of Cornell (Ithaca, NY).

175
Table 6-9. Genes differentially regulated in the ∆835p strain vs wild-type strain via RNA-seq analysis.
Gene ID Gene Description
Fold change
∆835p/WT P value
SMU.1001 DNA processing protein 279 0 SMU.1987c
late competence protein; type II secretion system protein E 247 1.58e-32
SMU.1980c conserved hypothetical protein 227 5.36e-86
SMU.498 late competence protein F 210 0 SMU.1983c competence protein ComYD 209 1.99e-145 SMU.1984c competence protein ComYC 203 4.35e-165 SMU.1981c competence protein G 203 1.62e-34 SMU.1982c conserved hypothetical protein 200 2.26e-134 SMU.1985c
competence protein; general (type II) secretory pathway protein 191 3.47e-26
SMU.499 late competence protein required for DNA uptake 170 2.81e-164
SMU.626 competence protein; possible integral membrane protein 143 8.63e-299
SMU.625 competence protein 112 2.48e-172 SMU.1967c single-stranded DNA-binding protein 84.5 7.18e-50
SMU.644 competence protein CoiA 53.0 3.21e-220
SMU.836 hypothetical protein 41.5 5.78e-174 SMU.1979c conserved hypothetical protein 36.1 4.57e-93 SMU.1912c hypothetical protein 25.7 7.58e-16 SMU.1910c hypothetical protein 24.7 3.37e-17 SMU.1997c competence-specific sigma factor 22.8 2.18e-219
SMU.539c prepilin peptidase type IV 21.0 4.04e-07 SMU.1909c hypothetical protein 20.1 1.51e-13
SMU.837 Oxidoreductase 19.1 1.68e-97
SMU.1907 hypothetical protein 18.0 6.48e-13 SMU.1906c bacteriocin-related protein 16.0 4.95e-06
SMU.151 non-lantibiotic mutacin IV B 10.0 3.89e-05 SMU.1576c hypothetical protein 8.66 1.46e-23 SMU.1055c DNA repair protein RadC 8.65 3.37e-101
SMU.506 type II restriction endonuclease 8.51 2.58e-18

176
Table 6-9. continued
Gene ID Gene Description
Fold change
∆835p/WT P value SMU.769 conserved hypothetical protein 7.70 1.65e-32
SMU.10 cell-division protein DivIC 7.30 8.20e-07
SMU.46 hypothetical protein 7.27 2.39e-09 SMU.2086c competence damage-inducible protein A 6.59 2.66e-58
SMU.196c immunogenic secreted protein (transfer protein) 4.10 1.99e-07 SMU.2085c recombinase A 3.23 7.55e-62
SMU.1915 S. mutans specific competence stimulating peptide 3.23 5.48e-05
SMU.1345c peptide synthetase similar to mycA 3.25 7.34e-07
SMU.1828 universal stress protein family 0.652 1.46e-08
SMU.132 amino acid amidohydrolase (hippurate amidohydrolase) 0.390 1.46e-20
SMU.1692c pyruvate-formate lyase activating enzyme 0.385 8.13e-32
SMU.540 peroxide resistance protein / iron binding protein 0.385 2.55e-45
SMU.923 ABC-type multidrug/protein/lipid transport system 0.368 1.11e-51
SMU.932 conserved hypothetical protein 0.335 6.55e-11
SMU.629 superoxide dismutase 0.301 3.04e-71
SMU.924 thiol peroxidase 0.218 1.35e-68 SMU.1185c mannitol PTS EII 0.176 2.69e-43
SMU.921 transcriptional regulator 0.086 4.55e-38
The data were generated by Sang-Joon Ahn and collaborator Sang-Chul Choi in the laboratory of Michael Stanhope at the University of Cornell (Ithaca, NY).

177
CHAPTER 7 SUMMARY AND FUTURE DIRECTIONS
The Role of RcrRPQ in Stress Tolerance
S. mutans is able to gain a competitive advantage over many commensal
organisms because of its ability to thrive under conditions that are favorable for caries
development such as low pH (80, 118). However, S. mutans is still able to overcome
many environmental conditions that are less than optimal for its growth such as aeration
and limited nutrient availability. Therefore, it is critical to understand the mechanisms
that S. mutans utilizes to respond to stress and eventually cause disease.
Transcriptional regulators of the MarR family linked to the expression of genes encoding
efflux pumps are one mechanism bacteria use to overcome antibiotic stress and
environmental stresses in general (157). MarR proteins linked to efflux have been
characterized in other Streptococcus species (191). However, there are limited
published studies which characterize MarR regulators linked to efflux pumps in S.
mutans and their role in stress tolerance.
The previously uncharacterized rcrRPQ operon, which encodes a MarR regulator
linked to two efflux pumps, plays a dominant role in stress tolerance and two other
stress adaptation pathways: the metabolism of (p)ppGpp and genetic competence.
Specifically, the RcrPQ efflux pumps play a significant role in the ability of the cells to
grow in a variety of stresses. The Δ836p strain, which has the gene encoding the RcrP
(SMu0836) efflux pump deleted and the gene encoding the RcrQ (SMu0837) efflux
pump expressed at 1000-fold lower than wild-type levels, exhibited a poor growth
phenotype. The ability for S. mutans to grow at low pH is a key virulence property (20)
and the Δ836p mutant had very little cell accumulation even after 24 h at pH 5.5. Efflux
178
pumps are not only associated with the extrusion of antibiotics but are seen as playing
an important role in controlling the physiology of the cell and externalizing a wide range
of compounds including, metals, peptides and lipids (148, 179). Therefore, we
concluded that the RcrPQ efflux pumps are capable of extruding growth inhibitory
compounds that accumulate in growing cells that may be increased in low pH or aerobic
conditions. The expression of genes encoding efflux pumps is usually carefully
regulated by MarR regulators and uncontrolled expression of genes encoding efflux
pumps can eventually pose a metabolic burden on the cell (148). The data
accumulated show that the expression of rcrPQ is under dominant control by the RcrR
(SMu0835) regulator which belongs to the MarR family, and the expression of the genes
encoding the pumps had to be carefully regulated. Various strains where rcrPQ were
aberrantly expressed had an altered physiology compared to the wild-type strain.
Strains where rcrPQ were overexpressed were not transformable or had defects in
transformation efficiency, and many genes in the competence pathway were affected.
Therefore it is critical for RcrR to bind to the promoter of rcrRPQ to control the
expression of the operon. The data detailed in Chapter 1 and 6 show that RcrR controls
the expression of rcrRPQ by binding to a specific pseudopalindromic sequence,
TAGTTTTCATGAGAACTA, in the promoter region of the rcr operon, which is consistent
with the mechanisms of how MarR-type regulators bind DNA (236). Mutations in the
binding site affected the ability of RcrR to bind efficiently, and transformation efficiency
and the expression of genes in the competence pathway were perturbed. MarR-type
regulators are well known gauges for bacteria to respond to environmental cues. The
binding affinity of MarR type regulators to bind promoter-DNA can be altered in
179
response to different signals to control gene expression and cause a physiological
response in the cells(172). It is part of our working model that under non-stress
conditions RcrR is able to bind to the promoter of the rcr operon to repress the
expression of rcrPQ (Figure 7-1, 7-2, 7-3). However, the rcrRPQ operon is derepressed
in response to a stress signal(s) that accumulates inside the cell so the RcrPQ pumps
can extrude potentially harmful or growth inhibitory substances.
An interesting finding emerged from these studies when we made various
deletions in rcrQ (SMu0837). Competence and growth in CSP in these mutants were
highly dependent on sequences in the 3’ region of rcrQ (Table 7-2). We hypothesized
that the 3’ region of rcrQ may have some regulatory elements or encode a putative
peptide(s) (Figure 7-4, Figure 7-5) (Ahn et al., manuscript in preparation). The data
thus far indicate that the genes encoding the putative peptides are under the control of
RcrR as well, since no promoter activity could be detected in the region 5’ to the ATG
start codon of the genes encoding the peptides via lacZ or cat fusions. In addition, a
mutant was made where the DNA encoding the putative peptides was deleted in the
background of the Δ835np strain (Ahn et al., manuscript in preparation). The Δ835np
strain, was not transformable and insensitive to growth inhibition by CSP. However,
when the DNA encoding the peptides was deleted in the Δ835np strain, the strain
exhibited a phenotype more similar to the Δ835p strain and was hypertransformable
(Ahn et al., manuscript in preparation). Our hypothesis is that the putative peptide(s) in
the region 3’ of rcrQ interferes with either RcrR or may be the signal being exported by
the RcrPQ exporters. We have also been able to FLAG-tag these peptides and detect
them in the cell wall and cytoplasmic fractions using Western blot analysis. However,

180
their functions are still unknown. Studies are currently being done investigating the role
of the 3’ region and the putative peptides on competence development and other
pathways such as (p)ppGpp metabolism . These data raise the possibility of other
peptide signals involved in the regulation of competence.
Novel Factors Affecting (p)ppGpp Metabolism
The production of (p)ppGpp is critical for bacteria to overcome environmental
stresses, particularly nutrient limitation, and bacteria that cannot mount an efficient
stringent response acquire deleterious mutations (183). The levels of (p)ppGpp
accumulated need to be carefully regulated since overproduction of (p)ppGpp can also
shift the physiology of the cell to grow slower, which would negatively affect competitive
fitness. Previously, it was thought that RelA was the sole regulator of (p)ppGpp
metabolism in Gram-positive bacteria. It is now known, however, that there are other
synthetases, RelP and RelQ, that produce (p)ppGpp in S. mutans, and their orthologues
are fairly widely distributed in other Gram-positive bacteria (122). Based on the studies
done by Lemos et al., RelP produces the bulk of (p)ppGpp under non-stringent
conditions and RelP-dependent (p)ppGpp accumulation can influence the growth of S.
mutans (122). Notably, the regulation of RelP-dependent (p)ppGpp production was
linked to the RelRS TCS, probably by sensing external signals. However, these
external signals were not identified. The studies presented here revealed at least one
of the signals that influence RelP-dependent (p)ppGpp production in a dominant way.
The RelRS TCS detects oxidative stress to regulate (p)ppGpp production and control
the metabolism of the cell. There was a significant increase in the amount of (p)ppGpp
accumulated when the cells were exposed to hydrogen peroxide. Importantly, the
accumulation of (p)ppGpp in hydrogen peroxide was dependent on both RelP and

181
RelRS and the levels of (p)ppGpp accumulated were minimally affected by RelA or
RelQ. Furthermore, the promoter activity of relP was increased when cells were
exposed to hydrogen peroxide. S. mutans encounters oxidative stress, especially in
early biofilm formation in the oral cavity from host defense mechanisms and other oral
bacteria, and it has somewhat limited capacity to deal with oxidative stress compared to
other oral streptococci such as S. sanguinus (142, 165). We posit that the
accumulation of (p)ppGpp under oxidative stress can serve as mechanism to slow the
metabolism of the cells, so they do not use up resources and acquire deleterious
mutations. Therefore, S. mutans can persist until conditions become more favorable
such as in a mature biofilm. Notably, preliminary data show that (p)ppGpp
accumulation was not affected by low pH, and furthermore the expression of relPRS
was not changed in response to low pH (data not shown). Therefore, we conclude that
aeration and oxidative stress are major environmental signals to regulate RelPRS-
dependent production of (p)ppGpp.
An interesting finding was the effect of the rcrRPQ operon on the expression of
relP and (p)ppGpp production. The data detailed in Chapter 4 show that the expression
of the rcrRPQ operon affects the amount of (p)ppGpp accumulated, where the Δ835np
and Δ836p mutants had reductions in levels of (p)ppGpp accumulated in exponentially
growing cells. Notably, the expression of relP was significantly downregulated in the
Δ835np, Δ835p and Δ836p strains as well. The recombinant RcrR protein was also
shown to have weak interaction with the promoter of relP. Therefore we propose that
RcrR may bind weakly to the relP promoter under specific conditions such as oxidative
stress or when the rcr operon is derepressed to positively regulate the expression of
182
relP and increase (p)ppGpp production to control population growth. Based on the
reduced levels of (p)ppGpp accumulated in the Δ836p strain, which has rcrP deleted
and rcrQ expressed 1000-fold lower than wild-type levels, we also propose that the
RelRS TCS can sense the signals externalized by RcrPQ. We posit that the Rel RS
TCS can sense population density via the substance(s) being exported by the RcrPQ
exporters when it reaches a critical level to activate RelP-dependent (p)ppGpp
production (Figure 4-9) in a quorum sensing-like manner. We have not investigated the
role of the putative peptide(s) encoded in the rcrQ 3’ region, but it is reasonable to
hypothesize that if the peptides are being exported by RcrPQ, they may also play a role
in the expression of relPRS and (p)ppGpp production.
The Role of RcrRPQ on Genetic Competence and DNA Uptake
Genetic competence has nutritional advantages (46) and has been linked to
adaptation and survival by increasing genetic diversity in bacterial species. Mutations to
genes in the competence pathway attenuated virulence and biofilm formation in S.
mutans (129, 130). The regulation of competence in S. mutans differs from other
naturally competent bacteria and S. mutans is the only naturally competent bacterium
studied thus far that utilizes both of the main peptide signaling systems, ComRS and
ComCDE, to regulate competence (86). It appears that there is cross-regulation of the
ComCDE and ComRS systems by as-yet-undefined mechanisms, although they both
converge at ComX (63). Despite the fact that the alternative sigma factor ComX is
required for activation of late competence genes, other factors influence the
development of genetic competence, often in a dominant way (8, 63, 167). However, in

183
most cases the mechanisms by which these other factors affect signaling of
competence have not been characterized.
These studies reveal components of the competence pathway that were not
previously identified. The rcrRPQ operon influences the expression of comX and the
late competence genes and DNA uptake in a dominant way. Based on the qRT- PCR
analysis and transcriptional profiling of various mutants of rcrRPQ, RcrR negatively
regulates the expression of genes in the competence pathway and may interact with the
promoters of genes in the competence pathway directly. The expression of the genes
encoding the RcrPQ exporters was also critical in controlling the expression of genes in
the competence pathway and DNA uptake. Strains in which the genes encoding the
RcrPQ exporters were overexpressed were either non-transformable or had reduced
transformation capabilities and had lower comYA mRNA levels than in the wild-type cell.
The Δ835p strain, which had wild-type levels of the genes encoding the RcrPQ
exporters, was hypertransformable, whereas the Δ835np strain overexpressed rcrPQ
and was not transformable under any of the conditions tested. The Δ835np strain
displayed an interesting gene expression profile, where the expression of comX was
about 100-fold higher than wild-type levels, but the expression of comYA was
significantly lower. This was a novel finding since ComX is required to activate comY
and other late competence genes. It is therefore our hypothesis that RcrPQ extrude a
signal(s) that is necessary for the activation of ComX (Figure 7-1, Figure 7-2, Figure 7-
3). We predict that the signal(s) acts as an anti-anti-sigma factor that impacts ComX
protein stability and/or activity. Analogous components that impact ComX stability have
been described in other naturally competent Gram-positive bacteria such as S.

184
pneumoniae and B. subtilis (228). We hypothesize that the signals being externalized
by RcrPQ that affect ComX stability, might be the peptides encoded in the 3’ region of
rcrQ. Current efforts in the lab are focused on generating antibodies to ComX to
examine ComX stability in the various rcrRPQ mutants generated and use the His6-
tagged purified ComX to perform pull down assays to identify proteins and components
such as the peptides that may interact with it.
Linkage of RcrRPQ to Stress Tolerance, (p)ppGpp and Competence
S. mutans has evolved and fine tuned multiple systems to integrate and regulate
its gene expression to respond to different environmental challenges (121). Stress
tolerance, (p)ppGpp metabolism and competence are all important pathways for S.
mutans to survive and establish itself and cause caries when the conditions are
favorable. The competence pathway and (p)ppGpp metabolism have been described
more extensively in other bacteria, but the regulation of both of these systems differs
significantly in S. mutans from other Gram-positive bacteria. An inappropriate induction
of these stress response systems can cause the cells to grow inefficiently and cause an
unnecessary burden on the cell (101, 183). Consistent with this idea we have some
preliminary evidence where a strain that overexpresses comX grows poorly (Sang-Joon
Ahn, personal communication). Therefore, it is necessary to tightly regulate the
expression of comX. The findings presented show the important role that the previously
uncharacterized rcrRPQ operon plays in stress adaptation pathways and links (p)ppGpp
metabolism and competence.
We propose that (p)ppGpp metabolism and the development of competence are
linked through central control by the RcrR regulator and the substances being localized
by the RcrPQ exporters (Figure 7-1, Figure 7-2, Figure 7-3). S. mutans has master
185
regulators such as CcpA (3) which can up- or down-regulate the expression of many
genes enabling the bacteria to adapt efficiently to rapid changes in the environment
such as those encountered in the oral cavity (120, 205). RcrR appears to serve as
another important regulator by influencing both (p)ppGpp metabolism and competence.
The upregulation of the rcrRPQ operon in the presence of mupirocin (122) indicated that
the expression of the operon can be altered in response to stress. An interesting finding
from the microarray analysis done by Ahn et al., revealed that the expression of comX
was downregulated in aeration, whereas the expression of relPRS was upregulated in
response to aeration (7). Therefore oxidative stress, nutrient limitation or other
unidentified stress may be some of the signals to integrate RcrR-dependent control of
(p)ppGpp production and the induction of competence. As part of our working model,
we propose that in conditions which cause derepression of the rcr operon, RcrR can
bind more efficiently to the promoters of both relP and comX to positively regulate the
expression of relP and (p)ppGpp production, and negatively impact the expression of
comX and the uptake of DNA (Figure 7-1, 7-2). It is known that the ComCDE system
can activate comX even though the mechanisms are not clear. However, the
expression of comX is lower in aeration(7) even though the expression of genes
encoding the bacteriocins and ComD were highly upregulated in cells that were aerated
(7). Therefore it is reasonable to hypothesize that RcrR can serve as a mechanism to
control the expression of comX and DNA uptake even when the expression of the
genes encoding the bacteriocins and ComDE are upregulated and may serve as the
decision whether cells lyse or become competent.

186
The substances that RcrPQ extrude, which are also under the dominant control of
RcrR, play a significant role in the regulation of both (p)ppGpp metabolism and the
development of competence. We propose that the substances RcrPQ export can act in
a quorum sensing-like manner to regulate RelPRS-dependent production of (p)ppGpp
to control the growth of the population while internal concentrations impact ComX
stability and activity (Figure 7-1, 7-2). Therefore, localization of the substances being
exported by RcrPQ need to be carefully balanced, and slight differences in the
localization of the substances can alter the physiology of the cells. The induction of
(p)ppGpp production causes the cells to shift their physiology to conserve energy; we
posit that the RcrRPQ system serves to delay the induction of competence so as not to
utilize unnecessary resources. However, under other conditions where the rcr operon is
repressed, RcrR may not bind as effectively to the relP or comX promoters. The
amount of the substance externalized by RcrPQ will also be reduced thereby causing
lower amounts of (p)ppGpp production by RelP and increasing ComX stability and/or
activity (Figure 7-1).
Preliminary studies also show a linkage of (p)ppGpp metabolism to ComS/XIP. A
ΔrelA mutant is less sensitive to XIP-induced growth inhibition compared to the wild-type
strain and had defects in transformation (Justin Kaspar, personal communication).
However, the explanation for these observations is not known and further experiments
linking the two pathways are in progress. Data also show that the rcrRPQ operon
exerts an effect on the ComRS/ XIP system as well, where comS levels are high in
some of the ∆rcrRPQ mutant strains. However, the mechanisms underlying the linkage
of rcrRPQ to ComRS are currently being investigated.

187
Future Studies
One of the interesting findings in these studies is the significance of the RcrPQ
exporters and the signals being exported to regulate the physiology of the cell. Current
efforts are focused on identifying the substrates being extruded by the RcrPQ porters
through mass spectrometry on concentrated supernates from the various mutants. We
are also interested in the putative peptides encoded in the 3’ region of rcrQ. Studies
investigating the localization of these putative peptides through Western blot analysis
using antibodies specific to the peptides are currently in progress. The RcrR regulator
has a dominant role in regulating the rcr operon and other genes through RcrR binding
to the promoters of various genes. It is known that MarR regulators can change their
binding affinity by the presence of substances such phenols or antibiotics (236).
Therefore the identification of substances that can impact the expression of the rcrRPQ
operon and influence the binding activity of RcrR to various promoters would provide
much needed insight into the mechanism of control by the RcrR regulator.
Summary
The RcrRPQ system has not been identified or characterized in other bacterial
species. However, other Streptococcus species have genes that encode orthologues of
RcrRPQ linked to RelPRS (Table 7-1). Interestingly, the species that have orthologues
of RcrRPQ linked to RelPRS do not have the ComCDE system, only the ComRS
system [Table 7-1, (86)]. Notably, an orthologue of RcrRPQ was identified in S.
pyogenes (Table 7-1), an organism that has not been transformable in laboratory
conditions even though it has all the components of the competence machinery, such
as the genes encoding ComG (ComYA). The orthologues of RcrRPQ may have a
similar function to control competence in other bacterial species such as S. pyogenes.

188
Current projects in the lab are focused on characterizing other clinical isolates of S.
mutans and investigating genes that play an important role in stress tolerance.
Interestingly, a clinical isolate that does not have the gene encoding the RcrR regulator
(47) is not transformable under the conditions tested thus far (Lin Zeng, personal
communication), suggesting that this operon is not only important in the strain UA159,
but may be a critical regulator in other clinical isolates and contribute to fitness of other
strains of S. mutans. The transformation capabilities of other strains of S. mutans differ
from the strain UA159 and some of the clinical isolates are not readily transformable
under the conditions tested thus far (171). Therefore, studies characterizing the rcrRPQ
operon in other strains of S. mutans would be interesting to see if they impact the
physiology of the organisms and if they function in a similar manner as in the strain
UA159.
The findings reveal novel factors that influence the development of competence
and (p)ppGpp metabolism, which are two important pathways S. mutans utilizes to
adapt to various environmental stresses to cause disease. The production of (p)ppGpp
and the development of competence are regulated by a MarR-type regulator and the
accumulation of other peptides and signals that were not previously identified. The
discovery of the peptides encoded in the rcrQ 3’ region that influence the physiology of
the cell may have therapeutic value by impacting the growth of the population or
perturbing other physiological pathways. Since the expression of rcrRPQ operon
affects the physiology of the cells, especially growth at low pH, a key virulence attribute
of S. mutans, RcrRPQ may also be a good target for therapies to limit the growth of S.
mutans and the development of caries.

189
Figure 7-1. Schematic of the working model showing the regulation of relP and comX by RcrRPQ under rcr repressing conditions. RcrR can bind to the promoter of the rcr operon and repress expression of the operon. RcrR also has weak interaction with the relP and comX promoters. The RcrPQ signals can interact with a factor that interferes with ComX stability.

190
Figure 7-2. Schematic of the working model showing the regulation of relP and comX by
RcrRPQ under rcr derepressing conditions. Derepression of the operon can lead to higher levels of RcrR. High concentrations of RcrR can bind to the relP promoter to activate (p)ppGpp production as well as bind to the comX promoter to impair competence. Upregulation of the genes encoding the RcrPQ efflux pumps also results in externalization of the signal/s interacting with the factor that impairs ComX stability causing its activity to be impaired and impacting competence.

191
Figure 7-3. Schematic of the working model showing the regulation of the competence pathway and the RelPRS –dependent production of (p)ppGpp by rcrRPQ.

192
Figure 7-4. Schematic showing the presence of a putative peptide. Peptide 1 in the 3’ region of SMu0837 (rcrQ).

193
Figure 7-5. Schematic showing the presence of a putative peptide. Peptide 2 in the 3’ region of SMu0837 (rcrQ).

194
Table 7-1 List of organisms with genes encoding RcrRPQ homologues linked to RelPRS homologues and their GeneBank Locus ID
Organism MarR linked to ABC transporters
RelPRS homologues present
RelPRS linked to MarR
Streptococcus gallolyticus
YES GALLO_1282-1286
YES GALLO_1279-1281
YES
Streptococcus salivarius
YES STRASA001_623-625
YES STRASA001_619-621
YES
Streptococcus infantarius
YES STRINF_00326-00328
YES STRINF_00329-00332
YES
Streptococcus thermophilus
YES STU0432-434
NO NO
Streptococcus pyogenes
YES spyM18_0213-0215
YES spyM18_0934-0936
NO
Streptococcus agalactiae
YES Gbs1400-1402
YES Gbs1397-1399
YES
Streptococcus equisimilis
YES Sez_0219-221
NO NO
Streptococcus suis YES SsuiDRAFT_2132-2134
NO NO
Streptococcus uberis
YES SUB1688-1690
NO NO
Streptococcus sanguinis
YES SSA_0460-0462
YES SSA_1793-1795
NO
Streptococcus gordonii
YES SGO_1750-1752
YES SGO_0484-0486
NO
Streptococcus pneumoniae
YES CGSSp11BS70_11141-1146
NO NO
Streptococcus mitis
YES smi_1834-1836
NO NO

195
Table 7-2. Summary of mutants with deletions in the rcrQ 3’ region showing transformation efficiency compared to the wild-type strain
Strain RcrR levels RcrP levels RcrQ levels
No. of peptides present in the rcrQ 3’ region
Growth with CSP
Transformation efficiency compared to WT
Δ836-7 np V3 Not tested Deleted Deleted 0 Resistant 0
Δ837np V2 Not tested Not tested Deleted 2 Resistant 0
Δ837 p V2 Not tested Not tested Deleted 2 Resistant 0
Δ836-7np V2 Not tested Deleted Deleted 2 Resistant 10 -fold increase
Δ836-7p V2 Not tested Deleted Deleted 2 Hypersensitive 1000 - fold increase
Δ837np V3 Not tested Not tested Deleted 0 Resistant 100- fold increase
Δ835-7p npV2 Deleted Deleted Deleted 2 Resistant 1000 -fold increase
Δ835-7 npV3 Deleted Deleted Deleted 0 Resistant 1000- fold increase

196
APPENDIX ZONE OF INHIBITION
Figure showing the difference in size for the zone of inhibition for the wild-type and
Δ836p mutant strains of S. mutans overlaid with Streptococcus sanuginus strain SK150.
The diameter for the zone of inhibition of the wild-type strain was 21 mm ± 0.34 mm.
The diameter for the zone of inhibition of the Δ836p strain was 15.5 mm ± 1.3 mm.
197
LIST OF REFERENCES
1. Abranches, J., A. R. Martinez, J. K. Kajfasz, V. Chavez, D. A. Garsin, and J. A. Lemos. 2009. The molecular alarmone (p)ppGpp mediates stress responses, vancomycin tolerance, and virulence in Enterococcus faecalis. J. Bacteriol. 191:2248-2256.
2. Abranches, J., J. H. Miller, A. R. Martinez, P. J. Simpson-Haidaris, R. A. Burne, and J. A. Lemos. 2011. The collagen-binding protein Cnm is required for Streptococcus mutans adherence to and intracellular invasion of human coronary artery endothelial cells. Infect. Immun. 79:2277-2284.
3. Abranches, J., M. M. Nascimento, L. Zeng, C. M. Browngardt, Z. T. Wen, M. F. Rivera, and R. A. Burne. 2008. CcpA regulates central metabolism and virulence gene expression in Streptococcus mutans. J. Bacteriol. 190:2340-2349.
4. Ahn, S. J., S. J. Ahn, C. M. Browngardt, and R. A. Burne. 2009. Changes in biochemical and phenotypic properties of Streptococcus mutans during growth with aeration. Appl. Environ. Microbiol. 75:2517-2527.
5. Ahn, S. J., and R. A. Burne. 2007. Effects of oxygen on biofilm formation and the AtlA autolysin of Streptococcus mutans. J. Bacteriol. 189:6293-6302.
6. Ahn, S. J., J. A. Lemos, and R. A. Burne. 2005. Role of HtrA in growth and competence of Streptococcus mutans UA159. J. Bacteriol. 187:3028-3038.
7. Ahn, S. J., Z. T. Wen, and R. A. Burne. 2007. Effects of oxygen on virulence traits of Streptococcus mutans. J. Bacteriol. 189:8519-8527.
8. Ahn, S. J., Z. T. Wen, and R. A. Burne. 2006. Multilevel control of competence development and stress tolerance in Streptococcus mutans UA159. Infect. Immun. 74:1631-1642.
9. Ajdic, D., W. M. McShan, R. E. McLaughlin, G. Savic, J. Chang, M. B. Carson, C. Primeaux, R. Tian, S. Kenton, H. Jia, S. Lin, Y. Qian, S. Li, H. Zhu, F. Najar, H. Lai, J. White, B. A. Roe, and J. J. Ferretti. 2002. Genome sequence of Streptococcus mutans UA159, a cariogenic dental pathogen. Proc. Natl. Acad. Sci. U S A 99:14434-14439.
10. Alekshun, M. N., S. B. Levy, T. R. Mealy, B. A. Seaton, and J. F. Head. 2001. The crystal structure of MarR, a regulator of multiple antibiotic resistance, at 2.3 A resolution. Nat. Struct. Biol. 8:710-714.
11. Ali, S. B. S., Y. Hurtubise, M. C. Lavoie, and G. LaPointe. 2002. Diversity of Streptococcus mutans bacteriocins as confirmed by DNA analysis using specific molecular probes. Gene 283:125-131.

198
12. Altschul, S. F., W. Gish, W. Miller, E. W. Myers, and D. J. Lipman. 1990. Basic local alignment search tool. J. Mol. Biol. 215:403-410.
13. Anders, S., and W. Huber. 2010. Differential expression analysis for sequence count data. Genome Biol. 11:R106.
14. Ariza, R. R., S. P. Cohen, N. Bachhawat, S. B. Levy, and B. Demple. 1994. Repressor mutations in the marRAB operon that activate oxidative stress genes and multiple antibiotic resistance in Escherichia coli. J. Bacteriol. 176:143-148.
15. Attaiech, L., A. Olivier, I. Mortier-Barriere, A. L. Soulet, C. Granadel, B. Martin, P. Polard, and J. P. Claverys. 2011. Role of the single-stranded DNA-binding protein SsbB in pneumococcal transformation: maintenance of a reservoir for genetic plasticity. PLoS Genet. 7:e1002156.
16. Avarbock, D., A. Avarbock, and H. Rubin. 2000. Differential regulation of opposing RelMtb activities by the aminoacylation state of a tRNA.ribosome.mRNA.RelMtb complex. Biochemistry 39:11640-11648.
17. Avery, O. T., C. M. Macleod, and M. McCarty. 1944. Studies on the Chemical Nature of the Substance Inducing Transformation of Pneumococcal Types : Induction of Transformation by a Desoxyribonucleic Acid Fraction Isolated from Pneumococcus Type Iii. J. Exp. Med. 79:137-158.
18. Axelsson, L. 2005. Lactic Acid Bacteria. In S. Salminen, A. von Wright, and A. Ouwehand (ed.), Microbiolgy and Functional Aspects, Third Edition ed. Marcel Dekker, Inc, New York.
19. Balakrishnan, M., R. S. Simmonds, A. Carne, and J. R. Tagg. 2000. Streptococcus mutans strain N produces a novel low molecular mass non-lantibiotic bacteriocin. FEMS Microbiol. Lett. 183:165-169.
20. Banas, J. A. 2004. Virulence properties of Streptococcus mutans. Front. Biosci. 9:1267-1277.
21. Banas, J. A., and M. M. Vickerman. 2003. Glucan-binding proteins of the oral streptococci. Crit. Rev. Oral Bio.l Med. 14:89-99.
22. Barker, M. M., T. Gaal, and R. L. Gourse. 2001. Mechanism of regulation of transcription initiation by ppGpp. II. Models for positive control based on properties of RNAP mutants and competition for RNAP. Journal of molecular biology 305:689-702.
23. Barker, M. M., T. Gaal, C. A. Josaitis, and R. L. Gourse. 2001. Mechanism of regulation of transcription initiation by ppGpp. I. Effects of ppGpp on transcription initiation in vivo and in vitro. J. Mol. Biol. 305:673-688.
199
24. Beier, D., and R. Gross. 2006. Regulation of bacterial virulence by two-component systems. Curr. Opin. Microbiol. 9:143-152.
25. Beltran-Aguilar, E. D., L. K. Barker, M. T. Canto, B. A. Dye, B. F. Gooch, S. O. Griffin, J. Hyman, F. Jaramillo, A. Kingman, R. Nowjack-Raymer, R. H. Selwitz, and T. Wu. 2005. Surveillance for dental caries, dental sealants, tooth retention, edentulism, and enamel fluorosis--United States, 1988-1994 and 1999-2002. MMWR Surveill Summ 54:1-43.
26. Bender, G. R., S. V. W. Sutton, and R. E. Marquis. 1986. Acid Tolerance, Proton Permeabilities, and Membrane Atpases of Oral Streptococci. Infection and Immunity 53:331-338.
27. Bender, G. R., E. A. Thibodeau, and R. E. Marquis. 1985. Reduction of acidurance of streptococcal growth and glycolysis by fluoride and gramicidin. J. Dent. Res. 64:90-95.
28. Bernhart, S. H., I. L. Hofacker, and P. F. Stadler. 2006. Local RNA base pairing probabilities in large sequences. Bioinformatics (Oxford, England) 22:614-615.
29. Bowden, G. H., J. M. Hardie, and G. L. Slack. 1975. Microbial variations in approximal dental plaque. Caries. Res. 9:253-277.
30. Bowen, W. H., K. Schilling, E. Giertsen, S. Pearson, S. F. Lee, A. Bleiweis, and D. Beeman. 1991. Role of a cell surface-associated protein in adherence and dental caries. Infect. Immun. 59:4606-4609.
31. Boyd, D. A., D. G. Cvitkovitch, A. S. Bleiweis, M. Y. Kiriukhin, D. V. Debabov, F. C. Neuhaus, and I. R. Hamilton. 2000. Defects in D-alanyl-lipoteichoic acid synthesis in Streptococcus mutans results in acid sensitivity. J. Bacteriol. 182:6055-6065.
32. Bryan, E. M., T. Bae, M. Kleerebezem, and G. M. Dunny. 2000. Improved vectors for nisin-controlled expression in gram-positive bacteria. Plasmid 44:183-190.
33. Burne, R. A. 1998. Oral streptococci... products of their environment. J. Dent. Res. 77:445-452.
34. Burne, R. A., Y. Y. Chen, D. L. Wexler, H. Kuramitsu, and W. H. Bowen. 1996. Cariogenicity of Streptococcus mutans strains with defects in fructan metabolism assessed in a program-fed specific-pathogen-free rat model. J. Dent. Res. 75:1572-1577.
35. Burne, R. A., K. Schilling, W. H. Bowen, and R. E. Yasbin. 1987. Expression, purification, and characterization of an exo-beta-D-fructosidase of Streptococcus mutans. J. Bacteriol. 169:4507-4517.

200
36. Burt, B. A., S. A. Eklund, K. J. Morgan, F. E. Larkin, K. E. Guire, L. O. Brown, and J. A. Weintraub. 1988. The effects of sugars intake and frequency of ingestion on dental caries increment in a three-year longitudinal study. J Dent Res 67:1422-1429.
37. Busuioc, M., B. A. Buttaro, and P. J. Piggot. 2010. The pdh operon is expressed in a subpopulation of stationary-phase bacteria and is important for survival of sugar-starved Streptococcus mutans. J. Bacteriol. 192:4395-4402.
38. Carlsson, J. 1983. Regulation of sugar metabolism in relation to feast-and famine existence of plaque. In Cariology today:205-211.
39. Carlsson, J., U. Kujala, and M. B. K. Edlund. 1985. Pyruvate-Dehydrogenase Activity in Streptococcus mutans. Infection and Immunity 49:674-678.
40. Cashel, M., Gentry, D.R., Hernandez, V.J., and Vinella, D. 1996. The Stringent Response. In Escherichia coli and Salmonella, p. 1458-1496. In F. C. Neidhardt (ed.), Cellular and Molecular Biology, vol. 1. ASM Press, Washington, DC.
41. Cha, R. S., H. Zarbl, P. Keohavong, and W. G. Thilly. 1992. Mismatch amplification mutation assay (MAMA): application to the c-H-ras gene. PCR Methods Appl. 2:14-20.
42. Chen, A., J. D. Hillman, and M. Duncan. 1994. L-(+)-lactate dehydrogenase deficiency is lethal in Streptococcus mutans. J. Bacteriol. 176:1542-1545.
43. Clarke, J. K. 1924. On the bacterial factor in the ae tiology of dental caries. British Journal of Experimental Pathology 5:141-147.
44. Claverys, J. P., B. Martin, and L. S. Havarstein. 2007. Competence-induced fratricide in streptococci. Mo.l Microbiol. 64:1423-1433.
45. Claverys, J. P., B. Martin, and P. Polard. 2009. The genetic transformation machinery: composition, localization, and mechanism. FEMS Microbiol. Rev. 33:643-656.
46. Claverys, J. P., M. Prudhomme, and B. Martin. 2006. Induction of competence regulons as a general response to stress in gram-positive bacteria. Annu. Rev. Microbiol. 60:451-475.
47. Cornejo, O. E., T. Lefebure, P. D. Pavinski Bitar, P. Lang, V. P. Richards, K. Eilertson, T. Do, D. Beighton, L. Zeng, S. J. Ahn, R. A. Burne, A. Siepel, C. D. Bustamante, and M. J. Stanhope. 2013. Evolutionary and Population Genomics of the Cavity Causing Bacteria Streptococcus mutans. Mol. Biol. Evol. 30:881-893.
48. Cotter, P. D., C. Hill, and R. P. Ross. 2005. Bacteriocins: developing innate immunity for food. Nat. Rev. Microbiol. 3:777-788.

201
49. Coykendall, A. L. 1989. Classification and identification of the viridans streptococci. Clin. Microbiol. Rev. 2:315-328.
50. Crowley, P. J., L. J. Brady, D. A. Piacentini, and A. S. Bleiweis. 1993. Identification of a salivary agglutinin-binding domain within cell surface adhesin P1 of Streptococcus mutans. Infect. Immun. 61:1547-1552.
51. Curtiss, R., 3rd. 1985. Genetic analysis of Streptococcus mutans virulence. Curr. Top. Microbiol. Immunol. 118:253-277.
52. Cvitkovitch, D. G. 2001. Genetic competence and transformation in oral streptococci. Crit. Rev. Oral. Bio.l Med. 12:217-243.
53. Desai, B. V., and D. A. Morrison. 2006. An unstable competence-induced protein, CoiA, promotes processing of donor DNA after uptake during genetic transformation in Streptococcus pneumoniae. J. Bacteriol. 188:5177-5186.
54. Desai, B. V., and D. A. Morrison. 2006. An unstable competence-induced protein, CoiA, promotes processing of donor DNA after uptake during genetic transformation in Streptococcus pneumoniae. J Bacteriol 188:5177-5186.
55. Desai, K., L. Mashburn-Warren, M. J. Federle, and D. A. Morrison. 2012. Development of competence for genetic transformation of Streptococcus mutans in a chemically defined medium. J. Bacteriol. 194:3774-3780.
56. Dewhirst, F. E., T. Chen, J. Izard, B. J. Paster, A. C. Tanner, W. H. Yu, A. Lakshmanan, and W. G. Wade. 2010. The human oral microbiome. J Bacteriol 192:5002-5017.
57. Dufour, D., M. Cordova, D. G. Cvitkovitch, and C. M. Levesque. 2011. Regulation of the competence pathway as a novel role associated with a streptococcal bacteriocin. J. Bacteriol. 193:6552-6559.
58. Edgar, R. C. 2004. MUSCLE: multiple sequence alignment with high accuracy and high throughput. Nucleic Acids Res. 32:1792-1797.
59. Ellen, R. P., Burne, R.A. (ed.). 1996. Conceptual advances in oral microbial adhesion. In Bacterial adhesion: molecular and ecologic diversity. . John Wiley and Sons, New York.
60. Ellison, D. W., and V. L. Miller. 2006. Regulation of virulence by members of the MarR/SlyA family. Curr. Opin. Microbiol. 9:153-159.
61. Engelmoer, D. J., and D. E. Rozen. 2011. Competence increases survival during stress in Streptococcus pneumoniae. Evolution 65:3475-3485.
62. Fath, M. J., and R. Kolter. 1993. ABC transporters: bacterial exporters. Microbiol. Rev. 57:995-1017.
202
63. Federle, M. J., and D. A. Morrison. 2012. One if by land, two if by sea: signalling to the ranks with CSP and XIP. Mol. Microbiol. 86:241-245.
64. Fiorentino, G., R. Ronca, R. Cannio, M. Rossi, and S. Bartolucci. 2007. MarR-like transcriptional regulator involved in detoxification of aromatic compounds in Sulfolobus solfataricus. J. Bacteriol. 189:7351-7360.
65. Fitzgerald, R. J., B. O. Adams, H. J. Sandham, and S. Abhyankar. 1989. Cariogenicity of a lactate dehydrogenase-deficient mutant of Streptococcus mutans serotype c in gnotobiotic rats. Infect. Immun. 57:823-826.
66. Fontaine, L., C. Boutry, M. H. de Frahan, B. Delplace, C. Fremaux, P. Horvath, P. Boyaval, and P. Hols. 2010. A novel pheromone quorum-sensing system controls the development of natural competence in Streptococcus thermophilus and Streptococcus salivarius. J. Bacteriol. 192:1444-1454.
67. Fontaine, L., P. Goffin, H. Dubout, B. Delplace, A. Baulard, N. Lecat-Guillet, E. Chambellon, R. Gardan, and P. Hols. 2013. Mechanism of competence activation by the ComRS signaling system in streptococci. Mol. Microbiol.
68. Fozo, E. M., and R. G. Quivey, Jr. 2004. The fabM gene product of Streptococcus mutans is responsible for the synthesis of monounsaturated fatty acids and is necessary for survival at low pH. J. Bacteriol. 186:4152-4158.
69. Fozo, E. M., and R. G. Quivey, Jr. 2004. Shifts in the membrane fatty acid profile of Streptococcus mutans enhance survival in acidic environments. Appl. Environ. Microbiol. 70:929-936.
70. Gentry, D. R., and M. Cashel. 1996. Mutational analysis of the Escherichia coli spoT gene identifies distinct but overlapping regions involved in ppGpp synthesis and degradation. Mol. Microbiol. 19:1373-1384.
71. Griffith, F. 1928. The Significance of Pneumococcal Types. Journal of Hygiene 27:113-159.
72. Griswold, A., Y. Y. Chen, J. A. Snyder, and R. A. Burne. 2004. Characterization of the arginine deiminase operon of Streptococcus rattus FA-1. Appl. Environ. Microbiol. 70:1321-1327.
73. Griswold, A. R., Y. Y. Chen, and R. A. Burne. 2004. Analysis of an agmatine deiminase gene cluster in Streptococcus mutans UA159. J. Bacteriol. 186:1902-1904.
74. Griswold, A. R., M. Jameson-Lee, and R. A. Burne. 2006. Regulation and physiologic significance of the agmatine deiminase system of Streptococcus mutans UA159. J. Bacteriol. 188:834-841.

203
75. Gropp, M., Y. Strausz, M. Gross, and G. Glaser. 2001. Regulation of Escherichia coli RelA requires oligomerization of the C-terminal domain. J. Bacteriol. 183:570-579.
76. Gruber, A. R., S. Findeiss, S. Washietl, I. L. Hofacker, and P. F. Stadler. 2010. Rnaz 2.0: Improved noncoding rna detection. Pac. Symp. Biocomput. 15:69-79.
77. Hahn, K., R. C. Faustoferri, and R. G. Quivey, Jr. 1999. Induction of an AP endonuclease activity in Streptococcus mutans during growth at low pH. Mol. Microbiol. 31:1489-1498.
78. Hale, J. D., Y. T. Ting, R. W. Jack, J. R. Tagg, and N. C. Heng. 2005. Bacteriocin (mutacin) production by Streptococcus mutans genome sequence reference strain UA159: elucidation of the antimicrobial repertoire by genetic dissection. Appl. Environ. Microbiol. 71:7613-7617.
79. Hamada, S., and T. Ooshima. 1975. Production and properties of bacteriocins (mutacins) from Streptococcus mutans. Arch Oral Biol 20:641-648.
80. Hamada, S., and H. D. Slade. 1980. Biology, immunology, and cariogenicity of Streptococcus mutans. Microbiol. Rev. 44:331-384.
81. Hamilton, I. R., and N. D. Buckley. 1991. Adaptation by Streptococcus mutans to acid tolerance. Oral Microbiol. Immunol. 6:65-71.
82. Harris, G. S., S. M. Michalek, and R. Curtiss, 3rd. 1992. Cloning of a locus involved in Streptococcus mutans intracellular polysaccharide accumulation and virulence testing of an intracellular polysaccharide-deficient mutant. Infect. Immun. 60:3175-3185.
83. Haseltine, W. A., and R. Block. 1973. Synthesis of guanosine tetra- and pentaphosphate requires the presence of a codon-specific, uncharged transfer ribonucleic acid in the acceptor site of ribosomes. Proc Natl Acad Sci U S A 70:1564-1568.
84. Hasona, A., P. J. Crowley, C. M. Levesque, R. W. Mair, D. G. Cvitkovitch, A. S. Bleiweis, and L. J. Brady. 2005. Streptococcal viability and diminished stress tolerance in mutants lacking the signal recognition particle pathway or YidC2. Proc. Natl. Acad. Sci. U S A 102:17466-17471.
85. Hastings, J. W., and K. H. Nealson. 1977. Bacterial bioluminescence. Annu. Rev. Microbiol. 31:549-595.
86. Havarstein, L. S. 2010. Increasing competence in the genus Streptococcus. Mol. Microbiol. 78:541-544.

204
87. Havarstein, L. S., G. Coomaraswamy, and D. A. Morrison. 1995. An unmodified heptadecapeptide pheromone induces competence for genetic transformation in Streptococcus pneumoniae. Proc. Natl. Acad. Sci. U S A 92:11140-11144.
88. Hillman, J. D., A. Chen, and J. L. Snoep. 1996. Genetic and physiological analysis of the lethal effect of L-(+)-lactate dehydrogenase deficiency in Streptococcus mutans: complementation by alcohol dehydrogenase from Zymomonas mobilis. Infect. Immun. 64:4319-4323.
89. Hillman, J. D., J. Novak, E. Sagura, J. A. Gutierrez, T. A. Brooks, P. J. Crowley, M. Hess, A. Azizi, K. Leung, D. Cvitkovitch, and A. S. Bleiweis. 1998. Genetic and biochemical analysis of mutacin 1140, a lantibiotic from Streptococcus mutans. Infect. Immun. 66:2743-2749.
90. Ho, S. N., H. D. Hunt, R. M. Horton, J. K. Pullen, and L. R. Pease. 1989. Site-directed mutagenesis by overlap extension using the polymerase chain reaction. Gene 77:51-59.
91. Hogg, T., U. Mechold, H. Malke, M. Cashel, and R. Hilgenfeld. 2004. Conformational antagonism between opposing active sites in a bifunctional RelA/SpoT homolog modulates (p)ppGpp metabolism during the stringent response [corrected]. Cell 117:57-68.
92. Horaud, T., and F. Delbos. 1984. Viridans streptococci in infective endocarditis: species distribution and susceptibility to antibiotics. Eur. Heart J. 5 Suppl C:39-44.
93. Hossain, M. S., and I. Biswas. 2012. An extracelluar protease, SepM, generates functional competence-stimulating peptide in Streptococcus mutans UA159. J. Bacteriol. 194:5886-5896.
94. Hui, F. M., L. Zhou, and D. A. Morrison. 1995. Competence for genetic transformation in Streptococcus pneumoniae: organization of a regulatory locus with homology to two lactococcin A secretion genes. Gene 153:25-31.
95. Hung, D. C., J. S. Downey, E. A. Ayala, J. Kreth, R. Mair, D. B. Senadheera, F. Qi, D. G. Cvitkovitch, W. Shi, and S. D. Goodman. 2011. Characterization of DNA binding sites of the ComE response regulator from Streptococcus mutans. J. Bacteriol. 193:3642-3652.
96. Inaoka, T., and K. Ochi. 2002. RelA protein is involved in induction of genetic competence in certain Bacillus subtilis strains by moderating the level of intracellular GTP. J. Bacteriol. 184:3923-3930.
97. Jacobson, G. R., J. Lodge, and F. Poy. 1989. Carbohydrate uptake in the oral pathogen Streptococcus mutans: mechanisms and regulation by protein phosphorylation. Biochimie 71:997-1004.

205
98. Jain, V., M. Kumar, and D. Chatterji. 2006. ppGpp: stringent response and survival. J. Microbiol. 44:1-10.
99. Jayaraman, G. C., J. E. Penders, and R. A. Burne. 1997. Transcriptional analysis of the Streptococcus mutans hrcA, grpE and dnaK genes and regulation of expression in response to heat shock and environmental acidification. Mol. Microbiol. 25:329-341.
100. Jayaraman, G. C., J. E. Penders, and R. A. Burne. 1997. Transcriptional analysis of the Streptococcus mutans hrcA, grpE and dnaK genes and regulation of expression in response to heat shock and environmental acidification. Molecular microbiology 25:329-341.
101. Johnsborg, O., V. Eldholm, and L. S. Havarstein. 2007. Natural genetic transformation: prevalence, mechanisms and function. Research in Microbiology 158:767-778.
102. Johnson, C. P., S. M. Gross, and J. D. Hillman. 1980. Cariogenic potential in vitro in man and in vivo in the rat of lactate dehydrogenase mutants of Streptococcus mutans. Arch. Oral Biol. 25:707-713.
103. Kamiya, R. U., J. F. Hofling, and R. B. Goncalves. 2008. Frequency and expression of mutacin biosynthesis genes in isolates of Streptococcus mutans with different mutacin-producing phenotypes. J. Med. Microbiol. 57:626-635.
104. Keyes, P. H. 1960. The Infectious and Transmissible Nature of Experimental Dental Caries - Findings and Implications. Archives of Oral Biology 1:304-&.
105. Khan, R., H. V. Rukke, A. P. Ricomini Filho, G. Fimland, M. O. Arntzen, B. Thiede, and F. C. Petersen. 2012. Extracellular identification of a processed type II ComR/ComS pheromone of Streptococcus mutans. J. Bacteriol. 194:3781-3788.
106. Kim, J. N., S. J. Ahn, K. Seaton, S. Garrett, and R. A. Burne. 2012. Transcriptional organization and physiological contributions of the relQ operon of Streptococcus mutans. J. Bacteriol. 194:1968-1978.
107. Kingsford, C. L., K. Ayanbule, and S. L. Salzberg. 2007. Rapid, accurate, computational discovery of Rho-independent transcription terminators illuminates their relationship to DNA uptake. Genome Biol. 8:R22.
108. Kingston, R. E., W. C. Nierman, and M. J. Chamberlin. 1981. A direct effect of guanosine tetraphosphate on pausing of Escherichia coli RNA polymerase during RNA chain elongation. J. Biol. Chem. 256:2787-2797.
109. Kremer, B. H., M. van der Kraan, P. J. Crowley, I. R. Hamilton, L. J. Brady, and A. S. Bleiweis. 2001. Characterization of the sat operon in Streptococcus mutans: evidence for a role of Ffh in acid tolerance. J. Bacteriol. 183:2543-2552.

206
110. Kreth, J., D. C. Hung, J. Merritt, J. Perry, L. Zhu, S. D. Goodman, D. G. Cvitkovitch, W. Shi, and F. Qi. 2007. The response regulator ComE in Streptococcus mutans functions both as a transcription activator of mutacin production and repressor of CSP biosynthesis. Microbiology 153:1799-1807.
111. Kreth, J., L. Zhu, J. Merritt, W. Shi, and F. Qi. 2008. Role of sucrose in the fitness of Streptococcus mutans. Oral Microbiol. Immunol. 23:213-219.
112. Kruger, N. J., and K. Stingl. 2011. Two steps away from novelty--principles of bacterial DNA uptake. Mol. Microbiol. 80:860-867.
113. Kvist, M., V. Hancock, and P. Klemm. 2008. Inactivation of efflux pumps abolishes bacterial biofilm formation. Appl. Environ. Microbiol. 74:7376-7382.
114. Lee, M. S., and D. A. Morrison. 1999. Identification of a new regulator in Streptococcus pneumoniae linking quorum sensing to competence for genetic transformation. J. Bacteriol. 181:5004-5016.
115. Lee, S. F., A. Progulske-Fox, G. W. Erdos, D. A. Piacentini, G. Y. Ayakawa, P. J. Crowley, and A. S. Bleiweis. 1989. Construction and characterization of isogenic mutants of Streptococcus mutans deficient in major surface protein antigen P1 (I/II). Infect. Immun. 57:3306-3313.
116. Lemme, A., L. Grobe, M. Reck, J. Tomasch, and I. Wagner-Dobler. 2011. Subpopulation-specific transcriptome analysis of competence-stimulating-peptide-induced Streptococcus mutans. J. Bacteriol. 193:1863-1877.
117. Lemme, A., L. Grobe, M. Reck, J. Tomasch, and I. Wagner-Dobler. 2011. Subpopulation-specific transcriptome analysis of competence-stimulating-peptide-induced Streptococcus mutans. J Bacteriol 193:1863-1877.
118. Lemos, J. A., J. Abranches, and R. A. Burne. 2005. Responses of cariogenic streptococci to environmental stresses. Curr. Issues. Mol. Biol. 7:95-107.
119. Lemos, J. A., T. A. Brown, Jr., and R. A. Burne. 2004. Effects of RelA on key virulence properties of planktonic and biofilm populations of Streptococcus mutans. Infect. Immun. 72:1431-1440.
120. Lemos, J. A., and R. A. Burne. 2008. A model of efficiency: stress tolerance by Streptococcus mutans. Microbiology 154:3247-3255.
121. Lemos, J. A., and R. A. Burne. 2002. Regulation and Physiological Significance of ClpC and ClpP in Streptococcus mutans. J. Bacteriol. 184:6357-6366.
122. Lemos, J. A., V. K. Lin, M. M. Nascimento, J. Abranches, and R. A. Burne. 2007. Three gene products govern (p)ppGpp production by Streptococcus mutans. Mol. Microbiol. 65:1568-1581.

207
123. Lemos, J. A., M. M. Nascimento, V. K. Lin, J. Abranches, and R. A. Burne. 2008. Global regulation by (p)ppGpp and CodY in Streptococcus mutans. J. Bacteriol. 190:5291-5299.
124. Lemos, J. A., M. M. Nascimento, V. K. Lin, J. Abranches, and R. A. Burne. 2008. Global regulation by (p)ppGpp and CodY in Streptococcus mutans. J Bacteriol 190:5291-5299.
125. Li, H., and R. Durbin. 2009. Fast and accurate short read alignment with Burrows-Wheeler transform. Bioinformatics (Oxford, England) 25:1754-1760.
126. Li, H., B. Handsaker, A. Wysoker, T. Fennell, J. Ruan, N. Homer, G. Marth, G. Abecasis, and R. Durbin. 2009. The sequence alignment/map format and SAMtools. Bioinformatics (Oxford, England) 25:2078-2079.
127. Li, Y. H., M. N. Hanna, G. Svensater, R. P. Ellen, and D. G. Cvitkovitch. 2001. Cell density modulates acid adaptation in Streptococcus mutans: implications for survival in biofilms. J. Bacteriol. 183:6875-6884.
128. Li, Y. H., P. C. Lau, J. H. Lee, R. P. Ellen, and D. G. Cvitkovitch. 2001. Natural genetic transformation of Streptococcus mutans growing in biofilms. J. Bacteriol. 183:897-908.
129. Li, Y. H., N. Tang, M. B. Aspiras, P. C. Lau, J. H. Lee, R. P. Ellen, and D. G. Cvitkovitch. 2002. A quorum-sensing signaling system essential for genetic competence in Streptococcus mutans is involved in biofilm formation. J. Bacteriol. 184:2699-2708.
130. Li, Y. H., X. L. Tian, G. Layton, C. Norgaard, and G. Sisson. 2008. Additive attenuation of virulence and cariogenic potential of Streptococcus mutans by simultaneous inactivation of the ComCDE quorum-sensing system and HK/RR11 two-component regulatory system. Microbiology 154:3256-3265.
131. Linares, J. F., J. A. Lopez, E. Camafeita, J. P. Albar, F. Rojo, and J. L. Martinez. 2005. Overexpression of the multidrug efflux pumps MexCD-OprJ and MexEF-OprN is associated with a reduction of type III secretion in Pseudomonas aeruginosa. J. Bacteriol. 187:1384-1391.
132. Lindahl, T., and B. Nyberg. 1972. Rate of depurination of native deoxyribonucleic acid. Biochemistry 11:3610-3618.
133. Liu, Y., L. Zeng, and R. A. Burne. 2009. AguR is required for induction of the Streptococcus mutans agmatine deiminase system by low pH and agmatine. Appl. Environ. Microbiol. 75:2629-2637.
134. Loesche, W. J. 1986. Role of Streptococcus mutans in human dental decay. Microbiol. Rev. 50:353-380.

208
135. Loo, C. Y., D. A. Corliss, and N. Ganeshkumar. 2000. Streptococcus gordonii biofilm formation: identification of genes that code for biofilm phenotypes. J. Bacteriol. 182:1374-1382.
136. Luo, P., H. Li, and D. A. Morrison. 2003. ComX is a unique link between multiple quorum sensing outputs and competence in Streptococcus pneumoniae. Mol. Microbiol. 50:623-633.
137. Luo, P., H. Li, and D. A. Morrison. 2004. Identification of ComW as a new component in the regulation of genetic transformation in Streptococcus pneumoniae. Mol. Microbiol. 54:172-183.
138. Luo, P., and D. A. Morrison. 2003. Transient association of an alternative sigma factor, ComX, with RNA polymerase during the period of competence for genetic transformation in Streptococcus pneumoniae. J. Bacteriol. 185:349-358.
139. Ma, J. K., C. G. Kelly, G. Munro, R. A. Whiley, and T. Lehner. 1991. Conservation of the gene encoding streptococcal antigen I/II in oral streptococci. Infect. Immun. 59:2686-2694.
140. Magitot, E. 1867. Treatise on dental caries: experimental and therapeutic investigations.
141. Magnuson, R., J. Solomon, and A. D. Grossman. 1994. Biochemical and genetic characterization of a competence pheromone from B. subtilis. Cell 77:207-216.
142. Marquis, R. E. 1995. Oxygen metabolism, oxidative stress and acid-base physiology of dental plaque biofilms. J. Ind. Microbiol. 15:198-207.
143. Marsh, P. D. 2003. Are dental diseases examples of ecological catastrophes? Microbiology 149:279-294.
144. Martin, B., Y. Quentin, G. Fichant, and J. P. Claverys. 2006. Independent evolution of competence regulatory cascades in streptococci? Trends Microbiol 14:339-345.
145. Martin, J., W. Zhu, K. D. Passalacqua, N. Bergman, and M. Borodovsky. 2010. Bacillus anthracis genome organization in light of whole transcriptome sequencing. BMC bioinformatics 11 Suppl 3:S10.
146. Martin, M. 2011. Cutadapt removes adapter sequences from high-throughput sequencing reads. EMB-net.journal 17:10-12.
147. Martinez-Costa, O. H., M. A. Fernandez-Moreno, and F. Malpartida. 1998. The relA/spoT-homologous gene in Streptomyces coelicolor encodes both ribosome-dependent (p)ppGpp-synthesizing and -degrading activities. J. Bacteriol. 180:4123-4132.
209
148. Martinez, J. L., M. B. Sanchez, L. Martinez-Solano, A. Hernandez, L. Garmendia, A. Fajardo, and C. Alvarez-Ortega. 2009. Functional role of bacterial multidrug efflux pumps in microbial natural ecosystems. FEMS Microbiol. Rev. 33:430-449.
149. Mashburn-Warren, L., D. A. Morrison, and M. J. Federle. 2010. A novel double-tryptophan peptide pheromone controls competence in Streptococcus spp. via an Rgg regulator. Mol Microbiol 78:589-606.
150. Matsumoto-Nakano, M., and H. K. Kuramitsu. 2006. Role of bacteriocin immunity proteins in the antimicrobial sensitivity of Streptococcus mutans. J. Bacteriol. 188:8095-8102.
151. Mattos-Graner, R. O., S. Jin, W. F. King, T. Chen, D. J. Smith, and M. J. Duncan. 2001. Cloning of the Streptococcus mutans gene encoding glucan binding protein B and analysis of genetic diversity and protein production in clinical isolates. Infect. Immun. 69:6931-6941.
152. Mechold, U., M. Cashel, K. Steiner, D. Gentry, and H. Malke. 1996. Functional analysis of a relA/spoT gene homolog from Streptococcus equisimilis. J. Bacteriol. 178:1401-1411.
153. Mechold, U., H. Murphy, L. Brown, and M. Cashel. 2002. Intramolecular regulation of the opposing (p)ppGpp catalytic activities of Rel(Seq), the Rel/Spo enzyme from Streptococcus equisimilis. J. Bacteriol. 184:2878-2888.
154. Merritt, J., J. Kreth, W. Shi, and F. Qi. 2005. LuxS controls bacteriocin production in Streptococcus mutans through a novel regulatory component. Mol. Microbiol. 57:960-969.
155. Merritt, J., and F. Qi. 2012. The mutacins of Streptococcus mutans: regulation and ecology. Mol. Oral Microbiol. 27:57-69.
156. Merritt, J., F. Qi, and W. Shi. 2005. A unique nine-gene comY operon in Streptococcus mutans. Microbiology 151:157-166.
157. Miller, M. C., S. Parkin, J. D. Fetherston, R. D. Perry, and E. Demoll. 2006. Crystal structure of ferric-yersiniabactin, a virulence factor of Yersinia pestis. J Inorg Biochem 100:1495-1500.
158. Mittenhuber, G. 2001. Comparative genomics and evolution of genes encoding bacterial (p)ppGpp synthetases/hydrolases (the Rel, RelA and SpoT proteins). J. Mol. Microbiol. Biotechnol. 3:585-600.
159. Monchois, V., R. M. Willemot, and P. Monsan. 1999. Glucansucrases: mechanism of action and structure-function relationships. FEMS Microbiol. Rev. 23:131-151.
210
160. Munro, C., S. M. Michalek, and F. L. Macrina. 1991. Cariogenicity of Streptococcus mutans V403 glucosyltransferase and fructosyltransferase mutants constructed by allelic exchange. Infect. Immun. 59:2316-2323.
161. Nakano, K., R. Nomura, H. Nemoto, T. Mukai, H. Yoshioka, Y. Shudo, H. Hata, K. Toda, K. Taniguchi, A. Amano, and T. Ooshima. 2007. Detection of novel serotype k Streptococcus mutans in infective endocarditis patients. J Med Microbiol 56:1413-1415.
162. Nakano, K., and T. Ooshima. 2009. Serotype classification of Streptococcus mutans and its detection outside the oral cavity. Future Microbiol. 4:891-902.
163. Nanamiya, H., K. Kasai, A. Nozawa, C. S. Yun, T. Narisawa, K. Murakami, Y. Natori, F. Kawamura, and Y. Tozawa. 2008. Identification and functional analysis of novel (p)ppGpp synthetase genes in Bacillus subtilis. Mol. Microbiol. 67:291-304.
164. Nascimento, M. M., J. A. Lemos, J. Abranches, V. K. Lin, and R. A. Burne. 2008. Role of RelA of Streptococcus mutans in global control of gene expression. J. Bacteriol. 190:28-36.
165. Nguyen, P. T. M., J. Abranches, T. N. Phan, and R. E. Marquis. 2002. Repressed respiration of oral streptococci grown in Biofilms. Curr Microbiol 44:262-266.
166. Nishie, M., J. Nagao, and K. Sonomoto. 2012. Antibacterial peptides "bacteriocins": an overview of their diverse characteristics and applications. Biocontro.l Sci. 17:1-16.
167. Niu, G., T. Okinaga, L. Zhu, J. Banas, F. Qi, and J. Merritt. 2008. Characterization of irvR, a novel regulator of the irvA-dependent pathway required for genetic competence and dextran-dependent aggregation in Streptococcus mutans. J. Bacteriol. 190:7268-7274.
168. Okinaga, T., G. Niu, Z. Xie, F. Qi, and J. Merritt. 2010. The hdrRM Operon of Streptococcus mutans Encodes a Novel Regulatory System for Coordinated Competence Development and Bacteriocin Production. J. Bacteriol. 192:1844-1852.
169. Oppegard, C., L. Emanuelsen, L. Thorbek, G. Fimland, and J. Nissen-Meyer. 2010. The lactococcin G immunity protein recognizes specific regions in both peptides constituting the two-peptide bacteriocin lactococcin G. Appl. Environ. Microbiol. 76:1267-1273.
170. Oshlack, A., M. D. Robinson, and M. D. Young. 2010. From RNA-seq reads to differential expression results. Genome Biol. 11:220.

211
171. Palmer, S., J. Miller, J. Abranches, L. Zeng, T. Lefebure, V. Richards, J. Lemos, M. Stanhope, and R. A. Burne. 2013. Phenotypic Heterogeneity of Genomically-Diverse Isolates of Streptococcus mutans. PloS One.
172. Perera, I. C., Y. H. Lee, S. P. Wilkinson, and A. Grove. 2009. Mechanism for attenuation of DNA binding by MarR family transcriptional regulators by small molecule ligands. J. Mol. Biol. 390:1019-1029.
173. Perez-Casal, J., M. G. Caparon, and J. R. Scott. 1991. Mry, a trans-acting positive regulator of the M protein gene of Streptococcus pyogenes with similarity to the receptor proteins of two-component regulatory systems. J. Bacteriol. 173:2617-2624.
174. Perry, J. A., D. G. Cvitkovitch, and C. M. Levesque. 2009. Cell death in Streptococcus mutans biofilms: a link between CSP and extracellular DNA. FEMS Microbiol. Lett. 299:261-266.
175. Perry, J. A., M. B. Jones, S. N. Peterson, D. G. Cvitkovitch, and C. M. Levesque. 2009. Peptide alarmone signalling triggers an auto-active bacteriocin necessary for genetic competence. Mol. Microbiol. 72:905-917.
176. Pestova, E. V., L. S. Havarstein, and D. A. Morrison. 1996. Regulation of competence for genetic transformation in Streptococcus pneumoniae by an auto-induced peptide pheromone and a two-component regulatory system. Mol. Microbiol. 21:853-862.
177. Petersen, F. C., G. Fimland, and A. A. Scheie. 2006. Purification and functional studies of a potent modified quorum-sensing peptide and a two-peptide bacteriocin in Streptococcus mutans. Mol. Microbiol. 61:1322-1334.
178. Petersen, F. C., L. Tao, and A. A. Scheie. 2005. DNA binding-uptake system: a link between cell-to-cell communication and biofilm formation. J. Bacteriol. 187:4392-4400.
179. Piddock, L. J. 2006. Multidrug-resistance efflux pumps - not just for resistance. Nat. Rev. Microbiol. 4:629-636.
180. Pomares, M. F., P. A. Vincent, R. N. Farias, and R. A. Salomon. 2008. Protective action of ppGpp in microcin J25-sensitive strains. J. Bacteriol. 190:4328-4334.
181. Pomposiello, P. J., M. H. Bennik, and B. Demple. 2001. Genome-wide transcriptional profiling of the Escherichia coli responses to superoxide stress and sodium salicylate. J. Bacteriol. 183:3890-3902.
182. Postma, P. W., J. W. Lengeler, and G. R. Jacobson. 1993. Phosphoenolpyruvate:carbohydrate phosphotransferase systems of bacteria. Microbiol. Rev. 57:543-594.
212
183. Potrykus, K., and M. Cashel. 2008. (p)ppGpp: Still Magical? Annu. Rev. Microbiol. 62:35-51.
184. Potrykus, K., and M. Cashel. 2008. (p)ppGpp: Still Magical? Annual review of microbiology.
185. Qi, F., P. Chen, and P. W. Caufield. 2001. The group I strain of Streptococcus mutans, UA140, produces both the lantibiotic mutacin I and a nonlantibiotic bacteriocin, mutacin IV. Appl. Environ. Microbiol. 67:15-21.
186. Qi, F., P. Chen, and P. W. Caufield. 2000. Purification and biochemical characterization of mutacin I from the group I strain of Streptococcus mutans, CH43, and genetic analysis of mutacin I biosynthesis genes. Appl. Environ. Microbiol. 66:3221-3229.
187. Qi, F., J. Kreth, C. M. Levesque, O. Kay, R. W. Mair, W. Shi, D. G. Cvitkovitch, and S. D. Goodman. 2005. Peptide pheromone induced cell death of Streptococcus mutans. FEMS Microbiol. Lett. 251:321-326.
188. Quivey, R. G., Jr., R. Faustoferri, K. Monahan, and R. Marquis. 2000. Shifts in membrane fatty acid profiles associated with acid adaptation of Streptococcus mutans. FEMS Microbiol. Lett. 189:89-92.
189. Ra, R., M. M. Beerthuyzen, W. M. de Vos, P. E. Saris, and O. P. Kuipers. 1999. Effects of gene disruptions in the nisin gene cluster of Lactococcus lactis on nisin production and producer immunity. Microbiology 145 ( Pt 5):1227-1233.
190. Reiness, G., H. L. Yang, G. Zubay, and M. Cashel. 1975. Effects of guanosine tetraphosphate on cell-free synthesis of Escherichia coli ribosomal RNA and other gene products. Proc. Natl. Acad. Sci. U S A 72:2881-2885.
191. Reyes-Caballero, H., A. J. Guerra, F. E. Jacobsen, K. M. Kazmierczak, D. Cowart, U. M. Koppolu, R. A. Scott, M. E. Winkler, and D. P. Giedroc. 2010. The metalloregulatory zinc site in Streptococcus pneumoniae AdcR, a zinc-activated MarR family repressor. J. Mol. Biol. 403:197-216.
192. Robinson, M. D., and A. Oshlack. 2010. A scaling normalization method for differential expression analysis of RNA-seq data. Genome Biol. 11:R25.
193. Robinson, M. D., and G. K. Smyth. 2007. Moderated statistical tests for assessing differences in tag abundance. Bioinformatics (Oxford, England) 23:2881-2887.
194. Sajish, M., S. Kalayil, S. K. Verma, V. K. Nandicoori, and B. Prakash. 2009. The significance of EXDD and RXKD motif conservation in Rel proteins. J. Biol. Chem. 284:9115-9123.

213
195. Sajish, M., D. Tiwari, D. Rananaware, V. K. Nandicoori, and B. Prakash. 2007. A charge reversal differentiates (p)ppGpp synthesis by monofunctional and bifunctional Rel proteins. J. Biol. Chem. 282:34977-34983.
196. Sambrook, J., and D. Russel. 2001. Molecular Cloning, 3rd ed, vol. 1. Cold Spring Harbor Laboratory Press, Cold Spring Harbor, NY.
197. Sarubbi, E., K. E. Rudd, and M. Cashel. 1988. Basal ppGpp level adjustment shown by new spoT mutants affect steady state growth rates and rrnA ribosomal promoter regulation in Escherichia coli. Mol. Gen. Genet. 213:214-222.
198. Schmieder, R., and R. Edwards. 2011. Quality control and preprocessing of metagenomic datasets. Bioinformatics (Oxford, England) 27:863-864.
199. Seaton, K., S. J. Ahn, A. M. Sagstetter, and R. A. Burne. 2011. A transcriptional regulator and ABC transporters link stress tolerance, (p)ppGpp, and genetic competence in Streptococcus mutans. J. Bacteriol. 193:862-874.
200. Senadheera, M. D., B. Guggenheim, G. A. Spatafora, Y. C. Huang, J. Choi, D. C. Hung, J. S. Treglown, S. D. Goodman, R. P. Ellen, and D. G. Cvitkovitch. 2005. A VicRK signal transduction system in Streptococcus mutans affects gtfBCD, gbpB, and ftf expression, biofilm formation, and genetic competence development. J. Bacteriol. 187:4064-4076.
201. Seyfzadeh, M., J. Keener, and M. Nomura. 1993. Spot-Dependent Accumulation of Guanosine Tetraphosphate in Response to Fatty-Acid Starvation in Escherichia coli. Proceedings of the National Academy of Sciences of the United States of America 90:11004-11008.
202. Shaw, W. V., L. C. Packman, B. D. Burleigh, A. Dell, H. R. Morris, and B. S. Hartley. 1979. Primary structure of a chloramphenicol acetyltransferase specified by R plasmids. Nature 282:870-872.
203. Sheng, J., and R. E. Marquis. 2006. Enhanced acid resistance of oral streptococci at lethal pH values associated with acid-tolerant catabolism and with ATP synthase activity. FEMS Microbiol. Lett. 262:93-98.
204. Shibata, Y., K. Ozaki, M. Seki, T. Kawato, H. Tanaka, Y. Nakano, and Y. Yamashita. 2003. Analysis of loci required for determination of serotype antigenicity in Streptococcus mutans and its clinical utilization. J. Clin. Microbiol. 41:4107-4112.
205. Smith, E. G., and G. A. Spatafora. 2012. Gene regulation in S. mutans: complex control in a complex environment. J. Dent. Res. 91:133-141.
206. Solomon, J. M., B. A. Lazazzera, and A. D. Grossman. 1996. Purification and characterization of an extracellular peptide factor that affects two different developmental pathways in Bacillus subtilis. Genes Dev 10:2014-2024.

214
207. Son, M., S. J. Ahn, Q. Guo, R. A. Burne, and S. J. Hagen. 2012. Microfluidic study of competence regulation in Streptococcus mutans: environmental inputs modulate bimodal and unimodal expression of comX. Mol Microbiol 86:258-272.
208. Spatafora, G., K. Rohrer, D. Barnard, and S. Michalek. 1995. A Streptococcus mutans mutant that synthesizes elevated levels of intracellular polysaccharide is hypercariogenic in vivo. Infect. Immun. 63:2556-2563.
209. Sridhar, J., N. Sambaturu, R. Sabarinathan, H. Y. Ou, Z. Deng, K. Sekar, Z. A. Rafi, and K. Rajakumar. 2010. sRNAscanner: a computational tool for intergenic small RNA detection in bacterial genomes. PLoS One 5:e11970.
210. Staat, R. H., and C. F. Schachtele. 1974. Evaluation of dextranase production by the cariogenic bacterium Streptococcus mutans. Infect. Immun. 9:467-469.
211. Stein, T., S. Heinzmann, I. Solovieva, and K. D. Entian. 2003. Function of Lactococcus lactis nisin immunity genes nisI and nisFEG after coordinated expression in the surrogate host Bacillus subtilis. J. Biol. Chem. 278:89-94.
212. Stephan, R. M., and E. S. Hemmens. 1947. Studies of changes in pH produced by pure cultures of oral micro-organisms; effects of varying the microbic cell concentration; comparison of different micro-organisms and different substrates; some effects of mixing certain micro-organisms. J Dent Res 26:15-41.
213. Stevens, K. E., D. Chang, E. E. Zwack, and M. E. Sebert. 2011. Competence in Streptococcus pneumoniae is regulated by the rate of ribosomal decoding errors. MBio 2.
214. Stock, A. M., V. L. Robinson, and P. N. Goudreau. 2000. Two-component signal transduction. Annu. Rev. Biochem. 69:183-215.
215. Sturr, M. G., and R. E. Marquis. 1992. Comparative acid tolerances and inhibitor sensitivities of isolated F-ATPases of oral lactic acid bacteria. Appl. Environ. Microbiol. 58:2287-2291.
216. Sung, C. K., and D. A. Morrison. 2005. Two distinct functions of ComW in stabilization and activation of the alternative sigma factor ComX in Streptococcus pneumoniae. J. Bacteriol. 187:3052-3061.
217. Svensater, G., U. B. Larsson, E. C. Greif, D. G. Cvitkovitch, and I. R. Hamilton. 1997. Acid tolerance response and survival by oral bacteria. Oral Microbiol. Immunol. 12:266-273.
218. Svitil, A. L., M. Cashel, and J. W. Zyskind. 1993. Guanosine tetraphosphate inhibits protein synthesis in vivo. A possible protective mechanism for starvation stress in Escherichia coli. J. Biol. Chem. 268:2307-2311.

215
219. Tafer, H., and I. L. Hofacker. 2008. RNAplex: a fast tool for RNA-RNA interaction search. Bioinformatics (Oxford, England) 24:2657-2663.
220. Team, R. D. C. 2011. R: A language and environment for statistical computing. R foundation for Statistical Computing, Vienna, Ausrtia.
221. Terleckyj, B., N. P. Willett, and G. D. Shockman. 1975. Growth of several cariogenic strains of oral streptococci in a chemically defined medium. Infect. Immun. 11:649-655.
222. Tojo, S., K. Kumamoto, K. Hirooka, and Y. Fujita. 2010. Heavy involvement of stringent transcription control depending on the adenine or guanine species of the transcription initiation site in glucose and pyruvate metabolism in Bacillus subtilis. J. Bacteriol. 192:1573-1585.
223. Traxler, M. F., S. M. Summers, H. T. Nguyen, V. M. Zacharia, G. A. Hightower, J. T. Smith, and T. Conway. 2008. The global, ppGpp-mediated stringent response to amino acid starvation in Escherichia coli. Mol. Microbiol. 68:1128-1148.
224. Vadeboncoeur, C., and M. Pelletier. 1997. The phosphoenolpyruvate:sugar phosphotransferase system of oral streptococci and its role in the control of sugar metabolism. FEMS Microbiol. Rev. 19:187-207.
225. van der Ploeg, J. R. 2005. Regulation of bacteriocin production in Streptococcus mutans by the quorum-sensing system required for development of genetic competence. Journal of Bacteriology 187:3980-3989.
226. Wang, J. D., G. M. Sanders, and A. D. Grossman. 2007. Nutritional control of elongation of DNA replication by (p)ppGpp. Cell 128:865-875.
227. Washietl, S., I. L. Hofacker, and P. F. Stadler. 2005. Fast and reliable prediction of noncoding RNAs. Proc. Natl. Acad. Sci. USA 102:2454-2459.
228. Waters, C. M., and B. L. Bassler. 2005. Quorum sensing: cell-to-cell communication in bacteria. Annu. Rev. Cell. Dev. Biol. 21:319-346.
229. Wei, H., and L. S. Havarstein. 2012. Fratricide is essential for efficient gene transfer between pneumococci in biofilms. Appl. Environ. Microbiol. 78:5897-5905.
230. Wen, Z. T., H. V. Baker, and R. A. Burne. 2006. Influence of BrpA on critical virulence attributes of Streptococcus mutans. J. Bacteriol. 188:2983-2992.
231. Wen, Z. T., and R. A. Burne. 2004. LuxS-mediated signaling in Streptococcus mutans is involved in regulation of acid and oxidative stress tolerance and biofilm formation. J. Bacteriol. 186:2682-2691.

216
232. Wen, Z. T., P. Suntharaligham, D. G. Cvitkovitch, and R. A. Burne. 2005. Trigger factor in Streptococcus mutans is involved in stress tolerance, competence development, and biofilm formation. Infect. Immun. 73:219-225.
233. Wenderska, I. B., N. Lukenda, M. Cordova, N. Magarvey, D. G. Cvitkovitch, and D. B. Senadheera. 2012. A novel function for the competence inducing peptide, XIP, as a cell death effector of Streptococcus mutans. FEMS Microbiol. Lett.
234. Wexler, D. L., M. C. Hudson, and R. A. Burne. 1993. Streptococcus mutans fructosyltransferase (ftf) and glucosyltransferase (gtfBC) operon fusion strains in continuous culture. Infect. Immun. 61:1259-1267.
235. Wexler, D. L., J. E. Penders, W. H. Bowen, and R. A. Burne. 1992. Characteristics and cariogenicity of a fructanase-defective Streptococcus mutans strain. Infect. Immun. 60:3673-3681.
236. Wilkinson, S. P., and A. Grove. 2006. Ligand-responsive transcriptional regulation by members of the MarR family of winged helix proteins. Curr. Issues. Mol. Biol. 8:51-62.
237. Xie, Z., T. Okinaga, G. Niu, F. Qi, and J. Merritt. 2010. Identification of a novel bacteriocin regulatory system in Streptococcus mutans. Mol. Microbiol. 78:1431-1147.
238. Yamada, T., and J. Carlsson. 1975. Regulation of lactate dehydrogenase and change of fermentation products in streptococci. J. Bacteriol. 124:55-61.
239. Yamamoto, Y., K. Fukui, N. Koujin, H. Ohya, K. Kimura, and Y. Kamio. 2004. Regulation of the intracellular free iron pool by Dpr provides oxygen tolerance to Streptococcus mutans. J. Bacteriol. 186:5997-6002.
240. Yamashita, Y., W. H. Bowen, R. A. Burne, and H. K. Kuramitsu. 1993. Role of the Streptococcus mutans gtf genes in caries induction in the specific-pathogen-free rat model. Infect. Immun. 61:3811-3837.
241. Yamashita, Y., T. Takehara, and H. K. Kuramitsu. 1993. Molecular characterization of a STreptococcus mutans mutant altered in environmental stress responses. J. Bacteriol. 175:6220-6228.
242. Zeng, L., S. Das, and R. A. Burne. 2010. Utilization of lactose and galactose by Streptococcus mutans: transport, toxicity, and carbon catabolite repression. J. Bacteriol. 192:2434-2444.
243. Zeng, L., Z. T. Wen, and R. A. Burne. 2006. A novel signal transduction system and feedback loop regulate fructan hydrolase gene expression in Streptococcus mutans. Mol. Microbiol. 62:187-200.

217
244. Zhu, L., J. Kreth, S. E. Cross, J. K. Gimzewski, W. Shi, and F. Qi. 2006. Functional characterization of cell-wall-associated protein WapA in Streptococcus mutans. Microbiology 152:2395-2404.
245. Zubay, G., D. E. Morse, W. J. Schrenk, and J. H. Miller. 1972. Detection and isolation of the repressor protein for the tryptophan operon of Escherichia coli. Proc. Natl. Acad. Sci. U S A 69:1100-1103.

218
BIOGRAPHICAL SKETCH
Kinda Chikere Seaton was born in Georgetown, Guyana, South America, to
Julian M. P. and Yvette P. Seaton. She had her first son, Kymani O’mar on July 14,
2012.
Kinda moved to Manchester, Jamaica in 1996 where she completed her high
school education in July 2001. The author attended the Louisiana State University,
Baton Rouge from August 2001 to May 2005 as an undergraduate, where she was
awarded a non-resident full tuition scholarship. She graduated from LSU in May 2005
with a Bachelor of Science degree in Biological Sciences. The author worked as a
substitute teacher for the Charlotte- Mecklenburg School system from September 2005-
June 2006. In August 2006, she began her graduate career at the University of Florida
in the College of Medicine’s Interdisciplinary Program in Biomedical Sciences. From
May 2007 to the present, her graduate research in the Immunology and Microbiology
advanced concentration was supervised by Robert A. Burne, Ph.D.