a general method to eliminate laboratory induced...
TRANSCRIPT

Waugh et al. Virology Journal (2015) 12:55 DOI 10.1186/s12985-015-0280-x
METHODOLOGY Open Access
A general method to eliminate laboratoryinduced recombinants during massive, parallelsequencing of cDNA libraryCaryll Waugh1,2, Deborah Cromer3, Andrew Grimm3, Abha Chopra4, Simon Mallal4, Miles Davenport3*
and Johnson Mak1,2*
Abstract
Background: Massive, parallel sequencing is a potent tool for dissecting the regulation of biological processes byrevealing the dynamics of the cellular RNA profile under different conditions. Similarly, massive, parallel sequencingcan be used to reveal the complexity of viral quasispecies that are often found in the RNA virus infected host. However,the production of cDNA libraries for next-generation sequencing (NGS) necessitates the reverse transcription of RNA intocDNA and the amplification of the cDNA template using PCR, which may introduce artefact in the form of phantomnucleic acids species that can bias the composition and interpretation of original RNA profiles.
Method: Using HIV as a model we have characterised the major sources of error during the conversion of viral RNA tocDNA, namely excess RNA template and the RNaseH activity of the polymerase enzyme, reverse transcriptase. In additionwe have analysed the effect of PCR cycle on detection of recombinants and assessed the contribution of transfection ofhighly similar plasmid DNA to the formation of recombinant species during the production of our control viruses.
Results: We have identified RNA template concentrations, RNaseH activity of reverse transcriptase, and PCR conditionsas key parameters that must be carefully optimised to minimise chimeric artefacts.
Conclusions: Using our optimised RT-PCR conditions, in combination with our modified PCR amplification procedure,we have developed a reliable technique for accurate determination of RNA species using NGS technology.
Keywords: HIV, Recombination rate, Mutation rate, Transfection
BackgroundThe massive capacity of next generation sequencing(NGS) technologies is revolutionising transcriptomeanalysis and can be used to assess the complexity of viraldiversity in highly mutable, genomes of RNA viruses thatcause disease in humans, such as human immunodeficiencyvirus-1 (HIV-1). Accurate detection of clinically relevant,drug-resistant mutations is important for adapting patientdrug regimes. In addition, deep sequencing is used toinvestigate host cell and viral factors that impact on thegenetic diversity of HIV-1.
* Correspondence: [email protected]; [email protected] for Vascular Research, University of NSW, Sydney, NSW, Australia1School of Medicine, Deakin University and CSIRO(AAHL), Geelong, VIC,AustraliaFull list of author information is available at the end of the article
© 2015 Waugh et al.; licensee BioMed CentralCommons Attribution License (http://creativecreproduction in any medium, provided the orDedication waiver (http://creativecommons.orunless otherwise stated.
The production of cDNA libraries for NGS involveslaboratory procedures that include RNA extraction,reverse transcription PCR (RT-PCR) to generate cDNAfollowed by PCR amplification. Importantly, the amplifica-tion of each cDNA species must remain clonal, especiallywhen studying the diversity of RNA species. The laboratorymanipulations necessary for library generation are recog-nised as potential sources of artefactual recombination.Several papers have addressed the issue of minimising PCRartefacts [1-3] and there is growing interest in optimisingRT-PCR techniques to enable accurate analysis of patientRNA virus load and early detection of the emergence ofdrug resistant quasi-species [3-6].Thus, in both the clinical and experimental setting
there is a recognised need to identify sources of laboratoryinduced error and to minimise these to obtain a robusttechnique for generating DNA libraries for NGS that
. This is an Open Access article distributed under the terms of the Creativeommons.org/licenses/by/4.0), which permits unrestricted use, distribution, andiginal work is properly credited. The Creative Commons Public Domaing/publicdomain/zero/1.0/) applies to the data made available in this article,

Waugh et al. Virology Journal (2015) 12:55 Page 2 of 10
faithfully reflect the underlying genetic diversity of thevirus. In the current study there were three aspects ofsample processing that we were particularly interested inassessing and optimising: RNA concentration duringfirst strand synthesis; effect of RNase H activity andPCR cycling conditions. To assess the impact of theseon the introduction of recombinant artefact we useda mix of authentic wild-type (WT) HIV-1 and markervirus containing silent mutations[7] that are ideal forassessing sources of laboratory induced recombinationevents during cDNA library preparation. The markervirus is biologically and functionally indistinguishablefrom the parental WT virus, and thus mimics the closelyrelated, yet genetically distinct, quasi-species that exist ininfected patients.Using our viral system we have produced populations of
genetically distinct, but functionally identical, homozygousHIV-1 particles (containing either WT or marker RNA)and also heterozygous HIV-1 (containing a strand of WTand marker RNA) as sources of viral RNA species foranalysis of laboratory sources of recombination. Wehave characterised the important sources of error inRT-PCR that contribute to artificial chimera formationand, in combination with our modified PCR amplificationprocedure [1] and analytic tools [7], have developed areliable technique for accurate determination of viraldiversity using NGS. Our key observations are that (i)the amount of RNA used in the reverse transcriptionPCR must be kept to a minimum; (ii) approximately2,500 copies of cDNA should be input into the PCRamplification step and (iii) PCR cycles should be optimisedso that the amplification reaction is stopped whilst still inthe linear phase (27–29 cycles). Furthermore, we have alsoshown that homologous recombination during transfection,sometimes perceived as a source of experimental bias
Figure 1 Experimental method for assessing transfection as a sourcecells, harvested and quantitated using an ELISA assay to detect HIV-1 p24CA
amounts of homozygous WT and homozygous MK virus (top) or from an e
during virus production [8-11], is a negligible sourceof error and the effect of laboratory manipulations onestimates of mutation rate can be readily managed withappropriate rigorous experimental procedure.
Results and discussionIncreasing RNA concentration correlates with artificialchimera formation in reverse transcription PCR (RT-PCR)Many groups have exploited the depth and sensitivity ofNGS to characterise viral quasispecies in patient samplesespecially to identify rare HIV-1 variants and clinicallyimportant drug resistant mutations [3-6]. Where plasmaor tissue viral load is low, it is imperative that efforts tomaximise cDNA product for analysis, such as increasing(a) the amount of RNA that is reverse transcribed or (b)the amplification cycles during PCR, do not compromisethe original virus population species. To estimate theeffect of initial RNA concentration on the detectionof chimeric recombinants an equal amount (based onviral protein p24CA) of homozygous WT and MK viruseswere mixed together and RNA extracted (Figure 1 top).First strand synthesis was performed with three differentconcentrations of starting material using the high fidelitySSIII RT. RNA was added to the reverse transcription reac-tion mix at 160 ng, 1600 ng or 3990 ng, the maximumamount possible in this experiment given the concentra-tion of the extracted RNA. It should be noted that theseamounts are within the range recommended by themanufacturer (1 pg – 5ug). In order to stress the RT-PCRconditions and to mimic the effect of excessive template,at the highest template concentration (3990 ng), genespecific primers and dNTP’s were reduced 4-fold.The recombination events per 1000 nucleotides (REPN)
increased significantly as RNA concentration increased forRNA extracted from the mix of WT and MK virus
of artificial chimeras. Virus was produced by transfection of HEK293Tprotein. In these studies RNA was extracted from either a mix of equalquivalent amount of heterozygous virus (bottom).

Waugh et al. Virology Journal (2015) 12:55 Page 3 of 10
(Table 1a and Figure 2a). In addition, the number ofrelevant sequences retrieved from 454 sequencing declinedas the RNA input template increased and notably, thegreatest proportion of truncated sequences and the lowestproportion of sequences suitable for analysis occurred atthe highest input template (data not shown). There was aless pronounced effect on mutation with similar ratesfor low and mid-range input RNA templates, risingapproximately 3-fold at the highest input template(Table 1b and Figure 2b). These data indicate that theconcentration of RNA during reverse transcription canhave a profound effect on the quantity and quality ofsequencing data, can promote formation of artificialchimeras but has less impact on mutation rate.
Effect of PCR cycling conditions on chimera formationIt has been shown that PCR conditions have a significantimpact on the detection of genomic recombinants [1].Smyth et al. have developed modified cycling conditionsto minimise the occurrence of chimeras during PCR. Wesought to estimate the cumulative effects of optimal ver-sus non-optimal RT-PCR followed by optimal and non-optimal PCR conditions. RNA was reverse transcribed, asdescribed, varying the input amounts in the RT-PCR and
Table 1 Recombination and mutation rates
a. Recombination rates
RNA (ng) RT Virus PCR Cycles
160 SSIII wt + mk mix 27
1600 SSIII wt + mk mix 27
3990 SSIII wt + mk mix 27
2000 AMV wt + mk mix 27
160 SSIII Heterozygous 27
160 SSIII wt + mk mix 35
1600 SSIII wt + mk mix 35
3990 SSIII wt + mk mix 35
b. Mutation Rates
RNA (ng) RT Virus PCR Cycles
160 SSIII wt + mk mix 27
1600 SSIII wt + mk mix 27
3990 SSIII wt + mk mix 27
2000 AMV wt + mk mix 27
160 SSIII Heterozygous 27
160 SSIII wt + mk mix 35
1600 SSIII wt + mk mix 35
3990 SSIII wt + mk mix 35
RNA was extracted from either an equal mix of homozygous WT and MK viruses orusing increasing amounts of RNA as template using SSIII reverse transcriptase (RT),was also reverse transcribed using AMV with intact RNase H activity. Following firstor 35 PCR cycles. Replicates containing SYBR Green 1 dye were used to ensure the(35 cycles). Replicate samples were pooled and prepared for 454 NGS sequencing. RThe 95% confidence interval lower and upper boundaries, as determined by bootst
then diluted aliquots of cDNA were amplified with PCRusing identical conditions other than the number ofamplification cycles. PCR amplification was performedwith optimised cycles, where the amplification processwas terminated in the linear phase (25–28 cycles), orallowing the PCR to run to plateau (35 cycles). Amp-lification was followed in real time by monitoring dupli-cate samples that contained the fluorescent dye SYBRGreen 1. As expected, allowing the PCR amplification torun to ‘completion’ resulted in significant increases inrecombination rate in all cases (Table 1a compare 27cycles to 35 cycles and Figure 3a). The number of PCRcycles had very little impact on mutation rate(Table 1b and Figure 3b).
RNAse H activity has minor impact on chimera formationThe HIV-1 genome is comprised of 2 identical (or nearidentical) strands of RNA, that are used as templateduring reverse transcription to produce a cDNA moleculefor integration into the host genome during infection.Template switching during reverse transcription is ac-knowledged as an efficient mediator of viral diversity, gen-erating recombinant HIV RNA species that are amixture of the two parental RNA strands. Template
RR Lower 95% CI bound Upper 95% CI bound
0.0065 0.0000 0.0132
0.1029 0.0787 0.1391
0.8933 0.3675 1.8378
0.0742 0.0640 0.0901
0.0128 0.0064 0.0248
2.9482 2.7699 3.1668
4.6068 4.4601 4.7671
1.061 0.7903 1.4239
MR Lower 95% CI bound Upper 95% CI bound
0.1198 0.1075 0.1325
0.1551 0.1340 0.1763
0.4549 0.2674 0.6702
0.2169 0.2053 0.2288
0.1658 0.1503 0.1811
0.2172 0.1959 0.2396
0.1608 0.1494 0.1717
0.2819 0.2483 0.3166
from an equivalent amount of heterozygous virus and reverse transcribedengineered to have minimal RNase H activity. In a parallel experiment RNAstrand synthesis, cDNA was diluted as appropriate and amplified using 27reaction was stopped while in the log linear phase (27 cycles) or at plateauecombination and mutation rates are expressed as rate per 1000 nucleotides.rapping, are shown for each estimate.

160 1600 39900.0
0.5
1.0
1.5
2.0
2.5
RNA (ng)
reco
mb
inat
ion
rat
e
160 1600 39900.0
0.1
0.2
0.3
0.4
0.5
0.6
0.7
RNA (ng)
mu
tati
on
rat
e
a Recombination rate b Mutation rate
Figure 2 Effect of RNA concentration on (a) recombination and (b) mutation rates. RNA was extracted from an equal mix of WT and MKvirus. SSIII was used to reverse transcribe 160 ng, 1600 ng or 3990 ng as input template. At the highest RNA concentration dNTP’s and primerswere reduced 4-fold to mimic the effect of excess RNA template. Resulting cDNA was diluted such that ~2500 copies were input and amplified usingan optimised 2-step PCR and reduced (27) cycles to minimise PCR-induced recombination [1]. Recombination and mutation rates are expressed as rateper 1000 nucleotides and the confidence intervals, as estimated via bootstrapping, are shown. Significant differences (at 95%CI) are indicated.
Waugh et al. Virology Journal (2015) 12:55 Page 4 of 10
switching is thought to be facilitated through the action ofthe RNase H activity of the HIV-1 RT whereby a dynamicbalance exists between the polymerase activity of RT andthe endonuclease activity of RNase H that cleaves theRNA from the nascent cDNA polymer [12,13]. Accordingto the copy-choice model, RNase H degrades the RNAtemplate from the RNA/cDNA hybrid thus permittingthe newly synthesised DNA to base-pair with the similarsequence on the other RNA strand.As the aim of this study was to identify optimal
processes for minimising laboratory induced artefactwe performed a comparative analysis of AMV withSSIII. To assess the in vitro effect of RNase H activityon the formation of artificial recombinants viral RNAwas reverse transcribed using either the high fidelitySSIII enzyme, engineered to have reduced RNase Hactivity, or AMV RT with full RNase H activity. Wecompared the recombination rates detected for 160ng and 1600 ng of RNA transcribed with SSIII withthe rate for 2ug RNA transcribed using AMV-RT, as
160 1600 39900
1
2
3
4
5
6
27 cycles
35 cycles
RNA (ng)
reco
mb
inat
ion
rat
e
a Recombination rate
Figure 3 Effect of PCR cycle on (a) recombination and (b) mutation raResulting cDNA was diluted as described and amplified using a 2-step PCR anand mutation rates are expressed as rate per 1000 nucleotides and the confiddifferences (at 95%CI) are indicated.
recommended by the manufacturer. Surprisingly, theRNase H activity of AMV had little impact on the re-combination rate when compared to 1600 ng of RNAtranscribed with SSIII, however both of these were10-fold higher than the recombination rate at 160 nginput RNA using SSIII (Table 1 and Figure 4a). Theseresults further emphasise the influence of RNA concentra-tion on recombination during first strand synthesis. Themutation rate was similar for both enzymes (Table 1 andFigure 4b) and, in contrast to the recombination rate, wasnot significantly affected by RNA concentration.
Transfection of HEK293T cells does not contributesignificantly to chimera formationSeveral groups have developed experimental protocols tomeasure recombination rates of HIV-1 and other virusesthat require the production of virus from producer celllines using standard transfection methods and then useof the virus to infect cell lines and primary cells [14-17].Thus, transfection presents another potential source of
160 1600 39900.00.10.20.30.40.50.60.70.8
27 cycles35 cycles
RNA (ng)
mu
tati
on
rat
e
b Mutation rate
tes. RNA was extracted and transcribed as described in Figure 2.d either 27 cycles (white bars) or 35 cycles (black bars). Recombinationence intervals, as estimated via bootstrapping, are shown. Significant

SSIII-160 SSIII-1600 AMV-20000.00
0.05
0.10
0.15
0.20
RNA (ng)
reco
mb
inat
ion
rat
e
SSIII-160 SSIII-1600 AMV-20000.00
0.05
0.10
0.15
0.20
0.25
RNA (ng)
mu
tati
on
rat
e
a Recombination rate b Mutation rate
Figure 4 Effect of RNase H activity on (a) recombination and (b) mutation. RNA was extracted from an equal mix of WT and MK virus. SSIIIwas used to reverse transcribe 160 ng and 1600 ng as input template and AMV was used to reverse transcribe 2000 ng. All conditions compliedwith the manufacturers recommendations. Resulting cDNA was diluted and amplified using an optimised 2-step PCR and 27 cycles to minimisePCR-induced recombination [1]. Recombination and mutation rates are expressed as rate per 1000 nucleotides and the confidence intervals,as estimated via bootstrapping, are shown. Significant differences (at 95% CI) are indicated.
Waugh et al. Virology Journal (2015) 12:55 Page 5 of 10
artificial recombination. Indeed, previous studies haveshown that mammalian cells possess the enzymatic ma-chinery to effect homologous recombination and that(i) DNA topology affects homologous recombinationwith linear molecules the preferred substrates [9], (ii)homologous recombination can occur between singlestranded and double stranded DNA [10] and (iii) nickedDNA significantly enhances the frequency of homologousrecombination in transfected cells [8,11]. Our system ofmarker and wild type plasmids provides a unique oppor-tunity to assess the role of homologous recombination asa source of chimeric artefact during transfection.HEK293T cells were transfected with proviral DNA plas-mids to produce control viruses. We extracted RNA fromeither an equal mixture of homozygous WT and homozy-gous MK viruses (Figure 1 top) or from heterozygousWT/MK virus (based on p24 values) (Figure 1 bottom).Our sequencing data reveals that the heterozygous virus iscomposed of ~50% WT: 50%MK HIV-1 sequences (datanot shown). This is consistent with the premise that theplasmids used in transfection were equally transcribed.Given that: (i) the WT and MK plasmids were transfectedin equal ratios, (ii) each virion contains two copies ofRNA and (iii) the heterozygous virus also has equal ratiosof WT and MK virus, then the simplest and most likelyscenario is that 25% of virions contain two copies of WTvirus, 25% of virions contain two copies of MK virus and50% of virions contain one copy of WT virus and onecopy of MK virus. Any other scenario is less likely andwould require special pleading, and therefore we believethat our Mendelian assumption is valid. This is alsoconsistent with data published by Chen et al. [18] whowere able to directly discriminate between two differentRNA molecules encapsidated within the same virion par-ticle and confirmed that, using standard transfectiontechniques, RNA co-packaging was an efficient process(more than 90% of virions contained RNA) and that ~48%
of virions that contained RNA were heterozygous, as pre-dicted by the Hardy-Weinberg model.Samples were prepared using optimised RT-PCR (160 ng
input RNA template) and resulting cDNA was dilutedso that approximately 2,500 copies of HIV-1 cDNAwere used as template and amplified using our opti-mised PCR protocols. The mixture of homozygousRNA species provides a baseline measure of artefac-tual recombination attributable to downstream labora-tory manipulations, as any recombination betweenthese homozygous viruses could only have occurredduring RT-PCR, PCR or 454 sequencing. Thus, com-parison of the rate of recombination between the mixof homozygous viruses (equal mix of WT plus MK) withthat of the truly heterozygous viral RNA provides a noveland accurate estimate of the rate of transfection-inducedrecombination.Table 1 and Figure 5 show that the detection of recom-
binant species in the heterozygous virus was extremely lowand less than 2-fold higher than the mix of viruses. Theseresults are consistent with those of Levy et al. [14] whoused a GFP reporter system and found that recombinationwithin transfected cells to generate heterozygous virusesresulted in approximately 0.33% of the producer cellsexhibiting GFP fluorescence. Taken together, the dataindicate that the predominant sources of artefactualrecombination are the RT-PCR and PCR steps andthat increasing input RNA in the RT-PCR step andusing sub-optimal PCR conditions contribute signifi-cantly to the formation of chimeric species detectableby deep sequencing.
ConclusionsAny analysis of viral diversity through experimentationraises the possibility that recombinant quasi-species couldarise as a result of laboratory manipulations, includingvirus production (transfection), infection of primary cells

WT+MK mix WT/MK het0.00
0.01
0.02
0.03
reco
mb
inat
ion
rat
e
Figure 5 Occurrence of transfection induced recombination.Homozygous and heterozygous viruses were produced by transfectionof HEK293T cells as described in the methods. RNA was extracted froman equal mix of WT and MK virus or from an equivalent amount ofheterozygous virus. In parallel reactions SSIII was used to reversetranscribe 160 ng as input template. Resulting cDNA was diluted andamplified using an optimised 2-step PCR and 27 cycles to minimisePCR-induced recombination [1]. Any recombination occurring in themix of homozygous viruses can only be a consequence of RT-PCR,PCR and/or 454 sequencing (laboratory induced recombination).Recombination in the heterozygous virus reflects both laboratoryinduced recombination and transfection induced recombination.Recombination and mutation rates are expressed as rate per 1000nucleotides and the confidence intervals as estimated viabootstrapping are shown. There was no significant differencebetween these estimates.
Waugh et al. Virology Journal (2015) 12:55 Page 6 of 10
or cell lines, RNA extraction and conversion of RNA tocDNA (RT-PCR) and cDNA amplification. Mutationsin the form of insertions, deletions or substitutionscould occur during any of these procedures and deepsequencing. Further, with the vast improvements intreatment for HIV-1 infection that have occurred overthe last 30 years, clinicians are now able to investi-gate the emergence of viral quasi-species in individualpatients and to tailor drug regimes to counter theemergence of deleterious, drug-resistant mutants. Ex-perimental programs to identify viral and host cellfactors that affect recombination and clinical assessmentsof drug-resistant mutants require sensitive and validatedmethods to discern ‘true’ in vivo viral species from labora-tory induced artefacts.We produced genetically distinct, authentic HIV-1
viruses to investigate the most obvious sources oflaboratory induced error, namely: transfection, RT-PCR
and PCR conditions. Using our system we have beenable to compare recombination rates between a mixof homozygous viruses (where recombination could onlybe due to laboratory manipulations) and heterozygousvirus (where recombination could be due to laboratorymanipulations or to the transfection process). Our datashow that the transfection of HEK293T cells with plasmidDNA is an insignificant source of recombination andaffirms the appropriateness of using transfection-derivedviruses as model systems to identify viral and hostcell factors that affect recombination. We stress theimportance of using high quality plasmid DNA for theproduction of virus to minimise the risk of homologousrecombination within the culture system. This is consistentwith previous studies that have shown that nicked,non-circular plasmid DNA enhances the occurrenceof homologous recombination between plasmid andhomologous chromosomal regions [8,10].By comparison considerable attention must be paid to
the conditions of RT-PCR and PCR to minimise theoccurrence of artefactual chimeras. We postulatedthat increasing the concentration of RNA during firststrand synthesis would decrease the proximal distanceof strands of RNA and enhance strand transfer events,thus resulting in increased recombination rates. Our dataconfirm that RNA concentration in RT-PCR is a criticalparameter. Surprisingly, even acceptable ‘mid-range’concentrations of RNA template (1600 ng, well withinthe manufacturer’s suggested range) at the RT-PCRstep can result in detection of false chimeras. Thuswe show that even when using a high fidelity enzymewith low RNase H activity, RNA concentration is acritical factor and can have a marked effect on estimatesof recombination rate. We recommend that input RNA bekept to a minimum (100-200 ng) which, in this study,is at least 10-fold lower than that recommended bythe manufacturer. In accord with Di Giallonardo et al. [2],we have found that RNaseH activity does not contributesignificantly to artificial recombination when the concen-tration of RNA template is low.The PCR amplification of DNA is highly susceptible to
artefact. Previous studies have shown that input copynumber [1,2], annealing and extension steps [1] andnumber of PCR cycles [1,3] are critical parameters,requiring optimisation to minimise formation of artificialchimeras. In this study we used a 2-step PCR with opti-mised, limited input copy number (~2500 copies), shownto minimise artificial chimeras [1]. Varying only the numberof PCR cycles performed, we have shown that stopping thePCR amplification in the linear phase minimises falserecombinants whereas increasing cycle number to 35dramatically increased the detection of false chimeras. Ourdata show directly that while increasing the input RNAconcentration and PCR cycle might generate a larger viral
Waugh et al. Virology Journal (2015) 12:55 Page 7 of 10
cDNA population for analysis, such an approach islikely to compromise the quality of sequencing dataobtained. We have used the data to develop a protocolthat minimises the introduction of artificial recombinantsduring 454 library generation. The salient features of ourprotocol are: (i) restricted RNA input (100-200 ng) atRT-PCR for first strand synthesis using a high fidelityRT; (ii) ~2,500 copies of cDNA used as template forsubsequent PCR amplification; and (iii) restricting PCRcycles to ~27-29 cycles to ensure that the amplificationprocess is terminated in the linear phase of amplification.These studies have direct relevance to the clinical set-ting where minimisation of artefact is essential to obtain-ing accurate measurements of viral diversity anddetection of drug resistant mutations. The articulationof these critical parameters (RNA concentration, choice ofenzyme, input cDNA copies and PCR cycling parameters)
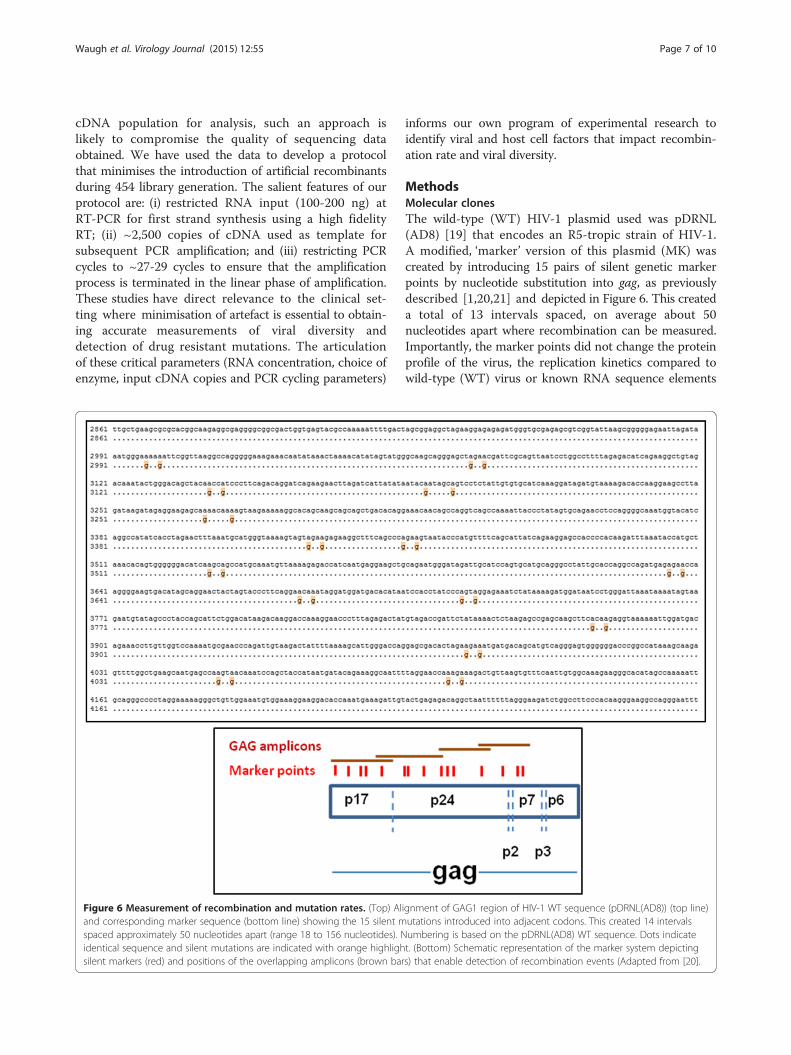
Figure 6 Measurement of recombination and mutation rates. (Top) Aland corresponding marker sequence (bottom line) showing the 15 silent mspaced approximately 50 nucleotides apart (range 18 to 156 nucleotides). Nidentical sequence and silent mutations are indicated with orange highlighsilent markers (red) and positions of the overlapping amplicons (brown bar
informs our own program of experimental research toidentify viral and host cell factors that impact recombin-ation rate and viral diversity.
MethodsMolecular clonesThe wild-type (WT) HIV-1 plasmid used was pDRNL(AD8) [19] that encodes an R5-tropic strain of HIV-1.A modified, ‘marker’ version of this plasmid (MK) wascreated by introducing 15 pairs of silent genetic markerpoints by nucleotide substitution into gag, as previouslydescribed [1,20,21] and depicted in Figure 6. This createda total of 13 intervals spaced, on average about 50nucleotides apart where recombination can be measured.Importantly, the marker points did not change the proteinprofile of the virus, the replication kinetics compared towild-type (WT) virus or known RNA sequence elements
ignment of GAG1 region of HIV-1 WT sequence (pDRNL(AD8)) (top line)utations introduced into adjacent codons. This created 14 intervalsumbering is based on the pDRNL(AD8) WT sequence. Dots indicatet. (Bottom) Schematic representation of the marker system depictings) that enable detection of recombination events (Adapted from [20].

Waugh et al. Virology Journal (2015) 12:55 Page 8 of 10
[1,20,21]. It is important to note that this system does notintroduce ‘foreign’ genes into the HIV-1 genome, such asfluorescent markers, antibiotic resistance genes or surfaceprotein markers that can drastically change the RNAstructure. Furthermore, the series of silent mutationsenables detection of recombination events over a signifi-cant length of the genome (Figure 6) and unlike othersystems, also permits the identification of multipletemplate switches. A full description of our systemand its attendant advantages in accurately measuringrecombination has been published [7,20].
Transfection and virus productionHomozygous virus was produced by transfection ofHEK293T cells with either WT or MK plasmid andheterozygous virus by co-transfection of equimolaramounts of WT and MK plasmids using polyethyleneimine
Table 2 Primers used for amplicon generation
a. Barcode sequences
Barcode Sequence (5′→3′)
RL1 ACACGACGACT
RL2 ACACGTAGTAT
RL3 ACACTACTCGT
RL4 ACGACACGTAT
RL5 ACGAGTAGACT
RL6 ACGCGTCTAGT
RL7 ACGTACACACT
RL8 ACGTACTGTGT
RL9 ACGTAGATCGT
RL10 ACTACGTCTCT
RL11 ACTATACGAGT
RL12 ACTCGCGTCGT
RL13 AGACTCGACGT
RL14 AGTACGAGAGT
RL15 AGTACTACTAT
RL16 AGTAGACGTCT
b. HIV-1 sequences common to WT and MK transcripts
Primer Sequence
G1(2945)Fw 5′ GAGATGGGTGCGAGAGCGTC 3
G1(3314)Rv 5′ TGTGTCAGCTGCTGCTTGCTG 3′
G2(3236)Fw 5′ ACCAAGGAAGCCTTAGATAAGA
G2(3679)Rv 5′ TGAAGGGTACTAGTAGTTCCTGC
G3(3584)Fw 5′ GATAGATTGCATCCAGTGCATGC
G3(3955)Rv 5′ GCTTTTAAAATAGTCTTACAATC
G4(3793)Fw 5′ TCTGGACATAAGACAAGGACCA
G4(4195)Rv 5′ ACATTTCCAACAGCCCTTTTTCC
Barcoded primers were designed so that marker points were amplified as 4 overlap(a) unique barcodes at the 5′ end; followed by (b) regions that were identical betwe
(PEI; Polysciences). Based on Mendelian genetics, theheterozygous virus will be composed of 3 distinct popula-tions: 25% of virus particles will contain 2 strands of WTRNA; 25% will contain 2 strands of MK RNA and 50% willbe truly heterozygous, containing a strand of WT and MKRNA. Sixteen to twenty hours after transfection cell cul-tures were gently washed with PBS and replenished withfresh media. At 48 hr post-transfection viral supernatantswere harvested, clarified by centrifugation, layeredover a 20% sucrose cushion and centrifuged for 1 hour at25,500 g, 4oC. Concentrated virus was then furtherrefined by layering onto a sucrose gradient (consistingof 9 sucrose layers ranging from 50% sucrose to 32%sucrose in 2.5% decrements) and centrifuged for 16 h,25,500 g, 4°C to reduce plasmid contamination. Con-centrated virus was resuspended in RPMI (Invitrogen),aliquoted and stored at −80°C. Quantitation of virus
Amplicon length (nt)
′ 370
TAGAGGAAGAG 3′ 444
TATGTCACTTC 3′
AG 3′ 372
TGGGTTCGC 3′
AAGG 3′ 403
TAG 3′
ping areas within the gag region of HIV-1. Primers were designed withen both WT and MK cDNA sequence.

Waugh et al. Virology Journal (2015) 12:55 Page 9 of 10
was done with an ELISA assay to detect viral capsidprotein using the HIV-1 p24CA Antigen Capture Assay(Frederick National Laboratory-AIDS and Cancer virusprogram).
RNA isolation and cDNA synthesisViral RNA was isolated using TRI-reagent (Qiagen)according to the manufacturer’s recommendations. RNAwas reverse transcribed using gene-specific primer, gag4(4195)Rv (5′ ACATTTCCAACAGCCCTTTTTCCTAG3′), and either SuperScript III reverse transcriptase (RT)(Invitrogen) engineered to have minimal RNaseH activityor AMV RT (with RNAse H activity) (Promega). Variableamounts of input RNA template were used in optimaland ‘stress’ conditions, as described in the results section.To gauge plasmid DNA contamination, RNA sampleswere processed without reverse transcriptase (RT) andthen analysed by qPCR using primers for gag1 amplicon.In all cases there was a minimum 10 cycle thresholddifferences between samples processed with the RT andthose without, indicating very low levels of plasmidcontamination.
PCR primersBarcoded PCR primers were designed so that markerpoints were amplified as 4 overlapping amplicons(~350 bp) covering the gag region of HIV-1 and desig-nated gag1, gag2, gag3 and gag4. Primers were designedwith unique barcodes at the 5′ end (Table 2a) followed byregions that were identical between WTand MK sequence(Table 2b).
PCR amplification conditionsModified PCR cycling conditions were used as describedpreviously [1] to reduce chimera formation during PCRamplification. Briefly, the PCR mix (total volume, 15ul)consisted of limiting DNA template (approximately2,500 copies in 5 ul), 1x HF buffer (Thermo Scientific),200uM dNTP (NEB), 400nM of each barcoded primerand 0.3U of Phusion DNA polymerase (Thermo Scientific).Five to ten replicates were performed to produce suffi-cient DNA product for library generation and sequen-cing. Additionally, to enable monitoring of the reactionusing qPCR, duplicates were included containing 0.5xSYBR Green 1 (Life Technologies). PCR cycling con-ditions were 98°C for 30s, followed by a variablenumber of cycles of 98°C for 10s and 72°C for 1 min. PCRcycles were selected either to minimise PCR-inducedchimera formation (25–29 cycles) or to maximise DNAproduct and to ‘stress’ PCR conditions (35-40cycles).
Library generation and 454 sequencingPCR replicates were pooled and purified using theWizard SV gel and PCR Clean-Up System (Promega)
following the recommended protocol and quantitatedagainst a plasmid standard curve, generated with gag1amplicon, ranging from 102-106 copies of DNA permicrolitre. Aliquots of each amplicon (gag1-gag4) for eachsample were pooled to construct sequencing librariesusing the 454 library preparation kit (Roche). EmulsionPCR and sequencing were performed using standardXLR70 chemistry at the Institute for Immunology andInfectious Diseases, Perth, Australia.
Statistical analysisSequencing analysis was performed using software customwritten in BioRuby. Chimera formation, expressed asrecombination rate per 1000 nucleotides (REPN), andstatistical comparisons performed as previously described[7]. Recombination is detected by monitoring the linkingof marker points in the HIV-1 gag gene from WTand MKgenomes into a single chimeric genome.
Competing interestsThe authors declare that they have no competing interests.
Authors’ contributionsCW performed the experiments and cDNA library preparation and draftedthe manuscript with input from JM and DC. DC, AG conducted the dataanalysis to determine recombination and mutation rates and providedstatistical analysis. AC and SM provided 454 library preparation andsequencing. MD and JM made substantial contributions to conceptionand design. All authors have read and approved the final manuscript.
Author details1School of Medicine, Deakin University and CSIRO(AAHL), Geelong, VIC,Australia. 2Biosecurity Flagship, CSIRO(AAHL), Geelong, VIC, Australia. 3Centrefor Vascular Research, University of NSW, Sydney, NSW, Australia. 4Institute forImmunology and infectious diseases (IIID), Murdoch University, Perth, WA,Australia.
Received: 3 December 2014 Accepted: 16 March 2015
References1. Smyth RP, Schlub TE, Grimm A, Venturi V, Chopra A, Mallal S, et al. Reducing
chimera formation during PCR amplification to ensure accurate genotyping.Gene. 2010;469(1–2):45–51.
2. Di Giallonardo F, Zagordi O, Duport Y, Leemann C, Joos B, Kunzli-GontarczykM, et al. Next-generation sequencing of HIV-1 RNA genomes: determinationof error rates and minimizing artificial recombination. PLoS One.2013;8(9):e74249.
3. Shao W, Boltz VF, Spindler JE, Kearney MF, Maldarelli F, Mellors JW, et al.Analysis of 454 sequencing error rate, error sources, and artifact recombinationfor detection of Low-frequency drug resistance mutations in HIV-1 DNA.Retrovirology. 2013;10:18.
4. Dudley DM, Chin EN, Bimber BN, Sanabani SS, Tarosso LF, Costa PR, et al.Low-cost ultra-wide genotyping using Roche/454 pyrosequencing forsurveillance of HIV drug resistance. PLoS One. 2012;7(5):e36494.
5. Fisher R, van Zyl GU, Travers SA, Kosakovsky Pond SL, Engelbrech S, MurrellB, et al. Deep sequencing reveals minor protease resistance mutations inpatients failing a protease inhibitor regimen. J Virol. 2012;86(11):6231–7.
6. Avidor B, Girshengorn S, Matus N, Talio H, Achsanov S, Zeldis I, et al.Evaluation of a benchtop HIV ultradeep pyrosequencing drug resistanceassay in the clinical laboratory. J Clin Microbiol. 2013;51(3):880–6.
7. Schlub TE, Smyth RP, Grimm AJ, Mak J, Davenport MP. Accuratelymeasuring recombination between closely related HIV-1 genomes.PLoS Comput Biol. 2010;6(4):e1000766.

Waugh et al. Virology Journal (2015) 12:55 Page 10 of 10
8. Kucherlapati RS, Eves EM, Song KY, Morse BS, Smithies O. Homologousrecombination between plasmids in mammalian cells can be enhanced bytreatment of input DNA. Proc Natl Acad Sci U S A. 1984;81(10):3153–7.
9. Wake CT, Vernaleone F, Wilson JH. Topological requirements forhomologous recombination among DNA molecules transfected intomammalian cells. Mol Cell Biol. 1985;5(8):2080–9.
10. Rauth S, Song KY, Ayares D, Wallace L, Moore PD, Kucherlapati R.Transfection and homologous recombination involving single-strandedDNA substrates in mammalian cells and nuclear extracts. Proc Natl Acad SciU S A. 1986;83(15):5587–91.
11. Sprengel R, Varmus HE, Ganem D. Homologous recombination betweenhepadnaviral genomes following in vivo DNA transfection: implications forstudies of viral infectivity. Virology. 1987;159(2):454–6.
12. Coffin JM. Structure, replication, and recombination of retrovirus genomes:some unifying hypotheses. J Gen Virol. 1979;42(1):1–26.
13. Hwang CK, Svarovskaia ES, Pathak VK. Dynamic copy choice: steady statebetween murine leukemia virus polymerase and polymerase-dependentRNase H activity determines frequency of in vivo template switching.Proc Natl Acad Sci U S A. 2001;98(21):12209–14.
14. Levy DN, Aldrovandi GM, Kutsch O, Shaw GM. Dynamics of HIV-1 recombinationin its natural target cells. Proc Natl Acad Sci U S A. 2004;101(12):4204–9.
15. Dapp MJ, Clouser CL, Patterson S, Mansky LM. 5-Azacytidine can inducelethal mutagenesis in human immunodeficiency virus type 1. J Virol.2009;83(22):11950–8.
16. Dapp MJ, Heineman RH, Mansky LM. Interrelationship between HIV-1 fitnessand mutation rate. J Mol Biol. 2013;425(1):41–53.
17. Nguyen LA, Kim DH, Daly MB, Allan KC, Kim B. Host SAMHD1 proteinpromotes HIV-1 recombination in macrophages. J Biol Chem.2014;289(5):2489–96.
18. Chen J, Nikolaitchik O, Singh J, Wright A, Bencsics CE, Coffin JM, et al. Highefficiency of HIV-1 genomic RNA packaging and heterozygote formationrevealed by single virion analysis. Proc Natl Acad Sci U S A.2009;106(32):13535–40.
19. Englund G, Theodore TS, Freed EO, Engelman A, Martin MA. Integration isrequired for productive infection of monocyte-derived macrophages byhuman immunodeficiency virus type 1. J Virol. 1995;69(5):3216–9.
20. Schlub TE, Grimm AJ, Smyth RP, Cromer D, Chopra A, Mallal S, et al. Fifteento twenty percent of HIV substitution mutations are associated withrecombination. J Virol. 2014;88(7):3837–49.
21. Smyth RP, Schlub TE, Grimm AJ, Waugh C, Ellenberg P, Chopra A, et al.Identifying recombination hot spots in the HIV-1 genome. J Virol.2014;88(5):2891–902.
Submit your next manuscript to BioMed Centraland take full advantage of:
• Convenient online submission
• Thorough peer review
• No space constraints or color figure charges
• Immediate publication on acceptance
• Inclusion in PubMed, CAS, Scopus and Google Scholar
• Research which is freely available for redistribution
Submit your manuscript at www.biomedcentral.com/submit