a genome-wide gene function prediction resource for drosophila
TRANSCRIPT
A Genome-Wide Gene Function Prediction Resource forDrosophila melanogasterHan Yan1,2, Kavitha Venkatesan1,2¤a, John E. Beaver5, Niels Klitgord1,2¤c, Muhammed A. Yildirim1,2,4¤b,
Tong Hao1,2, David E. Hill1,2, Michael E. Cusick1,2, Norbert Perrimon2,3, Frederick P. Roth1,5*, Marc
Vidal1,2*
1 Department of Cancer Biology, Center for Cancer Systems Biology (CCSB), Dana-Farber Cancer Institute, Boston, Massachusetts, United States of America, 2 Department
of Genetics, Harvard Medical School, Boston, Massachusetts, United States of America, 3 Howard Hughes Medical Institute, Boston, Massachusetts, United States of
America, 4 Applied Physics Program, Division of Engineering and Applied Sciences, Graduate School of Arts and Sciences, Harvard University, Cambridge, Massachusetts,
United States of America, 5 Department of Biological Chemistry and Molecular Pharmacology, Harvard Medical School, Boston, Massachusetts, United States of America
Abstract
Predicting gene functions by integrating large-scale biological data remains a challenge for systems biology. Here wepresent a resource for Drosophila melanogaster gene function predictions. We trained function-specific classifiers tooptimize the influence of different biological datasets for each functional category. Our model predicted GO terms andKEGG pathway memberships for Drosophila melanogaster genes with high accuracy, as affirmed by cross-validation,supporting literature evidence, and large-scale RNAi screens. The resulting resource of prioritized associations betweenDrosophila genes and their potential functions offers a guide for experimental investigations.
Citation: Yan H, Venkatesan K, Beaver JE, Klitgord N, Yildirim MA, et al. (2010) A Genome-Wide Gene Function Prediction Resource for Drosophilamelanogaster. PLoS ONE 5(8): e12139. doi:10.1371/journal.pone.0012139
Editor: Nicholas James Provart, University of Toronto, Canada
Received January 12, 2010; Accepted July 14, 2010; Published August 12, 2010
Copyright: � 2010 Yan et al. This is an open-access article distributed under the terms of the Creative Commons Attribution License, which permits unrestricteduse, distribution, and reproduction in any medium, provided the original author and source are credited.
Funding: This work was supported by grants from the National Institutes of Health (NIH; HG001715, HG004233 and HG003224; http://www.nih.gov/), theCanadian Institute for Advanced Research (http://www2.cifar.ca/), and the Presidential Scholarship from Harvard University (http://www.harvard.edu/). Thefunders had no role in study design, data collection and analysis, decision to publish, or preparation of the manuscript.
Competing Interests: The authors have declared that no competing interests exist.
* E-mail: [email protected] (FPR); [email protected] (MV)
¤a Current address: Novartis Institutes for Biomedical Research, Cambridge, Massachusetts, United States of America¤b Current address: Whitehead Institute for Biomedical Research, Cambridge, Massachusetts, United States of America¤c Current address: Bioinformatics Program, Boston University, Boston, Massachusetts, United States of America
Introduction
A challenge in systems biology is to assign functions to genes
from the information in large-scale datasets, maximizing the utility
of available information to make predictions of function with
verifiable performance. As initial maps of protein-protein
interaction networks, gene expression profiles, and other large-
scale dataset types have become available for several model
organisms [1–15], machine-learning algorithms—including Bayes-
ian network, Markov random field, decision tree, and Support
Vector Machine (SVM) approaches—have been applied to these
datasets to predict gene function [16–25].
Most function prediction models currently available [16–19,21–
25] in some way incorporate supervised machine learning [26]. In
supervised machine learning, a series of ‘features’ describing the
relationships between either two genes or a gene-function pair are
calculated using known properties of the genes or corresponding
proteins, such as the shortest path in protein-protein interaction
networks or the correlation in gene expression profiles. A set of
positive (known to exist) and negative (known/expected to not
exist) gene-function pairs, along with calculated features for
corresponding genes, are then designated as the training data. In
the learning step, the model generalizes a classifier from the
training data, and uses this classifier to predict a class label for each
instance of input data provided to the model. Generally the class
label is either ‘true’ or ‘false’ for a gene-function pair, although in
some models an intermediate classifier is also trained to assign a
label of ‘sharing function’ or ‘not sharing function’ for a pair of two
genes [22,23]. The performance of these models is usually
evaluated by the ‘‘hide-and-discover’’ strategy of cross-validation,
in which the knowledge space of gene-function pairs is randomly
split into a training set and a test set. The model is trained on the
data in the training set, and then used to predict functions of genes
in the test set by classifying gene-function pairs with ‘true’ or ‘false’
labels. Performance is measured by comparing predictions and
real gene-function associations in the test set.
It can be useful to optimize the importance of features for
different functional categories. For example, while co-expression of
two genes can indicate shared functions between the two genes in
embryonic developmental processes, it is less informative for
cytoskeleton functions, which rely more heavily on physical
interactions between proteins.
To generate a resource of gene function predictions for Drosophila
melanogaster, we applied an approach which used biological relation-
ships to train individual classifiers for each specific functional category
(here either a GO term or a KEGG pathway), thereby optimizing the
importance of each feature extracted from different biological
datasets for the prediction of each function. The datasets we used
to calculate features were protein-protein interaction networks[27],
gene expression profiles [7,28], genetic interaction datasets [29,30],
PLoS ONE | www.plosone.org 1 August 2010 | Volume 5 | Issue 8 | e12139

conserved protein domains [31] and cross-species sequence similarity
based on BLAST analysis [32,33]. To train our classifier we used a
Random Forest algorithm [34], which constructs an ensemble of
Decision Tree classifiers. The natural resistance of Random Forest to
over-fitting and its excellent performance tackling large-scale datasets
with multiple features [35] makes it a good candidate for function
prediction in Drosophila.
To evaluate prediction performance, we used a typical 10-fold
cross-validation [36] to analyze the sensitivity/specificity and
precision/recall characteristics of the model. We examined the
reliability of our predictions against literature evidence, and
compared our prediction results against positive and negative hits
available in the genome-wide RNAi screening data obtained at the
Harvard Medical School Drosophila RNAi Screening Center
(DRSC, http://flyrnai.org) [37]. The considerable overlap
between our prediction results, RNAi screening datasets and
other literature evidence indicates that our list of prioritized
Drosophila gene-function associations can serve as a guide for future
experimental investigations, including identification of false-
negatives in RNAi screens.
Results
GO terms and KEGG pathway membership prediction forDrosophila genes
The Gene Ontology (GO, www.geneontology.org) [38] and the
Kyoto Encyclopedia of Genes and Genomes (KEGG) [39] were
our two major sources for functional annotations. As of November
2009, Gene Ontology and FlyBase (www.flybase.org) [30] had
annotated around 11,000 Drosophila genes with over 6,000 GO
terms among the three GO branches: biological process,
molecular function, and cellular component. Here we focused
on the biological process (BP) branch. Each association of a gene
and a GO term is labeled with some GO evidence codes [38],
which denote the sources from which the association was learned.
For the KEGG side, 143 pathways were assigned to 2241
Drosophila genes as of November 2009 (www.genome.jp/kegg). We
also included three well-known pathways not yet represented in
KEGG—JNK Signaling, Insulin/AKT and Hippo pathways—
based on information from The Interactive Fly Database (http://
www.sdbonline.org/fly/aimain/1aahome.htm) [40].
To avoid potential circularity we filtered the GO-gene
associations in the training set by GO evidence codes. All GO
term associations derived from non-experimental (IEA/RCA
evidence codes. IEA: Inferred from Electronic Annotation;
RCA: inferred from Reviewed Computational Analysis) or non-
machine-traceable sources (TAS/NAS/ND/IC evidence codes.
TAS: Traceable Author Statement; NAS: Non-traceable Author
Statement; ND: No biological Data available; IC: Inferred by
Curator), or from the datasets we used to calculate the features
used in the prediction (IEP/IPI/IGI/ISS evidence codes. IEP:
Inferred from Expression Pattern; IPI: Inferred from Physical
Interaction; IGI: Inferred from Genetic Interaction; ISS: Inferred
from Sequence or Structural Similarity) were removed, leaving
only associations with IDA (inferred from direct assays) and IMP
(inferred from mutant phenotypes) codes to be used as true
positives. To remove GO terms that were too broadly defined
(e.g., ‘‘biological process’’ or ‘‘cellular process’’), we excluded GO
terms to which 500 or more Drosophila genes had been assigned.
To train the prediction model we calculated features from four
large-scale biological datasets: protein-protein interactions, co-
expression, genetic interactions, conserved protein domains and
sequence similarity. For each functional category (either a GO
term or a KEGG pathway), a number of ‘‘features’’ were derived
to describe the a priori similarity between the gene in question
(candidate gene) and those genes known to belong to the given
functional category before the prediction (reference genes). Each
feature consisted of the average, maximum and minimum values
of a specific measurement between the candidate gene and all
reference genes in the given function category. These features
were pair-wise shortest paths (the minimum number of steps
needed to connect one node to the other one on a network) in the
protein-protein interaction network and in the genetic interaction
network, correlation of expression profiles in microarray expres-
sion datasets, correlation of genetic interaction profiles, number of
shared protein domains, correlation of protein domain profiles,
and sequence similarity.
Evaluating the performance of GO term and KEGGpathway prediction model
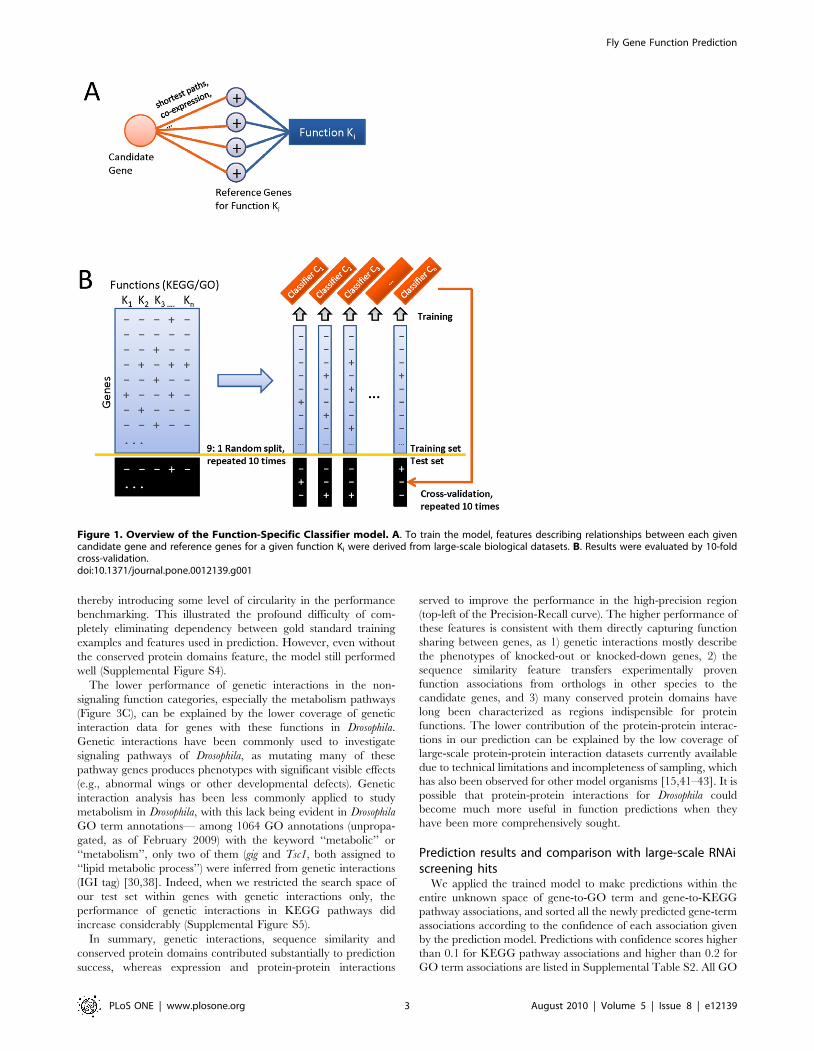
We used 10-fold cross-validation to evaluate the performance of
our model. All the combinations of annotated genes and functional
categories were randomly split into ten subsamples, taking one
subsample as the test set and keeping the rest as the training set. A
list of classifiers (one classifier for each function) were trained by
the Random Forest Algorithm [34]. These trained classifiers were
then used to calculate the confidence score of true association for
each gene-function pair in the test set. We repeated the process ten
times so that each subsample was used once as the test set
(Figure 1).
We evaluated the performance of GO term prediction and
KEGG pathway membership prediction with Receiver Operating
Characteristic curves (ROC) and Precision-Recall (PRC) curves
(Figures 2, 3). We examined the performance of each independent
feature alone, as well as the effect on performance of leaving each
feature out (Supplemental Figures S3, S4).
For GO term predictions, genetic interactions were the most
informative, followed by sequence similarity, while conserved
protein domains, protein-protein interactions and expression
profiles contributed less (Figure 2A,B). The trend was similar
when we assessed the model performance against different levels of
GO term specificity defined by the number of genes associated
with each GO term (Figure 2C–F). Given that all true associations
in our test sets were derived from direct experiments (inferred from
either mutant phenotypes or direct assays), the high performance
of genetic interactions and sequence similarity features in the
cross-validation indicates that many experiment-derived GO term
associations could have been learned through systematic analysis
of the genetic interaction network and phylogenetics of Drosophila
genes.
For KEGG pathway membership prediction we classified all
KEGG pathways into three groups: metabolism, signaling, and
basic functions (Supplemental Table S1). We evaluated the
performance in each group as well as the overall performance.
The conserved protein domains and sequence similarity features
offered the highest overall performance, despite removal of
homology within KEGG Orthology (KO) groups (groups of gene
orthologs sharing similar functions that have been annotated with
the same conserved pathway by KEGG) from the model. That the
sequence similarity feature remained highly informative suggests
that the KO groups could be further expanded (Figure 3A,B),
especially for metabolism and basic function categories
(Figure 3C,E). For signaling pathway predictions, genetic interac-
tions provided the best performing feature (Figure 3D), while
sequence similarity scored second. We noted that the conserved
protein domains could owe some performance success to the fact
that genes in certain KEGG pathways may have been placed in
the same pathway by virtue of sharing a common protein domain,
Fly Gene Function Prediction
PLoS ONE | www.plosone.org 2 August 2010 | Volume 5 | Issue 8 | e12139
thereby introducing some level of circularity in the performance
benchmarking. This illustrated the profound difficulty of com-
pletely eliminating dependency between gold standard training
examples and features used in prediction. However, even without
the conserved protein domains feature, the model still performed
well (Supplemental Figure S4).
The lower performance of genetic interactions in the non-
signaling function categories, especially the metabolism pathways
(Figure 3C), can be explained by the lower coverage of genetic
interaction data for genes with these functions in Drosophila.
Genetic interactions have been commonly used to investigate
signaling pathways of Drosophila, as mutating many of these
pathway genes produces phenotypes with significant visible effects
(e.g., abnormal wings or other developmental defects). Genetic
interaction analysis has been less commonly applied to study
metabolism in Drosophila, with this lack being evident in Drosophila
GO term annotations— among 1064 GO annotations (unpropa-
gated, as of February 2009) with the keyword ‘‘metabolic’’ or
‘‘metabolism’’, only two of them (gig and Tsc1, both assigned to
‘‘lipid metabolic process’’) were inferred from genetic interactions
(IGI tag) [30,38]. Indeed, when we restricted the search space of
our test set within genes with genetic interactions only, the
performance of genetic interactions in KEGG pathways did
increase considerably (Supplemental Figure S5).
In summary, genetic interactions, sequence similarity and
conserved protein domains contributed substantially to prediction
success, whereas expression and protein-protein interactions
served to improve the performance in the high-precision region
(top-left of the Precision-Recall curve). The higher performance of
these features is consistent with them directly capturing function
sharing between genes, as 1) genetic interactions mostly describe
the phenotypes of knocked-out or knocked-down genes, 2) the
sequence similarity feature transfers experimentally proven
function associations from orthologs in other species to the
candidate genes, and 3) many conserved protein domains have
long been characterized as regions indispensible for protein
functions. The lower contribution of the protein-protein interac-
tions in our prediction can be explained by the low coverage of
large-scale protein-protein interaction datasets currently available
due to technical limitations and incompleteness of sampling, which
has also been observed for other model organisms [15,41–43]. It is
possible that protein-protein interactions for Drosophila could
become much more useful in function predictions when they
have been more comprehensively sought.
Prediction results and comparison with large-scale RNAiscreening hits
We applied the trained model to make predictions within the
entire unknown space of gene-to-GO term and gene-to-KEGG
pathway associations, and sorted all the newly predicted gene-term
associations according to the confidence of each association given
by the prediction model. Predictions with confidence scores higher
than 0.1 for KEGG pathway associations and higher than 0.2 for
GO term associations are listed in Supplemental Table S2. All GO
Figure 1. Overview of the Function-Specific Classifier model. A. To train the model, features describing relationships between each givencandidate gene and reference genes for a given function Ki were derived from large-scale biological datasets. B. Results were evaluated by 10-foldcross-validation.doi:10.1371/journal.pone.0012139.g001
Fly Gene Function Prediction
PLoS ONE | www.plosone.org 3 August 2010 | Volume 5 | Issue 8 | e12139

Fly Gene Function Prediction
PLoS ONE | www.plosone.org 4 August 2010 | Volume 5 | Issue 8 | e12139

term association predictions are also readily accessible and
downloadable via the FuncBase website (http://func.med.harvard.
edu/) [44].
To systematically evaluate the quality of these predictions we
turned to genome-wide assays of gene function available from the
Drosophila RNAi Screening Center at Harvard Medical School
(DRSC), where RNAi screens are undertaken to systematically
interrogate signaling pathways (e.g., MAPK, Wingless/Wnt,
Hedgehog, JAK/STAT, and JNK pathways). These RNAi
datasets are independent from the datasets we used for function
predictions (protein-protein interactions, expression profiles and
genetic interactions). Our trained model was applied to all gene-
pathway pairs tested in these RNAi screens. We then assessed the
quality of our predictions against the strong and medium signals in
DRSC RNAi screening results as the positive reference set, and
the non-signal results as the negative reference set, with the
performance of our model assessed as precision vs. recall and
precision as a function of cutoff score (Figure 4). Given the limited
sensitivity inherent to RNAi experiments [45], the performance
gauged by RNAi screens was, as expected, lower than that found
by cross-validation. However, predictions with high confidence
scores achieved high precision, indicating that our top predictions
were well supported by RNAi experiments and hence likely to be
biologically relevant (Figure 4B,D).
To evaluate the statistical significance of the overlap between
our predictions and RNAi screens, we labeled the top 0.5% of the
prediction results ranked by confidence score as positive
predictions, and compared them to RNAi screening data from
DRSC (Supplemental Tables S3, S4). For each gene found with a
strong or medium signal in RNAi screens, we examined whether
we had a positive prediction for the corresponding function on a
keyword-matching basis. We then compared the total number of
matched associations against randomized RNAi screening data.
We found significant overlap (compared to randomized RNAi
data, p,1025; Figure 5) between our computational predictions
and the RNAi screening results, either in specific functions/
pathways (Wnt and MAPK pathways, as well as neuronal
functions) or in overall correspondence between the two studies.
The performance of a canonical supervised machine-learning
model, trained on the same prior features and training space we
used for our function-specific classifier model and differing in that
it aggregates training data for all GO terms, is shown for
comparison (Figure 5). The predictions from our function-specific
classifier model had higher overlap with RNAi results than the
canonical model in all situations examined.
Our prediction results also provided a way to identify potential
false negatives in RNAi screens. In the JAK-STAT pathway the
genes upd3 and BRWD3 were scored 0.632 and 0.530, ranked 5th
and 8th respectively among all Drosophila genes for potential
involvement in the JAK-STAT pathway (Supplemental Table S2).
Neither gene scored positively in the JAK-STAT screen. However,
the upd3 gene is required in the fat-body-specific activation of the
Drosophila JAK-STAT pathway [46], and the BRWD3 gene is a
positive regulator of JAK-STAT pathway found in a third-party
RNAi screen [47]. Hence, the prioritized gene-function pairs we
provided could serve as a useful resource to identify pathway
components that might otherwise be missed by RNAi screening
alone.
To examine the quality of our predictions in greater detail on a
specific example, we compared prediction results for the Drosophila
c-Jun N-terminal kinase (JNK) pathway to a recently published
RNAi dataset specific for JNK pathway activations [48]. We found
four genes (nec, CG7338, Rac2 and Mnn1) in the top 5% by
prediction score that were shown to result in activation of JNK
signaling when knocked down by RNAi (Supplemental Table S5).
The confidence scores we assigned to the four genes roughly
correlated with the strength of JNK activation signals upon RNAi
of these genes. The nec and CG7338 genes were among our top
predictions for the JNK pathway (0.872 and 0.639, ranked 1st and
3rd respectively, Supplemental Table S2) and showed high JNK
activation when knocked down by RNAi. Rac2 had a lower
confidence score (0.338) and lower JNK activation signal, while
Mnn1 had the lowest confidence score and JNK signal.
Discussion
The goal of function prediction is to infer novel functions for genes
to help prioritize hypothesis-driven experimentation. The available
evidence allows current prediction methods to quantify the shades of
gray in gene function annotation. Therefore, the goal of experiment-
prioritization is better approached not by assigning functions to genes
in a binary fashion, but rather by prioritizing the most promising novel
gene-function associations for future small-scale investigations
[19,49,50]. Here we have provided a genome-wide resource of
prioritized associations between Drosophila genes and their potential
biological functions. Our model also helps to indicate false negatives
in RNAi screening results, which often arise due to limited sensitivity
in RNAi experiments [45] caused by both limited RNAi efficiency
and tissue specificity of gene expression. High-scoring predictions not
already verified in published screens could become interesting
candidates for higher-sensitivity validation experiments, as suggested
in our comparison with systematic RNAi screening data.
For the experimentalist users of function predictions, the quality
of the predictions is an important concern. Currently available
models generally rely on cross-validation for quality assessment of
model performance, although some models use literature-mining
and small-scale forward genetics assays to characterize the quality
of a few prioritized prediction results [51]. We demonstrated the
high performance of our prediction model relative to independent
large-scale RNAi results that were not used in training our
computational models. The significant overlap between our
computational predictions and RNAi screening results suggests
that RNAi screen results can be improved by using computational
predictions to guide experiments, performing RNAi screens in
size-reduced, prioritized subspaces predicted by our model, thus
allowing more tissue types or experimental conditions to be tested
with the same resources.
Materials and Methods
Sources of datasetsGenome-wide gene expression data across different develop-
mental stages of Drosophila was obtained from the Berkeley
Drosophila Genome Project (BDGP) [7] (www.fruitfly.org), which
provided the expression data collected during Drosophila embryo-
genesis, and from a dataset [28] which covered the life cycle of
Drosophila. Additional expression data for Drosophila genes were
Figure 2. Performance of the GO term prediction model. Receiver Operating Characteristic curves (A) and Precision-Recall curves (B) for theoverall performance and contribution of each feature in GO term (biological process, BP) prediction. Precision-Recall curves for the GO termprediction model for GO terms with various degrees of specificity, i.e., those that have been annotated with 2–25 genes (C), 25–50 genes (D), 50–100genes (E), and 100–500 genes (F).doi:10.1371/journal.pone.0012139.g002
Fly Gene Function Prediction
PLoS ONE | www.plosone.org 5 August 2010 | Volume 5 | Issue 8 | e12139
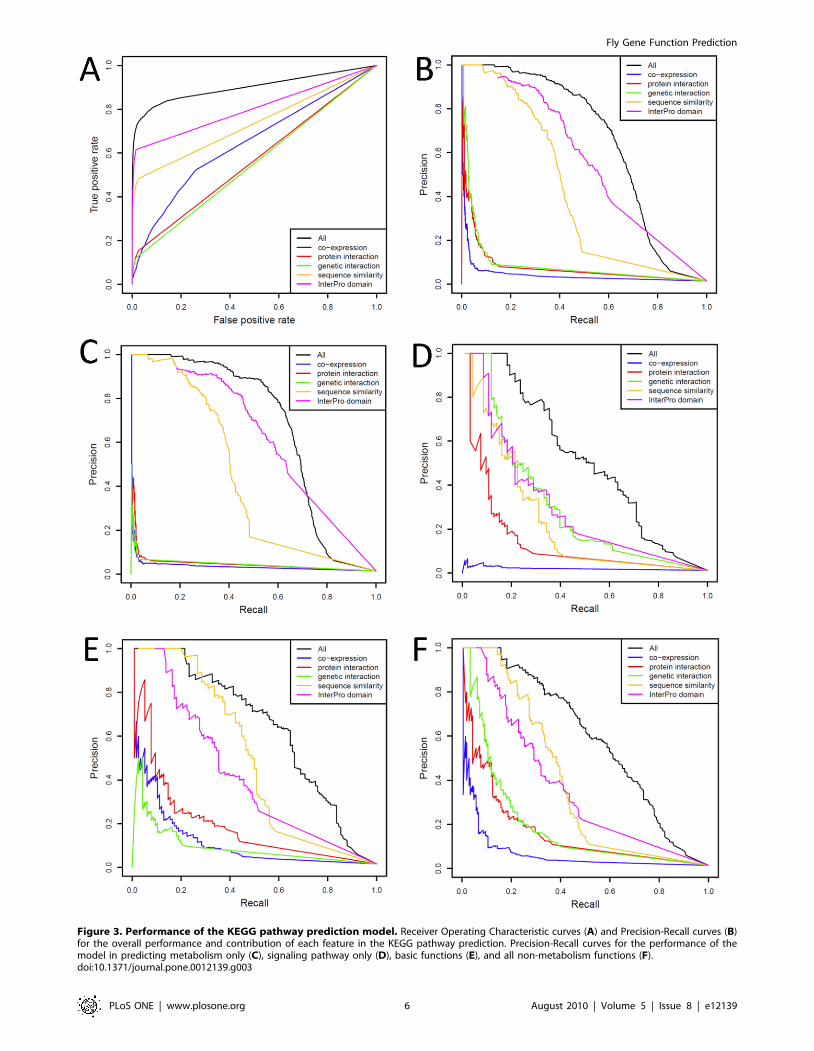
Figure 3. Performance of the KEGG pathway prediction model. Receiver Operating Characteristic curves (A) and Precision-Recall curves (B)for the overall performance and contribution of each feature in the KEGG pathway prediction. Precision-Recall curves for the performance of themodel in predicting metabolism only (C), signaling pathway only (D), basic functions (E), and all non-metabolism functions (F).doi:10.1371/journal.pone.0012139.g003
Fly Gene Function Prediction
PLoS ONE | www.plosone.org 6 August 2010 | Volume 5 | Issue 8 | e12139

obtained from a variety of published datasets[52–74] at NCBI
Gene Expression Omnibus (GEO) (Supplemental Table S7).
Genome-wide gene sequences were downloaded from NCBI
RefSeq database [32]. GO terms and gene-term associations were
downloaded from the February 2009 snapshot of Gene Ontology
database [38] (www.geneontology.org). Genetic interactions were
obtained from BioGRID (www.thebiogrid.org) and FlyBase (www.
flybase.org) [29,30]. Physical protein-protein interactions in
Drosophila were obtained from the Comprehensive Drosophila
Interactions Database v5.0 (DroID, www.droidb.org) [27].
Conserved protein domain information was downloaded from
InterPro (www.ebi.ac.uk/interpro/) [31]. Pathway annotations
were downloaded from Kyoto Encyclopedia of Genes and
Genomes (KEGG, www.genome.jp/kegg) [39].
Random Forest algorithm, prediction model and priorfeatures
We used the randomForest package for R-language (http://cran.r-
project.org/web/packages/randomForest/index.html) [75] to train
and test our prediction model. For each functional category (either a
KEGG pathway or GO term) a Random Forest classifier was trained,
and for each classifier 500 decision trees were generated. We left
other parameters at default levels as defined by the randomForest
package.
Figure 4. Assessing prediction quality against RNAi screening results. Precision-Recall curves (A) and the curves for precision vs. confidencescore threshold (B) for the quality of GO term prediction measured by DRSC RNAi screening results; Precision-Recall curves (C) and the curves forprecision vs. confidence score threshold (D) for the quality of KEGG pathway membership prediction measured by DRSC RNAi screening results.doi:10.1371/journal.pone.0012139.g004
Fly Gene Function Prediction
PLoS ONE | www.plosone.org 7 August 2010 | Volume 5 | Issue 8 | e12139

Figure 5. Comparison between GO term/KEGG pathway prediction and DRSC RNAi screening hits. A–B, GO/KEGG predictions matchedwith RNAi screen results compared to randomized RNAi screen data. C–E, individual pathway/function predictions matched with RNAi screen resultscompared to randomized RNAi screen data. For comparison, we show performance of a supervised machine-learning model trained using the samealgorithm and datasets except that it aggregates all GO terms/KEGG pathways in its training as has been traditionally done.doi:10.1371/journal.pone.0012139.g005
Fly Gene Function Prediction
PLoS ONE | www.plosone.org 8 August 2010 | Volume 5 | Issue 8 | e12139

For the protein-protein interaction feature, pair-wise shortest path
on the protein-protein interaction network was calculated using the
Johnson Algorithm [76] as provided by the Boost Graph Library
(www.boost.org/libs/graph/, http://search.cpan.org/perldoc?Boost::
Graph). For microarray expression data, we calculated Pearson-
Correlation Coefficients (average method) to measure the correlation
between the expression profiles [7,28] of a pair of genes. For genetic
interactions we used binary values (0 or 1) to describe the existence of a
genetic interaction (no matter whether it was a phenotypic
enhancement or suppression) between a pair of genes. We also used
the shortest path between two genes on the genetic interaction
network as an additional feature of genetic interactions.
The genetic interaction profile for a given gene X was a binary
vector describing the existence of genetic interactions between Xand all other genes. The genetic interaction profile feature for a
pair of genes was the Pearson-Correlation Coefficient (average
method) between their genetic interaction profiles. Genetic
interaction profiles could help to identify genes in the same
pathway whose function was also achieved by another redundant
pathway (Supplemental Figure S1A).
The shared protein domains feature includes two values: 1) the
number of conserved protein domains shared between two
proteins X and Y, denoted as S; and 2) the ratio between S and
the total number (U) of unique domains on the two proteins X or
Y. The protein domain profile for a given gene X was a binary vector
describing the existence of each human protein domain in the
IntePro database on gene X. The protein domain profile feature
for a pair of genes was the Pearson-Correlation Coefficient
(average method) between their protein domain profiles.
Sequence similarity was calculated using BLASTp [33] based
on the Reciprocal Best Hits (RBH) approach [77]. The sequence
similarity feature included two scores: pair-wise similarity and
cross-species functional inference. To calculate the pair-wise
similarity score, we counted the number (S) of shared orthologs
between two genes X and Y, as well as the size (U) of the union of
all their orthologs. The sequence similarity score for X and Y was
then calculated as S/U. To calculate the score for cross-species
function inference, for each candidate gene X and a given function
F, we counted the number (A) of orthologs of gene X known to be
associated with function F, and the number (B) of all its orthologs,
and the score was then calculated as A/B. To prevent circularity
caused by learning the functions of gene X from the functions of its
orthologs in the same KO (KEGG Orthology) group to which Xbelonged, sequence similarity was not calculated between genes
within the same KO group in KEGG. Similarly, ISS-tagged
(Inferred from Sequence Similarity) gene-term associations in
Gene Ontology were also excluded from the training and test sets.
Model training and performance evaluationThe combination space of genes and functions was randomly
split into 10 subsamples, with one designated as the test set, the
others as training sets. For each function Ki a classifier Ci was
trained and used in the test set to predict candidate genes for
function Ki. The process was repeated ten times so that each
subsample was used as the test set once. All the predictions were
then compared to known associations to calculate the perfor-
mance. To make novel predictions, the model was trained in the
entire known space of gene-function pairs and run in the entire
unknown space of gene-function pairs.
Keyword-matching between function prediction andRNAi screening hits
From the titles of the 24 published DRSC RNAi screens, we
chose keywords which can be found in the descriptions of
corresponding KEGG pathways or GO terms (Supplemental
Table S6). For those instances where one RNAi screen was
matched to multiple KEGG pathways or GO terms, we
considered these pathways or terms as one general function
matched to the screen. For any gene X found as a positive hit in a
given RNAi screen, all the positive predictions associating gene Xwith the matched KEGG pathways or GO terms were counted as
successful recoveries of the hit.
Canonical supervised learning model built forcomparison purpose
To compare the performance of our model in recovering
positive hits in RNAi screens with the canonical supervised
learning model, we trained a Random Forest model with the
same prior features and training sets used in our model. In this
model, objects were gene-function pairs, labels were either ‘‘yes’’
or ‘‘no’’ (indicating whether a gene-function pair was labeled as a
valid association or not), and features for a given gene-function
pair were a variety of measures (see Materials and Methods) of
similarity between the given gene and all positive reference genes
for that function. All gene-function pairs in the training set were
used to train a single classifier which was used to make
predictions in the test set of gene-function pairs. These
predictions were then compared to the results of RNAi screens.
The performance of the canonical model in recovering positive
RNAi hits was compared to that of the function-specific model
(Figure 5).
Code performance and comparison with canonicalsupervised machine-learning model
We executed our code on a Dell PowerEdge server equipped
with 32 GBytes of RAM and 8 Intel Xeon 2.8 GHz processors
running Red Hat Linux Advanced Server 64 bit Edition 4. The
training of our function-specific classifier model took approxi-
mately 43 minutes for KEGG pathway membership prediction
and 3 hours 57 minutes for GO term prediction (compared to the
performance of the canonical model which required 3 hours 16
minutes for KEGG pathway prediction and 15 hours 20 minutes
for GO term prediction, Supplemental Figure S2).
Supporting Information
Table S1 Classification of KEGG pathways.
Found at: doi:10.1371/journal.pone.0012139.s001 (0.04 MB
XLS)
Table S2 GO term and KEGG pathway membership predic-
tions with confidence scores above 0.2 (for GO term predictions)
or above 0.1 (for KEGG pathway predictions).
Found at: doi:10.1371/journal.pone.0012139.s002 (3.91 MB
XLS)
Table S3 KEGG pathway predictions matched to DRSC
screening.
Found at: doi:10.1371/journal.pone.0012139.s003 (0.03 MB
XLS)
Table S4 GO-term predictions matched to DRSC screening.
Found at: doi:10.1371/journal.pone.0012139.s004 (0.04 MB
XLS)
Table S5 JNK pathway prediction compared to RNAi data at
the Japan National Institute of Genetics (NIG).
Found at: doi:10.1371/journal.pone.0012139.s005 (0.03 MB
DOC)
Fly Gene Function Prediction
PLoS ONE | www.plosone.org 9 August 2010 | Volume 5 | Issue 8 | e12139

Table S6 Keyword matching between RNAi screens and gene
functions.
Found at: doi:10.1371/journal.pone.0012139.s006 (0.02 MB
XLS)
Table S7 Additional Expression Profiles from NCBI Gene
Expression Omnibus (GEO).
Found at: doi:10.1371/journal.pone.0012139.s007 (0.10 MB
XLS)
Figure S1 Genetic interaction profiles. A, Both pathway P1 and
P2 drive downstream processes to achieve a function; loss of genes
within either pathway will not abolish the function. However,
when a pair of genes from the two pathways respectively are lost
(e.g. a-x, a-y, c-x), both pathways will be broken and a loss-of-
function phenotype will emerge. B, Genes within the same
pathway have similar genetic interaction profiles, which could be
useful in categorizing a,b,c and x,y,z into pathway P1 and P2
respectively.
Found at: doi:10.1371/journal.pone.0012139.s008 (1.07 MB TIF)
Figure S2 Code performance of Functional-Specific Classifier
model and canonical supervised machine-learning model.
Found at: doi:10.1371/journal.pone.0012139.s009 (0.51 MB TIF)
Figure S3 Performance of GO prediction when removing one
feature at a time from the model. Receiver Operating Character-
istic curves (A) and Precision-Recall curves (B) for the overall
performance and the performance when removing one feature at a
time in GO term (biological process, BP) prediction. Precision-
Recall curves for the GO term prediction model for GO terms
with various degrees of specificity, i.e., those that have been
annotated with 0–25 genes (C), 25–50 genes (D), 50–100 genes (E),
and 100–500 genes (F).
Found at: doi:10.1371/journal.pone.0012139.s010 (1.73 MB TIF)
Figure S4 Performance of KEGG prediction when removing
one feature at a time from the model. Receiver Operating
Characteristic curves (A) and Precision-Recall curves (B) for the
overall performance and the performance when removing one
feature at a time in the KEGG pathway prediction. Precision-
Recall curves for the performance of the model in predicting
metabolism only (C), signaling pathway only (D), basic functions
(E), and all non-metabolism functions (F).
Found at: doi:10.1371/journal.pone.0012139.s011 (2.20 MB TIF)
Figure S5 Performance of KEGG prediction when limited in
the gene space of genetic interaction network. Receiver Operating
Characteristic curves (A) and Precision-Recall curves (B) for the
overall performance and contribution of each feature in the
KEGG pathway prediction. Precision-Recall curves for the
performance of the model in predicting metabolism only (C),
signaling pathway only (D), basic functions (E), and all non-
metabolism functions (F).
Found at: doi:10.1371/journal.pone.0012139.s012 (1.85 MB TIF)
Acknowledgments
We thank all members of the Vidal laboratory and the Center for Cancer
Systems Biology (CCSB), Dr Chris Bakal, Dr Young Kwon and Dr Mike
Boxem for helpful suggestions, Dr Rachel Drysdale and Dr Paul Leyland
for technical support on FlyBase data, Changyu Fan for assistance on
computational resources, Anne-Ruxandra Carvunis and Samuel Pevzner
for reading the manuscript. NP is an investigator of the Howard Hughes
Medical Institute. M.V. is a Chercheur Qualifie Honoraire from the Fonds
de la Recherche Scientifique (FRS-FNRS, French Community of
Belgium). We are grateful for a variety of constructive suggestions from
the anonymous reviewers that have improved the quality and presentation
of these results.
Author Contributions
Conceived and designed the experiments: HY KV FR. Performed the
experiments: HY. Analyzed the data: HY KV NP FR MV. Contributed
reagents/materials/analysis tools: HY JEB NK MAY TH DEH MEC NP
FR MV. Wrote the paper: HY KV DEH MEC FR MV.
References
1. Ito T, Tashiro K, Muta S, Ozawa R, Chiba T, et al. (2000) Toward a protein-
protein interaction map of the budding yeast: A comprehensive system to
examine two-hybrid interactions in all possible combinations between the yeast
proteins. Proc Natl Acad Sci U S A 97: 1143–1147.
2. Uetz P, Giot L, Cagney G, Mansfield TA, Judson RS, et al. (2000) A
comprehensive analysis of protein-protein interactions in Saccharomyces cerevisiae.
Nature 403: 623–627.
3. Walhout AJ, Sordella R, Lu X, Hartley JL, Temple GF, et al. (2000) Protein
interaction mapping in C. elegans using proteins involved in vulval development.
Science 287: 116–122.
4. Gavin AC, Bosche M, Krause R, Grandi P, Marzioch M, et al. (2002)
Functional organization of the yeast proteome by systematic analysis of protein
complexes. Nature 415: 141–147.
5. Ho Y, Gruhler A, Heilbut A, Bader GD, Moore L, et al. (2002) Systematic
identification of protein complexes in Saccharomyces cerevisiae by mass spectrom-
etry. Nature 415: 180–183.
6. Reinke V (2002) Functional exploration of the C. elegans genome using DNA
microarrays. Nat Genet 32Suppl: 541–546.
7. Tomancak P, Beaton A, Weiszmann R, Kwan E, Shu S, et al. (2002) Systematic
determination of patterns of gene expression during Drosophila embryogenesis.
Genome Biol 3: R0088.
8. Whitfield ML, Sherlock G, Saldanha AJ, Murray JI, Ball CA, et al. (2002)
Identification of genes periodically expressed in the human cell cycle and their
expression in tumors. Mol Biol Cell 13: 1977–2000.
9. Giot L, Bader JS, Brouwer C, Chaudhuri A, Kuang B, et al. (2003) A protein
interaction map of Drosophila melanogaster. Science 302: 1727–1736.
10. Reboul J, Vaglio P, Rual JF, Lamesch P, Martinez M, et al. (2003) C. elegans
ORFeome version 1.1: experimental verification of the genome annotation and
resource for proteome-scale protein expression. Nat Genet 34: 35–41.
11. Li S, Armstrong CM, Bertin N, Ge H, Milstein S, et al. (2004) A map of the
interactome network of the metazoan C. elegans. Science 303: 540–543.
12. Rual JF, Venkatesan K, Hao T, Hirozane-Kishikawa T, Dricot A, et al. (2005)
Towards a proteome-scale map of the human protein-protein interaction
network. Nature 437: 1173–1178.
13. Wu X, Dewey TG (2006) From microarray to biological networks: Analysis of
gene expression profiles. Methods Mol Biol 316: 35–48.
14. Yu H, Braun P, Yildirim MA, Lemmens I, Venkatesan K, et al. (2008) High-
quality binary protein interaction map of the yeast interactome network. Science
322: 104–110.
15. Venkatesan K, Rual JF, Vazquez A, Stelzl U, Lemmens I, et al. (2009) An
empirical framework for binary interactome mapping. Nat Methods 6: 83–
90.
16. Marcotte EM, Pellegrini M, Thompson MJ, Yeates TO, Eisenberg D (1999) A
combined algorithm for genome-wide prediction of protein function. Nature
402: 83–86.
17. Vazquez A, Flammini A, Maritan A, Vespignani A (2003) Global protein
function prediction from protein-protein interaction networks. Nat Biotechnol
21: 697–700.
18. Chua HN, Sung WK, Wong L (2006) Exploiting indirect neighbours and
topological weight to predict protein function from protein-protein interactions.
Bioinformatics 22: 1623–1630.
19. Sharan R, Ulitsky I, Shamir R (2007) Network-based prediction of protein
function. Mol Syst Biol 3: 88.
20. Deng X, Geng H, Ali HH (2008) A Hidden Markov Model approach to
predicting yeast gene function from sequential gene expression data.
Int J Bioinform Res Appl 4: 263–273.
21. Obozinski G, Lanckriet G, Grant C, Jordan MI, Noble WS (2008) Consistent
probabilistic outputs for protein function prediction. Genome Biol 9 Suppl 1:
S6.
22. Tasan M, Tian W, Hill DP, Gibbons FD, Blake JA, et al. (2008) An en masse
phenotype and function prediction system for Mus musculus. Genome Biol 9
Suppl 1: S8.
23. Tian W, Zhang LV, Tasan M, Gibbons FD, King OD, et al. (2008) Combining
guilt-by-association and guilt-by-profiling to predict Saccharomyces cerevisiae gene
function. Genome Biol 9 Suppl 1: S7.
24. Aerts S, Vilain S, Hu S, Tranchevent LC, Barriot R, et al. (2009) Integrating
computational biology and forward genetics in Drosophila. PLoS Genet 5:
e1000351.
Fly Gene Function Prediction
PLoS ONE | www.plosone.org 10 August 2010 | Volume 5 | Issue 8 | e12139
25. Costello JC, Dalkilic MM, Beason SM, Gehlhausen JR, Patwardhan R, et al.
(2009) Gene networks in Drosophila melanogaster: integrating experimental data topredict gene function. Genome Biol 10: R97.
26. Kotsiantis SB (2007) Supervised Machine Learning: A Review of Classification
Techniques. Informatica 31: 249–268.27. Yu J, Pacifico S, Liu G, Finley RL, Jr. (2008) DroID: the Drosophila Interactions
Database, a comprehensive resource for annotated gene and proteininteractions. BMC Genomics 9: 461.
28. Arbeitman MN, Furlong EE, Imam F, Johnson E, Null BH, et al. (2002) Gene
expression during the life cycle of Drosophila melanogaster. Science 297: 2270–2275.29. Stark C, Breitkreutz BJ, Reguly T, Boucher L, Breitkreutz A, et al. (2006)
BioGRID: a general repository for interaction datasets. Nucleic Acids Res 34:D535–539.
30. Wilson RJ, Goodman JL, Strelets VB (2008) FlyBase: integration andimprovements to query tools. Nucleic Acids Res 36: D588–593.
31. Mulder NJ, Apweiler R, Attwood TK, Bairoch A, Bateman A, et al. (2002)
InterPro: an integrated documentation resource for protein families, domainsand functional sites. Brief Bioinform 3: 225–235.
32. Pruitt KD, Tatusova T, Maglott DR (2007) NCBI reference sequences (RefSeq):a curated non-redundant sequence database of genomes, transcripts and
proteins. Nucleic Acids Res 35: D61–65.
33. Johnson M, Zaretskaya I, Raytselis Y, Merezhuk Y, McGinnis S, et al. (2008)NCBI BLAST: a better web interface. Nucleic Acids Res 36: W5–9.
34. Breiman L (2001) Random forests. Machine Learning. pp 5–32.35. Statnikov A, Wang L, Aliferis CF (2008) A comprehensive comparison of
random forests and support vector machines for microarray-based cancerclassification. BMC Bioinformatics 9: 319.
36. Witten IH, Frank E (2000) Data mining: practical machine learning tools and
techniques with Java implementations. San Francisco, Calif: Morgan Kauf-mann. xxv. 371 p.
37. Flockhart I, Booker M, Kiger A, Boutros M, Armknecht S, et al. (2006)FlyRNAi: the Drosophila RNAi screening center database. Nucleic Acids Res 34:
D489–494.
38. Ashburner M, Ball CA, Blake JA, Botstein D, Butler H, et al. (2000) Geneontology: tool for the unification of biology. The Gene Ontology Consortium.
Nat Genet 25: 25–29.39. Kanehisa M, Goto S (2000) KEGG: Kyoto Encyclopedia of Genes and
Genomes. Nucleic Acids Res 28: 27–30.40. Brody T (1999) The Interactive Fly: gene networks, development and the
Internet. Trends Genet 15: 333–334.
41. Braun P, Tasan M, Dreze M, Barrios-Rodiles M, Lemmens I, et al. (2009) Anexperimentally derived confidence score for binary protein-protein interactions.
Nat Methods 6: 91–97.42. Cusick ME, Yu H, Smolyar A, Venkatesan K, Carvunis AR, et al. (2009)
Literature-curated protein interaction datasets. Nat Methods 6: 39–46.
43. Simonis N, Rual JF, Carvunis AR, Tasan M, Lemmens I, et al. (2009)Empirically controlled mapping of the Caenorhabditis elegans protein-protein
interactome network. Nat Methods 6: 47–54.44. Beaver J, Tasan M, Gibbons M, Tian W, Hughes T, et al. (2010) FuncBase: A
resource for quantitative gene function annotation. Bioinformatics May 21[Epub ahead of print].
45. Echeverri CJ, Perrimon N (2006) High-throughput RNAi screening in cultured
cells: a user’s guide. Nat Rev Genet 7: 373–384.46. Agaisse H, Petersen UM, Boutros M, Mathey-Prevot B, Perrimon N (2003)
Signaling role of hemocytes in Drosophila JAK/STAT-dependent response toseptic injury. Dev Cell 5: 441–450.
47. Muller P, Kuttenkeuler D, Gesellchen V, Zeidler MP, Boutros M (2005)
Identification of JAK/STAT signalling components by genome-wide RNAinterference. Nature 436: 871–875.
48. Umemori M, Habara O, Iwata T, Maeda K, Nishinoue K, et al. (2009) RNAi-Mediated Knockdown Showing Impaired Cell Survival in Drosophila Wing
Imaginal Disc. Gene Regul Syst Bio 2009 3: 11–20.
49. Myers CL, Barrett DR, Hibbs MA, Huttenhower C, Troyanskaya OG (2006)Finding function: evaluation methods for functional genomic data. BMC
Genomics 7: 187.50. Lee HJ, Manke T, Bringas R, Vingron M (2008) Prioritization of gene
regulatory interactions from large-scale modules in yeast. BMC Bioinformatics 9:32.
51. Gunsalus KC, Ge H, Schetter AJ, Goldberg DS, Han JD, et al. (2005) Predictivemodels of molecular machines involved in Caenorhabditis elegans early embryo-
genesis. Nature 436: 861–865.
52. Wang J, Kean L, Yang J, Allan AK, Davies SA, et al. (2004) Function-informed
transcriptome analysis of Drosophila renal tubule. Genome Biol 5: R69.
53. Beckstead RB, Lam G, Thummel CS (2005) The genomic response to 20-
hydroxyecdysone at the onset of Drosophila metamorphosis. Genome Biol 6: R99.
54. Deng X, Meller VH (2006) roX RNAs are required for increased expression ofX-linked genes in Drosophila melanogaster males. Genetics 174: 1859–1866.
55. Edwards AC, Rollmann SM, Morgan TJ, Mackay TF (2006) Quantitative
genomics of aggressive behavior in Drosophila melanogaster. PLoS Genet 2: e154.
56. Estrada B, Choe SE, Gisselbrecht SS, Michaud S, Raj L, et al. (2006) Anintegrated strategy for analyzing the unique developmental programs of different
myoblast subtypes. PLoS Genet 2: e16.
57. Mourikis P, Hurlbut GD, Artavanis-Tsakonas S (2006) Enigma, a mitochondrialprotein affecting lifespan and oxidative stress response in Drosophila. Proc Natl
Acad Sci U S A 103: 1307–1312.
58. Terry NA, Tulina N, Matunis E, DiNardo S (2006) Novel regulators revealed by
profiling Drosophila testis stem cells within their niche. Dev Biol 294: 246–257.
59. Wang X, Bo J, Bridges T, Dugan KD, Pan TC, et al. (2006) Analysis of cell
migration using whole-genome expression profiling of migratory cells in the
Drosophila ovary. Dev Cell 10: 483–495.
60. Carney GE (2007) A rapid genome-wide response to Drosophila melanogaster social
interactions. BMC Genomics 8: 288.
61. Firth LC, Baker NE (2007) Spitz from the retina regulates genes transcribed in
the second mitotic wave, peripodial epithelium, glia and plasmatocytes of theDrosophila eye imaginal disc. Dev Biol 307: 521–538.
62. Jemc J, Rebay I (2007) Identification of transcriptional targets of the dual-
function transcription factor/phosphatase eyes absent. Dev Biol 310: 416–429.
63. Johansson AM, Stenberg P, Bernhardsson C, Larsson J (2007) Painting of fourth
and chromosome-wide regulation of the 4th chromosome in Drosophila
melanogaster. EMBO J 26: 2307–2316.
64. Maines JZ, Park JK, Williams M, McKearin DM (2007) Stonewalling Drosophila
stem cell differentiation by epigenetic controls. Development 134: 1471–1479.
65. Muse GW, Gilchrist DA, Nechaev S, Shah R, Parker JS, et al. (2007) RNA
polymerase is poised for activation across the genome. Nat Genet 39:1507–1511.
66. Qin X, Ahn S, Speed TP, Rubin GM (2007) Global analyses of mRNA
translational control during early Drosophila embryogenesis. Genome Biol 8: R63.
67. Sorensen JG, Nielsen MM, Loeschcke V (2007) Gene expression profile analysisof Drosophila melanogaster selected for resistance to environmental stressors. J Evol
Biol 20: 1624–1636.
68. Boltz KA, Carney GE (2008) Loss of p24 function in Drosophila melanogaster causesa stress response and increased levels of NF-kappaB-regulated gene products.
BMC Genomics 9: 212.
69. Carrera I, Zavadil J, Treisman JE (2008) Two Subunits Specific to the PBAPChromatin Remodeling Complex Have Distinct and Redundant Functions
during Drosophila Development. Mol Cell Biol 28: 5238–5250.
70. Liang HL, Nien CY, Liu HY, Metzstein MM, Kirov N, et al. (2008) The zinc-finger protein Zelda is a key activator of the early zygotic genome in Drosophila.
Nature 456: 400–403.
71. Mezey JG, Nuzhdin SV, Ye F, Jones CD (2008) Coordinated evolution of co-expressed gene clusters in the Drosophila transcriptome. BMC Evol Biol 8: 2.
72. Weber KE, Greenspan RJ, Chicoine DR, Fiorentino K, Thomas MH, et al.
(2008) Microarray analysis of replicate populations selected against a wing-shapecorrelation in Drosophila melanogaster. Genetics 178: 1093–1108.
73. Deng X, Koya SK, Kong Y, Meller VH (2009) Coordinated regulation of
heterochromatic genes in Drosophila melanogaster males. Genetics 182: 481–491.
74. Robine N, Lau NC, Balla S, Jin Z, Okamura K, et al. (2009) A broadlyconserved pathway generates 39UTR-directed primary piRNAs. Curr Biol 19:
2066–2076.
75. Liaw A, Wiener M (2002) Classification and Regression by randomForest.R News 2: 18–22.
76. Johnson DB (1977) Efficient algorithms for shortest paths in sparse networks.
Journal of the ACM 24(1): 1–13.
77. Tatusov RL, Koonin EV, Lipman DJ (1997) A genomic perspective on proteinfamilies. Science 278: 631–637.
Fly Gene Function Prediction
PLoS ONE | www.plosone.org 11 August 2010 | Volume 5 | Issue 8 | e12139