a geomorphic template for the analysis of lake districts ...€¦ · analyses were restricted to a...
TRANSCRIPT

A geomorphic template for the analysis of lake districtsapplied to the Northern Highland Lake District,Wisconsin, U.S.A.
JOAN L. RIERA*, JOHN J. MAGNUSON*, TIM K. KRATZ* AND KATHERINE E. WEBSTER*y*Center for Limnology, University of Wisconsin±Madison, 680 North Park Street, Madison, WI 53706, U.S.A
yWisconsin Department of Natural Resources, 1350 Femrite Dr, Monona, WI 53716, U.S.A.
SUMMARY
1. We tested the degree to which a lake's landscape position constrains the expression of
limnological features and imposes a characteristic spatial pattern in a glacial lake district,
the Northern Highland Lake District in north-central Wisconsin.
2. We defined lake order as a metric to analyze the effect of landscape position on
limnological features. Lake order, analogous to stream order, is based solely on
geographical information and is simple to measure.
3. We examined the strength of the relationship between lake order and a set of 25
variables, which included measures of lake morphometry, water optical properties, major
ions, nutrients, biology, and human settlement patterns.
4. Lake order explained a significant fraction of the variance of 21 of the 25 variables tested
with ANOVA. The fraction of variance explained varied from 12% (maximum depth) to
56% (calcium concentration). The variables most strongly related to lake order were:
measures of lake size and shape, concentrations of major ions (except sulfate) and silica,
biological variables (chlorophyll concentration, crayfish abundance, and fish species
richness), and human-use variables (density of cottages and resorts). Lake depth, water
optical properties, and nutrient concentrations (other than silica) were poorly associated
with lake order.
5. Potential explanations for a relationship with lake order differed among variables. In
some cases, we could hypothesize a direct link. For example, major ion concentration is a
function of groundwater input, which is directly related to lake order. We see these as a
direct influence of the geomorphic template left by the retreat of the glacier that led to the
formation of this lake district.
6. In other cases, a set of indirect links was hypothesized. For example, the effect of lake
order on lake size, water chemistry, and lake connectivity may ultimately explain the
relation between lake order and fish species richness. We interpret these relationships as
the result of constraints imposed by the geomorphic template on lake development over
the last 12 000 years.
7. By identifying relationships between lake characteristics and a measure of landscape
position, and by identifying geomorphologic constraints on lake features and lake
evolution, our analysis explains an important aspect of the spatial organization of a lake
district.
Keywords: constraint, geomorphology, lake, lake district, landscape, legacy, spatial pattern
Introduction
A lake district is a landscape rich in lakes that share
origin, climate and catchment geology. Despite these
Freshwater Biology (2000) 43, 301±318
ã 2000 Blackwell Science Ltd. 301
Correspondence: Center for Limnology, University of Wiscon-sin±Madison, 680 North Park Street, Madison, WI 53706, U.S.AE-mail: [email protected]
common traits, lakes within a lake district vary
considerably in their physical, chemical and biological
characteristics. Understanding the underlying causes of
thisheterogeneityhasbeenarecurrentthemeofregional
limnology (Birge & Juday, 1911; Thienemann, 1925;
Naumann, 1932; Hutchinson, 1957; Margalef, 1983;
Allan & Johnson, 1997). Lake features ranging from
internalfeaturessuchasfoodwebstructureandnutrient
cycling to morphometry and interaction between a lake
and its catchment have been invoked as explanatory
factors. Major ion chemistry, for example, is best
predicted by hydrogeochemical models of ion weath-
ering and transport in the catchment (Likens, 1985).
Waterchemistry,nutrientconcentrationsandfood±web
interactions (Harris, 1986) best explain phytoplankton
biomass and composition. Finally, fish species richness
and composition are best explained by multiple vari-
ables including extinction and isolation (Tonn &
Magnuson, 1982; Rahel, 1986; Tonn et al., 1990; Magnu-
son et al., 1998b).
Efforts to select the best predictors and to identify
proximate causes, however, have tended to obscure
the spatial linkages among lakes in the landscape and
have thus hampered a landscape perspective on lake
districts. Here we propose a new perspective on
regional limnology that explicitly takes into account
spatial patterning in lake districts. We elaborate on the
concept of landscape position as developed by Kratz
& Medland (1989); Webster et al., (1996); Kratz et al.,
(1997) and Magnuson & Kratz (2000). These papers
provide a set of observations and a conceptual
framework for evaluating how lakes interact with
neighbouring lakes, with the hydrology of the region,
and with the terrestrial landscape. A key premise of
this concept is that a lake's position relative to other
features of the landscape constrains the expression of
a wide range of limnological properties and processes.
Kratz et al. (1997) discuss several examples of the
relationship between landscape position and proper-
ties ranging from lake morphometry to fish richness.
Webster et al. (1996) discuss how landscape position
influences the response of a lake's water chemistry to
drought episodes. The wide range of variables that
were found to be related to landscape position in
those analyses suggests that the geomorphologic
configuration of this landscape by glacial forces over
10 000 years ago has imposed constraints which have
yielded spatial patterning in lake characteristics
across the landscape.
From the analysis of past work, we derive two
major conclusions. First, we conclude that lake
features in a lake district are not randomly distributed
in space, but reflect a spatial pattern. Choosing an
appropriate metric describing the spatial location of
the lake, i.e. its position in the landscape, can help
describe this pattern. Kratz et al. (1997), for example,
found that the position of a lake within the ground-
water flow system was a useful descriptor of land-
scape position (i.e. a descriptor that revealed spatial
patterning) in the Northern Highland Lake District.
We posit that each lake district displays a character-
istic spatial organization, and that different metrics of
landscape position can reveal different aspects of this
spatial pattern within a lake district, or among lake
districts (e.g. Soranno et al., 1999)
Second, we conclude that disparate lake features,
apparently unrelated to each other, are nonetheless
related to a lake's landscape position. For example,
Kratz et al. (1997) found that lake area, water specific
conductance, and fish species richness all increased
with landscape position, with landscape position
defined by the location of lakes within the local
groundwater flow system. More generally, regional
limnological studies often find a large degree of
redundancy among variables (e.g. Riera et al., 1992),
with significant correlation among apparently unre-
lated properties. We hypothesize that this redundancy
is brought about by landscape constraints on lake
features.
The purpose of our analysis here is two-fold. To
begin, we expand on the analysis of lake landscape
position in the Northern Highland Lake District.
Landscape position was defined in previous studies
as the position of a lake in the groundwater flow system.
Because this property is difficult to measure, those
analyses were restricted to a small number of lakes. We
expand on previous studies by analyzing relationships
between lake position and limnological properties in a
large set of lakes in the same region. To do this, we first
define lake order, a new metric of landscape position
that is related to stream order and is easy to measure
using only geographic information. We then test the
presence and strength of relationships between limno-
logical properties and lake order. The limnological
properties we analyzed are compiled from published
surveys and include morphological variables, variables
related to water optical properties, major ions, nutri-
ents, biological variables, and human-use variables.
302 J. L. Riera et al.
ã 2000 Blackwell Science Ltd, Freshwater Biology, 43, 301±318

Finally, we provide refinements to the theoretical
framework elaborated by Kratz et al. (1997) and
Magnuson & Kratz (2000). We posit that the spatial
organization of a lake district is the result of the
historical processes that led to the formation of the
lake district. We view this influence of historical
geomorphologic processes on present-day lake char-
acteristics as a legacy of the past. In our study
landscape, it was the retreat of the glaciers that left
an imprint, a geomorphic template, on the landscape
that directly determined lake morphometry and,
through the development of hydrologic flowpaths,
landscape position. Furthermore, we allege that the
relationships observed between disparate lake fea-
tures and metrics of landscape position were not just
directly conditioned by the geomorphic template but,
perhaps more importantly, were the result of the
constraints imposed by that template on the process of
lake ontogeny since the time of the formation of the
lake district.
Methods
Study area
The Northern Highland Lake District, situated in
north-central Wisconsin and the Upper Peninsula of
Michigan, contains more than 2500 lakes in an area of
» 3500 km2. In the present landscape, which was
formed 10 000±13 000 years ago during the Wisconsin
glaciation, 30±50 m of sandy, noncalcareous glacial
outwash overlie granitic Precambrian bedrock
(Okwueze, 1983; Attig, 1984). Elevation ranges from
470 to » 550 meters above sea level. Despite the
generally low relief, an uplands region is in the north-
east, and lowlands are in the south. The north-west
has lower relief and extensive wetlands. The lake
district is high in elevation relative to the rest of
Wisconsin. It is the headwaters for several large rivers
that flow to the Mississippi River, and several small
streams that flow north to Lake Superior.
Fig. 1 (a) Location of study area in north-central Wisconsin; (b) the four catchments of the study area; (c) example of lake order
assignment.
A geographic template for lake districts 303
ã 2000 Blackwell Science Ltd, Freshwater Biology, 43, 301±318

We selected four major catchments for analysis
(Fig. 1a). The Manitowish and Bear catchments drain
into the Chippewa-Flambeau River system, which
flows south-west to the Mississippi. The Lower
Tomahawk and Saint Germain catchments are
drained by the Wisconsin River, which flows south
to the Mississippi River. Altogether, these four
catchments are 1741 km2 in area and contain over
550 lakes constituting 216 km2 or 15% of the area
(Fig. 1b). These four catchments are centered around
the Trout Lake Station, which has been the base
facility for numerous lake surveys, including those
carried out by E. A. Birge and C. Juday from 1924
through 1941 (Beckel, 1987) and by the North
Temperate Lakes Long-term Ecological Research
program (Magnuson et al., 1998a). Limnological
research in this region spans most of the century,
making this lake district one of the best studied in the
world (Beckel 1987).
The strong linkage between many limnological
properties and lake hydrology in this region has been
recognized since the pioneering work of Birge, Juday,
and collaborators (e.g. Juday & Birge, 1933). More
recently, Eilers et al. (1983) concluded that chemical
susceptibility to lake acidification in 275 lakes in north-
central Wisconsin was determined most strongly by
hydrology, that is, whether a lake's water budget was
dominated by direct precipitation, groundwater flow,
or surface runoff. More generally, groundwater input
has been recognized as a good predictor of major ion
chemistry (Hurley et al., 1985; Kenoyer & Anderson,
1989; Michaels, 1995), because the flowpaths of
groundwater allow weathering of the sparingly soluble
glacial outwash that dominate the geology of this
region (Kenoyer & Bowser, 1992a, 1992b). In contrast,
precipitation and surface runoff supply more dilute
water. The proportion of groundwater input to a lake
depends on its position in the landscape. Lakes that are
high in the landscape tend to be precipitation-
dominated lakes that recharge aquifers, whereas
lakes lower in the landscape tend to be in closer contact
with aquifers and are either groundwater flow-through
lakes or lakes that receive groundwater discharge
(Anderson & Munter, 1981; Cheng & Anderson, 1994).
Lake order
Our definition of lake order is based on the type
and strength of the connections between a lake and
the surface drainage network. We used a numbering
system to clearly differentiate those lakes without
permanent inlets or outlets (seepage lakes, negative
lake order), from those having inlets and outlets
(drainage lakes, positive lake order). For lakes with
both surface inlets and outlet, lake order was
defined as the order of the stream that drains the
lake. Stream order was measured following Strahler
(1964) using 1 : 100 000 scale maps (Wisconsin
Department of Natural Resources, 1994). Thus, a
lake whose outlet was a stream of order 3 would be
assigned a lake order of 3, whether its inlets were of
order 3 and below, or two or more inlets were of
order 2. Likewise, a lake drained by an order 1
stream would be assigned a lake order of 1.
Headwater lakes (i.e. lakes with no inlets but with
a surface outlet), were differentiated from order 1
lakes and assigned lake order 0. Headwater lakes
tend to be spring-fed and to have smaller catchment
areas than order 1 lakes.
Lakes without any permanent drainage by streams
were assigned negative lake orders. Lakes connected
to the surface drainage network only by temporary
streams or streams of very low flow were assigned
lake order ± 1. These were operationally identified as
streams marked as temporary on 1 : 24 000 USGS
(U.S. Geologic Survey) topographic sheets, or as
streams that were displayed on 1 : 24 000 scale
maps, but not on 1 : 100 000 scale maps. Lake order
± 2 was assigned to lakes connected to the drainage
system by a wetland where channelized flow was
absent. Finally, lake order ± 3 was assigned to closed-
basin lakes hydrologically unconnected to the drai-
nage network by surface water.
Just like stream order, lake order is sensitive to map
scale and accuracy. The use of smaller scale maps
could have resulted in a slightly different lake order
assignment.
Data sources
We tested the following published data for a relation-
ship with lake position: lake morphometry, geo-
graphic position, optical properties, major dissolved
ions, major nutrients, biological variables, and human
variables. Table 1 summarizes data sources and
provides references to methods. Variables selected
for this study are in Table 2, together with descriptive
statistics and data sources.
304 J. L. Riera et al.
ã 2000 Blackwell Science Ltd, Freshwater Biology, 43, 301±318

Tab
le1
Des
crip
tio
no
fd
ata
sets
.T
he
acro
ny
mis
use
dto
iden
tify
each
dat
ase
tin
Tab
le2
Dat
ase
tA
cro
ny
mC
om
men
tsR
efer
ence
s
USG
S1
:24
000
top
og
rap
hic
map
sT
OP
OM
ost
ly19
81;
som
eq
uad
sfr
om
earl
y19
70s
U.S
.G
eolo
gic
alS
urv
ey
GIS
hy
dro
gra
ph
yco
ver
age
HY
DR
OP
rod
uce
db
yW
isco
nsi
nD
epar
tmen
to
fN
atu
ral
Res
ou
rces
(WD
NR
);b
ased
on
1:
100
000
map
s
Wis
con
sin
Dep
artm
ent
of
Nat
ura
lR
eso
urc
es(1
994)
Wis
con
sin
Dep
artm
ent
of
Nat
ura
lR
eso
urc
esW
DN
RL
ake
mo
rph
om
etry
dat
ap
rod
uce
db
yW
DN
RW
isco
nsi
nD
epar
tmen
to
f
Nat
ura
lR
eso
urc
es(1
995)
Bir
ge
and
Jud
ayD
ata
Set
BJ
Dat
aco
llec
ted
1920
±41.
Lak
essa
mp
led
on
ced
uri
ng
Joh
nso
n(1
984)
sum
mer
,so
me
lak
essa
mp
led
mo
reth
ano
ne
yea
r
Su
rfac
eW
ater
Res
ou
rces
SW
RS
urv
eyco
nd
uct
edb
etw
een
1963
and
1969
by
the
Wis
con
sin
Co
nse
rvat
ion
Dep
artm
ent
(Wis
con
sin
Dep
artm
ent
of
Nat
ura
l
Res
ou
rces
)fo
rst
atew
ide
lak
ein
ven
tory
.L
akes
sam
ple
do
nce
.
All
nam
edla
kes
and
nu
mer
ou
su
nn
amed
lak
essa
mp
led
An
dre
ws
&T
hre
inen
(196
6,19
70)
Bla
cket
al.
(196
3)
Eas
tern
Lak
eS
urv
eyE
LS
Dat
aco
llec
ted
for
acid
rain
sen
siti
vit
yst
ud
y;
lak
essa
mp
led
on
cein
autu
mn
Ov
erto
net
al.
(198
6)
EP
AE
nv
iro
nm
enta
lR
esea
rch
Lab
ora
tory
in
Du
luth
and
Un
iver
sity
of
Min
nes
ota
atD
ulu
th
ER
LD
Ch
emic
alsu
rvey
so
fo
ver
275
lak
esin
Wis
con
sin
con
du
cted
bet
wee
n19
79an
d19
82fo
rev
alu
atio
no
ftr
op
hic
stat
ean
d
sen
siti
vit
yto
acid
dep
osi
tio
n
Eil
ers
etal
.(1
983)
;
Gla
ss&
So
ren
son
(199
4)
Cap
elli
&M
agn
uso
n(1
983)
CM
Su
rvey
(198
2)o
fcr
ayfi
shsp
ecie
san
dab
un
dan
cein
no
rth
-cen
tral
Wis
con
sin
Cap
elli
&M
agn
uso
n(1
983)
Fis
hco
mm
un
ity
anal
ysi
sst
ud
yF
ISH
Ase
ries
of
surv
eys
(197
8±81
)o
ffi
shsp
ecie
sp
rese
nce
±ab
sen
ce
inn
ort
h-c
entr
alW
isco
nsi
n
Rah
el(1
984,
1986
),T
on
n&
Mag
nu
son
(198
2)
A geographic template for lake districts 305
ã 2000 Blackwell Science Ltd, Freshwater Biology, 43, 301±318
For many variables, we combined data from multiple
sources (Table 1). Where values for a given lake were
available in two or more data sets, an average was
used in the analysis. Variables common to multiple
data sets were scrutinized using 1 : 1 plots to ensure
the quality of our aggregated data set. We pooled and
averaged variables only if their correlation was
greater that 0.7 and the slope from a geometric
regression was between 0.8 and 1.2.
When variables from different data sets were
incongruous, only the `better' data set (usually the
more recent) was used. The `better' data set was
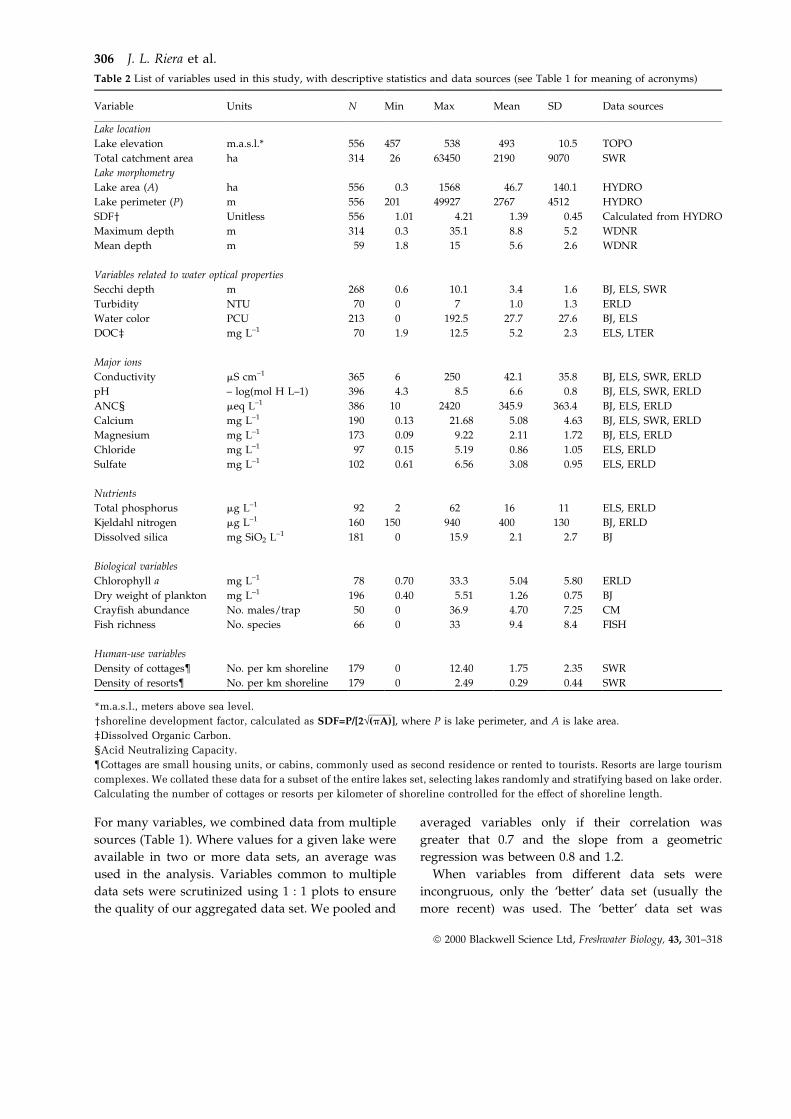
Table 2 List of variables used in this study, with descriptive statistics and data sources (see Table 1 for meaning of acronyms)
Variable Units N Min Max Mean SD Data sources
Lake location
Lake elevation m.a.s.l.* 556 457 538 493 10.5 TOPO
Total catchment area ha 314 26 63450 2190 9070 SWR
Lake morphometry
Lake area (A) ha 556 0.3 1568 46.7 140.1 HYDRO
Lake perimeter (P) m 556 201 49927 2767 4512 HYDRO
SDFy Unitless 556 1.01 4.21 1.39 0.45 Calculated from HYDRO
Maximum depth m 314 0.3 35.1 8.8 5.2 WDNR
Mean depth m 59 1.8 15 5.6 2.6 WDNR
Variables related to water optical properties
Secchi depth m 268 0.6 10.1 3.4 1.6 BJ, ELS, SWR
Turbidity NTU 70 0 7 1.0 1.3 ERLD
Water color PCU 213 0 192.5 27.7 27.6 BJ, ELS
DOCz mg L±1 70 1.9 12.5 5.2 2.3 ELS, LTER
Major ions
Conductivity mS cm±1 365 6 250 42.1 35.8 BJ, ELS, SWR, ERLD
pH ± log(mol H L±1) 396 4.3 8.5 6.6 0.8 BJ, ELS, SWR, ERLD
ANCx meq L±1 386 10 2420 345.9 363.4 BJ, ELS, ERLD
Calcium mg L±1 190 0.13 21.68 5.08 4.63 BJ, ELS, SWR, ERLD
Magnesium mg L±1 173 0.09 9.22 2.11 1.72 BJ, ELS, ERLD
Chloride mg L±1 97 0.15 5.19 0.86 1.05 ELS, ERLD
Sulfate mg L±1 102 0.61 6.56 3.08 0.95 ELS, ERLD
Nutrients
Total phosphorus mg L±1 92 2 62 16 11 ELS, ERLD
Kjeldahl nitrogen mg L±1 160 150 940 400 130 BJ, ERLD
Dissolved silica mg SiO2 L±1 181 0 15.9 2.1 2.7 BJ
Biological variables
Chlorophyll a mg L±1 78 0.70 33.3 5.04 5.80 ERLD
Dry weight of plankton mg L±1 196 0.40 5.51 1.26 0.75 BJ
Crayfish abundance No. males/trap 50 0 36.9 4.70 7.25 CM
Fish richness No. species 66 0 33 9.4 8.4 FISH
Human-use variables
Density of cottages{ No. per km shoreline 179 0 12.40 1.75 2.35 SWR
Density of resorts{ No. per km shoreline 179 0 2.49 0.29 0.44 SWR
*m.a.s.l., meters above sea level.
yshoreline development factor, calculated as SDF=P/[2Ö(pA)], where P is lake perimeter, and A is lake area.
zDissolved Organic Carbon.
xAcid Neutralizing Capacity.
{Cottages are small housing units, or cabins, commonly used as second residence or rented to tourists. Resorts are large tourism
complexes. We collated these data for a subset of the entire lakes set, selecting lakes randomly and stratifying based on lake order.
Calculating the number of cottages or resorts per kilometer of shoreline controlled for the effect of shoreline length.
306 J. L. Riera et al.
ã 2000 Blackwell Science Ltd, Freshwater Biology, 43, 301±318

selected based on an evaluation of sampling and
analytical methodology (precision, accuracy, and
reported detection limit) and on the comprehensive-
ness of the data sets. Data sets spanned more than
60 years, and some lakes may have changed. Where
this was suspected (notably, the concentration of
chloride; Bowser, 1992), only the most recent data
were used. Once the data sources for each variable
were selected, pairwise scatterplots were used to
detect outliers; these were excluded from further
analyses.
Statistical analyses
To quantify the strength of the relationship between
each variable and lake order, we used three
analytical devices. First, we inspected relations
with lake order on box-and-whisker plots and
symmetrical dot plots. Box-and-whisker plots give
a visual representation of the distribution properties
of a sample based on nonparametric measures of
central tendency, dispersion, and skewness. Symme-
trical dot plots represent the distribution of data
points using all cases. Together, these plots give
information about the number of cases in each lake
order category and their statistical distribution, as
well as about the presence, strength, and shape of
the relationship between the variable and lake order
(Jacoby, 1997). Second, we tested for differences
among lake orders using one-way analysis of
variance (ANOVA) with lake order as a categorical
variable. Finally, if an ANOVA suggested that lake
orders differed significantly, we used multiple
means comparisons with the Bonferroni correction
to test for differences among individual lake orders.
We decided not to use linear regression analysis
because lake order, the predictor variable, is not
continuous, but ordinal. In addition, inspection of
plots revealed that not all relationships were linear.
Results
Lake order compared to other measures of landscape position
Because lake order is based on position along a
drainage network, the number of lakes in each class
decreased as order increased (Fig. 2). Out of 556 lakes,
231 lakes (42%) were isolated, closed-basin lakes (lake
order ± 3), whereas there were only 11 lakes of order 3
and six of order 4. Because of the small number of
order 4 lakes, we merged them with order 3 for all
further analysis.
Fig. 2 Distribution of lakes by lake order.
Fig. 3 Box plots for lake elevation (in meters above sea level), and total catchment area vs. lake order.
A geographic template for lake districts 307
ã 2000 Blackwell Science Ltd, Freshwater Biology, 43, 301±318

We found that lake order was associated to some
extent with two other metrics of landscape position.
Lake elevation ranged from 457 to 538 m above sea
level. Lake order was unrelated to lake elevation,
except that lakes at a high elevation tended to be of
order ± 3 (Fig. 3a). Total catchment area increased
sharply with lake order, but only for drainage lakes
of order 0 or greater. Lakes of lower order
consistently had small catchments (Fig. 3b).
Lake features and lake order
Of the 25 lake variables, only four (DOC, sulfate, total
phosphorus, and dry weight of plankton) did not
differ significantly among lake orders. One variable
(crayfish abundance) was marginally significant
(P = 0.06) and the rest differed significantly based
on one-way ANOVA (Table 3). Among the variables
with a significant ANOVA, the percentage of the
Table 3 Results of analysis of variance. Unless otherwise noted, all models are one-way ANOVA to test for differences among lake
order classes
Variable Transformation N MSE R2 P-value
(a) Morphometric variables
Lake area log 556 0.38 0.24 < 0.0001
Lake perimeter log 556 0.14 0.27 < 0.0001
SDF* log 556 0.01 0.26 < 0.0001
Maximum depth None 205 33.87 0.12 < 0.0001
Mean depth None 114 4.97 0.17 < 0.002
(b) Variables related to water optical properties
Secchi depth None 268 2.20 0.12 < 0.0001
Turbidity log 70 0.03 0.29 < 0.0001
Water color log 213 0.19 0.16 < 0.0001
DOCy) log 70 0.03 0.16 < 0.09
(c) Major ions
Conductivity log 365 0.06 0.54 < 0.0001
pH None 396 0.46 0.36 < 0.0001
ANCz) log 386 0.14 0.50 < 0.0001
Calcium log 190 0.11 0.57 < 0.0001
Magnesium log 173 0.08 0.51 < 0.0001
Chloride log 97 0.12 0.35 < 0.0001
Sulfate None 102 0.90 0.06 < 0.4
(d) Nutrients
Total phosphorus log 92 0.07 0.07 < 0.42
Kjeldahl nitrogen None 160 0.15 0.15 < 0.0003
Dissolved silica log(x + 0.05) 181 0.19 0.46 < 0.0001
(e) Biological variables
Chlorophyll ax log 78 0.12 0.28 < 0.0002
Chlorophyll a{ log 76 0.10 0.37 < 0.0001
Dry weight of plankton log 196 0.05 0.04 < 0,22
Crayfish abundance log (x + 1) 50 0.20 0.23 < 0.06
Fish richness sqr (x + 0.5) 66 1.12 0.41 < 0.0001
(f) Human-use variables
Density of cottages None 179 4.9 0.14 < 0.0002
Density of resorts None 179 0.15 0.25 < 0.0001
*Shoreline development factor.
yDissolved organic carbon.
zAcid neutralizing capacity.
xIncluding all data.
{Excluding two outliers of lake order 2.
308 J. L. Riera et al.
ã 2000 Blackwell Science Ltd, Freshwater Biology, 43, 301±318

variance accounted for by lake order (as measured by
R2) varied from 12% (maximum depth), to 56%
(calcium concentration).
ANOVA tests are sensitive to small differences
among classes (especially in our highly unbalanced
models), tend to have low P-values when the degrees
of freedom are high, and do not provide information
about the presence or absence of a trend with lake
order. Observation of a trend with lake order would
increase our confidence that lake order is related
systematically to a variable. Below, we discuss the
relations between each group of variables and lake
order taking into account the visual inspection of
graphs and multiple mean comparisons among lake
orders (Figs 4±10).
Fig. 4 Box plots for lake area, shoreline development factor
(SDF), and maximum depth vs. lake order. Thick lines at the
base of each graph group lake orders not significantly different
according to multiple means comparison tests.
Fig. 5 Box plots for Secchi disk depth, water turbidity, and water
color vs. lake order. Thick lines at the base of each graph group
lake orders not significantly different according to multiple
means comparison tests.
A geographic template for lake districts 309
ã 2000 Blackwell Science Ltd, Freshwater Biology, 43, 301±318

Lake area (Fig. 4a), shoreline length, and the
shoreline development factor (Fig. 4b) increased
with lake order. Lakes high in the landscape tended
to be numerous, small, and circular in shape, while
lowland lakes were less common, large, and tended to
have convoluted shorelines. Both maximum depth
(Fig. 4c) and mean depth (not shown) differed
significantly among lake orders (ANOVA, Table 3),
with a slight tendency to increase with lake order
(Fig. 4), but multiple mean comparisons detected no
significant differences. In this district, lake depth is
limited by the 30 meter thickness of the layer of glacial
sediments over bedrock.
Optical properties of water were weakly related to
lake order. Secchi depth, turbidity, and water color
differed significantly among orders (Table 3), but
differences among orders were small (Fig. 5), and
multiple means comparison tests did not detect
significant differences for any pairing. Nonetheless,
Secchi depth, turbidity and water color changed in
directions that were consistent with each other, i.e.
water color and turbidity increased, and Secchi depth
decreased with lake order. DOC, which influences
water color and, thus, clarity, did not differ signifi-
cantly with lake order (Table 3).
Water chemistry variables were strongly related to
lake order. Specific conductance, pH, acid neutraliz-
ing capacity (ANC), and the concentrations of
calcium and magnesium (Fig. 6 and Table 3)
increased markedly with lake order. Differences
were highest between seepage lakes (classes ± 3, ± 2
and ± 1) and drainage lakes (classes 0 and higher).
Fig. 6 Box plots for specific conductance, calcium concentration, pH, and Acid Neutralizing Capacity (ANC) vs. lake order. Thick lines
at the base of each graph group lake orders not significantly different according to multiple means comparison tests.
310 J. L. Riera et al.
ã 2000 Blackwell Science Ltd, Freshwater Biology, 43, 301±318
These properties tended to increase with lake order
for seepage lakes, but not among drainage lakes.
Several studies point to the controlling influence of
weathering reactions and groundwater transport for
these chemical species. Groundwater is much more
concentrated in dissolved ions than precipitation and
surface runoff water (Hurley et al., 1985; Kenoyer &
Anderson, 1989).
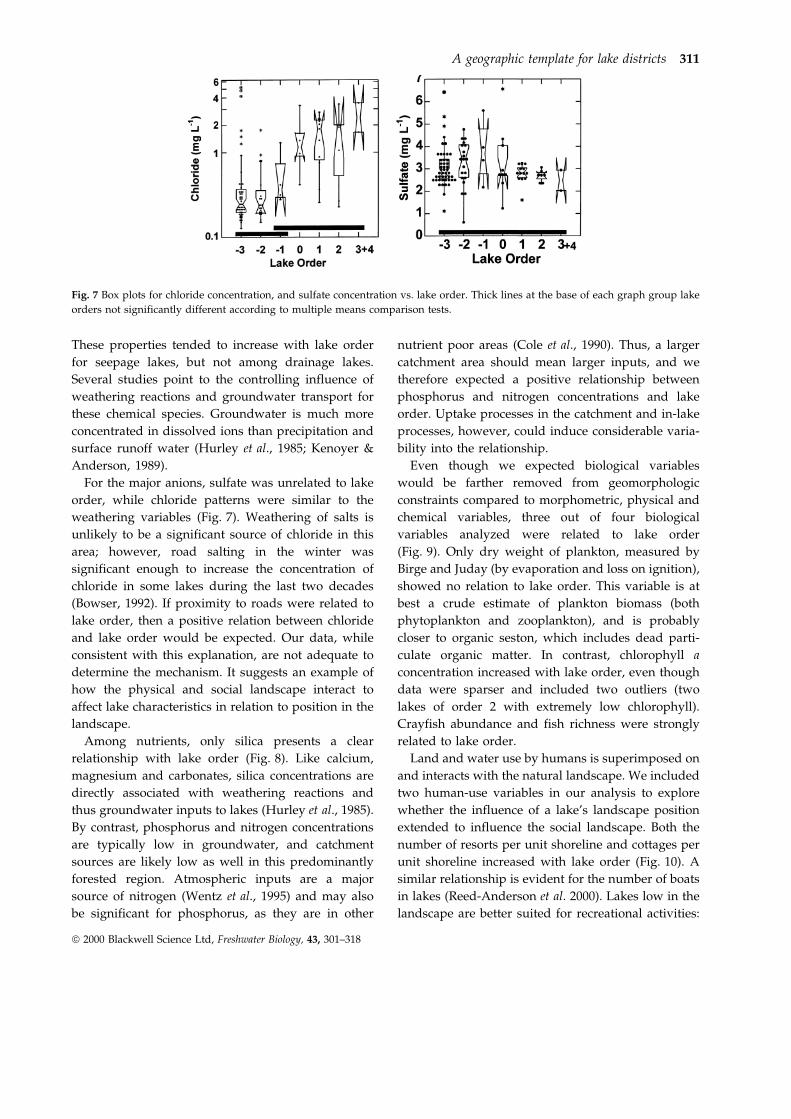
For the major anions, sulfate was unrelated to lake
order, while chloride patterns were similar to the
weathering variables (Fig. 7). Weathering of salts is
unlikely to be a significant source of chloride in this
area; however, road salting in the winter was
significant enough to increase the concentration of
chloride in some lakes during the last two decades
(Bowser, 1992). If proximity to roads were related to
lake order, then a positive relation between chloride
and lake order would be expected. Our data, while
consistent with this explanation, are not adequate to
determine the mechanism. It suggests an example of
how the physical and social landscape interact to
affect lake characteristics in relation to position in the
landscape.
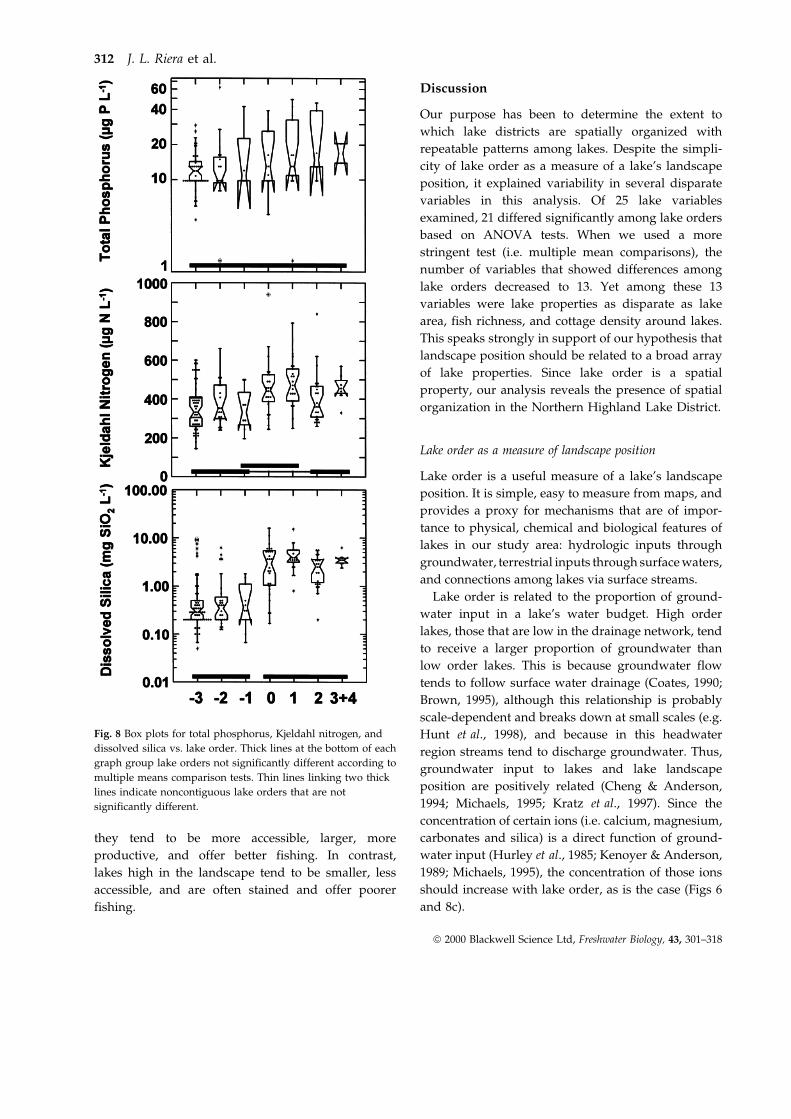
Among nutrients, only silica presents a clear
relationship with lake order (Fig. 8). Like calcium,
magnesium and carbonates, silica concentrations are
directly associated with weathering reactions and
thus groundwater inputs to lakes (Hurley et al., 1985).
By contrast, phosphorus and nitrogen concentrations
are typically low in groundwater, and catchment
sources are likely low as well in this predominantly
forested region. Atmospheric inputs are a major
source of nitrogen (Wentz et al., 1995) and may also
be significant for phosphorus, as they are in other
nutrient poor areas (Cole et al., 1990). Thus, a larger
catchment area should mean larger inputs, and we
therefore expected a positive relationship between
phosphorus and nitrogen concentrations and lake
order. Uptake processes in the catchment and in-lake
processes, however, could induce considerable varia-
bility into the relationship.
Even though we expected biological variables
would be farther removed from geomorphologic
constraints compared to morphometric, physical and
chemical variables, three out of four biological
variables analyzed were related to lake order
(Fig. 9). Only dry weight of plankton, measured by
Birge and Juday (by evaporation and loss on ignition),
showed no relation to lake order. This variable is at
best a crude estimate of plankton biomass (both
phytoplankton and zooplankton), and is probably
closer to organic seston, which includes dead parti-
culate organic matter. In contrast, chlorophyll a
concentration increased with lake order, even though
data were sparser and included two outliers (two
lakes of order 2 with extremely low chlorophyll).
Crayfish abundance and fish richness were strongly
related to lake order.
Land and water use by humans is superimposed on
and interacts with the natural landscape. We included
two human-use variables in our analysis to explore
whether the influence of a lake's landscape position
extended to influence the social landscape. Both the
number of resorts per unit shoreline and cottages per
unit shoreline increased with lake order (Fig. 10). A
similar relationship is evident for the number of boats
in lakes (Reed-Anderson et al. 2000). Lakes low in the
landscape are better suited for recreational activities:
Fig. 7 Box plots for chloride concentration, and sulfate concentration vs. lake order. Thick lines at the base of each graph group lake
orders not significantly different according to multiple means comparison tests.
A geographic template for lake districts 311
ã 2000 Blackwell Science Ltd, Freshwater Biology, 43, 301±318
they tend to be more accessible, larger, more
productive, and offer better fishing. In contrast,
lakes high in the landscape tend to be smaller, less
accessible, and are often stained and offer poorer
fishing.
Discussion
Our purpose has been to determine the extent to
which lake districts are spatially organized with
repeatable patterns among lakes. Despite the simpli-
city of lake order as a measure of a lake's landscape
position, it explained variability in several disparate
variables in this analysis. Of 25 lake variables
examined, 21 differed significantly among lake orders
based on ANOVA tests. When we used a more
stringent test (i.e. multiple mean comparisons), the
number of variables that showed differences among
lake orders decreased to 13. Yet among these 13
variables were lake properties as disparate as lake
area, fish richness, and cottage density around lakes.
This speaks strongly in support of our hypothesis that
landscape position should be related to a broad array
of lake properties. Since lake order is a spatial
property, our analysis reveals the presence of spatial
organization in the Northern Highland Lake District.
Lake order as a measure of landscape position
Lake order is a useful measure of a lake's landscape
position. It is simple, easy to measure from maps, and
provides a proxy for mechanisms that are of impor-
tance to physical, chemical and biological features of
lakes in our study area: hydrologic inputs through
groundwater, terrestrial inputs through surface waters,
and connections among lakes via surface streams.
Lake order is related to the proportion of ground-
water input in a lake's water budget. High order
lakes, those that are low in the drainage network, tend
to receive a larger proportion of groundwater than
low order lakes. This is because groundwater flow
tends to follow surface water drainage (Coates, 1990;
Brown, 1995), although this relationship is probably
scale-dependent and breaks down at small scales (e.g.
Hunt et al., 1998), and because in this headwater
region streams tend to discharge groundwater. Thus,
groundwater input to lakes and lake landscape
position are positively related (Cheng & Anderson,
1994; Michaels, 1995; Kratz et al., 1997). Since the
concentration of certain ions (i.e. calcium, magnesium,
carbonates and silica) is a direct function of ground-
water input (Hurley et al., 1985; Kenoyer & Anderson,
1989; Michaels, 1995), the concentration of those ions
should increase with lake order, as is the case (Figs 6
and 8c).
Fig. 8 Box plots for total phosphorus, Kjeldahl nitrogen, and
dissolved silica vs. lake order. Thick lines at the bottom of each
graph group lake orders not significantly different according to
multiple means comparison tests. Thin lines linking two thick
lines indicate noncontiguous lake orders that are not
significantly different.
312 J. L. Riera et al.
ã 2000 Blackwell Science Ltd, Freshwater Biology, 43, 301±318

Lake order is related to total catchment area (Fig. 3)
and to the catchment to lake area ratio. These are
measures of the significance of terrestrial inputs to
lakes, which increase with stream order (Vanotte
et al., 1980) and hence with lake order for drainage
lakes.
Finally, lake order is a proxy for lake connectivity
through surface water, a property of biogeographic
significance. Colonization via surface waters from
downstream sources decreases from order 3 + 4 lakes
to isolated order ± 3 lakes.
We compared lake order to two other metrics of
landscape position that could serve as alternatives to
lake order: lake elevation and total catchment area.
Lake elevation was not related to lake order
(ANOVA R2 = 0.02, n = 556, P = 0.16), and was a
poor predictor of lake features in this lake district.
For example, fish species richness was related more
Fig. 9 Box plots for chlorophyll a concentration, plankton dry weight, crayfish abundance, and fish species richness vs. lake order.
Thick lines at the base of each graph group lake orders not significantly different according to multiple means comparison tests.
Fig. 10 Box plots for density of cottages, and density of resorts vs. lake order. Thick lines at the bottom of each graph group lake orders
not significantly different according to multiple means comparison tests. Thin lines linking two thick lines indicate noncontiguous lake
orders that are not significantly different.
A geographic template for lake districts 313
ã 2000 Blackwell Science Ltd, Freshwater Biology, 43, 301±318
strongly to lake order (R2 = 0.38, n = 66, P < 0.001)
than to elevation (R2 = 0.12, n = 66, P = 0.04).
Furthermore, the lack or loss of explanatory power
from elevation was apparent even when we per-
formed separate regressions for each catchment. The
contrast between strong relationships of lake char-
acteristics with lake order and weak relationships
with elevation suggests that the relative, not the
absolute, landscape position of lakes is important,
and that this relationship operates at a spatial scale
smaller than the entire lake district.
Total catchment area has been used frequently in
regional limnology as an indicator of terrestrial
inputs to lakes. In our analysis it was related
strongly to lake order, plus it has the advantage of
being a continuous variable. Why then use lake
order? We think lake order is conceptually superior
in the context of our question. Lake order reflects the
geomorphology and the legacy of the geomorphic
template and constrained processes that structured
the landscape and the characteristics of the lakes,
including their catchment area. Thus, total catchment
area can be considered an attribute constrained by
landscape position. Moreover, connectivity between
lakes is conceptually related to lake order, but
unrelated to total catchment area. The merit of the
concept of landscape position lies as much in its
heuristic value as in its predictive power.
Lake order and the legacy of the last glaciation
We argued in the introduction that the spatial
pattern of a lake district originated in the geomor-
phologic processes that generates a landscape. In the
case of the Northern Highland Lake District, the
origin of the landscape can be traced back to the
end of the Wisconsin glaciation, about 13 000 years
ago. Some of the features we investigated (i.e.
morphometric features) can be directly linked to
those processes. Others (e.g. biological variables)
were strongly related to lake order not through a
single and direct causal link, but through a multi-
variate set of causal variables linking the property
of interest to lake position. Still other features were
unrelated to lake order; they may still reveal spatial
patterning, but it is unrelated to the particular
geographic metric that we chose for this analysis. In
the following discussion, we provide examples of all
three cases.
Direct links, the influence of the geomorphic template
We observed that, as one moves down the landscape,
lakes were more likely to be larger and to have a more
complex shape. This pattern probably reflects the
geomorphologic processes that formed the lake dis-
trict. During the retreat of the Wisconsin glaciation,
blocks of ice detached from the glaciers and melted to
form numerous small, isolated circular lakes. Large
lakes, in contrast, were formed when the incipient
surface drainage system filled end moraines, or when
two or more simple basins coalesced to form a larger
lake, perhaps because of increases in lake level
occasioned by larger discharge of groundwater or
surface inputs. In both cases, larger lakes would tend
to be more complex in shape and to be part of the
surface drainage system. Thus geomorphology acted
as a constraint, favoring the formation of one type of
lake over another depending on its location in the
landscape. Still, there are large variations in size and
shape within each lake order. In low elevation, low
relief areas covered by extensive wetlands, such as the
north-west section of our study area, some seepage
lakes are large, although still nearly circular in shape.
Conversely, some lakes low in the drainage system
are small, with relatively large streams flowing
through them.
Indirect links, the legacy of the geomorphic template
Three of the four biological variables we evaluated
were related to lake order, but explaining these
relationships requires invoking intervening explana-
tory variables. Consider the case of the concentration
of chlorophyll. In our data set, chlorophyll is best
predicted by the concentrations of total phosphorus
and silica (R2 = 0.61, n = 58, P < 0.001; ERLD data).
The concentration of silica is clearly related to lake
order. If lake order is introduced as a covariate in an
ANCOVA model, the most terse model includes lake
order and total phosphorus (R2 = 0.65, n = 65,
P < 0.001). Other factors that might affect chlorophyll
concentrations, such as lake area, mean depth or
water renewal time, are also related to lake order.
Thus, environmental constraints on chlorophyll con-
centration can be traced back to a lake's position in the
landscape.
Similar arguments can be used to explain the
stronger relationships between lake order and cray-
fish abundance and fish species richness. Crayfish
abundance in this lake district is best predicted by
314 J. L. Riera et al.
ã 2000 Blackwell Science Ltd, Freshwater Biology, 43, 301±318
calcium concentration, the quality of the littoral
substrate, and lake size (Capelli & Magnuson, 1983;
Lodge et al., 1998). Calcium is necessary for growth
and structure, and lakes with a calcium concentration
below » 4 mg/L do not sustain crayfish populations.
The quality of the bottom substrate is another
important habitat requirement. Silt and muck, com-
mon in seepage lakes, are not suitable for crayfish,
whereas cobbles and pebbles are most suitable
(Capelli & Magnuson, 1983). Lake size is important
because larger lakes are more likely to provide
patches of suitable habitat. All three variables (cal-
cium concentration, bottom materials, and lake size)
are related to lake order, explaining its relationship
with crayfish abundance. Analogous explanations
account for the relationship between fish species
richness and lake order. Fish species richness is well
predicted by lake area in our data set (R2 = 0.74,
n = 66, P < 0.0001). This alone could statistically
explain the relationship between fish species richness
and lake order, but lake area is highly correlated with
other causal factors important to fish such as lake
connection by streams for invasions, the probability of
severe winter oxygen, and low pH (Tonn & Magnu-
son, 1982; Rahel, 1984, 1986; Tonn et al., 1990;
Magnuson et al., 1994, 1998b).
No relation to lake order, Would other metrics do it?
Lake water optical properties were unrelated to lake
order. Water color in these lakes is related to humic and
fulvic components of dissolved organic carbon con-
centration (DOC). Lake DOC concentrations are corre-
lated with the presence and extent of wetlands in the
catchment area (Hope et al., 1996; Gergel et al. 1999).
This suggests that DOC and water color may be more
related to inputs from the immediate catchment than to
a lake's position in the drainage system. Thus the
spatial patterning of lake water color should be related
to the distribution of wetlands, and this, in turn, is
potentially related to geomorphology and may there-
fore be also related to the legacy of the glacial processes
that shaped the landscape. It is just not related to the
hydrologic measure of landscape position that we have
focused on for this analysis.
Lake order and the organization of lake districts
Lake order was capable of explaining a significant
fraction of among-lake variability in a broad selection
of variables in the Northern Highland Lake District. In
some cases (morphometry, water chemistry), the
relationship was explained directly by geomorpholo-
gical or hydrological considerations; in other cases
(biological variables, human-use variables), the
`response' variable was indirectly influenced by the
lake's landscape position. However, in all cases, lake
order could be viewed as integrating a multiplicity of
covarying mechanisms to explain the observed rela-
tionship.
Taken individually, none of the relationships
reported here will strike any limnologist as new.
Even if not reported, they belong to the expert
knowledge of many local scientists. Taken together,
however, they compose a powerful view of how the
legacy of the glacial processes that acted during the
genesis of the lake district, impinges on a broad range
of lake features, and ultimately defines the spatial
character of a lake district.
Lake order in particular and landscape position in
general are best seen as constraints (sensu Allen &
Starr, 1982; Pickett et al., 1994) based on lake origin
and development, rather than as ultimate causes. It is
an expression of the spatial organization of a lake
district. Lakes that are high in the landscape are not
determined to be small or to have species-poor fish
communities. The geomorphic template laid down by
the glaciers caused these lakes to be more likely to
have these features through the way that processes
are constrained during lake development. The posi-
tion they happen to occupy was constrained by their
genesis and, as well, constrained their subsequent
ontogeny.
The analysis of lake order is important, not because
we may gain more insight on proximate mechanisms,
or because we may improve our predictions of any
individual lake's features, but because it reveals how
lakes are related to each other across the landscape
now, and how they may respond to external forces in
the future. Moreover, it provides a framework for
regionalization, allowing us to make better predic-
tions and better management decisions with scant
data. It also provides a mechanism to compare across
lake districts (Soranno et al., in 1999). Finally, it
provides a framework for the synthesis of regional
analyses of lakes, streams, and the terrestrial land-
scape. Terrestrial ecologists have embraced landscape
perspectives (Turner, 1989). Stream ecologists have
long incorporated a landscape and geomorphological
A geographic template for lake districts 315
ã 2000 Blackwell Science Ltd, Freshwater Biology, 43, 301±318

perspective (Vanotte et al., 1980). The lake order
concept can help to develop such a spatially explicit
landscape perspective for lakes.
Acknowledgments
Support for this project was provided through NSF
grant DEB9632853 to the North Temperate Lakes
Long-term Ecological Research Project. J.L. Riera was
supported by a postdoctoral fellowship from the
Catalan Comissio Interdepartamental de Recerca i
Innovacio TecnoloÁgica (CIRIT 1995BEAI300126). We
thank Alan P. Covich, Thomas M. Frost, and an
anonymous reviewer for their criticism on an earlier
manuscript.
References
Allan J.D. & Johnson L.B. (1997) Catchment-scale
analysis of aquatic ecosystems. Freshwater Biology, 37,
107±111.
Allen T.F.H. & Starr T.B. (1982) Hierarchy. Perspectives for
Ecological Complexity. University of Chicago Press,
Chicago, IL.
Anderson M.P. & Munter J.A. (1981) Seasonal reversals
of groundwater flow around lakes and the relevance of
stagnation points and lake budgets. Water Resources
Research, 17, 1139±1150.
Andrews L.M. & Threinen C.W. (1966) Surface Water
Resources of Oneida County. Wisconsin Conservation
Department (Wisconsin Department of Natural Re-
sources), Madison, WI.
Andrews L.M. & Threinen C.W. (1970) Surface Water
Resources of Iron County. Wisconsin Conservation
Department (Wisconsin Department of Natural Re-
sources), Madison, WI.
Attig J. (1984) The Pleistocene Geology of Vilas County,
Wisconsin. PhD Thesis, University of Wisconsin-Madi-
son, Madison, WI.
Beckel A.L. (1987) Breaking New Waters. A Century of
Limnology at the University of Wisconsin. Wisconsin
Academy of Sciences, Arts and Letters, Madison, WI.
Birge E.A. & Juday Ch. (1911) The inland lakes of
Wisconsin. Bulletin of the Wisconsin Geological and
Natural History Survey, 22.
Black J.J., Andrews L.M. & Threinen C.W. (1963) Surface
Water Resources of Vilas County. Wisconsin Conserva-
tion Department (Wisconsin Department of Natural
Resources), Madison, WI.
Bowser C.J. (1992) Groundwater pathways for chloride
pollution of lakes. Chemical Deicers and the Environment
(Ed. F.M. Ditri). Lewis Publishers Inc., Chelsea, MI.
Brown A.G. (1995) Geomorphology and Groundwater.
Wiley, Chichester, England.
Capelli G.M. & Magnuson J.J. (1983) Morphoedaphic and
biogeographic analysis of crayfish distribution in
northern Wisconsin. Journal of Crustacean Biology, 3,
548±564.
Cheng X. & Anderson M.P. (1994) Simulating the
influence of lake position on groundwater fluxes.
Water Resources Research, 30, 2041±2049.
Coates D.R. (1990) Geomorphic controls of groundwater
hydrology. Groundwater Geomorphology. The Role of
Subsurface Water in Earth-Surface Processes and Landforms
(Eds C.G. Higgins & D.R. Coates). Geological Society of
America, Special Paper 252, Boulder, CO.
Cole J.J., Caraco N.F. & Likens G.E. (1990) Short-range
atmospheric transport: a significant source of phos-
phorus to an oligotrophic lake. Limnology and Oceano-
graphy, 35, 1230±1237.
Eilers J.M., Glass G.E., Webster K.E. & Rogalla J.A. (1983)
Hydrologic control of lake susceptibility to acidifica-
tion. Canadian Journal of Fisheries and Aquatic Sciences,
40, 1896±1904.
Gergel S.E., Turner M.E. & Kratz. T.K. (1999) Dissolved
organic carbon as an indicator of the scale of watershed
influence on lakes and rivers. Ecological Applications, 9,
1377±1390.
Glass G.E. & Sorenson J.A. (1994) USEPA ERLD-UMD
acid deposition gradient-susceptibility database. U.S. EPA
Environmental Research Laboratory ± Duluth and
University of Minnesota at Duluth, MN.
Harris G.P. (1986) Phytoplankton Ecology. Chapman &
Hall, London.
Hope D., Kratz T.K. & Riera J.L. (1996) The relationship
between PCO2 and dissolved organic carbon in North-
ern Wisconsin lakes. Journal of Environmental Quality,
25, 1442±1445.
Hunt R.J., Anderson M.P. & Kelson V.A. (1998) Improv-
ing a complex finite-difference ground water flow
model through the use of an analytic element screening
model. Ground Water, 36, 1011±1017.
Hurley J.C., Armstrong D.E., Kenoyer G.J. & Bowser G.J.
(1985) Groundwater as a silica source for diatom
production in a precipitation dominated lake. Science
(Washington, D.C.), 227, 1576±1578.
Hutchinson G.E. (1957) A Treatise on Limnology, Vol. 1.
Wiley, New York.
Jacoby W.G. (1997) Statistical Graphics for Univariate and
Bivariate Data. Sage Publications, Thousand Oaks, CA.
Johnson M.D. (1984) Documentation and quality assur-
ance of the computer files of historical water chemistry
data from the Wisconsin Northern Highland Lake
District (the Birge and Juday data). Wisconsin DNR
Technical Report. Madison, WI.
316 J. L. Riera et al.
ã 2000 Blackwell Science Ltd, Freshwater Biology, 43, 301±318

Juday C. & Birge E.A. (1933) The transparency, the color
and the specific conductance of the lake waters of
north-eastern Wisconsin. Transactions of the Wisconsin
Academy of Sciences, Arts and Lettters, 28, 295±259.
Kenoyer G.J. & Anderson M.P. (1989) Groundwater's
dynamic role in regulating acidity and chemistry in a
precipitation-dominated lake. Journal of Hydrology, 109,
287±306.
Kenoyer G.J. & Bowser C.J. (1992a) Groundwater
chemical evolution in a sandy silicate aquifer in
northern Wisconsin. 1: Patterns and rates of change.
Water Resources Research, 28, 579±589.
Kenoyer G.J. & Bowser C.J. (1992b) Groundwater
chemical evolution in a sandy silicate aquifer in
northern Wisconsin. 2: Reaction modeling. Water
Resources Research, 28, 591±600.
Kratz T.K. & Medland V.L. (1989) Relationship
between landscape position and groundwater input
in northern Wisconsin kettle-hole peatlands. Fresh-
water Wetlands and Wildlife (eds R.R. Sharitz & J.W.
Gibbons). CONF-8603101, DOE Symposium Series no.
61, USDOE Office of Scientific and Technical In-
formation, Oak Ridge, TN.
Kratz T.K., Webster K.E., Bowser C.J., Magnuson J.J. &
Benson B.J. (1997) The influence of landscape position
on lakes in northern Wisconsin. Freshwater Biology, 37,
209±217.
Likens G.E., ed.. (1985) An Ecosystem Approach to Aquatic
Ecology ± Mirror Lake and its Environment. Springer-
Verlag, New York.
Lodge D.M., Stein R.A., Brown K.M., Covich A.P.,
Bronmark C., Garvey J.E. & Klosiewski S.P. (1998)
Predicting impact of freshwater exotic species on
native biodiversity: challenges to spatial scaling.
Australian Journal of Ecology, 23, 53±67.
Magnuson J.J., Benson B.J. & McLain A.S. (1994) Insights
on species richness and turnover from long-term
ecological research: fishes in north-temperate lakes.
American Zoologist, 34, 437±451.
Magnuson J.J. & Kratz T.K. (2000) Lakes in the landscape:
approaches to regional limnology. Verhandlungen Inter-
nationale Vereinigung fuÈr Limnologie, 27, 1±14.
Magnuson J.J., Kratz T.K., Allen T.F., Armstrong D.E.,
Benson B.J., Bowser C.J., Bolgrien D.W., Carpenter S.R.,
Frost T.M., Gower S.T., Lillesand T.M., Pike J.A. &
Turner M.G. (1998a) Regionalization of long-term
ecological research (LTER) on north temperate lakes.
Verhandlungen Internationale Vereinigung fuÈr Limnologie,
26, 522±528.
Magnuson J.J., Tonn W.M., Banerjee A., Toivonen J.,
Sanchez O. & Rask M. (1998b) Isolation versus
extinction in the assembly of fishes in small northern
lakes. Ecology, 79, 2941±2956.
Margalef R. (1983) LimnologõÂa. Omega, Barcelona.
Michaels S. (1995) Regional analysis of lakes, ground-
water and precipitation in northern Wisconsin: A
stable isotope study. M.S. University of Wisconsin ±
Madison. Madison, WI.
Naumann E. (1932) GrundzuÈ ge der regionalen Limnolo-
gie. Die BinnengewaÈsser (Schweizerbart, Stuttgart), 11.
Okwueze E. (1983) Geophysical investigations of the bedrock
and the groundwater-lake flow system in the Trout Lake
region of Vilas County, Wisconsin. PhD Thesis, Univer-
sity of Wisconsin-Madison, Madison, WI.
Overton W.S., Kanciruk P., Hook L.A., Eilers J.M.,
Landers D.H., Brakke D.F., Blick Jr D.J., Linhurst
R.A., DeHaan M.D. & Omernik J.M. (1986) Character-
istics of lakes in the Eastern United States. Volume II:
Lakes sampled and descriptive statistics for physical
and chemical variables. EPA/600/4±86/007b, U.S.
Environmental Protection Agency, Washington, DC.
Pickett S.T.A., Kolasa J. & Jones C.G. (1994) Ecological
Understanding. Academic Press, San Diego, CA.
Rahel F.J. (1984) Factors structuring fish assemblages along
a bog lake successional gradient. Ecology, 65, 1276±1289.
Rahel F.J. (1986) Biogeographic influences on fish species
composition of northern Wisconsin lakes with applica-
tions for lake acidification studies. Canadian Journal of
Fisheries and Aquatic Sciences, 43, 124±134.
Reed-Anderson T., Bennett E.M., Jorgensen B.S., Causter
G., Bruce Lewis D., Nawacek D., Riera J.L., Sanderson
B.L. & Stedman R. (2000) Distribution of recreational
boating across lakes: do landscape variables affect
recreational use? Freshwater Biology, 43, 439±448.
Riera J.L., De Manuel J., Jaume D., MorguõÂ J.A. &
Armengol J. (1992) Patterns of variation in the
limnology of Spanish reservoirs: a regional study.
Limnetica, 8, 111±123.
Soranno P.A., Webster K.E., Riera J.L., Kratz T.K., Baron
J.S., Bukaveckas P., Kling G.W., White D.S., Caine N.,
Lathrop R.C., & Leavitt P. (1999) Spatial variation
among lakes within landscapes: ecological organiza-
tion along lake chains. Ecosystems, 2, 395±410.
Strahler A.N. (1964) Quantitative geomorphology of
drainage basins and channel networks. Handbook of
Applied Hydrology (ed. V.T. Chow), pp. 4/39±4/76.
McGraw-Hill Book Co, New York.
Thienemann A. (1925) Dien BinnengewaÈsser Mitteleur-
opas. Die BinnengewaÈsser (Schweizerbart, Stuttgart), 1.
Tonn W.M. & Magnuson J.J. (1982) Patterns of species
composition and richness of fish assemblages in
northern Wisconsin lakes. Ecology, 63, 1149±1166.
Tonn W.M., Magnuson J.J., Rask. M. & Toivonen J. (1990)
Intercontinental comparison of small-lake fish assem-
blages: the balance between local and regional pro-
cesses. The American Naturalist, 136, 345±375.
A geographic template for lake districts 317
ã 2000 Blackwell Science Ltd, Freshwater Biology, 43, 301±318
Turner M.G. (1989) Landscape ecology: the effect of
pattern on process. Annual Review of Ecology and
Systematics, 20, 171±197.
Vanotte R.L., Minshall G.W., Cumins K.W., Sedell J.R. &
Cushing C.E. (1980) The River Continuum Concept.
Canadian Journal of Fisheries and Aquatic Sciences, 37,
130±137.
Webster K.E., Kratz T.K., Bowser C.J, Magnuson J.J. &
Rose W.J. (1996) The influence of landscape position on
lake chemical responses to drought in northern
Wisconsin, USA. Limnology and Oceanography, 41,
977±984.
Wentz D.A., Rose W.J. & Webster K.E. (1995) Long-term
hydrologic and biogeochemical responses of a soft
water seepage lake in north central Wisconsin. Water
Resources Res., 31, 199±212.
Wisconsin Department of Natural Resources (1994)
Wisconsin DNR GIS database user's guide. Wisconsin
Department of Natural Resources, Bureau of Informa-
tion Management, Geographic Services Section. Madi-
son, WI.
Wisconsin Department of Natural Resources (1995)
Lakes of Wisconsin. Wisconsin Department of Natural
Resources, Madison, WI.
318 J. L. Riera et al.
ã 2000 Blackwell Science Ltd, Freshwater Biology, 43, 301±318