a global perspective of southern asian monsoon...
TRANSCRIPT
Cooperative Institute for Climate and SatellitesUniversity of Maryland5825 University Research Court, (Suite 4001)College Park, MD 20740-3823Tel: (301) 405-2147 Fax: (301) 405-8648http://www.essic.umd.edu/cics
Institute Director: Dr. Phillip [email protected] Director: Andrew [email protected]
Monterey, Oct 26-30, 2009 NOAA 34th Climate Diagnostic and Prediction Workshop
A GLOBAL PERSPECTIVE OF SOUTHERN ASIAN MONSOON ANNUAL PRECIPITATION VARIATIONS IN GPCP (1979-2006)
(The co-variability of annual monsoon precipitation and global surface temperature with a focus on
the southern Asian monsoon region)
Investigators: A. Sudradjat, A. Gruber, J. Janowiak, and R. R. Ferraro

Cooperative Institute for Climate and SatellitesUniversity of Maryland5825 University Research Court, (Suite 4001)College Park, MD 20740-3823Tel: (301) 405-2147 Fax: (301) 405-8648http://www.essic.umd.edu/cics
Institute Director: Dr. Phillip [email protected] Director: Andrew [email protected]
• Background• Data & methods• Results• Summary
Outline
This study is a co-variability study (not a trend-focused study)
Cooperative Institute for Climate and SatellitesUniversity of Maryland5825 University Research Court, (Suite 4001)College Park, MD 20740-3823Tel: (301) 405-2147 Fax: (301) 405-8648http://www.essic.umd.edu/cics
Institute Director: Dr. Phillip [email protected] Director: Andrew [email protected]
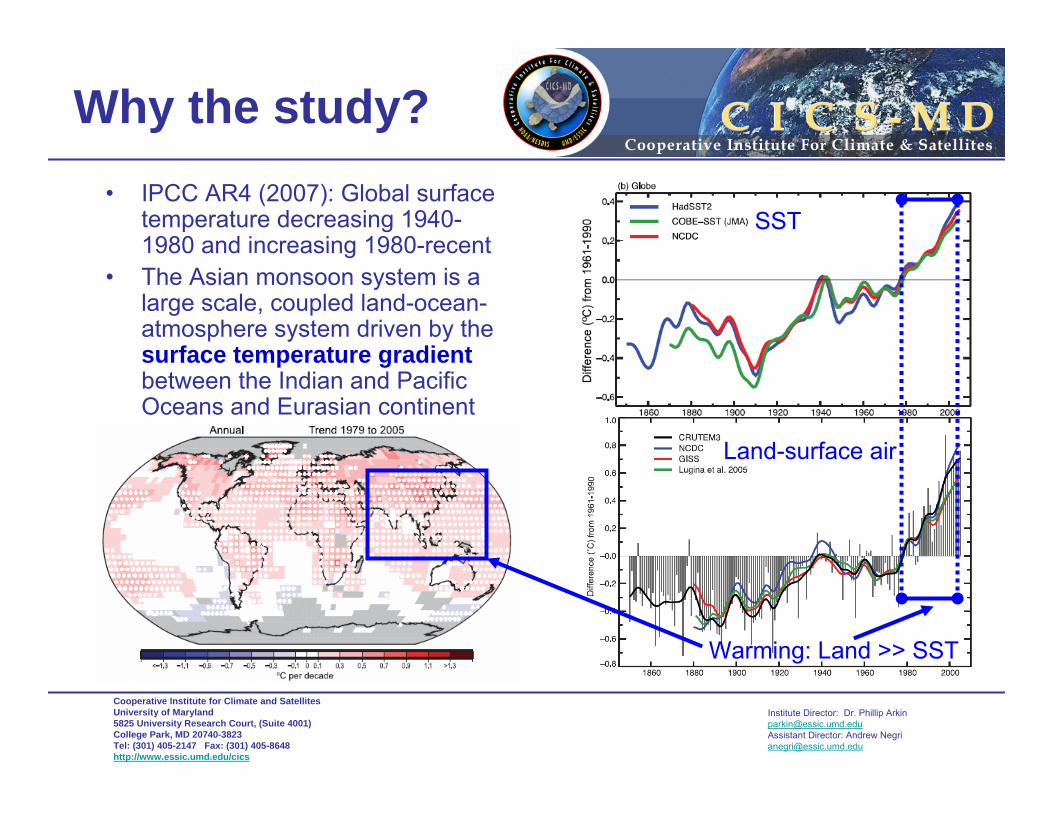
Why the study?• IPCC AR4 (2007): Global surface
temperature decreasing 1940-1980 and increasing 1980-recent
• The Asian monsoon system is a large scale, coupled land-ocean-atmosphere system driven by the surface temperature gradientbetween the Indian and Pacific Oceans and Eurasian continent
SST
Land-surface air
Warming: Land >> SST

Cooperative Institute for Climate and SatellitesUniversity of Maryland5825 University Research Court, (Suite 4001)College Park, MD 20740-3823Tel: (301) 405-2147 Fax: (301) 405-8648http://www.essic.umd.edu/cics
Institute Director: Dr. Phillip [email protected] Director: Andrew [email protected]
Why the study?• Q: How does recent (1979-recent) global land and ocean warming affect
monsoon P spatio-temporally? • Comprehensive observational global datasets available: short (1979-recent)
for interdecadal analyses [Smith et al. 2006], but useful for covariabilityanalyses
Recent observational monsoon & global P interdecadal studies:• Wang and Ding (2006): global oceanic monsoon P in GPCP increasing
1979-2003. Global land monsoon P decreasing 1948-1980 and leveling off 1980-2003 (in line with Chase et al. 2003).
• Smith et al. (2006): global P in GPCP (1979-2004) vary spatially over land and ocean with a near-zero global average. Increase convective P over tropical oceans due to SST >29°C.
• Adler et al. (2008): linear change occurs predominantly in tropical P• Zhou et al. (2008): global land P variations arise from ocean forcing (SST)• The first three studies warrant the sensitivity of trend analysis to the record
length

Cooperative Institute for Climate and SatellitesUniversity of Maryland5825 University Research Court, (Suite 4001)College Park, MD 20740-3823Tel: (301) 405-2147 Fax: (301) 405-8648http://www.essic.umd.edu/cics
Institute Director: Dr. Phillip [email protected] Director: Andrew [email protected]
Data & MethodsData: 1979-2006• GPCP Version 2.1 [Huffman et al.
2009]• Global merged surface
temperature [Smith et al. 2008]• ERSST v. 3 [Smith et al. 2008]• Global land daily max & min
temperature from GTS station [Xieet al. 1996]
• NCEP/NCAR reanalysis winds [class “A”; Kalnay et al. 1996]
Methods:EOF, correlation, low frequency variability
EOF-1 (long-term mean removed) (EV=32.37%)
Cooperative Institute for Climate and SatellitesUniversity of Maryland5825 University Research Court, (Suite 4001)College Park, MD 20740-3823Tel: (301) 405-2147 Fax: (301) 405-8648http://www.essic.umd.edu/cics
Institute Director: Dr. Phillip [email protected] Director: Andrew [email protected]
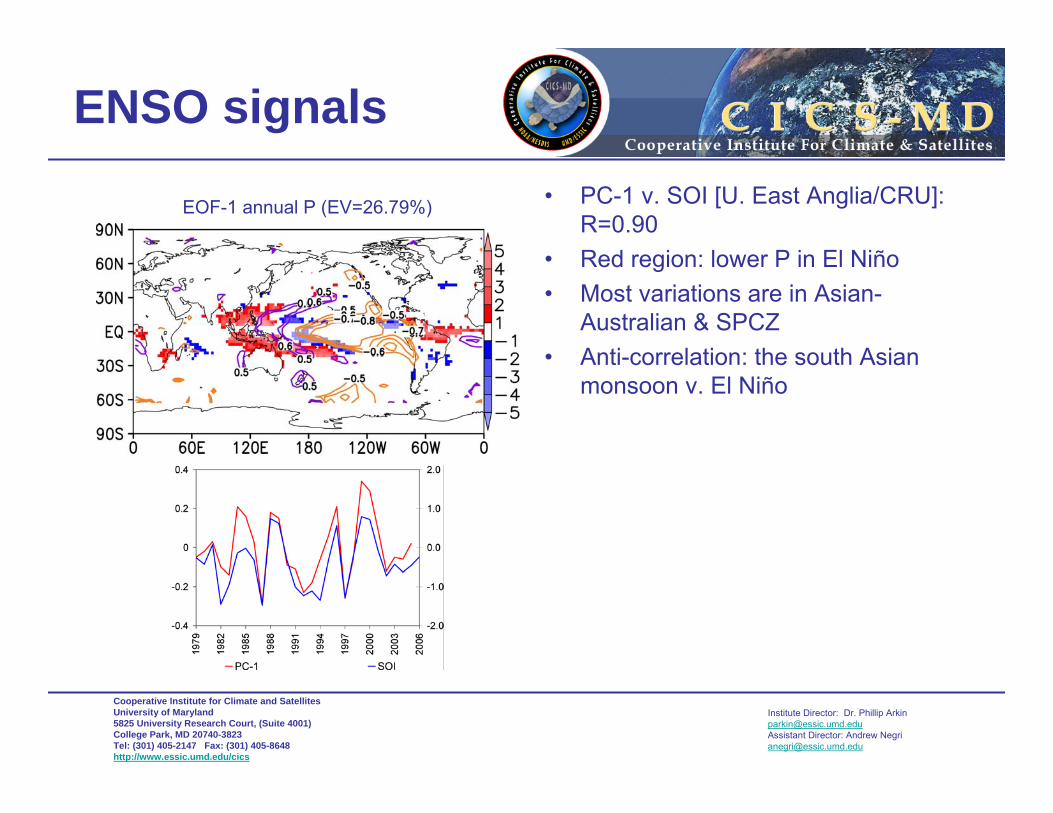
• PC-1 v. SOI [U. East Anglia/CRU]: R=0.90
• Red region: lower P in El Niño • Most variations are in Asian-
Australian & SPCZ• Anti-correlation: the south Asian
monsoon v. El Niño
ENSO signals
EOF-1 annual P (EV=26.79%)

Cooperative Institute for Climate and SatellitesUniversity of Maryland5825 University Research Court, (Suite 4001)College Park, MD 20740-3823Tel: (301) 405-2147 Fax: (301) 405-8648http://www.essic.umd.edu/cics
Institute Director: Dr. Phillip [email protected] Director: Andrew [email protected]
• PC-2 v. TNI [Trenberth and Stepaniak 2001]: R=0.75
• Mostly response to strong El Niño events of 82/83 & 97/98
• Combining with EOF-1: in collocated red region, even dryer P during the strong El Niño
• Most variations are in Asian-Australian & SPCZ
ENSO signals
EOF-2 annual P (EV=14.55%)
Niño-4
Niño-1+2

Cooperative Institute for Climate and SatellitesUniversity of Maryland5825 University Research Court, (Suite 4001)College Park, MD 20740-3823Tel: (301) 405-2147 Fax: (301) 405-8648http://www.essic.umd.edu/cics
Institute Director: Dr. Phillip [email protected] Director: Andrew [email protected]
• Positive change dominates and are in Asian-Australian & SPCZ
• Smith et al. [2006] & Zhou et al. [2008]: monsoon P variations arise from ocean forcing (i.e. SST)
• High R between monsoon P v. SST only? High R are both in land and ocean
• SPCZ: increase convective P due to SST >29°C [Smith et al. 2006]
• Similar results with ERSST and GTS (independent datasets)
• Southern Asian monsoon region is sandwiched by correlation regions of the 30°N Asian land and equatorial Indian Ocean.
P v. SST-Tsfc land
EOF-3 annual P (EV=6.29%)

Cooperative Institute for Climate and SatellitesUniversity of Maryland5825 University Research Court, (Suite 4001)College Park, MD 20740-3823Tel: (301) 405-2147 Fax: (301) 405-8648http://www.essic.umd.edu/cics
Institute Director: Dr. Phillip [email protected] Director: Andrew [email protected]
P v. SST-Tsfc land
R: P v. Gradient 0.60 & P v. PC-3 0.63
Increasing concurrently
getting higher
Increasing: (Spearman-Conley test) • U850 (α=10%)• V850 (α=5%)• The Webster-Yang monsoon index [u*850-u*200] [Webster and Yang, 1992] (α=10%)
• P in the Bay of Bengal (α=5%)

Cooperative Institute for Climate and SatellitesUniversity of Maryland5825 University Research Court, (Suite 4001)College Park, MD 20740-3823Tel: (301) 405-2147 Fax: (301) 405-8648http://www.essic.umd.edu/cics
Institute Director: Dr. Phillip [email protected] Director: Andrew [email protected]
• Monsoon P in GPCP co-varies with land and sea Tsfc• Most P variations can be associated with ENSO• Higher P is expected with increasing SST in tropical convective oceanic
monsoon regions• Where moisture import is the main source of monsoon P, such as the
southern Asian monsoon region, variations in the land-sea Tsfc gradient can affect the monsoon circulation by changing the low level wind fields and hence moisture transport and ultimately P in the region.
Modeling efforts focusing on dynamical physical connections between the variations of surface temperature gradient and monsoon precipitation should be done especially under the global warming scenario. These should incorporate the dynamic changes of the gradient from observations as land warms faster than ocean.
Summary

Cooperative Institute for Climate and SatellitesUniversity of Maryland5825 University Research Court, (Suite 4001)College Park, MD 20740-3823Tel: (301) 405-2147 Fax: (301) 405-8648http://www.essic.umd.edu/cics
Institute Director: Dr. Phillip [email protected] Director: Andrew [email protected]
Wang [2006]:• Related to the large scale vertical shear in the zonal winds [u*850-u*200] of
the Asian monsoon system• Measures the broad-scale monsoon circulation • Depicts the thermally driven nature of the monsoon and thus recognizes the
importance of horizontal temperature gradient• Higher Webster-Yang index corresponds to increase P in the Northeastern
India, Bay of Bengal, Southeast Asia, South China Sea, and western Pacific
The W-Y index
Cooperative Institute for Climate and SatellitesUniversity of Maryland5825 University Research Court, (Suite 4001)College Park, MD 20740-3823Tel: (301) 405-2147 Fax: (301) 405-8648http://www.essic.umd.edu/cics
Institute Director: Dr. Phillip [email protected] Director: Andrew [email protected]
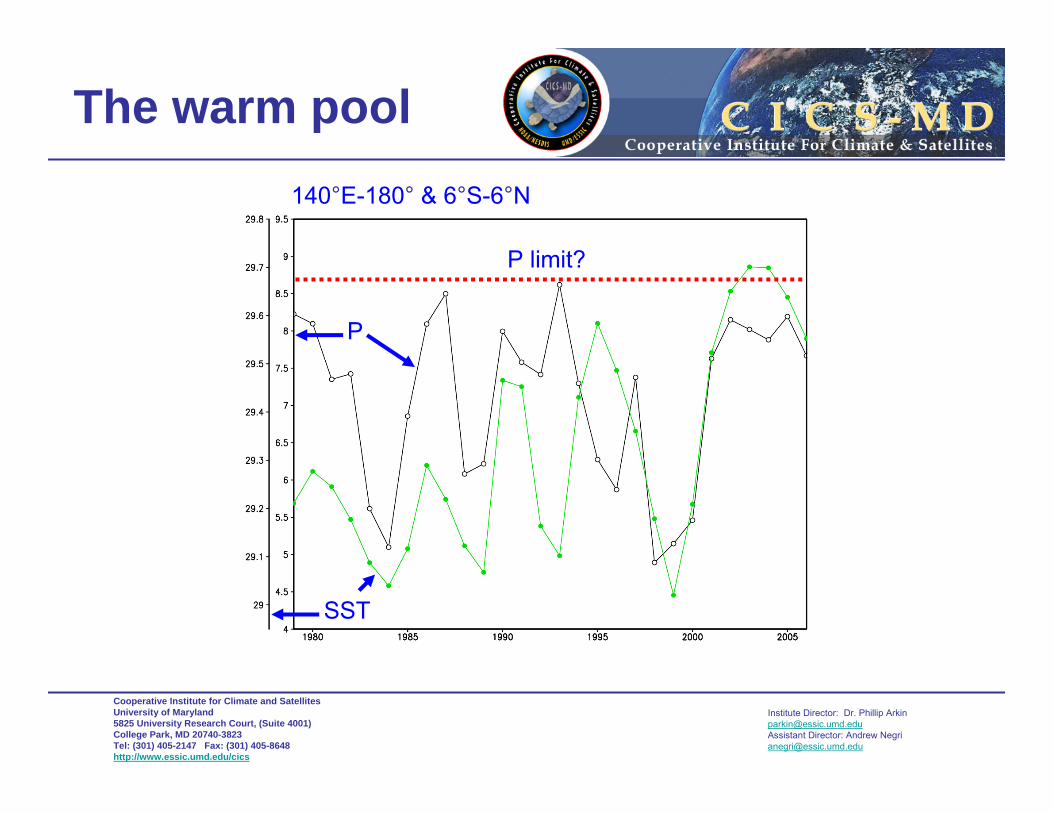
The warm pool
SST
P
P limit?
140°E-180° & 6°S-6°N

Cooperative Institute for Climate and SatellitesUniversity of Maryland5825 University Research Court, (Suite 4001)College Park, MD 20740-3823Tel: (301) 405-2147 Fax: (301) 405-8648http://www.essic.umd.edu/cics
Institute Director: Dr. Phillip [email protected] Director: Andrew [email protected]
• Seasonal cycle temperature amplitude: land > oceans• Specific heat capacity: ocean >>> land.• Mixing in the ocean: wind and buoyancy-generated turbulence.• Land surface conducts heat slowly.• Air over land warms faster and reaches a higher temperature than air over
the ocean → creating low pressure → low level wind bring moisture from ocean.
• Rainfall: moist ocean air being lifted upwards by mountains, surface heating, convergence at the surface, divergence aloft, or from storm-produced outflows at the surface.
• In winter, the land cools off quickly, but the ocean retains heat longer
Monsoon process