a global review of national influenza immunization ... · justin r. ortiza, ⇑, marc peruta ... m....
TRANSCRIPT

Vaccine 34 (2016) 5400–5405
Contents lists available at ScienceDirect
Vaccine
journal homepage: www.elsevier .com/locate /vaccine
Review
A global review of national influenza immunization policies: Analysisof the 2014 WHO/UNICEF Joint Reporting Form on immunization
http://dx.doi.org/10.1016/j.vaccine.2016.07.0450264-410X/� 2016 Published by Elsevier Ltd.This is an open access article under the CC BY license (http://creativecommons.org/licenses/by/4.0/).
⇑ Corresponding author at: Initiative for Vaccine Research, World Health Organization, 20 Avenue Appia, 1211 Geneva 27, Switzerland.E-mail address: [email protected] (J.R. Ortiz).
Justin R. Ortiz a,⇑, Marc Perut a, Laure Dumolard a, Pushpa Ranjan Wijesinghe b, Pernille Jorgensen c,Alba Maria Ropero d, M. Carolina Danovaro-Holliday a, James D. Heffelfinger e, Carol Tevi-Benissan f,Nadia A. Teleb g, Philipp Lambach a, Joachim Hombach a
aDepartment of Immunization, Vaccines and Biologicals, World Health Organization, Geneva, Switzerlandb Immunization and Vaccine Development, World Health Organization (WHO), South-East Asia Regional Office, New Delhi, IndiacDivision of Communicable Diseases and Health Security, World Health Organization (WHO) Regional Office for Europe, Copenhagen, Denmarkd Immunization Unit, Pan American Health Organization, Washington, DC, United Statese Expanded Programme on Immunization, World Health Organization (WHO) Regional Office for the Western Pacific, Manila, Philippinesf Immunization and Vaccine Development, World Health Organization, Regional Office for Africa, Brazzaville, People’s Republic of CongogVaccine Preventable Diseases, World Health Organization (WHO) Regional Office for the Eastern Mediterranean, Cairo, Egypt
a r t i c l e i n f o a b s t r a c t
Article history:Available online 16 September 2016
Keywords:Influenza vaccinesImmunization programmesWorld Health OrganizationVaccinationJoint Reporting Form
Introduction: The WHO recommends annual influenza vaccination to prevent influenza illness in high-risk groups. Little is known about national influenza immunization policies globally.Material and Methods: The 2014 WHO/UNICEF Joint Reporting Form (JRF) on Immunization was adaptedto capture data on influenza immunization policies. We combined this dataset with additional JRF infor-mation on new vaccine introductions and strength of immunization programmes, as well as publiclyavailable data on country economic status. Data from countries that did not complete the JRF were soughtthrough additional sources. We described data on country influenza immunization policies and usedbivariate analyses to identify factors associated with having such policies.Results: Of 194 WHO Member States, 115 (59%) reported having a national influenza immunization pol-icy in 2014. Among countries with a national policy, programmes target specific WHO-defined riskgroups, including pregnant women (42%), young children (28%), adults with chronic illnesses (46%),the elderly (45%), and health care workers (47%). The Americas, Europe, and Western Pacific were theWHO regions that had the highest percentages of countries reporting that they had national influenzaimmunization policies. Compared to countries without policies, countries with policies were significantlymore likely to have the following characteristics: to be high or upper middle income (p < 0.0001); to haveintroduced birth dose hepatitis B virus vaccine (p < 0.0001), pneumococcal conjugate vaccine (p = 0.032),or human papilloma virus vaccine (p = 0.002); to have achieved global goals for diphtheria-tetanus-pertussis vaccine coverage (p < 0.0001); and to have a functioning National Immunization TechnicalAdvisory Group (p < 0.0001).Conclusions: The2014 revisionof the JRFpermitted aglobal assessment ofnational influenza immunizationpolicies. The 59%of countries reporting that they hadpolicies arewealthier, usemore newor under-utilizedvaccines, and have stronger immunization systems. Addressing disparities in public health resources andstrengthening immunization systems may facilitate influenza vaccine introduction and use.� 2016 Published by Elsevier Ltd. This is an open access article under the CC BY license (http://creative-
commons.org/licenses/by/4.0/).
Contents
1. Introduction . . . . . . . . . . . . . . . . . . . . . . . . . . . . . . . . . . . . . . . . . . . . . . . . . . . . . . . . . . . . . . . . . . . . . . . . . . . . . . . . . . . . . . . . . . . . . . . . . . . . . . . . 54012. Materials and methods . . . . . . . . . . . . . . . . . . . . . . . . . . . . . . . . . . . . . . . . . . . . . . . . . . . . . . . . . . . . . . . . . . . . . . . . . . . . . . . . . . . . . . . . . . . . . . . 54013. Results. . . . . . . . . . . . . . . . . . . . . . . . . . . . . . . . . . . . . . . . . . . . . . . . . . . . . . . . . . . . . . . . . . . . . . . . . . . . . . . . . . . . . . . . . . . . . . . . . . . . . . . . . . . . . 5402

1
J.R. Ortiz et al. / Vaccine 34 (2016) 5400–5405 5401
4. Discussion. . . . . . . . . . . . . . . . . . . . . . . . . . . . . . . . . . . . . . . . . . . . . . . . . . . . . . . . . . . . . . . . . . . . . . . . . . . . . . . . . . . . . . . . . . . . . . . . . . . . . . . . . . 5404Conflicts of interest . . . . . . . . . . . . . . . . . . . . . . . . . . . . . . . . . . . . . . . . . . . . . . . . . . . . . . . . . . . . . . . . . . . . . . . . . . . . . . . . . . . . . . . . . . . . . . . . . . 5405Disclaimer . . . . . . . . . . . . . . . . . . . . . . . . . . . . . . . . . . . . . . . . . . . . . . . . . . . . . . . . . . . . . . . . . . . . . . . . . . . . . . . . . . . . . . . . . . . . . . . . . . . . . . . . . . 5405Funding . . . . . . . . . . . . . . . . . . . . . . . . . . . . . . . . . . . . . . . . . . . . . . . . . . . . . . . . . . . . . . . . . . . . . . . . . . . . . . . . . . . . . . . . . . . . . . . . . . . . . . . . . . . . 5405Acknowledgements . . . . . . . . . . . . . . . . . . . . . . . . . . . . . . . . . . . . . . . . . . . . . . . . . . . . . . . . . . . . . . . . . . . . . . . . . . . . . . . . . . . . . . . . . . . . . . . . . . 5405References . . . . . . . . . . . . . . . . . . . . . . . . . . . . . . . . . . . . . . . . . . . . . . . . . . . . . . . . . . . . . . . . . . . . . . . . . . . . . . . . . . . . . . . . . . . . . . . . . . . . . . . . . 5405
1. Introduction
The Global Action Plan for Influenza Vaccines (GAP1) waslaunched by the World Health Organization (WHO) in 2006 toreduce the global shortage of seasonal and pandemic influenza vac-cines [1]. A major goal of GAP is to increase seasonal influenza vac-cine use globally. Addressing this goal would prevent severeinfluenza illness, strengthen health systems within countries to bet-ter respond to influenza pandemics, and encourage the vaccineindustry to develop greater influenza vaccine manufacturing capac-ity [1]. Since the launch of GAP, regional influenza vaccine manufac-turing capacity has expanded and overall global production capacityhas increased [2–5]. As of 2015, global production capacity for a pan-demic influenza vaccine is estimated to be around 6.372 billiondoses per year [5]. While this estimate represents a large increasefrom the most recent assessment, production capacity is still farfrom the GAP goals of being able to provide two doses of vaccineto 70% of the global population within 6 months [1].
The 2012 WHO position paper on influenza vaccines notes thatinfluenza causes considerable morbidity worldwide and that coun-tries should consider implementing influenza vaccine programmesas national capacities and resources allow [6]. WHO recommendsthat countries consider immunizing high-risk groups againstinfluenza; these groups include pregnant women, young children6–59 months, adults with specific chronic illnesses, persons atleast 65 years, and health care workers [6]. As of the 2012 positionpaper, WHO recommends that countries initiating or expandinginfluenza immunization programmes should prioritize pregnantwomen, while other risk groups are not ranked by priority [6].There are limited published data about the presence or nature ofnational influenza immunization policies in many countries. Wereviewed data reported by Member States to WHO and UNICEFto evaluate national influenza immunization priorities and use toinform efforts to meet WHO influenza immunization goals [1,7].
2. Materials and methods
We adapted the WHO/UNICEF Joint Reporting Form on Immu-nization (JRF) to include questions on national influenza immu-nization policies and use. Since 1998, the JRF is completedannually by Ministries of Health of WHO Member States [8]. TheJRF is a monitoring and evaluation tool that collects national
Nonstandard abbreviations used in text:
� AFR: WHO Africa Region
� AMR: WHO Region of the Americas
� DTP3: third dose of diphtheria-tetanus-pertussis vaccine
� EMR: WHO Eastern Mediterranean Region
� EUR: WHO Europe Region
� GAP: Global Action Plan for Influenza Vaccines
� JRF: WHO/UNICEF Joint Reporting Form on Immunization
� MNTE: maternal and neonatal tetanus elimination
� NITAG: National Immunization Technical Advisory Group
� SEAR: WHO South-East Asia Region
� UNICEF: United Nations Children’s Fund
� WPR: WHO Western Pacific Region
administrative information regarding estimates of immunizationcoverage, reported cases of vaccine-preventable diseases, immu-nization schedules, vaccination campaigns, as well as indicatorsof immunization system performance and financing [9]. MostWHO Member States report immunization data annually in theJRF. Prior to 2014, the JRF collected information about influenzavaccine schedules, distribution, and coverage. At that time, WHOadapted the influenza vaccine JRF questions to focus on presenceof seasonal influenza immunization policies during the precedingyear, 2014 (see Table 1). Collected data included whether the coun-try had a national seasonal influenza vaccination policy, the groupstargeted for vaccination by the policy, the influenza vaccine formu-lation used (northern or southern hemisphere), and the number ofinfluenza vaccine doses distributed. Vaccine distribution data arecollected as an approximate measure of vaccine use, since dataon doses administered are not available in many countries. Influ-enza vaccine coverage among persons with chronic illnesses andamong the elderly are also collected to monitor progress towardWorld Health Assembly resolution WHA56.19 goals that countrieswith influenza vaccine programmes immunizeP 75% of persons inthese groups [7]. The entire JRF undergoes standard data checks atnational, regional, and global levels to improve data quality andconsistency. We reviewed the specific JRF influenza vaccine data.We used regional surveys from the Americas, Europe, and theWestern Pacific to determine the presence of immunization poli-cies for some countries that did not report influenza data on theJRF [10–14]. We did not extract vaccine coverage, formulation, ordistribution data from non-JRF sources. We used the 2014 JRFdatabase that was available as of 15 July 2016.
Next, we identified additional Member-State-specific data (from2014 except where noted) that were relevant to immunization pro-grammes (Table 4). As a measure of country economic status, weused 2013World Bank data for country income category and healthexpenditure per capita [15]. As low-resource countries often rely onfinancial support from Gavi, the Vaccine Alliance, for new vaccineintroduction, we also used JRF data for country eligibility to receivesuch support (Gavi eligible) [16,17]. To assess newvaccine introduc-tions, we used JRF data indicating the inclusion of the following vac-cines in national immunization schedules per WHOrecommendations: birth dose hepatitis B vaccine (HBV), pneumo-coccal conjugate vaccine (PCV), human papilloma virus vaccine(HPV), and rotavirus vaccine [18–20]. To assess the general strengthof routine immunizationwe used JRF data indicatingwhether coun-trieshadachievedGlobalVaccineActionPlan (GVAP)goals ofmater-nal and neonatal tetanus elimination (MNTE) (<1 case of neonataltetanus per 1,000 live births in every district of a country), and weused theWHOUNICEF estimates of national immunization coverageto assess if countries had achieved global goals of diphtheria-tetanus-pertussis containing vaccine third dose coverage (DTP3)P95% nationally [21,22]. Finally, to assess the strength of a countryto make decisions about vaccine interventions, we used JRF data todetermine whether countries achieved the indicators definingwell-functioningNational ImmunizationTechnicalAdvisoryGroups(NITAGs) [21,23].We did not have data regardingwhether a countryparticipated in a well-functioning subregional Technical AdvisoryGroup (TAG), which is recommended as an option for small coun-tries. Country income category (high income/upper middle income
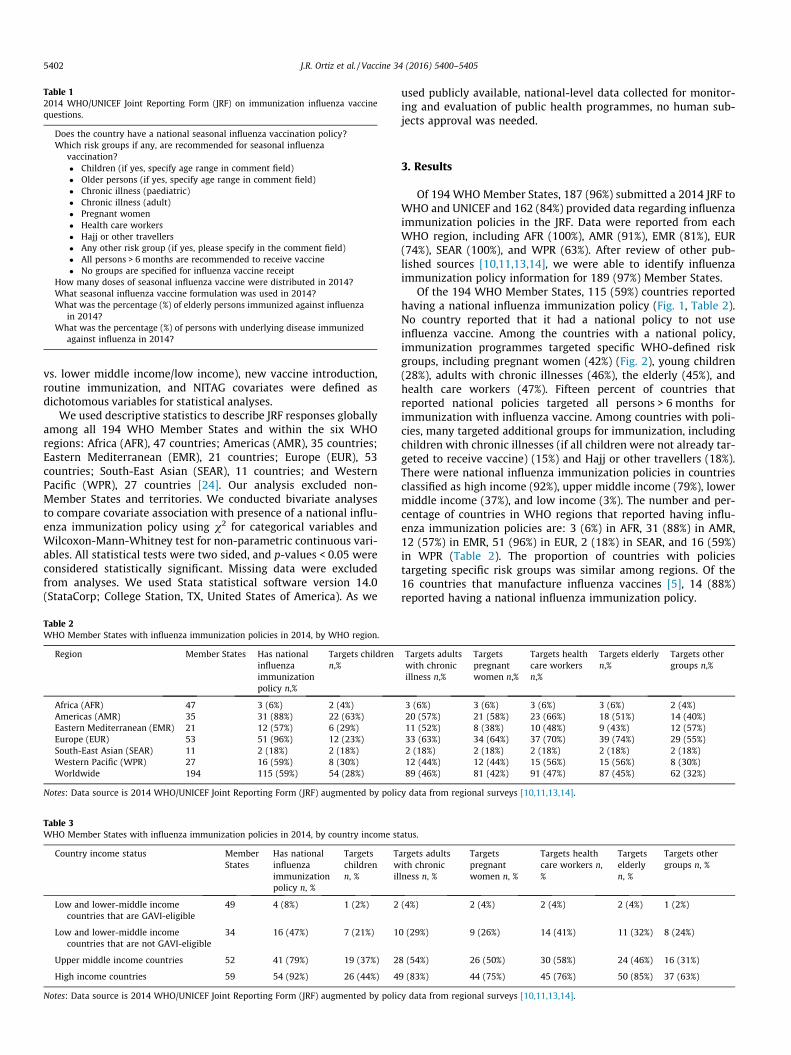
Table 12014 WHO/UNICEF Joint Reporting Form (JRF) on immunization influenza vaccinequestions.
Does the country have a national seasonal influenza vaccination policy?Which risk groups if any, are recommended for seasonal influenza
vaccination?� Children (if yes, specify age range in comment field)� Older persons (if yes, specify age range in comment field)� Chronic illness (paediatric)� Chronic illness (adult)� Pregnant women� Health care workers� Hajj or other travellers� Any other risk group (if yes, please specify in the comment field)� All persons > 6 months are recommended to receive vaccine� No groups are specified for influenza vaccine receipt
How many doses of seasonal influenza vaccine were distributed in 2014?What seasonal influenza vaccine formulation was used in 2014?What was the percentage (%) of elderly persons immunized against influenza
in 2014?What was the percentage (%) of persons with underlying disease immunized
against influenza in 2014?
5402 J.R. Ortiz et al. / Vaccine 34 (2016) 5400–5405
vs. lower middle income/low income), new vaccine introduction,routine immunization, and NITAG covariates were defined asdichotomous variables for statistical analyses.
We used descriptive statistics to describe JRF responses globallyamong all 194 WHO Member States and within the six WHOregions: Africa (AFR), 47 countries; Americas (AMR), 35 countries;Eastern Mediterranean (EMR), 21 countries; Europe (EUR), 53countries; South-East Asian (SEAR), 11 countries; and WesternPacific (WPR), 27 countries [24]. Our analysis excluded non-Member States and territories. We conducted bivariate analysesto compare covariate association with presence of a national influ-enza immunization policy using v2 for categorical variables andWilcoxon-Mann-Whitney test for non-parametric continuous vari-ables. All statistical tests were two sided, and p-values < 0.05 wereconsidered statistically significant. Missing data were excludedfrom analyses. We used Stata statistical software version 14.0(StataCorp; College Station, TX, United States of America). As we
Table 3WHO Member States with influenza immunization policies in 2014, by country income st
Country income status MemberStates
Has nationalinfluenzaimmunizationpolicy n, %
Targetschildrenn, %
Twil
Low and lower-middle incomecountries that are GAVI-eligible
49 4 (8%) 1 (2%) 2
Low and lower-middle incomecountries that are not GAVI-eligible
34 16 (47%) 7 (21%) 1
Upper middle income countries 52 41 (79%) 19 (37%) 2
High income countries 59 54 (92%) 26 (44%) 4
Notes: Data source is 2014 WHO/UNICEF Joint Reporting Form (JRF) augmented by polic
Table 2WHO Member States with influenza immunization policies in 2014, by WHO region.
Region Member States Has nationalinfluenzaimmunizationpolicy n,%
Targets childrenn,%
Africa (AFR) 47 3 (6%) 2 (4%)Americas (AMR) 35 31 (88%) 22 (63%)Eastern Mediterranean (EMR) 21 12 (57%) 6 (29%)Europe (EUR) 53 51 (96%) 12 (23%)South-East Asian (SEAR) 11 2 (18%) 2 (18%)Western Pacific (WPR) 27 16 (59%) 8 (30%)Worldwide 194 115 (59%) 54 (28%)
Notes: Data source is 2014 WHO/UNICEF Joint Reporting Form (JRF) augmented by polic
used publicly available, national-level data collected for monitor-ing and evaluation of public health programmes, no human sub-jects approval was needed.
3. Results
Of 194 WHO Member States, 187 (96%) submitted a 2014 JRF toWHO and UNICEF and 162 (84%) provided data regarding influenzaimmunization policies in the JRF. Data were reported from eachWHO region, including AFR (100%), AMR (91%), EMR (81%), EUR(74%), SEAR (100%), and WPR (63%). After review of other pub-lished sources [10,11,13,14], we were able to identify influenzaimmunization policy information for 189 (97%) Member States.
Of the 194 WHO Member States, 115 (59%) countries reportedhaving a national influenza immunization policy (Fig. 1, Table 2).No country reported that it had a national policy to not useinfluenza vaccine. Among the countries with a national policy,immunization programmes targeted specific WHO-defined riskgroups, including pregnant women (42%) (Fig. 2), young children(28%), adults with chronic illnesses (46%), the elderly (45%), andhealth care workers (47%). Fifteen percent of countries thatreported national policies targeted all persons > 6 months forimmunization with influenza vaccine. Among countries with poli-cies, many targeted additional groups for immunization, includingchildren with chronic illnesses (if all children were not already tar-geted to receive vaccine) (15%) and Hajj or other travellers (18%).There were national influenza immunization policies in countriesclassified as high income (92%), upper middle income (79%), lowermiddle income (37%), and low income (3%). The number and per-centage of countries in WHO regions that reported having influ-enza immunization policies are: 3 (6%) in AFR, 31 (88%) in AMR,12 (57%) in EMR, 51 (96%) in EUR, 2 (18%) in SEAR, and 16 (59%)in WPR (Table 2). The proportion of countries with policiestargeting specific risk groups was similar among regions. Of the16 countries that manufacture influenza vaccines [5], 14 (88%)reported having a national influenza immunization policy.
atus.
argets adultsith chroniclness n, %
Targetspregnantwomen n, %
Targets healthcare workers n,%
Targetselderlyn, %
Targets othergroups n, %
(4%) 2 (4%) 2 (4%) 2 (4%) 1 (2%)
0 (29%) 9 (26%) 14 (41%) 11 (32%) 8 (24%)
8 (54%) 26 (50%) 30 (58%) 24 (46%) 16 (31%)
9 (83%) 44 (75%) 45 (76%) 50 (85%) 37 (63%)
y data from regional surveys [10,11,13,14].
Targets adultswith chronicillness n,%
Targetspregnantwomen n,%
Targets healthcare workersn,%
Targets elderlyn,%
Targets othergroups n,%
3 (6%) 3 (6%) 3 (6%) 3 (6%) 2 (4%)20 (57%) 21 (58%) 23 (66%) 18 (51%) 14 (40%)11 (52%) 8 (38%) 10 (48%) 9 (43%) 12 (57%)33 (63%) 34 (64%) 37 (70%) 39 (74%) 29 (55%)2 (18%) 2 (18%) 2 (18%) 2 (18%) 2 (18%)12 (44%) 12 (44%) 15 (56%) 15 (56%) 8 (30%)89 (46%) 81 (42%) 91 (47%) 87 (45%) 62 (32%)
y data from regional surveys [10,11,13,14].

Fig. 1. World Map with WHO Member States Reporting to Have a National Seasonal Influenza Vaccine Programme in 2014. Note: The boundaries and names shown and thedesignations used on this map do not imply the expression of any opinion whatsoever on the part of the World Health Organization concerning the legal status of any country,territory, city or area or of its authorities, or concerning the delimitation of its frontiers or boundaries. Dotted lines on maps represent approximate borderlines for whichthere may not yet be full agreement. �WHO 2016. All rights reserved. Source: WHO-UNICEF Joint Reporting Forms (JRFs) 2014. Map production: Immunization Vaccines andBiologicals, (IVB). World Health Organization. Date of slide: 15 July 2016.
Table 4Comparison of WHO Member States with and without national influenza immunization policies in 2014.
Countries with a national influenza immunizationpolicy n,%
Countries without a national influenza immunizationpolicy n,%
Total countries 115 79
Country wealthMedian per capita health expenditure (USD$), (IQR) 664 (342, 2018) 82 (42, 178)World Bank income categoryHigh income 54 (47%) 5 (6%)Upper middle income 41 (36%) 11 (11%)Lower middle income 19 (17%) 33 (42%)Low income 1 (1%) 30 (38%)
Gavi-eligible 4 (3%) 45 (57%)
New and Under-utilized vaccine introductionIntroduced birth dose hepatitis B vaccine (HBV) 78 (68%) 29 (37%)Introduced pneumococcal conjugate vaccine (PCV) 80 (70%) 43 (54%)Introduced human papilloma virus vaccine (HPV) 56 (49%) 7 (9%)Introduced rotavirus vaccine 45 (39%) 30 (38%)
Strength of immunization systemsFunctioning National Immunization TechnicalAdvisory Group
61 (53%) 17 (22%)
Eliminated maternal and neonatal tetanus 113 (98%) 57 (72%)DTP3 coverage P95% nationally 96 (83%) 33 (42%)
Note: Data on influenza immunization policies, functional NITAGs, maternal neonatal tetanus elimination, DTP3 coverage, and MCV2 coverage from 2014 WHO/UNICEF JointReporting Form (JRF) and augmented by policy data from regional surveys [10,11,13,14]. Average per capita health expenditure and income category data are fromWorld Bank.
J.R. Ortiz et al. / Vaccine 34 (2016) 5400–5405 5403
Eighty-nine (46%) countries provided information onvaccine for-mulation used, and of these, 60 (67%) used the northern hemisphereformulation, 19 (21%) used the southern hemisphere formulation,and 10 (11%) used both formulations. Sixty-six (34%) countries pro-
vided vaccine distribution data. These countries reported distribut-ing of 230,258,405 doses of seasonal influenza vaccine, or around37% of the estimated 620 million doses produced annually [4]. Vac-cine doses were distributed in EUR (39%), AMR (29%), WPR (28%),

Fig. 2. World Map with WHO Member States Reporting to Have a National Seasonal Influenza Vaccine Programme that Targets Either All Persons > 6 Months or PregnantWomen in 2014. Note: The boundaries and names shown and the designations used on this map do not imply the expression of any opinion whatsoever on the part of theWorld Health Organization concerning the legal status of any country, territory, city or area or of its authorities, or concerning the delimitation of its frontiers or boundaries.Dotted lines on maps represent approximate borderlines for which there may not yet be full agreement. �WHO 2016. All rights reserved. Source: WHO-UNICEF JointReporting Forms (JRFs) 2014. Map production: Immunization Vaccines and Biologicals, (IVB). World Health Organization. Date of slide: 15 July 2016.
5404 J.R. Ortiz et al. / Vaccine 34 (2016) 5400–5405
SEAR (1%), AFR (1%), and EMR (1%). Data were missing from 128countries (56%), including countries that reported elsewhere tohavehigh influenza vaccine distribution rates [25].
A small number of countries reported influenza vaccinecoverage that meets World Health Assembly resolution goals toimmunizeP 75% of persons with chronic underlying diseasesand the elderly. Twenty-five countries (13%) reported influenzaimmunization rates in persons with chronic diseases; among these,coverage ranged from 4% to 100%, and 5 countries (3%) reportedachieving coverageP 75%. Thirty-seven countries (19%) reportedinfluenza immunization rates in the elderly; among these, cover-age ranged from 1% to 100%, and only 2 countries (1%) reportedachieving coverageP 75%.
Countries reporting national influenza immunization policieswere significantly more likely to be high income or upper middleincome classification (83% vs 20%, p < 0.0001) and to be ineligiblefor Gavi funding support (3% vs 57%, p < 0.0001). Countries withpolicies also had significantly higher median per capita healthexpenditures than those without such policies (664 USD vs 82USD, p < 0.0001) (Table 2). In addition, countries with policies weresignificantly more likely to have introduced birth dose HBV vaccine(68% vs 37%, p < 0.0001), introduced PCV vaccine (70% vs. 54%,p = 0.032), introduced HPV vaccine (49% vs. 9%, p = 0.002), and tohave a functioning NITAG (53% vs. 22%, p < 0.0001). Introductionof rotavirus vaccine was not significantly associated with influenzaimmunization policies. Countries with policies were more likely tohave eliminated neonatal tetanus (98% vs 72%, p < 0.0001) and tohave achieved DTP3 coverageP 95% nationally (83% vs 42%,
p < 0.0001). Only four countries with influenza immunization poli-cies were Gavi-eligible (Table 3); of these, two had functioningNITAGs, three had introduced birth dose HBV vaccine, one hadintroduced PCV vaccine, one had introduced HPV vaccine as ademonstration project, and none had introduced rotavirus vaccine.
4. Discussion
The 2014 revision of the WHO/UNICEF JRF on Immunizationpermitted a global summary of national influenza immunizationpolicies. Such policies were reported by 59% of WHO MemberStates, including countries from all WHO regions and all WorldBank income categories. Our report shows increased global influ-enza immunization policy development. A 2006 global surveyidentified 74 countries and territories with seasonal influenzaimmunization policies [26]. That survey of countries and territorieswas conducted by WHO as part of the 2006 GAP launch andachieved a 70% response rate. We identified 115 WHO MemberStates with influenza immunization policies in 2014. Since 2006,policy development was seen in each WHO region, and the coun-tries targeting pregnant women for influenza vaccine receipt hasincreased from around 15 in 2006 to 81 in 2014. Annual reportingby countries with the JRF will facilitate continued monitoring ofprogress of influenza immunization policy development.
This reporthighlights thatworkmust still bedone to ensure equi-table access of influenza vaccines globally. The regions with thehighest percentages ofMember Stateswith influenza immunizationpolicies (AMR, EUR, andWPR) reported distributing 97% of all influ-

J.R. Ortiz et al. / Vaccine 34 (2016) 5400–5405 5405
enzavaccines.Whilewehad lowresponse rates for influenzavaccinedistribution, the proportion of vaccine distribution byWHO regionsare similar to previous reports using more robust distribution databy the International Federation of Pharmaceutical Manufacturers& Associations [25]. Further, 42% of countries reported having speci-fic programmes for immunization of pregnant women, a risk groupprioritized for influenza vaccine receipt by WHO beginning in2012. Finally, few countries reportedmeetingWorld Health Assem-bly goals to immunizeP 75% of elderly persons andP 75% of per-sons with chronic illnesses [7], though other data sources indicatemore countries have achieved these goals [10,11].
Findings from this survey may facilitate the initiation or expan-sion of influenza vaccine programmes globally. Countries in higherWorld Bank income categories were significantly more likely tohave influenza immunization policies. Other factors associatedwith presence of influenza immunization policies included experi-ence introducing other new and under-utilized vaccines such asbirth dose HBV vaccine, PCV, and HPV. Countries with influenzaimmunization policies had strong routine immunization pro-grammes as measured by DTP3 coverage as well as by achievingelimination of maternal and neonatal tetanus. Many countrieswithout influenza policies did not have functional NITAGs.Strengthening NITAGs to support review of evidence to make vac-cine recommendations is critical for country decision making.Lastly, the lack of financing mechanisms to support influenza vac-cine introduction in low-resource countries will pose a major chal-lenge. Knowledge of the factors that influenced the development ofinfluenza immunization policies would be of high value for effortsto increase influenza vaccine use globally.
The report should be interpreted in the context of several limi-tations. Data were collected from the first year that influenzaimmunization policy questions were asked in the JRF. WHO expe-rience with the JRF is that completeness and accuracy of reporteddata increases over time with increased familiarity with the form.The JRF had a substantial amount of missing data on influenza vac-cines, particularly regarding vaccine distribution and coverageestimates. Some countries that have made progress achievinginfluenza vaccine coverage goals or distributing influenza vaccinesdid not provide these data in the JRF. Improving influenza vaccina-tion monitoring and reporting will be vital if the JRF is to be used tomonitor progress in influenza vaccine use prospectively. Addition-ally, some countries, mostly high income countries from the Amer-icas and Europe, did not report influenza vaccine information,requiring us to seek relevant policy data through reviews of publicinformation. Finally, the presence of an influenza immunizationpolicy does not necessarily correlate with substantial vaccine use.
The JRF is an efficient and very useful tool to prospectively mon-itor annual progress toward implementation and equitable use ofinfluenza vaccines globally. WHO recommends annual vaccinationof high-risk groups to prevent complications of influenza virusinfection, however this report demonstrates that many countriesdo not yet have national influenza immunization policies. Coun-tries without influenza immunization policies tend to have fewerresources, use fewer new or under-utilized vaccines, and haveweaker routine immunization systems. Addressing these chal-lenges may facilitate influenza vaccine introduction and use.
Conflicts of interest
The authors report no conflicts of interest.
Disclaimer
Authors of this study are employees of the World Health Orga-nization. The authors alone are responsible for the views expressed
in this publication and they do not necessarily represent the deci-sions, policy, or views of the World Health Organization.
Funding
The authors would like to acknowledge the contributions of theCenters for Disease Control and Prevention (CDC), which providesfinancial support to the World Health Organization Initiative forVaccine Research (U50 CK000431).
Acknowledgements
We would like to thank the following persons for their assis-tance with this project: Kimberly Fox and Nathalie El Omeiri.
References
[1] World Health Organization. Global action plan for influenzavaccines. Geneva: World Health Organization; 2016.
[2] Collin N, de Radigues X. Vaccine production capacity for seasonal andpandemic (H1N1) 2009 influenza. Vaccine 2009;27:5184–6.
[3] Partridge J, Kieny MP. Global production of seasonal and pandemic (H1N1)influenza vaccines in 2009–2010 and comparison with previous estimates andglobal action plan targets. Vaccine 2010;28:4709–12.
[4] Partridge J, Kieny MP. Global production capacity of seasonal influenza vaccinein 2011. Vaccine 2013;31:728–31.
[5] McLean KA, Goldin S, Nannei C, Sparrow E, Torelli G. The 2015 globalproduction capacity of seasonal and pandemic influenza vaccine. Vaccine.2016;34:5410–5413. http://dx.doi.org/2016.10.1016/j.vaccine.2016.08.019.
[6] World Health Organization. Vaccines against influenza WHO position paper –November 2012. Releve epidemiologique hebdomadaire/Section d’hygiene duSecretariat de la Societe des Nations = Weekly epidemiological record/HealthSection of the Secretariat of the League of Nations 2012;87:461–76.
[7] World Health Assembly. Resolution WHA56.19. Prevention and control ofinfluenza pandemics and annual epidemics. Geneva, Switzerland: WorldHealth Assembly; 2003.
[8] World Health Organization. Immunization financing indicators. Geneva,Switzerland: World Health Organization; 2014.
[9] World Health Organization. WHO/UNICEF joint reportingprocess. Geneva: World Health Organization; 2016.
[10] Venice III Consortium.National seasonal influenza vaccination survey for 2012–13 influenza season inEU/EEA (provisional data). In: ConsortiumVI, editor.2015.
[11] Pan American Health Organization. Immunization in the Americas: 2015summary. Washington, DC: Pan American Health Organization; 2016.
[12] Ropero-Álvarez AM, El Omeiri N, Kurtis HJ, Danovaro-Holliday MC, Ruiz-MatusC. Influenza vaccination in the Americas: progress and challenges after the2009 A(H1N1) influenza pandemic. Human Vaccines Immunother 2016.
[13] Dwyer D, Barr I, Hurt A, Kelso A, Reading P, Sullivan S, et al. Seasonal influenzavaccine policies, recommendations and use in the World Health Organization’sWestern Pacific Region. West Pac Surveillance Resp J: WPSAR 2013;4:51–9.
[14] WHOWestern Pacific Regional Office. Recommendations for vaccine recipientsby country and area. Manila, Philippines: WHO Western Pacific Region; 2011.
[15] The World Bank. GNI per capita ranking, Atlas method and PPPbased. Washington, DC: The World Bank; 2014.
[16] Gavi the Vaccine Alliance. Countries eligible for support; 2016.[17] Gavi The Vaccine Alliance. Country eligibility policy; 2016.[18] Organization WH. Rotavirus vaccines WHO position paper: January 2013–
recommendations. Vaccine 2013;31:6170–1.[19] Publication W. Hepatitis B vaccines: WHO position paper—Recommendations.
Vaccine 2010;28:589–90.[20] Publication W. Pneumococcal vaccines WHO position paper–2012–
recommendations. Vaccine 2012;30:4717–8.[21] World Health Organization. Global vaccine action plan 2011–2020; 2013.[22] Burton A, Monasch R, Lautenbach B, Gacic-Dobo M, Neill M, Karimov R, et al.
WHO and UNICEF estimates of national infant immunization coverage:methods and processes. Bull World Health Organ 2009;87:535–41.
[23] Blau J, Sadr-Azodi N, Clementz M, Abeysinghe N, Cakmak N, Duclos P, et al.Indicators to assess National Immunization Technical Advisory Groups(NITAGs). Vaccine 2013;31:2653–7.
[24] World Health Organization. WHO regional offices; 2016.[25] Palache A, Oriol-Mathieu V, Fino M, Xydia-Charmanta M. Seasonal influenza
vaccine dose distribution in 195 countries (2004–2013): little progress inestimated global vaccination coverage. Vaccine 2015;33:5598–605.
[26] World Health Organization. Global Survey on Seasonal Influenza VaccinePolicy Development and Implementation – 2006. Report of Findings. WorldHealth Organization; 2008.