a global search for triggered tremor following the 2011...
TRANSCRIPT

Ⓔ
A Global Search for Triggered Tremor Following
the 2011 Mw 9.0 Tohoku Earthquake
by Kevin Chao,* Zhigang Peng, Hector Gonzalez-Huizar, Chastity Aiken, Bogdan Enescu,†
Honn Kao, Aaron A. Velasco, Kazushige Obara, and Takanori Matsuzawa
Abstract The 2011 Mw 9.0 Tohoku, Japan, earthquake triggered deep tectonictremor and shallow microearthquakes in numerous places worldwide. Here, we con-duct a systematic survey of triggered tremor in regions where ambient or triggeredtremor has been previously identified. Tremor was triggered in the following regions:south-central Alaska, the Aleutian Arc, Shikoku in southwest Japan, the North Islandof New Zealand, southern Oregon, the Parkfield–Cholame section of the San Andreasfault in central California, the San Jacinto fault in southern California, Taiwan, andVancouver Island. We find no evidence of triggered tremor in the Calaveras fault innorthern California. One of the most important factors in controlling the triggeringpotential is the amplitude of the surface waves. Data examined in this study suggestthat the threshold amplitude for triggering tremor is !0:1 cm=s, which is equivalent toa dynamic stress threshold of !10 kilopascals. The incidence angles of the teleseismicsurface waves also affect the triggering potentials of Love and Rayleigh waves. Theresults of this study confirm that both Love and Rayleigh waves contribute to trigger-ing tremor in many regions. In regions where both ambient and triggered tremor areknown to occur, tremor triggered by the Tohoku event generally occurred at similarlocations with previously identified ambient and/or triggered tremor, further support-ing the notion that although the driving forces of triggered and ambient tremor differ,they share similar mechanisms. We find a positive relationship between the amplitudesof the triggering waves and those of the triggered tremor, which is consistent with theprediction of the clock-advance model.
Online Material: Table of measured parameters and other information related totriggering/nontriggering information, and figures of observed seismograms.
Introduction
Following the first discovery of tectonic tremor at theNankai subduction zone in southwest Japan (Obara, 2002),tremor has been subsequently found along major plate-boundary faults around the Pacific plates (Peng and Gom-berg, 2010; Beroza and Ide, 2011, and references therein).Tremor is located mostly below the brittle-ductile transitionzone and has extended source duration and nonimpulsivearrivals that lack high-frequency content compared with regu-lar earthquakes in the brittle upper crust. While most tremoroccur spontaneously (also known as ambient tremor), some-times tremor can be instantly triggered by dynamic stressesfrom regional (Guilhem et al., 2010) or teleseismic earth-
quakes (Miyazawa and Mori, 2006; Rubinstein et al., 2007;Gomberg et al., 2008). Many recent studies suggest that shearfaulting is responsible for generating tremor (Shelly et al.,2007; Peng and Gomberg, 2010), and many of the character-istics of triggered and ambient tremor are similar (Shelly et al.,2011). For instance, triggered tremor can mostly be found inregions where ambient tremor is active (Peng and Gomberg,2010), and their spectral shapes are similar (Rubinstein et al.,2007; Peng et al., 2008). Moreover, at least part of the trig-gered tremor consists of many low-frequency earthquakes(LFEs) that also occur during ambient tremor (Peng et al.,2010; Shelly et al., 2011).
Peng and Gomberg (2010) summarized observationsaround the world and suggested that teleseismically-induceddynamic stresses on the order of several kilopascals (kPa) arecapable of triggering tremor. However, the triggering threshold
*Now at Earthquake Research Institute, University of Tokyo, 1-1-1 Yayoi,Bunkyo-ku, Tokyo 113-0032, Japan.
†Now at Earth Evolution Sciences Department, University of Tsukuba,1-1-1 Tennodai, Tsukuba, Ibaraki 305-8572, Japan.
1551
Bulletin of the Seismological Society of America, Vol. 103, No. 2B, pp. 1551–1571, May 2013, doi: 10.1785/0120120171
appears to be variable from region to region. For example,the apparent triggering threshold is about 2–3 kPa at theParkfield–Cholame section of the San Andreas fault (SAF;Peng et al., 2009), but it is about 8–10 kPa beneath theCentral Range in Taiwan (Chao, Peng, Wu, et al., 2012). Itis still not clear whether such a difference is caused by differ-ent instrumentation or different tremor behavior.
The relationship between surface waves and tremor hasbeen the subject of several recent studies. Gomberg (2010)proposed a clock-advance model in which triggered tremoris considered as sped-up ambient tremor such that the sur-face-wave stress perturbations exceed the failure thresholdof the tremor patch. In particular, the instantaneous perturbedrate is proportional to the background rate, and a function de-scribes how the perturbing stress changes the failure time of afault patch. Gomberg (2010) further examined the relation-ship between the amplitudes of the triggering waves and trig-gered tremor from four observations in Cascadia (Rubinsteinet al., 2009) and found that the results did not match the pre-dictions of the clock-advance model. Chao, Peng, Wu, et al.(2012) found a positive relationship between the amplitudesof surface waves from nine teleseismic earthquakes and thoseof triggered tremor beneath the Central Range in Taiwan. Inaddition, Chao, Peng, Fabian, et al. (2012) compared trig-gered tremor observed in the Parkfield–Cholame section ofthe SAFwith the San Jacinto fault (SJF) in southern Californiaand theCalaveras fault (CF) in northernCalifornia. The resultssuggested that the abundant triggered tremor observations inParkfield and the relative lack of triggered tremor observa-tions in the other two regions could be related to their back-ground tremor rates. These results suggest a need for furtherstudies that examine the relationship among triggering surfacewaves, triggered tremor, and background tremor rate.
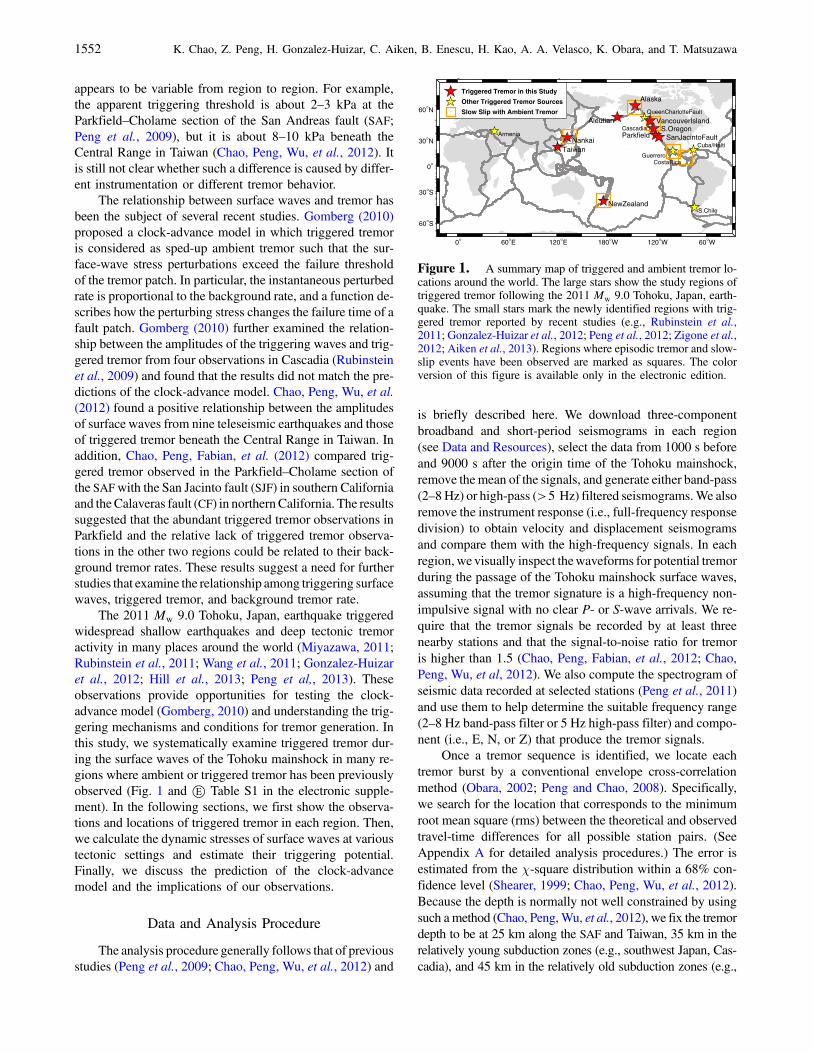
The 2011 Mw 9.0 Tohoku, Japan, earthquake triggeredwidespread shallow earthquakes and deep tectonic tremoractivity in many places around the world (Miyazawa, 2011;Rubinstein et al., 2011; Wang et al., 2011; Gonzalez-Huizaret al., 2012; Hill et al., 2013; Peng et al,, 2013). Theseobservations provide opportunities for testing the clock-advance model (Gomberg, 2010) and understanding the trig-gering mechanisms and conditions for tremor generation. Inthis study, we systematically examine triggered tremor dur-ing the surface waves of the Tohoku mainshock in many re-gions where ambient or triggered tremor has been previouslyobserved (Fig. 1 and Ⓔ Table S1 in the electronic supple-ment). In the following sections, we first show the observa-tions and locations of triggered tremor in each region. Then,we calculate the dynamic stresses of surface waves at varioustectonic settings and estimate their triggering potential.Finally, we discuss the prediction of the clock-advancemodel and the implications of our observations.
Data and Analysis Procedure
The analysis procedure generally follows that of previousstudies (Peng et al., 2009; Chao, Peng, Wu, et al., 2012) and
is briefly described here. We download three-componentbroadband and short-period seismograms in each region(see Data and Resources), select the data from 1000 s beforeand 9000 s after the origin time of the Tohoku mainshock,remove the mean of the signals, and generate either band-pass(2–8Hz) or high-pass (>5 Hz) filtered seismograms.We alsoremove the instrument response (i.e., full-frequency responsedivision) to obtain velocity and displacement seismogramsand compare them with the high-frequency signals. In eachregion, we visually inspect thewaveforms for potential tremorduring the passage of the Tohoku mainshock surface waves,assuming that the tremor signature is a high-frequency non-impulsive signal with no clear P- or S-wave arrivals. We re-quire that the tremor signals be recorded by at least threenearby stations and that the signal-to-noise ratio for tremoris higher than 1.5 (Chao, Peng, Fabian, et al., 2012; Chao,Peng, Wu, et al, 2012). We also compute the spectrogram ofseismic data recorded at selected stations (Peng et al., 2011)and use them to help determine the suitable frequency range(2–8 Hz band-pass filter or 5 Hz high-pass filter) and compo-nent (i.e., E, N, or Z) that produce the tremor signals.
Once a tremor sequence is identified, we locate eachtremor burst by a conventional envelope cross-correlationmethod (Obara, 2002; Peng and Chao, 2008). Specifically,we search for the location that corresponds to the minimumroot mean square (rms) between the theoretical and observedtravel-time differences for all possible station pairs. (SeeAppendix A for detailed analysis procedures.) The error isestimated from the χ-square distribution within a 68% con-fidence level (Shearer, 1999; Chao, Peng, Wu, et al., 2012).Because the depth is normally not well constrained by usingsuch amethod (Chao, Peng,Wu, et al., 2012), we fix the tremordepth to be at 25 km along the SAF and Taiwan, 35 km in therelatively young subduction zones (e.g., southwest Japan, Cas-cadia), and 45 km in the relatively old subduction zones (e.g.,
0° 60°E 120°E 180°W 120°W 60°W
60°S
30°S
0°
30°N
60°N
Cascadia
GuerreroCostaRica
Armenia
Cuba/Haiti
QueenCharlotteFault
S.Chile
TaiwanNankai
VancouverIslandS.Oregon
Parkfield SanJacintoFault
NewZealand
Alaska
Aleutian
Triggered Tremor in this Study
Other Triggered Tremor Sources
Slow Slip with Ambient Tremor
Figure 1. A summary map of triggered and ambient tremor lo-cations around the world. The large stars show the study regions oftriggered tremor following the 2011 Mw 9.0 Tohoku, Japan, earth-quake. The small stars mark the newly identified regions with trig-gered tremor reported by recent studies (e.g., Rubinstein et al.,2011; Gonzalez-Huizar et al., 2012; Peng et al., 2012; Zigone et al.,2012; Aiken et al., 2013). Regions where episodic tremor and slow-slip events have been observed are marked as squares. The colorversion of this figure is available only in the electronic edition.
1552 K. Chao, Z. Peng, H. Gonzalez-Huizar, C. Aiken, B. Enescu, H. Kao, A. A. Velasco, K. Obara, and T. Matsuzawa

the Aleutian Arc, Alaska, and New Zealand). These numbersare primarily based on previous studies, and we also take intoconsideration the fact that when the age of the subducting plateis older, tremor tends to occur deeper (Ide, 2012).
In regions where tremor appears to come from multiplelocations, we divide the seismic data into several groups andlocate the tremor of each group separately (see Appendix A).The detailed tremor location information for all regions canbe found in Tables 1 and Ⓔ S1 (available as an electronicsupplement to this paper).
Triggered Tremor Observations
In this section, we describe the characteristics of trig-gered tremor we found in nine of our study regions (Table 1):Nankai, Taiwan, the Aleutian Arc, Alaska, Vancouver Island,southern Oregon, central California, southern California, andNew Zealand. In addition, we also include several regionswhere ambient or triggered tremor have been found in pre-vious studies, but no triggered tremor occurred during theTohoku mainshock (i.e., the CF in northern California andGuerrero in Mexico) and in regions where the Tohoku main-shock triggered tremor, but were not analyzed in this study(i.e., Cuba; Gonzalez-Huizar et al., 2012; Peng et al., 2013).We sort these regions according to their distances relativeto the epicenter of the Tohoku mainshock. We measure thepeak ground velocities (PGVs) for the Love and Rayleighwaves shown in the instrument-corrected transverse andvertical-component seismograms, respectively. In addition,we compute the expected PGV at each station based on thesurface-wave magnitude MS equation (Lay and Wallace,1995; van der Elst and Brodsky, 2010)
log10 A20 ! MS " 1:66 log10 Δ " 2; (1)
where Δ is the epicentral distance in degrees, and A20 is thepeak surface-wave displacement at 20 s. We obtain the sur-face wave magnitude, MS ! 8:4, for the Tohoku mainshockbased on the empirical estimation (Geller, 1976; Stein andWysession, 2003). We also assume a predominant period (T)of 20 s for the surface waves and convert the peak dis-placement (A20) to peak velocity ( _u) with the equation _u!2πA20=T (Aki and Richards, 2002).
Finally, we estimate the corresponding dynamic stress(Δσ) based on equation (2), using a shear rigidity (G) of35 GPa and a phase velocity (v) of 4:1 and 3:5 km=s for Love(transverse component) and Rayleigh (vertical component)waves, respectively,
Δσ ! G _u=v: (2)
Because these are nominal numbers, reasonable changesin their actual values do not substantially change our results.As shown in Figure 2, the epicentral distance mainly controlsthe PGVs and the associated dynamic stresses for all the re-gions examined in this study, which is expected from theabove two equations. The horizontal dotted line marks the
dynamic stress of a triggering threshold of 10 kPa, whichcorresponds to the measured PGVs of !0:1 cm=s. Note thatat distances greater than 9000 km, the observed dynamicstress estimated using equation (2) is approximately 10 kPaand systematically larger than the theoretical values. This islikely caused by the convergence of the surface-wave trainswhen the great circle distance is larger than 90°.
Nankai, Japan
Widespread ambient tremor activity in the Nankaisubduction zone has been the focus of intense study since2002 (Obara, 2002, 2011; Ide, 2010). While ambient tremoroccurs in the Shikoku, Kii, and Tokai regions, parallel to theNankai trough (Obara et al., 2010), triggered tremor is foundin particular spots in these regions (Miyazawa andMori, 2005,2006; Miyazawa and Brodsky, 2008). Here we focus only onthe Shikoku region because the Kii and Tokai regions are closeto the Tohoku epicenter (i.e., less than 800 km) such that earlyaftershock signals from the Tohoku rupture zone may over-print and obscure any locally triggered tremor signals.
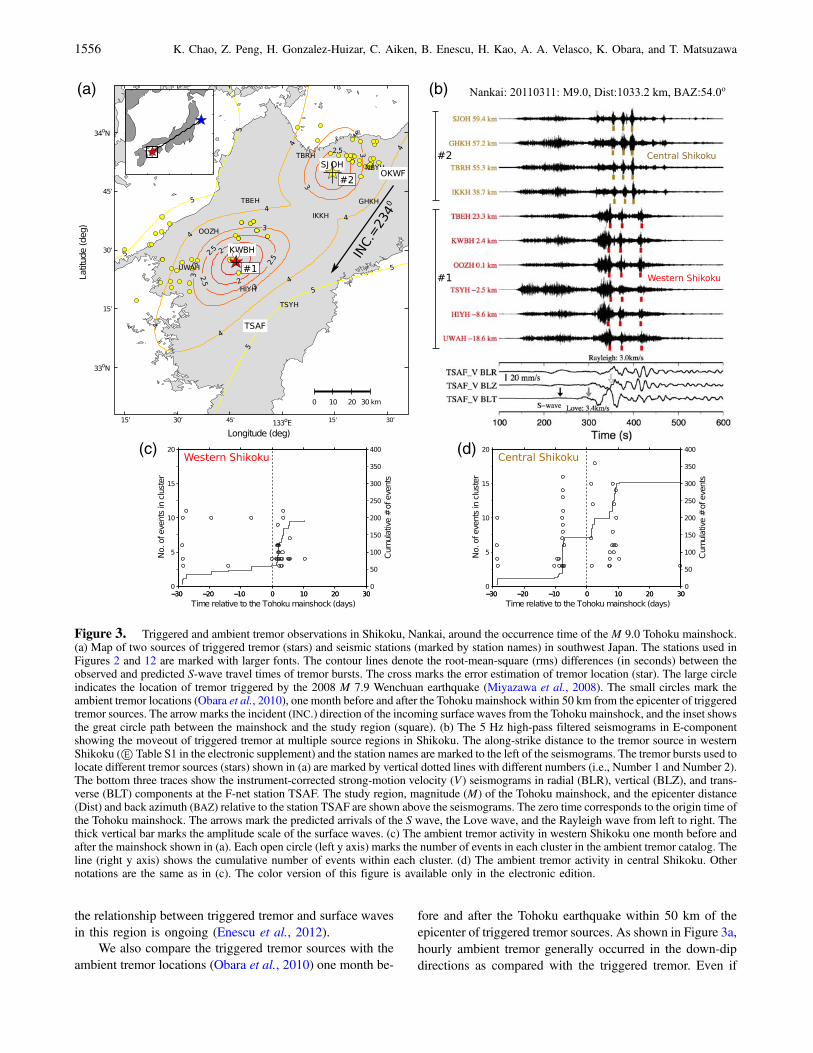
We find at least two tremor sources in Shikoku duringthe passing surface waves of the Tohoku mainshock. For thesource in western Shikoku, the first tremor burst occurredduring the arrivals of Love and Rayleigh waves between350 and 450 s (Fig. 3). Additional tremor bursts with smalleramplitudes continued until 800 s (Ⓔ Fig. S1 in the electronicsupplement). In central Shikoku, clear tremor bursts weremainly associated with Rayleigh waves between 350 and 500 s,and smaller amplitude tremor bursts lasted until 700 s(Ⓔ Fig. S1 in the electronic supplement). Study examining
Figure 2. Theoretical and observed dynamic stress in each ofour study regions versus epicentral distance to the Tohoku main-shock. Numbers indicate the different study regions and the seismicstation used for measuring the peak ground velocity (PGV). The ob-served dynamic stress is calculated from the PGVof surface waves intransverse and vertical components from the broadband and strong-motion (with * symbol) stations (Ⓔ Table S2 in the electronic sup-plement). The horizontal dashed line marks the apparent tremortriggering threshold, which corresponds to a dynamic stress thresh-old of !10 kPa. The color version of this figure is available only inthe electronic edition.
A Global Search for Triggered Tremor Following the 2011 Mw 9.0 Tohoku Earthquake 1553
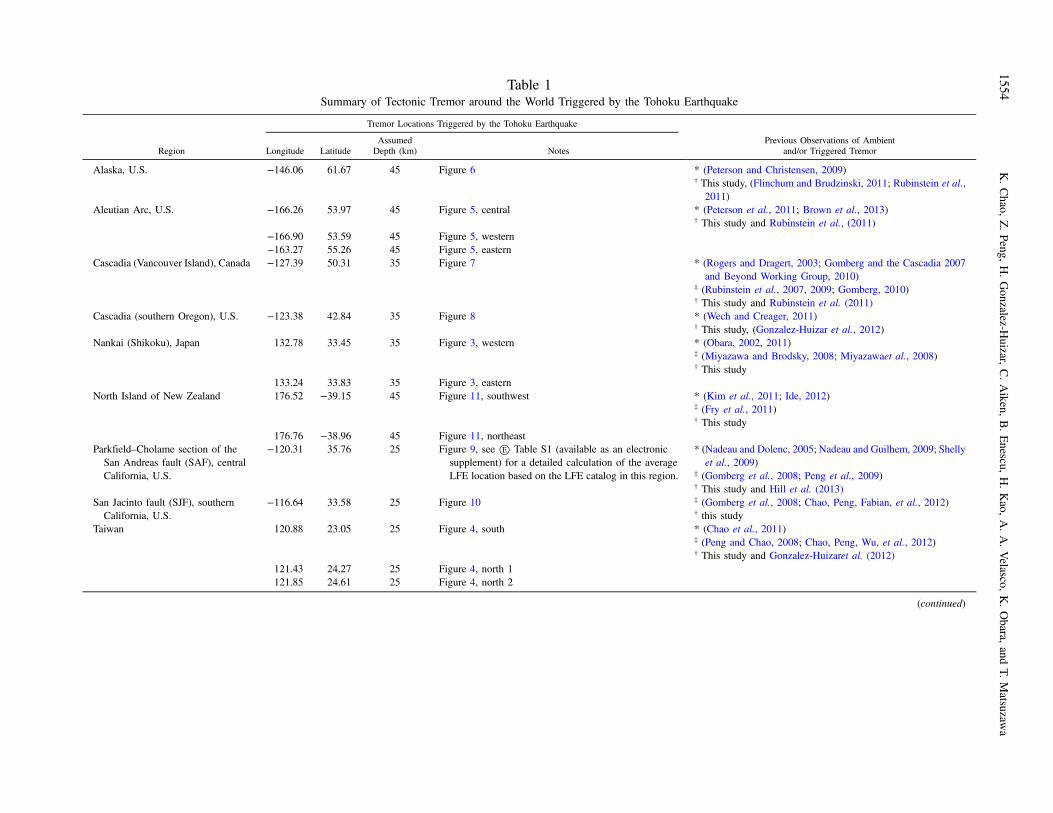
Table 1Summary of Tectonic Tremor around the World Triggered by the Tohoku Earthquake
Tremor Locations Triggered by the Tohoku Earthquake
Region Longitude LatitudeAssumedDepth (km) Notes
Previous Observations of Ambientand/or Triggered Tremor
Alaska, U.S. "146.06 61.67 45 Figure 6 * (Peterson and Christensen, 2009)† This study, (Flinchum and Brudzinski, 2011; Rubinstein et al.,
2011)Aleutian Arc, U.S. "166.26 53.97 45 Figure 5, central * (Peterson et al., 2011; Brown et al., 2013)
† This study and Rubinstein et al., (2011)"166.90 53.59 45 Figure 5, western"163.27 55.26 45 Figure 5, eastern
Cascadia (Vancouver Island), Canada "127.39 50.31 35 Figure 7 * (Rogers and Dragert, 2003; Gomberg and the Cascadia 2007and Beyond Working Group, 2010)
‡ (Rubinstein et al., 2007, 2009; Gomberg, 2010)† This study and Rubinstein et al. (2011)
Cascadia (southern Oregon), U.S. "123.38 42.84 35 Figure 8 * (Wech and Creager, 2011)† This study, (Gonzalez-Huizar et al., 2012)
Nankai (Shikoku), Japan 132.78 33.45 35 Figure 3, western * (Obara, 2002, 2011)‡ (Miyazawa and Brodsky, 2008; Miyazawaet al., 2008)† This study
133.24 33.83 35 Figure 3, easternNorth Island of New Zealand 176.52 "39.15 45 Figure 11, southwest * (Kim et al., 2011; Ide, 2012)
‡ (Fry et al., 2011)† This study
176.76 "38.96 45 Figure 11, northeastParkfield–Cholame section of theSan Andreas fault (SAF), centralCalifornia, U.S.
"120.31 35.76 25 Figure 9, see Ⓔ Table S1 (available as an electronicsupplement) for a detailed calculation of the averageLFE location based on the LFE catalog in this region.
* (Nadeau and Dolenc, 2005; Nadeau and Guilhem, 2009; Shellyet al., 2009)
‡ (Gomberg et al., 2008; Peng et al., 2009)† This study and Hill et al. (2013)
San Jacinto fault (SJF), southernCalifornia, U.S.
"116.64 33.58 25 Figure 10 ‡ (Gomberg et al., 2008; Chao, Peng, Fabian, et al., 2012)† this study
Taiwan 120.88 23.05 25 Figure 4, south * (Chao et al., 2011)‡ (Peng and Chao, 2008; Chao, Peng, Wu, et al., 2012)† This study and Gonzalez-Huizaret al. (2012)
121.43 24.27 25 Figure 4, north 1121.85 24.61 25 Figure 4, north 2
(continued)
1554K.Chao,
Z.Peng,
H.Gonzalez-H
uizar,C.Aiken,
B.Enescu,
H.Kao,
A.A.Velasco,
K.Obara,
andT.
Matsuzaw
a

Table 1 (Continued)Tremor Locations Triggered by the Tohoku Earthquake
Region Longitude LatitudeAssumedDepth (km) Notes
Previous Observations of Ambientand/or Triggered Tremor
Other RegionsArmenia (Garni) Closest station: IU.GNI
(longitude ! 44:74,latitude ! 40:15)
Possible triggered tremor event. † (Gonzalez-Huizar et al., 2012)
Calaveras fault (CF), northernCalifornia, U.S.
Closest station: BK.MHC(longitude ! "121:64,
latitude ! 37:34)
No triggered tremor. Ⓔ Figure S4 (available as anelectronic supplement)
‡ (Gomberg et al., 2008; Chao, Peng, Fabian, et al. , 2012)
Costa Rica Closest station: II.JTS(longitude ! "84:95,latitude ! 10:29)
Possible triggered tremor event.Ⓔ Figure S3a (availableas an electronic supplement)
* (Brown et al., 2009; Outerbridge et al., 2010)† This study
Cuba (Guantanamo) "74.74 19.94 20 Clear triggered tremor event. East of CU.GTBY station ‡ (Gonzalez-Huizar et al., 2012; Peng et al., 2013)† (Peng et al., 2013)
"75.24 19.85 20 Clear triggered tremor event. West of CU.GTBY stationMexico (Guerrero) Closest station: G.UNM
(longitude ! "99:18,latitude ! 19:33)
No triggered tremor. Ⓔ Figure S3b (available as anelectronic supplement)
* (Payero et al., 2008; Kostoglodov et al., 2010)‡ (Zigone et al., 2012)
Queen Charlotte Margin, Canada Closest station: CN.DIB(longitude ! "132:48,
latitude ! 53:20)
Clear triggered tremor event. * (H. Kao, personal comm., 2012)‡ (Aiken et al., 2013)† (Aiken et al., 2013)
South Chile Closest station: YJ.ISM01(longitude ! "73:83,latitude ! "45:93)
No seismic station in this region is available during theTohoku earthquake
* (Ide, 2012)‡ (Peng et al., 2012)
Observations of Ambient and/or Triggered Tremor in each region:*Ambient tremor.†Tremor triggered by the Tohoku earthquake.‡Tremor triggered by other teleseismic earthquakes.
AGlobal
Searchfor
TriggeredTrem
orFollow
ingthe
2011M
w9.0
TohokuEarthquake
1555
the relationship between triggered tremor and surface wavesin this region is ongoing (Enescu et al., 2012).
We also compare the triggered tremor sources with theambient tremor locations (Obara et al., 2010) one month be-
fore and after the Tohoku earthquake within 50 km of theepicenter of triggered tremor sources. As shown in Figure 3a,hourly ambient tremor generally occurred in the down-dipdirections as compared with the triggered tremor. Even if
(a) (b)
(c) (d)
Figure 3. Triggered and ambient tremor observations in Shikoku, Nankai, around the occurrence time of the M 9.0 Tohoku mainshock.(a) Map of two sources of triggered tremor (stars) and seismic stations (marked by station names) in southwest Japan. The stations used inFigures 2 and 12 are marked with larger fonts. The contour lines denote the root-mean-square (rms) differences (in seconds) between theobserved and predicted S-wave travel times of tremor bursts. The cross marks the error estimation of tremor location (star). The large circleindicates the location of tremor triggered by the 2008 M 7.9 Wenchuan earthquake (Miyazawa et al., 2008). The small circles mark theambient tremor locations (Obara et al., 2010), one month before and after the Tohoku mainshock within 50 km from the epicenter of triggeredtremor sources. The arrow marks the incident (INC.) direction of the incoming surface waves from the Tohoku mainshock, and the inset showsthe great circle path between the mainshock and the study region (square). (b) The 5 Hz high-pass filtered seismograms in E-componentshowing the moveout of triggered tremor at multiple source regions in Shikoku. The along-strike distance to the tremor source in westernShikoku (Ⓔ Table S1 in the electronic supplement) and the station names are marked to the left of the seismograms. The tremor bursts used tolocate different tremor sources (stars) shown in (a) are marked by vertical dotted lines with different numbers (i.e., Number 1 and Number 2).The bottom three traces show the instrument-corrected strong-motion velocity (V) seismograms in radial (BLR), vertical (BLZ), and trans-verse (BLT) components at the F-net station TSAF. The study region, magnitude (M) of the Tohoku mainshock, and the epicenter distance(Dist) and back azimuth (BAZ) relative to the station TSAF are shown above the seismograms. The zero time corresponds to the origin time ofthe Tohoku mainshock. The arrows mark the predicted arrivals of the S wave, the Love wave, and the Rayleigh wave from left to right. Thethick vertical bar marks the amplitude scale of the surface waves. (c) The ambient tremor activity in western Shikoku one month before andafter the mainshock shown in (a). Each open circle (left y axis) marks the number of events in each cluster in the ambient tremor catalog. Theline (right y axis) shows the cumulative number of events within each cluster. (d) The ambient tremor activity in central Shikoku. Othernotations are the same as in (c). The color version of this figure is available only in the electronic edition.
1556 K. Chao, Z. Peng, H. Gonzalez-Huizar, C. Aiken, B. Enescu, H. Kao, A. A. Velasco, K. Obara, and T. Matsuzawa
we do not fix the triggered tremor depth at 35 km, the changein the best-fitting horizontal location is within"0:02°, whichwould still place the triggered tremor at the up-dip edge ofthe ambient tremor zone. In addition, ambient tremor activityin both regions shows slightly different temporal patterns be-fore and after the Tohoku mainshock. In western Shikoku,while ambient tremor was not active before the Tohokumainshock, tremor activity significantly increased after themainshock (Fig. 3c). In central Shikoku, while ambienttremor episodes were active before the Tohoku mainshock,their occurrence rates did not significantly change after themainshock (Fig. 3d). We note that no large amplitude-triggered tremor identified in the first 800 s was listed inthe ambient tremor catalog (Obara et al., 2010).
Taiwan
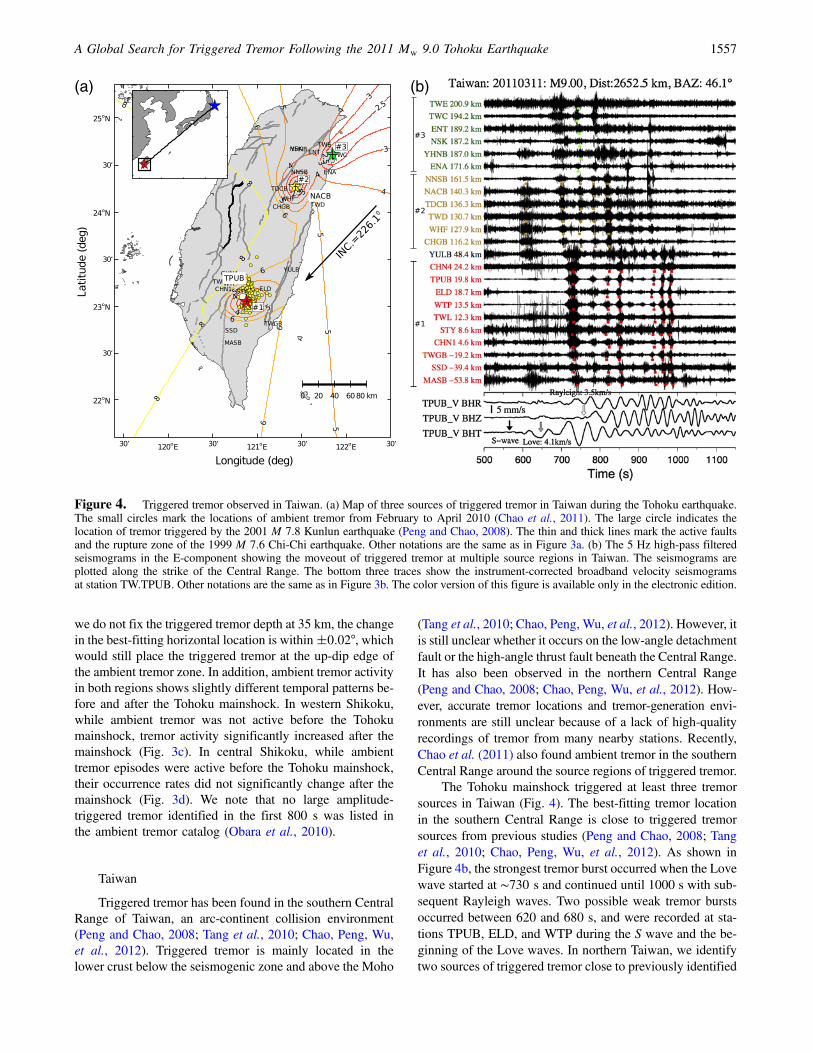
Triggered tremor has been found in the southern CentralRange of Taiwan, an arc-continent collision environment(Peng and Chao, 2008; Tang et al., 2010; Chao, Peng, Wu,et al., 2012). Triggered tremor is mainly located in thelower crust below the seismogenic zone and above the Moho
(Tang et al., 2010; Chao, Peng, Wu, et al., 2012). However, itis still unclear whether it occurs on the low-angle detachmentfault or the high-angle thrust fault beneath the Central Range.It has also been observed in the northern Central Range(Peng and Chao, 2008; Chao, Peng, Wu, et al., 2012). How-ever, accurate tremor locations and tremor-generation envi-ronments are still unclear because of a lack of high-qualityrecordings of tremor from many nearby stations. Recently,Chao et al. (2011) also found ambient tremor in the southernCentral Range around the source regions of triggered tremor.
The Tohoku mainshock triggered at least three tremorsources in Taiwan (Fig. 4). The best-fitting tremor locationin the southern Central Range is close to triggered tremorsources from previous studies (Peng and Chao, 2008; Tanget al., 2010; Chao, Peng, Wu, et al., 2012). As shown inFigure 4b, the strongest tremor burst occurred when the Lovewave started at !730 s and continued until 1000 s with sub-sequent Rayleigh waves. Two possible weak tremor burstsoccurred between 620 and 680 s, and were recorded at sta-tions TPUB, ELD, and WTP during the S wave and the be-ginning of the Love waves. In northern Taiwan, we identifytwo sources of triggered tremor close to previously identified
°°°
°
°
°
°
(a) (b)
Figure 4. Triggered tremor observed in Taiwan. (a) Map of three sources of triggered tremor in Taiwan during the Tohoku earthquake.The small circles mark the locations of ambient tremor from February to April 2010 (Chao et al., 2011). The large circle indicates thelocation of tremor triggered by the 2001 M 7.8 Kunlun earthquake (Peng and Chao, 2008). The thin and thick lines mark the active faultsand the rupture zone of the 1999 M 7.6 Chi-Chi earthquake. Other notations are the same as in Figure 3a. (b) The 5 Hz high-pass filteredseismograms in the E-component showing the moveout of triggered tremor at multiple source regions in Taiwan. The seismograms areplotted along the strike of the Central Range. The bottom three traces show the instrument-corrected broadband velocity seismogramsat station TW.TPUB. Other notations are the same as in Figure 3b. The color version of this figure is available only in the electronic edition.
A Global Search for Triggered Tremor Following the 2011 Mw 9.0 Tohoku Earthquake 1557
tremor locations (Chao, Peng, Wu, et al., 2012). The first isbeneath the northern Central Range near the broadband sta-tion NACB (Fig. 4a). A clear tremor burst occurred at !600 sduring the S wave and the beginning of the Love wave andcontinued up to !950 s during the subsequent Love andRayleigh waves. At another source farther north near thecoast and around station TWC, tremor bursts occurredmainly between 700 and 800 s.
Aleutian Arc and Alaska
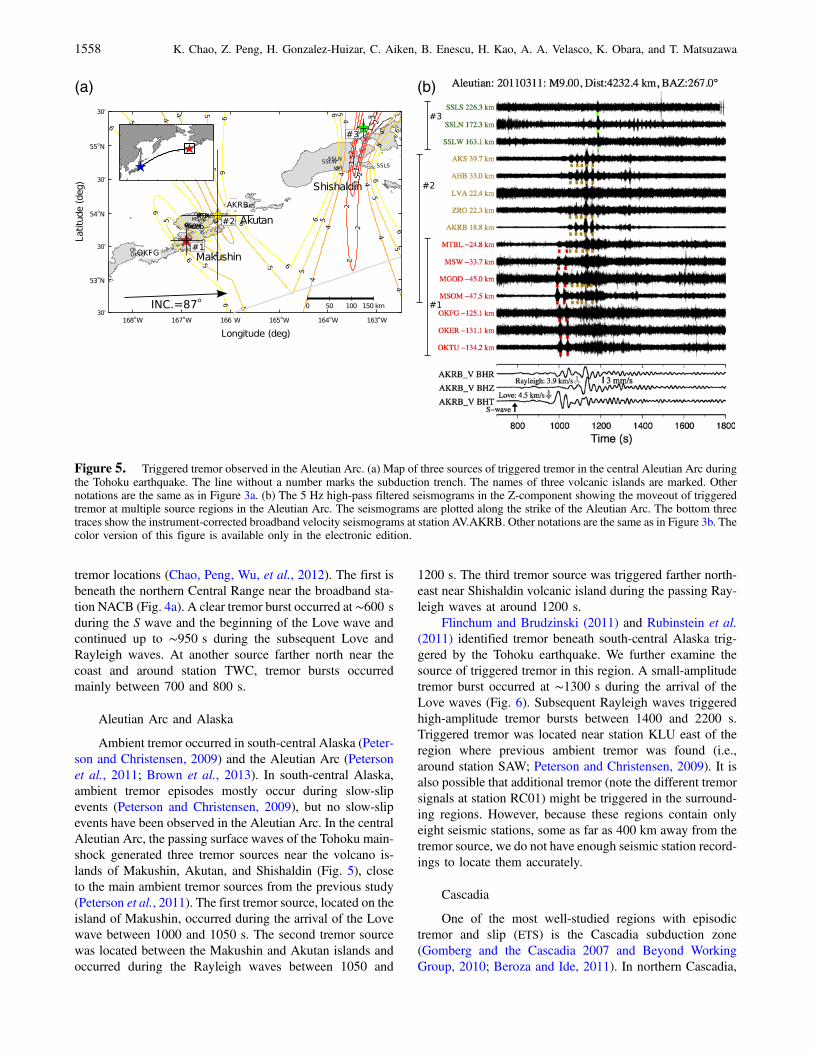
Ambient tremor occurred in south-central Alaska (Peter-son and Christensen, 2009) and the Aleutian Arc (Petersonet al., 2011; Brown et al., 2013). In south-central Alaska,ambient tremor episodes mostly occur during slow-slipevents (Peterson and Christensen, 2009), but no slow-slipevents have been observed in the Aleutian Arc. In the centralAleutian Arc, the passing surface waves of the Tohoku main-shock generated three tremor sources near the volcano is-lands of Makushin, Akutan, and Shishaldin (Fig. 5), closeto the main ambient tremor sources from the previous study(Peterson et al., 2011). The first tremor source, located on theisland of Makushin, occurred during the arrival of the Lovewave between 1000 and 1050 s. The second tremor sourcewas located between the Makushin and Akutan islands andoccurred during the Rayleigh waves between 1050 and
1200 s. The third tremor source was triggered farther north-east near Shishaldin volcanic island during the passing Ray-leigh waves at around 1200 s.
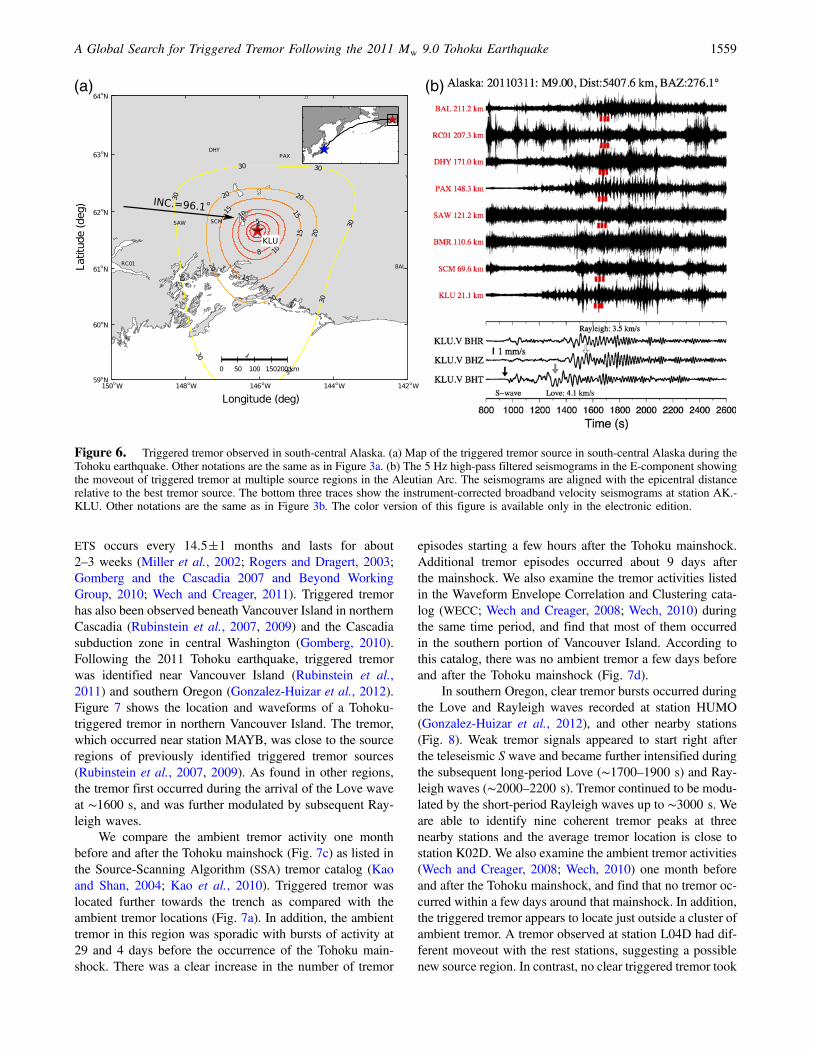
Flinchum and Brudzinski (2011) and Rubinstein et al.(2011) identified tremor beneath south-central Alaska trig-gered by the Tohoku earthquake. We further examine thesource of triggered tremor in this region. A small-amplitudetremor burst occurred at !1300 s during the arrival of theLove waves (Fig. 6). Subsequent Rayleigh waves triggeredhigh-amplitude tremor bursts between 1400 and 2200 s.Triggered tremor was located near station KLU east of theregion where previous ambient tremor was found (i.e.,around station SAW; Peterson and Christensen, 2009). It isalso possible that additional tremor (note the different tremorsignals at station RC01) might be triggered in the surround-ing regions. However, because these regions contain onlyeight seismic stations, some as far as 400 km away from thetremor source, we do not have enough seismic station record-ings to locate them accurately.
Cascadia
One of the most well-studied regions with episodictremor and slip (ETS) is the Cascadia subduction zone(Gomberg and the Cascadia 2007 and Beyond WorkingGroup, 2010; Beroza and Ide, 2011). In northern Cascadia,
(b)(a)
°
° ° ° ° °
°
°
°
Figure 5. Triggered tremor observed in the Aleutian Arc. (a) Map of three sources of triggered tremor in the central Aleutian Arc duringthe Tohoku earthquake. The line without a number marks the subduction trench. The names of three volcanic islands are marked. Othernotations are the same as in Figure 3a. (b) The 5 Hz high-pass filtered seismograms in the Z-component showing the moveout of triggeredtremor at multiple source regions in the Aleutian Arc. The seismograms are plotted along the strike of the Aleutian Arc. The bottom threetraces show the instrument-corrected broadband velocity seismograms at station AV.AKRB. Other notations are the same as in Figure 3b. Thecolor version of this figure is available only in the electronic edition.
1558 K. Chao, Z. Peng, H. Gonzalez-Huizar, C. Aiken, B. Enescu, H. Kao, A. A. Velasco, K. Obara, and T. Matsuzawa
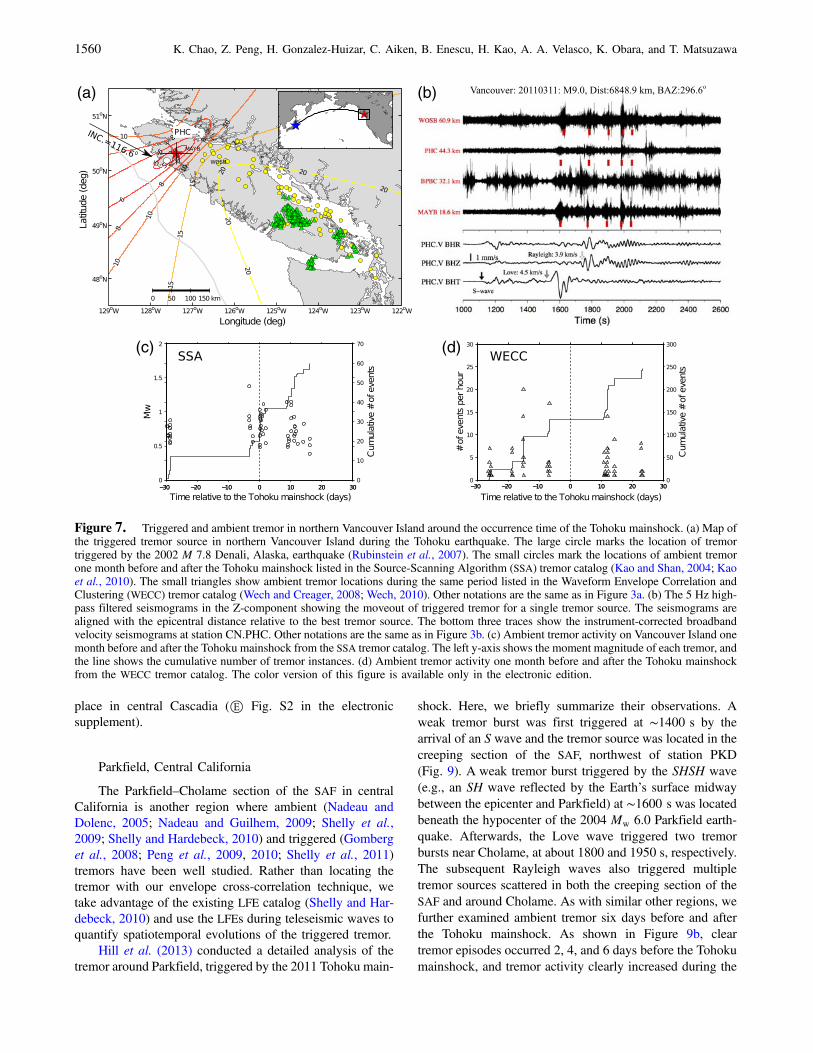
ETS occurs every 14:5"1 months and lasts for about2–3 weeks (Miller et al., 2002; Rogers and Dragert, 2003;Gomberg and the Cascadia 2007 and Beyond WorkingGroup, 2010; Wech and Creager, 2011). Triggered tremorhas also been observed beneath Vancouver Island in northernCascadia (Rubinstein et al., 2007, 2009) and the Cascadiasubduction zone in central Washington (Gomberg, 2010).Following the 2011 Tohoku earthquake, triggered tremorwas identified near Vancouver Island (Rubinstein et al.,2011) and southern Oregon (Gonzalez-Huizar et al., 2012).Figure 7 shows the location and waveforms of a Tohoku-triggered tremor in northern Vancouver Island. The tremor,which occurred near station MAYB, was close to the sourceregions of previously identified triggered tremor sources(Rubinstein et al., 2007, 2009). As found in other regions,the tremor first occurred during the arrival of the Love waveat !1600 s, and was further modulated by subsequent Ray-leigh waves.
We compare the ambient tremor activity one monthbefore and after the Tohoku mainshock (Fig. 7c) as listed inthe Source-Scanning Algorithm (SSA) tremor catalog (Kaoand Shan, 2004; Kao et al., 2010). Triggered tremor waslocated further towards the trench as compared with theambient tremor locations (Fig. 7a). In addition, the ambienttremor in this region was sporadic with bursts of activity at29 and 4 days before the occurrence of the Tohoku main-shock. There was a clear increase in the number of tremor
episodes starting a few hours after the Tohoku mainshock.Additional tremor episodes occurred about 9 days afterthe mainshock. We also examine the tremor activities listedin the Waveform Envelope Correlation and Clustering cata-log (WECC; Wech and Creager, 2008; Wech, 2010) duringthe same time period, and find that most of them occurredin the southern portion of Vancouver Island. According tothis catalog, there was no ambient tremor a few days beforeand after the Tohoku mainshock (Fig. 7d).
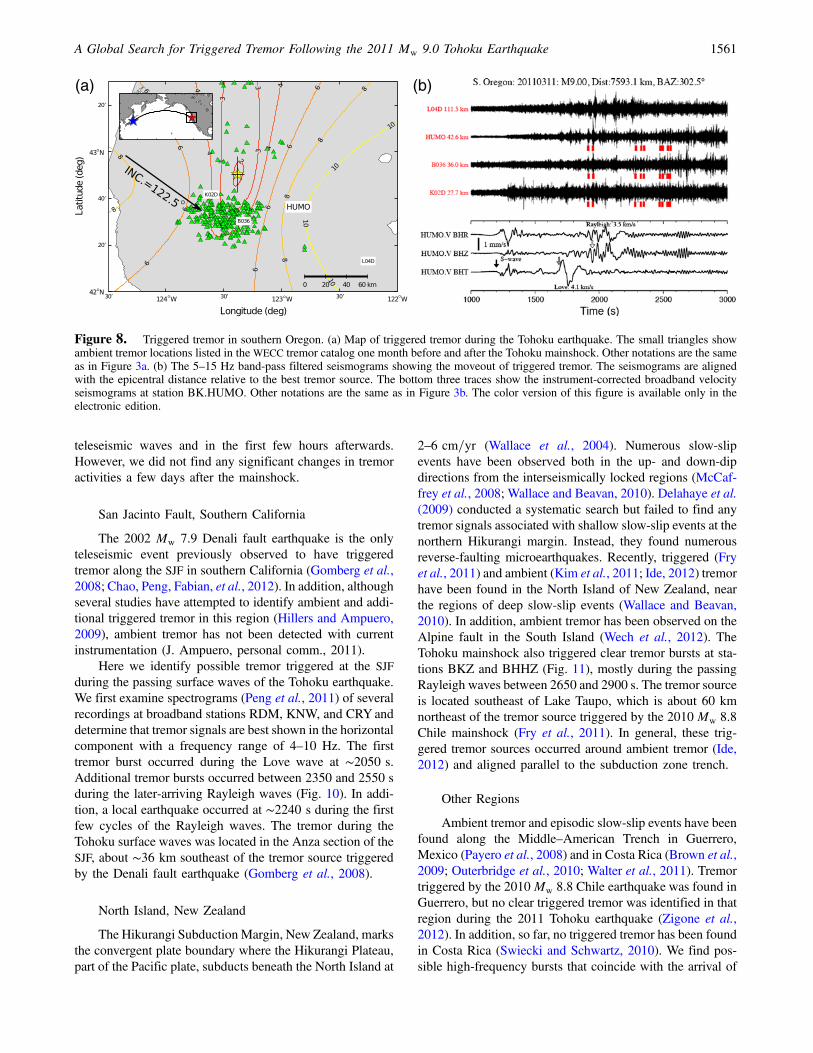
In southern Oregon, clear tremor bursts occurred duringthe Love and Rayleigh waves recorded at station HUMO(Gonzalez-Huizar et al., 2012), and other nearby stations(Fig. 8). Weak tremor signals appeared to start right afterthe teleseismic S wave and became further intensified duringthe subsequent long-period Love (!1700–1900 s) and Ray-leigh waves (!2000–2200 s). Tremor continued to be modu-lated by the short-period Rayleigh waves up to !3000 s. Weare able to identify nine coherent tremor peaks at threenearby stations and the average tremor location is close tostation K02D. We also examine the ambient tremor activities(Wech and Creager, 2008; Wech, 2010) one month beforeand after the Tohoku mainshock, and find that no tremor oc-curred within a few days around that mainshock. In addition,the triggered tremor appears to locate just outside a cluster ofambient tremor. A tremor observed at station L04D had dif-ferent moveout with the rest stations, suggesting a possiblenew source region. In contrast, no clear triggered tremor took
°°
°
°°°°
°
°
°
°
°(b)(a)
Figure 6. Triggered tremor observed in south-central Alaska. (a) Map of the triggered tremor source in south-central Alaska during theTohoku earthquake. Other notations are the same as in Figure 3a. (b) The 5 Hz high-pass filtered seismograms in the E-component showingthe moveout of triggered tremor at multiple source regions in the Aleutian Arc. The seismograms are aligned with the epicentral distancerelative to the best tremor source. The bottom three traces show the instrument-corrected broadband velocity seismograms at station AK.-KLU. Other notations are the same as in Figure 3b. The color version of this figure is available only in the electronic edition.
A Global Search for Triggered Tremor Following the 2011 Mw 9.0 Tohoku Earthquake 1559
place in central Cascadia (Ⓔ Fig. S2 in the electronicsupplement).
Parkfield, Central California
The Parkfield–Cholame section of the SAF in centralCalifornia is another region where ambient (Nadeau andDolenc, 2005; Nadeau and Guilhem, 2009; Shelly et al.,2009; Shelly and Hardebeck, 2010) and triggered (Gomberget al., 2008; Peng et al., 2009, 2010; Shelly et al., 2011)tremors have been well studied. Rather than locating thetremor with our envelope cross-correlation technique, wetake advantage of the existing LFE catalog (Shelly and Har-debeck, 2010) and use the LFEs during teleseismic waves toquantify spatiotemporal evolutions of the triggered tremor.
Hill et al. (2013) conducted a detailed analysis of thetremor around Parkfield, triggered by the 2011 Tohoku main-
shock. Here, we briefly summarize their observations. Aweak tremor burst was first triggered at !1400 s by thearrival of an S wave and the tremor source was located in thecreeping section of the SAF, northwest of station PKD(Fig. 9). A weak tremor burst triggered by the SHSH wave(e.g., an SH wave reflected by the Earth’s surface midwaybetween the epicenter and Parkfield) at !1600 s was locatedbeneath the hypocenter of the 2004 Mw 6.0 Parkfield earth-quake. Afterwards, the Love wave triggered two tremorbursts near Cholame, at about 1800 and 1950 s, respectively.The subsequent Rayleigh waves also triggered multipletremor sources scattered in both the creeping section of theSAF and around Cholame. As with similar other regions, wefurther examined ambient tremor six days before and afterthe Tohoku mainshock. As shown in Figure 9b, cleartremor episodes occurred 2, 4, and 6 days before the Tohokumainshock, and tremor activity clearly increased during the
(a) (b)
(d)(c)
L
L
Figure 7. Triggered and ambient tremor in northern Vancouver Island around the occurrence time of the Tohoku mainshock. (a) Map ofthe triggered tremor source in northern Vancouver Island during the Tohoku earthquake. The large circle marks the location of tremortriggered by the 2002 M 7.8 Denali, Alaska, earthquake (Rubinstein et al., 2007). The small circles mark the locations of ambient tremorone month before and after the Tohoku mainshock listed in the Source-Scanning Algorithm (SSA) tremor catalog (Kao and Shan, 2004; Kaoet al., 2010). The small triangles show ambient tremor locations during the same period listed in the Waveform Envelope Correlation andClustering (WECC) tremor catalog (Wech and Creager, 2008; Wech, 2010). Other notations are the same as in Figure 3a. (b) The 5 Hz high-pass filtered seismograms in the Z-component showing the moveout of triggered tremor for a single tremor source. The seismograms arealigned with the epicentral distance relative to the best tremor source. The bottom three traces show the instrument-corrected broadbandvelocity seismograms at station CN.PHC. Other notations are the same as in Figure 3b. (c) Ambient tremor activity on Vancouver Island onemonth before and after the Tohoku mainshock from the SSA tremor catalog. The left y-axis shows the moment magnitude of each tremor, andthe line shows the cumulative number of tremor instances. (d) Ambient tremor activity one month before and after the Tohoku mainshockfrom the WECC tremor catalog. The color version of this figure is available only in the electronic edition.
1560 K. Chao, Z. Peng, H. Gonzalez-Huizar, C. Aiken, B. Enescu, H. Kao, A. A. Velasco, K. Obara, and T. Matsuzawa
teleseismic waves and in the first few hours afterwards.However, we did not find any significant changes in tremoractivities a few days after the mainshock.
San Jacinto Fault, Southern California
The 2002 Mw 7.9 Denali fault earthquake is the onlyteleseismic event previously observed to have triggeredtremor along the SJF in southern California (Gomberg et al.,2008; Chao, Peng, Fabian, et al., 2012). In addition, althoughseveral studies have attempted to identify ambient and addi-tional triggered tremor in this region (Hillers and Ampuero,2009), ambient tremor has not been detected with currentinstrumentation (J. Ampuero, personal comm., 2011).
Here we identify possible tremor triggered at the SJFduring the passing surface waves of the Tohoku earthquake.We first examine spectrograms (Peng et al., 2011) of severalrecordings at broadband stations RDM, KNW, and CRYanddetermine that tremor signals are best shown in the horizontalcomponent with a frequency range of 4–10 Hz. The firsttremor burst occurred during the Love wave at !2050 s.Additional tremor bursts occurred between 2350 and 2550 sduring the later-arriving Rayleigh waves (Fig. 10). In addi-tion, a local earthquake occurred at !2240 s during the firstfew cycles of the Rayleigh waves. The tremor during theTohoku surface waves was located in the Anza section of theSJF, about !36 km southeast of the tremor source triggeredby the Denali fault earthquake (Gomberg et al., 2008).
North Island, New Zealand
The Hikurangi Subduction Margin, New Zealand, marksthe convergent plate boundary where the Hikurangi Plateau,part of the Pacific plate, subducts beneath the North Island at
2–6 cm=yr (Wallace et al., 2004). Numerous slow-slipevents have been observed both in the up- and down-dipdirections from the interseismically locked regions (McCaf-frey et al., 2008; Wallace and Beavan, 2010). Delahaye et al.(2009) conducted a systematic search but failed to find anytremor signals associated with shallow slow-slip events at thenorthern Hikurangi margin. Instead, they found numerousreverse-faulting microearthquakes. Recently, triggered (Fryet al., 2011) and ambient (Kim et al., 2011; Ide, 2012) tremorhave been found in the North Island of New Zealand, nearthe regions of deep slow-slip events (Wallace and Beavan,2010). In addition, ambient tremor has been observed on theAlpine fault in the South Island (Wech et al., 2012). TheTohoku mainshock also triggered clear tremor bursts at sta-tions BKZ and BHHZ (Fig. 11), mostly during the passingRayleigh waves between 2650 and 2900 s. The tremor sourceis located southeast of Lake Taupo, which is about 60 kmnortheast of the tremor source triggered by the 2010 Mw 8.8Chile mainshock (Fry et al., 2011). In general, these trig-gered tremor sources occurred around ambient tremor (Ide,2012) and aligned parallel to the subduction zone trench.
Other Regions
Ambient tremor and episodic slow-slip events have beenfound along the Middle–American Trench in Guerrero,Mexico (Payero et al., 2008) and in Costa Rica (Brown et al.,2009; Outerbridge et al., 2010; Walter et al., 2011). Tremortriggered by the 2010Mw 8.8 Chile earthquake was found inGuerrero, but no clear triggered tremor was identified in thatregion during the 2011 Tohoku earthquake (Zigone et al.,2012). In addition, so far, no triggered tremor has been foundin Costa Rica (Swiecki and Schwartz, 2010). We find pos-sible high-frequency bursts that coincide with the arrival of
°°°°
°
°
(a) (b)
Figure 8. Triggered tremor in southern Oregon. (a) Map of triggered tremor during the Tohoku earthquake. The small triangles showambient tremor locations listed in the WECC tremor catalog one month before and after the Tohoku mainshock. Other notations are the sameas in Figure 3a. (b) The 5–15 Hz band-pass filtered seismograms showing the moveout of triggered tremor. The seismograms are alignedwith the epicentral distance relative to the best tremor source. The bottom three traces show the instrument-corrected broadband velocityseismograms at station BK.HUMO. Other notations are the same as in Figure 3b. The color version of this figure is available only in theelectronic edition.
A Global Search for Triggered Tremor Following the 2011 Mw 9.0 Tohoku Earthquake 1561

Love waves at the broadband station JTS in Costa Rica (ⒺFig. S3 in the electronic supplement). However, we could notconfirm the existence of a triggered tremor based only on asingle-station record. We also examined seismic recordingsin the CF in northern California, where the 2002 Denali faultearthquake has triggered tremor (Gomberg et al., 2008;Chao, Peng, Fabian, et al., 2012), but have not found anyclear triggering during the Tohoku mainshock (Ⓔ Fig. S4in the electronic supplement).
Gonzalez-Huizar et al. (2012) reported triggered tremorat station SAO in the creeping section of the SAF, station GNIin Armenia, station HUMO in south Oregon, and station
GTBY in Cuba. Because station SAO is only !88 km awayfrom the northwesternmost tremor on the creeping section ofthe SAF, it is not clear whether the recorded tremor signalsoriginated from a new source region or if they could havebeen generated by the same source from the Parkfield–Cholame section, as shown in Figure 9. The 2011 Tohokuevent has triggered tremor-like signals at station GNI inArmenia. Because the number of stations that recorded thetremor does not meet our selecting criterion (i.e., not re-corded by at least three nearby stations in Armenia), we can-not say with the same level of certainty that these representtriggered tremor, nor can we accurately locate them. The
Figure 9. Triggered and ambient tremor along the Parkfield–Cholame section of the San Andreas fault (SAF) around the Tohoku main-shock occurrence time. (a) Map of triggered tremor during the Tohoku mainshock. The tremor locations are marked as circles denoting thetime since the mainshock. The small points mark the background seismicity, and the lines denote active faults. Other notations are the same asin Figure 3a. (b) An along-fault cross-section view showing the depth profile of the 88 tremor locations. The scale numbers denote the ratiobetween the number of tremor occurrences during the teleseismic surface waves to the total number of tremor occurrences within the six daysprior to the Tohoku mainshock. (c) (top) Along-strike distances versus the number of tremor occurrences within the six days before and afterthe Tohoku mainshock (bottom). A zoom-in plot around the teleseismic waves of the mainshock. The vertical line marks the arrival time oflarge-amplitude Love waves. (d) The 2–8 Hz band-pass filtered seismograms showing the moveout of triggered tremor at multiple sources.The seismograms are plotted along the SAF strike. The bottom three traces show the instrument-corrected broadband velocity seismograms atstation BK. PKD. Other notations are the same as in Figure 3b. The color version of this figure is available only in the electronic edition.
1562 K. Chao, Z. Peng, H. Gonzalez-Huizar, C. Aiken, B. Enescu, H. Kao, A. A. Velasco, K. Obara, and T. Matsuzawa
2010 Mw 8.8 Chile earthquake and its large aftershocks alsotriggered tremor in Cuba (Gonzalez-Huizar et al., 2012). Byexamining regional seismic network data during the Tohokuearthquake, Peng et al. (2013) identified at least two trig-gered tremor sources near the left-lateral Oriente fault. Fromthese findings, we include only the Cuba case in a sub-sequent analysis in Figures 12 and 13.
Tremor Amplitudes and Dynamic Stress Changes
In this section we quantify the relationship betweentremor amplitudes and dynamic stress changes in all 13regions that we have examined in this study. In regions withmultiple tremor sources (e.g., Japan, Taiwan, the AleutianArc), wemeasure the values for each tremor source separately.
°°°
°
°
(a) (b)
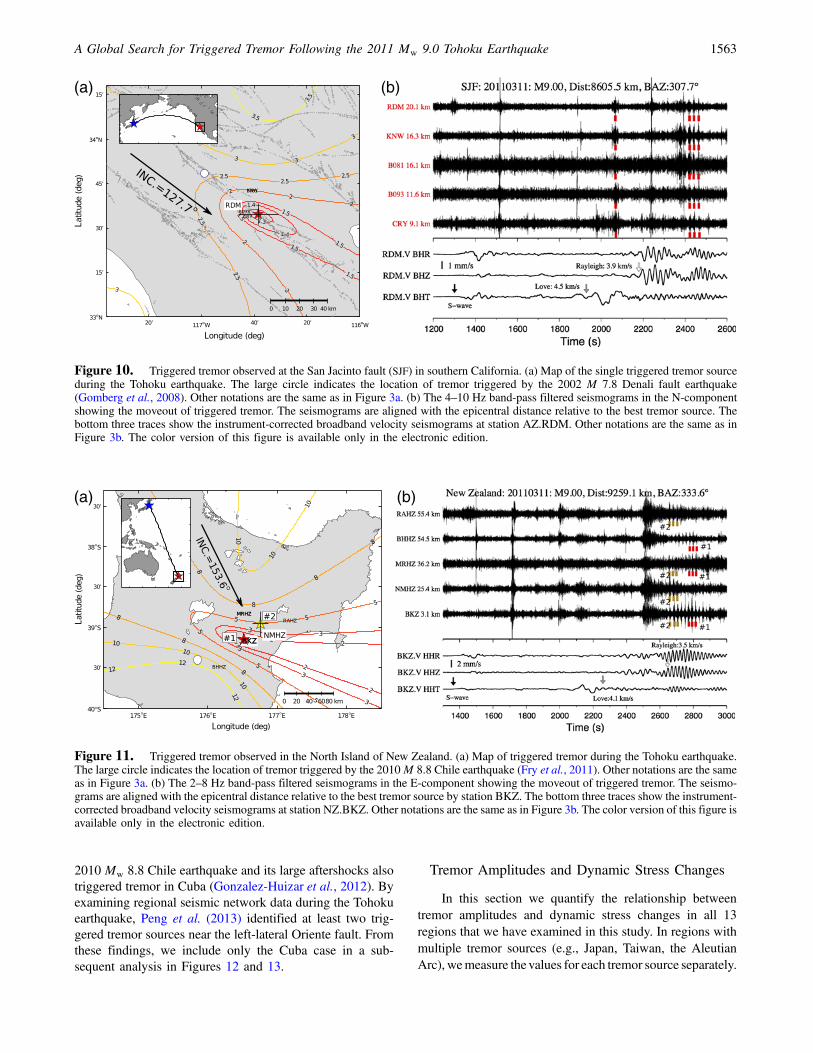
Figure 10. Triggered tremor observed at the San Jacinto fault (SJF) in southern California. (a) Map of the single triggered tremor sourceduring the Tohoku earthquake. The large circle indicates the location of tremor triggered by the 2002 M 7.8 Denali fault earthquake(Gomberg et al., 2008). Other notations are the same as in Figure 3a. (b) The 4–10 Hz band-pass filtered seismograms in the N-componentshowing the moveout of triggered tremor. The seismograms are aligned with the epicentral distance relative to the best tremor source. Thebottom three traces show the instrument-corrected broadband velocity seismograms at station AZ.RDM. Other notations are the same as inFigure 3b. The color version of this figure is available only in the electronic edition.
° °°°°
°
°
°
(a) (b)
Figure 11. Triggered tremor observed in the North Island of New Zealand. (a) Map of triggered tremor during the Tohoku earthquake.The large circle indicates the location of tremor triggered by the 2010M 8.8 Chile earthquake (Fry et al., 2011). Other notations are the sameas in Figure 3a. (b) The 2–8 Hz band-pass filtered seismograms in the E-component showing the moveout of triggered tremor. The seismo-grams are aligned with the epicentral distance relative to the best tremor source by station BKZ. The bottom three traces show the instrument-corrected broadband velocity seismograms at station NZ.BKZ. Other notations are the same as in Figure 3b. The color version of this figure isavailable only in the electronic edition.
A Global Search for Triggered Tremor Following the 2011 Mw 9.0 Tohoku Earthquake 1563
As mentioned before, the PGV is measured as the maximumpeak on the transverse and vertical components of velocityseismograms within the apparent velocities of 5 to 2 km=s.To measure tremor amplitude, we follow our previous studies
(Chao, Peng, Fabian, et al., 2012; Chao, Peng, Wu, et al.,2012) and compute the median amplitude of triggered tremorfrom the two horizontal-component band-pass-filtereddisplacement seismograms during large-amplitude surface
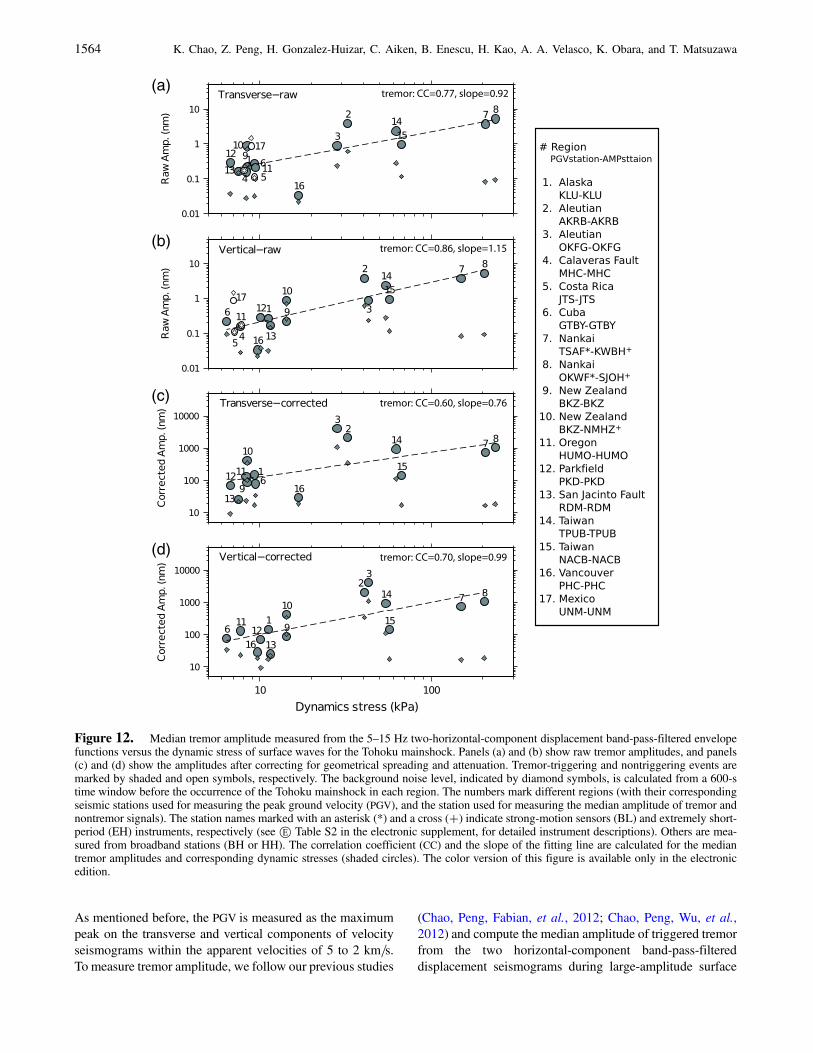
Figure 12. Median tremor amplitude measured from the 5–15 Hz two-horizontal-component displacement band-pass-filtered envelopefunctions versus the dynamic stress of surface waves for the Tohoku mainshock. Panels (a) and (b) show raw tremor amplitudes, and panels(c) and (d) show the amplitudes after correcting for geometrical spreading and attenuation. Tremor-triggering and nontriggering events aremarked by shaded and open symbols, respectively. The background noise level, indicated by diamond symbols, is calculated from a 600-stime window before the occurrence of the Tohoku mainshock in each region. The numbers mark different regions (with their correspondingseismic stations used for measuring the peak ground velocity (PGV), and the station used for measuring the median amplitude of tremor andnontremor signals). The station names marked with an asterisk (*) and a cross (#) indicate strong-motion sensors (BL) and extremely short-period (EH) instruments, respectively (see Ⓔ Table S2 in the electronic supplement, for detailed instrument descriptions). Others are mea-sured from broadband stations (BH or HH). The correlation coefficient (CC) and the slope of the fitting line are calculated for the mediantremor amplitudes and corresponding dynamic stresses (shaded circles). The color version of this figure is available only in the electronicedition.
1564 K. Chao, Z. Peng, H. Gonzalez-Huizar, C. Aiken, B. Enescu, H. Kao, A. A. Velasco, K. Obara, and T. Matsuzawa

waves. To ensure that the tremor amplitudes at different sitesare comparable, we use a fixed frequency range between5–15 Hz. Because the median triggered tremor amplitudeis not sensitive to the choice of the frequency range(2–8 Hz or 5–15Hz), we chose 5–15 Hz to avoid the contami-nation of aftershock signals from the Tohoku mainshock rup-ture zone, especially in the Nankai region. Displacementseismograms were integrated from the band-pass-filteredvelocity seismograms for the purpose of amplitude correctionas described below. In regions with no triggered tremor, wemeasure themedian amplitudes of 5–15Hz band-pass-filteredseismograms during the surface-wave time period withinthe apparent velocities of 5–2 km=s. Finally, we computethe median amplitudes of the background noise during the600 s before the arrival of the P wave of the mainshock.
We correct for the effects of geometrical spreading(Boore, 2003) and attenuation (Shearer, 1999; Chao, Peng,Fabian, et al., 2012) with the following equation:
Astation ! $Asource=R% ! exp&$"2πfR%=$2VSQ%'; (3)
where Astation is the observed tremor amplitude at a station,Asource is the amplitude at the tremor source (referred to as“corrected tremor amplitude”), R is the hypocentral distancebetween a station and the tremor source, 1=R is the geomet-rical spreading function (for R < 70 km), f is the dominantfrequency, VS is the shear-wave velocity, and Q is a qualityfactor. Here we assume constant Q ! 100 and average VS !3:9 km=s for the lower crust (Shearer, 1999) and assume
f ! 6 Hz with the highest amplitude of triggered tremor(Rubinstein et al., 2007).
As shown in Figure 12, the median tremor amplitudespositively correlate with the dynamic stresses estimated fromboth Love and Rayleigh waves on the transverse and verticalcomponents, respectively (Fig. 12). The correlation coeffi-cient (CC) in the log–log scale is more than 0.60 for measure-ments both before and after the amplitude corrections. Thecorresponding two-tailed p value is 0.023, indicating that thecorrelation is significant at a 95% confidence level. In com-parison, background noise does not show any correlationwith dynamic stress.
Modeling of Tremor Triggering Potential
To quantify the triggering capability of surface wavesfrom the Tohoku earthquake in different regions, we followthe modeling approach used by Hill (2008, 2010, 2012a,b)and Gonzalez-Huizar and Velasco (2011) for triggered earth-quakes. Assuming shear faulting at nearby major plate-boundary faults is responsible for generating tremor signals,we use two modeling approaches that follow a simpleCoulomb failure criterion. In the first approach, we estimatethe capability of surface waves with fixed amplitude andfrequency to trigger tremor on a fault plane with a specificorientation and faulting mechanism. In the second approach,we use time-dependent frequency and amplitude informationof the triggering wave to model time-dependent dynamicstresses or stress grams.
(a) (b) (c)
(d) (e) (f)
Figure 13. Surface-wave triggering potentials for three simplified tectonic models. Panels (a), (b), and (c) show idealized maps for thetectonic models, and the arrows represent the surface-wave incident angles relative to the strike of the major faults in each region. Panels (d),(e), and (f) show the normalized triggering potential of the Love (solid lines) and Rayleigh (dash lines) waves as a function of the incidentangles for the tectonic models in (a), (b), and (c), respectively. The normalization factor (n.f.) is shown for each plot. Vertical lines in thetriggering potential plots define the incident angle for each of the regions where tremor was triggered. The color version of this figure isavailable only in the electronic edition.
A Global Search for Triggered Tremor Following the 2011 Mw 9.0 Tohoku Earthquake 1565

First, we compute the triggering potential P(γ) as theamplitude of the stress orbit projected onto the normal ofthe Coulomb failure envelope (equivalent to the dynamicCoulomb Failure Function, ΔCFF) and normalized by themaximum radius (semimajor axis) for the suite of orbitsspanning all incidence angles γ of the incoming waves (Hill,2012b). The null and maximum triggering potential is 0 and1, respectively. Here we assume a predominant period of 20 sfor both Love and Rayleigh waves. We use the same elasticand velocity parameter values defined in table 1 of Hill(2012a), a coefficient of static friction of 0.2, and a Skemptoncoefficient equal to 0.8. As stated above, we group our studyregions into three tectonic models. For strike-slip faults (e.g.,SAF and SJF), we use a vertical fault and set the tremor depthat 25 km. For the relatively young subduction zones (e.g.,southwest Japan and Cascadia), we use a 15° shallow dippingfault and set the tremor depth at 35 km. For the relativelyold subduction zones (e.g., Aleutian Arc, Alaska, and NewZealand), we use a 25° dipping angle to approximate thesubduction-zone plate interface, and set the tremor depthat 45 km (e.g., Brown et al., 2013). Because the faulting stylefor tremor in Taiwan is still not clear (Tang et al., 2010;Chao, Peng, Wu, et al., 2012), we do not include the resultsfrom Taiwan in this analysis.
Figure 13 shows the triggering potentials for Love andRayleigh waves for each of the simplified tectonic models.For strike-slip faults (Fig. 13a,d), Love waves show a highertriggering potential than Rayleigh waves for the incidentdirection parallel to the strike of each tectonic region. Thisfinding indicates that we should expect more predominanttremor activity while Love waves are passing, which is gen-erally consistent with observations at Parkfield (Fig. 9) andalong the SJF (Fig. 10). However, Rayleigh waves triggeredlarger amplitude tremor than Love waves in Parkfield (Fig. 9)and in Cuba (Peng et al., 2013). For the relatively young sub-duction zones (Fig. 13b,e), Love waves have a much highertriggering potential than Rayleigh waves for the incidentangles of interest. Thus, we expect triggered tremor burstswith high amplitudes during the arrival of Love waves, whichwere observed in these regions (e.g., Figs. 3 and 7). Finally,for the relatively old subduction zones model (Fig. 13c,f),Love waves still show higher triggering potential. In thiscase, we expect higher amplitudes in triggered tremor ratesduring Love waves than during Rayleigh waves (e.g., Fig. 5).Overall, the triggering potential is similar in both young andold subduction zones. This is generally consistent with theobservations that triggered tremor in the Nankai, AleutianArc, Alaska, and Vancouver Island was initiated by Lovewaves rather then the later passage of Rayleigh waves trig-gered by tremor bursts (e.g., Figs. 3, 5, 6, and 7).
For this simple modeling, the triggering potential for theLove and Rayleigh waves is calculated with a constantdominant period of 20 s and equal amplitude. In addition,as shown in Figure 9, tremor triggered by the Love andRayleigh waves may occur in different regions, which wouldalso result in different amplitudes. Finally, the comparisons
between triggering potential and tremor amplitudes arequalitative. To obtain a more quantitative estimate of howdynamic stress triggers tremor, we need to know the preciseamplitude and frequency of the triggering wave at the exacttime when tremor pulse occurs, which can be accomplishedby time shifting the triggered tremor and triggering wavesback to the tremor source (e.g., Peng et al., 2009; Rubinsteinet al., 2009). Therefore, precise triggered tremor locationsand related fault-plane orientations are needed to producean acceptable estimate of triggering dynamic stress.
In the second approach, we calculate the stress grams fortwo representative tectonic regions with precise triggeredtremor locations: the Parkfield–Cholame strike-slip sectionof the SAF, and the subduction zone in Western Shikoku,Japan (Fig. 14). In both cases, we calculate individualdynamic stress tensors for surface waves with varying am-plitudes and frequencies as measured from consecutive peaksin the displacement seismograms. Then, the time-dependentstress values are interpolated to obtain a continuous stress-gram signal. For the SAF, the stress grams are calculated fora vertical strike-slip right-lateral fault with a strike angle of319° (Chao, Peng, Wu, et al., 2012), and a tremor source of25 km depth. For the western Shikoku, we use a tremorsource of 35 km depth for a thrust fault of strike and dipangles of 225° and 15°, respectively (Miyazawa and Brodsky,2008; Hill, 2010, 2012b; Ⓔ Table S4 in the electronic sup-plement). For both fault planes, we use a coefficient of staticfriction μ ! 0:2 (Hill, 2010, 2012b), as justified by theinference of near-lithostatic pore pressure at tremor depthfrom tidal correlations at Parkfield (Thomas et al., 2009) andseismic tomography in other regions (Shelly et al., 2006). Weshift the tremor signals back to the source region based on a1D velocity model in each region and use a constant phasevelocity (4:1 km=s for the Love and 3:5 km=s for the
Figure 14. Time-dependent dynamic stress (stress grams) as ameasurement of the surface-wave potential to trigger tremor inwestern Shikoku and Parkfield. (a) Radial, vertical, and transversedisplacement components recorded by broadband seismic stations.(b) Dynamic stress caused by Love, Rayleigh, and combined (total)ground displacement. (c) Triggered tremor bursts shown in high-passfiltered and envelope-function seismograms. The cross correlationbetween dynamic stress grams and the envelope-function seismo-gram of triggered tremor is shown in (b). All signals have been timeshifted back to the best-triggered tremor source. The color version ofthis figure is available only in the electronic edition.
1566 K. Chao, Z. Peng, H. Gonzalez-Huizar, C. Aiken, B. Enescu, H. Kao, A. A. Velasco, K. Obara, and T. Matsuzawa

Rayleigh waves) to shift the time-dependent triggeringpotentials or dynamic stress grams back to the tremor sourceregion (Miyazawa and Mori, 2006; Rubinstein et al., 2007).We also take a smoothed-envelope function of the tremorsignals and compute the cross correlations with the stressgrams for the Love and Rayleigh waves and the sum tracesseparately.
In western Shikoku (Fig. 14a), the Love waves correlatebetter with the first two cycles of tremor bursts, but the latersingle tremor burst is not correlated well with either the Loveor Rayleigh waves. At Parkfield (Fig. 14b), the first twocycles of tremor burst (between 1800 and 2000 s) are bettercorrelated with the Love waves than they are later, when thetremor better associates with the Rayleigh waves. In bothcases, the correlation coefficient values for the Love wavesare higher than those for the Rayleigh waves, which is con-sistent with the higher triggering potential of Love waves(Fig. 13) and their larger amplitudes.
Discussion and Conclusion
In this study, we conducted a global search of deeptectonic tremor triggered by the 2011 Mw 9.0 Tohoku earth-quake. Among the regions where either ambient or triggeredtremor has been previously observed, we have found tremortriggered by the Tohoku mainshock in nine of these regions(Figs. 3–11). Such widespread triggering of tremor by theTohoku mainshock is perhaps not surprising because the ob-served dynamic stress values at all of these regions equal orexceed 10 kPa (Fig. 2), which is close to or higher than theapparent triggering threshold found in previous studies(i.e., from 2 to 8 kPa) (Peng et al., 2009; Rubinstein et al.,2009; Chao, Peng, Wu, et al., 2012). However, no clear evi-dence of tremor triggered by the Tohoku earthquake wasfound at either the CF in northern California or Guerrero,Mexico (Zigone et al., 2012; Ⓔ Figs. S3 and S4 in the elec-tronic supplement). While we found several high-frequencysignals recorded by a nearby broadband station in NicoyaPeninsula, Costa Rica, during the teleseismic surface waves(Ⓔ Fig. S3 in the electronic supplement), we cannot verifythe existence or lack of triggered tremor since additionalwaveform data are not yet open to the public. At the CF,while we did not identify coherent tremor-like signals inthe band-pass-filtered seismograms (Ⓔ Fig. S4 in the elec-tronic supplement), we observed small-amplitude tremorsignals in the surface broadband and borehole short-periodrecordings at the SJF in southern California (Fig. 10). Wecannot rule out the possibility that weak tremor was triggeredin the CF, but it was not detected because its amplitude issmaller than or close to that of background noise. Hence,we imply that tremor could be triggered in wider tectonicregions than we previously expected yet could remain unde-tected because its amplitude is below the noise level.
In places where ambient tremor was previously reported(e.g., southwest Japan, Taiwan, Aleutian Arc, Alaska,Cascadia, Parkfield, and New Zealand), triggered tremor was
generally observed near the ambient tremor sources. Insouthwest Japan, triggered tremor appeared to occur in theup-dip direction as compared with the location of mostambient tremor. Even if we perform a grid search at depthsof 0–60 km, the horizontal locations in these regions vary onlywithin"0:02°, suggesting that fixing tremor depth would notaffect the horizontal location significantly. Although we couldexplain such observations as depth-dependent behavior of trig-gered and ambient tremor (e.g., Wech and Creager, 2011),triggered and ambient tremor in southwest Japan were locatedusing different techniques. Hence, the apparent differences inthe horizontal locations of triggered and ambient tremor couldsimply have originated from the use of varying location tech-niques rather than from genuine differences in behavior.
Parkfield is the only region where triggered and ambienttremor was identified and located with the same technique byShelly and Hardebeck (2010). Shelly et al. (2011) summa-rized previous observations of triggered tremor in that regionand found that the shallowest (<20 km) tremor families inthe creeping section of the SAF were infrequently triggered.However, it is not clear whether such a difference is causedby depth-dependent tremor behavior or variations in thetremor amplitudes, in which concurrent strong tremorsources mask weak tremor sources. We also examined theratios between the number of tremor that occurred during theteleseismic surface waves to the total number of tremor thatoccurred within six days before the Tohoku mainshock(Fig. 9b). We found that only deep tremor (e.g., >20 km)in the creeping section of the SAF was triggered, which issimilar to the general patterns observed by Shelly et al.(2011). However, such a pattern is unclear for tremor sourcesnear Cholame. Further systematic studies could verify anysystematic differences between the locations of triggeredand ambient tremor and identify the cause of possible depth-dependent tremor behaviors in the creeping section of theSAF. Nevertheless, it is evident that triggered and ambienttremor at Parkfield shares the same LFE template families.
This suggests that both types of tremor originated fromthe same source but that triggered tremor are driven by theextra stress changes from the surface waves (Shelly et al.,2011). Because we are using waveforms of existing LFE fam-ilies to detect within triggered tremor, only those LFE eventswith similar waveforms would be detected. However, the factthat we have detected 39 LFE events within 650 s of the tele-seismic waves (with an average of 3.6 events per minute)suggests that these LFE families could explain most of thetriggered tremor signals.
We found a positive correlation between the amplitudesof triggered tremor and the amplitudes of the associateddynamic stresses of the teleseismic surface waves in allregions (Fig. 12). This observation is consistent with the pre-dictions of the clock-advance model (Gomberg, 2010) thatlarger triggering waves result in larger triggered tremor sig-nals. For example, in the SJF, the PGV measured at stationRDM during the Tohoku mainshock was !0:12 cm=s, aboutone-fifth of the PGV of 0:54 cm=s during the 2002 Denali
A Global Search for Triggered Tremor Following the 2011 Mw 9.0 Tohoku Earthquake 1567
fault earthquake (Chao, Peng, Fabian, et al., 2012). Themedian triggered tremor amplitude was !0:2 and !10 nm=sfor the Tohoku and Denali fault earthquake, respectively,which is again qualitatively consistent with the prediction ofthe clock-advance model. This finding also suggests that inregions where the background tremor rate is low (e.g., theSJF or the CF in California) or the background seismic noiseis high, larger triggering waves are needed to trigger tremorwith amplitudes above the background noise level. Althoughthe correlation between the PGVand tremor amplitude is sta-tistically significant, the data points are somewhat scattered,and the scatter becomes larger after the tremor amplitudecorrections. The later is likely caused by the assumption ofa constant Q, location errors, and/or other unknown path orsite effects that modify the high-frequency tremor amplitudes.In addition, we also did not take into account differencesamong the background tremor rates in each region.
Finally, we systematically modeled the triggering poten-tials of Love and Rayleigh waves using a simple Coulombfailure criterion (Hill, 2010, 2012b). Our modeling resultsconfirmed that both Love and Rayleigh waves play importantroles in the triggering of tremor and that their triggeringpotentials are partially controlled by the incident angles ofincoming surface waves (Fig. 13).We also computed the time-dependent stress changes for the Love and Rayleigh waves,or stress grams, and compared them with the tremor signals.We found that tremor pulses do not necessarily correlate withthe peaks in any of the three displacement components butcorrelate better with the peaks in the calculated triggeringpotential, i.e., stress grams (Fig. 14). In other words, tremor-triggering potential could be caused by the combination of thedynamic stresses from both surface waves. This is particularlytrue following the arrival of a Rayleigh wave when Love- andRayleigh-wave stresses may interfere constructively. This ob-servation indicates that amplitudes and incidence angles ofboth Love and Rayleigh waves must be taken into accountwhen evaluating their triggering potentials.
The fact that tremor amplitude is controlled mainly bythe triggering waves and the background tremor rate, indi-cates that one could theoretically predict the occurrence oftriggered tremor in certain regions immediately after theoccurrence of major earthquakes and before the arrival ofsurface waves. The amplitudes of triggered tremor are!10–100 nm=s, which is equivalent to a magnitude 0 to 1earthquake. Hence, although triggered tremor does not causeany damage, it provides a useful tool to study how largeearthquakes could change tremor behaviors and affect thedeep fault zone behaviors at long-range distances.
Data and Resources
Seismograms used in this study were downloaded fromthe following resources: (1) Alaska and the Aleutian Arc: theAlaska Volcano Observatory (Network code: AV) distributedthrough the Incorporated Research Institutions for Seismol-ogy (IRIS) website (http://www.iris.edu/mda, last accessed
March 2012); (2) Vancouver Island, central Cascadia, andsouth Oregon, Cascadia subduction zone: the Canadian Na-tional Seismograph Network (http://www.earthquakescanada.nrcan.gc.ca/stndon/AutoDRM/autodrm_req-eng.php, last ac-cessed March 2012) operated by the Geological Survey ofCanada, and the PacificNorthwest Regional SeismicNetwork(Network code: UW), the Berkeley Digital SeismographNetwork (Network code: BK), the Northern California Earth-quake Data Center (Network codes PB), and the EarthScope(TA.L04D), distributed through the IRIS website (http://www.iris.edu/mda, last accessed November 2012); (3) theNankai subduction zone, Japan: the Hi-net (High SensitivitySeismograph Network, http://www.hinet.bosai.go.jp/, per-mission required, last accessed March 2012) and F-net(Broadband Seismograph Network, http://www.fnet.bosai.go.jp/, permission required, last accessed March 2012) oper-ated by the National Research Institute for Earth Scienceand Disaster Prevention, Japan; (4) New Zealand: the NewZealand National Seismic Network (http://www.geonet.org.nz/, last accessedMarch 2012), operated byGNSScience;(5) others: the Calaveras fault (BK.MHC), Costa Rica(II.JTS), and Cuba (CU.GTBY), all from the Berkeley DigitalSeismograph Network (Network code: BK), and the GlobalSeismograph Network (Network code: II), the USGS Carib-bean Network (Network code: CU), distributed through theIRIS website (http://www.iris.edu/mda, last accessed March2012); (6) Parkfield: the Northern California Earthquake DataCenter (network codes: BP, NC, and PB, http://www.ncedc.org/, last accessedMarch 2012); (7) the SJF: the Southern Cal-ifornia Earthquake Data Center (network codes: AZ, CI andPB, http://www.data.scec.org/, last accessed March 2012);and (8) Taiwan: the Broadband Array in Taiwan for Seismol-ogy (http://bats.earth.sinica.edu.tw/, last accessed March2012), operated by the Institute of Earth Sciences, AcademiaSinica, and the short-period Central Weather Bureau SeismicNetwork (http://gdms.cwb.gov.tw/, permission required, lastaccessed March 2012), operated by the Taiwan CentralWeatherBureau.TheWaveformEnvelopeCorrelationandClus-tering (WECC) Cascadia tremor catalog was downloaded fromhttp://www.pnsn.org/tremor/, last accessed December, 2012.Maps were generated byM_Map: a mapping package for Mat-lab (available at http://www.eos.ubc.ca/~rich/map.html, lastaccessed November, 2012).
Acknowledgments
The manuscript benefited from comments by Andy Newman, re-viewers David Hill and Debi Kilb, and Guest Editor Justin Rubinstein.We thank David Shelly and Aaron Wech for allowing the use of their tremorcatalogs at Parkfield and Cascadia, respectively. K. C., Z. P., and C. A. aresupported by the National Science Foundation (NSF) through awards EAR-0908310 and EAR-0956051, and the Southern California Earthquake Center(SCEC). K. C. is also supported by the Japan Society for the Promotion ofScience (JSPS) through awards P12329 and KAKENHI 23244091. C. A. isalso supported by the NSF Graduate Fellowship Grant NSF Grant DGE-1148903. H.G-H. and V.A.A. are supported by NSF Grant EAR-1053355. Allmaps in this paper were generated by the mapping toolbox developed by RichPawlowicz (see Data and Resources).
1568 K. Chao, Z. Peng, H. Gonzalez-Huizar, C. Aiken, B. Enescu, H. Kao, A. A. Velasco, K. Obara, and T. Matsuzawa
References
Aiken, C., Z. Peng, and K. Chao (2013). Tremors along the Queen CharlotteFault triggered by large teleseismic earthquakes, Geophys. Res. Lett.40, 1–6, doi: 10.1002/grl.50220.
Aki, K., and P. G. Richards (2002). Quantitative Seismology, 2nd Ed., Univ.Sci. Books, Sausalito, California, 700 pp.
Beroza, G. C., and S. Ide (2011). Slow earthquakes and nonvolcanic tremor,Annu. Rev. Earth Planet. Sci. 39, 271–296, doi: 10.1146/annurev-earth-040809-152531.
Boore, D. M. (2003). Simulation of ground motion using the stochasticmethod, Pure Appl Geophys. 635–676, doi: 10.1007/978-3-0348-8010-7_10.
Brown, J. R., G. C. Beroza, S. Ide, K. Ohta, D. R. Shelly, S. Y. Schwartz, W.Rabbel, M. Thorwart, and H. Kao (2009). Deep low-frequencyearthquakes in tremor localize to the plate interface in multiplesubduction zones, Geophys. Res. Lett. 36, L19306, doi: 10.1029/2009GL040027.
Brown, J. R., S. G. Prejean, G. C. Beroza, J. S. Gomberg, and P. J. Haeussler(2013). Deep low-frequency earthquakes in Tectonic tremor along theAlaska–Aleutian subduction zone, J. Geophys. Res. 118, doi: 10.1029/2012JB009459.
Chao, K., Z. Peng, A. Fabian, and L. Ojha (2012). Comparisons of triggeredtremor in California, Bull. Seismol. Soc. Am. 12, no. 2, 900–908, doi:10.1785/0120110151.
Chao, K., Z. Peng, A. Wech, C.-C. Tang, C.-H. Lin, and C.-H. Chen (2011).Deep tremor activities beneath the Central Range in Taiwan and theirrelationship to local, regional, and teleseismic earthquakes, Seismol.Res. Lett. 82, 326.
Chao, K., Z. Peng, C. Wu, C.-C. Tang, and C.-H. Lin (2012). Remote trig-gering of non-volcanic tremor around Taiwan, Geophys. J. Int. 188,no. 1, 301–324, doi: 10.1111/j.1365-246X.2011.05261.x.
Delahaye, E., J. Townend, M. Reyners, and G. Rogers (2009). Microseis-micity but no tremor accompanying slow slip in the Hikurangi subduc-tion zone, New Zealand, Earth Planet. Sci. Lett. 277, 1–2, 21–28, doi:10.1016/j.epsl.2008.09.038.
Enescu, B., K. Chao, Z. Peng, H. Gonzalez-Huizar, K. Obara, D. P.. Hill, T.Matsuzawa, S. Tanaka, K. Shiomi, T. Takeda, and A. A. Velasco(2012). Love wave triggering of non-volcanic tremor in the Nankairegion, southwest Japan: Observations and physical interpretation (ab-stract S33B-2550), AGU (Fall Meet.) San Francisco, California, 3–7December, S33B-2550.
Flinchum, B. A., and M. R. Brudzinski (2011). Non-volcanic tremor trig-gered by teleseismic surface waves in south-central Alaska, Eos Trans.AGU, Fall Meet. Suppl., Abstract S23B-2254.
Fry, B., K. Chao, S. Bannister, and Z. Peng (2011). Deep tremor in NewZealand triggered by the 2010 Mw 8.8 Chile earthquake, Geophys.Res. Lett. 38, L15306, doi: 10.1029/2011GL048319.
Geller, R. J. (1976). Scaling relations for earthquake source parameters andmagnitudes, Bull. Seismol. Soc. Am. 66, no. 5, 1501–1523.
Gomberg, J. (2010). Lessons from (triggered) tremor, J. Geophys. Res. 115,B10302, doi: 10.1029/2009JB007011.
Gomberg, J., and the Cascadia 2007 and Beyond Working Group (2010).Slow-slip phenomena in Cascadia from 2007 and beyond: A review,GSA Bull. 122, no. 7/8, 963–978, doi: 10.1130/B30287.1.
Gomberg, J., J. L. Rubinstein, and Z. Peng (2008). Widespread triggering ofnonvolcanic tremor in California, Science 319, 173, doi: 10.1126/sci-ence.1149164.
Gonzalez-Huizar, H., and A. A. Velasco (2011). Dynamic triggering: Stressmodeling and a case study, J. Geophys. Res. 116, B02304, doi:10.1029/2009JB007000.
Gonzalez-Huizar, H., A. A. Velasco, Z. Peng, and R. Castro (2012). Remotetriggered seismicity caused by the 2011, M 9.0 Tohoku, Japan earth-quake, Geophys. Res. Lett. L10302, doi: 10.1029/2012GL051015.
Guilhem, A., Z. Peng, and R. M. Nadeau (2010). High-frequency identifi-cation of non-volcanic tremor triggered by regional earthquakes,Geophys. Res. Lett. 37, L16309, doi: 10.1029/2010GL044660.
Hill, D. (2008). Dynamic stresses, Coulomb failure, and remote triggering,Bull. Seismol. Soc. Am. 98, no. 1, 66–92, doi: 10.1785/0120070049.
Hill, D. P. (2010). Surface-wave potential for triggering tectonic (nonvol-canic) tremor, Bull. Seismol. Soc. Am. 100, no. 5A, 1859–1878,doi: 10.1785/0120090362.
Hill, D. P. (2012a). Dynamic stress, Coulomb failure, and remote triggering—Corrected, Bull. Seismol. Soc. Am. 102, no. 6, 2313–2336.
Hill, D. P. (2012b). Surface-wave potential for triggering tectonic (nonvolca-nic) tremor—Corrected,Bull. Seismol. Soc. Am. 102, no. 6, 2337–2355.
Hill, D. P., Z. Peng, D. R. Shelly, and C. Aiken (2013). S-wave triggering oftremor beneath the Parkfield, California, section of the San Andreasfault by the 2011 Tohoku, Japan, earthquake: Observations and theory,Bull. Seismol. Soc. Am. 103, no. 2B, doi: 10.1785/0120120114.
Hillers, G., and J. P. Ampuero (2009). Systematic search for spontaneousnon-volcanic tremor in Southern California, Eos Trans. AGU 90,no. 54, Fall Meet. Suppl., Abstract T13D-1918.
Ide, S. (2010). Striations, duration, migration and tidal response in deeptremor, Nature 466, 356–359, doi: 10.1038/nature09251.
Ide, S. (2012). Variety and spatial heterogeneity of tectonic tremor world-wide, J. Geophys. Res. 117, no. B3, doi: 10.1029/2011JB008840.
Kao, H., and S.-J. Shan (2004). The Source-Scanning Algorithm: Mappingthe distribution of seismic sources in time and space, Geophys. J. Int.157, no. 2, 589–594, doi: 10.1111/j.1365-246X.2004.02276.x.
Kao, H., K. Wang, H. Dragert, J. Y. Kao, and G. Rogers (2010). Estimatingseismic moment magnitude (Mw) of tremor bursts in northern Casca-dia: Implications for the “seismic efficiency” of episodic tremor andslip, Geophys. Res. Lett. 37, no. 19, doi: 10.1029/2010GL044927.
Kim, M. J., S. Y. Schwartz, and S. Bannister (2011). Non-volcanic tremorassociated with the March 2010 Gisborne slow slip event at theHikurangi subduction margin, New Zealand, Geophys. Res. Lett.38, no. 14, doi: 10.1029/2011GL048400.
Kostoglodov, V., A. Husker, N. M. Shapiro, J. S. Payero, M. Campillo,N. Cotte, and R. Clayton (2010). The 2006 slow slip event and non-volcanic tremor in the Mexican subduction zone, Geophys. Res. Lett.37, 24301, doi: 10.1029/2010GL045424.
Lay, T., and T. C. Wallace (1995). Modern Global Seismology, Academic,San Diego, California, 381–383.
McCaffrey, R., L. M. Wallace, and J. Beavan (2008). Slow slip and frictionaltransition at low temperature at the Hikurangi subduction zone, NatureGeosci. 1, no. 5, 316–320, doi: 10.1038/ngeo178.
Miller, M. M., T. Melbourne, D. J. Johnson, and W. Q. Sumner (2002).Periodic slow earthquakes from the Cascadia subduction zone, Science295, 2423, doi: 10.1126/science.1071193.
Miyazawa, M. (2011). Propagation of an earthquake triggering front fromthe 2011 Tohoku-Oki earthquake, Geophys. Res. Lett. 38, no. 23, doi:10.1029/2011GL049795.
Miyazawa, M., and E. Brodsky (2008). Deep low-frequency tremor thatcorrelates with passing surface waves, J. Geophys. Res. 113, B01307,doi: 10.1029/2006JB004890.
Miyazawa, M., and J. Mori (2005). Detection of triggered deep low-frequency events from the 2003 Tokachi-oki earthquake, Geophys.Res. Lett. 32, L10307, doi: 10.1029/2005GL022539.
Miyazawa, M., and J. Mori (2006). Evidence suggesting fluid flow beneathJapan due to periodic seismic triggering from the 2004 Sumatra-Andaman earthquake, Geophys. Res. Lett. 33, L05303, doi: 10.1029/2005GL025087.
Miyazawa, M., E. Brodsky, and J. Mori (2008). Learning from dynamic trig-gering of low-frequency tremor in subduction zones, Earth PlanetsSpace 60, e17–e20.
Nadeau, R. M., and D. Dolenc (2005). Nonvolcanic tremors deep beneath theSanAndreas fault, Science307,no. 389, doi: 10.1126/science.1107142.
Nadeau, R. M., and A. Guilhem (2009). Nonvolcanic tremor evolution andthe San Simeon and Parkfield, California, earthquakes, Science 325,191–193, doi: 10.1126/science.1174155.
Obara, K. (2002). Nonvolcanic deep tremor associated with subductionin southwest Japan, Science 296, 1679–1681, doi: 10.1126/science.1070378.
A Global Search for Triggered Tremor Following the 2011 Mw 9.0 Tohoku Earthquake 1569

Obara, K. (2011). Characteristics and interactions between non-volcanictremor and related slow earthquakes in the Nankai subduction zone,southwest Japan, J. Geodyn. 52, no. 3–4, 229–248, doi: 10.1016/j.jog.2011.04.002.
Obara, K., S. Tanaka, T. Maeda, and T. Matsuzawa (2010). Depth-dependentactivity of non-volcanic tremor in southwest Japan,Geophys. Res. Lett.37, no. 13, doi: 10.1029/2010GL043679.
Outerbridge, K. C., T. H. Dixon, S. Y. Schwartz, J. I. Walter, M. Protti, V.Gonzalez, J. Biggs, M. M. Thorwart, and W. Rabbel (2010). A tremorand slip event on the Cocos-Caribbean subduction zone as measuredby a global positioning system (GPS) and seismic network on theNicoya Peninsula, Costa Rica, J. Geophys. Res. 115, B10408, doi:10.1029/2009JB006845.
Payero, J. S., V. Kostoglodov, N. Shapiro, T. Mikumo, A. Iglesias, X. Perez-Campos, and R. W. Clayton (2008). Nonvolcanic tremor observed inthe Mexican subduction zone, Geophys. Res. Lett. 35, L07305, doi:10.1029/2007GL032877.
Peng, Z., and K. Chao (2008). Non-volcanic tremor beneath the CentralRange in Taiwan triggered by the 2001 Mw 7.8 Kunlun earthquake,Geophys. J. Int. 175, no. 2, 825–829, doi: 10.1111/j.1365-246X.2008.03886.x.
Peng, Z., and J. Gomberg (2010). An integrated perspective of thecontinuum between earthquakes and slow-slip phenomena, NatureGeosci. 3, 599–607, doi: 10.1038/ngeo940.
Peng, Z., K. Chao, C. Wu, B. Fry, B. Enescu, and C. Aiken (2012). Globalobservations of triggered tectonic tremor, Seismol. Res. Lett. 83, no. 2, 417.
Peng, Z., H. Gonzalez-Huizar, K. Chao, C. Aiken, B. Moreno, andG. Armstrong (2013). Tectonic tremor beneath Cuba triggered bytheMw 8.8 Maule andMw 9.0 Tohoku-Oki earthquakes, Bull. Seismol.Soc. Am. 103, no. 1, 595–600, doi: 10.1785/0120120253.
Peng, Z., D. P. Hill, D. R. Shelly, and C. Aiken (2010). Remotely triggeredmicroearthquakes and tremor in central California following the 2010Mw 8.8 Chile Earthquake, Geophys. Res. Lett. 37, L24312, doi:10.1029/2010GL045462.
Peng, Z., L. T. Long, and P. Zhao (2011). The relevance of high-frequencyanalysis artifacts to remote triggering, Seismol. Res. Lett. 82, no. 5,654–660, doi: 10.1785/gssrl.82.5.654.
Peng, Z., J. E. Vidale, K. C. Creager, J. L. Rubinstein, J. Gomberg, andP. Bodin (2008). Strong tremor near Parkfield, CA, excited by the2002 Denali Fault earthquake, Geophys. Res. Lett. 35, L23305, doi:10.1029/2008GL036080.
Peng, Z., J. E. Vidale, A. G. Wech, R. M. Nadeau, and K. C. Creager (2009).Remote triggering of tremor along the San Andreas fault in central Cal-ifornia, J. Geophys. Res. 114, B00A06, doi: 10.1029/2008JB006049.
Peterson, C., and D. Christensen (2009). Possible relationship betweennonvolcanic tremor and the 1998–2001 slow slip event, south centralAlaska, J. Geophys. Res. 114, B06302, doi: 10.1029/2008JB006096.
Peterson, C., S. McNutt, and D. Christensen (2011). Nonvolcanic tremor inthe Aleutian Arc, Bull. Seismol. Soc. Am.101, no. 6, 3081–3087, doi:10.1785/0120100241.
Rogers, G., and H. Dragert (2003). Episodic tremor and slip on the Cascadiasubduction zone: The chatter of silent slip, Science 300, 1942–1943,doi: 10.1126/science.1084783.
Rubinstein, J. L., G. C. Beroza, J. Brown, M. Brudzinski, K. Chao,J. Gomberg, S. Malone, D. Oppenheimer, Z. Peng, S. Prejean,H. Savage, D. R. Shelly, A. Wech, and M. West (2011). Widespreadtriggering of earthquakes and tremor by the 2011 off-Tohoku earth-quake, Seismol. Res. Lett. 82, 461.
Rubinstein, J. L., J. Gomberg, J. E. Vidale, A. G. Wech, H. Kao, K. C.Creager, and G. Rogers (2009). Seismic wave triggering of nonvol-canic tremor, episodic tremor and slip, and earthquakes on VancouverIsland, J. Geophys. Res. 114, B00A01, doi: 10.1029/2008JB005875.
Rubinstein, J. L., J. E. Vidale, J. Gomberg, P. Bodin, K. C. Creager, andS. D. Malone (2007). Non-volcanic tremor driven by large transientshear stresses, Nature 448, 579–582, doi: 10.1038/nature06017.
Shearer, P. M. (1999). Introduction to Seismology, Cambridge UniversityPress, Cambridge, United Kingdom, 163–165.
Shelly, D. R., and J. L. Hardebeck (2010). Precise tremor source locationsand amplitude variations along the lower-crustal central San Andreasfault, Geophys. Res. Lett. 37, L14301, doi: 10.1029/2010GL043672.
Shelly, D. R., G. C. Beroza, and S. Ide (2007). Non-volcanic tremor andlow-frequency earthquake swarms, Nature 446, no. 7133, 305–307,doi: 10.1038/nature05666.
Shelly, D. R., G. C. Beroza, S. Ide, and S. Nakamula (2006). Low-frequencyearthquakes in Shikoku, Japan, and their relationship to episodictremor and slip, Nature 442, no. 7099, 188–191, doi: 10.1038/nature04931.
Shelly, D. R., W. L. Ellsworth, T. Ryberg, C. Haberland, G. S. Fuis,J. Murphy, R. M. Nadeau, and R. Bürgmann (2009). Precise locationof San Andreas fault tremors near Cholame, California using seismom-eter clusters: Slip on the deep extension of the fault? Geophys. Res.Lett. 36, L01303, doi: 10.1029/2008GL036367.
Shelly, D. R., Z. Peng, D. P. Hill, and C. Aiken (2011). Triggered creep as apossible mechanism for delayed dynamic triggering of tremor andearthquakes, Nature Geosci. 4, 384–388, doi: 10.1038/ngeo1141.
Stein, S., and M. Wysession (2003). An Introduction to Seismology,Earthquakes and Earth Structure, Blackwell Publishing, 263–266.
Swiecki, Z., and S. Y. Schwartz (2010). Ambient tremor, but no triggeredtremor at the northern Costa Rica subduction zone, Eos Trans. AGU,Fall Meet. Suppl., Abstract S23A-2108.
Tang, C.-C., Z. Peng, K. Chao, C.-H. Chen, and C.-H. Lin (2010). Detectinglow-frequency earthquakes within non-volcanic tremor in southernTaiwan triggered by the 2005 Mw 8.6 Nias earthquake, Geophys.Res. Lett. 37, L16307, doi: 10.1029/2010GL043918.
Thomas, A. M., R. M. Nadeau, and R. Bürgmann (2009). Tremor-tidecorrelations and near-lithostatic pore pressure on the deep San Andreasfault, Nature 462, no. 7276, 1048–1051, doi: 10.1038/nature08654.
van der Elst, N. J., and E. E. Brodsky (2010). Connecting near-field andfar-field earthquake triggering to dynamic strain, J. Geophys. Res.115, no. B7, doi: 10.1029/2009JB006681.
Wallace, L. M., and J. Beavan (2010). Diverse slow slip behavior at theHikurangi subduction margin, New Zealand, J. Geophys. Res. 115,no. B12, doi: 10.1029/2010JB007717.
Wallace, L. M., J. Beavan, R. McCaffrey, and D. Darby (2004). Subductionzone coupling and tectonic block rotations in the North Island, NewZealand, J. Geophys. Res. 109, no. B12, doi: 10.1029/2004JB003241.
Walter, J. I., S. Y. Schwartz, J. M. Protti, and V. Gonzalez (2011). Persistenttremor within the northern Costa Rica seismogenic zone, Geophys.Res. Lett. 38, L01307, doi: 10.1029/2010GL045586.
Wang, W., X. Gong, Z. Peng, Q. Chen, and C. Wu (2011). Dynamic trigger-ing around Fangshan Pluton near Beijing, China, Eos Trans. AGU, FallMeet. Suppl., Abstract S22B-06.
Wech, A. G. (2010). Interactive tremor monitoring, Seismol. Res. Lett. 81,no. 4, 664–669, doi: 10.1785/gssrl.81.4.664.
Wech, A. G., and K. C. Creager (2008). Automated detection and locationof Cascadia tremor, Geophys. Res. Lett. 35, 20, doi: 10.1029/2008GL035458.
Wech, A. G., and K. C. Creager (2011). A continuum of stress, strength andslip in the Cascadia subduction zone, Nature Geosci. 4, no. 9, 624–628, doi: 10.1038/ngeo1215.
Wech, A. G., C. M. Boese, T. A. Stern, and J. Townend (2012). Tectonictremor and deep slow slip on the Alpine fault, Geophys. Res. Lett.39, 10, doi: 10.1029/2012GL051751.
Zigone, D., D. Rivet, M. Radiguet, M. Campillo, C. Voisin, N. Cotte, A.Walpersdorf, N. M. Shapiro, G. Cougoulat, P. Roux, V. Kostoglodov,A. Husker, and J. S. Payero (2012). Triggering of tremors and slow slipevent in Guerrero, Mexico, by the 2010 Mw 8.8 Maule, Chile, earth-quake, J. Geophys. Res. 117, B09304, doi: 10.1029/2012JB009160.
Appendix A
The tremor location is calculated by performing a gridsearch of the minimal root mean square (rms) between the
1570 K. Chao, Z. Peng, H. Gonzalez-Huizar, C. Aiken, B. Enescu, H. Kao, A. A. Velasco, K. Obara, and T. Matsuzawa
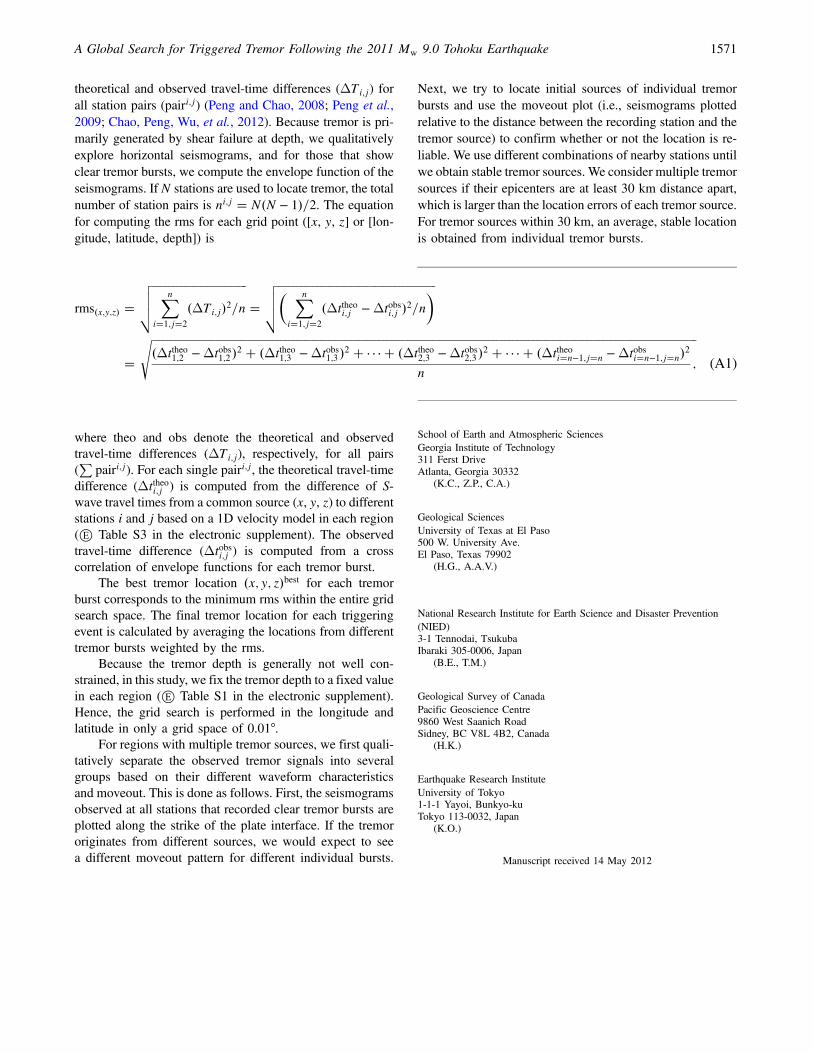
theoretical and observed travel-time differences (ΔTi;j) forall station pairs (pairi;j) (Peng and Chao, 2008; Peng et al.,2009; Chao, Peng, Wu, et al., 2012). Because tremor is pri-marily generated by shear failure at depth, we qualitativelyexplore horizontal seismograms, and for those that showclear tremor bursts, we compute the envelope function of theseismograms. If N stations are used to locate tremor, the totalnumber of station pairs is ni;j ! N$N " 1%=2. The equationfor computing the rms for each grid point ([x, y, z] or [lon-gitude, latitude, depth]) is
rms$x;y;z% !
!!!!!!!!!!!!!!!!!!!!!!!!!!!!!!!!!!!!Xn
i!1;j!2
$ΔTi;j%2=n
vuut !
!!!!!!!!!!!!!!!!!!!!!!!!!!!!!!!!!!!!!!!!!!!!!!!!!!!!!!!!!!!!" Xn
i!1;j!2
$Δttheoi;j "Δtobsi;j %2=n#vuut
!
!!!!!!!!!!!!!!!!!!!!!!!!!!!!!!!!!!!!!!!!!!!!!!!!!!!!!!!!!!!!!!!!!!!!!!!!!!!!!!!!!!!!!!!!!!!!!!!!!!!!!!!!!!!!!!!!!!!!!!!!!!!!!!!!!!!!!!!!!!!!!!!!!!!!!!!!!!!!!!!!!!!!!!!!!!!!!!!!!!!!!!!!!!!!!!!!!!!!!!!!!!!!!!!$Δttheo1;2 "Δtobs1;2 %2 # $Δttheo1;3 "Δtobs1;3 %2 # ( ( ( # $Δttheo2;3 "Δtobs2;3 %2 # ( ( ( # $Δttheoi!n"1;j!n "Δtobsi!n"1;j!n%2
n;
s
(A1)
where theo and obs denote the theoretical and observedtravel-time differences (ΔTi;j), respectively, for all pairs(P
pairi;j). For each single pairi;j, the theoretical travel-timedifference (Δttheoi;j ) is computed from the difference of S-wave travel times from a common source (x, y, z) to differentstations i and j based on a 1D velocity model in each region(Ⓔ Table S3 in the electronic supplement). The observedtravel-time difference (Δtobsi;j ) is computed from a crosscorrelation of envelope functions for each tremor burst.
The best tremor location $x; y; z%best for each tremorburst corresponds to the minimum rms within the entire gridsearch space. The final tremor location for each triggeringevent is calculated by averaging the locations from differenttremor bursts weighted by the rms.
Because the tremor depth is generally not well con-strained, in this study, we fix the tremor depth to a fixed valuein each region (Ⓔ Table S1 in the electronic supplement).Hence, the grid search is performed in the longitude andlatitude in only a grid space of 0.01°.
For regions with multiple tremor sources, we first quali-tatively separate the observed tremor signals into severalgroups based on their different waveform characteristicsand moveout. This is done as follows. First, the seismogramsobserved at all stations that recorded clear tremor bursts areplotted along the strike of the plate interface. If the tremororiginates from different sources, we would expect to seea different moveout pattern for different individual bursts.
Next, we try to locate initial sources of individual tremorbursts and use the moveout plot (i.e., seismograms plottedrelative to the distance between the recording station and thetremor source) to confirm whether or not the location is re-liable. We use different combinations of nearby stations untilwe obtain stable tremor sources. We consider multiple tremorsources if their epicenters are at least 30 km distance apart,which is larger than the location errors of each tremor source.For tremor sources within 30 km, an average, stable locationis obtained from individual tremor bursts.
School of Earth and Atmospheric SciencesGeorgia Institute of Technology311 Ferst DriveAtlanta, Georgia 30332
(K.C., Z.P., C.A.)
Geological SciencesUniversity of Texas at El Paso500 W. University Ave.El Paso, Texas 79902
(H.G., A.A.V.)
National Research Institute for Earth Science and Disaster Prevention(NIED)3-1 Tennodai, TsukubaIbaraki 305-0006, Japan
(B.E., T.M.)
Geological Survey of CanadaPacific Geoscience Centre9860 West Saanich RoadSidney, BC V8L 4B2, Canada
(H.K.)
Earthquake Research InstituteUniversity of Tokyo1-1-1 Yayoi, Bunkyo-kuTokyo 113-0032, Japan
(K.O.)
Manuscript received 14 May 2012
A Global Search for Triggered Tremor Following the 2011 Mw 9.0 Tohoku Earthquake 1571