a governance perspective on electricity industry
TRANSCRIPT

A Governance Perspective on Electricity Industry
Performance in India
HARBANS LAL BAJAJ
A thesis submitted to the University of Technology Sydney in partial fulfilment of the
requirements for the degree of Doctor of Philosophy
University of Technology Sydney
Faculty of Engineering and Information Technology
2019

CERTIFICATE OF AUTHORSHIP
I, (Harbans Lal Bajaj) declare that this thesis, is submitted in fulfilment of the
requirements for the award of the degree of Doctor of Philosophy, in the Faculty of
Engineering and Information Technology at the University of Technology Sydney. This
thesis is wholly my own work unless otherwise reference or acknowledged. In addition,
I certify that all information sources and literature used are indicated in the thesis. This
document has not been submitted for qualifications at any other academic institution. This
research is supported by the Australian Government Research Training Program.
Signature of Candidate Production Note:
Signature removedprior to publication.

ACKNOWLEDGEMENTS
I am grateful to Prof. Deepak Sharma, my esteemed Supervisor, for his encouragement,
guidance and immense help in carrying out this research. His constructive criticisms and
suggestions resulting from tireless reviews of the material are highly appreciated.
I would also like to express my gratitude to Dr. Muyi Yang, my co-supervisor, for
providing guidance during my study.
Thanks are also due to the Faculty of Engineering and Information Technology,
University of Technology Sydney for providing the right type of environment and timely
advice for carrying out this research.
A special note of thanks for Nirmal Bajaj, my wife, for patience and encouragement.

TABLE OF CONTENTS
LIST OF TABLES ........................................................................................................... i
LIST OF FIGURES ........................................................................................................ ii
ABSTRACT .................................................................................................................... iii
1 INTRODUCTION ........................................................................................................ 1
1.1 Indian electricity industry: A backdrop ................................................................... 1
1.2 Performance of the Indian electricity industry ........................................................ 7
1.3 Causes of poor industry performance .................................................................... 16
1.3 Research objectives ............................................................................................... 25
1.4 Research methodology .......................................................................................... 25
1.4.1 Qualitative framework .................................................................................... 26
1.4.2 Quantitative framework .................................................................................. 32
1.5 Scope of this research ............................................................................................ 33
1.6 Data considerations ............................................................................................... 33
1.7 Significance of this research .................................................................................. 34
1.8 Organization of this thesis ..................................................................................... 35
2 INDIA’S NATIONAL AND ELECTRICITY GOVERNANCE PARADIGMS .. 36
2.1 Introduction ........................................................................................................... 36
2.2 National and electricity governance paradigms in India ....................................... 37
2.2.1 Colonial period (late 18th century to 1946) ..................................................... 37
2.2.2 Centre-dominated period (1947 to 1960s) ...................................................... 41
2.2.3 Populist period (1970s to 1980s) .................................................................... 48
2.2.4 Market reform period (1990s to the present) .................................................. 52
2.3 Summary ............................................................................................................... 58
3 INDUSTRY STRUCTURE-OWNERSHIP-REGULATION AND
PERFORMANCE ......................................................................................................... 65

3.1 Introduction ........................................................................................................... 65
3.2 Industry structure-ownership-regulation and performance ................................... 66
3.2.1 Colonial period (late 18th century to 1946) ..................................................... 66
3.2.2 Centre-dominated period (1947 to 1960s) ...................................................... 71
3.2.3 Populist period (1970s to 1980s) .................................................................... 75
3.2.4 Market reform period (1990s to the present) .................................................. 79
3.3 Summary and conclusions ..................................................................................... 89
4 CAUSES OF POOR INDUSTRY PERFORMANCE: SOME FURTHER
ANALYSIS .................................................................................................................... 94
4.1 Introduction ........................................................................................................... 94
4.2 Review of existing studies ..................................................................................... 94
4.2.1 Key features of existing studies ...................................................................... 95
4.2.2 Some observations .......................................................................................... 99
4.3 Analytical framework proposed in this research ................................................. 104
4.3.1 Framework for assessing mediation effects .................................................. 105
4.3.2 Framework for assessing moderation effects................................................ 108
4.3.3 Variable selection and data considerations ................................................... 109
4.4 Empirical results and discussion ......................................................................... 117
4.4.1 Mediation effects .......................................................................................... 117
4.4.2 Moderation effects ........................................................................................ 123
4.5 Summary ............................................................................................................. 126
5 SOME SUGGESTIONS FOR IMPROVING INDUSTRY PERFORMANCE . 129
5.1 Introduction ......................................................................................................... 129
5.2 Existing strategy for improving the efficacy of governance ............................... 130
5.2.1 Key features of existing studies .................................................................... 130
5.2.2 Some observations ........................................................................................ 137

5.3 Some suggestions for improving India’s electricity governance ........................ 145
5.4 Summary ............................................................................................................. 150
6 CONCLUSION AND RECOMMENDATIONS FOR FURTHER
RESEARCH ................................................................................................................ 154
6.1 Conclusion ........................................................................................................... 154
6.2 Some recommendations for further research ....................................................... 170
Appendix A: Existing literature on the causes for the poor performance ............. 172
Appendix B: Key features of the Indian society ....................................................... 180
Appendix C: List of existing studies on the performance of electricity industry .. 183
Appendix D: Data sets for assessing the performance of electricity industry in
India .............................................................................................................................. 184
Appendix E: Results of the analysis for assessing the industry performance ....... 199
Bibliography ................................................................................................................ 206
i
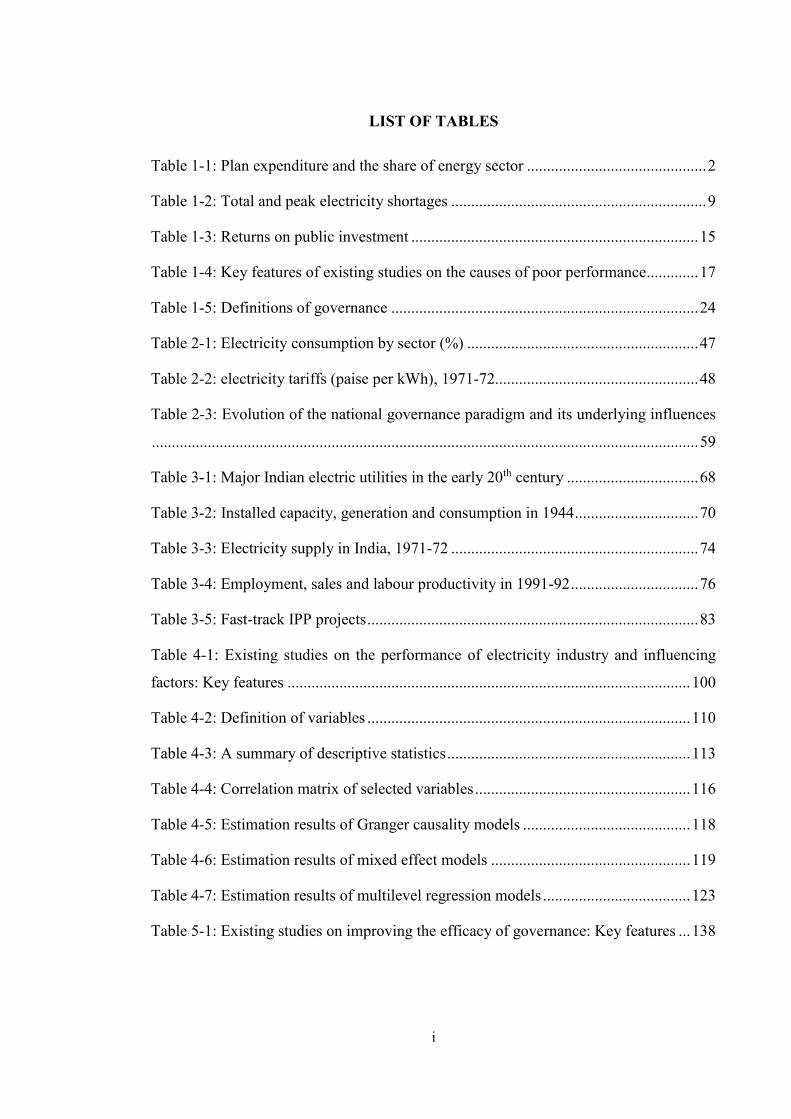
LIST OF TABLES
Table 1-1: Plan expenditure and the share of energy sector ............................................. 2
Table 1-2: Total and peak electricity shortages ................................................................ 9
Table 1-3: Returns on public investment ........................................................................ 15
Table 1-4: Key features of existing studies on the causes of poor performance ............. 17
Table 1-5: Definitions of governance ............................................................................. 24
Table 2-1: Electricity consumption by sector (%) .......................................................... 47
Table 2-2: electricity tariffs (paise per kWh), 1971-72................................................... 48
Table 2-3: Evolution of the national governance paradigm and its underlying influences
......................................................................................................................................... 59
Table 3-1: Major Indian electric utilities in the early 20th century ................................. 68
Table 3-2: Installed capacity, generation and consumption in 1944 ............................... 70
Table 3-3: Electricity supply in India, 1971-72 .............................................................. 74
Table 3-4: Employment, sales and labour productivity in 1991-92 ................................ 76
Table 3-5: Fast-track IPP projects ................................................................................... 83
Table 4-1: Existing studies on the performance of electricity industry and influencing
factors: Key features ..................................................................................................... 100
Table 4-2: Definition of variables ................................................................................. 110
Table 4-3: A summary of descriptive statistics ............................................................. 113
Table 4-4: Correlation matrix of selected variables ...................................................... 116
Table 4-5: Estimation results of Granger causality models .......................................... 118
Table 4-6: Estimation results of mixed effect models .................................................. 119
Table 4-7: Estimation results of multilevel regression models ..................................... 123
Table 5-1: Existing studies on improving the efficacy of governance: Key features ... 138

ii
LIST OF FIGURES
Figure 1-1: Electricity consumption per capita in 2013 .................................................. 10
Figure 1-2: Quality of electricity supply index ............................................................... 11
Figure 1-3: Affordability for agricultural consumers in 2013 ........................................ 13
Figure 1-4: Affordability for household consumers in 2013 .......................................... 14
Figure 1-5: Affordability for industrial consumers in 2013 ............................................ 14
Figure 1-6: Governance framework adopted in this research ......................................... 32
Figure 3-1: Electricity consumption by sector in the 1960s ........................................... 74
Figure 3-2: Structure and ownership of India’s electricity industry in the 1980s ........... 79
Figure 4-1: Mediation and moderation effects .............................................................. 105
Figure 4-2: Framework for assessing mediation effects ............................................... 105
Figure 5-1: Subsidy distribution across India, 2010 ..................................................... 149

iii
ABSTRACT
This research develops a ‘governance perspective’ on the performance of the Indian
electricity industry, with specific emphasis on identifying the causes of persisting poor
industry performance, and ways to improve it. This research emphasis is predicated on
the argument that the contemporary, quintessentially industry-centric, focus on
identifying causes and remedial measures is deficient, as it ignores climacteric socio-
economic, political and cultural influences (the raison d'état of the industry) on industry
performance. The methodological framework employed in this research comprises two
complementary analytical approaches, namely: a) a qualitative approach, drawing upon
the basic tenets of state-society relational models; and b) a quantitative statistical
approach comprising a suit of three econometric models, viz., granger-causality, mixed-
effect, and multilevel-regression. Each of these approaches assesses the impacts of
national and electricity governance paradigms on the configuration (structure-ownership-
regulation) and performance of the electricity industry, albeit from different yet
complementary lenses, for example, historic (for qualitative), and statistical (for
quantitative). Collectively therefore these approaches provide a robust basis for validating
the insights gained from the ‘other’ approach. The analyses undertaken in this research
suggests that the governance processes of the India electricity industry have historically
been overwhelmingly influenced by the wider national governance priorities and agendas
for promoting socio-economic development, and that these priorities and agendas have
quintessentially reflected a rather narrow set of dominant, ‘politically-powerful’,
economic and socio-cultural interests of the time. By this reasoning, electricity has
traditionally been seen simply as a means to promote these (dominant) interests. The
question of industry performance has therefore (and understandably so) become sub-
servient to the more pressing need to promote (narrow) political interests. Outcome:
persistent poor industry performance. This research further posits that industry
performance can be improved by a state-led effort to extend the ambit of dominant
interests by, in particular, including ‘local’ (and currently, marginalised) interests.

1
1 INTRODUCTION
1.1 Indian electricity industry: A backdrop
Energy (electricity in particular) is a key driver for the socio-economic development of a
nation. It is even more critical for a developing country like India (the country of focus
of this research) where electricity produces a lifeline for a multitude of people whose
basic human needs of health, education and poverty alleviation are a priority. The
provision of sufficient and affordable electricity is, therefore, a priority for promoting
economic development, for creating job opportunities, for fostering growth, for
improving living standards, and for bridging social inequalities that exist in the country.
In view of its significance, the development of energy sector, electricity sector in
particular, has traditionally been accorded a high priority by the Indian policy makers.
For example, the energy sector has accounted for nearly 23% of total capital outlays over
the period 1951-2017, of which electricity sector alone has accounted for around 17%
(see Table 1-1). In addition, the country’s policy makers have established an elaborate
array of institutions to deal with various facets of the electricity business, namely, policy
making, planning, financing, implementation and operation. Further, the Seventh
Schedule of the Constitution of India has placed the issue of electricity on the Concurrent
List (Sl, No. 38 of List-III Concurrent List, Constitution of India), implying that the
responsibility for the electricity industry is jointly shared between the Centre and the
States of the Indian federal system. Accordingly, since independence in 1947, both the
Central and the State governments in India have been able to legislate on electricity
matters.

2
Table 1-1: Plan expenditure and the share of energy sector
Plan outlays (Rs.Cr.)
Share of energy sector (%)
Power Oil & Gas Coal Renewable Total
1951-1956 2,070 - - - - 19.7
1956-1961 4,800 09.7 0.8 1.9 - 12.4
1961-1966 7,500 14.6 2.6 1.3 - 18.5
1969-1974 15,900 18.6 1.9 0.7 - 21.2
1974-1979 38,853 18.7 3.6 2.9 - 25.2
1980-1985 97,500 16.7 7.8 3.5 0.1 28.1
1985-1990 180,000 17.4 7.3 3.2 0.3 28.2
1992-1997 434,100 18.4 5.5 2.4 0.2 26.5
1997-2002 859,200 14.5 8.6 2.3 0.4 25.8
2002-2007 1,525,639 22.3 7.9 2.5 0.6 33.3
2007-2012 3,644,719 15.7 5.9 1.0 0.3 22.8
2012-2017 7,669,807 16.9 1.0 1.5 0.5 13.4
Notes: 1. Rs Cr: Rupee Crore (1 US $ ≈ Rs 65, currently) 2. Outlays, at current prices, expressed in terms of the base year of
the respective Plans.
Sources: Planning Commission five-year plans (various)
The legislative scope of these two levels of the government was more formally defined
in the Electricity (Supply) Act of 1948. The backdrop for this Act was provided by several
national, local and global factors including belief in energy-growth nexus; primacy of
poverty alleviation since independence in 1947; emphasis on self-sufficiency through the
development of local small-scale and heavy industry; politically significant and large
agriculture sector; availability of indigenous resources; technological development in
large scale coal-based power generation and transmission; and lessons from overseas
experience, especially the experience with national power grid in the UK by locating
power stations at coal pitheads and connecting them with transmission lines to supply
power to the whole country, etc.

3
Against this backdrop, the Indian Electricity (Supply) Act of 1948 was enacted and led
to the establishment of State Electricity Boards (SEBs). The SEBs were owned by the
State governments and were normally operated as extensions of the State ministries. They
were vertically integrated utilities that were responsible for electricity generation,
transmission, distribution and retail in the states. There also existed several organisations
at the national level (e.g., Central Electricity Authority) that played important roles in the
electricity industry in India. The roles of these organisations were however mainly limited
to policy-making and planning at the national level (Kale 2004).
In the 1960s, the State governments gradually realised the political appeal of electricity,
and began to actively intervene in the operation and management of the SEBs, particularly
in tariff setting. The SEBs were usually required to provide electricity at low tariffs to
agricultural consumers, even though the cost of serving remote rural areas was high
(Dubash & Rajan 2001). This was driven by a range of factors including, for example,
shift in developmental priority in favour of agricultural sector in the 1960s and 70s,
caused by chronic food shortages, increased reliance on food imports, fear of losing
national sovereignty, emergence of powerful farmer organisations at the state level in the
late 1960s, and the needs to win support from these organisations which represented a
significant proportion of the electorate. Agriculture subsidies therefore became
commonplace in the 1970s and 80s (Dubash & Rajan 2001; Ganguly & Mukherji 2011).
These subsidies however began to negatively affect the financial health of the SEBs. The
Electricity (Supply) Act 1948 required the SEBs to earn a 3% minimum return on net
fixed assets. But most SEBs could not comply with this statutory requirement due to
lower-than-cost electricity tariffs. In fact, revenues generated by the SEBs were
insufficient even for financing necessary system maintenance, resulting in poor quality

4
of supply and chronic power shortages. Further capacity expansion from their own
resources was therefore simply beyond the capacity of the SEBs (Tongia 2009).
In addition, electricity subsidies provided by the SEBs to agricultural consumers were
normally in the form of flat-rate bills based on the capacity of water pumps rather than
metered consumption. This enabled the SEBs to hide network losses and theft of
electricity under the category of agricultural consumption, creating little incentives for
improving efficiency and quality of supply (Dubash & Rajan 2001).
Further, in order to offset the losses associated with electricity subsidies to agricultural
customers, the SEBs usually charged high tariffs from industrial consumers. In the 1980s,
this cross-subsidisation, together with unreliable and insufficient electricity supply, led to
many industrial customers eschewing high-cost electricity from the SEBs in favour of
self-generated electricity. This left the SEBs with fewer financially valuable customers,
and further worsened their financial condition (Kale 2004).
In response to the poor financial and technical performance of the SEBs, the Central
government established the National Thermal Power Corporation (NTPC) and National
Hydro Power Corporation (NHPC) in 1975. These companies generated electricity and
sold it to more than one SEB for distribution. They (especially, the NTPC) were expected
to deliver a rapid expansion of generation capacity, which, it was argued, will alleviate
supply shortages in the country. They were also expected to form a model of modern
operational practices with high efficiency and supply quality that the SEBs could follow
(Tongia 2009).
In addition, the Central government also created the National Power Transmission
Corporation in 1989, which was subsequently renamed as Power Grid Corporation of
India Limited (Powergrid). The Powergrid was expected to develop a national grid that

5
could enable more efficient coordination of electricity supply in the country. In the
following years, the Powergrid took over transmission assets of NTPC and NHPC and
assumed responsibility for all inter-state power transmission systems. Since then, all the
extra high voltage alternating current (EHVAC) and high voltage direct current (HVDC)
transmission lines in the country have come under the purview of Powergrid.
Although central government intervention alleviated the supply shortages in the short-
term, it failed to improve the financial and technical performance of the SEBs in the long-
term. Chronic power shortages, low electrification rates, high system losses, and
insufficient investments in developing new capacity remained commonplace. The SEBs
remained heavily debt-ridden and largely unable to finance power system maintenance
and capacity additions to serve rising electricity demand (Tongia 2009).
As a response, steps were taken by the Indian government in the early 1990s to reform
the electricity industry. In 1991, the Central government amended the 1948 Electricity
(Supply) Act, to allow private investors to establish, operate and maintain power plants
(Dubash and Rajan 2001). Shortly after making this legislative change, eight showcase
Independent Power Producer (IPP) projects were assigned by the Central government
with ‘fast track clearance’, which allowed these projects to leap over licensing hurdles in
order to expeditiously address the power shortages. Encouraged by these reforms, private
investors made about 190 proposals for IPPs by 1996 (Tongia 2009). If completed, these
projects would add over 75,000 MW of generation capacity. But most of these proposed
projects did not materialise, partly due to local unrest about these projects. Consequently,
by 2002, IPPs had only added 10,800 MW of capacity (Dubash & Rajan 2001).
In addition, commissioned IPP projects were normally operated based on power purchase
agreements (PPAs) between IPPs and SEBs. The PPAs were strongly in favour of private

6
investors, with a guaranteed 16 per cent rate of return, a five-year tax holiday, full
repatriation of profits in dollars, and take-or-pay clause. These PPAs provided little
incentives for IPPs to minimise the costs of supply because all the costs could be passed
onto the SEBs. As a result, electricity generated from the IPPs was usually much more
expensive than that from comparable NTPC and SEB power plants (Kale 2004). Further,
most IPPs were designed to meet base-load demand even though peak demand was the
most pressing need of the time. This, together with take-or-pay clause, meant that power
plants with lower costs were frequently replaced by IPPs with higher costs to meet base-
load demand. This contributed to deepening fiscal woes for the SEBs, and higher tariffs
in some states (Dubash & Rajan 2001).
By the mid-1990s, there was a growing concern in India that the reform focusing on
encouraging IPPs would not improve the financial and technical performance of the
electricity industry, because it left untouched the fundamental weaknesses of the SEBs,
namely: 1) heavily subsidised and below cost electricity tariffs; 2) continued practice
showing transmission and distribution losses and theft of power as agricultural
consumption; and 3) high cost of electricity purchased from expensive IPPs (Kale 2014a).
As a response, several State governments (e.g., Andhra Pradesh, Orissa, and Uttar
Pradesh) began to reform their SEBs in the 1990s. These reforms included: 1)
restructuring of the SEBs into separate generation, transmission, and distribution entities;
2) privatisation of separated electricity entities, especially distribution entities; and 3)
creation of independent regulators – the State Electricity Regulatory Commissions
(SERCs). These reforms were expected to depoliticise the SEBs and their tariff setting,
and to improve efficiency and quality of supply (Kale 2004). While the actual outcomes
of these state reforms have been mixed, they did succeed in highlighting the central

7
problems of the electricity industry, namely, highly politicalised tariff-settings and SEBs’
financial woes (Sen & Jamasb 2013).
In 2003, the Central government sought to deepen and formalise the reforms that had
already been initiated in some states. The Electricity Act of 2003 was enacted in May
2003. It replaced all existing legislation in the electricity industry and prepared the ground
for a fundamental reform of the Indian electricity industry. Key elements of this reform
included restructuring of the SEBs, creation of independent regulators, open-access to
networks, and introduction of market competition (Sen & Jamasb 2013).
1.2 Performance of the Indian electricity industry
The above discussion suggests that the development of the electricity industry has long
been accorded a high priority by the Indian policy makers, as reflected in the magnitude
of investments made in the industry, and the establishment of an extensive governance
framework ( including, laws, rules, regulations and institutions) for the industry. Despite
this, the Indian electricity industry has persistently performed poorly (Pargal & Banerjee
2014). While industry performance is a much expansive concept, it is discussed, in the
context of this research, in terms of four performance indicators. They include: adequacy,
reliability, affordability, and returns on public investment. The selection of these
indicators – it is argued – is highly appropriate for a country that has experienced
persistent shortages of electricity supply, where the quality of supply continues to be poor,
where a significant majority of people requiring access to electricity to uplift their
economic and political well-being, are simply not in a position to pay for it, and where
public exchequer is under duress with equally competing demands for allocation of
investment funds.

8
Adequacy
Electricity shortages (total and peak) for India, over the period 1975-2015, are presented
in Table 1-2. As shown in the table, total and peak shortages of electricity supply were
severe in India in the 1970s and 80s. Total electricity shortages seemed to have improved
in recent years, falling from 16.0 per cent in 1980-81, to less than 4.0 per cent in 2014-
15. Similarly, peak shortages also dropped from 18.3 per cent in 1995-96, to 4.7 per cent
in 2014-15.
These statistics of reduction in shortages should however be read with caution. There are
two reasons for that. One, these statistics are estimated as percentage of electricity
required by consumers with very low levels of consumption. In fact, India’s average
electricity consumption per capita (about 750 kWh per capita) is among the lowest in the
world (see Figure 1-1). It is approximately 25 per cent of world average, and less than 35
per cent of major developing countries (e.g., China, Malaysia, and Thailand), and around
10 per cent of OECD countries. The increase of India’s average electricity consumption
level to the world average (around 3,100 kWh per capita) would have led to about a 300%
increase in the country’s electricity requirement in 2014-15.
Two, shortages are estimated as percentage of electricity required by those with access to
electricity; they do not consider the large number of consumers in the country who do not
currently have access to electricity (more than 200 millions). The provision of electricity
to these consumers would considerably increase the country’s total electricity
requirement – by about 181,000 GWh (almost one fifth of the country’s electricity
requirement in 2014-15), if the consumption level of these consumers is assumed to be
equal to the country’s average consumption level (about 760 kWh per capita).

9
Table 1-2: Total and peak electricity shortages
Total Peak
Requirement (GWh)
Availability (GWh)
Shortage (GWh)
Shortage (%)
Requirement (MW)
Availability (MW)
Shortage (MW)
Shortage (%)
1975-76 0083,508 0074,909 08,599 10.3 - - - -
1980-81 0092,324 0077,506 14,818 16.0 - - - -
1985-86 0170,746 0157,262 13,484 07.9 028,090 024,215 03,875 13.8
1990-91 0267,632 0246,560 21,072 07.9 044,005 037,171 06,834 15.5
1995-96 0389,721 0354,045 35,676 09.2 060,981 049,836 11,145 18.3
2000-01 0507,216 0467,409 39,807 07.8 074,872 065,628 09,244 12.3
2005-06 0631,757 0578,819 52,938 08.4 093,255 081,792 11,463 12.3
2010-11 0861,591 0788,355 73,236 08.5 122,287 110,256 12,031 09.8
2014-15 1,068,943 1,030,800 38,143 03.6 148,166 141,160 07,006 04.7
Sources: Central Electricity Authority (2015) and World Bank (1981)

10
Figure 1-1: Electricity consumption per capita in 2013
Reliability
Quality of electricity supply index is part of the Global Competitiveness Index developed
by the World Economic Forum (World Economic Forum 2016). This index measures the
reliability of electricity supply in a country (i.e., degree of supply interruptions and
voltage fluctuations). It ranges from 1 (not reliable at all) to 7 (extremely reliable). A
snapshot of the quality of electricity supply index, for major developed and developing
countries, over the period 2006 to 2015, is presented in Figure 1-2. As shown in the figure,
the quality of electricity supply index for India has been in the range of 3.1 to 3.4 over
this period. This is significantly low in comparison with the average of most developed
and several developing countries, with an average rate of 5 and above (a rate of 5 is
considered to be a highly reliable system). This suggests that electricity supply is highly
unreliable in India. In fact, the Enterprise Surveys conducted by the World Bank in 2014
12,985
10,428 10,134
8,049 7,836 7,019
5,407 4,512
3,762 3,105 3,093 2,529 2,471
1,306 765 488 -
2,000
4,000
6,000
8,000
10,000
12,000
14,000kW
h pe
r cap
ita
Source: World Bank (2014), World Development Indicators

11
reported that firms in India experienced power outages about 14 times in a typical month,
and most of these outages lasted for more than an hour. Such unreliable electricity supply
caused about 2% reduction in their annual profits (World Bank 2014). Similarly, about
one fifth of households with electricity reported in 2005 electricity outages of up to four
hours a day. The state of Bihar and Uttar Pradesh had the worst supply reliability in the
country. They had average electricity outages of 16 and 20 hours per day, respectively.
In response to this unreliable electricity supply, most households (around 70%) use
expensive backup generators for lighting (Banerjee et al. 2015).
Figure 1-2: Quality of electricity supply index
3.2 3.1 3.2 3.2 3.1 3.13.2 3.2
3.4
3
3.5
4
4.5
5
5.5
6
6.5
7
2006-2007 2008-2009 2010-2011 2012-2013 2014-2015
India Australia China
Malaysia Thailand United States
United Kingdom OECD countries Canada
Source: World Economic Forum (2017), quality of electricity supply index

12
Affordability
Affordability is defined – in the context of the present discussion – as electricity
expenditure by consumers as proportion of their total incomes. In this research,
affordability is estimated for agricultural, household and industrial consumers, based on
their electricity expenditures and total incomes. Electricity expenditures by these
consumers are estimated from data on electricity prices and electricity consumption.
These data are sourced from IEA databases (IEA 2016a, 2016b). Total incomes for
agricultural and industrial consumers are estimated based on the share of their value added
in the overall GDP while total incomes for household consumers are estimated based on
household final consumption expenditure, as a percentage of GDP. Data for agricultural
and industrial value added and household final consumption expenditure are sourced from
the World Bank national account databases (World Bank 2016b).
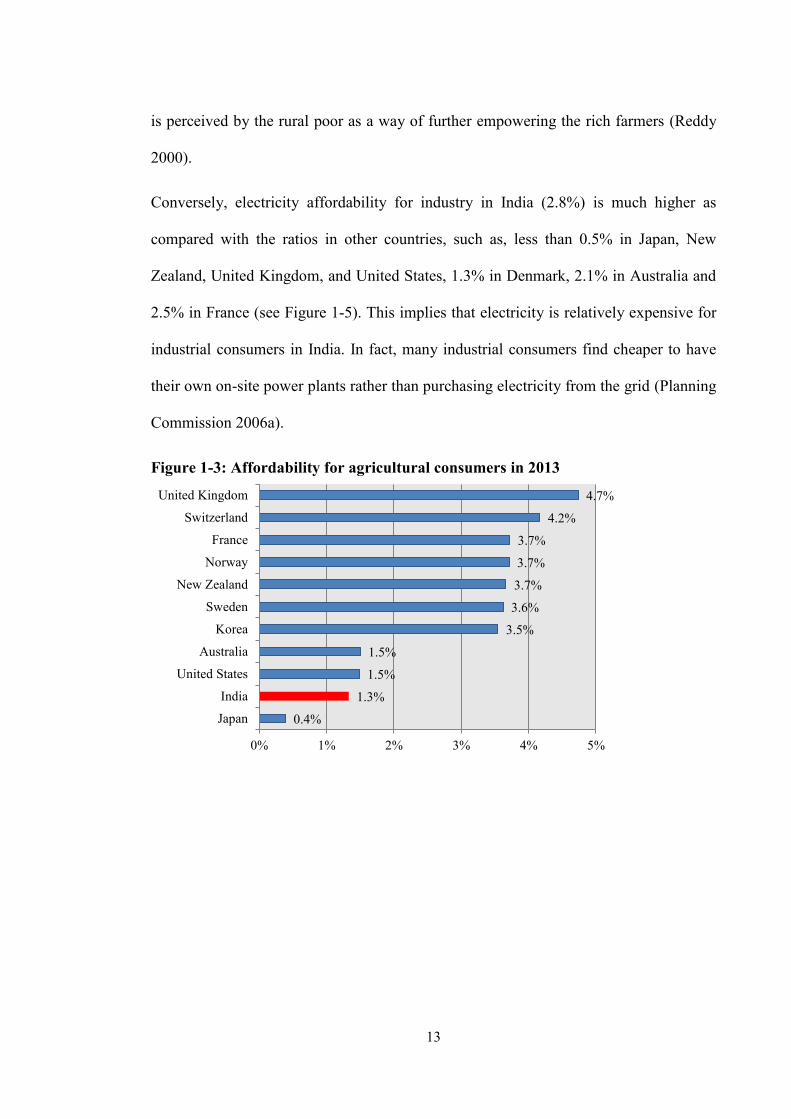
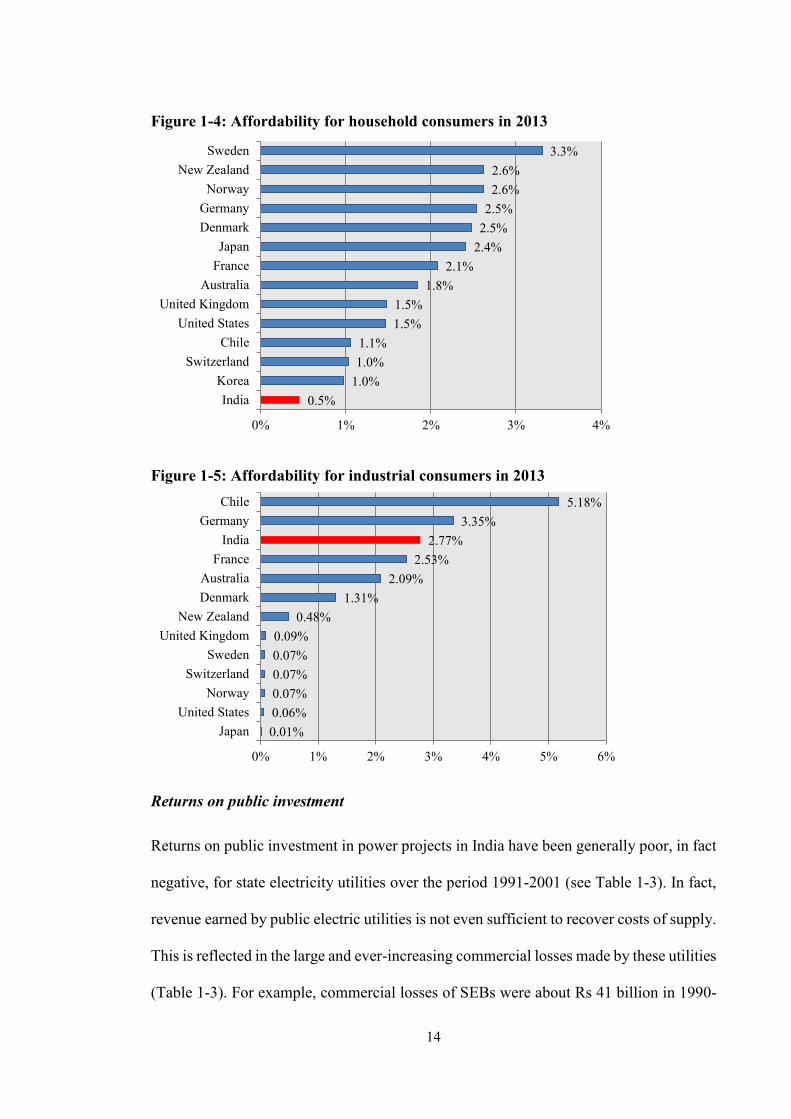
The estimations of affordability (as noted above) are presented in Figures 1-3 to 1-5. A
review of the figures suggests that electricity expenditure in India accounts for about 1.3%
of agricultural income, and 0.5% of household income. These ratios are low in
comparison with other countries, such as, Australia (1.5% and 1.8%), France (3.7% and
2.1%), Korea (3.5% and 1.0%), United Kingdom (4.7% and 1.5%), and United States
(1.5% and 1.5%). This implies that electricity is generally affordable for agricultural and
household consumers in India. This is understandable if one takes note the fact that
agricultural and household electricity prices are heavily subsidised in India (Dubash &
Rajan 2001). These subsidies are however mistargeted and mainly benefit large and
wealthy agricultural and household consumers. It has even been reported that there is
significant popular rural opposition against the provision of electricity subsidies, which
13
is perceived by the rural poor as a way of further empowering the rich farmers (Reddy
2000).
Conversely, electricity affordability for industry in India (2.8%) is much higher as
compared with the ratios in other countries, such as, less than 0.5% in Japan, New
Zealand, United Kingdom, and United States, 1.3% in Denmark, 2.1% in Australia and
2.5% in France (see Figure 1-5). This implies that electricity is relatively expensive for
industrial consumers in India. In fact, many industrial consumers find cheaper to have
their own on-site power plants rather than purchasing electricity from the grid (Planning
Commission 2006a).
Figure 1-3: Affordability for agricultural consumers in 2013
0.4%
1.3%
1.5%
1.5%
3.5%
3.6%
3.7%
3.7%
3.7%
4.2%
4.7%
0% 1% 2% 3% 4% 5%
Japan
India
United States
Australia
Korea
Sweden
New Zealand
Norway
France
Switzerland
United Kingdom
14
Figure 1-4: Affordability for household consumers in 2013
Figure 1-5: Affordability for industrial consumers in 2013
Returns on public investment
Returns on public investment in power projects in India have been generally poor, in fact
negative, for state electricity utilities over the period 1991-2001 (see Table 1-3). In fact,
revenue earned by public electric utilities is not even sufficient to recover costs of supply.
This is reflected in the large and ever-increasing commercial losses made by these utilities
(Table 1-3). For example, commercial losses of SEBs were about Rs 41 billion in 1990-
0.5%1.0%1.0%1.1%
1.5%1.5%
1.8%2.1%
2.4%2.5%2.5%
2.6%2.6%
3.3%
0% 1% 2% 3% 4%
IndiaKorea
SwitzerlandChile
United StatesUnited Kingdom
AustraliaFranceJapan
DenmarkGermany
NorwayNew Zealand
Sweden
0.01%0.06%0.07%0.07%0.07%0.09%
0.48%1.31%
2.09%2.53%
2.77%3.35%
5.18%
0% 1% 2% 3% 4% 5% 6%
JapanUnited States
NorwaySwitzerland
SwedenUnited Kingdom
New ZealandDenmarkAustralia
FranceIndia
GermanyChile

15
91. In the following years, these losses increased steadily, reaching more than Rs 71
billion in 2013-14. This is equivalent to 0.6 per cent of India’s GDP, and 9.2 per cent of
the country’s gross fiscal deficit in 2013-14. Compared with the country’s 12th Five-year
Plan (2012-17) outlays for different sectors, these losses account for about 5 per cent of
energy spending, or nearly 3 per cent of social service spending (such as, spending on
education and health care).
Table 1-3: Returns on public investment
1990-91 1995-96 2000-01 2005-06 2010-11 2013-14
Rate of return (%)
- Without subsidy1
- With subsidy2
-12.1
-9.5
-16.4
-2.2
-39.1
-27.5
-
-
-
-
-
-
Commercial losses (Rs. Crore)
- Without subsidy1
- With subsidy2
-4,124
-3,083
-8,770
-1,178
-25,259
-17,794
-31,723
-19,166
-65,997
-43,766
-71,271
-31,148
Notes: 1. Before receiving subvention from the state governments 2. After receiving subvention from the state governments
Sources: Planning Commission (various)
Based on the above discussion, it can be argued that the performance of the Indian
electricity industry has been persistently poor, notwithstanding the fact that some
performance improvements have been made in recent years. It is extremely important to
identify the causes for poor performance, because poor industry performance is not only
damaging for the industry, it is extremely damaging for the wider economy and society,
given the criticality of electricity as an essential ingredient for economic and social
progress.

16
1.3 Causes of poor industry performance
Over the years, several studies have been undertaken to identify the causes of persistent
poor performance of the electricity industry in India. They include, for example, Ahn &
Graczyk (2012), Chikkatur et al., (2009), Kannan and Pillai (2001a and 2001b), Khurana
and Banerjee (2015), Planning Commission (2001 and 2006), Shunglu Committee (2011),
Venkataraman Committee (1964), and World Bank (1979, 1984 and 1999). Appendix A
provides a more detailed discussion of these studies. Table 1-4 presents the key features
of these studies, in particular causes of poor performance, and the indicators in terms of
which performance is measured in each study.

17
Table 1-4: Key features of existing studies on the causes of poor performance
Key studies Performance indicators Causes of poor performance
Venkataraman Committee (1964)
- Large financial losses of SEBs
- Lower-than-cost electricity tariffs, due to the provision of subsidies to the industry
World Bank (1979) - Inadequate power supply
- Slow growth of supply capacity, due to significant delays in project execution - Underutilisation of existing capacity, due to inadequate network capacity and poor facility
maintenance
World Bank (1984)
- Inadequate power supply
- Delays in project execution, due to insufficient financial resources, inadequate supply of construction materials (e.g., cement and steel), frequent revisions in the design of the power plants, and shortages of qualified engineers and technicians.
- Inadequate network capacity, due to insufficient investment
World Bank (1999) - Inadequate power supply
- Overconsumption encouraged by subsidised electricity tariffs
Planning Commission (2001) - Inadequate power supply
- Insufficient supply capacity, due primarily to the inability of the central and state governments to mobilise sufficient financial resources for capacity expansion
Kannan & Pillai (2001a) - Large financial losses of SEBs
- High cost of supply, due primarily to inefficiency of the SEBs (e.g., overstaffing) - Lower-than-cost electricity tariffs
Kannan & Pillai (2001b) - Inadequate and unreliable power supply
- Poor technical efficiency of most power plants, due to poor facility maintenance, poor design of
thermal boilers, and service of power plants in excess of their useful operating life
- High network losses
Jain (2006) - Electricity poverty - Non-discriminatory subsidies to rural consumers that mainly benefit medium and large consumers

18
Table 1-4: Key features of existing studies on the causes of poor performance (continued)
Key studies Performance indicators Causes of poor performance
Planning Commission (2006b) - Inadequate and unreliable supply
- Insufficient funding to finance necessary capacity expansion and facility maintenance, due to high technical and commercial losses of public electric utilities
- High electricity tariffs for industry, commerce and large households
- High cost of supply - Cross-subsidisation
- Electricity poverty - Mistargeted subsidy programs that mainly benefit large agricultural and household consumers
Chikkatur, Sagar & Sankar (2009)
- Inadequate power supply
- Underutilisation of existing capacity, due to insufficient and poor quality of coal for generation
- Inappropriate contractual arrangements for coal supply (e.g., no penalty on non-compliance)
- Non-differentiation between coal with different quality in the pricing-settings that encourage the supply of low quality coal
Kodwani (2009) - Inadequate and unreliable supply
- Large financial losses of SEBs
- Insufficient investment and irrational pricing
- Inability of the regulators (SERCs) to establish an independent, transparent and unbiased regulatory framework for the industry, due to their strong reliance on government resources (e.g., funding and staff deputation)
Shunglu Committee (2011) - Large financial losses of public electric utilities
- Inadequate cost realisation
- Delays in tariff increase, due to late submission of tariff proposals by electric utilities or submission in unacceptable forms (no audit reports)
- Lower-than-cost electricity tariffs, due to frequent government intervention in tariff-settings empowered by section 108 of the Electricity Act
- Widespread power thefts and significant network losses
Ahn & Graczyk (2012) - Inadequate power supply
- Underutilisation of existing capacities, due to insufficient fuel supplies (i.e., coal and gas)
- Slow growth of generation capacity, due to inadequate domestic supply of generation equipment

19
Table 1-4: Key features of existing studies on the causes of poor performance (continued)
Key studies Performance indicators Causes of poor performance
Pargal & Banerjee (2014) - Large financial losses of public electric utilities
- High fuel costs, due to shortage of domestic fuel supply (mainly coal) and poor procurement planning of public electric utilities (heavily reliance on spot market for fuel procurement)
- Lower-than-cost electricity tariffs
- Insufficient government compensation for electricity subsidies
Pargal & Mayer (2014) - Large financial losses of public electric utilities
- Inefficiencies of public electric utilities (e.g., poor investment decisions) that lead to large financial losses
- Unaccountability of these utilities, caused by frequent political interference
- Inability of the regulators (SERCs) to encourage loss reduction, due to insufficient technical, financial and human resources to perform their regulatory functions, and limited autonomy
Khurana & Banerjee (2015) - Large financial losses of public electric utilities
- High cost of supply, due largely to high fuel costs
- Lower-than-cost electricity tariffs

20
A review of the table suggests that although existing studies have identified a diverse
range of causes of the poor performance of the Indian electricity industry, there however
is a commonality of views on the underlying causes for poor performance. The main
causes for poor performance can be grouped under the following categories: 1)
underutilisation of existing capacities, due to insufficient and low quality fuel supplies
(i.e., coal and gas), poor facility design and maintenance, and inadequate network
capacity; 2) widespread and prolonged delays in project execution, due to insufficient
financial resources, inadequate domestic supply of construction materials (e.g., cement
and steel) and electrical equipment, shortages of qualified engineers and technicians, and
significant revisions in project execution; 3) poor management of electric utilities, mainly
caused by frequent state interventions in their day-to-day operation; 4) high financial
losses of electric utilities caused by subsidised electricity prices that are normally lower
than the cost of supply, high network losses that are due to high technical losses or
widespread theft of power, and low payment collection; and 5) inability of the regulators
(SERCs) to create an independent, transparent and unbiased regulatory framework for the
industry, due to insufficient technical, financial and human resources to perform the
regulatory functions, and limited autonomy.
Limitations of existing studies and premise of this research
It is clear from the previous discussion that existing studies overwhelmingly tend to
attribute poor industry performance to industry-centric factors, that is, factors that are
proximate to the industry, or within the immediate confines of the industry. They include,
for example, underutilisation of capacity, low quality fuel, poor system design,
inadequate network capacity, lack of financial resources, poor management, etc. These
studies then suggest ways to improve performance by addressing these factors, for

21
example, improved capacity utilisation, better quality fuel, improved system design,
extending network capacity, and improving industry management.
Such industry-centric focus for understanding causes (reasons) for poor industry
performance (and for measures to improve performance) – this research contends – is
highly deficient. Why? Because the concept of industry performance is a nuanced
concept, and it is context-specific. Performance is, in fact, an outcome of an admixture of
layers and layers of mutually interacting and unpredictably reinforcing underlying
influences. For example, delays in project execution could happen due to a variety of
reasons, such as, unrealistic prior estimation of project execution times, delays in
procurement of construction materials, lack of qualified engineers and technicians, etc.
These, in turn, could be due to ineffective planning processes, which could further be
direct outcomes of deficient policy processes. These policy processes may themselves be
weak due to their inability to effectively articulate underlying interests; these interests
themselves may have cultural, historical and global roots. Similar arguments could be
built for other proximate factors. Further, these varied proximate factors and underlying
influences may be correlated. For example, poor system design may create need for more-
than-planned maintenance, which may lead to low capacity utilisation and inadequate
network capacity. Similar arguments could be built for the underlying influences and their
interactions with the proximate factors.
In short, the existing industry-centric focus (of attributing industry performance to its
proximate factors) is highly deficient – as argued above. It is therefore unlikely to provide,
on its own, meaningful insights into the causes (reasons) for poor industry performance,
hence guidance for designing measures to improve industry performance. Such insights
and guidance can only be gained – this research contends – if one is able to identify the

22
varied influences that shape the proximate factors. It is based on these insights then that
remedies for improving the performance of the Indian electricity industry can be
identified – the argument continues.
The task of identifying the varied influences is however extremely difficult, due to their
multiplicity, possible correlations, perspectives, and viewpoints (as also noted above).
Notwithstanding this difficulty, a sufficiently useful idea about these influences can be
gained by grouping these factors into specific ‘defining’ realms and, through a multi-
stage processes, delineating their significance. Institutional theory does provide a
coherent framework within which an understanding of underlying influences could be
developed. This theory divides institutions into formal and informal (North & Thomas
1973). Formal institutions often refer to rules that are made explicit or written down. They
include, for example, constitution, laws, and regulations (North 1990). Informal
institutions usually refer to socially shared norms that produce regularities in behaviour
with respect to particular human interactions. Some examples of informal institutions
include: beliefs, customs, conventions, ideologies, and traditions (Kingston & Caballero
2009). A core premise of institutional theory is that the performance of an industry
(electricity industry, in this instance) is influenced by the formal institutions, which in
turn derive their legitimacy from the underlying informal institutions (Williamson 2000).
As the scope of ‘institutions’ can be rather expansive and somewhat diffuse, in the context
of this paper, the concept of ‘governance’ is used instead. Governance refers to the
structure (such as, hierarchy, network, and market) and processes (for example, control,
coordinate, and steer) by which various state and social actors pursue their interests in
governing socio-economic activities of a country (see Table 1-5). The outcomes of this
pursuit of interest are the setting, application and enforcement of institutions for shaping

23
human behaviour in these activities (Kjaer 2004). This suggests that the concept of
governance tends to emphasise the dynamic aspect of institutions, that is, the ongoing
processes of creating, applying and enforcing institutions for governing socio-economic
activities, and the role of various state and social actors in shaping these processes. The
use of this concept could therefore enable a perspective to be developed on the influence
of socio-economic institutions (e.g., central planning, and market competition) in shaping
the configurations of electricity industry in India (i.e., industry structure, ownership,
regulation), the underlying dynamics of these configurations, and hence, the performance
of the industry. Further, rather than engaging in a comprehensive, but less than useful,
consideration of the specific institutions for governing socio-economic development in
India, the governance perspective developed in this research focuses on the underlying
philosophy of the socio-economic institutions – the national governance paradigm. This
perspective, in conjunction with the existing industry-centric thinking, can provide much
richer insights into why the Indian electricity industry has persistently performed poorly,
and what can be done to improve its performance.

24
Table 1-5: Definitions of governance
Definitions of governance G
over
nanc
e as
stru
ctur
e Jessop (1998) Any mode of coordination of interdependent activities
including, for example, anarchy of exchange, organisational hierarchy, and self-organising heterarchy
Rhodes (1997) Self-organising, inter-organisational networks characterised by interdependence, resource exchange, rules of the game, and significant autonomy from the state
Risse (2012) Institutionalised modes of social coordination to produce and implement collectively binding rules, or to provide collective goods
Rosenau (1995) Systems of rule at all levels of human activity – from the family to the institutional organisation – in which the pursuit of goals through the exercise of control has transnational repercussions
Salamon (2002) An elaborate system of third-party government in which crucial elements of public authority are shared with a host of nongovernmental or other-governmental actors, frequently in complex collaborative systems
Torfing (2012) Networks of interdependent actors that contribute to the production of public governance
Gov
erna
nce
as p
roce
ss
Ansell & Torfing (2016)
The process of steering society and the economy through collective action and in accordance with common goals
Bevir (2012) All of processes of governing, whether undertaken by a government, market or network, whether over a family, tribe, formal or informal organisation or territory and whether through the laws, norm, power or language.
Dixit (2008) Processes that support economic activity and economic transactions by protecting property rights, enforcing contracts, and taking collective action to provide appropriate physical and organisational infrastructure
Heritier (2002) Types of political steering in which non-hierarchical modes of guidance are employed
Kooiman (1993) All those activities of social, political and administrative actors that…guide, steer, control or manage society
Pierre & Peters (2000)
An ongoing process of steering, or enhancing the institutional capacity to steer and coordinate
UNDP (1997) Exercise of economic, political and administrative authority to manage a country’s affairs at all levels
25
1.3 Research objectives
Against the above background, the primary objective of this research is to develop a
governance perspective on the causes of the poor performance of the Indian electricity
industry, and to identify ways to improve industry performance. In order to achieve this
objective, three specific objectives have been set in this research. These are as follows:
Objective 1: To examine the evolution of national governance paradigm, with the
aim of gaining insights into the influences of political, socio-economic
and cultural factors in shaping this evolution, and to develop an
understanding of the impacts of this evolution on shaping the electricity
governance paradigm in India.
Objective 2: To assess the impact of national and electricity governance paradigms
on shaping the structure-ownership-regulation and performance of the
Indian electricity industry.
Objective 3: To develop recommendations on how insights gained from objectives
1 to 2 could contribute to developing policy prescriptions for improving
the industry performance.
1.4 Research methodology
Clearly, addressing these objectives is a multidisciplinary task. This requires recourse to
concepts and methodologies belonging to several disciplines, such as, technology,
engineering, economics, political sciences, and sociology. As a result, a combination of
methodologies is employed in this research. These methodologies are divided into two
parts – a qualitative framework, and a quantitative framework. The qualitative framework
essentially draws upon the basic tenets of the state-society relational approach for

26
analysing governance. It seeks to analyse the impacts of national and electricity
governance paradigms on shaping the electricity institutions (i.e., industry structure,
ownership, regulation), the underlying dynamics of these institutions, and hence, the
performance of the industry. The quantitative framework is based on three econometric
models, namely, granger causality model, mixed effect model, and multilevel regression
model. These models statistically assess the impacts of national and electricity
governance paradigms on the structure-ownership-regulation and performance of the
Indian electricity industry. This assessment is expected to lend credence to the insights
gained from the qualitative analysis (not just confined to select examples or historical
events). Details about these two frameworks are provided in Sections 1.4.1 (qualitative
framework) and 1.4.2 (quantitative framework).
1.4.1 Qualitative framework
There has been a long tradition of discussion on governance in social sciences. This
tradition can be traced back to the work of Thucydides in the 5th century on the failure of
governance of Athens (Thauer 2016). Most of the early discussion on governance viewed
‘governance’ as a synonym for ‘government’: providing direction to the economy and
society by the exercise of authority. This discussion was accordingly primarily confined
to the field of political sciences, and was not widely used in other fields of social sciences
(such as, sociology and economics) (Kjaer 2004; Lynn 2012).
The situation began to change in the 1980s, driven primarily by shift in the nature and
role of the government in the governance of social and economic activities following the
neoliberal reforms of the times (Bevir 2012). This shift led to a growing interest among
social scientists in understanding the processes of state restructuring and the emerging
new forms of governance (e.g., market and network) in various arenas of social and

27
economic activities, such as, international trade, national-level regulation of the macro-
economy, and industry management (Pierre 2002). This interest resulted in a growing
popularity of the study of ‘governance’, as evidenced by the rising number of publications
on this topic, and its broad coverage (ranging from international relations, to sociology,
to political science, to economics, and to business management) (Kjaer 2004; Levi-Faur
2012). This popularity, ironically, is also a contributing factor to the increasing ambiguity
of the concept of governance because different scholars tend to define governance in
accord with their own intellectual preferences. Several definitions of ‘governance’ have
accordingly emerged in the literature (Peters 2012).
Despite this ambiguity, most studies appear to view governance as patterns of control;
they then focus on the analysis of different aspects of these patterns of control, particularly
structural and implementational (Bevir 2011; Risse 2012). Some studies focus on
analysing the structural aspects of governance. In these studies, governance is normally
defined as a system of formal and informal institutions for controlling human interactions
(i.e., social, political and economic). Some examples of this definition are:
‘institutionalised modes of social coordination’ (Risse 2012), ‘system of rules at all level
of human activity’ (Rosenau 1995), and ‘method through which power is exercised in the
management of a country’s political, economic and social resources for development’
(World Bank 1993a). There are accordingly different types of governance structures.
They include, for example, market or hierarchy (e.g., authoritative control) for governing
economic transactions (Williamson 1975), command and control or public-private
collaboration for regulation (Lobel 2012), and anarchy, autocracy and democracy for
governing political decision-making (Kjaer 2004).

28
Other studies emphasise analysis of the implementational aspects of governance. They
tend to examine the actual processes of governing that are carried out within specific
underlying governance structures. Thus, these studies usually define governance as an
ongoing process of governing human interactions (i.e., social, political and economic).
Some examples of this definition include: ‘all of processes of governing’ (Bevir 2012),
‘processes that support economic activity and economic transactions’ (Dixit 2008), and
‘exercise of economic, political and administrative authority’ (UNDP 1997).
As discussed above, existing literature views governance as patterns of control over
human interactions (i.e., social, political and economic). As also noted above, these
patterns of control encompass two important aspects, namely, structure (i.e., institutions
for governing human interactions) and processes (i.e., actual processes of governing
human interactions within the underlying governance structures). Consistent with this
view, this research defines national governance as a system of structures and processes
for governing social and economic activities (in India), intended to promote the country’s
developmental priorities. This research then seeks to analyse the evolution of national
governance and its influence on shaping the electricity governance as well as the
institutional configurations and performance of the electricity industry.
There exist three broad types of approaches for analysing governance, namely, state-
centred approach, society-centred approach, and state-society relational approach (Bell
and Hindmoor, 2009; Jessop, 2016).
1. The state-centred approach originated from the ideology held by several prominent
political philosophers of the 16th century (such as, Machiavelli, Luther and Bodin),
who stressed the importance of absolute and indivisible power of the state in
governance (Daniel, 2016). It gradually took shape in the 1970s as a response to

29
growing state involvement in socio-economic development in the post-war years
(1950s and 60s) and perceived inadequacies in society-centred explanations (such as,
elitism, pluralism, and Marxism) of this phenomenon (Amenta, 2005; Skocpol, 1985).
This approach is built on Max Weber’s view of the state as an autonomous actor able
to pursue its own goals in governing socio-economic activities of a country (Stepan,
1978). This autonomy is primarily derived from the capacity of the state, not
possessed by other social actors, to make policy decisions, due to its control of
administrative, legal, bureaucratic, and coercive (e.g., police and military) resources
(Kjaer, 2004; Skocpol, 1985). The state-centred approach accordingly tends to focus
on analysing governance as reflective of the autonomy and capacity of the state to
formulate and implement policies to promote its priorities and agendas, such as,
economic restructuring (Evans, 1995; Rueschemeyer and Evans, 1985),
industrialisation (Amsden, 1989; Johnson, 1982), and welfare (Smyth and Wearing,
2002).
2. The society-centred approach traces its origins to Marxism, structure-functionalism,
and pluralism (Kjaer, 2004). The recent academic interest in this approach has an
empirical background in the widespread recognition of the increased influence of non-
governmental actors in socio-economic governance following the neoliberal reform
of the 1990s (Torfing, 2012). The society-centred approach asserts the centrality of
society in the process of governing socio-economic activities of a country. It considers
the state as either ‘an arena’ within which various social actors try to shape the making
of policy decisions in pursuit of their own interests (Dahl, 1961; Miliband, 1969;
Truman, 1951), or an actor that has to share its authority with a range of social actors
(e.g., civil society associations, and interest-groups) in socio-economic governance
(Bevir and Rhodes, 2003; Salamon, 2002). The main focus of this approach is
30
accordingly to analyse the influence of various forms of societal relations and
governance networks (such as, public-private partnerships, strategic alliances, and
inter-organisational networks) in shaping governance (Marsh, 1998; Rhodes, 1997;
Sorensen and Torfing, 2007).
3. The state-society relational approach rejects one sided state- or society-centred
approaches to governance on the grounds that state and society are not separate, polar
opposites (Sellers, 2011). Rather, they ‘are interdependent and interpenetrate in a
multitude of different ways … arguments about which of these factors are more
important tend to divert us from the more important issues of understanding the
complex and changing interaction between state and society’ (Block, 1987, p 21).
This approach accordingly focuses on the analysis of interactions and
interdependency between the state and society in socio-economic governance (Sellers,
2011). It recognises the importance of the state in making policy decisions for
governing socio-economic activities of a nation, but suggests that the governance
capacity of the state largely depends on how it interacts with various social actors
(Jessop, 2016; Kohli, 2002; Migal, 2001). For example, the state could choose to
govern unilaterally through the exercise of ‘despotic’ power. This may however lead
to a loss of state legitimacy, and hence adversely affect its governance capacity (Bell
and Hindmoor, 2009; Hall and Ikenberry, 1989). In contrast, the state could also
choose to govern in partnership with various social actors. This may help the state
acquire greater legitimacy, and consequently improve its governance capacity (Bell
and Hindmoor, 2009). This may however also lead to anomic democracy, in which
‘conflicting goals and specialised interests crowd in one upon another, with
executives, cabinets, parliaments, and bureaucrats lacking the criteria to discriminate
among them’ (Crozier et al., 1975, pp 161).
31
The above discussion suggests that these three approaches tend to have different focus in
the analysis of governance. For example, the state-centred approach focuses on analysing
the role of the state in governance. In contrast, the society-centred approach stresses the
centrality of society in the analysis of governance. The state-society relational approach
rejects this state-society distinction in the analysis of governance. Rather, it focuses on
the influence of state-society interactions in shaping governance.
The state-society relational approach is useful in the context of this paper. This is mainly
because both, the state and society, have important influence in shaping the governance
of socio-economic activities of India. For example, the Indian state remains a critical actor
in formulating and implementing policies for promoting socio-economic development of
the country, despite significant efforts to reduce its involvement in national economy
since 1991, through liberalisation, privatisation, and de-regulation (Chatterjee, 2011). The
capacity of the Indian state to pursue its policies has however often been ‘softened’ by
powerful social actors (such as, business groups, and farmer organisations), who seek to
thwart these policies in pursuit of their own interests and preferences (Harriss, 2013;
Kohli, 1990; Sinha, 2010).
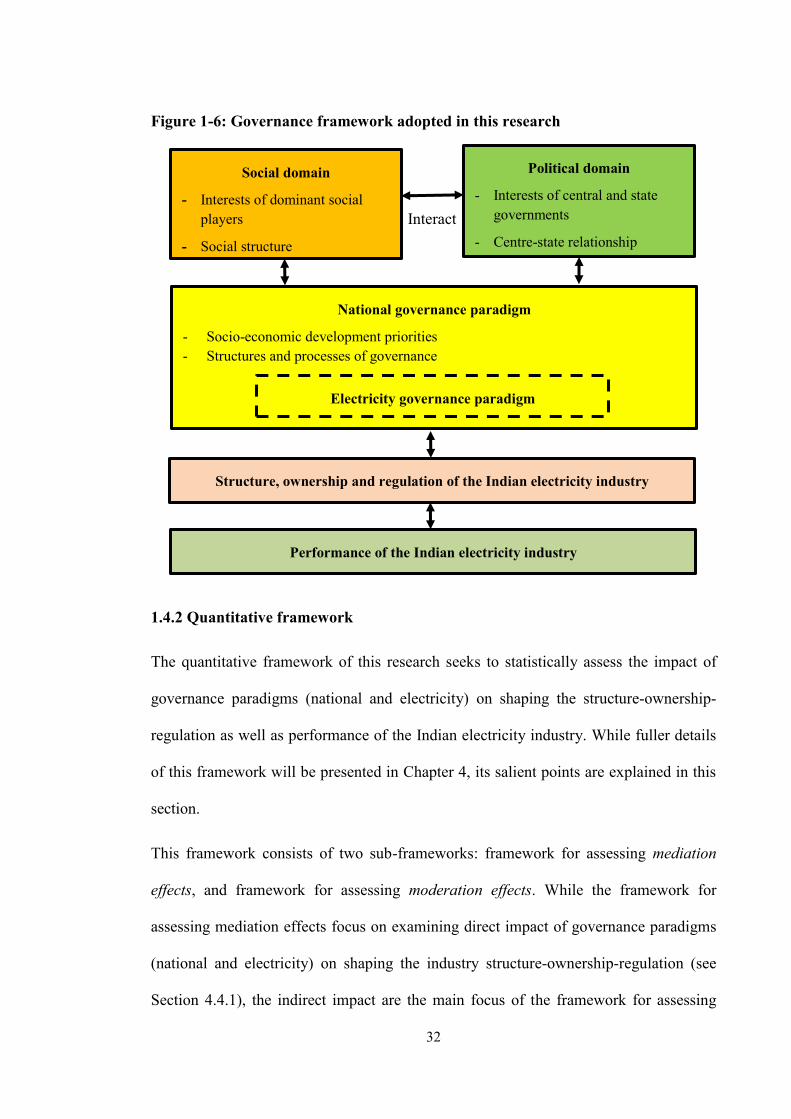
Accordingly, the analytical framework adopted in this paper is built on the state-society
relational approach. This framework analyses how Indian state and society have
interacted with each other over the past decades, how this interaction has shaped the
governance of socio-economic activities of the country, how such national governance
has then shaped the way electricity industry is governed, and finally how electricity
governance has shaped the structure, ownership, and regulation of the industry, thus
influencing its performance. An overview of the broad contours of the qualitative
framework employed in this research is provided in Figure 1-6.
32
Figure 1-6: Governance framework adopted in this research
1.4.2 Quantitative framework
The quantitative framework of this research seeks to statistically assess the impact of
governance paradigms (national and electricity) on shaping the structure-ownership-
regulation as well as performance of the Indian electricity industry. While fuller details
of this framework will be presented in Chapter 4, its salient points are explained in this
section.
This framework consists of two sub-frameworks: framework for assessing mediation
effects, and framework for assessing moderation effects. While the framework for
assessing mediation effects focus on examining direct impact of governance paradigms
(national and electricity) on shaping the industry structure-ownership-regulation (see
Section 4.4.1), the indirect impact are the main focus of the framework for assessing
Political domain
- Interests of central and state governments
- Centre-state relationship
National governance paradigm
- Socio-economic development priorities - Structures and processes of governance
Electricity governance paradigm
Structure, ownership and regulation of the Indian electricity industry
Social domain
- Interests of dominant social players
- Social structure
Interact
Performance of the Indian electricity industry

33
moderation effects (see Section 4.4.2). These two sub-frameworks could assist with
developing an understanding of the direct and indirect effects of governance paradigms
on the Indian electricity industry, particularly its structure-ownership-regulation and
performance. It is in this understanding – this research contends – resides the
understanding of why the Indian electricity industry has persistently performed poorly,
and what could be done to improve its performance.
1.5 Scope of this research
This research focuses on analysis of the influence of India’s governance paradigms
(national and electricity) on the shaping of the contours of the Indian electricity industry
(i.e., its structure, ownership and regulation) as well as the industry performance. This
analysis is carried out in this research from the time of the introduction of electricity in
India (1870s) to the present time. This timeframe encompasses major changes in the
structure, ownership and regulation of the industry. It therefore allows the development
of insights into how these changes have been shaped by the underlying governance
paradigms, and how they have influenced the performance of the industry. These insights
would further contribute to the development of much fuller understanding of the
fundamental causes for the persistent poor industry performance, hence for measures to
improve performance.
1.6 Data considerations
This research is data intensive, and requires a broad range of historical information/data
to develop key lineaments of India’s governance paradigm (national and electricity) and
of the structure, ownership and regulation of the electricity industry. This
information/data is typically embedded in historical and evolutionary accounts of India’s
socio-economic development and electricity industry. This research has collected this

34
information/data from a variety of sources including, for example, government agencies
(e.g., Planning Commission), international development agencies (e.g., the World Bank),
and relevant literature (such as, conference papers, reports, books, and journal articles).
The information/data gaps were filled through data mining and interviews with energy
experts in the country.
1.7 Significance of this research
To the best of knowledge of the author, this research is the first comprehensive analysis
of the influence of India’s governance paradigms (national and electricity) on shaping the
contours of the country’s electricity industry (i.e., structure, ownership and regulation),
and by implication, on industry performance. It represents a point of departure from the
conventional, industry-centric, focus of most existing studies that ascribe industry
performance to the proximate (industry-centric) factors, and hence seek remedies to
improve industry performance within the immediate confines of the industry. The general
approach, adopted in this research, this author contends, would provide meaningful
insights into the ‘fundamental’ causes behind the poor performance of the Indian
electricity industry and contribute to the development of practical policy responses for
improving its performance.
The potential beneficiaries of this research would include: 1) Indian policy makers and
planners who may benefit from the insights provided by this research to make more
informed policy decisions; 2) potential investors who would be able to develop better
appreciation for issues confronting the Indian electricity industry, and hence make more
informed investment decisions; 3) multilateral funding agencies (for example, the World
Bank and Asian Development Bank) which could use the insights gained from this
research to restructure their assistance packages to India in a way that better reflect the
35
Indian realities; 4) academic and research community which can use the methodological
frameworks employed in this research for examining an issue of contemporary
importance in the context of a developing country; and 5) society at large who may find
this research as an effective medium for articulating their viewpoints and addressing their
concerns.
1.8 Organization of this thesis
This thesis comprises of six chapters:
Chapter 2 examines the evolution of national governance paradigm in India and its
underlying drivers. It also analyses the impacts of this paradigm on shaping the
governance paradigm for electricity.
Chapter 3 examines the impacts of governance paradigms (national and electricity) on
shaping the structure-ownership-regulation and performance of the electricity industry in
India.
Chapter 4 statistically assesses the impacts identified in the previous chapters.
Chapter 5 demonstrates how insights gained from previous analyses can be applied to
improve the performance of the Indian electricity industry.
Chapter 6 provides the summary of the main findings of this thesis. It also discusses
limitations of this research and recommendations for future research.

36
2 INDIA’S NATIONAL AND ELECTRICITY GOVERNANCE PARADIGMS
2.1 Introduction
In the previous chapter, a framework is proposed for analysing changes in national
governance paradigm and how these changes have altered the way the Indian electricity
industry is governed. This framework seeks to develop an understanding of the
interactions between the state and society and the effects of these interactions in shaping
India’s governance paradigms (national and electricity). This understanding, it is argued
in the previous chapter, could provide much deeper insights into the causes of poor
performance of the Indian electricity industry, and hence for designing policy
prescriptions for improving industry performance.
This framework (approach) is applied in this chapter to analyse: 1) the evolution of
national governance paradigm and its underlying drivers; and 2) the influence of this
evolution on the shaping of electricity governance paradigm. This analysis is conducted
for four time periods, namely, the colonial period (late 18th century to 1946), the centre-
dominated period (1947 to 1960s), the populist period (1970s to 1980s), and market
reform period (1990s to the present). This timeframe encompasses major changes in
India’s governance paradigms (national and electricity). It therefore allows a meaningful
understanding to be developed of the changes in India’s governance paradigms (national
and electricity) and their effects in shaping the structure, ownership, and regulation of the
industry as well as industry performance.
This chapter is organised as follows. Section 2.2 assesses the historical evolution of the
national governance paradigm and its impacts on the shaping of electricity governance
paradigm. Section 2.3 provides a summary of the major findings of this chapter.

37
2.2 National and electricity governance paradigms in India
2.2.1 Colonial period (late 18th century to 1946)
India’s governance paradigm for socio-economic development in the colonial period (late
18th century to 1946) is referred to as colonial governance in this research. This
governance paradigm emphasised a socio-economic order under which private investors
(especially, British) are allowed to freely pursue their self-interests with minimum
governmental intervention. This pursuit of private interests, it was believed, would
spontaneously generate benefits for the country as a whole. Accordingly, this governance
paradigm strongly favoured: 1) domestic market open to British products and capital; and
2) government presence confined to the provision of basic infrastructure (such as, law,
order, education and roads) for supporting this movement (Ambirajan 1978).
The colonial governance paradigm of the time was imposed on India by Great Britain
through the colonisation process. This colonisation process was primarily informed by
three factors. They include:
1) Trade as an economic necessity. The British colonisation of India was essentially
driven by its business interests in the country. These interests, as argued by Stokes
(1959), were to use colonial control ‘as an instrument for ensuring the necessary
conditions of law and order by which the potentially vast Indian market could be
conquered for British industry’ (Stokes 1959).
Hobson (1902) further explains the underlying momentum behind these business
interests in terms of wealth misdistribution in Great Britain. Hobson argues that the
wealth was increasingly concentrated into a few monopolist organisations (such as,
manufacturers’ associations, cartels, and syndicates) in Britain in the 19th century.
This misdistribution of wealth led to a rapid growth in productive capacity, which was
38
much faster than the growth of domestic consumer demand because these monopolist
organisations were more likely to invest their surplus capital for increasing productive
capacity in search of greater profits, instead of distributing them to the mass
population (e.g., increased salary). This, in turn, created strong incentives for the
country to export the domestically produced surplus capital and products to less
developed regions of the world (Hobson 1902).
Hunt (2002) also expresses similar view that ‘When productive capacity grew faster
than consumer demand, there was very soon an excess of this capacity (relative to
consumer demand), and, hence, there were few profitable domestic investment outlets.
Foreign investment was the only answer’. Hunt further stresses that ‘insofar as the
same problem existed in every industrialized capitalist country, such foreign
investment was possible only if non-capitalist countries could be “civilised”,
“Christianised”, and “uplifted” - that is, if their traditional institutions could be
forcefully destroyed, and the people coercively brought under the domain of the
“invisible hand” of market capitalism. So, imperialism was the only answer’ (Hunt
2002).
2) A feeling of cultural superiority. Many British people believed that their culture was
superior to that of the colonial people. It was therefore an important duty of them (or
the white man’s burden) to impose their customs and traditions on the people they
colonised, even at the cost of war. This would, they believed, further bring about order,
education, peace, and prosperity to the colonised people (O'Brien & Williams 2010).
Palmerston, the then British Foreign Secretary, clearly expressed this belief that ‘I
may say without any vain glorious boast that we stand at the head of moral, social and
political civilisation. Our task is to lead the way and direct the march of other nations’.

39
This would, as argued in a Commons’ Committee report of 1837, provide the
colonised people with ‘the opportunity of becoming partakers of that civilisation, that
innocent commerce, that knowledge and that faith with which it has pleased a gracious
Providence to bless our own country’ (Lynn 1999).
3) Colonial domination. Britain’s colonial domination was built on its military strength,
and more importantly, its accommodation with indigenous and traditional Indian
society, through close collaboration with local dominant castes and other ‘big men’,
to control those below them in the social hierarchy (Burroughs 2001). These local
leaders often exercised administrative control on behalf of the British rulers, and acted
as mediators between the British unitary centre and the local communities in resolving
local issues, such as, tax collection (Krishna 2010). As a result, the traditional patron-
client relationships (such as, caste) between landowning class and local communal
villagers were largely maintained in the colonial period. In these relationships, local
communal villagers were subordinate to landowning class, because landowners
usually had larger wealth and hence greater political influence (Krishna 2010). This
subordination was also legitimised by the basic religio-cultural values of the local
community (Dumont 1970).
Colonial governance paradigm for electricity
Consistent with the wider colonial governance paradigm, between late 19th century and
1946, the India’s electricity governance paradigm mainly focused on the furtherance of
private interests (especially, British). The colonial government assumed a largely passive
role in regulating the electricity industry. This regulatory role mainly included ensuring
general safety of electricity supply and usage, and granting licenses for electricity
undertakings (Kale 2014b). This role was defined in several legislations passed in the late

40
19th century and up to the year 1946. Specific details about some of the key legislations
are presented as follows.
1) The first legislation endeavouring to regulate the use of electricity in India was
enacted in 1887 on the passage of the Electricity (XIII of 1887) Act. This Act mainly
aimed to ensure general safety of electricity for the public. It provided for ‘the
protection of person and property from injury, due to contact with, or proximity of,
appliances or apparatus used in the generation or supply of electricity’ (Garg, Gaha
& Bajaj 2008). It also provided for making rules for preventing telegraph lines from
being affected by electricity appliances or apparatus. Under this Act, any people, who
were intended to undertake electricity business or to use electricity for public purpose
or in public place where there was likelihood of the public being affected, was
required to give at least one week notice to the District Magistrate or the Police
Commissioner (Garg, Gaha & Bajaj 2008).
2) In 1903, the 1887 Act was replaced by the Indian Electricity Act of 1903. This was
aimed to consolidate provisions for regulating electricity supply in the country. This
Act required electricity business to be governed by the terms and conditions of the
license granted by local governments. It also required that the licensee should not
discriminate any consumers in the licensed area (Garg, Gaha & Bajaj 2008).
Many practical problems were witnessed after the passing of the 1903 Act. For
example, the 1903 Act required the sanction of the Governor-General in Council for
the establishment of power systems in ‘cantonments and similar places in the
occupation of Government for naval or military purposes’. But some of these places
‘are situated within larger areas, in respect to which the Local Government is
empowered to grant licenses’. As a result, ‘separate, and not necessarily consistent,

41
licenses have been granted by the Governor-General in Council and the Local
Government, respectively, to the same licensee for the same purpose, in one and the
same place’. This has in turn significantly reduced the interests of private investors in
electricity, ‘as it has hitherto been virtually impossible for a company to obtain a
license under two or three years’, and ‘the financial position may, and in fact
frequently does, change completely between the date of the application and the
granting of the license’ (The Indian Electricity Act 1910).
3) In response to these problems, the 1903 Act was amended and re-enacted as the
Electricity Act of 1910, on 18th March, 1910. The 1910 Act was a comprehensive
legislation to ‘regulate the generation, supply and use of electricity and dealt with
licensing, regulation and safety’. It gave considerable regulatory authority to the local
governments, particularly the granting of licenses related to electricity supply. The
Governor-General in Council was made only responsible for rule-making (Garg,
Gaha & Bajaj 2008).
2.2.2 Centre-dominated period (1947 to 1960s)
The early-to-mid 20th century witnessed considerable turbulences in the global socio-
economic and political landscapes such as, the Great Depression and two World Wars.
These turbulences significantly reduced the military and economic strength of Great
Britain. The British colonial government was no longer able to contain the rising Indian
nationalism led by the National Congress Party (NCP). India eventually attained
independence on 15 August, 1947.
In the years after the independence (1947 to 1960s specifically), India’s national
leadership strongly favoured a socialist governance paradigm in which the government
(especially, central) would control ‘the commanding heights of the economy’, and

42
promote rapid industrialisation of the country, by setting up new public companies in
heavy and infrastructure industries, and by tightly regulating private investments in other
industries (such as, manufacturing industries for producing consumer and intermediate
goods) (Kennedy 2014). Rapid industrial growth, it was strongly believed, would
contribute to self-sufficiency, and eradication of poverty and backwardness (Chatterjee
2010).
This governance paradigm for post-independence socio-economic development is
referred to as centre-dominated governance in this research. It essentially reflected the
vision of development held by the then Indian political leaders, particularly Gandhi and
Nehru. The ability of these political leaders to pursue their developmental vision was built
upon the Congress Party’s political dominance of the time. Details are discussed as
follows.
1) Gandhism: Gandhism is a body of ideas based on Mohandas Gandhi’s (the preeminent
leader of the Indian Independence Movement) vision of development. To Gandhi,
development is not just material or economic; it has to be moral. It should be able to
instil the values of equality, harmony and freedom in the people (Thakker 2011).
These values could however be undermined by market capitalism, because this model
of development ‘is exploitative in nature and generates inequalities and conflicts, and
all these evils of transformational growth are accentuated under a dependency type of
development’ (Ghosh 2007). Gandhism accordingly seeks to develop an alternative
model for India’s development. It views social harmony, self-sufficiency, and
cooperation as alternatives to competition and class conflicts. It also emphasises the
eradication of poverty, social conflicts, and backwardness in India (Frankel 2005).
Gandhism laid the ideological basis for the post-war socio-economic development of

43
India, by focusing the attention of the Congress Party leaders on moral aspects of
development.
2) Nehruism: The practical guidance for India’s postcolonial development came
primarily from the beliefs held by Jawaharlal Nehru, India’s first prime minister after
independence. Nehru strongly believed in large-scale industrialisation, and viewed it
as the best way of achieving self-sufficiency, poverty reduction and improved living
standard (Parekh 1991). As Nehru put it, ‘It can hardly be challenged that, in the
context of the modern world no country can be politically and economically
independent, even within the framework of international interdependence, unless it is
highly industrialised and has developed its power resources to the utmost. Nor can it
achieve or maintain high standards of living and liquidate poverty without the aid of
modern technology in almost every sphere of life. An industrially backward country
will continually upset the world’s equilibrium and encourage the aggressive
tendencies of more developed countries’ (Nehru 1946, p. 413).
Nehru’s beliefs in large-scale industrialisation also came from cultural considerations.
To Nehru, the ‘very basic problem’ of India was agriculture. Agriculture, as argued
by Nehru, ‘is a primitive and culturally inferior activity. It heavily relies on the forces
of nature, and makes people a plaything of nature’. This encourages ‘fatalistic’ and
‘obscurantist’ ways of thought. These ways of thought, in his view, ‘fragmented the
country, confined the vision of the people to the narrow limits of his village, and are
a breeding ground of ignorance, traditionalism, passivity, narrow-mindedness and
superstition’ (Parekh 1991). Large-scale industrialisation is the means not only to
deliver material development (such as, poverty reduction and better living standards),
but also to change these ‘antiquated’ ways of thought (Parekh 1991).

44
As influenced by Nehruism, the main current of intellectual thought of the Indian
government stressed the need for the formation of a developmental state which
intervened in the economy, planning and guiding the industrialisation programs, and
trying directly to promote the welfare of the population (Roy 2012). For example, the
Ministers of Industries met in Delhi in 1938 and adopted a resolution which said,
‘This conference … is of the opinion that the problems of poverty and
unemployment…cannot be solved without industrialisation. As a step towards such
industrialisation, a comprehensive scheme of national planning should be formulated.
This scheme should provide for the development of heavy key industries, keeping in
view our national requirements, the resources of the country, as also the peculiar
circumstances prevailing in the country’ (Mishra 2014).
3) Political domination of the Congress Party. The Indian politics in the 1950s and 60s
was dominated by the Congress Party. The Party ran governments at the centre as
well as in the states. For example, in the first three general elections after
independence, the Congress Party won about 45 per cent of the votes and 75 per cent
of the seats in the Parliament. The largest opposition parties (such as, the Socialist
party in 1951, the Praja Socialist party in 1957, and the Communist party in 1962)
could only manage about 10 per cent of the votes and less than 5 per cent of the seats
in the Parliament. Besides, the Congress Party also won elections in nearly all Indian
states until 1967. The only exception was Jammu and Kashmir, where the National
Conference party was the ruling party after the 1951 election. But its party leaders
were removed in 1953. After that, this party virtually became part of the Congress
Party (Mitra 2011a; Sridharan 2010).

45
This political dominance could be explained partly by the Party’s widespread
popularity, derived from the nationalist legacy and the hope that the Party would be
able to improve the welfare of the population, and partly by the Party’s incorporation
within its own organisation of the society’s traditional authority in various localities,
such as, high castes, village leaders and landowners (Kohli & Singh 2013). The
Congress Party used the inherited influence of these local leaders to garner votes in
the local communities. In exchange for bringing in vote, these local leaders were
provided with privileged access to agencies of the government. When ordinary
villagers need to make contact with government officials, they would have to do it
through the meditation of their village leaders. Thus, the dominant position of these
leaders was preserved. Their dominant position was also bolstered by letting
development benefits from government-financed projects (such as, employment) pass
as patronage through their hands (Krishna 2010).
The dominance of a single party, this research argues, ensured policy consistency and
coherency in the 1950s and 60s. This is so because the central government was heavily
reliant on the state governments for the implementation of its policies; a strong
political centre could bring the state governments under effective central control
through the exercise of party discipline, hence a relatively smooth implementation of
centre-led development programs (Hardgrave 1970).
Centre-dominated governance paradigm for electricity
The centre-dominated governance paradigm, in the context of the electricity industry,
meant the government (especially, central) assuming the lead in developing the industry,
and using electricity as a vital input to support the country’s large-scale industrialisation
46
programs. As argued by Dr. Bhimrao Ramji Ambedkar, the chair of the committee on
public utilities and electricity:
‘It is necessary that those who are placed in charge of the subject should have the
fullest realisation of (electrification’s) significance and its objective. If you agree
with me in this, I will request you to ask yourselves the question, “Why do we want
cheap and abundant electricity in India?” The answer is that without cheap and
abundant electricity no effort for the industrialisation of India can succeed. This
answer brings out only a part of the significance of the work this Committee has to
undertake. Ask another question, “Why is industrialisation necessary?” and you will
have the full significance made clear to you at once; for the answer to the question
is, we want industrialisation in India as the surest means to rescue the people from
the eternal cycle of poverty in which they are caught’ (Kale 2014a).
The central role of the government in developing the electricity industry was envisioned
in the Electricity (Supply) Act of 1948. According to this Act, the central and state
governments share the responsibilities of developing the Indian electricity industry. At
the central level, the 1948 Act provided for the establishment of the Central Electricity
Authority (CEA), responsible for providing board guidance and coordination. The Act
also mandated the creation of State Electricity Boards (SEBs) at the state levels. The SEBs
were mainly charged with the responsibility of operating electricity system within each
state, and of controlling and regulating other electricity undertakings (mostly, private
licensees) (World Bank 1979).
Despite this, central authority usually overrode state authorities, especially under the
dominating central government of the time (Tongia 2009). This was further assisted by
the fact that the central government was a major source of electricity finance and played

47
dominant role in infrastructure planning (including, power) (Henderson 1975). As a result,
electricity was often used as a tool to promote the country’s large-scale industrialisation
programs. As shown in Table 2-1, for instance, industrial sector was overwhelmingly the
major single consumer of electricity in the 1960s, accounting for more than 70 per cent
of total electricity consumption in the country.
The industrial sector also received electricity at subsidised rates. As shown in Table 2-2,
in 1971-72, average electricity tariffs for industrial consumers were 10.6 paise per kWh.
They were low as compared to 15.5 paise per kWh for agricultural consumers, 30.5 paise
per kWh for domestic consumers, and 31.3 paise per kWh for commercial consumers.
Table 2-1: Electricity consumption by sector (%)
1960/61 1965/66 1970/71
Industry 73.7 72.8 70.0 Agriculture 4.9 6.3 9.2 Domestic 8.8 7.8 7.9 Commercial & government 5.0 5.5 5.3 Railway 2.7 3.5 2.8 Public lighting 1.0 0.9 1.0 Others 3.8 3.2 3.3
Source: Henderson (1975)
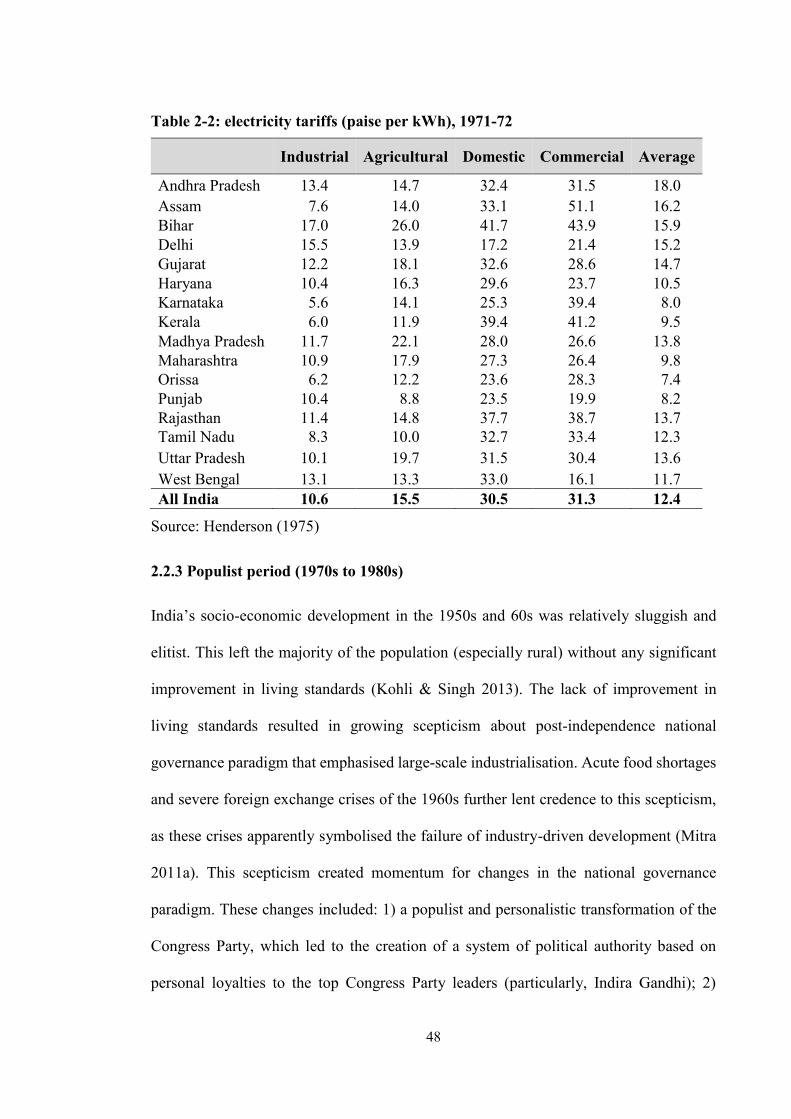
48
Table 2-2: electricity tariffs (paise per kWh), 1971-72
Industrial Agricultural Domestic Commercial Average
Andhra Pradesh 13.4 14.7 32.4 31.5 18.0 Assam 07.6 14.0 33.1 51.1 16.2 Bihar 17.0 26.0 41.7 43.9 15.9 Delhi 15.5 13.9 17.2 21.4 15.2 Gujarat 12.2 18.1 32.6 28.6 14.7 Haryana 10.4 16.3 29.6 23.7 10.5 Karnataka 05.6 14.1 25.3 39.4 08.0 Kerala 06.0 11.9 39.4 41.2 09.5 Madhya Pradesh 11.7 22.1 28.0 26.6 13.8 Maharashtra 10.9 17.9 27.3 26.4 09.8 Orissa 06.2 12.2 23.6 28.3 07.4 Punjab 10.4 08.8 23.5 19.9 08.2 Rajasthan 11.4 14.8 37.7 38.7 13.7 Tamil Nadu 08.3 10.0 32.7 33.4 12.3 Uttar Pradesh 10.1 19.7 31.5 30.4 13.6 West Bengal 13.1 13.3 33.0 16.1 11.7 All India 10.6 15.5 30.5 31.3 12.4
Source: Henderson (1975)
2.2.3 Populist period (1970s to 1980s)
India’s socio-economic development in the 1950s and 60s was relatively sluggish and
elitist. This left the majority of the population (especially rural) without any significant
improvement in living standards (Kohli & Singh 2013). The lack of improvement in
living standards resulted in growing scepticism about post-independence national
governance paradigm that emphasised large-scale industrialisation. Acute food shortages
and severe foreign exchange crises of the 1960s further lent credence to this scepticism,
as these crises apparently symbolised the failure of industry-driven development (Mitra
2011a). This scepticism created momentum for changes in the national governance
paradigm. These changes included: 1) a populist and personalistic transformation of the
Congress Party, which led to the creation of a system of political authority based on
personal loyalties to the top Congress Party leaders (particularly, Indira Gandhi); 2)

49
provision of welfare packages to the country’s poor people (such as, low caste peasants,
factory workers or women) in ways that created an impression that they were a gift from
the central leadership, Indira Gandhi in particular; and 3) a shift in developmental priority
from large-scale industrialisation to accelerated agricultural production by using new
technologies (e.g., high-yielding crops) and price subsidies (Kaviraj 1986; Kohli & Singh
2013; Varshney 1995).
The national governance paradigm that emerged from these changes is referred to as
populist governance in this research. The creation of this paradigm was inspired by a
combination of social and political factors. They include:
1) Growing social activism. India experienced growing social activism in the late 1960s
and early 1970s (Baviskar 2010). For example, in 1967, a locally-organised peasant
movement arose in Naxalbari in the eastern state of West Bengal. This movement
advocated ‘land to tiller’ programs, and a violent overthrow of the state government
and local landowners by peasants and rural labourers. While it was brutally supressed
by the West Bengal government, its influence extended to many other areas of the
country, particularly in the states of Bihar, Andhra Pradesh, Chhattisgarh, Jharkhand,
and Maharashtra (Baviskar 2010).
Besides, the early 1970s also witnessed several large-scale labour protests. In 1974,
for instance, railway workers organised a massive country-wide strike; they
demanded a raise in salary, in the backdrop of declining incomes and rising inflation.
This strike lasted for 20 days, and was crushed by a huge police and paramilitary
operation; thousands of workers were sent to jail and lost their jobs (Sherlock 1989).
In addition, there were also widespread anti-corruption protests in many parts of the
country (especially, in the states of Bihar and Gujarat). These protests were initially

50
led by students, but soon became a popular nationwide anti-corruption movement.
This movement later escalated into a call for ‘total revolution’ at a huge rally in New
Delhi on 25 June 1975, claiming that the government had lost all moral claims to rule.
Later that night, a state of emergency was promulgated by the government, resulting
in many opposition leaders and tens of thousands of activists from all over the country
being arrested (Baviskar 2010).
This growing social activism essentially reflected the gradual erosion of traditional
social authority, that had in the past enabled local influential people (such as, high
castes and village leaders) to control those below them in the social hierarchy (Kohli
1990). New social actors (such as, students, industry workers, and peasants and rural
labours) entered the political domain and began to press diverse demands upon the
government, such as, anti-corruption, raise in salary and working conditions, and land
reforms (Baviskar 2010). In order to maintain social and political stability, the central
leadership sought to accommodate at least rhetorically and symbolically diverse
social demands by personalistic and populist policies (Kohli & Singh 2013).
2) Internal conflicts of the Congress Party. As argued by Kaviraj (1986), Indira Gandhi’s
accession to power was not due to ‘either political support, control over party
machinery, personal charisma or personal intrigues’. Rather, it was due to ‘her
weakness, and the fact that she was not too strongly associated with any policy line
to give offence to any of the groups which dominated the polycentric structure of the
Congress party after Nehru’s death’. Accordingly, her rise to power essentially
reflected a stalemate between dominant factional interests within the Congress Party.
These factional interests believed that ‘she would make way after sometime for

51
someone with clearer policy preferences, or if she survived, she could be encouraged,
pressured or cajoled into line’ (Kaviraj 1986).
It is therefore understandable that the primary objective of Indira Gandhi after seizing
power was to consolidate political control, by creating a new system of authority
based on personal loyalties to her, bypassing the old party elites (i.e., the upper-caste
intelligentsia, business community and landowners) (Kaviraj 1986). New candidates
were selected from among locally prominent and influential wealthy persons (such as,
rich farmers) who could finance and win elections (Tenhunen and Saavala 2013).
These new state and local Party leaders, as argued by Kaviraj (1986), ‘were more in
the nature of political “contractor” who were willing to go to any length to dragoon
votes, systematically replacing discursive techniques with money and subtle forms of
coercion’ (Kaviraj 1986).
Populist governance paradigm for electricity
Consistent with the populist governance paradigm, the 1970s and 80s witnessed a gradual
shift in India’s developmental policies towards populism, focusing on satisfying the
demands of various social groups (such as, farmer associations), by distributing public
resources and privileges to these groups. The electricity industry was considered as an
important instrument for subserving these policies. For example, it was common for the
state governments to require the State Electricity Board (SEBs) to provide electricity
subsidies (e.g., low electricity tariffs) to agricultural consumers, even though the costs of
serving remote rural areas were high (Dubash & Rajan 2001). Wealthy large and
intermediate farmers were the main beneficiaries of these subsidies. This is mainly
because these wealthy farmers, though small in number, were usually ‘the patriarchs of
their clans and communities and functioned as political intermediaries who could deliver

52
blocs of votes to their favoured political party’ (Lal 2005). It would be therefore very
risky for local political parties to alienate the demands of these powerful wealthy farmers,
in the backdrop of mounting democratic activism and volatile swing votes in the 1970s
and 80s (Lal 2005).
2.2.4 Market reform period (1990s to the present)
The 1980s saw a considerable increase in the Indian government’s fiscal deficit. The
deficit reached more than 10 per cent of the GDP in the late 1980s, due primarily to
escalating public expenditure on interest repayments on commercial borrowings, large
amount of subsidies for targeted beneficiaries in agriculture and industry, and rising
defence expenditure (Ganguly & Mukherji 2011). The balance-of-payment crisis broke
out in 1991, as the government could not guarantee its debt repayments, and the
international banks lost their confidence in the country. This crisis was further
exacerbated by the collapse of India’s important trade partner (the Soviet Union) in 1990,
and rising oil bills in the early 1990s caused by the Iraq War (Tenhunen & Saavala 2012).
In response, India turned to the International Monetary Fund (IMF) for financial
assistance to avoid defaults on loans. As part of the conditions for receiving such
assistance, the Indian government agreed to implement market reforms (Weinraub 1991).
These reforms were primarily based on neoliberal ideology that state-centric governance
paradigm is inherently inefficient, due to bureaucratic inefficiencies, lack of market-
styled incentives, and highly political bias, especially of strong interest groups (Harvey
2005). Neoliberalism accordingly suggested a rollback of the state, limiting itself to
‘steering’ the policy development processes for socio-economic development and leaning
the rest to the market. It specifically emphasised the replacement of the state by an
entrepreneurial system based on market competition and private ownership (Bevir 2009).
53
Such market-oriented governance paradigm, neoliberalists argued, would achieve
optimum economic performance with respect to efficiency, economic growth, and
technical progress. This would then lead to improved living standards for the population
(Harvey 2005).
The Indian government started to implement neoliberal reform in 1991. Some key
components of these reform programs included: financial and trade liberalisation (such
as, removal of exchange rate controls and trade restrictions), reduction of public deficit
by cutting public expenditure and privatisation of public-owned companies, dismantling
of the industrial licensing system (i.e., licence Raj), and gradual removal of protection in
selected sectors (such as, industry, infrastructure and agriculture) (Shylajan, Sreejesh &
Suresh 2011).
These reform programs have however only been partially implemented. In some areas
(such as, encouragement of private investment), reforms have been implemented with
relative ease, while in others (particularly, removal of protection in agriculture) there have
been strong resistance; the progress of reform has therefore been slow (Mitra 2011a). This
partial implementation of market reform is essentially reflective of mixed views on this
type of reform in India. Some points to support this observation are presented below.
1) Strong rural resistance to reform. The resistance to reform mainly came from rural
elites (such as, rich peasants and capitalist farmers), who had come to rely on
enormous quantities of low-cost electricity for pumping water, fearing that market
reform would lead to the removal of electricity subsidies that the government
currently provide to them (Lal 2005). This resistance was often expressed as part of
rural opposition to the economy-wide reforms. For example, the Karnataka Rajya
Ryot Sangha (KRRS), one of India’s major farmer organisations, led a number of

54
protests against market liberalisation in the early 1990s. Market liberalisation, it was
argued, is part of the larger strategy of international capital for ‘trapping India in the
vicious circle of exploitation and converting her into a neo-colony’ (Assadi 1997, p.
530). It would, the argument continued, adversely affect Indian agriculture by, for
example, a gradual withdrawal of agricultural subsidies and price support,
introduction of seed-manufacturing multinational companies that will destroy the
autonomy of Indian farmers, and use of genetically-modified food that has the
potential to destroy India’s biodiversity (Assadi 1997).
Similar protests were witnessed in several other states. For example, the Bharatiya
Kisan Union (BKU) of Punjab staged a protest in New Delhi in 2004. This protest
was against the reduction of government’s price support on cotton crops. In Rajasthan,
the Kisan Mazdoor Vyapari Sangh (KMVS) organised several large-scale protests in
2006 against rising electricity and water tariffs (Pai 2010).
Further justification for this rural resistance to reform came from rising farmer
suicides in the country. Farmer suicides were considered as a product of ‘a crisis
rooted in economic reforms’, that is, in the shift in agricultural governance due to
market liberalisation (Patnaik 2004; Rao 2004). For example, in 1998, more than
1,000 farmers from Andhra Pradesh staged a massive protest in New Delhi. This
protest was organised by the Rytanga Atmahatyala Nivarna Aikya Porata Vedika
(Platform for United Struggle to Prevent the Suicide of Farmers) of the southeast state
of Andhra Pradesh. They submitted a memorandum to the Lok Sabha (lower house of
the Indian Parliament), which argued that the farmer suicides were primarily caused
by market reform pursued by the central government for the last seven years (Pai
2010).

55
2) Growing political regionalism. Strong rural resistance to reform was also encouraged
by growing political regionalism. Since 1989, no national party could win majority in
the Parliament alone. Rather, they always needed to collaborate with state parties to
form coalition government. This led to a weakened central government on one hand
and increasingly empowered state governments on the other hand (Chatterjee 2010).
Given the relatively strong influence of the landed elites (such as, rich peasants and
capitalist farmers) on the state governments, it became difficult for the state
governments to fully implement market reform, especially in rural areas (Mitra
2011b).
3) Increasing business influence in policy-making. A considerable increase in the
influence of domestic business groups in policy-making (especially, at the central
level) has been witnessed since the 1980s (Chatterjee 2010). For example, it was
observed that the central government has regularly consulted with domestic business
groups (especially, national business associations, such as, the Federation of Indian
Chambers of Commerce & Industry, the Confederation of Indian Industry, and the
Associated Chambers of Commerce and Industry of India) on economic and trade
policies (Sinha 2010).
There are two contributory factors for this increased business influence on policy-
making. One, post-war industrialisation created new business groups in engineering,
metals, and chemicals, etc. While the economic strength of these new business groups
grew, they found that their further growth was constrained by the fact that access to
key resources (e.g., capital) was controlled by the country’s economic planners, who
naturally favoured traditional business groups, which had a proven track record and
established connections with the government. This in turn created incentives for these

56
new business groups to gain political power, with the aim of influencing the economic
planners’ decisions (Chibber & Usmani 2013).
Two, the political influence of these business groups was further strengthened by a
widely held view by the Indian society that the 1970s is a lost decade due to economic
stagnation. This view significantly increased the leverage of groups (such as, major
business groups, and some bureaucratic and political leaders) that were critical of
state-centric economic planning, because the disappointing economic outcomes of the
1970s provided them with larger scope for criticising state-centric economic planning
(Chibber & Usmani 2013).
The increased business influence in policy-making contributed to a fair degree of
policy coherence and stability, especially in some key areas such as market
liberalisation in the urban areas. This is so because domestic business groups had a
clear policy preference for market liberalisation and privatisation of public companies,
as this would lead to dismantling of controls and regulations on domestic investment,
and hence open new profit-making opportunities for them (Chibber & Usmani 2013;
Kohli & Singh 2013).
Partial market-oriented governance paradigm for electricity
Consistent with the country’s wider shift towards market-oriented governance paradigm,
several legislative changes were made in the 1990s and 2000s to reduce the role of the
government in the electricity industry. For example, the Electricity Act of 1948 was
amended in 1991, to allow private participation in generation, in the form of independent
power producers (IPPs). In 1998, the central government passed the Electricity
Regulatory Commissions Act of 1998. This Act set up the Central Electricity Regulatory
Commission (CERC), responsible for regulating central government owned utilities and

57
matters related to interstate exchange of electricity. It also provided for the creation of
State Electricity Regulatory Commissions (SERCs). The SERCs are extensions of the
CERC at the state level, responsible for rationalising retail tariffs, regulating wholesale
and network prices, and intrastate matters (such as, intrastate electricity trading) (Garg,
Gaha & Bajaj 2008). In 2003, the central government enacted the Electricity Act of 2003.
This Act sought to deepen and formalise electricity market reforms that were already
underway in some regions. Key elements of this Act included: introduction of market
competition, open-access to networks, and free entry of new power generators (Pargal &
Banerjee 2014).
These legislative changes led to the implementation of electricity market reforms that
emphasised private ownership, market mechanisms for electricity trading, elimination of
subsidies and price control, and sector-specific regulator for overseeing the operation of
power systems (Tongia 2009). The progress of this reform has however been quite slow
(especially, in the rural areas) due to strong political resistance. For example, when the
governments initiated pricing reforms, they were usually faced with vocal and organised
agricultural sector that viewed removal of electricity subsidies and market-based
electricity pricing as detrimental to its interests (Joseph 2010). Thus, although reforms of
the State Electricity Boards (SEBs) had begun and regulatory agencies were set up in
every state, the reforms remain largely ineffective. As argued by the World Bank, ‘Boards
remain state-dominated, lack sufficient decision-making authority in practice, and are
rarely evaluated on performance. Political interference in appointments to and by the
board and in decision making on business aspects remains common, and board member
training and peer evaluation are conspicuous by their absence’ (Pargal & Banerjee 2014).

58
2.3 Summary
This chapter has shown that the national governance paradigm in India was informed by
various political, socio-economic and cultural influences, arising from the interactions
between the Indian society and the state (see Table 2-3). This chapter has also shown that
the electricity governance paradigm was essentially a reflection of the underlying national
governance paradigm. Some key findings of this chapter are summarised as follows.
India’s national governance paradigm in the colonial period (late 18th century to 1946),
referred to as colonial governance in this research, emphasised a socio-economic
order under which colonisers were allowed to freely pursue their self-interests with
minimum governmental intervention. This pursuit of colonial interests, it was
believed, would spontaneously generate benefits for the colonising countries.
Accordingly, this governance paradigm strongly favoured: 1) domestic market open
to British products and capital; and 2) government presence confined to the provision
of basic infrastructure (such as, law, order, education and roads) for supporting this
movement.
Britain’s colonial domination was built on its military strength, and more importantly,
its accommodation with indigenous and traditional Indian society, through close
collaboration with local dominant castes and other ‘big men’, to control those below
them in the social hierarchy.

59
Table 2-3: Evolution of the national governance paradigm and its underlying influences
Colonial period
(late 18th century ~ 1946)
Centre-dominated period
(1947 ~ 1960s)
Populist period
(1970s ~ 1980s)
Market reform period
(1990s ~ the present)
Nat
iona
l gov
erna
nce
para
digm
Colonial governance Centre-dominated governance Populist governance Partial market-oriented governance
- Emphasis on the pursuit of colonial interests
- Domestic market opening to colonial products and capitals
- Government presence confined to the provision of basic infrastructure, such as, law, order, education, and roads
- Tight public (especially, central) control of the economy
- Rapid industrialisation
- Accelerated agricultural production
- Provision of welfare packages to targeted social groups
- Emphasis on market competition and private ownership
- Reduced scope for government involvement in socio-economic development
- Partial implementation due to strong resistance
Und
erly
ing
influ
ence
s
- British business interests
- A feeling of cultural superiority
- British colonial domination
- Close collaboration with local dominant castes and village leaders
- Gandhism that emphasised moral aspects of development
- Nehruism that stressed the importance of industrialisation in promoting social and economic development
- Political dominance of a single party
- Incorporation within party organisation of the society’s traditional authority
- Food shortages and lack of improvement in living standards
- Gradual erosion of traditional social authority in the local community
- Rising social activism
- Factional fights within the Congress Party
- Mixed views on reform
- Support from domestic business groups
- Opposition from farm organisations
- Growing political regionalism with weakened central government and increasingly empowered state governments

60
Consistent with the wider colonial governance paradigm, between late 19th century
and 1946, electricity governance paradigm in India mainly focused on the furtherance
of business interests (especially, British). The colonial government assumed a passive
role in regulating the electricity industry. This regulatory role was confined to
ensuring general safety of electricity supply, and issuing licenses to electricity
undertakings.
India attained independence on 15 August 1947. In the years after the independence
(1947 to 1960s), the country’s national leadership strongly favoured a socialist
governance paradigm in which the government (especially, central) controlled ‘the
commanding heights of the economy’, and promoted rapid industrialisation by
creating public companies in industrial and infrastructure sectors, and by tightly
regulating private investments in other industries (such as, manufacturing). This, it
was strongly believed, would lead to self-sufficiency and the eradication of poverty,
unemployment and backwardness.
This post-independence governance paradigm for socio-economic development,
referred to as centre-dominated governance in this research, derived its ideological
basis from Gandhism that focused the attention of Congress Party leaders to moral
aspects of development (such as, employment creation and elimination of inequity).
Its practical guidance came from the vision of development held by Jawaharlal Nehru,
India’s first prime minister after independence. He had a strong belief in large-scale
industrialisation, and viewed it as the best way to achieve self-sufficiency, poverty
reduction and improvement in living standards.
The ability of the Congress Party to establish its perceived national governance
paradigm was built on the Party’s political dominance of the time. This political

61
dominance was built upon the Party’s widespread popularity, derived from its
nationalist legacy, and its incorporation within its own organisation of the society’s
traditional authority in various localities, such as, high castes, village leaders, and
landowners.
The centre-dominated governance paradigm, in the context of the electricity industry,
meant the government (especially, central) assuming the lead in developing the
industry, and using electricity as a vital input to support the country’s large-scale
industrialisation programs.
A combination of economic stagnation, severe food shortages, and lack of
improvement in living standards created momentum for changes in national
governance paradigm. The changes included: 1) a populist transformation of the
Congress Party, leading to the creation of a system of political authority based on
personal loyalties to the top Congress Party leaders; 2) provision of welfare packages
to the country’s poor people in ways that created an impression that they were the gift
from the central leadership; and 3) a shift in developmental priority from
industrialisation, to accelerated agricultural production, using new technologies and
subsidies.
The national governance paradigm that emerged from these changes is referred to as
populist governance in this research. The primary motivation for this governance
paradigm was growing social activism in the late 1960s and early 1970s. In order to
maintain political stability, the central leadership sought to accommodate (at least
rhetorically and symbolically) diverse social demands by personalistic and populist
policies. This accommodative strategy was also motivated by factional fights within
the Congress Party, between the central leadership and old party elites (such as, the

62
upper-caste intelligentsia, business community and landowners). This strategy created
a system of authority based on personal loyalties to the central leadership, bypassing
the old party elites.
Consistent with the populist governance paradigm, the 1970s and 80s witnessed a
gradual shift in India’s developmental policies towards populism, focusing on
satisfying the demands of various social groups (such as, farmer associations), by
distributing public resources and privileges to these groups. The electricity industry
was considered as an important instrument for subserving these policies.
The 1980s saw a considerable increase in India’s fiscal deficit. Faced with a severe
balance of payment crisis, the Indian government agreed to implement market reform
in the early 1990s, as the condition of receiving financial assistance from the IMF.
This reform was primarily based on neoliberal ideology that considered state-centric
governance as inherently inefficient, due to bureaucratic inefficiencies, lack of
market-styled incentives, and highly political biases, especially of strong interest
groups. Neoliberalism accordingly suggested a rollback of the state, limiting its role
to ‘steering’ socio-economic development. This market-oriented governance
paradigm would then achieve optimum economic performance with respect to
efficiency, economic growth, and technical progress, resulting in improved welfare
of the population, the argument continued.
The market reforms have however only been partially implemented. This essentially
reflects mixed perceptions on reform in India. On the one hand, the domestic business
groups strongly supported market reform based on the belief that it would lead to a
dismantling of controls and regulations on domestic investment, and open new profit-
making opportunities for them. This, assisted by increased business influence at the

63
central level, resulted in a fair degree of policy coherence and stability, especially in
the areas of market liberalisation. On the other hand, market reform faced strong rural
resistance, due to the fear that it would adversely affect rural interests (e.g., removal
of electricity subsidies). Given the relatively greater influence of landed interests on
state governments, the implementation of market reform has been quite slow at the
state levels.
As part of the country’s wider shift towards market-oriented governance paradigm,
several legislative changes were made in the 1990s and 2000s to reduce the
government’s role in the electricity industry. These changes led to the implementation
of electricity market reform that emphasised private ownership, market mechanisms
for electricity trading, elimination of subsidies and price control, and establishment
of sector-specific regulators for overseeing the operation of the power systems. The
progress of this reform has however been quite due to strong rural resistance.
The above discussion suggests that the electricity governance paradigm in India, over the
four distinctive time periods (namely, colonial, centrist, populist, and neo-liberal), have
predominately been shaped by the underlying governance paradigm for socio-economic
development of the country. Further, the discussion also suggests that underlying national
governance paradigm of a time is essentially reflective of the dominant political and
socio-economic interests of the time. This suggests that electricity governance is merely
a process of serving dominant political and socio-economic interests of the time. In such
environments, consideration of industry performance assumed a dormant role. Poor
industry performance is therefore a ‘natural’ outcome. This viewpoint is further discussed
in Chapter 3 of this thesis, through an analysis of the impact of governance paradigms

64
(national and electricity) on the structure-ownership-regulation as well as performance of
the Indian electricity industry.

65
3 INDUSTRY STRUCTURE-OWNERSHIP-REGULATION AND
PERFORMANCE
3.1 Introduction
As shown in the previous chapter, the electricity governance paradigm in India has
historically been shaped by the underlying governance paradigm for socio-economic
development of the country, which in turn derived its legitimacy from the dominant
political and socio-economic interests of the time. This suggests that electricity
governance is merely a process of serving dominant political and socio-economic
interests of the time. This, it is argued in this chapter, has made issues of industry
performance subordinate to broader political and socio-economic interests. Poor industry
performance is therefore a natural outcome.
The veracity of this argument is assessed in this chapter, through an analysis of changes
in the structure-ownership-regulation of the Indian electricity industry, as guided by the
underlying electricity governance paradigm, and how these changes have affected the
industry performance. This analysis is conducted for four time-periods, to coincide with
major changes in the structure-ownership-regulation of the Indian electricity industry.
These time periods are: the colonial period (late 19th century to 1946), the centre-
dominated period (1947 to 1960s), the populist period (1970s and 80s), and the market
reform period (1990s to the present). The analyses of structural, ownership and regulatory
changes in these four-time periods – this research argues – will allow a meaningful
understanding to be developed of the nature of these changes, how they have been shaped
by the underlying electricity governance paradigm, and what is their impact on industry
performance.

66
This chapter is organised as follows. Section 3.2 assesses the impact of electricity
governance paradigm on the industry structure-ownership-regulation and performance.
Section 3.3 summarises the major findings of this chapter. Some broad conclusions of the
chapter are also presented in this section.
3.2 Industry structure-ownership-regulation and performance
This section provides an overview of the key lineaments of the structure-ownership-
regulation and performance of the Indian electricity industry, with the view to assess the
impact of electricity governance paradigm on these lineaments.
3.2.1 Colonial period (late 18th century to 1946)
Consistent with the wider colonial governance paradigm of the times, between late 19th
century and 1946, electricity governance paradigm in India largely emphasised the
furtherance of private interests (especially, British). The colonial government assumed
only a passive role in regulating the electricity industry, with regulation primarily
confined to the areas of safety and licensing (see Section 2.2.1). This electricity
governance paradigm led to the development of electricity industry typified by highly
fragmented structure, predominately private ownership, and minimal regulation.
Structure, ownership and regulation
The electricity governance paradigm of the times (i.e., colonial) provided private
investors (especially, British) with the freedom to exploit potential business opportunities
associated with electricity. The government assumed only a passive role in regulating the
electricity industry. This role was primarily confined to the areas of safety and licensing.
For example, the electric utilities were regulated to protect ‘person and property from
injury, due to contact with, or proximity of, appliances or apparatus used in the generation

67
or supply of electricity’. They were also regulated to ‘prevent telegraph lines from being
affected by electricity appliances or apparatus’ (Garg, Gaha & Bajaj 2008). Besides,
electric utilities were required to obtain licenses for supplying electricity to any area or
individual. The licensee had the monopolistic right of supplying electricity to its
franchised area. There was no tariff regulation on licensee. Each licensee was required to
maintain accounts in a format prescribed in the license. These accounts would be
regularly inspected by the government to prevent the licensee from abusing its monopoly
power (Sankar & Ramachandra 2000).
Electricity was firstly introduced in India in 1879, when a demonstration of electric
lighting was made in Calcutta (today Kolkata) by a British company (Tongia 2009). In
the following years, a steady development of the electricity industry was witnessed in the
country. Between 1907 and 1912, for example, India’s imports of electrical machinery
increased by about 30 per cent while imports of steam-driven machinery dropped by more
than 60 per cent, suggesting an increasing popularity of electricity in the country (Speyer
1913).
Most of this development was undertaken by British investors. There were also a few
prominent Indian-owned power companies, notably Tata & Sons. Tata & Sons was
granted licenses for three large hydro projects in the early 20th century. These hydro
projects were among the largest in the country in terms of installed capacity and electricity
sales. They were operated by three companies controlled by Tata & Sons. They included:
the Tata Hydro-Electric Power Supply Company, the Andhra Valley Power Supply
Company, and the Tata Power Company (Kale 2014b).
There also existed a few public owned electric utilities, particularly in less industrialised
states with spatially scattered economic activities (hence lack of large and concentrated

68
demand for electricity) (Kale 2014b). For example, in Madras (a princely state under
indirectly British rule), the government took the lead in developing the electricity
industry, and built several power stations in the state. These stations included, for
example, Aruvankadu hydro power station, Mettur hydro power station, thermal power
stations at Bezawada, Vizagapatam, and Cocanada, and Papanasam hydro power station
(Rao & Lourdusamy 2010).
Table 3-1 shows installed capacity and ownership of the five largest Indian electric
utilities of the times.
Table 3-1: Major Indian electric utilities in the early 20th century
Electric utilities Installed capacity (kW)
Ownership
Tata Hydro-Electric Power Company 32,000 Domestic private Mysore Government Cauvery Falls Company 12,000 Public
Calcutta Electric Supply Corporation 10,000 British Bombay Electric Supply and Tramway Company 7,000 British
Rangoon Electric Tramway and Supply Company 5,900 British
Source: Speyer (1913)
Performance
Most capacity of the time was built to serve big cities and urban towns, where industry
and population were at their greatest density. Smaller rural towns and villages were
largely untouched by this new technology (Kale, 2014b). This can be explained by the
lack of interests by private investors in building power projects in remote, economically
unattractive rural areas. This view gets substantiated by a review of the installed capacity,
generation and consumption of the time, as presented in Table 3-2. This table shows that

69
in the British provinces, most installed capacity (more than 58 per cent) was located in
Bombay and Bengal (economic centres of the times), implying the profit-orientation of
private investors (particularly, British) who were only interested in building power
projects in areas where electricity businesses were considered economically viable. These
two provinces also had the largest amount of electricity generation and consumption
among the British provinces. Similarly, in the Indian states, more than 40 per cent of the
installed capacity was situated in Mysore. This state also had the largest electricity
generation and consumption among the Indian states.

70
Table 3-2: Installed capacity, generation and consumption in 1944 Installed Capacity Generation Consumption
kW % GWh % GWh % British provinces1
Ajmer-Merwara 1,394 0.1 3 0.1 2 0.1 Assam 2,524 0.2 4 0.1 3 0.1 Baluchistan 1,250 0.1 3 0.1 2 0.1 Bengal 336,622 29.6 846 25.2 739 26.1 Bihar 27,162 2.4 74 2.2 67 2.4 Bombay 323,999 28.5 1,323 39.5 1,139 40.2 Berar 20,563 1.8 39 1.2 33 1.2 Coorg 74 0.0 0 0.0 0 0.0 Delhi 22,285 2.0 71 2.1 61 2.2 Madras 135,740 12.0 370 11.1 292 10.3 NWFP 10,630 0.9 16 0.5 13 0.5 Orissa 1,221 0.1 1 0.0 1 0.0 Punjab 89,539 7.9 195 5.8 149 5.3 Sind 17,558 1.5 37 1.1 30 1.1 United Province 144,935 12.8 367 11.0 304 10.7 Total 1,135,496 100.0 3,350 100.0 2,835 100.0
Indian states2 Baroda 4,761 3.3 7 1.5 6 1.5 Bikaner 4,000 2.8 11 2.3 8 2.0 Cochin 2,919 2.0 5 1.1 7 1.9 Gwalior 3,846 2.7 9 1.7 7 1.7 Hyderabad 12,901 8.9 28 5.7 24 6.1 Indore 2,980 2.1 8 1.6 7 1.7 Jaipur 2,995 2.1 6 1.2 4 1.1 Jodhpur 2,600 1.8 5 1.1 4 1.1 Kashmir 4,270 3.0 21 4.2 12 3.1 Mysore 61,000 42.2 280 57.1 217 55.0 Rampur 4,200 2.9 7 1.5 6 1.4 Travancore 16,947 11.7 70 14.3 58 14.8 Other states 21,069 14.6 34 6.9 34 8.6 Total 144,488 100.0 491 100.0 394 100.0
Notes: 1. British provinces refer to regions directly ruled by the British Crown as colonial possessions of the United Kingdom.
2. Indian states refer to regions ruled by local or regional Indian rulers in a subsidiary alliance with the British Crown.
Source: Kale (2014a)

71
3.2.2 Centre-dominated period (1947 to 1960s)
After independence in 1947, the new government of India adopted socialist governance
paradigm for socio-economic development of the country, with the public sector
assuming an ever-larger role in the economy (see Section 2.2.2). Electricity was viewed
as a vital input for socio-economic development. It was therefore placed under public
control, as it was believed that only public sector could forgo immediate profit and supply
electricity to less-developed areas where electricity supply was considered as
economically-unviable (Rao 2002).
The belief in public control of the industry was primarily legitimised on the basis of the
country’s unsatisfactory experience with private electric utilities in the colonial period.
As argued in the Constituent Assembly debates of 1948:
‘But what these (private) corporations did was to take away the cream of income
from the public and not contribute even a little or a farthing to the expansion of
power to the rural areas…Corporations were easily established in towns (where) for
lighting and other purposes they were charging at the rate of 4 annas per unit
whereas under the terms of license they were obliged to supply power for
agricultural and industrial purposes at the rate of 9 pies per unit. Therefore, these
corporations always concentrated their efforts only in cities where on account of
lighting they would get the largest portion of income, but they tried least to get into
the villages and giving power to lift up water from wells and so on’ (Constituent
Assembly Debates 1948, p.41, cited in Kale 2014a).
The belief in public ownership was further supported by the capital-intensive nature of
the electricity industry; to build large-scale power stations and long-distance high voltage
transmission networks required large investments. Investments of such magnitude could

72
be more effectively financed by the public sector, because the government was normally
considered as the most creditworthy entity and was therefore able to borrow money at the
lowest rates (World Bank 1993b).
This belief led to important changes in the Indian electricity industry (particularly, its
structure, ownership, and regulation) in the post-independence years (1947 to 1960s).
These changes were primarily made to ensure that electricity could be used as an
instrument for subserving the wider social and economic developmental policies of the
country, with particular focus on promoting rapid industrialisation (see section 2.2.2).
Specific details about some of the key changes in the structure, ownership and regulation
of the Indian electricity industry are discussed in the following paragraphs.
Structure, ownership and regulation
At the time of independence, the Indian electricity industry was predominantly owned by
the private sector. In 1948, the Indian government enacted the Electricity (Supply) Act,
1948. This Act brought all electricity generation, transmission and distribution under
public control. It also led to the establishment of vertically integrated public electric
utilities (i.e., State Electricity Boards), responsible for generation, transmission,
distribution and retail of electricity within state territories, and for the control and
regulation of other electricity undertakings (such as, private utilities and municipalities)
(Rao & Lourdusamy 2010).
This vertically integrated structure was justified on the grounds of natural monopoly
characteristics of the electricity industry, i.e., a single company that integrated all
segments of the electricity industry can supply electricity at the lowest costs, because it
could avoid wasteful duplication, particularly of transmission networks. It could also
enable significant cost reductions arising from the pursuit of scale economies i.e., the

73
larger the number of consumers served, the lower the average costs of electricity supply
(Gilbert, Kahn & Newbery 1996).
As originally conceived, the SEBs were expected to be self-regulated and autonomous
public corporations. They would be controlled by a Board, appointed by the respective
state government. The Board would be responsible for the SEB’s actions, with duties laid
down by the Electricity (Supply) Act of 1948, and with independence in their day-to-day
operations. The Board would be subjected to broad instructions and guidance in policy
matters from the state governments (Rao & Lourdusamy 2010).
In practice however, the autonomy of the SEBs was limited. Most SEBs worked under
tight control by the state governments. The chairman and members of the SEBs were
usually directly appointed by the state governments. It was also common for the Minister
in charge of electricity in the state to get involved in the day-to-day operation of the SEBs
(Santhakumar 2008). This tight government control implied that the government
(especially, state) had important influence in the regulation of electricity industry. This
also implied that the industry could be easily used as an instrument to support prevalent
political objectives rather than operated based on considerations of economic efficiency
and cost minimisation.
Performance
The 1950s and 60s witnessed large public investments on power projects, rising from Rs.
2.6 billion in the period 1951-1956, to Rs. 12.5 billion in the period 1961-1966 (World
Bank 1979). These investments led to a rapid expansion of the public sector. As a result,
the public sector began to dominate the industry in the early 1970s. As shown in Table
3-3, in 1971-72, the SEBs supplied 66 per cent of electricity sold in the country, while
other public electric undertakings (such as, municipalities and government departments)
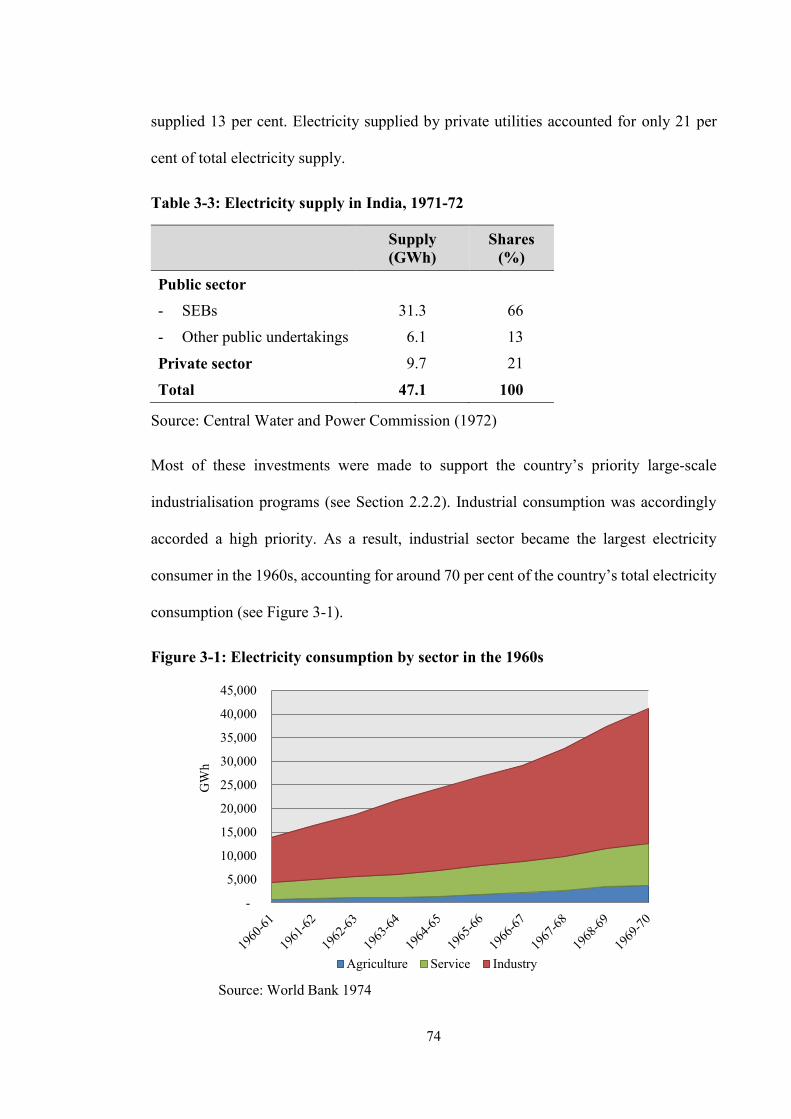
74
supplied 13 per cent. Electricity supplied by private utilities accounted for only 21 per
cent of total electricity supply.
Table 3-3: Electricity supply in India, 1971-72
Supply (GWh)
Shares (%)
Public sector - SEBs 31.3 066 - Other public undertakings 06.1 013
Private sector 09.7 021
Total 47.1 100
Source: Central Water and Power Commission (1972)
Most of these investments were made to support the country’s priority large-scale
industrialisation programs (see Section 2.2.2). Industrial consumption was accordingly
accorded a high priority. As a result, industrial sector became the largest electricity
consumer in the 1960s, accounting for around 70 per cent of the country’s total electricity
consumption (see Figure 3-1).
Figure 3-1: Electricity consumption by sector in the 1960s
-
5,000
10,000
15,000
20,000
25,000
30,000
35,000
40,000
45,000
GW
h
Agriculture Service Industry
Source: World Bank 1974

75
In addition, in the 1950s and 60s, residential and commercial customers were charged
higher electricity prices to compensate for the provision of subsidies to industrial
consumers. For instance, in 1965-66, industrial electricity prices were 5.4 paise per kWh.
They were much less than residential (23.0 paise per kWh) and commercial (17.4 paise
per kWh) prices. As a result, electricity sold to the industry normally had the lowest
average revenue as compared to electricity sold to other sectors (i.e., domestic,
commercial and agricultural) (Venkataraman 1972).
3.2.3 Populist period (1970s to 1980s)
The 1970s and 80s witnessed a gradual shift in India’s social and economic policies
towards populism, focusing on satisfying the demands of various interest groups (such as,
farmer associations), by distributing public resources and privileges to these groups (see
section 2.2.3). The electricity industry was considered as an important instrument for
subserving these policies. Some points to support this observation are presented as
follows.
1) Driven by social security concerns, the state governments frequently encouraged the
SEBs to hire more people. Jobs were created even when they were not required or
could not be afforded by the SEBs (Rao 2002). As a result, over-employment was
common in most SEBs. In 1991-92, for example, number of employees per GWh of
electricity sold was in the range of 2.5 to 14.6, with the average of 4.5 (see Table 3-4).
This was high as compared with other countries, such as, about 0.2 in Chile, Norway
and the United States, around 0.6 in Argentina, New Zealand and United Kingdom,
and less than 2.5 in some Asian developing countries, such as, China, Philippines, and
Indonesia (Kannan & Pillai 2001b).

76
Table 3-4: Employment, sales and labour productivity in 1991-92
Num. of employees
Electricity sale (GWh)
Employees per GWh sold
Andhra Pradesh 71,979 266,322 3.7
Assam 23,201 338,735 14.6
Bihar 42,430 322,468 7.6
Delhi 26,100 86,130 3.3
Gujarat 45,991 114,978 2.5
Haryana 45,000 234,000 5.2
Himachal Pradesh 11,362 77,262 6.8
Jammu & Kashmir 16,449 177,649 10.8
Karnataka 45,217 185,390 4.1
Kerala 23,957 98,224 4.1
Madhya Pradesh 82,911 406,264 4.9
Maharahtra 111,514 390,299 3.5
Meghalaya 4,596 49,637 10.8
Orissa 33,008 201,349 6.1
Punjab 71,416 357,080 5.0
Rajasthan 59,008 312,742 5.3
Tamil Nadu 95,299 476,495 5.0
Uttar Pradesh 98,809 434,760 4.4
West Bengal 39,876 267,169 6.7
Average 49,901 224,555 4.5
Source: Planning Commission (1999)
2) Contracts for construction and manufacturing in the electricity industry were
frequently awarded to politically well-connected contractors. In exchange, these
contractors paid the politicians significant amounts of commissions, which in turn
would be used to finance their election campaigns (Rao 2002). According to an
interview with a former SEB chairman, the list of contractors hired for projects in the
electricity industry in a particular northern state changed immediately after the change
of political party in office (Kale 2004).

77
3) It was also common for the state governments to require the SEBs to provide
electricity subsidies (e.g., low electricity tariffs) to agricultural consumers, even
though the costs of serving remote rural areas were high (Dubash & Rajan 2001).
Wealthy large and intermediate farmers were the main beneficiaries of these subsidies.
This is mainly because these wealthy farmers, though small in numbers, were usually
‘the patriarchs of their clans and communities and functioned as political
intermediaries who could deliver blocs of votes to their favoured political party’ (Lal
2005). It would be therefore very risky for political parties to alienate the demands of
these powerful wealthy farmers, in the backdrop of mounting democratic activism and
volatile swing votes (Lal 2005).
These wealthy farmers were also politically well-organised. They had formed several
farmer organisations to participate in the electoral politics to pressurise the political
parties to satisfy their demands. The political parties normally responded positively
to these demands in order to win political support from these powerful organisations
(Jain 2006).
The provision of agricultural subsidies were usually justified on the ground that
irrigation (most of which used electricity) was an important means of raising the level
of agricultural production, as India’s agricultural production was heavily reliant on
rainfall, and even a partial failure of the monsoon could lead to a significant reduction
in agricultural production (Mahalanobis 1955). The importance of irrigation in raising
agricultural production was also reinforced by the fact that irrigation is a basic input
on which modern techniques of agricultural production (such as, high-yielding seeds
and chemical fertilisers) depended significantly, because irrigation could enable the
use of better seed-fertiliser combination and multiple cropping (Jain 2006). Higher

78
agricultural production was considered by the Indian planners as an important means
of eradicating poverty and backwardness. This is so because the lives of large number
of very poor in India were reliant on the agricultural sector, and hence there existed
opportunities for their economic advancement. These opportunities could be realised,
it was believed, if cheap electricity was available (Rao 2002).
The use of electricity for subserving populist policies however adversely affected industry
performance. For example, the provision of agricultural subsidies resulted in significant
unrecovered costs of electricity supply. In the 1970s, SEB tariffs were on average only
52% of their long-run marginal costs (LRMCs). While the SEBs made some tariff
adjustments in the 1980s, average tariffs continued to recover only between 50% and 60%
of LRMCs (World Bank, 1999). These costs led to considerable financial losses for the
SEBs. Most SEBs could not comply with the statutory requirement of 3% minimum
return on net fixed assets. In fact, revenues generated by the SEBs were insufficient even
for financing necessary system maintenance and expansion, resulting in poor quality of
supply and chronic power shortages (Tongia, 2009).
In response, the government amended the 1948 Act, which allowed the central
government to establish electricity generation companies with a view to support the SEBs
to meet rising electricity demand. This led to the establishment of major central electric
utilities, such as, the National Hydroelectric Power Corporation (NHPC), and the
National Thermal Power Corporation (NTPC). As a result, prior to electricity reform in
the early 1990s, the Indian electricity industry was jointly controlled by state and central
electric utilities. The SEBs, fully owned by respective state governments, controlled most
of the generation (about two-thirds) and transmission (within regional boundaries)
capacities in the country. They also carried out electricity distribution in most areas of


80
especially at the non-technical, administrative level, involving unwarranted cost increases
and in irrational pricing practices for subsidised power sales, irrespective of
considerations of costs, leading to substantial losses’ (Kannan & Pillai 2001a, p. 245).
Until the early 1990s, these costs were largely offset by the governments primarily
through foreign borrowings. In mid-1991, the capacity of the governments to further
offset the costs of electricity industry reached its limit, as foreign lenders lost their
confidence in the country, in the face of rising inflation and mounting public debts (Basu
1993). In response, India turned to the IMF for financial assistance. As part of the bailout
deal with the IMF, the Indian government started to implement market reforms of the
economy (including the electricity industry) in 1991 (see section 2.2.4).
The serious power shortages in the early 1990s gave further immediacy to these reforms.
There were power shortages in many parts of the country, especially during the peak hours.
The SEBs were debt-stricken, with losses of roughly Rs 40 billion ($0.85 billion) or
around 0.7 per cent of the country’s GDP at the time. They were therefore unable to
alleviate power shortages by adding new supply capacity on their own (Pargal & Banerjee
2014).
These external and internal crises set in motion the market reform of electricity industry
in India. Initially, the government encouraged private investment in generation, as a
response to immediate crisis of supply shortages. In the mid-to-late 1990s, the reform was
deepened in several states, emphasising restructuring and privatisation of SEBs and
independent regulation. In 2003, a new Electricity Act was enacted to consolidate and
replace all previous federal acts governing the electricity industry, and to further promote
market reform in the industry (Kale 2014a).

81
Despite these reform efforts, the reform has only been partially implemented, due to
significant political resistance. This resistance essentially reflected a mixed reception of
the reform in the Indian society. Support for reform mainly came from international
capital, on the lookout for attractive investments, and domestic business community,
based on the expectations that the reforms could create new investment opportunities for
them. Opposition for reform mainly came from the farmers, who had come to rely on
enormous quantities of low-cost electricity for pumping water, and utility employees who
feared losing their jobs if the bloated SEBs were privatised. Some government officials
and political parties (especially, at the state level) also opposed reforms, fearing that the
reforms would reduce their control of the industry, which is viewed as an important source
of political power. Some points to support this observation are presented in the following
paragraphs.
Introduction of Independent Power Producers (IPPs)
The first phase of reform (early-to-mid 1990s) primarily focused on encouraging private
investment in the electricity industry in the form of Independent Power Producers (IPPs).
Other important aspects of market reforms (such as, restructuring of the SEBs,
independent regulation and market competition) were largely ignored. For example, in
1991, the government of India published a series of notifications seeking to encourage
private investment in generation. These notifications permitted private investors to
establish, operate and maintain power plants of virtually any size; and to enter into long-
term Power Purchase Agreements (PPAs) with SEBs. They also provided generous
incentives to private investors including, for example, a guaranteed minimum 16 per cent
rate of return, a five-year tax holiday, and counter-guarantees from the central
government to cover payment default by SEBs. Some of these notifications were later

82
enacted in parliament – to become the Electricity Laws (Amendment) Act of 1991
(Dubash & Rajan 2001). In 1992, eight showcase IPP projects were assigned by the
government with ‘fast track clearance’, with the aim of speeding up the process of
introducing IPPs for capacity additions (Tongia 2009). Table 3-5 provides detailed
information about these eight fast-track projects.
This first phase of reform received bipartisan support in the parliament. For example, in
the Lok Sabha (lower house of the Parliament), during a debate on issues related to
electricity reform, the Minister argued that reform was ‘necessitated by a paralysing
scarcity of financing for the electricity industry’ (Lok Sabha Debates 1991, cited in Kale
2014a). Similarly, the largest opposition party, Bharatiya Janata Party (BJP), argued that
electricity is a sector ‘where the States have failed to fulfil their responsibilities…The
BJP has consistently been advocating the cause of liberalisation, deregulation and
privatisation, wherever necessary’ (Lok Sabha Debates 1991, p 81, cited in Kale 2014a).

83
Table 3-5: Fast-track IPP projects
Project Investor Location Capacity
(MW)
Investment
(Rs. billion) Fuel Technology
Dabhol Enron Maharashtra Phase II: 0,740
Phase II: 1,444
Phase II: 28
Phase II: 63 Natural
gas/naphtha CCGT
Jegurupadu GVK Reddy Andhra Pradesh 0,216 8 Natural gas/naphtha CCGT
Godavari Spectrum Power Generation Andhra Pradesh 0,208 7 Natural
gas/naphtha CCGT
Ib Valley TPS AES Transpower, USA Orissa 0,500 24 Coal n.a.
Neyveli ST-CMS Electric Co. Tamil Nadu 0,250 12 Lighite n.a.
Mangalore Mangalore Power Co. Karnataka 1,013 43 Coal n.a.
Visakhapatnam Ashok Leyland and National Power Plc., UK Andhra Pradesh 1,040 n.a. Coal n.a.
Bhadravati Nippon Denro Ispat Maharashtra 1,072 46 Coal n.a.
Source: IEA (2002)

84
This bipartisan support for reform was primarily built upon the need to attract private
investments, and the absence of any significant broad-based opposition to reform. Details
are presented as follows.
1) Needs to attract private investments. The World Bank estimated that annual
investments of $100 billion were required in developing countries to meet rising
electricity demand in the 1990s. Only about $20 billion was available from
international development organisations, such as, the World Bank. This left a gap of
about $80 billion. Hence, it was suggested that the only possible source of funds was
the private sector (especially, foreign), in view of the fact that the Indian government
was debt-stricken and unable to finance further capacity expansion in the electricity
industry, and domestic capital did not appear to be able to make a significant
contribution (D'Sa, Murthy & Reddy 1999).
2) Absence of broad-based opposition to reform. The reform policies of introducing IPPs
were not perceived to threaten the main interests in the electricity industry (such as,
rural interests in electricity subsidies) because these policies were not discussed in the
context of privatisation of the SEBs that could lead to large-scale layoffs and
widespread labour protests, and removal of electricity subsidies that could adversely
affect the interests of wealthy farmers, who were the main beneficiaries of these
subsidies (Kale 2014a).
State level reform: restructuring, privatisation and re-regulation
In some states (such as, Orissa, Haryana, and Andhra Pradesh), the governments decided
to restructure and privatise the SEBs, and to introduce independent regulation in the mid-
1990s, in an effort to deepen market reform of the electricity industry. The initial impetus
for this reform came from the World Bank, as the Bank had made the reforms conditional

85
for receiving further financial assistance to these states (Kumar & Chatterjee 2012). The
actual implementation of this reform was however slow, due to strong farm and labour
resistance. For example:
1) In Orissa, the electricity board was restructured in 1996. This led to the creation of
two generation companies, one transmission company, and four distribution
companies. These companies were then sold to private investors. A state electricity
regulatory commission was also established to insulate the industry from the influence
of the government. Many regulatory responsibilities, previously assumed by the
government, were transferred to the regulatory commission. These responsibilities
included, for example, licensing and tariff-setting (Dixit, Sant & Wagle 1998).
This reform was strongly advocated by the World Bank. The Bank had made the
implementation of market reform in the electricity industry as a necessary condition
for receiving further financial assistance to the industry (Rajan 2000). The Orissa
government was quite supportive of this reform, and viewed it as important way of
reducing the state’s large fiscal deficit. According to an interview with a senior former
public official, ‘the chief minister clearly saw impending bankruptcy looming, and
quickly came to see the Bank’s proposals as the only way out’ (Dubash & Rajan 2001,
p. 3377). This strong government support for reform was also built on the absence of
powerful farm lobby in the region, as agricultural consumption only accounted for 5.7
per cent of total electricity sales in Orissa, as compared to around 40 per cent in large
agricultural states, such as, Andhra Pradesh, Haryana, and Karnataka (Rajan 2000).
2) In 1998, the Haryana electricity board was incorporated into two separate companies,
namely, Haryana Power Generation Corporation Ltd, and Haryana Vidyut Prasaran
Nigam (HVPN) (in charge of electricity networks). In 1999, the distribution activity

86
of HVPN was separated into two companies, namely, Uttar Haryana Bikli Vitran
Nigam (in charge of Northern Haryana) and Dakshan Haryana Bijli Vitran Nigam (in
charge of Southern Haryana). There were also plans to privatise these distribution
companies. These plans were however abandoned, due to strong resistance (Ruet
2005). This resistance was largely caused by concerns about electricity price increases
and staff layoffs that could result from privatisation of electric utilities (Dubash &
Rajan 2001).
3) In Andhra Pradesh, the state electricity board was unbundled into two companies,
namely, AP Genco and AP Transco (in charge of electricity networks). In 2000, the
distribution segment was separated from the AP Transco, and four zonal distribution
companies were created. These companies were not privatised. The state government
simply adopted measures to improve their efficiency by, for example, tariff
rationalisation and financial incentives for performance improvement. A stringent
anti-theft legislation was also introduced, resulting in a 3% reduction in thefts in the
years after reform. The state government also managed to dramatically reduce its
network losses (Sen & Jamasb 2013).
The electricity reform in Andhra Pradesh was considered as largely successful. But
this success was short-lived. In 2002, the Chief Minister announced that farmers
would receive 9 hours of guaranteed supply daily, and rural homes would receive 24-
hour supply, in an effort to win the coming election. This resulted in annual additional
losses of about Rs.10 billion. After election, the newly elected government announced
at its inauguration ceremony that it would provide free electricity to all farmers
(Tongia 2009).

87
Central level reform: Electricity Act 2003
On 10 June 2003, the Indian central government enacted the Electricity Act 2003. This
Act repealed all existing federal legislations on electricity, and consolidated the
provisions in one Act. This Act sought to introduce market competition in the electricity
industry by, for example, de-licensing thermal generation, open access to networks,
unbundling and privatisation of SEBs, and establishment of market-based regulatory
arrangements (Ranganthan 2004).
The implementation of the 2003 Act however met strong resistance. This resistance
essentially came from farmers and utility employees. For example, farmers actively
opposed the removal of electricity subsidies and metering in various political and social
forums. Utility employees viewed public jobs as a passport to security, fearing that
privatisation would make them lose their jobs (Lal 2005).
Besides, this resistance was also usually used by the government officials and political
parties (especially, at the state level) as a scapegoat to mask their own resistance, because
electricity industry was viewed by them as an important source of political power. As
argued by Lal (2005), ‘candidates and parties incur astronomical, undeclared expenses
and then seek “returns on investment” when in office’ (Lal 2005, p. 652). Besides,
electricity industry was also seen as an important source of dispensing favours (such as,
jobs and subsidies) for gaining political support, especially during elections. Min &
Golden (2014) found increased electricity losses in periods immediately prior to state
assembly elections in Uttar Pradesh, implying that political parties had deliberately
provided electricity to unbilled users in exchange for their political support in elections.
The strong resistance to reform (as discussed above) led to a slow implementation of the
2003 Act. Immediately after the 2004 election, for example, the new coalition government

88
called for a review of the 2003 Act, with specific emphasis on those parts relating to SEB
restructuring and elimination of electricity subsidies. This was driven by concerns that
market reform in the economy (including the electricity industry) would adversely affect
India’s social conscience, taking into consideration the country’s vast disparities in
incomes and living conditions (Bhattacharyya 2007). A second review was called in 2007,
in response to growing local dissatisfaction about the reform programs (Kumar &
Chatterjee 2012).
The slow implementation of reform resulted in the establishment of a dual market in the
Indian electricity industry. On the one hand, the conditions of SEBs remained largely
unchanged, continuously subjected to political interference. As argued in the World Bank
report, ‘Boards remain state-dominated, lack sufficient decision-making authority in
practice, and are rarely evaluated on performance. Political interference in appointments
to and by the board and in decision making on business aspects remains common, and
board member training and peer evaluation are conspicuous by their absence’ (Pargal &
Mayer 2014).
On the other hand, large consumers (especially, industrial consumers, residential
association and cooperatives) were allowed to build their own captive power or to
purchase electricity from other private generators. They could also sell their surplus
electricity to the grid (Sen & Jamasb 2013). Electricity trading initially took the form of
unscheduled interchange transactions, and was usually undertaken to address power
shortages at local levels by purchasing surplus captive generation capacity in the region.
In 2006, for example, a small urban agglomeration in Maharashtra (Pune) faced a power
deficit of 90 MW, equivalent to 2 to 4 hour of power cuts a day. In this region, the industry
had unutilised captive capacity of more than 100 MW. The industry reached an agreement

89
with residential and commercial consumers to produce electricity for the duration of
scheduled power cuts (Nag 2010).
Two power exchanges were also established to facilitate electricity trading. These power
exchanges operated with day-ahead and week-ahead contracts, based on prices arrived at
through double-sided auctions. The volume of electricity traded on the exchanges
increased steadily from around 8 per cent of total generation in 2009-10, to about 11 per
cent in 2012-13 (Pargal & Banerjee 2014).
The reform of the Indian electricity industry has encouraged large private investments in
electricity generation, resulting in a more than threefold increase in generation capacity
over the period 1992-2017, from 78 GW in 1992, to 330 GW in 2017 (Central Electricity
Authority, 2017). Despite this rapid capacity expansion, however, electricity remains
inaccessible to a significant proportion of the population (more than 240 million in 2016)
(IEA, 2018). Even those who have access often receive unreliable electricity supply with
frequent outages (Banerjee et al., 2015). Besides, the electric utilities (SEBs) have
continued to register large financial losses, and hence accumulated large debts. These
debts amounted to 4.3 trillion rupees (about $67 billion) in 2015, equivalent to more than
3 per cent of the country’s GDP (Upadhyay, 2017).
3.3 Summary and conclusions
This chapter has assessed changes in the structure-ownership-regulation of the electricity
industry in India, as guided by the underlying electricity governance paradigm, and the
impact of these changes on industry performance. Key findings of this assessment are
summarised as follows.
Consistent with the wider colonial governance paradigm, between late 19th century
and 1946, the electricity governance paradigm in India emphasised the furtherance of

90
private interests (especially, British). The colonial government assumed only a
passive role in regulating the electricity industry, primarily confined to the areas of
safety and licensing. This electricity governance paradigm led to the development of
electricity industry typified by highly fragmented structure, predominately foreign
ownership, and minimal regulation. Power supply was mainly confined to major cities
and towns, where economic activities concentrated. Rural areas were largely
untouched by electricity.
In the years after independence (1947 to 1960s, specifically), the new government of
India took a socialist approach for governing socio-economic development, with the
public sector assuming an ever-larger role in the economy. This approach viewed
electricity as a vital input for socio-economic development. It therefore placed the
electricity industry under tight public control. This is so because only public sector, it
was believed, could forgo immediate profit, and supply electricity to less-developed
areas where electricity supply was considered as economically-unviable.
This belief led to important structural, ownership and regulatory changes in the Indian
electricity industry, for example, creation of public-owned, vertical-integrated
utilities (SEBs), and introduction of tight regulatory control of the industry. These
changes enabled the use of electricity by the government as an instrument for
promoting rapid industrialisation, which was viewed as the means to achieve self-
sufficiency, eradication of poverty, and reduced unemployment and backwardness.
This resulted in a rapid expansion of generation capacity, mainly to meet rising
industrial demand. The industry also received subsidised electricity.
The mid-to-late 1960s witnessed mounting democratic activism by previously quiet
social groups (such as, peasants, workers and students). The government (keen to

91
maintain social stability) began to implement, in the 1970s and 80s, populist policies
to (at least rhetorically and symbolically) satisfy the interests of various social groups.
Electricity was considered as an important instrument for furthering the populist
policies, resulting in significant financial costs for the SEBs.
Until the early 1990s, these financial costs were largely offset by the governments,
primarily through foreign borrowings. In mid-1991, the capacity of the governments
to further offset financial costs of the industry reached its limit, as foreign lenders lost
their confidence in the country, in the face of rising inflation and mounting public
debt. In response, India turned to the IMF for financial assistance. As part of the
bailout deal with the IMF, the Indian government began to implement market reforms
of the economy (including the electricity industry). Serious power shortages in the
early 1990s gave further immediacy to these reforms.
Key component of these reforms included: restructuring and privatisation of SEBs,
encouragement of IPPs, introduction of market competition, elimination of subsidies
and price control, and establishment of sector-specific regulators for overseeing the
operation of the power systems.
These reforms have only been partially implemented, due to strong political resistance.
This resistance essentially reflected a mixed reception of these reforms in the Indian
society. Support for reform mainly came from international capital, on the lookout for
attractive investments, and domestic business groups, based on the view that these
reform could lead to new investment opportunities for them. Opposition for reform
mainly came from the farmers, who had come to rely on enormous quantities of low-
cost electricity for pumping water, and utility labour who feared losing their jobs if
the bloated SEBs were privatised. Some government officials and political parties
92
(especially, at the state levels) also opposed reform, fearing that reform would reduce
their control of the electricity industry, which was viewed by them as an important
source of political power.
Despite this resistance, some progress has been made, especially in the areas of market
opening, due to strong business support based on the belief that such reforms could
provide them with profit-making opportunities. This has encouraged large private
investments in electricity generation, resulting in a rapid expansion of generating
capacity. Electricity supply however remains inaccessible and unreliable to a
significant proportion of the population, especially in rural areas, as profit-seeking
private investors, mainly interested in commercially attractive investments in the
industry, have showed little interest in extending electricity access to remote rural
areas. Besides, public utilities are still debt-stricken, and are therefore unable to
finance necessary maintenance and capacity expansion.
The analysis in this chapter clearly demonstrates that electricity industry has historically
been considered in India as an important instrument for subserving wider policy priorities
and agendas. These priorities and agendas have essentially been shaped by the underlying
electricity and national governance paradigms, which have drawn their legitimacy from
the dominant political and socio-economic interests of the time. This perspective has
made electricity governance as merely a process of serving the dominant interests of the
time. Issues of industry performance have therefore assumed a dormant role. The outcome
is persistently poor performance of the industry. For example, in the formative years (late
18th century to 1946), the development of electricity industry in India tended to emphasise
furtherance of private interests (especially, British). As a result, power supply of the time
was mainly confined to major cities and towns, where economic activities concentrated.

93
Rural areas were largely untouched by electricity. After independence, the new
government of India realised the political appeal of the electricity, and started to actively
intervene in the development of the industry, to support its large-scale industrialisation
programs. As a result, most capacity was built in the 1950s and 60s to meet rising
industrial demand. Industrial consumers were also cross-subsidised by other consumer
groups, such as, agricultural and households. The industry performance further
deteriorated in the 1970s and 80s, as Indian governments (keen to maintain social stability)
channelled large public resources to meet the heterogeneous and often conflicting social
demands. This largess however significantly reduced the capability of the governments
to improve the performance of electricity industry, particularly in a country (like India)
beset with economic scarcity, large poverty and backwardness. The recent market reform
has therefore only made limited contribution to improving the industry performance, due
primarily to slow implementation of the reform, caused by strong political resistance.

94
4 CAUSES OF POOR INDUSTRY PERFORMANCE: SOME FURTHER
ANALYSIS
4.1 Introduction
This chapter of the thesis develops a quantitative analysis of the impact of electricity and
national governance paradigms on the structure-ownership-regulation and performance
of the Indian electricity industry. The main purpose of this analysis is to lend credence to
the argument made in the previous chapter, namely, that the causes of poor industry
performance are deeply rooted in the electricity governance processes, which have
historically favoured the use of electricity as a means to subserve wider governance
priorities and agendas, aimed at promoting socio-economic development of India.
Consequently, the issue of industry performance has assumed a dormant role, and the
outcome is persistently poor performance of the industry.
This chapter is organised as follows. Section 4.2 reviews major analytical approaches for
assessing the performance of electricity industry and its underlying influencing factors. It
also discusses the appropriateness of these approaches in the context of this research.
Section 4.3 presents the salient features of the approach developed in this research for
assessing the performance of the Indian electricity industry and its underlying influencing
factors. Section 4.4 discusses the empirical results of this assessment. Section 4.5
provides the some broad conclusions of this chapter.
4.2 Review of existing studies
Several studies have been undertaken to assess the performance of electricity industry
and its underlying influencing factors (such as, privatisation, removal of subsidies, and
introduction of market competition). They include, for example, Erdogdu (2011),
Nagayama (2007), Pompei (2013), and Steiner (2001). Appendix C provides a more

95
expanded list of these studies. The first part of this section (4.2.1) presents the key features
of these studies, in particular, their objective, scope, methodology and major findings.
These features are then analysed in section 4.2.2 with the aim of identifying major
limitations
4.2.1 Key features of existing studies
The main objective of Erdogdu (2011) is to analyse the impact of electricity reforms on
the efficiency of electricity supply. In this study, a market reform index is created to
measure the degree of electricity reforms. The index ranges from 0 to 8, with higher value
indicating higher degree of market reforms. The efficiency of electricity supply is
measured in this study in terms of specific indicators, for example, plant load factor,
network losses, and generation per employee. Mixed effect regression models are used in
this study, using panel data for 92 developed and developing countries, covering the
period 1982-2008. The analysis in this study suggests that electricity reforms have
positive impacts on efficiency of electricity supply, implying that reforms have resulted
in efficiency improvements. But these positive impacts, the analysis also reveals, are
rather limited. Besides, the analysis also finds that country-specific factors (such as,
income level) are more important determinants of industry efficiency than electricity
reforms.
In Erdogdu (2014), the main objective is to analyse the impact of electricity reforms on
investment, security of supply, and CO2 emissions. Multiple regression models are
employed in the study, using panel data from 55 countries, covering the period from 1975
to 2010. Electricity reforms are measured in this study in terms of market openness index.
The values of the index range from 0 to 6, with higher value indicating higher degree of
market opening. Industry performance is measured in terms of private investment in

96
electricity industry, reserve margin (a proxy for security of supply), and CO2 emissions
per kWh. The results of the study suggest that electricity reforms have led to declined
private investments (especially in developing countries), high levels of self-sufficiency in
electricity supply, and lower CO2 emissions from electricity generation.
Fiorio & Florio (2013) analyses the impact of industry ownership on residential
electricity prices. A panel data of 15 European countries, covering the period 1978 to
2008, are used in this study. A dynamic panel data model (including lagged dependent
variables) is used for analysis. The analysis suggests that public ownership tends to lower
residential electricity prices in most Western European countries.
In Gugler, Rammerstorfer & Schmitt (2011), the main objective is to examine the
impact of regulatory reforms on investment. It employs a dynamic panel regression model,
using panel data from 16 European countries, over the period 1998 to 2007. Regulatory
reforms are measured in the study in terms of free access regulation and ownership
unbundling. The study suggests that there is a trade-off between vertical unbundling and
competition. Ownership unbundling and free access regulation tend to increase the level
of competition, but comes at the cost of lost vertical economies, which may in turn lead
to reduced investment.
The main objective of Hattori & Tsutsui (2004) is to analyse the impact of electricity
reforms on electricity prices. A panel data of OECD countries, covering the period 1987
to 1999, is used in the analysis. A multiple regression model that controls for country-
specific time-invariant effects is used in the study. Electricity reforms are measured in
terms of six indicators, namely, unbundling, third party access, wholesale competition,
private ownership, time to liberalisation, and time to privatisation. The analysis suggests
that introduction of retail competition is likely to lower industrial electricity prices, and

97
that restructuring and introduction of market competition tends to increase electricity
prices.
Nagayama (2007) examines the impacts of electricity reforms on electricity prices. Panel
data for 83 developed and developing countries, covering the period 1985–2002, are used
in this study. The analytical method adopted in the study is mixed effect regression model.
In this model, electricity reforms are measured in terms of six indicators, namely,
introduction of IPPs, privatisation of electric utilities, unbundling, establishment of
independent regulator, introduction of wholesale competition, and introduction of retail
competition. The results of the study suggest that unbundling could only lead to lower
electricity prices if it coexists with the establishment of independent regulator. Besides,
introduction of IPPs and privatisation seem to have contributed to lower electricity prices
in some regions.
In Nagayama (2010), the main objective is to examine the impact of electricity reforms
on investment and network losses. Panel data from 86 countries, covering the period 1985
to 2006, are used in the study. The method used by this study is fixed effect regression
model. The main findings of this study suggest that electricity reforms (particularly,
introduction of IPPs, restructuring, establishment of independent regulator, and
introduction of market competition) has positive impacts on installed capacity, implying
that the reforms tend to encourage more investment in the electricity industry. Besides,
the study suggests that reforms are negatively correlated with network losses, and that
deeper reforms would further reduce network losses.
In Pompei (2013), the main objective is to analyse the impacts of regulatory reforms on
the efficiency of electricity supply in European countries. Regulatory reforms are
measured in terms of three indicators, namely, entry regulation, importance of public

98
ownership, and degree of vertical integration. Efficiency of electricity supply is measured
in the study in terms of total factor productivity (TFP) and reserve margin. Panel data for
19 European countries, covering the period 1994 to 2007, are used in the analysis. A
dynamic panel data model is used in the analysis. The analysis suggests that there are
significantly negative effects of regulatory reforms on the efficiency of electricity supply,
and that open access regulation has negatively impacted technical efficiency.
Steiner (2001) examines the impact of electricity reforms on the efficiency of electricity
supply. The efficiency of electricity supply is measured in terms of industrial prices, ratio
of industrial to residential prices, capacity utilisation rate, and reserve margin. A multiple
regression model that controls for country-specific effects is used in the study. Panel data
of 19 OECD countries, covering the period 1986-1996, is used in the study. The results
of the study suggest that electricity reforms have led to higher efficiency of electricity
supply. The results also suggest that most efficiency gains have been transferred to
industrial consumers through lower electricity prices.
The main objective of Zhang, Parker & Kirkpatrick (2008) is to assess the impacts of
electricity reforms on the performance of electricity industry. This study uses panel data
of 36 developing and transitional economies, covering the period 1985 to 2003.
Electricity reforms are measured in the study in terms of privatisation, competition, and
regulation. Four indicators are used to measure the performance of electricity industry
(generation per capita, installed capacity per capita, generation per employee, and
capacity utilisation rate). A fixed effect model that controls for country-specific and time-
specific effects is used in the study. The results of the study suggest that privatisation
could only lead to higher capacity utilisation rate (hence higher efficiency of electricity
supply) and higher generation and capacity per capita if it is coupled with the existence

99
of an independent regulator. The results also suggest that competition does not seem to
have significant impacts on industry performance.
4.2.2 Some observations
The previous section reviews major studies for assessing the performance of electricity
industry and its influencing factors. Key features of these studies are summarised in Table
4-1.

100
Table 4-1: Existing studies on the performance of electricity industry and influencing factors: Key features
Objectives Scope Influencing factors Performance indicators Methodology Main results
Erdo
gdu
(201
1) Examine the impact
of electricity reform on the efficiency of electricity supply
- 92 developed and developing countries
- 1982 to 2008
- Market reform score (0-8)
- Load factor - Reserve margin - Network losses - Generation per
employee
- Mixed effect model
- Electricity reforms have limited impact on the efficiency of electricity supply
- Country-specific factors (such as, income level) are important determinants of industry efficiency
Erdo
gdu
(201
4)
Analyse the impact of electricity reform on investment, security of supply, and CO2 emissions
- 55 developed and developing countries
- 1975 to 2010
- Market openness index (0-6)
- Private investment - CO2 emissions per
kWh - Reserve margin
- Multiple regression model
- Electricity reforms have led to declined private investment (especially in developing countries)
- Electricity reforms have resulted in high levels of self-sufficiency in electricity supply, and lower levels of CO2 emissions
Fior
io a
nd
Flor
io (2
013)
Assess the impact of ownership on residential electricity prices
- 15 EU countries - 1978 to 2008
- Ownership of the utilities
- Residential electricity prices
- Dynamic panel data model
- Public ownership tends to lower electricity prices for residential consumers
Gug
ler e
t al
. (20
11) Assess the impact of
regulatory reform on investment
- 16 EU countries - 1998 to 2007
- Ownership unbundling
- Free access regulation
- Investment - Dynamic panel regression models
- Ownership unbundling and free access regulation have led to lower investment
Note: Table continues on next page.

101
Table 4-1: Existing studies on the performance of electricity industry and influencing factors: Key features (Continued)
Objectives Scope Influencing factors Performance indicators Methodology Main results
Hat
tori
and
Tsut
sui (
2004
) Analyse the impact of electricity reform on electricity prices
- OECD countries - 1987 to 1999
- Unbundling - Third party
access - Wholesale
competition - Private
ownership - Time to
liberalisation and privatisation
- Electricity prices - Multiple regression model
- Retail competition tends to lower electricity prices for industrial consumers
- Restructuring and market competition tend to increase electricity prices
Nag
ayam
a (2
007)
Examine the impact of electricity reform on electricity prices
- 83 developing countries
- 1985 to 2002
- Introduction of IPPs
- Privatisation - Unbundling - Independent
regulation - Wholesale and
retail competition
- Residential electricity prices
- Industrial electricity prices
- Ordinary least-square model
- Fixed effect model
- Random effect model
- Unbundling could lower electricity prices if it coexists with independent regulation-
- Introduction of IPPs and privatisation seem to have lower electricity prices in some regions
Nag
ayam
a (2
010)
Assess the impact of electricity reform on investment and network losses
- 86 developed and developing countries
- 1985 to 2006
- Unbundling - Market
competition - Independent
regulation - Private
ownership
- Generation capacity per capita
- Network losses
- Mixed effect model
- Electricity reforms are likely to encourage more investment
- Electricity reforms tend to reduce network losses
Note: Table continues on next page.

102
Table 4-1: Existing studies on the performance of electricity industry and influencing factors: Key features (Continued)
Objectives Scope Influencing factors Performance indicators Methodology Main results
Pom
pei
(201
3)
Assess the impact of regulatory reform on the efficiency of electricity supply
- 19 EU countries
- 1994 to 2007
- Entry regulation - Public
ownership - Vertical
integration
- Productivity and efficiency of electricity supply
- Dynamic panel data model
- Regulatory reforms have negative impacts on the efficiency of electricity supply
Stei
ner (
2001
)
Examine the impact of electricity reform on the efficiency of electricity supply
- 19 OECD countries
- 1986 to 1996
- Privatisation - Market
competition - Restructuring - Price regulation
- Industrial electricity prices
- Industrial to residential price ratio
- Capacity utilisation - Reserve margin
- Multiple regression model
- Electricity reforms have improved the efficiency of electricity supply
- Most efficiency gains have been assumed by industrial consumers through lower electricity prices
Zhan
g, P
arke
r &
Kirk
patri
ck (2
008)
Analyse the impact of electricity reform on investment and the efficiency of electricity supply
- 36 developing countries and transitional economies
- 1985 to 2003
- Privatisation - Competition - Regulation
- Generation per capita
- Installed capacity per capita
- Generation per employee
- Capacity utilisation
- Fixed effect model
- Privatisation could improve efficiency and attract more investment if coupled with independent regulation
- Competition tends to increase efficiency and attract more investments
Source: Developed by the author based on discussion in Section 4.2.1.

103
Some observations, based on the discussion in Section 4.2.1 and information summarised
in Table 4-1, are as follows:
a) The dominant objective of existing studies has been to analyse the impact of
electricity reform on the performance of electricity industry. The analytical
frameworks employed in these studies therefore primarily focus on empirically
assessing the causal relationship between electricity reform and the performance of
electricity industry. These frameworks typically involve three components: 1)
measure the extent of electricity reform in terms of specific indicators that reflect
various elements of reform, for example, introduction of IPPs, degree of market
competition, and establishment of independent regulators; 2) measure industry
performance in terms of specific indicators, for example, capacity and generation per
capita, electricity prices, network losses; and 3) empirically assess the causal
relationship between reform and performance indicators by using a variant of
regression models, such as, mixed effect model, dynamic panel data model, or
multiple regression model.
b) The existing frameworks for assessing industry performance and its underlying
influencing factors – this research argues – are deficit, because they tend to focus on
the impact of industry-specific factors (e.g., electricity reform) on industry
performance, and largely ignore the impact of wider socio-economic interests that
have shaped the ways electricity industry is governed. These interests, as presented in
Chapters 2 and 3 of this thesis, did however exert significant influence on shaping the
industry structure-ownership-regulation and hence performance. An understanding of
this influence is therefore a pre-requisite for developing deeper insights into the
causes (reasons) of poor industry performance. It is based on these insights that

104
remedies for improving the industry performance can be identified – this thesis
contends.
4.3 Analytical framework proposed in this research
The forgoing analysis has identified some of the methodological weaknesses of existing
studies. An alternative framework is developed in this section to overcome these
weaknesses. This framework considers wider socio-economic interests that have shaped
the national and electricity governance paradigms in India, and seeks to analyse how these
interests have influenced the structure-ownership-regulation for governing the Indian
electricity industry, and hence how they have affected industry performance.
Two types of effects (impacts) of wider influencing factors on the structure-ownership-
regulation and performance of the Indian electricity industry can be identified, namely,
mediation effects, and moderation effects (see Figure 4-1). Mediation effects, in the
context of this research, are referred to as the direct effects of wider influences (X1) on
shaping the industry structure-ownership-regulation (X2), which in turn influence the
industry performance (Y). Moderation effects are referred to as the indirect effects of
wider influences (X1) on shaping the ability of the industry structure-ownership-
regulation (α1) to influence industry performance (Y). Accordingly, the framework
proposed in this research consists of two sub-frameworks: framework for assessing
mediation effects, and framework for assessing moderation effects. Details about these
two sub-frameworks are presented in Sections 4.3.1 and 4.3.2, respectively.

105
Figure 4-1: Mediation and moderation effects
4.3.1 Framework for assessing mediation effects
Figure 4-2 shows the overall framework for assessing mediation effects. This framework
examines the impact of wider influencing factors (WIF) on shaping the industry structure-
ownership-regulation (EI), which in turn influence the industry performance (IP). It
consists of two models: granger causality model, and mixed effect model.
Figure 4-2: Framework for assessing mediation effects
X1
Y
X2
𝑌 = 𝛼2𝑋2
𝑋2 = 𝛼1𝑋1
Mediation effects
X2
Y
X1
𝑌=
𝛼1
𝑋2
𝛼1 = 𝛼2𝑋1
Moderation effects
Granger causality
model
- Wider influencing factors (WIF)
- Electricity institutions (EI)
- Industry performance (IP)
Causal relationships between WIF, EI, and IP
Mixed effect model
Mediation effects of WIF on EI, and hence, IP

106
Granger causality model
Granger causality model is a statistical model for examining causality between variables.
The basic ideas behind this model are as follows. If a variable X causes another variable
Y, then past value of X should contain information that can explain the present value of
Y (Seth 2007). As Koop puts it, ‘…time does not run backward. That is, if event A happens
before event B, then it is possible that A is causing B. However, it is not possible that B
is causing A. In other words, events in the past can cause events to happen today, future
events cannot’ (Koop 2000, p.175, cited in Gujarati, 2011).
The simplified Granger causality models adopted in this research are presented below (1
and 2). Each of these models contains two equations.
𝐸𝐼𝑡 = ∑ 𝑎11𝐸𝐼𝑡−𝑗
𝑝
𝑗=1+ ∑ 𝑎12𝑊𝐼𝐹𝑡−𝑗
𝑝𝑗=1 + 𝜆1𝑇 + 휀1𝑡 (4.1)
𝑊𝐼𝐹𝑡 = ∑ 𝑎21𝑊𝐼𝐹𝑡−𝑗
𝑝
𝑗=1+ ∑ 𝑎22𝐸𝐼𝑡−𝑗
𝑝𝑗=1 + 𝜆2𝑇 + 휀2𝑡 (4.2)
𝐼𝑃𝑡 = ∑ 𝑎11𝐼𝑃𝑡−𝑗
𝑝
𝑗=1+ ∑ 𝑎12𝐸𝐼𝑡−𝑗
𝑝𝑗=1 + 𝜆1𝑇 + 휀1𝑡 (4.3)
𝐸𝐼𝑡 = ∑ 𝑎21𝐸𝐼𝑡−𝑗
𝑝
𝑗=1+ ∑ 𝑎22𝐼𝑃𝑡−𝑗
𝑝𝑗=1 + 𝜆1𝑇 + 휀1𝑡 (4.4)
Model (1) aims to test whether there exists a causal relationship between the wider
influencing factor (WIF) and industry structure-ownership-regulation (EI). It specifies
each of these two variables as a function of the lags (j) of both WIF and EI. ε1t and ε2t are
error terms. The causal relationship between WIF and EI can be determined based on the
following principles.
1. WIF causes EI if the estimated a12 in equation (4.1) are statistically different from
zero, and the estimated a22 in equation (4.2) are statistically close to zero.
(1)
(2)

107
2. EI causes WIF if the estimated a12 in equation (4.1) are statistically close to zero, and
the estimated a22 in equation (4.2) are statistically different from zero.
3. There exists a bilateral causality between WIF and EI if the estimated a12 and a22 in
both equations are statistically different from zero.
4. No causality exists between WIF and GS if the estimated a12 and a22 in both equations
are statistically close to zero.
Model (2) aims to test whether there exists a causal relationship between industry
structure-ownership-regulation (EI) and industry performance (IP). It specifies each of
these two variables as a function of the lags (j) of both EI and IP. ε1t and ε2t are error
terms. The causal relationship between EI and IP will be determined based on principles
similar to model (1).
The number of lagged terms (j) to be introduced in Granger causality model is normally
decided through a trial and error process. In this process, Akaike information criterion
(AIC) is estimated for various lags. The lags that could produce the lowest AIC will be
selected (see Table E-2 in Appendix E).
Mixed effect model
Mixed effect model is based on Ordinary Least Regression (OLR) model with the
consideration of either fixed or random country-specific effects. The simplified models
adopted in this research are presented as models (3) and (4).
𝐸𝐼𝑖𝑡 = 𝑎0 + 𝑎1𝑊𝐼𝐹𝑖𝑡 + 𝑍𝑖𝑡 + 𝛿𝑡 + 휀𝑖𝑡 (3)
Model (3) aims to assess the effects of wider influencing factors (WIFs) on industry
structure-ownership-regulation (EI). It specifies EIit, as a function of WIFit, for state i and
year t. Zit denotes unobserved state-specific factors that are independent of wider

108
influencing factors but have important influence on shaping industry structure-
ownership-regulation. a0 and εit are constant term and normal errors, respectively.
𝐼𝑃𝑖𝑡 = 𝑎0 + 𝑎1𝐸𝐼𝑖𝑡 + 𝑍𝑖𝑡 + 𝛿𝑡 + 휀𝑖𝑡 (4)
Model (4) aims to assess the effects of industry structure-ownership-regulation (EI) on
industry performance (IP). It specifies IPit, as a function of EIit, for state i and year t.
Similar to model (3), Zit denotes unobserved state-specific factors that are independent of
electricity structure-ownership-regulation, but have important influence on shaping the
industry performance. a0 and εit are constant term and normal errors, respectively.
The unobserved state-specific effects (Zit) may be caused by state-specific factors
including, for example, cultural background, energy endowment, climate and
geographical location. These effects are included in this model because we are not sure
whether explanatory variables (i.e., WIF and EI) in our models capture all relevant
characteristics of the state, so that we cannot directly use an OLR model. If we were to
do so, it would generate an omitted variable bias, and over- or under-estimation.
Therefore, we try to include these effects in this model by using either fixed effects (FE)
or random effects (RE) models. In FE model, these effects are assumed to be identical for
each state, and to be time independent. In RE model, these effects are estimated as
stochastic, arising from random causes. The validity of these two models in this research
will be tested by using Hausman test (Nagayama 2007).
4.3.2 Framework for assessing moderation effects
The framework for assessing moderation effects examines the impact of wider socio-
political influences (WIF) on the ability of industry structure-ownership-regulation (a1)
to influence industry performance (IP). This framework is built upon multilevel
regression models. The multilevel regression models normally involve a multilevel

109
system of regression equations. These equations are made up of at least one dependent
variable measured at the lowest level, and several independent variables at higher levels
(Hox 1995). These models are selected because performance indicators for a particular
Indian state tend to be highly dependent on each other, due to the existence of time- and
state-specific effects. Such dependence however violates the basic assumptions
(independence of the observations) of standard statistical models (e.g., ordinary least
regression with interaction terms), resulting in spurious estimates (Hox 1995).
The simplified multilevel regression model adopted in this research is formulated as:
𝐼𝑃𝑖𝑡 = 𝑎0 + 𝑎1𝐸𝐼𝑖𝑡 + 휀𝑖𝑡 (1)
𝑎1 = 𝑏0 + 𝑏1𝑊𝐼𝐹𝑖𝑡 + 𝛿𝑖𝑡 (2)
where IP represents the performance of the Indian electricity industry, for state i and year
t. It is a function of industry structure-ownership-regulation (EI) (see equation 1). In this
function, a1 represents the ability of EI to shape IP. This ability is a function of wider
influencing factor (WIF) (see equation 2). a0 and b0 are constant terms. ε and δ are error
terms.
4.3.3 Variable selection and data considerations
Table 4-2 presents definitions of the variables selected in this research to measure industry
performance (IP), industry structure-ownership-regulation (EI), and wider influences
(WIF).

110
Table 4-2: Definition of variables
Variables Definitions
Indu
stry
per
form
ance
(IP)
Energy deficit (ED) Total electricity deficit (% of total electricity requirement)
Peak deficit (PD) Peak electricity deficit (% of electricity requirement during the peak hours)
Forced outage rate (FoR) Number of hours electricity services is on forced outage (% of total number of hours in a year)
Network losses (NL) Network losses (% of total electricity supply)
Price-cost ratio for industry (PCI) Ratio between industrial electricity prices and average costs of electricity supply
Price-cost ratio for agriculture (PCA) Ratio between agricultural electricity prices and average costs of electricity supply
Ele
ctri
city
in
stitu
tions
(E
I)
Structure (S) Introduction of market competition
Degree of privatisation (P) Private generation (%of total generation)
Regulation (R) Establishment of independent regulator
Wid
er in
fluen
ces
(WIF
)
Rural interests (RI) Rural population (% of total population)
Domestic business interests (DBI) Industry value added (% of gross state domestic product)
External pressures for reform (EP) Interest payments on external debt, public guaranteed (current US$)
Centre-state relationship (CSR) Does the state ruling party the same as the central ruling party? 1 yes, 0 no

111
The following paragraphs provide a detailed discussion of these variables.
In this research, six variables are selected to measure the performance of the Indian
electricity industry. They include: energy deficit, peak deficit, forced outage rate, network
losses, price-cost ratio for industry, and price-cost ratio for agriculture. These variables
are selected because they provide measures of the adequacy, reliability, and affordability
of electricity provided by the Indian electricity industry. These three aspects of industry
performance, as argued in the Chapter 1, are highly appropriate for a country (like India)
where the provision of sufficient, reliable and affordable electricity is a priority for
promoting socio-economic development.
Three variables are selected to capture changes in industry structure-ownership-
regulation, arising from the introduction of market reforms since the early 1990s. They
include: industry structure (S), degree of privatisation (P), and establishment of
independent regulator (R). Dummy variables are used to analyse the impacts of these
variables on the performance of the Indian electricity industry.
In this research, four variables are used to measure the wider influences that have shaped
the national and electricity governance paradigms of the country. These variables include:
rural interests, domestic business interests, external pressures for reform, and centre-state
relationship. These variables are selected because they provide measures of the main
influences behind changes in the national governance paradigm. For example, as
discussed in the Chapter 2 of this thesis, the opposition to economy-wide market reform
mainly came from rural elites (such as, rich peasants and capitalist farmers), who had
come to rely on large amounts of government subsidies (such as, subsidised electricity),
fearing that reform would lead to the removal of subsidies that the government currently
provided them. The support for this reform mainly came from domestic business

112
community, based on the expectations that reforms could create investment opportunities
for them. Besides, pressures from external players (such as, the World Bank), as shown
in the Chapters 2, provided impetus to implement market reforms, as the Bank had made
reform as a condition for giving financial assistance to the country.
Data for the above noted variables was collected from a variety of sources (see Appendix
D). Industry performance data was taken from various publications of the Planning
Commission; this included data on energy (ED) and peak (PD) deficits, forced outage
rates (FoR), network losses (NL), prices and costs of electricity supply for calculating
price-cost ratios for industry (PCI) and agriculture (PCA). Data for institution-related
variables (S and R) was developed based on the year of introduction of various
components for reform (see Table D-11 in Appendix D). Private generation (% of total
generation) was used as a proxy for the degree of privatisation (P). It was taken from
various publications of the Planning Commission. Data for governance paradigms were
taken from various sources. For example, rural population, as a proxy for rural interest
(RI), was taken from the Indian census data. Industry value added, as a proxy for domestic
business interest (DBI), was taken from various publications of the Reserve Bank of India.
Public guaranteed interest payments on external debt, as a proxy for external pressure for
reform (EP), were taken from the database of the World Bank. A profile of Centre-State
relationships (CSR) was developed based on data taken from various publications of the
Election Commission of India.
Panel data for 17 Indian states, covering the period 1990-2015, are used in this research.
Some descriptive statistics of the data are presented in Table 4-3.

113
Table 4-3: A summary of descriptive statistics
Variables Obs. Mean Min. Max. S.D. Skewness Kurtosis
Energy deficit (ED) 422 7.8 0 31.9 6.9 1.2 1.0 Peak deficit (PD) 422 12.5 0 48.4 9.7 0.8 0.7 Forced outage rate (FoR) 422 15.8 1.6 58.6 12.0 1.6 2.0 Network losses (NL) 422 26.2 5.5 63.0 10.6 1.0 0.8 Price-cost ratio for industry (PCI) 422 1.3 0 3.4 0.5 0.7 1.8 Price-cost ratio for agriculture (PCA) 422 0.3 0 2.0 0.3 2.1 5.7 Structure (S) 422 0.4 0 1 0.5 0.4 -1.8 Degree of privatisation (P) 422 0.1 0 0.9 0.2 2.1 5.4 Regulation (R) 422 0.6 0 1 0.5 -0.3 -1.9 Rural interests (RI) 422 0.7 0.5 0.9 0.1 0.007 -0.8 Domestic business interests (DBI) 422 0.4 0.2 0.7 0.1 0.006 -0.5 External pressures for reform (EP) 422 21.6 20.8 22.2 0.4 -0.4 -1.4 Centre-state relationship (CSR) 422 0.3 0.2 0.5 0.1 0.5 -0.9
Notes: 1. obs. = observations; S.D. = standard deviation 2. Skewness is a measure of the asymmetry of the probability distribution of a variable about its mean. 3. Kurtosis is a measure of the ‘tailedness’ of the probability distribution of a variable.

114
A review of the table suggests that the performance of the Indian electricity industry has
been generally poor. Over the sample period 1990-2015 and across selected 17 Indian
states, for example, the mean of energy and peak deficits were 7.8% and 12.5%,
respectively. Besides, the forced outage rates were in the range of 1.6% to 58.6%, with
the average of 15.8%. Similarly, network losses were in the range of 5.5% and 63.0%,
with the average of 26.2%.
Besides, standard deviation is relatively high for some variables. For example, energy
deficit deviates from its mean by 6.9 on average. The corresponding figures are 9.7 for
peak deficit, 12.0 for forced outage rate, and 10.6 for network losses. This relatively high
value of standard deviation suggests that there are significant differences across the
sample period and the selected 17 Indian states in terms of these variables.
In addition, most variables are normally distributed as their skewness and kurtosis are in
the range of -1 and 1. There are also some exceptions. For example, energy deficit, forced
outage rate, price-cost ratio for agriculture, and degree of privatisation are positively
skewed. Forced outage rate, price-cost ratio for agriculture, and degree of privatisation,
have relatively high positive values of kurtosis, suggesting that these variables have
significantly high peaks.
The relationships among the selected variables are shown in a form of correlation matrix,
in Table 4-4. A review of the table suggests that many of the variables are strongly
correlated with each other. For example, the establishment of independent regulator (R)
is highly correlated with the introduction of market competition (S) and privatisation (P).
External pressure for reform (EP) is highly correlated with rural interest (RI) and domestic
business interest (DBI). This needs to be accounted for in conducting the analysis,
because the inclusion of highly correlated variables into the same statistical model might

115
cause multi-collinearity, resulting in imprecise estimation of coefficients (Gujarati 2011).
Since these coefficients are reflective of the magnitude of impacts that an explanatory
variable may have on the performance of electricity industry in India, the existence of
multi-collinearity among these variables means that the model is not able to precisely
estimate their impacts on industry performance.

116
Table 4-4: Correlation matrix of selected variables1
ED PD NL FoR PCI PCA S P R RI DBI EP CSR
ED 1**
PD 0.749** 1**
NL 0.282** 0.173** 1****
FoR 0.041** 0.057** 0.149** 1**
PCI -0.126** -0.140** -0.501** -0.134** 1**
PCA -0.082** -0.252** 0.105** 0.311** 0.149** 1
S -0.165** -0.320** -0.057** -0.147** 0.233** 0.228** 1**
P -0.263** -0.215** -0.366** -0.071** 0.194** 0.036** 0.176** 1**
R -0.224** -0.356** -0.040** -0.091** 0.132** 0.264** 0.684** 0.300** 1**
RI -0.022** -0.034** -0.191** 0.465** -0.270** 0.193** -0.106** -0.142** -0.226** 1**
DBI -0.189** -0.262** -0.285** -0.417** 0.326** 0.054** 0.424** -0.501** 0.510** -0.617** 1**
EP -0.013** 0.180** 0.042** 0.039** -0.073** -0.302** -0.541** -0.256** -0.669** 0.162** -0.509** 1**
CSR 0.097** 0.178** -0.090** -0.025** -0.031** -0.056** -0.064** -0.060** -0.101** 0.031** 0.072** -0.141** 1**
Note 1: ** = Correlation is significant at the 0.01 level (2-tailed); * = Correlation is significant at the 0.05 level (2-tailed).
Source: Table E-1 in Appendix E

117
4.4 Empirical results and discussion
This section examines both the mediation and moderation effects of wider influencing
factors (WIF) on shaping electricity institutions (i.e., industry structure, ownership and
regulation), and hence industry performance.
4.4.1 Mediation effects
The estimation results from Granger causality models (as in the form of models 1 and 2)
and mixed effect models (as in the form of models 3 and 4) are summarised in Tables 4-
5 and 4-6, respectively.
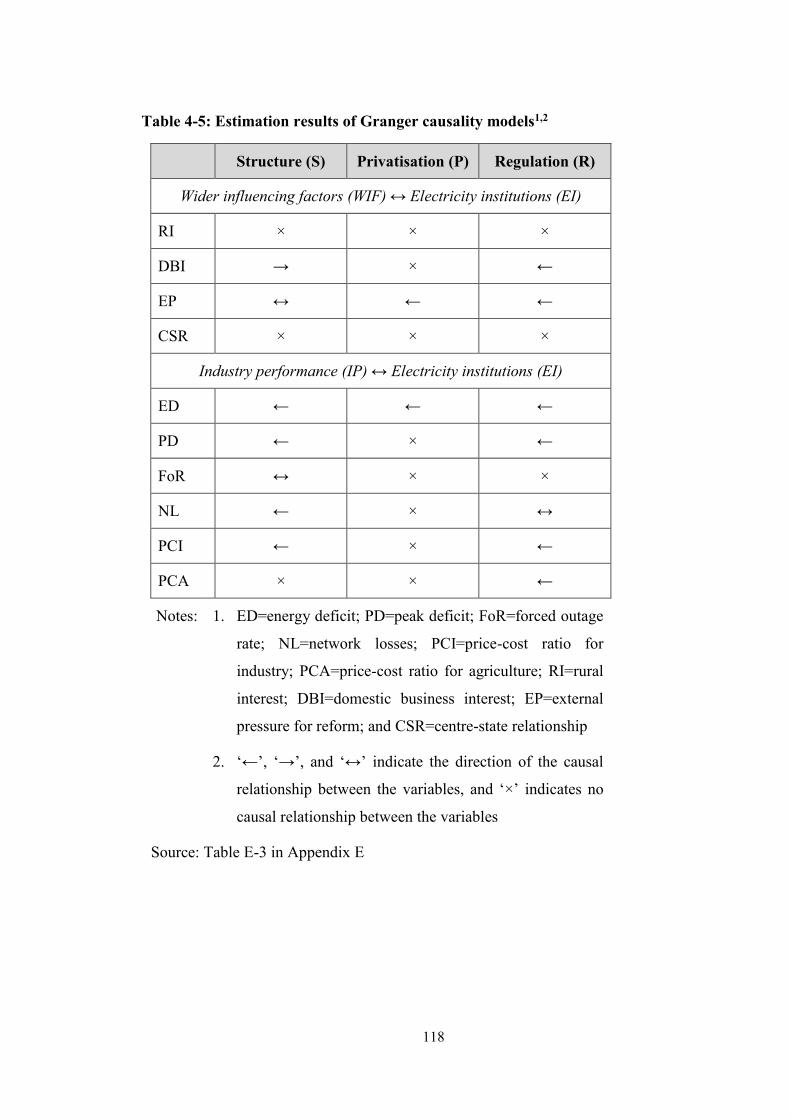
118
Table 4-5: Estimation results of Granger causality models1,2
Structure (S) Privatisation (P) Regulation (R)
Wider influencing factors (WIF) ↔ Electricity institutions (EI)
RI × × ×
DBI → × ←
EP ↔ ← ←
CSR × × ×
Industry performance (IP) ↔ Electricity institutions (EI)
ED ← ← ←
PD ← × ←
FoR ↔ × ×
NL ← × ↔
PCI ← × ←
PCA × × ←
Notes: 1. ED=energy deficit; PD=peak deficit; FoR=forced outage
rate; NL=network losses; PCI=price-cost ratio for
industry; PCA=price-cost ratio for agriculture; RI=rural
interest; DBI=domestic business interest; EP=external
pressure for reform; and CSR=centre-state relationship
2. ‘←’, ‘→’, and ‘↔’ indicate the direction of the causal
relationship between the variables, and ‘×’ indicates no
causal relationship between the variables
Source: Table E-3 in Appendix E

119
Table 4-6: Estimation results of mixed effect models
Structure (S) Privatisation (P) Regulation (R)
Wider influencing factors (WIF) → Electricity institutions (EI)
RI - - -
DBI ↑ (-3.11) - -
EP ↓ (-0.62) - -
CSR - - -
Electricity institutions (EI) → Industry performance (IP)
ED ↑ ( 1.46) ↑ ( 7.93) ↑ ( 1.97)
PD ↑ ( 5.56) - -
FoR ↓ (-1.71) - -
NL - - ↓ (-2.42)
PCI ↑ (-0.11) - -
PCA - - ↑ (-0.20)
Notes: 1. ‘↑’ means positive impacts with statistically significant at
10% level or above; ‘↓’ means negative impacts with
statistically significant at 10% level or above; ‘-’ means
that the coefficient is either not statistically significant
even at 10% level or is not estimated due to the non-
existence of causal relationship between the variables
2. Regression coefficients are shown in the bracket
Source: Tables E-4 and E-5 in Appendix E

120
Key observations, based on a review of Tables 4-5 and 4-6, are as follows:
a) Wider influencing factors (especially, domestic business interests, DBI) have
significant positive impact on industry structure (3.11, as shown in Table 4-6). This
suggests that domestic business interests are the main drivers behind the introduction
of market competition in the Indian electricity industry. This is understandable if one
takes notes of the fact that private sector (especially domestic) has shown significant
interests in market opening of the electricity industry, with the expectation that this
will provide new profit-making opportunities. These interests have resulted in the
development of a solid domestic support for market opening of the industry. This
support mainly includes companies working as engineering, procurement and
construction contractors for the industry (Pargal & Banerjee 2014).
b) There is an inverse relationship between external pressure for reform (EP) and
industry structure (S) (see Table 4-6). This relationship may be explained by the
general distrust among the Indian society towards globalisation and foreign economic
interests. High level of public debt may provide leverage for market reform; but it
could also create a fear of loss of national sovereign to foreign interests.
c) Table 4-5 shows that there is no causal relationship between rural interests (RI) and
electricity institutions (EI). This may reflect mixed views on electricity reform (as
part of the economy-wide market reform) in the rural communities across the states.
In some states (such as, Andhra Pradesh, Karnataka, and Punjab), for example,
wealthy big farmers have already taken to capitalist agriculture. They were therefore
largely supportive of market reform, based on the belief that this could provide them
with better access to foreign technology, capital and markets. In other states, the

121
farmer organisations strongly opposed market reform, fearing that this reform could
reduce benefits (e.g., electricity subsidies) that they currently enjoy (Pai 2010).
d) The impact of the structure-ownership-regulation of electricity industry on industry
performance is mixed. For example:
- As shown in Tables 4-5, electricity institutions have impacted total and peak
electricity deficits (ED and PD). These impacts, as presented in Table 4-6, are
positive. For example, industry structure (S) has positive impacts on total
(1.46) and peak (5.56) electricity deficits. Besides, privatisation (P) and
establishment of independent regulator (R) also have positive impact on total
electricity deficits (7.93 and 1.97, respectively). These positive impacts
suggest that electricity reform in India (namely, introduction of market
competition, privatisation and re-regulation) has contributed to reduced
electricity deficits. This can be explained by the fact that this reform has
encouraged large private investments for capacity expansion (thereby lower
total and peak electricity deficits). For example, recent years witnessed a
considerable increase of private-owned capacity in India, from only 2.5 GW
in 1991, to more than 62 GW in 2012. As a result, generation capacity in India
grew almost threefold from 78 GW in 1992, to 214 GW in 2012 (Pargal &
Banerjee 2014).
- According to Table 4-6, industry structure (S) has negative impact (-1.71) on
forced outage rates (FoR). This is understandable if one notes that market
competition may create pressure for suppliers to provide better maintenance,
hence lower forced outage rates.

122
e) Table 4-6 shows that independent regulation (R) has a negative impact (-2.42) on
network losses. This seems to support the observation made by some studies (see, for
example, Pargal and Banerjee, 2014) that most state regulators (SERCs) are unable to
perform their regulatory functions, due to insufficient technical, financial and human
resources. As a result, network companies have struggled to control losses, especially
in rural areas. Besides, the payment collection is also difficult in these areas, thus
contributing to worsening the financial outlook of network companies, and further
dampening their ability to improve technical performance (e.g., lower network losses).
f) Industry structure (S) seems to have widened the gaps between electricity price and
cost for industrial consumers, as indicated by a strong causal relationship between
structure and price-cost ratio for the industry (see Table 4-5), and positive impact of
structure on PCI (0.11 in Table 4-6). This can be explained by 1) significant cost
reduction, driven by increased market competition; and 2) continued cross
subsidisation between industrial and agricultural consumers, resulting in higher
industrial electricity prices.
g) The establishment of independent regulator (R) seems to have increased agricultural
prices, hence higher price-cost ratio for agriculture, as indicated by a positive impact
(0.20) of independent regulation (R) on PCA. This is probably due to the
implementation of pricing reforms by the regulators (SERCs) in various Indian states
aimed at reducing the level of agricultural subsidies.

123
4.4.2 Moderation effects
The estimation results from multilevel regression models are summarised in Table 4-7.
Table 4-7: Estimation results of multilevel regression models
ED PD FoR NL PCI PCA
S - - - - - - S×RI - - - - - - S×DBI - - - - - ↑ (-0.8) S×EP - - - - - - S×CSR - - - - - -
P ↑ ( 219.4) ↑ ( 244.9) - - - ↑ (-9.4) P×RI ↓ (-195.7) ↓ (-209.9) - - - ↓ (-7.8) P×DBI ↓ (-140.9) ↓ (-170.1) - - - ↑ (-8.5) P×EP - - - - - - P×CSR ↑ ( 235.5) ↑ ( 286.4) - - - ↑ (-3.6)
R ↑ (0 17.1) - - - ↓ (-1.2) - R×RI ↓ (0-13.7) - - - ↑ (-1.5) - R×DBI ↓ (0-11.7) - - - - - R×EP - - - - - - R×CSR - - - - - -
Notes: 1. S = industry structure; P = privatisation; R = independent regulation ;
RI = rural interests; DBI = domestic business interests; EP = external
pressure for reform; and CSR = central-state relationship
2. ‘↑’ means positive impacts with statistically significant at 10% level or
above; ‘↓’ means negative impacts with statistically significant at 10%
level or above; ‘-’ means that the coefficient is not statistically
significant even at 10% level
3. Regression coefficients are shown in the bracket
Source: Table E-6 in Appendix E

124
A review of the table suggests that wider influencing factors have significant impact on
the ability of electricity reform (through, for example, introduction of market competition,
privatisation, and establishment of independent regulation) to improve the performance
of the industry. For example:
a) Rural interests (RI) have adverse impacts on the ability of the industry structure-
ownership-regulation to influence industry performance. As shown in Table 4-7, for
example, privatisation (P) has positive impacts on total (219.4) and peak (244.9)
electricity deficits, suggesting that privatisation has the effect of reducing electricity
deficits. These effects could however be reversed if privatisation coexists with strong
rural interests, as indicated by negative impacts (-195.7 and -209.9) of the interaction
term (P×RI) on total and peak electricity deficits. Similarly, the establishment of
independent regulator (R) has a positive impact on total electricity deficits (17.1),
implying that independent regulation has the effects of reducing electricity deficits.
These effects could however be reversed by rural interests, as reflected by negative
impact (-13.7) of independent regulator, together with rural interests, on total
electricity deficits.
b) Table 4-7 suggests that privatisation (P), together with strong domestic business
interests (DBI), could lead to higher deficits of total and peak electricity supply. This
can be explained by two reasons. One, the IPP policy of the early 1990s has
encouraged large private (especially, domestic) investment in generation in the form
of independent power producers. Most commissioned IPP projects were designed to
meet base-load demand even though peak demand was the most pressing need of the
time. These projects therefore made limited contribution to alleviating the power
shortages of the times (Mukherjee 2014).

125
Two, after the enactment of the Electricity Act of 2003, competitive bidding was
introduced for private participation in generation. During the 11th Five-Year Plan
period (2007-2012), several biddings were made by private investors with low tariffs,
which would not fully recover the cost of supply, in the backdrop of rising imported
coal prices (Mukherjee 2014). This may has resulted in delays in project execution,
which would further contribute to widening the gaps between electricity supply and
demand.
c) Domestic business interests (DBI) appear to support the implementation of pricing
reforms in India. For example, Table 4-7 shows that privatisation has a positive impact
(9.4) on price-cost ratio for agriculture, suggesting the increase of agricultural prices
due probably to a gradual removal of electricity subsidies. This impact could become
deeper if privatisation coexists with strong domestic business interests, as indicated
by positive impacts (8.5) of the interaction term (P×DBI) on price-cost ratio for
agriculture.
d) Central and state relationship (CSR) seems to have contributed to smooth
implementation of market reform in the Indian electricity industry. For example,
Table 4-7 shows that privatisation has a positive impact on total (219.4) and peak
(244.9) electricity deficits. This impact could become deeper if privatisation has taken
place in states with good centre-state relationship, as reflected by positive impacts
(235.5 and 286.4) of the interaction between privatisation (P) and centre-state
relationship (CSR) on electricity deficits. This can be explained by the political
structure of cooperative federalism in India. This structure features consensus
building and multi-level decision making. It comprises two interdependent
constitutive elements, i.e., the central and state governments (Mitra & Pehl 2010).

126
This political structure frequently gives rise to tensions between central and state
governments, as they sometimes have different and conflicting interests in regard to
socio-economic governance (Garg, Gaha & Bajaj 2008). Good relationship between
central and state governments could facilitates consensus building, and consequently
contribute to smooth implementation of market reform in the electricity industry.
4.5 Summary
This chapter has assessed the impacts of wider socio-economic interests on the structure-
ownership-regulation and performance of the Indian electricity industry. Key findings of
this assessment are summarised as follows.
The wider interests (e.g., rural interests, and domestic business interests) have exerted
significant influence in shaping the structure-ownership-regulation of the electricity
industry in Indian, and consequently affecting the industry performance.
Rural interests (RI) seems to have opposed the implementation of market reform in
the Indian electricity industry. This is reflected by adverse impact of rural interests on
the ability of market reform to improve the performance of electricity industry, as
presented in Section 4.4.2. The rural opposition however varies across the country, as
indicated by no significant causal relationship between rural interests and industry
structure-ownership-regulation (see Table 4-5). This probably reflects mixed views
on electricity reform in rural communities across the country.
Domestic business interests (DBI) seems to have favoured the introduction of market
competition in the electricity industry, as reflected by its positive impact on industry
structure. The introduction of market competition has led to some improvements in
the industry performance, such as, lower electricity deficits, reduced forced outage
rates, and reduced cross subsidisation. Besides, domestic business interests also seem

127
to have encouraged private investment in the electricity industry. This investment has
however only made a limited impact on reducing electricity deficits, due probably to
slow project execution.
Better central and state relationship (CSR) appears to have contributed to smooth
implementation of market reform in the electricity industry, as reflected by a more
significant impact of privatisation on reducing electricity deficits, if privatisation has
taken place in states with good centre-state relationship (see Section 4.4.2).
In summary, the analysis of this chapter has demonstrated the significance of wider socio-
economic interests in shaping the structure-ownership-regulation and performance of the
Indian electricity industry. This further provides validation to the argument made in
Chapter 3 that causes of poor industry performance are deeply rooted in the electricity
governance processes, which have historically favoured the use of electricity as the means
of subserving wider governance priorities and agendas, aimed at promoting socio-
economic development of India. These priorities and agendas have arisen from a range
of political and socio-economic interests. This perspective makes electricity governance
merely a process of serving dominant interests of the time. In these processes, issues of
industry performance become subordinate to wider interests, thereby limited action for
improving industry performance.
This research therefore suggests that the performance of the Indian electricity industry
can only be improved by an appreciation of the influence of these wider socio-economic
interests that have shaped the contours of the industry, because this appreciation could
enable a considered accommodation, into the electricity governance processes, of
dominant socio-political interests of the time, which will in turn improve the efficacy of
electricity governance, and hence contribute to better industry performance. The next

128
chapter will develop the strategy for improving the efficacy of electricity governance, and
demonstrate how this strategy can contribute to improving the performance of electricity
industry.

129
5 SOME SUGGESTIONS FOR IMPROVING INDUSTRY PERFORMANCE
5.1 Introduction
The analysis in the previous chapters showed that the structure-ownership-regulation of
the Indian electricity industry is essentially determined by the underlying electricity and
national governance paradigms. The contours of these paradigms in turn are shaped by
the dominant socio-economic interests of the time. This perspective on electricity industry
essentially makes electricity governance a process of serving dominant interests of the
time. In such processes, issue of industry performance therefore assumed a dormant role.
Poor industry performance is therefore a natural outcome.
Against the above backdrop, this research argues that a way to rectify the situations is to
improve the efficacy of electricity governance processes, through a considered
accommodation, into these processes, of dominant socio-economic interests of the time.
This chapter aims to develop a strategy for better accommodating these socio-economic
interests, and to demonstrate how this accommodation strategy can contribute to
improved efficacy of electricity governance processes, and hence better industry
performance.
This chapter is structured as follows. Section 5.2 reviews existing strategies in the
literature for improving the efficacy of governance processes. This section also discusses
the appropriateness of these strategies in the context of India. Based on these approaches,
Section 5.3 presents some thoughts on how India’s electricity governance processes can
be improved, and how this improved governance can contribute to better industry
performance. Section 5.4 provides a summary of the main findings of this chapter.

130
5.2 Existing strategy for improving the efficacy of governance
Several studies have been undertaken to understand the causes of poor governance, and
to provide suggestions for improving its efficacy. These studies include, for example,
Crozier et al. (1975), Dahrendorf (1980), Kohli (1990), Huntington (1968), Shifter (2008),
United Nations (2004) and World Bank (2017). Section 5.2.1 presents the key features of
these studies, in particularly their scope, causes of poor governance, and suggestions for
improving the efficacy of governance. These features are then, in Section 5.2.2, analysed
with the aim of identifying the most appropriate approaches for improving India’s
electricity governance processes as the means of improving the performance of electricity
industry in the country.
5.2.1 Key features of existing studies
Crozier, Huntington & Watanuki (1975) attributes poor governance in major
developed countries (such as, Japan, Western European countries, and the United States)
in the early-to-mid 1970s to the inability of the governments to build consensus for
addressing pressing issues facing these countries (such as, rising inflation). As argued in
this study, ‘Conflicting goals and specialised interests crowd in one upon another, with
executives, cabinets, parliaments, and bureaucrats lacking the criteria to discriminate
among them. The system becomes one of anomic democracy, in which democratic
politics becomes more an arena for the assertion of conflicting interests than a process for
the building of common purposes’ (Crozier, Huntington & Watanuki 1975, pp 161). This
inability to build consensus, as argued in Crozier, Huntington & Watanuki (1975), is
primarily caused by a de-legitimation of government, due to: 1) a gradual erosion of social
institutions (e.g., trade unions, business enterprises, professional associations, churches,
and civic groups); 2) the disaggregation of needs and interests as indicated by the rising
131
number of political parties; and 3) the ‘overloading’ of government. Accordingly, a re-
legitimisation of government is suggested as the means of improving the efficacy of
governance. This, it is further suggested, can be achieved by, for example, creation of
new socio-political institutions for promoting cooperation among various social groups,
and reinvigoration of political parties to adapt to changing needs and interests of the
electorate.
Coppedge (2001) argues that the efficacy of governance may sometimes be undermined
by representative democracy. This argument is explained as follows. In representative
democracy, it is preferable to have ‘a large number of parties, to represent all possible
combinations of positions on all the relevant issues; and rigid parties that resist
compromising on the mandate received from the voters and have sharp issue differences
with other parties’. Such a party system, however, tends to be ‘divisive, polarised, and
indecisive’ (Coppedge 2001, pp 180). It could therefore undermine the efficacy of
governance by making it difficult to build consensus for policy making.
It is argued in Dahrendorf (1980) that poor governance of many developed countries
(such as, Germany, United Kingdom, and United States) in the mid-to-late 1970s was
primarily caused by the lack of legitimacy of the governments. He explained this
argument as follows. In these countries, the governments of the times were unable to
‘satisfy rising expectations’ and to ‘absorb changes in values and social structure’
(Dahrendorf 1980, pp 406). As a result, ‘people ceased to expect the election of their party
to make them better off’. The outcome of this is ‘not a politics of protest, but a politics of
quiet disillusion, a politics in which lack of involvement or indifference to organised party
politics’ (Dahrendorf 1980, pp 396). The legitimacy of the governments was therefore
adversely affected, because what they do is not ‘right both in the sense of complying with
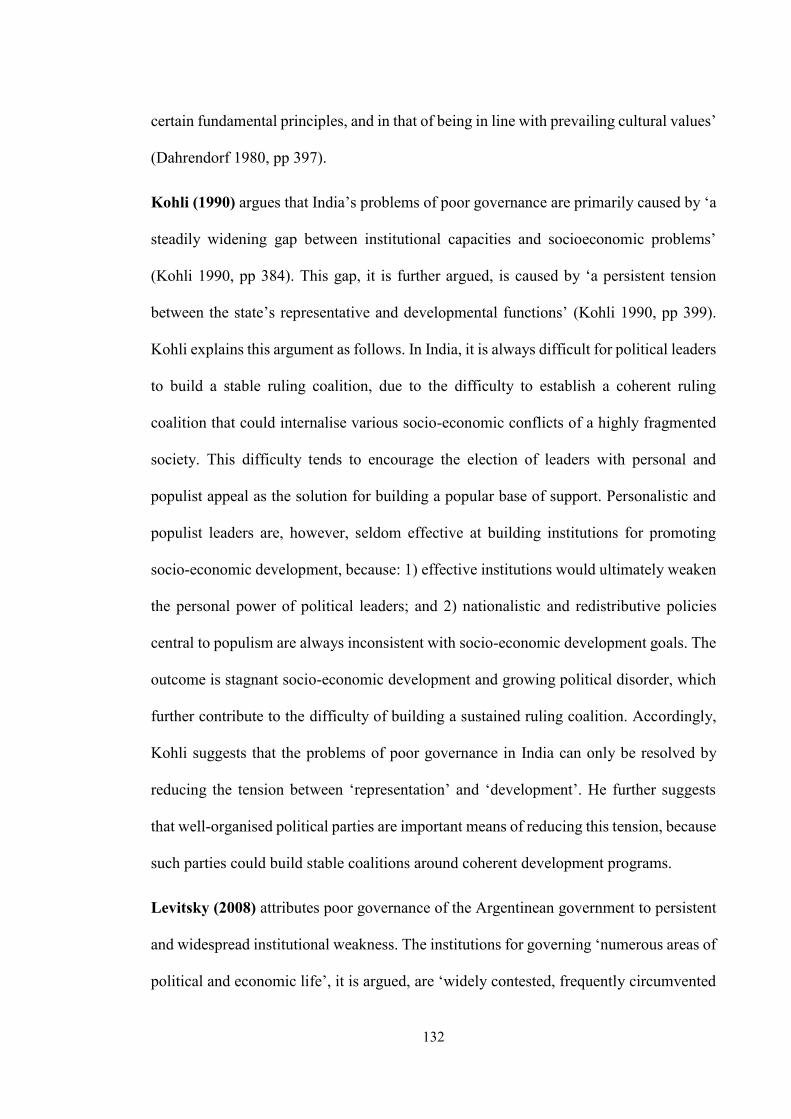
132
certain fundamental principles, and in that of being in line with prevailing cultural values’
(Dahrendorf 1980, pp 397).
Kohli (1990) argues that India’s problems of poor governance are primarily caused by ‘a
steadily widening gap between institutional capacities and socioeconomic problems’
(Kohli 1990, pp 384). This gap, it is further argued, is caused by ‘a persistent tension
between the state’s representative and developmental functions’ (Kohli 1990, pp 399).
Kohli explains this argument as follows. In India, it is always difficult for political leaders
to build a stable ruling coalition, due to the difficulty to establish a coherent ruling
coalition that could internalise various socio-economic conflicts of a highly fragmented
society. This difficulty tends to encourage the election of leaders with personal and
populist appeal as the solution for building a popular base of support. Personalistic and
populist leaders are, however, seldom effective at building institutions for promoting
socio-economic development, because: 1) effective institutions would ultimately weaken
the personal power of political leaders; and 2) nationalistic and redistributive policies
central to populism are always inconsistent with socio-economic development goals. The
outcome is stagnant socio-economic development and growing political disorder, which
further contribute to the difficulty of building a sustained ruling coalition. Accordingly,
Kohli suggests that the problems of poor governance in India can only be resolved by
reducing the tension between ‘representation’ and ‘development’. He further suggests
that well-organised political parties are important means of reducing this tension, because
such parties could build stable coalitions around coherent development programs.
Levitsky (2008) attributes poor governance of the Argentinean government to persistent
and widespread institutional weakness. The institutions for governing ‘numerous areas of
political and economic life’, it is argued, are ‘widely contested, frequently circumvented

133
or violated, and repeatedly changed’. This resulted in ‘high levels of uncertainty, narrow
time horizons, and minimal trust and cooperation, all of which leaves both the economy
and the polity vulnerable to crisis’ (Levitsky 2008, pp 99-100). The economic and
political crisis further weakened the economic and political institutions, as it ‘triggers
efforts to circumvent or change the rules’ (Levitsky 2008, pp 122). During the 2001-02
crises, for example, many Argentines complained about the absence of judicial
independence. They demanded a purge of the Supreme Court. The President’s purge of
the Court however weakened the legal institutions by enhancing executive control over
the Magistrates Council, a body created by the 1994 Constitution to oversee the
appointment and removal of federal judges (Levitsky 2008).
Huntington (1968) attributes poor governance of many developing countries in the 1950s
and 60s to political instability. This political instability, it is argued, is caused by ‘rapid
social change and the rapid mobilisation of new groups into politics coupled with the slow
development of political institutions’ (Huntington 1968, pp 4). Social changes (such as,
urbanisation, increases in literacy and education, and mass media expansion) ‘extend
political consciousness, multiply political demands, broaden political participation’,
which in turn creates demand for new political institutions that could incorporate these
changes. This demand however is largely unmet, resulting in political instability and
disorder.
Mainwaring (1993) argues that presidentialism is one of the main factors responsible for
poor governance. This argument is explained as follows. Under presidential system, the
president may not always enjoy legislative support, due to factors including: 1) the
president’s party does not enjoy a majority in the legislature; 2) the president is unable to
build a coalition of parties that provides a majority; and 3) the president is unable to

134
govern by creating shifting coalitions. As a result, even though presidents are powerful
relative to the legislature in most presidential democracies, they often have difficulties in
implementing their policy agendas (thereby poor governability), because of legislature
opposition. Besides, Mainwaring also argues that the tendency toward
executive/legislative deadlock is particularly acute in multiparty systems, because
coalition-building is more difficult under multiparty systems, thereby complicating
executive/legislative deadlock problems associated with presidentialism.
Nasr (1992) argues that the crisis of governance in Pakistan in the late 1980s is primarily
attributable to weak government of the times that encouraged the pursuit of patronage.
The pursuit of patronage resulted in the erosion of institutions (such as, government
agencies and public utilities) for governing socio-economic development of the country.
The economic performance of the country was therefore sluggish. This sluggish
development in turn led to widespread social discontent, which further weakened the
government. Further, Nasr attributes the weak government to three factors, namely, its
lack of political power, due to the presence of strong military influence; organisational
weaknesses of the ruling party because of strong personal rules; and unpopular party
leaders.
It is argued in Santiso (2001) that governance of a country is primarily attributable to its
democratic institutions, i.e., an efficient executive, a functioning legislature, an
independent judiciary, and effective and balanced separation of powers. Therefore, for
the country to improve its governance, it will need to explicitly improve its democratic
institutions.
As argued in Sauquet & Vielajus (2009), poor governance of many African, Andean
American and Central Asian countries is primarily caused by poor participation in

135
democratic elections, as it seriously undermines the legitimacy of elected governments.
This poor participation, it is further argued, is the outcomes of conflicts between
‘traditional’ and ‘democratic’ leader selection models in these countries. Under the
traditional model, for example, the elders normally have greater say over the leader
selection in many African towns and villages. This is in conflict with the democratic
leader selection model, because this model gives equal weights to an eighteen-year-old
as that of an elder in the leader selection. Accordingly, the resolution of these conflicts is
suggested as the way to improve the efficacy of governance in these countries. The
encouragement of greater social participation in shaping the leader selection models is
considered as important means to achieve resolution of conflicts.
Shifter (2008) attributes poor governance of major Latin American countries to ‘a
nagging institutional deficit’ that reduces the ability of the governments of these countries
to satisfy growing social demands, such as, poverty reduction, social inclusion, and better
delivery of public services (e.g., health, energy and education). The failure of the
governments to satisfy these demands is ‘a recipe for enormous social frustration and
discontent’, which further undermines the legitimacy of the governments (thereby poor
governance) (Shifter 2008, pp 5). Institutional reforms focused at improving the ability
of the governments to satisfy rising social demands are accordingly suggested as the
means of improving the efficacy of governance in these countries. It is also suggested that
political leadership is important for promoting these reforms, because effective political
leadership could contribute to the formation of a national consensus to pursue necessary
institutional reforms that could address growing social demands in these countries.
United Nations (2004) argues that limited public involvement in policy-making
processes is the main causes of poor governance in most African countries. This limited

136
public involvement, it is further argued, is due to factors, such as, inadequate legal and
institutional arrangements for public involvement, and insufficient resources (human,
financial and technical) for parliamentarians to engage the public. Accordingly, improved
legal and institutional arrangements and better provision of resources are suggested as the
means of encouraging public involvement in policy-making processes; hence better
governance.
World Bank (1989) argues that ‘underlying the litany of Africa’s development problems
is a crisis of governance’ (World Bank 1989, pp 60). This crisis, it is further argued, is
caused by widespread corruption in most African countries. ‘A concerted attack on
corruption from the highest to the lowest levels’ is accordingly suggested as the means of
improving the efficacy of governance in these countries. This involves ‘setting a good
example, by strengthening accountability, by encouraging public debate, and by nurturing
a free press’. This also involves ‘empowering women and the poor by fostering grassroots
and non-governmental organisations, such as, farmer associations, cooperatives and
women’s groups’ (World Bank 1989, pp 6).
World Bank (2016a) argues that poor governance is the direct outcome of ‘unhealthy’
political engagement, such as, vote buying, patronage, and strong interest group influence.
This is so because unhealthy political engagement would provide ‘adverse political
incentives’ for political leaders to ‘extract private benefits from the public sector’. As a
result, effective policies for promoting socio-economic development are not always
adopted and implemented. This would negatively affect development outcomes, which in
turn undermine the legitimacy of the government, further weakening its ability to adopt
and implement development policies. Further, unhealthy political engagement, as argued
in World Bank (2016a), is primarily caused by the lack of public involvement and
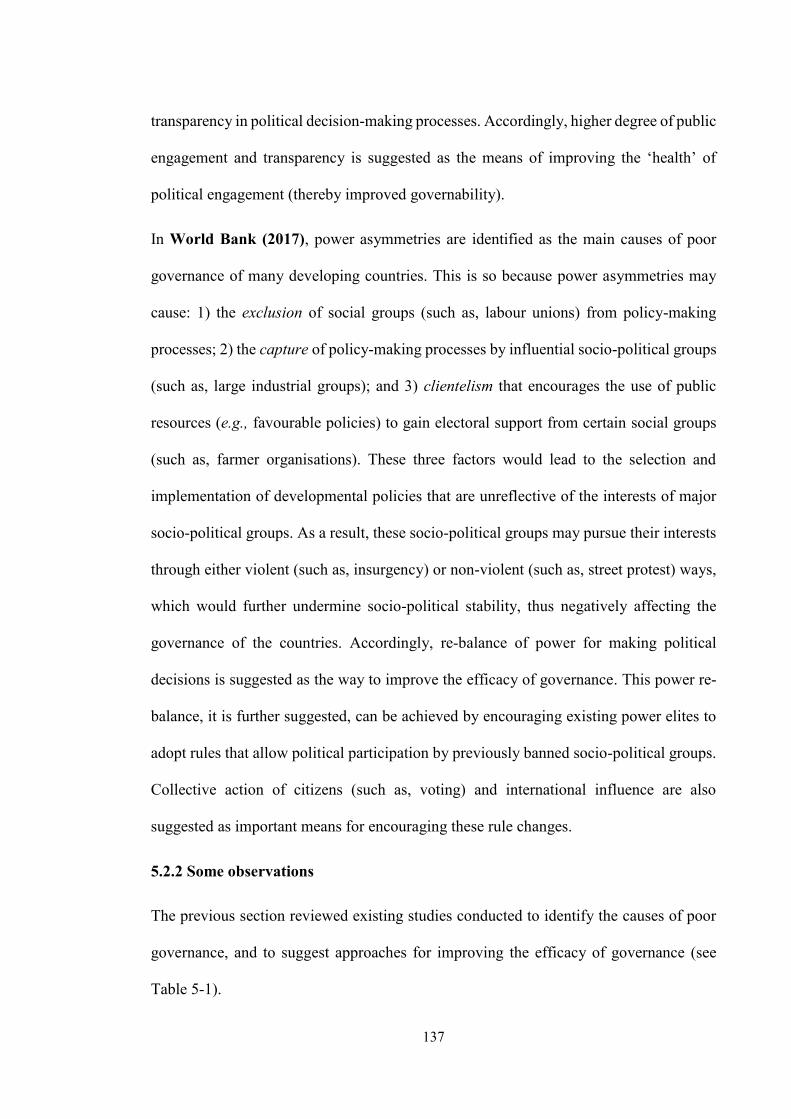
137
transparency in political decision-making processes. Accordingly, higher degree of public
engagement and transparency is suggested as the means of improving the ‘health’ of
political engagement (thereby improved governability).
In World Bank (2017), power asymmetries are identified as the main causes of poor
governance of many developing countries. This is so because power asymmetries may
cause: 1) the exclusion of social groups (such as, labour unions) from policy-making
processes; 2) the capture of policy-making processes by influential socio-political groups
(such as, large industrial groups); and 3) clientelism that encourages the use of public
resources (e.g., favourable policies) to gain electoral support from certain social groups
(such as, farmer organisations). These three factors would lead to the selection and
implementation of developmental policies that are unreflective of the interests of major
socio-political groups. As a result, these socio-political groups may pursue their interests
through either violent (such as, insurgency) or non-violent (such as, street protest) ways,
which would further undermine socio-political stability, thus negatively affecting the
governance of the countries. Accordingly, re-balance of power for making political
decisions is suggested as the way to improve the efficacy of governance. This power re-
balance, it is further suggested, can be achieved by encouraging existing power elites to
adopt rules that allow political participation by previously banned socio-political groups.
Collective action of citizens (such as, voting) and international influence are also
suggested as important means for encouraging these rule changes.
5.2.2 Some observations
The previous section reviewed existing studies conducted to identify the causes of poor
governance, and to suggest approaches for improving the efficacy of governance (see
Table 5-1).

138
Table 5-1: Existing studies on improving the efficacy of governance: Key features
Authors Scope Causes of poor governance Suggestions for improving the efficacy of governance
Society-centred approach
Santiso (2001) - Major developing
countries
- Weak democratic institutions typified by inefficient
executive, malfunctioning legislature, and judiciary
with limited autonomy
- Improved democratic institutions with efficient
executive, functioning legislature, and independent
judiciary
Sauquet and Vielajus
(2009)
- Major developing
countries
- Lack of legitimacy of elected governments, due
primarily to poor participation in democratic elections
- This poor participation is caused by the conflicts
between ‘traditional’ and ‘democratic’ leader selection
models
- A resolution of the conflicts between ‘traditional’ and
‘democratic’ leader selection models
United Nations
(2004)
- Major African countries - Limited public involvement in policy-making
processes
- Caused by inadequate legal and institutional
arrangements for public involvement, and insufficient
resources for parliamentarians to engage the public
- Legal and institutional reforms focused at encouraging
public involvement in policy-making processes
- Better provision of resources
Note: Table continues on next page.
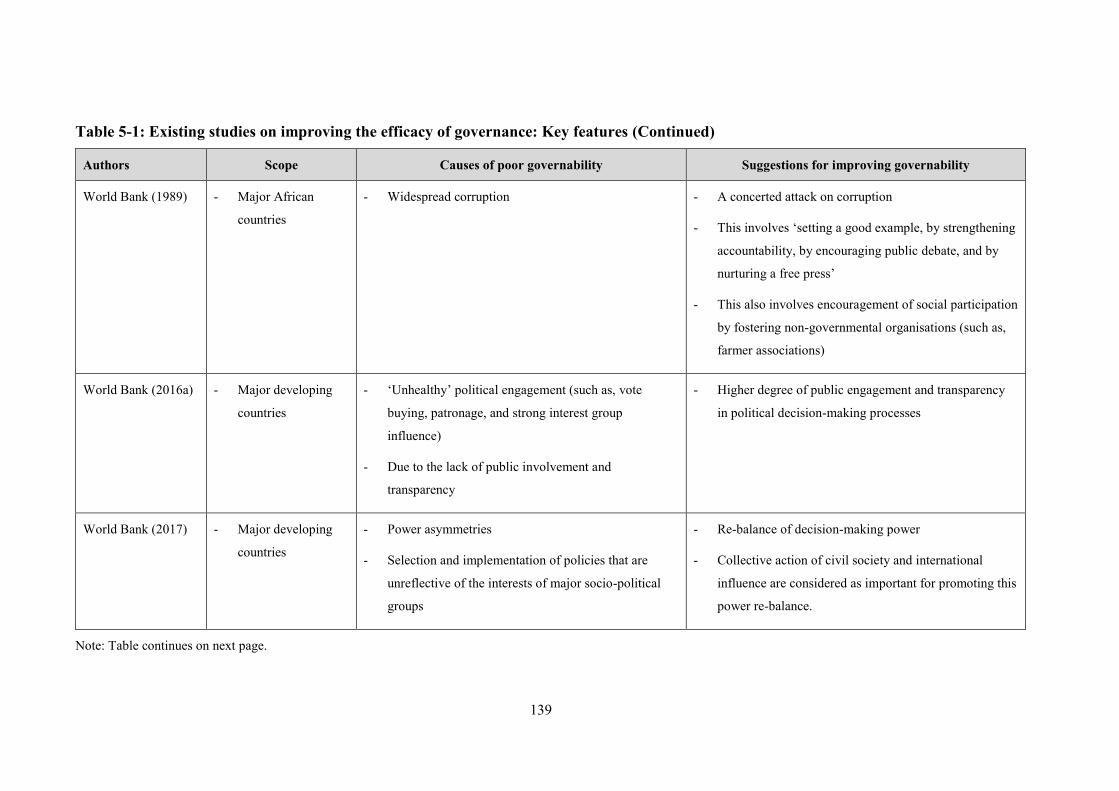
139
Table 5-1: Existing studies on improving the efficacy of governance: Key features (Continued)
Authors Scope Causes of poor governability Suggestions for improving governability
World Bank (1989) - Major African
countries
- Widespread corruption - A concerted attack on corruption
- This involves ‘setting a good example, by strengthening
accountability, by encouraging public debate, and by
nurturing a free press’
- This also involves encouragement of social participation
by fostering non-governmental organisations (such as,
farmer associations)
World Bank (2016a) - Major developing
countries
- ‘Unhealthy’ political engagement (such as, vote
buying, patronage, and strong interest group
influence)
- Due to the lack of public involvement and
transparency
- Higher degree of public engagement and transparency
in political decision-making processes
World Bank (2017) - Major developing
countries
- Power asymmetries
- Selection and implementation of policies that are
unreflective of the interests of major socio-political
groups
- Re-balance of decision-making power
- Collective action of civil society and international
influence are considered as important for promoting this
power re-balance.
Note: Table continues on next page.

140
Table 5-1: Existing studies on improving the efficacy of governance: Key features (Continued)
Authors Scope Causes of poor governability Suggestions for improving governability
State-centred approach
Crozier, Huntington
& Watanuki (1975)
- Major developed
countries
- Early-to-mid 1970s
- Inability of the governments to build consensus for
addressing pressing issues (such as, rising inflation)
- This inability is primarily caused by de-legitimation of
government, due to gradual erosion of social
institutions (such as, trade unions, churches, and civic
groups), disaggregation of interests, and overloading
of government.
- Re-legitimation of government by, for example,
creation of new socio-political institutions for
promoting cooperation among various social groups,
and reinvigoration of political parties to adapt to
changing needs and interests of the electorate.
Coppedge (2001) - Latin American
countries
- Inability of the governments to build consensus for
policy making
- This inability is primarily caused by representative
democracy with ‘divisive, polarised, and indecisive’
party systems
N.A.
Dahrendorf (1980) - Major developed
countries
- Mid-to-late 1970s
- Lack of legitimacy of governments, due primarily to
their inability to ‘satisfy rising expectations’ and to
‘absorb changes in values and social structure’
N.A.
Note: Table continues on next page.

141
Table 5-1: Existing studies on improving the efficacy of governance: Key features (Continued)
Authors Scope Causes of poor governability Suggestions for improving governability
Kohli (1990) - India
- 1980s
- A gap between institutional capacities and socio-
economic problems, due to ‘a persistent tension
between the state’s representative and developmental
functions’
- A resolution of the tension between ‘representation’ and
‘development’
Levitsky (2008) - Argentina - Persistent and widespread institutional weaknesses for
governing political and economic activities
N.A.
Huntington (1968) - Major developing
countries
- 1950s and 60s
- Political instability, due to mismatch between rapid
social changes and slow development of political
institutions to adapt to these changes
N.A.
Mainwaring (1993) - Major developing
and developed
countries with
presidential systems
- Presidentialism that is vulnerable to
executive/legislative deadlock
- This deadlock is further complicated by multiparty
systems
N.A.
Note: Table continues on next page.

142
Table 5-1: Existing studies on improving the efficacy of governance: Key features (Continued)
Authors Scope Causes of poor governability Suggestions for improving governability
Nasr (1992) - Pakistan
- 1980s
- Weak government that encouraged pursuit of
patronage
- Three factors are responsible for this weakness
including: lack of political power, organisational
weakness of the ruling party, and unpopular party
leaders
N.A.
Shifter (2008) - Major Latin American
countries
- Institutional weaknesses that reduce the ability of the
governments to satisfy growing social demands, such
as, poverty alleviation, social inclusion, and better
delivery of public services
- Institutional reforms focused at improving the ability of
governments to satisfy rising social demand
- Political leadership is considered as important for
implementing these reforms
Note: N.A. means suggestions for improving the efficacy of governance are not provided in the study
Source: Developed by the author based on discussion in section 5.2.1

143
This review suggests that there are two main approaches for improving the efficacy of
governance in the literature, namely, society-centred approach, and state-centred
approach. These two approaches attribute poor governance to different causes, and
accordingly seek to improve the efficacy of governance in quite different ways.
1) The society-centred approach, for example, primarily attributes poor governance to
weak society that fails to articulate its interests in the political decision-making
processes, due to factors, such as, insufficient resources (human, financial, and
technical) for public engagement (United Nations 2004), lack of transparency in the
political decision-making processes (World Bank 2016a), and power asymmetries
that encourage political capture and clientelism (World Bank 2017). As a result, the
governments always select and implement policies that are unreflective of the
interests of major social groups (such as, farmer organisations, labour unions, and
professional associations). These social groups therefore frequently seek to pursue
their interests through either violent (such as, insurgency) or non-violent (such as,
street protest) ways, which in turn undermine socio-political stability, and hence
adversely affect the governability of the country. Accordingly, the society-centred
approach suggests several ways to better accommodate various social interests, as the
means of improving the efficacy of governance. They include, for example, better
provision of resources for parliamentarians to engage the public (United Nations
2004), higher degree of transparency in political decision-making processes (World
Bank 2016a), and more equal power distribution among the society (World Bank
2017).
2) In contrast, the state-centred approach tends to attribute poor governance to weak
state, such as, weak political institutions (Levitsky 2008, Mainwaring 1993), polarised
and fragmented party systems (Coppedge 2001), and ineffective political parties

144
(Nasr 1992). These factors, it is argued, frequently lead to gridlock and rigidness in
political decision-making, which in turn reduce the ability of the government to make
difficult political decisions to satisfy the needs and interests of major social groups
(such as, farmer organisations, labour unions, and business associations). This always
leads to widespread social discontent, which further weakens the governability of the
country. Further, this approach argues that weak state is deeply rooted in the
underlying ‘social structure’ that enables the society to resist political authority and
prevent the development of a strong state (Huntington 1968, Fukuyama 2011).
Accordingly, the state-centred approach suggests a stronger state as the means of
improving the efficacy of governance. It also suggests that the strength of the state
can be enhanced by a better accommodation of social demand by, for example,
creation of new socio-political institutions for promoting cooperation among various
social groups (Crozier et al. 1975).
3) Based on the above discussion, this research argues that the state-centred approach
would be the most appropriate approach for improving the efficacy of electricity
governance in India. This is mainly because poor governance of India, as shown in
Chapter 2, is primarily caused by a weak Indian state (e.g., growing political
regionalism, multiple party competition, and unstable ruling coalition) that has
become increasingly incapable of satisfying the interests and needs of various social
groups (such as, farmer organisations, labour unions, and business associations). The
state-centred approach, referred to above, is focused on strengthening the state as the
means of improving the efficacy of governance. It can, this research contends, provide
appropriate guidance for developing policy measures to improve the efficacy of
governance in India.

145
5.3 Some suggestions for improving India’s electricity governance
This section will present some thoughts on how to strengthen the Indian state as the means
of improving electricity governance in the country. It will also demonstrate how this
improved governance can contribute to better performance of electricity industry in India.
Nature of the weak Indian state: A disconnection between the state and society
The indigenous and traditional Indian society was structured based on a multiplicity of
patron-client relationships (such as, kinship, caste, and religion), dominated by a small
group of local elites (such as, dominant castes, ethnic leaders and wealthy land owners)
(Krishna 2010). This social structure has historically empowered the Indian society to
resist the development of a strong state that ‘could aspire to reach deeply into society and
change its fundamental social institutions…not under an indigenous Hindu government,
not under the Moghuls, and not under the British’ (Fukuyama 2011, pp 187). After
independence, the Indian state did not put in place a new structure of authority in the local
communities; but rather built up its authority by accommodating the indigenous social
structure, through close collaboration with local elites, to control those below them in the
local communities (Krishna 2010).
This strategy however disconnects the state authority from the local society. As Fuller
and Harriss (2000) put it, ‘the state can and often does appear to people in India as a
sovereign entity set apart from society…a local administrative office, a government
school, a police station; to enter any of these is to cross the internal boundary into the
domain of the state’ (Fuller & Harriss 2000, pp23).
This disconnection weakens the governability of the country, especially at the local level.
Because local leaders, sensitive to the base of their political support, have often remained
adamantly independent, as, for example, in their refusal to levy taxes on agricultural

146
income as the central government has recommended (Hardgrave 1970). Similarly, as
argued by Weiner (1962), ‘There is a marked change in attitudes…as one leaves the
offices of ministers and planners in New Delhi and enters the homes of state
legislators…the distance of the national leadership from rural political pressures disposes
them toward a program which they justify on economic grounds, while state and local
leaders are sensitive within their constituencies and are therefore disposed towards
policies on political considerations’ (Weiner 1962, p. 152).
Suggested strategy for strengthening the Indian state
This research suggests a strategy to strengthen the Indian state, as the means of improving
the efficacy of electricity governance in the country. This strategy seeks to directly
connect the state authority and local communities, bypassing the powerful local elites.
Some key aspects of this strategy are presented below.
1) Strong political parties: Strong political parties with effective party organisation are
needed to directly connect the state authority and local communities. Because the
interests of local communities (especially, in the rural areas) are primarily articulated
in the country’s policy-making processes through the mediation of powerful local
elites. This always leads to ineffective interest articulation, as these elites may tend to
pursue their own interests (such as, wealth and power) at the expense of the wider
society. The resulting social discontent is frequently mobilised by opportunistic
politicians for the pursuit of their political interests (such as, winning an election).
This political mobilisation may provide some short-term partisan benefits; but would
dampen the governability of the country over the long-term (also see Kohli 1990).
Besides, it has been witnessed in recent years that young and educated villagers (also
known as naya neta) are becoming new local leaders in demanding benefits from the

147
government (Krishna 2010). These local leaders could be incorporated into party
organisations, acting as the connection between political parties and local
communities. The incorporation of these new local leaders into the party organisations
means that they could be subject to party discipline in the process of political
mobilisation, hence reducing the magnitude of undisciplined political mobilisation.
2) Strong political leadership: Political leadership is weak in India, focusing primarily
on the sectarian demands – caste, language, religion, etc. (Guha 2010). This weak
leadership, this research argues, tends to weaken the Indian state by encouraging
political fragmentation. The increasingly fragmented Indian polity further highlights
the importance of maintaining political support at the local level, thereby increased
needs for political parties to collaborate with powerful local elites.
Accordingly, this research suggests that strong political leadership, focusing on the
interests of the country as a whole, is important to strengthen the Indian state, because
it would reduce the magnitude of political fragmentation in India. The outcome would
be reduced needs for political parties to collaborate with local elites. Thus, they would
be more willing to build direct connection with the local communities.
3) Well-defined vision for national development: The prevalent strategy for political
mobilisation in India, as argued by Guha (2010), emphasises ‘a rhetoric of fear –
warning the members of a caste, or religion, or region, that they would be swamped
by their enemies if they do not bind together’ (Guha 2010, pp 295). This mobilisation
strategy, this research argues, tends to weaken the Indian state by encouraging
political fragmentation, which provides strong incentives for political parties to
collaborate with powerful local elites, hence little incentives for them to build strong
connection with local communities.

148
Therefore, this research suggests an alternative strategy for political mobilisation,
focusing on national socio-economic development, as the means of encouraging
political parties to build strong connection with the local communities. This is because
socio-economic development (vikaas) has increasingly become the priority for India.
A political party with a well-defined vision for national development is therefore more
likely to win electoral support from the local communities. The outcome would reduce
the need for political parties to rely on powerful local elites for political support.
Contribution to better performance of electricity industry
The suggested strategy for improving the efficacy of electricity governance as noted
above could contribute to better performance of the electricity industry. Some points to
further lend credence to this viewpoint are provided as follows.
1) Electricity subsidies are identified by several studies (such as, Pargal and Banerjee
2014 and Dubash, and Rajan 2001) as one of the main causes of poor industry
performance. For example, state electric utilities (SEBs) are frequently required by
state governments to subsidise rural consumers (especially, agricultural) through low-
than-cost electricity prices or even free electricity. The main motivation for the
provision of these subsidies, it is argued, is to gain electoral support from rural
communities that represent a significant proportion of the population. The outcomes
of these subsidies are however huge financial losses for state electric utilities. These
utilities had to be bailed out twice in recent years, costing $7.4 billion in 2001, and
$18.7 billion in 2012 (Khurana & Banerjee 2015).
2) It is well known that wealthy large and intermediate farmers are the main beneficiaries
of these subsidies. Because these wealthy farmers, though small in numbers, are
usually ‘the patriarchs of their clans and communities and function as political

149
intermediaries who could deliver blocs of votes to their favoured political party’ (Lal
2005). It would be therefore highly unlikely for political parties to alienate the
demands of these powerful local elites, especially in the backdrop of growing political
regionalism. This observation gets substantiated by the fact that, in India, the richest
quintile in 2010 received more than twice as much of the total electricity subsidy as
the poorest quintile (see Figure 5-1).
Figure 5-1: Subsidy distribution across India, 2010
3) The strategy to directly connect the state authority and local communities, as
discussed in the earlier parts of this section, could significantly reduce the need for
political parties to rely on local elites (such as, wealthy farmers) for political support.
The state governments are therefore more likely to implement pricing reforms aimed
at reducing the level of electricity subsidies.
14%
16%
18%22%
30%
Poorest quintile 2nd 3rd 4th Richest quintile
Source: Mayer et al. 2015

150
5.4 Summary
This chapter has provided some thoughts on how the efficacy of electricity governance
could be improved in India, and how this improved electricity governance could
contribute to better performance of the electricity industry. Main points of this chapter
are summarised as follows:
Existing approaches to improve the efficacy of governance
In the literature, there are two main approaches for improving the efficacy of
governance, namely, society-centred approach, and state-centred approach. The
society-centred approach primarily attributes poor governance to weak society that
fails to articulate its interests in the political decision-making processes. Thus, the
governments always select and implement policies that are unreflective of the
interests of major social groups (such as, farmer organisations, labour unions, and
professional associations). These social groups therefore frequently seek to pursue
their interests through either violent (such as, insurgency) or non-violent (such as,
street protests) ways, which in turn undermine socio-political stability, and hence
adversely affect the efficacy of governance in the country. This approach accordingly
emphasises strengthening society, and offer several approaches for doing so.
In contrast, the state-centred approach attributes poor governance to weak state that
is unable to make difficult political decisions to satisfy the needs and interests of
major social groups (such as, farmer organisations, labour unions, and business
associations). This always leads to widespread social discontent, which in turn
weakens the governability of the country. Further, this approach argues that the weak
state is deeply rooted in the underlying ‘social structure’ that enables the society to
resist political authority and prevent the development of a strong state. Accordingly,

151
the state-centred approach suggests a stronger state as the means of improving the
efficacy of governance. It also suggests that the strength of the state can be enhanced
by a ‘restructure’ of the society by, for example, creation of new socio-political
institutions for promoting cooperation among various social groups.
Based on the above discussion, this research argues that the state-centred approach
would be the most appropriate approach for improving electricity governance in India.
This is mainly because poor electricity governance, as discussed in Chapter 2, is
primarily caused by a weak Indian state (typified by growing political regionalism,
multiple party competition, and unstable ruling coalition) that has become
increasingly incapable of satisfying the interests and needs of various social groups
(such as, farmer organisations, labour unions, and business associations). The state-
centred approach is focused on strengthening the state as the means of improving the
efficacy of governance. It can, this research contends, provide appropriate guidance
for developing policy measures to improve electricity governance in India.
Nature of the weak Indian state: A disconnection between the state and society
The indigenous and traditional Indian society is structured based on a multiplicity of
patron-client relationships (such as, kinship, caste, and religion), dominated by a
small group of local elites (such as, dominant castes, ethnic leaders and wealthy land
owners). The Indian state has traditional sought to sustain this social structure by
closely collaborating with local elites in the governance of the country. This strategy
has however disconnected the state authority from the local society, which further
undermines the efficacy of governance in the country, especially at the local level.
The local leaders, sensitive to the base of their political support, have often remained
adamantly independent.

152
Some thoughts on strengthening the Indian state
This research accordingly argues for building a direct connection between the state
authority and local communities, bypassing the powerful local elites, as the means of
strengthening the Indian state (thereby improved electricity governance). Some
thoughts on how to build this direct connection between the state authority and local
community are as follows.
1) Strong political parties: Strong political parties with effective party organisation
are needed to connect the state authority and local communities. Besides, young
and educated villagers (also known as naya netas) could be incorporated into party
organisations, acting as the connection between political parties and local
communities. The incorporation of these new local leaders into the party
organisations means that they could be subject to party discipline in the process
of political mobilisation, hence reducing the magnitude of undisciplined political
mobilisation.
2) Strong political leadership: Political leadership is weak in India, focusing
primarily on the sectarian demands – caste, language, religion, etc. Such
leadership, this research argues, tends to weaken the Indian state by encouraging
political fragmentation, which further encourages political parties to rely on local
elites for political support. Accordingly, this research suggests that strong political
leadership, focusing on the interests of the country as a whole, is important to
strengthen the Indian state, because it would reduce the magnitude of political
fragmentation.
3) Well-defined vision for national development: The prevalent strategy for political
mobilisation in India primarily emphasises ‘a rhetoric of fear’. This mobilisation

153
strategy, this research argues, tends to weaken the Indian state by encouraging
political fragmentation, which provides little incentives for political parties to
build direct connection with local communities. Accordingly, this research
suggests an alternative strategy for political mobilisation, focusing on ‘a rhetoric
of hope’, as the means of encouraging political parties to build direct connection
with the local communities. Because socio-economic development (vikaas) has
increasingly become the priority for India. A political party with a well-defined
vision for national development is more likely to win electoral support from the
local communities. The outcome would be reduced need for them to rely on
powerful local elites for political support.
Contribution to better performance of electricity industry
The above discussion presented several ways for directly connecting the state
authority and local communities in India as the means of improving the efficacy of
governance. This, this research argues, will contribute to improving the performance
of electricity industry. This is because electricity governance in India has historically
favoured the use of electricity as a vehicle for pursuing wider policy priorities and
agendas (see Chapter 2). Such pursuit of wider policy priorities has however made
issues of industry performance (such as, capacity expansion, cost reduction, and
quality improvement) subordinate to wider priorities. The outcome is persistently
poor industry performance.

154
6 CONCLUSION AND RECOMMENDATIONS FOR FURTHER RESEARCH
6.1 Conclusion
The main objective of this research is to develop a governance perspective on the
performance of electricity industry in India, with specific emphasis on understanding the
causes of poor industry performance, and identifying ways to improve this performance.
The backdrop for this research is as follows. In view of its significance, the development
of electricity industry has traditionally been accorded a high priority by the Indian policy
makers, as reflected in the magnitude of investments made in the industry, and the
establishment of expansive governance framework (including, laws, regulations and
institutions) for the industry. Despite this, the Indian electricity industry has persistently
performed poorly. Existing studies overwhelmingly tend to attribute poor industry
performance to industry-centric factors, that is, factors that are proximate to the electricity
industry (e.g., poor facility maintenance, insufficient fuel supply, widespread theft of
power, and inappropriate regulation). Such industry-centric focus for understanding
causes (reasons) for poor industry performance – this research contends – is deficient,
because the concept of industry performance is a nuanced concept, and it is context-
specific. Performance is, in fact, an outcome of an admixture of layers and layers of
mutually interacting and unpredictably reinforcing underlying influences. This research
is accordingly founded on the premise that much deeper insights into the causes of poor
industry performance, and ways to improve this performance, could only be gained if one
is able to identify the varied influences that shape the proximate factors, and (hence) affect
industry performance. It is based on these insights then that remedies for improving the
performance of the Indian electricity industry can be identified.

155
The task of identifying the varied influences is however extremely difficult, due to the
multiplicity of the factors, possible correlations, and context-connects. Notwithstanding
this difficulty, a sufficiently useful idea about these influences can be gained by grouping
them into specific ‘defining’ realms and, through a multi-stage process, delineating their
significance. Institutional theory does provide a coherent framework for this purpose.
This theory divides institutions into formal and informal. Formal institutions refer to these
rules that are explicit or written down. They include, for example, constitution, laws, and
regulations. Informal institutions refer to socially shared norms of behaviour, such as,
beliefs, customs, and conventions. A core premise of institutional theory is that the
performance of an industry (electricity industry, in this instance) is shaped by underlying
formal institutions, which in turn derive their legitimacy from the underlying informal
institutions.
As the scope of ‘institutions’ can be rather expansive and somewhat diffuse, in the context
of this research, the concept of ‘governance’ is used instead. Governance refers to the
structure (such as, hierarchy, network, and market) and processes (for example, control,
coordinate, and steer) by which various state and social actors pursue their interests in
governing socio-economic activities of a country. The outcomes are the setting,
application and enforcement of institutions for shaping human behaviour in these
activities. This suggests that the concept of governance tends to emphasise the dynamic
aspect of institutions, that is, the ongoing process of creating and implementing
institutions for governing socio-economic activities, and the role of various state and
social actors in shaping this process. The use of this concept could therefore enable a
perspective to be developed on the understanding of the influence of socio-economic
institutions (e.g., central planning, and market competition) in shaping the configurations
of electricity industry in India (i.e., industry structure, ownership, regulation), the

156
underlying dynamics of these configurations, and hence, the performance of the industry.
This perspective, in conjunction with the existing industry-centric thinking, can provide
much richer insights into why the Indian electricity industry has persistently performed
poorly – this research contends.
The approach adopted in this research to develop a governance perspective on the
performance of electricity industry in India is a combination of both qualitative and
quantitative frameworks. The qualitative framework draws upon the basic tenets of the
state-society relational approach. This framework analyses how Indian state and society
have interacted with each other over the past decades, how this interaction has shaped the
governance of socio-economic activities of the country, how such national governance
paradigm has then shaped the way electricity industry is governed, and finally how
electricity governance has shaped the structure, ownership, and regulation of the industry,
thus influencing its performance. The quantitative framework of this research is based on
three econometric models, namely, granger causality model, mixed effect model, and
multilevel regression model. This framework seeks to statistically assess the impact of
national and electricity governance paradigms on shaping the structure-ownership-
regulation as well as performance of the Indian electricity industry.
The main conclusions of this research, in summary, are presented below.
National and electricity governance paradigms
India’s national governance paradigm in the colonial period (late 18th century to 1946),
referred to as colonial governance in this research, emphasised a socio-economic
order under which colonisers were allowed to freely pursue their self-interests with
minimum governmental intervention. Such governance, it was believed, would
spontaneously generate benefits for the colonising countries. Accordingly, this

157
governance paradigm strongly favoured: 1) domestic market opening to British
products and capital; and 2) government presence confined to the provision of basic
infrastructure (such as, law, order, education and roads).
Britain’s colonial domination was built on its military strength, and more importantly,
its accommodation with indigenous and traditional Indian society, through close
collaboration with local dominant castes and other ‘big men’, to control those below
them in the social hierarchy.
Consistent with the wider colonial governance paradigm, between late 19th century
and 1946, electricity governance paradigm in India mainly focused on the furtherance
of business interests (especially, British). The colonial government assumed a passive
role in regulating the electricity industry. Their regulatory role was confined to
ensuring general safety of electricity supply, and issuing licenses to electricity
undertakings.
India attained independence on 15 August 1947. In the years after the independence
(1947 to 1960s), the country’s national leadership strongly favoured a socialist
governance paradigm in which the government (especially, central) controlled ‘the
commanding heights of the economy’, and promoted rapid industrialisation by
creating public companies in industrial and infrastructure sectors, and by tightly
regulating private investments in other industries (such as, manufacturing). This, it
was strongly believed, would lead to self-sufficiency and eradication of poverty,
unemployment and backwardness.
This post-independence governance paradigm for socio-economic development,
referred to as centre-dominated governance in this research, derived its ideological
basis from Gandhism that focused the attention of Congress Party leaders to moral

158
aspects of development (such as, employment creation and elimination of inequity).
Its practical guidance came from the vision of development held by Jawaharlal Nehru,
India’s first prime minister after independence. He had strong belief in large-scale
industrialisation, and viewed it as the best way to achieve self-sufficiency, poverty
reduction and improvement in living standards.
The ability of the Congress Party to establish its perceived national governance
paradigm was built on the Party’s political dominance at the time. This dominance
was built upon the Party’s widespread popularity, derived from its nationalist legacy,
and its incorporation within its own organisation of the society’s traditional authority
in various localities, such as, high castes, village leaders, and landowners.
The centre-dominated governance paradigm, in the context of the electricity industry,
meant the government (especially, central) assuming the lead in developing the
industry, and using electricity as a vital input to support the country’s large-scale
industrialisation programs.
A combination of economic stagnation, severe food shortages, and lack of
improvement in living standards created momentum for changes in national
governance paradigm. The changes included: 1) a populist transformation of the
Congress Party, leading to the creation of a system of political authority based on
personal loyalties to the top Congress Party leaders; 2) provision of welfare packages
to the country’s poor people in ways that created an impression that they were the gift
from the central leadership; and 3) a shift in developmental priority from
industrialisation, to accelerated agricultural production, using new technologies and
subsidies.

159
The national governance paradigm that emerged from these changes is referred to as
populist governance in this research. The primary motivation for this governance
paradigm was growing social activism in the late 1960s and early 1970s. In order to
maintain political stability, the central leadership sought to accommodate (at least
rhetorically and symbolically) diverse social demands by personalistic and populist
policies. This accommodative strategy was also motivated by factional fights within
the Congress Party, between the central leadership and old party elites (such as, the
upper-caste intelligentsia, business community and landowners). This strategy created
a system of authority based on personal loyalties to the central leadership, bypassing
the old party elites.
Consistent with the populist governance paradigm, the 1970s and 80s witnessed a
gradual shift in India’s developmental policies towards populism, focusing on
satisfying the demands of various social groups (such as, farmer associations), by
distributing public resources and privileges to these groups. The electricity industry
was considered as an important instrument for subserving these policies.
The 1980s saw a considerable increase in India’s fiscal deficit. Faced with a severe
balance of payment crisis, the Indian government agreed to implement market reform
in the early 1990s, as the condition of receiving financial assistance from the IMF.
This reform was primarily based on neoliberal ideology that considered state-centric
governance as inherently inefficient, due to bureaucratic inefficiencies, lack of
market-styled incentives, and highly political biases, especially of strong interest
groups. Neoliberalism accordingly suggested a rollback of the state, limiting its role
to ‘steering’ socio-economic development. This market-oriented governance
paradigm would then achieve optimum economic performance with respect to

160
efficiency, economic growth, and technical progress, resulting in improved welfare
of the population, the argument continued.
The market reforms have however only been partially implemented. This essentially
reflects mixed perceptions on reform in India. On the one hand, the domestic business
groups strongly supported market reform based on the belief that it would lead to a
dismantling of controls and regulations on domestic investment, and open new profit-
making opportunities for them. This, assisted by increased business influence at the
central level, resulted in a fair degree of policy coherence and stability, especially in
the areas of market liberalisation. On the other hand, market reform faced strong rural
resistance, due to the fear that it would adversely affect rural interests (e.g., removal
of electricity subsidies). Given the relatively greater influence of landed interests on
state governments, the implementation of market reform has been quite slow at the
state levels.
As part of the country’s wider shift towards market-oriented governance paradigm,
several legislative changes were made in the 1990s and 2000s to reduce the
government’s role in the electricity industry. These changes led to the implementation
of electricity market reform that emphasised private ownership, market mechanisms
for electricity trading, elimination of subsidies and price control, and establishment
of sector-specific regulators for overseeing the operation of the power systems. The
progress of this reform has however been quite slow due to strong rural resistance.
Electricity industry structure-ownership-regulation and performance
The analysis of national and electricity governance paradigms (as noted above) suggests
that the electricity governance paradigm in India, over four distinctive time periods
(namely, colonial, centrist, populist, and neo-liberal), have predominately been shaped by

161
the underlying governance paradigm for socio-economic development of the country.
Further, the analysis also suggests that underlying national governance paradigm of a time
is essentially reflective of the dominant political and socio-economic interests of the time.
This suggests that electricity governance is merely a process of serving dominant political
and socio-economic interests of the time. In such environments, industry performance has
assumed a dormant role. Poor industry performance is therefore a ‘natural’ outcome. This
viewpoint is further discussed as follows:
Consistent with the wider colonial governance paradigm, between late 19th century
and 1946, the electricity governance paradigm in India emphasised the furtherance
of private interests (especially, British). The colonial government assumed only a
passive role in regulating the electricity industry, primarily confined to the areas of
safety and licensing. This electricity governance paradigm led to the development of
electricity industry typified by highly fragmented structure, predominately foreign
ownership, and minimal regulation. Power supply was mainly confined to major cities
and towns, where economic activities concentrated. Rural areas were largely
untouched by electricity.
In the years after independence (1947 to 1960s, specifically), the new government of
India took a socialist approach for governing socio-economic development, with the
public sector assuming an ever-larger role in the economy. This approach viewed
electricity as a vital input for socio-economic development. It therefore placed the
electricity industry under tight public control. This is so because only public sector, it
was believed, could forgo immediate profit, and supply electricity to less-developed
areas where electricity supply was considered as economically unviable.

162
This belief led to important structural, ownership and regulatory changes in the Indian
electricity industry, for example, creation of public-owned, vertical-integrated
utilities (SEBs), and introduction of tight regulatory control of the industry. These
changes enabled the use of electricity by the government as an instrument for
promoting rapid industrialisation – as the means of achieving self-sufficiency and the
eradication of poverty, and reduced unemployment and backwardness. This resulted
in a rapid expansion of generation capacity, mainly to meet rising industrial demand.
The industry also received subsidised electricity.
The middle-to-late 1960s witnessed mounting democratic activism by previously
quiet social groups (such as, peasants, workers and students). The government (keen
to maintain social stability) began to implement in the 1970s and 80s populist policies
to (at least rhetorically and symbolically) satisfy the interests of various social groups.
Electricity was considered as an important instrument for supporting the populist
policies, resulting in significant financial costs for the SEBs.
Until the early 1990s, these financial costs were largely offset by the governments,
primarily through foreign borrowings. In mid-1991, the capacity of the governments
to further offset the financial costs of the industry reached its limit, as foreign lenders
lost their confidence in the country, in the face of rising inflation and mounting public
debt. In response, India turned to the IMF for financial assistance. As part of the
bailout deal with the IMF, the Indian government began to implement market reforms
of the economy (including the electricity industry). Serious power shortages in the
early 1990s gave further immediacy to these reforms.
Key component of these reforms included: restructuring and privatisation of SEBs,
encouragement of IPPs, introduction of market competition, elimination of subsidies

163
and price control, and establishment of sector-specific regulators for overseeing the
operation of the power systems.
These reforms have only been partially implemented, due to strong political resistance.
This resistance essentially reflects a mixed reception of these reforms by the Indian
society. Support for reform mainly came from international capital, on the lookout for
attractive investments, and domestic business groups, based on the view that these
reform could lead to new investment opportunities for them. Opposition to reform
mainly came from the farmers, who had come to rely on enormous quantities of low-
cost electricity for pumping water, and utility labour who feared losing their jobs if
the bloated SEBs were privatised. Some government officials and political parties
(especially, at the state levels) also opposed reform, fearing that reform would reduce
their control of the electricity industry, which is viewed by them as an important
source of political power.
Despite this resistance, some progress has been made, especially in the areas of market
opening, due to strong business support based on the belief that such reforms could
provide them with profit-making opportunities. This has encouraged large private
investments in electricity generation, resulting in a rapid expansion of generating
capacity. Electricity supply has however remained inaccessible to, and unreliable for,
a significant proportion of the population, especially in rural areas, as profit-seeking
private investors, mainly interested in commercially attractive investments in the
industry, showed little interest in the remote rural areas. Besides, public utilities are
still debt-stricken, and are therefore unable to finance necessary maintenance and
capacity expansion.

164
Causes of poor industry performance
The analysis (as noted above) revealed that electricity industry has historically been
considered in India as an important instrument for subserving wider policy priorities and
agendas. These priorities and agendas have essentially been shaped by the underlying
national governance paradigms, which have drawn their legitimacy from the dominant
political and socio-economic interests of the time. This perspective has made electricity
governance as merely a process of serving the dominant interests of the time. Issues of
industry performance have therefore assumed a dormant role. The outcome is persistently
poor performance of the industry.
This viewpoint on electricity governance processes is further validated in this research
through a statistical assessment of the impact of wider socio-economic interests (that have
shaped the national and electricity governance paradigms) on the electricity industry
structure-ownership-regulation and performance. Further, two types of effect (impact) are
considered in the assessment, namely, mediation effects, and moderation effects.
Mediation effects, in the context of this research, are referred to as the direct effects of
wider interests on shaping the industry structure-ownership-regulation, which in turn
influence the performance of the industry. Moderation effects are referred to as the
indirect effects of wider influences on shaping the ability of the industry structure-
ownership-regulation to influence industry performance. Key findings of this assessment
are summarised as follows.
Rural interests seem to have opposed the implementation of market reform in the
Indian electricity industry. This is reflected by the adverse impact of rural interests on
the ability of market reform to improve the performance of electricity industry, as
presented in Section 4.4.2. The rural opposition however varies across the country, as

165
indicated by no significant causal relationship between rural interests and industry
structure-ownership-regulation (see Table 4-5). This probably reflects mixed views
on electricity reform in rural communities across the country.
Domestic business interests (DBI) seems to have favoured the introduction of market
competition in the electricity industry, as reflected by its positive impact (3.11 in
Table 4-6) on industry structure. The introduction of market competition has led to
some improvements in the industry performance, as indicated by its positive impact
on total (1.46) and peak (5.56) electricity deficits, and negative impact on forced
outage rate (-1.71), as presented in Table 4-6.
Better central and state relationship (CSR) appears to have contributed to smooth
implementation of market reform in the electricity industry, as reflected by a more
significant impact of privatisation on reducing electricity deficits, if privatisation had
taken place in states with good centre-state relationship (see Section 4.4.2).
In summary, the above analysis has clearly demonstrated the significance of wider socio-
economic interests in shaping the structure-ownership-regulation and performance of the
Indian electricity industry. This provides further validation to the viewpoint that causes
of poor industry performance are deeply rooted in the electricity governance processes,
which have historically favoured the use of electricity to subserve wider policy priorities
and agendas for socio-economic development of India, arising from a range of political
and socio-economic interests. This perspective makes electricity governance merely a
process of serving dominant interests of the time. In these processes, issues of industry
performance become subordinate to wider interests, thereby limited action for improving
industry performance.
166
This research therefore suggests that the performance of the Indian electricity industry
can only be improved by an appreciation of the influence of these wider socio-economic
interests that have shaped the contours of the industry, because this appreciation could
enable a considered accommodation, into the electricity governance processes, of
dominant socio-political interests of the time, which will in turn improve the efficacy of
electricity governance, and hence contribute to better industry performance.
Suggestions to improve the industry performance
This research demonstrates how the efficacy of electricity governance processes can be
improved, through a considered accommodation, into these processes, of various socio-
economic interests, and how this improved electricity governance can contribute to better
industry performance.
Existing approaches to improve the efficacy of governance
In the literature, there are two main approaches for improving the efficacy of
governance, namely, society-centred approach, and state-centred approach. The
society-centred approach primarily attributes poor governability to weak society that
fails to articulate its interests in the political decision-making processes. Thus, the
governments always select and implement policies that are unreflective of the
interests of major social groups (such as, farmer organisations, labour unions, and
professional associations). These social groups therefore frequently seek to pursue
their interests through either violent (such as, insurgency) or non-violent (such as,
street protests) ways, which in turn undermine socio-political stability, and hence
adversely affect the efficacy of governance in the country. This approach accordingly
emphasises strengthening society, and offer several approaches for doing so.

167
In contrast, the state-centred approach attributes poor governance to weak state that
is unable to make difficult political decisions to satisfy the needs and interests of
major social groups (such as, farmer organisations, labour unions, and business
associations). This always leads to widespread social discontent, which in turn
weakens the governability of the country. Further, this approach argues that the weak
state is deeply rooted in the underlying ‘social structure’ that enables the society to
resist political authority and prevent the development of a strong state. Accordingly,
the state-centred approach suggests a stronger state as the means of improving the
efficacy of governance. It also suggests that the strength of the state can be enhanced
by a ‘restructure’ of the society by, for example, creation of new socio-political
institutions for promoting cooperation among various social groups.
Based on the above discussion, this research argues that the state-centred approach
would be the most appropriate approach for improving electricity governance in India.
This is mainly because poor electricity governance, as discussed in Chapter 2, is
primarily caused by a weak Indian state (typified by growing political regionalism,
multiple party competition, and unstable ruling coalitions) that has become
increasingly incapable of satisfying the interests and needs of various social groups
(such as, farmer organisations, labour unions, and business associations). The state-
centred approach is focused on strengthening the state as the means of improving the
efficacy of governance. It can, this research contends, provide appropriate guidance
for developing policy measures to improve electricity governance in India.
Some thoughts on improving electricity governance in India
The indigenous and traditional Indian society is structured based on a multiplicity of
patron-client relationships (such as, kinship, caste, and religion), dominated by a

168
small group of local elites (such as, dominant castes, ethnic leaders and wealthy land
owners). The Indian state has traditionally sought to sustain this social structure by
closely collaborating with local elites in the governance of the country. This strategy
has however disconnected the state authority from the local society, which further
undermines the efficacy of governance in the country, especially at the local level.
The local leaders, sensitive to the base of their political support, have often remained
adamantly independent.
This research accordingly argues for building a direct connection between the state
authority and local communities, bypassing the powerful local elites, as the means of
strengthening the Indian state (thereby improved electricity governance). Some
thoughts on how to build this direct connection between the state authority and local
community are as follows.
- Strong political parties: Strong political parties with effective party
organisation are needed to connect the state authority and local communities.
Besides, young and educated villagers (also known as naya netas) could be
incorporated into party organisations, acting as the connection between
political parties and local communities. The incorporation of these new local
leaders into the party organisations means that they could be subject to party
discipline in the process of political mobilisation, hence reducing the
magnitude of undisciplined political mobilisation.
- Strong political leadership: Political leadership is weak in India, focusing
primarily on the sectarian demands – caste, language, religion, etc. Such
leadership, this research argues, tends to weaken the Indian state by
encouraging political fragmentation, which further encourages political

169
parties to rely on local elites for political support. Accordingly, this research
suggests that strong political leadership, focusing on the interests of the
country as a whole, is important to strengthen the Indian state, because it
would reduce the magnitude of political fragmentation.
- Well-defined vision for national development: The prevalent strategy for
political mobilisation in India primarily emphasises ‘a rhetoric of fear’. This
mobilisation strategy, this research argues, tends to weaken the Indian state by
encouraging political fragmentation, which provides little incentives for
political parties to build direct connection with local communities.
Accordingly, this research suggests an alternative strategy for political
mobilisation, focusing on ‘a rhetoric of hope’, as the means of encouraging
political parties to build direct connection with the local communities.
Because socio-economic development (vikaas) has increasingly become the
priority for India. A political party with a well-defined vision for national
development is more likely to win electoral support from the local
communities. The outcome would be reduced need for them to rely on
powerful local elites for political support.
Contribution to better performance of electricity industry
The above discussion presented several ways for directly connecting the state
authority and local communities in India as the means of improving the efficacy of
electricity governance. This, this research argues, will contribute to improving the
performance of electricity industry. This is because electricity governance in India
has historically favoured the use of electricity as a vehicle for pursuing wider policy
priorities and agendas (see Chapter 2). Such pursuit of wider policy priorities has

170
however made issues of industry performance (such as, capacity expansion, cost
reduction, and quality improvement) subordinate to wider priorities. The outcome is:
persistently poor industry performance.
6.2 Some recommendations for further research
This research has analysed the performance of Indian electricity industry from an
institutional perspective. This analysis has provided an in-depth understanding about the
causes of poor industry performance, and ways of improving performance. However,
there is still scope for further improvements in this analysis. Some suggestions include:
The approach employed by this research to analyse national and electricity
governance paradigms in India largely focuses on the influence of political and socio-
economic interests at the national level. This, this research argues, could be improved
by incorporating the analysis of regional and local political and socio-economic
interests. The potency of this argument becomes evident if one takes note the fact that
significant variation existed in the electricity industry structure-ownership-regulation
and performance at the regional and local levels.
This research primarily focuses on assessing the overall impact of national and
electricity governance paradigms on the performance of the Indian electricity industry.
While useful, such focus prevents a deeper understanding of the impact of national
and electricity governance paradigms on the performance of individual segments of
the industry (e.g., generation, transmission and distribution). This understanding is
extremely valuable for identifying ways to improve the performance of these
segments. Further research is therefore needed to develop such an understanding.
The data used in this research to analyse the impact of national and electricity
governance paradigms on the performance of the Indian electricity industry is

171
incomplete, due to the lack of data availability of several variables, such as, forced
outage rate, and electricity prices. The availability of these data could provide more
accurate estimation of the impact.
Suggestions made in Chapter 5 for improving the efficacy of electricity governance
processes are mainly a supplement to the main topic of this thesis, namely,
development of a governance perspective on the causes of poor performance of the
Indian electricity industry (Chapters 2 to 4). This chapter demonstrates the merits of
improved electricity governance processes through a more considered
accommodation of various socio-economic interests in these processes. The
discussion on this chapter, this research argues, sets a foundation for future research
on the topic of improving the efficacy of electricity governance.

172
Appendix A: Existing literature on the causes for the poor performance
Over the years, many studies have been undertaken to identify the causes for the poor
performance of the Indian electricity industry. These studies attribute this poor
performance to two groups of factors, namely, technico-economic (such as, slow project
execution, insufficient network capacity, and poor maintenance) and institutional (e.g.,
legislation that empowers the government to intervene in making regulatory decisions.
Details about these studies are presented in the following paragraphs.
Causes for inadequate electricity supply
Some studies focus on the analysis of technico-economic factors and their influence in
shaping electricity supply and demand balance. These studies include, for example, Ahn
& Graczyk (2012), Bost et al., (2006), Government of India (1980), and World Bank
(1979 and 1999). Several technico-economic factors are identified by these studies as
being responsible for inadequate electricity supply in India. These factors include:
Some technico-economic factors are at the supply side. These factors include a) slow
growth of installed generating capacity, due primarily to widespread and prolonged
delays in the execution of power projects; and b) significant underutilisation of existing
generating capacity, mainly due to lateness and inadequacy of network facilities,
insufficient and low quality fuel supply (e.g., coal and lignite), and poor maintenance
(Ahn & Graczyk 2012; Bose et al. 2006; World Bank 1979).
At the demand side, overconsumption encouraged by highly subsidised electricity prices
is identified as being responsible for power shortages in India. These subsidies, it is
argued, make electricity prices artificially low. These low prices have in turn encouraged
high levels of electricity consumption, and consequently lead to excessive investment
requirements for capacity expansion. These requirements are however far beyond the

173
capacity of the electricity industry to mobilise, hence power shortage (Sankar &
Ramachandra 2000; World Bank 1999).
There are also some studies that attribute India’s power shortages to institutional factors.
For example, according to Sharma (1990), India’s continued shortfall of electricity supply
is primarily caused by a slow capacity expansion, resulting from widespread and
prolonged delays in the execution of power projects. These delays in project execution,
as argued by Sharma (1990), are mainly attributable to the institutional arrangements for
governing the industry planning. In these arrangements, investment decisions are shared
between the central and the state governments. The State Electricity Boards (SEBs) are
made responsible for proposing power projects that would support state developmental
priorities (e.g., poverty reduction). These proposed projects are assessed and approved by
the Central Electricity Authority (CEA). The approval and associated funding are given
based on the ability of proposed projects to meet certain selection criteria, such as, low
cost, high returns on investment, and contribution to national developmental priorities.
This ability is normally assessed based on information and data provided by the SEBs.
There are no mechanisms to confirm the accuracy of these information and data. Given
the severe competition among the SEBs for limited central government resources, it is a
common practice for them to provide inadequate and incorrect information and data (e.g.,
underestimated project costs), with the aim of demonstrating the advantages of their
proposed projects. Hence, revisions become inevitable during the project execution
process, causing significant delays in the project execution (Sharma 1990).
Insufficient inter-state connections are identified in the World Bank (1979) as one of the
main causes for power shortages in India, as this could restrict generation in some states
while their neighbouring states are suffering from severe supply shortages. The lack of

174
inter-state connections, it is argued, is mainly attributable to the planning of the Indian
electricity industry that has been carried out in too limited an institutional framework,
largely due to the natural concentration of the state electricity boards on matters within
their own boundaries and spheres of responsibility. As a result, there is always a bias
against major power projects which extend beyond state boundaries. This largely
accounts for the fact that only slow progress has been made with respect to a number of
major power projects (especially, inter-state connections) that have the ability of
alleviating the power shortages (World Bank 1979).
According to Chikkatur et al., (2009), several institutional factors are responsible for
insufficient and low quality coal for power generation (the main causes for power
shortages as noted above). For example, existing contractual arrangements for coal supply
are inappropriate. There is no penalty on non-compliance, and no control on coal quality
(such as, ash content, and calorific value). As a result, it is at low costs for coal suppliers
to breach the contracts, supplying low quality coal at quantity lower than the contracted
amount. Besides, the existing coal pricing mechanisms provides little incentive to coal
producers to improve coal quality, because coal are priced based on wide bands of useful
heat values (UHV) under the current mechanism. Low quality unwashed coal is usually
in the same price band as high quality washed coal (Chikkatur, Sagar & Sankar 2009).
Large technical losses of the power system are identified as one of the main causes for
power shortages in India. The large technical losses are in large part caused by the tariff-
setting mechanisms that charge agricultural consumers based on the capacity of water
pumps rather than metered consumption. These mechanisms enable the SEBs to hide
technical losses of the power system under the category of agricultural consumption,

175
hence creating little incentives for them to reduce these technical losses (Kannan & Pillai
2001a; Reddy & Sumithra 1997).
As noted above, overconsumption encouraged by subsidised electricity prices is one of
the main causes for persistent power shortages in India. The provision of electricity
subsidies can be attributable to three main institutional factors that reduce the decision-
making authority of the regulators (such as, in tariff-settings). One, most electricity
regulators lack financial independence, heavily reliance on state grants for their budgets.
Two, state governments always have strong influence in recruitment decisions of
electricity regulators (Pargal & Mayer 2014). Three, the Electricity Act of 2003 gives the
state governments the ability to provide binding ‘directions’ to the regulators in matters
of policy involving the public interest. As a result, most regulators are often more
concerned with state governments’ agenda, thereby compromising their regulatory
responsibilities. This Act also provides the state governments with authority to select
members of the regulator. It has become a common practice of individuals working with
the state governments or in state-owned electricity companies being appointed as
chairman or members of the regulator. This makes it difficult for the regulator to be
independent, as its key members have strong connections with the state governments
(Shunglu Committee 2011).
Causes for unaffordable electricity supply
Electricity prices in India are largely unaffordable for industrial consumers. This is
primarily caused by cross-subsidisation of industrial consumers to agricultural and
residential consumers (Chattopadhyay 2004). The cross-subsidisation is largely due to
government interference in price determination, favouring agricultural and residential
consumers (Dubash & Rajan 2001). This government interference is enabled by several

176
institutional factors. For example, before the enactment of the 2003 Electricity Act, for
example, the SEBs were required by law to secure approval from the state governments
in tariff determination (Kale 2004). As argued by Kannan and Pillai (2001a), ‘it is true
that the Board is the primary authority to fix electricity tariff rates. But there is a statutory
power reserved in favour of the Government under Section 22-B to issue, when conditions
exist, necessary orders to ensure equitable distribution of electrical energy. When the
power is so exercised by the Government, it can also fix the tariff rates, for, the fixation
of tariff rates is incidental to the power to regulate supply, distribution, and consumption
and use of electrical energy and is also part of the regulatory process of equitable
distribution of electrical energy. The Government is free to make their own classification
of consumers for fixation of different rates of electricity tariff and they are not bound by
the specification, categorisation, designation or division made by the Board for purposes
of levying electricity charges’ (Kannan & Pillai 2001a).
In recognition of strong state government interference in tariff-settings and its detrimental
effects on industry finance, the Electricity Act of 2003 were enacted to remove the
responsibilities of tariff-settings from the SEBs and state governments, and vested them
in independent regulatory agencies. These regulatory agencies were required to determine
electricity tariffs at the level that all validated expenses of the utility get recovered along
with reasonable return on the investment made by the utility. But in practice the regulatory
agencies have usually failed to set up the tariff at the cost-recovery level. This is largely
due to widespread and prolonged delays in adjusting electricity tariff, caused by the fact
that most distribution companies did not submit their tariff proposals in time or submitted
the proposals in unacceptable forms (without account audited reports) as the regulatory
agencies cannot estimate the cost of supply based on the best available data as required
by law (Shunglu Committee 2011).

177
In addition, the section 108 of the 2003 Act gives power to the state governments in
matters related to public interests. Some state governments have used this power to
require the regulatory agencies to reserve the cheapest available electricity for specified
category of consumers while determining tariffs. This in turn resulted in increasing the
incidence of cross-subsidisation rather than reducing it (Shunglu Committee 2011).
Causes for unreliable electricity supply
Electricity supply in India is highly unreliable. Forced outage rate for power plants
(especially, state government owned) are high as compared to other countries, such as,
European countries. Three factors are identified in the literature as being responsible for
the unreliable electricity supply in India. One, extended service of major power plants
(Kannan & Pillai 2001b). As estimated by the Indian government in 2000, for example,
more than 11,000 MW thermal generating capacity (about 19% of total thermal capacity)
have already completed more than 20 years of their useful design life of 25 years.
Similarly, about 35 hydro power plants have been operational for more than 30 years in
excess of their useful operating life (Government of India 2000).
Two, poor maintenance of existing power plants, due to the lack of financial resources of
the electric utilities. The lack of financial resources is attributable to large gap between
electricity costs and prices, due to high supply costs, technical losses of the network,
power theft and low bill collection rate (Kannan & Pillai 2001b; Khurana & Banerjee
2015).
Three, unreliable electricity supply is also encouraged by the tariff regime. As argued in
Rao (2002), for example, ‘The engineers running the generating stations at the central
level kept pushing power into the grid, even when it was not required, thus pushing

178
frequency well above that desired, because they were paid incentives for generating more
power in relation to capacity, not for maintaining grid stability’ (Rao 2002).
Causes for poor returns on public electricity investments
Poor returns on public investments in power projects are primarily caused by the large
gap between electricity costs and prices (about 20 to 30 per cent) (Kannan & Pillai 2001a;
Khurana & Banerjee 2015). This gap can be attributed to three technico-economic factors.
One, rising cost of power purchase, due largely to poor purchase management. For
example, most distribution companies do not have a clear plan for power purchase in
advance. As a result, they do not rely on long-term contracts with electricity suppliers to
achieve an efficient power procurement cost; rather they usually purchase electricity at
high prices in short-term markets (Khurana & Banerjee 2015; Pargal & Banerjee 2014).
Two, the provision of lower-than-cost electricity to subsidise targeted social groups (e.g.,
agricultural and residential consumers). As argued by Kannan and Pillai (2001a), ‘the
socio-political compulsions of distributional solicitude of the governments have resulted
in significant distortions in setting tariffs for various consumer categories in line with the
cost involved in supplying each group’ (Kannan & Pillai 2001a). This governmental
interference in tariff-setting, as noted previously in this section, is encouraged by several
institutional factors, such as, the section 108 of the Electricity Act of 2003 that gives
power to the state governments in matters related to public interests (e.g., tariff increase
for agricultural and residential consumers).
Three, high network losses, due to large technical losses of the network, power theft and
low bill collection rate (Khurana & Banerjee 2015). For example, average network losses
were about 22 per cent in India in 1995-96. This has increased to about 24 per cent in
2010-11. In that year, the technical losses for some states (such as, Bihar, Jammu &

179
Kashmir, and Jharkhand) were even higher than 30 per cent. Such high technical losses
mean that a significant proportion of electricity purchased by the public distribution
companies would not get paid, hence large commercial losses for these public companies
(Planning Commission 2014). These high network losses are also encouraged by the
provision of electricity subsidised, because the electric utilities could hide the network
losses as part of the agricultural consumption. This in turn creates little incentive for these
utilities to reduce the network losses (Dubash & Rajan 2001).
180
Appendix B: Key features of the Indian society
Indian has a multi-religious and multi-cultural society. As the then Prime Minister of
India, Jawaharlal Nehru, put it:
‘The diversity of India is tremendous; it is obvious; it lies on the surface and
everybody can see it. It concerns itself with physical appearances as well as with
certain mental habits and traits. There is little in common, to outward seeming,
between the Pathan of the North-West and the Tamils in the far South. Their racial
stocks are not the same, though there may be common strands running through
them; they differ in face and figure, food and clothing, and, of course,
language…All of them have their own distinctive features, all of them have still
more distinguishing marks of India, It is fascinating to find how the Bengalis, the
Marathas, the Gujratis, the Tamils, the Andhras, the Oriyas, the Assamese, the
Canarese, the Malayalis, the Sindhis, the Punjabis, the Pathans, the Kashmiris, the
Rajputs, and the great central block comprising the Hindustani-speaking people,
have retained their peculiar characteristics for hundreds of years, have still more or
less the same virtues and feelings of which old tradition or record tells us, and yet
have been throughout these ages distinctively Indian, with the same national
heritage and the same set of moral and mental qualities’ (Nehru 1961, p. 61).
Some statistics to support this observation are presented as follows. Table B-1 shows
main religions in India. A review of the table suggests that most Indian people (about 80
per cent) believe in Hinduism. Hinduism is not a distinctive religion; it comprises many
sects and denominations, such as, Shaivism, Vaishnavism, and Shaktism (Mitra 2011a).
India also has a large Muslim community, accounting for 14.2 per cent of the population.
This Muslim community comprises of several major group affiliations and divisions. The

181
majority of them are Sunni. There also exist sizeable Shi’ite minority groups (Tenhunen
& Saavala 2012). Christians comprise the third-largest religious group in India. Most of
them are present in three Indian states, namely, Nagaland, Meghalaya, and Mizoram
(Mitra 2011a). Other main religions in the country include: Sikhs, Buddhists, and Jains
(see Table B-1).
Table B-1: Religions in India
Religions Population (million) Share of total population (%)
Hindus 966.3 79.8 Muslims 172.2 14.2 Christians 27.8 2.3 Sikhs 20.8 1.7 Buddhists 8.4 0.7 Jains 4.5 0.4 Others 10.8 0.9
Source: Government of India (2011).
India’s diverse culture is essentially reflected by the number of languages spoken in the
country, because language ‘does not exist apart from culture, that is, from the socially
inherited assemblage of practices and beliefs that determines the texture of our lives’
(Edward 1949). According to the latest consensus data, there are more than 1,000
languages used in the country. Of these, 29 languages have more than a million speakers
(Government of India 2001). Major languages used in India include: Bengali, English,
Hindi, Marathi, Tamili, Telugu and Urdu (Tenhunen & Saavala 2012).
India also has significant regional diversity in terms of economic and social development.
For example, India’s high economic performers are the western state of Goa, and northern
union territories of Chandigarh and Delhi. These states have more than Rs. 150,000 per
capita GDP in 2011-12. This is more than 5 times higher than that of the poorest states in

182
the country, such as, Bihar, Uttar Pradesh and Manipur (see Figure B-1). Socially, the
western union territories of Dadra and Nagar Haveli are the poorest states in the country
with around 40 per cent of the population living under the poverty line. This is much
higher than average poverty level in the country (about 20 per cent). The wealthiest states
include, for example, Goa, Kerala, and Lakshadweep. Less than 6 per cent of the
population in these states live under poverty (Reserve Bank of India 2015).
Figure B-1: Per capita GDP by state in 2011-12 (Rs. current prices)
23,794 34,022 38,247 40,599 42,658 43,124
51,469 52,071 54,235 54,565 54,626 58,275 60,733 61,961 64,078
75,348 77,385 78,540
92,226 93,068 93,072 93,129 94,408
101,313 106,747
114,901 120,461 125,097
141,783 185,478
222,692 246,494
BiharUttar Pradesh
ManipurAssam
Madhya PradeshJharkhard
OdishaJammu & Kashmir
TripuraMeghalaya
ChhattisgarhWest Bengal
RajasthanNagalandMizoram
KarnatakaAndhra Pradesh
Arunachal PradeshTamil Nadu
Himachal PradeshUttarakhand
PunjabKerala
GujaratMaharashtraPuducherry
HaryanaAndaman & Nicobar Islands
SikkimDelhi
ChandigarhGoa
Source: Government of India (2014): State Wise Data

183
Appendix C: List of existing studies on the performance of electricity industry
1. Aghdam (2006)
2. Aghdam et al. (2013)
3. Bacon and Besant-Jones (2001)
4. Cambini and Rondi (2010)
5. Erdogdu (2011; 2013; 2014)
6. Fiorio et al. (2007)
7. Fiorio and Florio (2013)
8. Gugler et al. (2011)
9. Hattori & Tsutsui (2004)
10. Henisz et al. (2004)
11. Nagayama (2007; 2008; 2010)
12. Nepal and Jamasb (2012)
13. Pompei (2013)
14. Ruffin (2003)
15. Steiner (2001)
16. Zhang et al. (2002; 2005; 2008)

184
Appendix D: Data sets for assessing the performance of electricity industry in India
This appendix presents the data used in this research to assess the performance of the
Indian electricity industry. It contains the following tables:
Table D-1: Energy deficit (%)
Table D-2: Peak deficit (%)
Table D-3: Forced outage rates (%)
Table D-4: Network losses (%)
Table D-5: Electricity prices for industry (paise per kWh)
Table D-6: Electricity prices for agriculture (paise per kWh)
Table D-7: Costs of electricity supply (paise per kWh)
Table D-8: Electricity generation (GWh)
Table D-9: State generation (GWh)
Table D-10: Private generation (GWh)
Table D-11: Introduction periods of various components for reforms
Table D-12: Rural population (% of total population)
Table D-13: Industry value added (% of gross state domestic product)
Table D-14: Centre-state relationship

185
Table D-1: Energy deficits (%)
Sources: Planning Commission, Annual Report (various years).
1990 1991 1992 1993 1994 1995 1996 1997 1998 1999 2000 2001 2002 2003 2004 2005 2006 2007 2008 2009 2010 2011 2012 2013 2014 2015Andhra Pradesh 6.5 6.7 9.8 12.9 15.9 19.0 22.1 14.4 8.7 6.6 7.8 8.5 6.8 4.3 0.7 1.3 4.4 4.1 6.8 6.6 3.2 7.2 17.6 6.9 4.9 0.1Assam 7.5 6.9 7.6 8.2 8.9 9.5 10.2 8.7 2.7 0.0 0.0 0.7 3.2 5.8 5.4 6.7 7.3 8.4 10.6 8.5 6.3 5.6 6.9 6.4 7.0 5.6Bihar 29.7 29.7 29.3 28.8 28.4 27.9 27.5 19.9 8.1 6.3 7.0 5.1 8.3 22.5 10.1 9.3 8.1 13.4 16.4 14.4 13.0 21.3 16.7 4.1 2.8 1.3Gujarat 4.0 4.3 5.1 5.8 6.6 7.3 8.1 5.3 6.2 8.2 9.7 11.5 11.4 12.0 11.7 8.2 13.4 16.2 9.8 4.5 5.8 0.4 0.2 0.0 0.0 0.0Haryana 3.3 2.0 2.8 3.6 4.3 5.1 5.9 1.6 2.1 2.3 2.8 1.7 3.0 4.7 5.7 9.1 11.9 12.6 8.5 4.2 5.6 3.6 7.7 0.6 0.4 0.1Himachal Pradesh 1.6 0.7 0.7 0.8 0.8 0.9 0.9 0.1 0.2 0.3 3.2 2.6 2.5 0.1 2.1 1.0 2.7 3.0 0.3 3.9 3.4 0.7 2.8 2.3 0.9 0.7Jammu & Kashmir 10.1 10.8 10.6 10.5 10.3 10.2 10.0 2.7 6.0 19.2 16.4 11.1 12.7 4.6 9.2 17.2 31.9 29.0 24.2 24.8 25.0 23.6 25.0 21.9 19.1 15.3Karnataka 24.5 23.6 24.3 25.0 25.7 26.4 27.1 20.3 13.2 8.3 9.1 12.5 9.8 13.9 4.2 0.7 2.1 2.7 6.0 7.7 7.6 11.2 13.9 9.5 4.3 5.2Kerala 3.2 3.3 7.2 11.1 14.9 18.8 22.7 19.0 9.7 7.3 6.6 7.4 6.9 3.8 1.2 0.7 2.0 2.4 11.8 2.4 1.4 2.1 4.0 2.4 1.5 0.5Madhya Pradesh 5.7 5.6 6.9 8.2 9.4 10.7 12.0 6.7 5.8 7.1 12.4 15.4 16.4 13.2 13.5 14.2 15.2 14.1 17.2 19.0 20.2 16.9 9.6 0.1 0.5 0.0Maharashtra 5.6 4.5 4.7 4.9 5.2 5.4 5.6 2.9 3.9 6.1 10.5 8.8 13.4 10.2 12.1 18.2 19.0 18.3 21.4 18.8 16.6 16.7 3.2 2.1 1.3 0.3Orissa 6.8 7.0 6.2 5.4 4.6 3.8 3.0 1.8 3.3 0.0 0.0 0.1 2.3 0.9 0.8 1.3 1.8 1.8 1.5 0.9 0.3 1.5 3.3 1.7 1.6 0.6Punjab 7.3 6.2 5.3 4.4 3.4 2.5 1.6 0.8 2.2 0.7 2.7 4.2 5.9 2.9 9.0 8.7 9.8 8.4 10.6 13.8 6.0 3.1 5.4 1.5 1.0 0.0Rajasthan 2.2 1.4 2.6 3.8 5.0 6.2 7.4 1.8 2.5 4.5 3.6 1.0 2.1 0.5 0.8 3.7 4.6 3.1 1.1 2.4 0.9 3.9 3.0 0.3 0.6 0.3Tamil Nadu 5.1 4.8 6.6 8.4 10.2 12.0 13.8 14.1 11.9 7.9 7.6 7.1 6.0 0.6 0.6 0.6 1.7 2.8 7.8 6.2 6.5 10.5 17.5 5.9 3.1 0.7Uttar Pradesh 11.8 10.3 11.0 11.7 12.5 13.2 13.9 12.3 9.8 12.9 14.6 9.9 17.8 13.2 20.1 20.9 15.8 18.0 21.5 21.6 15.0 11.3 16.6 14.0 15.6 12.5West Bengal 9.9 9.0 7.8 6.6 5.3 4.1 2.9 0.7 2.8 0.0 0.0 0.5 1.0 2.2 1.6 1.7 2.2 3.9 3.2 2.8 1.7 1.0 0.7 0.3 0.6 0.3

186
Table D-2: Peak deficits (%)
Sources: Planning Commission, Annual Report (various years).
1990 1991 1992 1993 1994 1995 1996 1997 1998 1999 2000 2001 2002 2003 2004 2005 2006 2007 2008 2009 2010 2011 2012 2013 2014 2015Andhra Pradesh 13.1 15.8 17.4 18.9 20.5 22.0 23.6 11.3 9.3 11.7 14.6 19.9 19.2 3.6 2.4 5.1 15.4 8.8 9.8 10.6 6.3 14.8 20.2 6.5 5.0 0.1Assam 7.8 9.5 7.6 5.7 3.8 1.9 0.0 5.7 3.2 1.6 0.9 10.2 11.8 12.4 5.8 7.4 10.8 9.7 16.8 5.0 3.5 5.3 4.1 8.2 13.3 7.6Bihar 36.1 43.7 44.6 45.6 46.5 47.5 48.4 41.2 15.4 16.0 14.1 8.6 4.6 13.4 0.0 15.1 16.9 34.0 27.6 32.9 22.5 14.4 22.3 6.2 4.0 6.7Gujarat 15.1 18.3 17.8 17.2 16.7 16.1 15.6 6.4 16.3 21.1 11.5 16.3 15.1 26.6 25.4 22.2 30.2 26.7 24.3 8.6 7.8 1.8 0.3 0.0 0.8 0.3Haryana 16.7 20.2 19.3 18.5 17.6 16.8 15.9 0.0 -8.3 0.0 3.3 3.3 2.5 1.6 10.3 9.3 13.2 2.7 13.1 7.4 9.3 4.2 9.5 0.0 0.0 0.0Himachal Pradesh 18.1 21.9 17.5 13.1 8.8 4.4 0.0 0.0 0.0 0.0 0.0 0.0 0.0 0.0 1.0 5.0 0.0 4.8 3.9 -3.6 7.1 7.1 21.0 10.8 0.0 0.0Jammu & Kashmir 25.9 31.3 28.5 25.6 22.8 19.9 17.1 3.7 18.2 17.0 16.8 17.4 15.2 8.0 11.4 23.4 14.4 26.2 34.9 33.8 33.7 25.0 25.0 20.1 20.0 15.2Karnataka 23.5 28.5 28.5 28.5 28.5 28.5 28.5 27.5 15.5 15.5 13.2 17.1 10.0 6.4 5.3 6.6 7.1 15.4 5.0 13.2 7.3 18.9 13.5 7.2 4.5 6.8Kerala 15.1 18.3 19.4 20.6 21.7 22.9 24.0 26.4 11.6 9.1 5.1 16.9 16.5 9.8 1.3 1.7 2.1 6.4 13.7 4.1 5.8 5.1 8.8 2.7 4.4 3.1Madhya Pradesh 17.6 21.3 22.9 24.4 26.0 27.5 29.1 17.2 25.2 29.7 25.3 21.6 27.6 29.8 18.5 21.7 20.8 10.6 10.0 14.4 8.7 7.1 6.1 0.0 0.4 0.0Maharashtra 7.2 8.7 8.7 8.7 8.7 8.7 8.7 9.4 18.7 19.3 15.5 12.6 19.8 18.2 16.8 23.1 27.4 26.4 23.7 24.4 18.1 22.1 6.5 8.6 1.7 1.8Orissa 19.7 23.9 21.9 19.9 17.8 15.8 13.8 8.4 2.0 5.2 -2.2 7.3 6.5 8.0 0.0 1.7 3.2 7.5 2.6 2.1 2.1 1.8 6.9 0.1 0.7 0.0Punjab 9.2 11.1 10.5 9.9 9.3 8.7 8.1 0.0 0.0 0.0 2.0 8.9 6.7 0.0 22.0 20.4 26.9 15.4 15.9 24.3 15.5 16.9 24.0 13.4 13.0 0.0Rajasthan 4.8 5.8 5.8 5.7 5.7 5.6 5.6 0.9 4.2 0.0 2.5 1.2 1.7 0.0 7.8 13.2 14.6 12.7 3.2 0.0 3.7 7.1 4.8 0.1 0.0 0.0Tamil Nadu 13.8 16.7 16.5 16.4 16.2 16.1 15.9 19.7 12.8 12.5 15.3 13.1 6.3 3.0 1.2 11.5 2.7 15.9 6.0 11.8 11.0 17.5 13.2 7.6 1.5 0.1Uttar Pradesh 14.7 17.8 18.2 18.7 19.1 19.6 20.0 24.6 19.8 23.1 15.0 9.2 14.8 16.1 20.4 19.4 18.0 22.8 22.1 21.1 3.7 3.5 13.6 5.8 17.0 14.6West Bengal 25.8 31.2 27.2 23.2 19.1 15.1 11.1 7.0 5.8 6.4 4.7 5.5 0.0 9.0 3.7 3.0 2.4 5.6 0.2 2.2 0.8 0.9 1.0 0.4 0.3 0.3

187
Table D-3: Forced outage rates (%)
Sources: Planning Commission, Annual Report (various years).
1990 1991 1992 1993 1994 1995 1996 1997 1998 1999 2000 2001 2002 2003 2004 2005 2006 2007 2008 2009 2010 2011 2012 2013 2014 2015Andhra Pradesh 10.2 11.3 7.5 8.2 6.0 6.4 5.9 4.3 10.0 5.9 3.0 3.1 3.2 3.2 3.3 3.4 3.5 3.6 3.7 2.4 9.3 4.2 7.0 7.8 8.7 9.5Assam 31.0 34.4 46.5 33.6 21.3 10.5 35.4 48.5 49.4 52.0 51.4 49.7 48.0 46.3 44.6 43.0 41.3 39.6 37.9 36.1 42.1 46.7 48.9 52.1 55.4 58.6Bihar 24.8 27.6 41.9 31.1 21.9 28.4 36.0 48.3 40.8 40.6 42.5 44.2 46.0 47.7 49.5 51.2 52.9 54.7 56.4 47.8 42.4 48.8 41.7 38.9 36.1 33.2Gujarat 9.6 10.6 7.2 7.6 6.6 7.9 7.4 7.8 10.4 12.9 12.4 11.8 11.1 10.5 9.9 9.2 8.6 7.9 7.3 9.2 15.2 12.0 15.9 17.9 19.9 21.9Haryana 27.8 30.9 16.4 26.7 35.7 29.7 24.1 22.7 25.1 26.3 19.1 18.2 17.2 16.3 15.3 14.4 13.5 12.5 11.6 9.9 11.7 16.0 16.1 17.6 19.1 20.6Himachal Pradesh 13.7 15.2 16.2 13.2 12.4 12.0 12.8 12.1 14.5 13.1 12.6 12.2 11.8 11.4 10.9 10.5 10.1 9.7 9.3 8.9 10.3 11.5 12.0 12.8 13.6 14.4Jammu & Kashmir 13.7 15.2 16.2 13.2 12.4 12.0 12.8 12.1 14.5 13.1 12.6 12.2 11.8 11.4 10.9 10.5 10.1 9.7 9.3 8.9 10.3 11.5 12.0 12.8 13.6 14.4Karnataka 7.9 8.8 26.6 8.9 6.7 7.0 2.9 5.3 5.5 2.8 5.7 6.9 8.2 9.4 10.6 11.9 13.1 14.3 15.5 11.0 11.3 10.6 8.5 7.0 5.5 4.1Kerala 13.7 15.2 16.2 13.2 12.4 12.0 12.8 12.1 14.5 13.1 12.6 12.2 11.8 11.4 10.9 10.5 10.1 9.7 9.3 8.9 10.3 11.5 12.0 12.8 13.6 14.4Madhya Pradesh 14.9 16.5 14.6 19.3 12.2 11.0 9.0 10.4 9.9 10.6 11.2 10.9 10.5 10.2 9.9 9.5 9.2 8.9 8.5 7.3 10.5 12.3 13.3 14.8 16.3 17.7Maharashtra 12.3 13.7 14.1 10.0 7.8 10.2 10.0 9.4 10.9 9.2 8.9 8.8 8.7 8.5 8.4 8.3 8.2 8.0 7.9 7.0 15.5 13.9 17.7 20.4 23.1 25.7Orissa 24.3 27.0 25.9 19.8 33.5 19.0 5.3 5.2 4.3 1.6 5.9 5.4 4.9 4.5 4.0 3.5 3.0 2.5 2.1 4.5 3.0 5.1 5.6 6.4 7.1 7.9Punjab 6.4 7.1 8.2 13.1 10.2 7.1 12.8 4.7 12.2 9.5 10.7 10.2 9.6 9.1 8.5 8.0 7.4 6.9 6.3 4.0 10.1 7.0 8.9 9.7 10.5 11.3Rajasthan 13.3 14.8 7.2 4.9 9.2 10.3 9.4 5.0 14.7 3.7 4.2 4.2 4.2 4.2 4.2 4.2 4.1 4.1 4.1 5.3 9.4 11.3 13.9 16.5 19.1 21.6Tamil Nadu 10.2 11.3 7.5 8.2 6.0 6.4 5.9 4.3 16.6 10.9 4.5 4.7 4.9 5.2 5.4 5.6 5.8 6.1 6.3 8.4 11.0 12.8 15.1 17.3 19.6 21.8Uttar Pradesh 24.9 27.7 27.6 22.7 15.9 26.1 29.7 23.2 32.1 25.6 24.7 23.0 21.4 19.7 18.1 16.4 14.8 13.1 11.5 10.2 11.6 11.3 11.3 11.4 11.5 11.6West Bengal 12.5 13.9 40.4 24.2 17.9 16.7 14.8 22.0 30.4 31.6 33.1 32.0 30.8 29.7 28.6 27.5 26.3 25.2 24.1 21.5 21.7 19.9 18.8 17.5 16.3 15.1

188
Table D-4: Network losses (%)
Sources: Planning Commission, Annual Report (various years).
1990 1991 1992 1993 1994 1995 1996 1997 1998 1999 2000 2001 2002 2003 2004 2005 2006 2007 2008 2009 2010 2011 2012 2013 2014 2015Andhra Pradesh 22.9 20.3 20.7 20.2 18.1 19.6 33.1 32.3 33.6 37.7 36.6 26.8 30.1 28.1 26.2 24.2 22.3 20.3 19.2 18.1 16.3 16.0 16.0 15.4 14.0 13.2Assam 24.1 22.7 21.4 22.4 25.3 27.6 26.0 27.3 38.7 39.0 40.7 42.8 38.3 36.2 34.2 32.1 30.0 28.0 29.6 28.1 24.2 29.1 26.7 23.4 24.4 23.7Bihar 16.5 18.3 17.2 15.1 15.3 12.6 18.2 11.0 16.5 15.5 17.9 51.7 38.0 38.2 38.4 38.6 38.8 39.1 38.0 38.3 43.6 44.1 42.0 38.0 41.9 42.3Gujarat 23.4 23.6 22.2 20.8 20.9 21.0 21.4 24.4 25.3 25.3 28.1 26.9 28.5 27.6 26.6 25.7 24.7 23.8 22.8 17.1 18.2 18.3 18.4 17.9 15.9 15.0Haryana 27.5 26.8 26.8 25.0 30.8 32.4 32.8 34.0 35.3 38.3 39.8 39.2 37.7 35.7 33.8 31.9 30.0 28.1 25.7 26.4 24.3 22.9 23.7 20.4 20.1 19.0Himachal Pradesh 21.0 19.8 20.0 18.8 19.2 16.4 18.4 20.2 26.4 22.8 23.4 25.6 21.2 19.6 18.1 16.5 15.0 13.5 13.2 14.7 11.1 13.4 12.4 12.1 11.9 11.6Jammu & Kashmir 43.0 50.1 48.1 46.4 50.1 49.0 50.0 51.3 48.0 45.0 45.4 48.9 45.6 48.8 52.1 55.4 58.6 61.9 61.3 63.0 62.0 61.4 46.7 46.4 46.5 43.7Karnataka 20.2 19.9 19.6 19.5 19.4 19.2 18.9 19.1 30.6 37.3 34.9 33.8 24.6 24.7 24.9 25.0 25.1 25.3 23.3 21.4 21.7 20.0 19.1 18.3 16.9 15.8Kerala 22.4 22.5 22.8 20.5 20.8 21.5 21.4 19.1 17.7 17.8 18.4 32.2 27.5 25.9 24.4 22.9 21.4 19.9 19.9 19.2 17.9 18.3 16.8 16.5 15.9 15.3Madhya Pradesh 18.0 25.8 22.5 21.8 20.8 19.3 20.6 20.9 21.1 33.7 46.1 44.6 43.3 42.7 42.0 41.4 40.7 40.1 39.0 36.6 34.6 33.7 31.0 25.9 25.6 23.5Maharashtra 18.3 18.6 18.5 17.8 17.5 18.2 17.7 18.0 17.8 29.2 33.8 37.3 34.0 33.0 32.1 31.1 30.1 29.1 26.5 25.2 21.1 18.8 17.6 18.8 14.5 12.6Orissa 25.8 25.3 25.9 23.1 23.7 25.6 50.4 49.8 43.2 44.3 44.9 47.3 45.4 37.9 30.4 22.9 15.5 8.0 7.5 7.3 7.0 6.7 6.4 6.1 5.8 5.5Punjab 19.3 21.8 15.3 15.8 15.0 16.5 17.4 13.6 18.0 18.3 7.9 27.7 24.4 23.8 23.3 22.7 22.1 21.5 18.5 19.7 18.2 17.1 16.8 16.4 15.3 14.5Rajasthan 25.8 23.1 22.7 24.9 24.7 29.3 25.9 26.4 29.4 30.3 29.8 43.1 42.6 41.2 39.8 38.4 36.9 35.5 31.9 29.4 26.7 24.4 23.0 21.6 18.3 16.0Tamil Nadu 18.0 18.4 17.3 17.0 17.1 16.1 17.2 17.1 16.8 17.0 15.7 16.1 17.3 17.4 17.6 17.7 17.9 18.0 18.0 18.0 20.8 16.9 20.0 19.6 19.8 20.1Uttar Pradesh 27.1 26.1 24.7 24.4 21.9 22.8 25.1 26.5 30.3 40.4 36.9 37.6 34.2 33.8 33.5 33.2 32.9 32.6 28.6 31.1 31.0 31.6 28.8 27.0 27.8 27.3West Bengal 17.7 19.7 17.5 16.0 19.5 20.0 20.6 20.4 22.9 26.3 29.4 31.7 25.9 25.6 25.3 25.0 24.7 24.3 23.3 23.8 25.0 25.3 21.1 22.0 22.1 21.8

189
Table D-5: Electricity prices for industry (paise/kWh)
Sources: Planning Commission, Annual Report (various years).
1990 1991 1992 1993 1994 1995 1996 1997 1998 1999 2000 2001 2002 2003 2004 2005 2006 2007 2008 2009 2010 2011 2012 2013 2014 2015Andhra Pradesh 159.8 177.5 214.7 221.8 236.0 287.9 330.3 330.3 394.9 439.5 441.5 428.8 416.2 403.5 390.8 378.1 365.5 374.0 397.8 457.3 425.0 546.5 535.9 591.5 639.4 687.4Assam 89.2 99.1 132.8 129.7 195.3 210.3 209.4 233.0 380.9 429.7 447.6 456.0 464.4 472.8 481.2 489.6 498.0 522.0 534.0 447.0 521.0 537.0 537.0 547.7 555.7 563.7Bihar 157.1 174.6 205.0 220.5 247.4 246.8 275.9 275.9 334.3 362.3 362.3 376.2 390.2 404.2 418.1 432.1 446.1 435.5 430.5 504.5 674.5 583.6 671.1 639.7 638.0 636.3Gujarat 169.2 188.0 220.2 220.0 235.0 284.7 336.8 396.5 391.1 439.6 476.7 473.6 470.4 467.3 464.2 461.1 458.0 537.7 527.5 514.8 566.2 591.6 607.9 630.3 651.1 672.0Haryana 153.9 171.0 195.7 222.3 266.6 319.9 338.0 341.0 411.1 428.0 477.9 470.2 462.4 454.6 446.9 439.1 431.3 429.7 424.7 474.1 498.3 574.1 573.0 623.2 660.5 697.9Himachal Pradesh 87.3 97.0 105.0 125.0 135.0 161.2 182.8 194.0 235.9 265.0 275.0 284.0 292.9 301.9 310.9 319.8 328.8 355.2 345.7 369.1 414.0 422.3 430.8 439.1 447.5 455.9Jammu & Kashmir 41.9 46.6 39.6 40.3 41.0 40.0 47.3 59.0 135.0 135.0 135.0 148.2 161.3 174.5 187.7 200.8 214.0 245.7 256.5 283.8 317.0 340.9 340.9 356.9 368.8 380.8Karnataka 166.9 185.4 221.6 231.0 262.2 227.2 302.9 325.0 410.0 409.9 480.7 478.5 476.2 474.0 471.7 469.5 467.2 469.3 492.6 524.5 556.3 585.4 610.2 637.9 664.8 691.8Kerala 74.3 82.5 92.8 101.1 104.2 116.8 150.6 165.9 225.2 225.2 226.7 256.3 285.9 315.6 345.2 374.8 404.5 474.7 413.2 427.5 418.6 537.1 567.9 657.1 731.7 806.4Madhya Pradesh 165.5 183.9 211.0 238.0 268.3 357.0 401.8 385.1 435.8 437.8 437.8 437.7 437.6 437.5 437.4 437.2 437.1 448.8 444.5 488.9 525.6 563.5 580.6 611.5 639.0 666.5Maharashtra 190.0 211.1 232.9 270.5 271.8 330.8 345.3 351.2 353.7 419.9 208.8 247.9 287.0 326.1 365.2 404.3 443.4 446.0 482.0 602.4 630.5 716.4 771.8 847.6 918.2 988.9Orissa 80.2 89.1 111.3 170.8 193.6 237.5 256.2 277.5 319.1 323.0 0.0 52.2 104.4 156.5 208.7 260.9 313.1 331.4 342.3 411.8 527.4 612.4 642.3 708.9 766.4 823.8Punjab 113.2 125.8 153.5 165.1 187.1 219.2 241.2 243.2 279.2 300.3 306.5 316.1 325.7 335.3 344.9 354.5 364.1 386.4 425.1 434.0 486.2 580.6 586.7 651.7 701.9 752.2Rajasthan 141.2 156.9 178.0 204.1 234.6 280.2 304.7 311.8 379.4 392.9 395.1 409.5 423.8 438.2 452.5 466.9 481.2 487.0 493.4 415.4 458.1 474.2 582.3 629.0 691.1 753.2Tamil Nadu 150.5 167.2 202.4 245.1 270.5 281.5 321.4 365.9 342.1 379.6 395.4 405.3 415.2 425.2 435.1 445.1 455.0 457.9 473.5 486.2 478.2 702.9 735.4 896.0 1024.5 1153.1Uttar Pradesh 189.8 210.9 225.2 240.8 272.1 276.0 335.5 341.6 412.9 464.4 482.0 473.8 465.5 457.3 449.1 440.9 432.6 431.8 485.2 496.3 509.9 653.7 736.4 859.7 972.9 1086.1West Bengal 113.3 125.9 149.5 183.0 209.3 202.1 246.7 283.7 321.3 320.0 352.8 362.8 372.8 382.7 392.7 402.6 412.6 416.7 460.3 557.5 589.6 641.5 650.5 688.0 718.4 748.9

190
Table D-6: Electricity prices for agriculture (paise/kWh)
Sources: Planning Commission, Annual Report (various years).
1990 1991 1992 1993 1994 1995 1996 1997 1998 1999 2000 2001 2002 2003 2004 2005 2006 2007 2008 2009 2010 2011 2012 2013 2014 2015Andhra Pradesh 7.7 8.6 6.4 5.3 2.8 12.0 17.4 16.1 15.4 15.0 14.0 13.0 12.1 11.1 10.1 9.1 8.2 8.6 9.2 10.7 12.0 18.7 44.3 57.2 62.8 68.3Assam 161.1 179.0 93.3 88.0 158.9 271.6 166.8 156.6 227.6 272.4 287.2 313.4 339.7 365.9 392.2 418.5 444.7 490.2 374.3 389.8 430.8 446.7 446.7 457.4 465.3 473.3Bihar 9.5 10.5 14.8 15.2 16.2 14.0 14.0 14.0 13.4 13.4 13.4 21.8 30.3 38.7 47.1 55.6 64.0 64.0 64.0 223.6 169.1 357.0 410.6 553.6 674.4 795.1Gujarat 9.9 11.0 19.0 22.0 19.0 20.0 18.0 17.0 15.0 39.0 63.6 72.9 82.2 91.6 100.9 110.2 119.5 197.5 176.9 167.0 207.2 214.9 217.6 223.6 228.7 233.9Haryana 23.0 25.5 29.0 45.5 51.9 52.4 55.0 55.0 35.5 37.0 47.7 46.0 44.4 42.7 41.1 39.4 37.7 40.2 35.8 41.5 43.6 48.0 46.5 48.9 50.3 51.8Himachal Pradesh 29.7 33.0 33.0 50.0 50.0 50.0 50.0 60.0 50.0 50.0 50.0 66.3 82.5 98.8 115.1 131.4 147.6 256.6 554.1 513.1 0.0 0.0 0.0 0.0 0.0 0.0Jammu & Kashmir 10.6 11.8 9.1 9.3 10.3 10.0 12.5 15.8 220.0 220.0 220.0 221.0 222.0 223.0 224.0 225.0 226.0 151.4 129.0 142.0 160.0 168.5 168.5 174.2 178.4 182.6Karnataka 3.8 4.2 2.8 1.8 1.7 62.6 87.1 86.0 31.5 30.5 38.8 44.5 50.2 55.8 61.5 67.2 72.9 82.3 145.3 304.7 107.5 152.6 172.9 209.8 242.5 275.2Kerala 22.6 25.1 29.4 23.9 23.7 27.0 50.0 55.1 67.2 67.2 67.2 73.6 80.0 86.3 92.7 99.1 105.4 135.3 109.9 115.1 107.5 152.6 172.9 209.8 242.5 275.2Madhya Pradesh 22.1 24.5 19.7 3.7 4.2 8.0 10.0 9.1 7.2 7.2 7.2 24.5 41.8 59.1 76.4 93.7 111.0 206.0 261.2 299.0 317.7 340.5 350.7 369.3 385.8 402.3Maharashtra 13.7 15.2 22.7 18.2 16.5 22.7 25.5 25.4 45.7 82.3 82.3 97.4 112.5 127.6 142.8 157.9 173.0 194.1 201.9 205.9 214.7 239.8 258.3 281.2 303.0 324.8Orissa 27.8 30.9 21.2 53.1 54.2 54.6 65.8 72.0 102.0 107.7 0.0 19.1 38.2 57.3 76.3 95.4 114.5 131.0 185.4 112.4 110.4 61.1 67.6 75.1 82.4 89.7Punjab 9.7 10.8 19.5 34.5 38.5 28.6 0.0 0.0 0.0 0.0 0.0 0.3 0.6 0.9 1.2 1.5 1.8 0.0 0.0 51.3 0.2 0.4 0.0 0.0 0.0 0.0Rajasthan 27.9 31.0 30.8 30.1 27.2 26.7 38.0 38.0 33.6 46.3 46.3 61.9 77.6 93.2 108.8 124.4 140.0 133.7 123.1 127.1 129.4 147.1 180.6 203.5 229.1 254.7Tamil Nadu 0.0 0.0 0.0 0.0 0.0 1.5 1.6 1.2 1.2 1.3 1.3 1.1 0.9 0.7 0.5 0.3 0.0 0.0 0.0 0.1 0.0 0.0 0.0 0.0 0.0 0.0Uttar Pradesh 28.4 31.6 31.9 43.1 49.5 42.5 44.7 46.6 64.3 107.8 119.0 126.3 133.7 141.0 148.3 155.6 163.0 153.1 159.6 195.9 191.9 236.8 224.2 249.9 266.1 282.2West Bengal 17.3 19.2 25.3 19.9 21.8 21.4 29.7 34.1 36.0 57.9 91.9 96.7 101.5 106.3 111.1 115.9 120.7 168.8 138.9 145.6 263.6 413.6 415.2 515.8 591.6 667.4

191
Table D-7: Costs of electricity supply (paise/kWh)
Sources: Planning Commission, Annual Report (various years).
1990 1991 1992 1993 1994 1995 1996 1997 1998 1999 2000 2001 2002 2003 2004 2005 2006 2007 2008 2009 2010 2011 2012 2013 2014 2015Andhra Pradesh 78.7 89.2 100.1 109.0 128.9 156.1 213.8 239.7 287.6 313.8 343.4 360.7 356.6 352.6 348.5 344.5 340.4 336.3 423.4 401.2 387.0 332.1 385.6 425.6 474.6 521.4Assam 249.6 281.2 255.2 252.7 299.3 356.1 337.3 457.2 450.6 432.9 556.8 589.1 575.6 562.0 548.5 534.9 521.4 507.9 549.4 596.2 616.3 375.9 374.3 363.8 359.3 353.2Bihar 169.0 176.5 185.7 200.1 232.8 252.4 290.6 316.0 346.2 365.1 391.8 377.1 425.3 473.5 521.7 569.9 618.2 666.4 691.9 720.5 721.9 373.8 341.9 388.1 382.3 389.5Gujarat 110.1 132.3 146.6 158.4 171.6 181.5 207.4 247.6 277.2 313.1 354.5 365.4 369.8 374.2 378.6 382.9 387.3 391.7 464.3 441.2 425.5 338.2 360.2 371.7 390.2 407.0Haryana 103.7 115.5 134.4 165.4 179.5 208.7 240.6 293.4 299.2 349.5 403.7 411.9 420.4 428.9 437.5 446.0 454.5 463.0 543.1 578.5 533.6 394.5 397.6 399.5 402.2 404.8Himachal Pradesh 94.8 118.2 114.3 142.8 126.6 111.5 143.0 166.0 192.9 254.4 238.4 235.4 259.8 284.2 308.6 333.0 357.4 381.9 421.6 451.0 472.8 270.0 302.7 309.5 333.6 353.4Jammu & Kashmir 125.6 172.3 165.5 209.1 230.8 242.5 286.2 293.0 325.3 379.8 432.3 412.3 451.8 491.3 530.8 570.3 609.8 649.3 677.7 644.4 719.1 271.1 319.6 384.0 437.8 494.3Karnataka 82.6 92.0 96.8 112.1 121.1 152.3 187.3 179.4 242.6 279.6 324.6 374.6 374.9 375.2 375.4 375.7 376.0 376.3 417.5 408.8 462.8 309.5 333.5 341.6 360.3 376.3Kerala 68.2 81.3 87.3 98.3 108.8 134.5 161.3 196.0 179.2 240.4 303.0 347.3 351.7 356.2 360.6 365.1 369.5 374.0 456.7 477.2 451.5 238.1 383.5 320.9 396.9 438.3Madhya Pradesh 116.4 121.5 141.4 157.8 167.2 181.6 216.2 231.5 251.1 314.4 314.4 324.9 345.4 365.9 386.4 406.9 427.4 447.9 492.5 557.7 561.3 275.6 290.9 288.2 297.6 303.9Maharashtra 107.4 124.5 139.0 152.2 162.0 185.3 206.9 215.6 223.3 298.8 318.7 357.5 366.3 375.1 384.0 392.8 401.6 410.4 450.0 466.2 462.0 356.0 377.2 388.0 405.8 421.8Orissa 71.4 71.8 98.8 133.5 185.7 227.5 322.6 351.7 374.1 162.0 177.2 184.9 207.7 230.4 253.2 275.9 298.7 321.4 366.2 329.9 292.0 254.1 216.1 222.3 232.5 241.6Punjab 106.8 98.8 122.0 145.2 165.1 179.7 187.3 217.2 236.2 260.1 274.5 285.2 305.3 325.5 345.6 365.8 385.9 406.0 405.4 414.5 499.8 230.7 276.3 303.4 342.9 379.2Rajasthan 114.6 113.3 138.2 163.8 196.5 213.2 234.5 258.6 284.3 336.1 341.3 368.2 392.1 415.9 439.8 463.6 487.5 511.3 637.7 679.8 629.8 335.9 375.8 380.1 408.1 430.2Tamil Nadu 114.3 103.3 124.5 144.7 152.0 170.9 185.0 208.1 230.6 255.2 270.8 309.8 324.5 339.2 353.8 368.5 383.2 397.9 478.9 493.8 511.7 377.0 429.1 387.8 408.8 414.2Uttar Pradesh 110.0 119.5 153.4 169.4 177.5 192.0 222.3 253.3 253.3 359.0 361.1 383.6 387.9 392.3 396.6 401.0 405.3 409.7 438.8 506.5 501.3 369.9 389.6 409.2 428.8 448.5West Bengal 157.2 163.7 161.9 170.1 185.2 189.4 205.4 252.5 300.4 332.7 344.3 376.8 372.8 368.8 364.9 360.9 356.9 352.9 490.8 443.5 471.6 377.7 382.9 382.3 385.6 387.9

192
Table D-8: Electricity generation (GWh)
Sources: Planning Commission, Annual Report (various years), Central Electricity Authority, General Review (various years).
1990 1991 1992 1993 1994 1995 1996 1997 1998 1999 2000 2001 2002 2003 2004 2005 2006 2007 2008 2009 2010 2011 2012 2013 2014 2015Andhra Pradesh 18,249 18,655 18,371 19,959 21,141 22,499 25,499 29,182 57,384 61,141 61,968 62,671 62,959 63,121 68,238 68,200 70,108 75,452 77,024 89,005 92,025 97,180 103,785 110,312 117,030 123,640 Assam 1,206 1,080 1,068 940 1,255 1,423 1,332 1,033 1,066 1,027 1,000 986 817 942 931 1,709 1,677 2,016 2,950 3,376 3,560 3,788 4,376 4,590 4,908 5,306 Bihar 2,964 2,599 2,967 2,987 2,700 2,301 2,742 3,570 4,225 3,623 3,613 2,088 1,894 1,739 1,512 1,329 1,141 1,797 4,011 5,797 3,441 3,160 4,305 3,528 2,928 3,252 Gujarat 19,875 20,801 23,045 24,121 24,934 25,993 27,075 30,247 34,357 36,401 36,506 34,336 39,167 41,555 45,476 70,354 70,394 80,607 91,238 104,884 122,054 135,910 152,065 167,034 182,979 198,027 Haryana 6,938 7,765 7,973 6,677 7,418 7,262 7,627 7,332 7,676 8,021 15,604 17,165 18,839 20,266 19,600 23,259 23,643 24,905 29,571 33,462 31,490 33,431 36,283 36,866 37,781 39,979 Himachal Pradesh 1,262 1,050 1,087 977 1,132 1,285 1,252 1,306 1,484 1,201 1,216 1,418 1,578 2,715 2,743 2,825 2,908 3,073 3,744 4,019 4,820 6,720 7,647 8,542 9,548 10,804 Jammu & Kashmir 875 878 801 790 879 798 796 951 713 608 646 683 1,102 1,678 1,507 1,644 1,847 2,411 2,735 3,530 4,721 5,068 5,883 6,738 7,461 8,120 Karnataka 12,430 12,907 12,758 14,344 16,830 15,503 12,927 17,109 17,203 21,141 25,262 29,107 29,783 34,326 37,404 41,229 45,001 55,179 56,339 59,998 64,148 63,309 67,936 70,298 72,607 75,090 Kerala 5,491 5,326 6,193 5,822 6,571 6,620 5,471 5,183 7,602 7,650 8,057 8,499 8,696 9,790 9,043 9,343 9,643 8,152 9,776 7,282 7,231 7,186 6,988 6,467 6,633 6,222 Madhya Pradesh 12,937 12,525 13,260 14,383 16,597 17,599 18,416 19,449 20,562 21,836 21,782 21,722 21,666 21,574 21,583 38,013 37,975 40,339 45,889 51,132 54,405 59,280 64,117 68,346 72,676 77,419 Maharashtra 36,439 39,200 38,607 41,417 46,561 50,699 53,561 54,187 56,639 62,557 61,844 61,526 63,321 64,690 66,114 118,380 120,161 135,374 153,883 167,606 184,913 224,335 241,824 264,296 288,020 311,318 Orissa 5,792 8,760 9,012 5,373 5,765 9,808 10,592 9,862 11,057 13,291 13,853 15,993 13,286 17,200 19,871 19,397 23,093 25,435 27,407 27,123 26,528 29,252 29,176 29,597 30,614 31,588 Punjab 14,618 14,677 15,718 16,322 17,175 16,899 18,455 17,900 20,880 22,563 23,183 23,804 24,428 25,046 25,670 26,345 27,020 24,273 26,294 27,799 23,702 22,820 23,350 21,533 19,985 19,657 Rajasthan 6,717 8,130 8,592 8,529 8,773 9,929 10,386 10,853 11,964 12,639 13,781 29,085 33,221 35,801 39,310 42,635 45,623 49,437 54,279 57,200 57,445 63,803 66,748 69,357 72,586 76,431 Tamil Nadu 13,202 13,833 16,958 17,627 19,917 21,975 22,954 23,827 23,279 26,155 26,675 29,233 31,375 32,374 32,557 36,595 39,958 45,033 44,406 46,679 47,178 46,765 48,506 49,193 49,545 50,392 Uttar Pradesh 19,688 18,692 18,167 19,847 21,675 22,827 23,637 23,790 24,938 23,598 23,516 46,067 25,729 46,106 44,263 44,120 53,469 58,879 64,203 71,422 79,605 86,738 94,341 101,939 108,957 116,345 West Bengal 9,001 6,075 6,427 13,585 14,296 7,148 7,643 14,755 15,883 16,650 19,836 25,800 29,610 32,547 35,294 37,236 40,065 45,171 47,623 50,200 55,605 56,649 60,524 63,795 66,902 69,688

193
Table D-9: State generation (GWh)
Sources: Planning Commission, Annual Report (various years), Central Electricity Authority, General Review (various years).
1990 1991 1992 1993 1994 1995 1996 1997 1998 1999 2000 2001 2002 2003 2004 2005 2006 2007 2008 2009 2010 2011 2012 2013 2014 2015Andhra Pradesh 17,397 17,563 17,217 18,750 20,045 21,235 24,074 25,853 26,579 27,304 28,030 28,756 29,481 30,207 30,933 31,658 32,384 33,110 33,079 33,033 32,389 37,451 36,210 37,636 39,252 40,761 Assam 1,206 1,080 1,068 940 1,255 1,423 1,332 1,033 926 867 850 834 817 801 784 768 751 868 1,549 1,755 1,709 1,703 2,066 2,051 2,141 2,298 Bihar 2,964 2,599 2,967 2,975 2,683 2,277 2,008 2,039 2,708 2,423 2,230 2,036 1,843 1,649 1,456 1,262 1,069 1,045 3,229 4,986 2,647 2,204 3,343 2,516 1,866 2,141 Gujarat 17,432 18,120 20,304 21,233 21,987 23,053 22,899 23,811 23,144 23,178 23,754 24,329 24,905 25,481 26,057 26,633 27,208 29,569 32,741 30,912 33,454 33,524 34,627 34,967 36,281 36,700 Haryana 6,938 7,765 7,973 6,677 7,418 7,262 7,627 7,332 7,676 8,021 8,366 8,711 9,056 9,401 9,746 10,091 10,436 10,781 14,540 17,505 14,559 15,561 17,463 17,096 17,062 18,310 Himachal Pradesh 1,262 1,050 1,087 977 1,132 1,285 1,252 1,306 1,484 1,201 1,216 1,231 1,246 1,261 1,276 1,291 1,306 1,456 2,092 2,413 1,526 1,739 1,845 1,573 1,410 1,499 Jammu & Kashmir 875 878 801 790 879 798 796 951 713 608 646 683 721 758 796 834 871 1,327 1,543 2,230 3,312 3,552 4,259 5,006 5,621 6,171 Karnataka 709 707 804 919 1,150 1,160 932 1,099 1,089 1,096 3,654 6,213 8,771 11,330 13,888 16,447 19,005 26,683 26,642 26,419 26,019 22,721 23,132 21,771 20,358 19,119 Kerala 5,491 5,326 6,193 5,822 6,571 6,620 5,471 5,155 7,558 7,614 7,873 8,132 8,390 8,649 8,908 9,167 9,426 7,744 8,833 6,633 7,008 7,137 6,559 6,021 6,170 5,741 Madhya Pradesh 12,937 12,525 13,260 14,383 16,597 17,599 18,410 19,441 20,552 21,812 21,753 21,693 21,634 21,574 21,515 21,455 21,396 18,846 19,260 19,465 17,740 17,396 17,215 16,368 15,621 15,288 Maharashtra 28,764 31,373 31,062 34,113 38,212 39,470 41,056 41,607 44,363 45,287 46,275 47,264 48,253 49,242 50,230 51,219 52,208 51,495 54,523 51,321 50,624 47,504 47,529 44,959 43,642 41,899 Orissa 3,839 4,252 3,739 3,580 3,574 2,670 3,346 4,022 4,699 5,375 6,052 6,728 7,404 8,081 8,757 9,433 10,110 10,786 11,092 9,142 6,881 7,939 6,197 4,952 4,303 3,611 Punjab 14,618 14,677 15,718 16,322 17,175 16,899 18,455 17,900 20,880 22,563 23,183 23,804 24,425 25,046 25,666 26,287 26,908 24,107 26,149 27,566 23,458 22,516 22,997 21,131 19,534 19,157 Rajasthan 6,717 8,130 8,592 8,529 8,773 9,929 10,386 10,853 11,964 12,638 13,775 14,912 16,050 17,187 18,324 19,461 20,599 22,225 24,885 25,324 22,673 23,832 24,088 23,235 23,002 23,384 Tamil Nadu 13,202 13,833 16,958 17,627 19,917 21,975 22,954 23,066 22,142 23,550 24,194 24,838 25,483 26,127 26,771 27,416 28,060 29,510 28,576 29,121 27,720 25,479 25,406 24,265 22,790 21,810 Uttar Pradesh 19,484 18,133 18,167 19,847 21,675 22,827 23,637 23,790 24,938 23,598 23,516 23,434 23,352 23,270 23,188 23,106 23,024 22,969 22,054 23,596 23,824 22,257 23,044 23,147 22,670 22,562 West Bengal 2,858 2,853 2,870 3,703 3,750 3,208 3,761 3,850 3,635 3,948 5,345 6,743 8,141 9,539 10,937 12,335 13,733 17,829 19,470 21,276 25,047 25,139 27,811 29,913 31,849 33,465

194
Table D-10: Private generation (GWh)
Sources: Planning Commission, Annual Report (various years), Central Electricity Authority, General Review (various years).
1990 1991 1992 1993 1994 1995 1996 1997 1998 1999 2000 2001 2002 2003 2004 2005 2006 2007 2008 2009 2010 2011 2012 2013 2014 2015Andhra Pradesh 2,043 2,909 3,317 4,009 5,093 6,261 6,285 6,437 5,794 5,151 8,286 8,406 18,949 21,131 19,741 26,103 29,722 33,340 36,959 Assam 140 160 150 152 141 147 131 115 94 104 80 67 58 40 25 10 8 Bihar 5 10 14 19 24 29 29 47 49 56 63 69 Gujarat 2,443 2,668 2,724 2,869 2,927 2,930 4,168 6,431 11,205 13,221 12,752 6,587 9,038 11,774 15,025 14,905 14,784 15,551 15,922 24,310 31,851 38,550 46,515 54,057 61,600 69,143 Haryana 7 14 22 29 26 42 107 137 178 218 258 297 Himachal Pradesh 187 332 1,454 1,467 1,534 1,602 1,617 1,652 1,605 3,293 4,981 5,802 6,970 8,137 9,305 Jammu & KashmirKarnataka 64 89 54 67 81 124 505 2,114 4,071 2,870 3,818 3,693 4,066 4,439 6,101 6,466 9,512 13,225 14,846 18,225 21,111 23,996 26,882 Kerala 28 44 36 184 368 306 1,141 135 176 217 408 943 649 223 49 428 446 463 481 Madhya Pradesh 6 7 11 23 29 28 33 - 69 89 110 83 279 376 434 712 790 926 1,062 1,197 Maharashtra 7,676 7,827 7,545 7,304 8,350 11,229 12,505 12,575 12,269 16,911 15,569 14,262 15,069 15,448 15,884 16,676 17,468 18,248 18,584 20,363 23,221 50,617 52,936 62,832 72,728 82,623 Orissa 806 1,613 2,419 3,225 4,032 4,838 5,645 6,451 7,257 8,064 8,870 9,676 Punjab 3 4 58 112 166 145 233 244 304 353 402 451 500 Rajasthan 11 25 15 318 407 497 791 1,081 1,669 2,673 5,978 6,774 8,343 9,913 11,482 Tamil Nadu 761 1,138 2,606 2,481 4,395 5,893 6,247 5,786 8,505 11,224 14,646 14,751 16,277 17,974 19,601 21,213 22,838 24,463 26,088 Uttar Pradesh 164 328 492 656 1,594 1,971 4,626 8,026 9,541 11,736 13,931 16,126 West Bengal 2,828 3,222 3,557 3,617 3,831 3,940 3,882 4,228 4,965 5,618 6,389 5,429 6,574 6,937 7,277 7,616 7,954 8,146 8,139 8,092 8,907 9,041 9,425 9,777 10,129 10,482

195
Table D-11: Introduction periods of various components for reforms
Structure1 Regulation1
Andhra Pradesh 2000 1999
Assam 2004 2002
Bihar - 2005
Gujarat 2005 2003
Haryana 1998 1998
Himachal Pradesh 2010 2002
Jammu & Kashmir - 2013
Karnataka 1999 1999
Kerala - 2003
Madhya Pradesh 2005 2001
Maharashtra 2005 1999
Orissa 1996 1997
Punjab 2010 1999
Rajasthan 2000 2000
Tamil Nadu 2010 1999
Uttar Pradesh 2000 1999
West Bengal 2007 1999
Note 1: Year when the reform component was implemented
Sources: various

196
Table D-12: Rural population (% of total population)
Sources: Census data (various years).
1990 1991 1992 1993 1994 1995 1996 1997 1998 1999 2000 2001 2002 2003 2004 2005 2006 2007 2008 2009 2010 2011 2012 2013 2014 2015Andhra Pradesh 73.4 73.1 73.0 73.0 73.0 72.9 72.9 72.8 72.8 72.8 72.7 72.7 72.0 71.4 70.7 70.1 69.5 68.9 68.3 67.8 67.2 66.6 66.1 65.6 65.0 64.5Assam 89.7 88.9 88.4 88.0 87.6 87.2 86.8 86.4 86.0 85.7 85.3 85.0 85.1 85.2 85.3 85.4 85.5 85.6 85.7 85.7 85.8 85.9 86.0 86.1 86.1 86.2Bihar 86.5 86.2 86.6 87.0 87.4 87.7 88.1 88.4 88.7 89.0 89.3 89.5 89.4 89.3 89.2 89.2 89.1 89.0 88.9 88.8 88.8 88.7 88.6 88.6 88.5 88.5Gujarat 65.8 65.5 65.1 64.7 64.3 64.0 63.6 63.3 63.0 62.7 62.4 62.1 61.6 61.0 60.5 60.0 59.5 59.1 58.6 58.2 57.8 57.4 57.0 56.6 56.3 55.9Haryana 75.6 75.4 74.8 74.2 73.6 73.1 72.6 72.1 71.7 71.2 70.8 70.4 69.8 69.2 68.6 68.1 67.5 67.0 66.5 66.0 65.6 65.1 64.7 64.3 63.9 63.5Himachal Pradesh 91.5 91.3 91.0 90.7 90.4 90.2 89.9 89.7 89.4 89.2 88.9 88.7 88.9 89.0 89.1 89.3 89.4 89.5 89.6 89.7 89.9 90.0 90.1 90.2 90.3 90.4Jammu & Kashmir 75.3 75.0 74.7 74.4 74.1 73.8 73.5 73.3 73.0 72.8 72.6 72.4 72.4 72.4 72.5 72.5 72.5 72.5 72.6 72.6 72.6 72.6 72.6 72.7 72.7 72.7Karnataka 69.2 69.1 68.7 68.3 67.9 67.6 67.2 66.9 66.6 66.3 65.9 65.7 65.2 64.7 64.2 63.8 63.3 62.9 62.5 62.1 61.7 61.3 61.0 60.6 60.3 59.9Kerala 74.3 73.6 73.1 72.6 72.2 71.7 71.2 70.8 70.4 69.9 69.5 69.1 67.3 65.6 63.9 62.2 60.5 58.8 57.2 55.5 53.9 52.3 50.7 49.1 47.6 46.0Madhya Pradesh 77.2 76.8 76.3 75.8 75.2 74.6 74.1 73.5 72.9 72.3 71.7 71.1 71.2 71.4 71.5 71.6 71.8 71.9 72.0 72.1 72.3 72.4 72.5 72.6 72.7 72.8Maharashtra 61.6 61.3 60.8 60.3 59.8 59.3 58.9 58.5 58.1 57.7 57.3 56.9 56.7 56.4 56.2 56.0 55.8 55.6 55.4 55.2 55.0 54.8 54.6 54.4 54.2 54.1Orissa 86.8 86.6 86.3 86.0 85.7 85.4 85.1 84.8 84.6 84.3 84.1 83.8 83.7 83.7 83.6 83.6 83.5 83.5 83.4 83.4 83.4 83.3 83.3 83.2 83.2 83.2Punjab 70.6 70.5 69.9 69.3 68.8 68.3 67.8 67.4 66.9 66.5 66.1 65.6 65.3 65.0 64.6 64.3 64.0 63.7 63.4 63.1 62.8 62.5 62.2 62.0 61.7 61.5Rajasthan 77.3 77.1 76.7 76.3 76.0 75.6 75.3 75.0 74.6 74.4 74.1 73.8 74.0 74.1 74.3 74.4 74.5 74.7 74.8 74.9 75.0 75.1 75.2 75.3 75.4 75.5Tamil Nadu 66.0 65.8 64.7 63.6 62.6 61.5 60.5 59.5 58.5 57.6 56.6 55.7 55.3 54.8 54.4 53.9 53.5 53.1 52.7 52.3 52.0 51.6 51.3 50.9 50.6 50.3Uttar Pradesh 84.6 84.4 83.5 82.6 81.7 80.9 80.1 79.3 78.6 77.9 77.3 76.6 76.8 76.9 77.0 77.1 77.2 77.3 77.4 77.5 77.6 77.7 77.8 77.9 78.0 78.1West Bengal 72.6 72.5 72.4 72.3 72.2 72.1 72.0 71.9 71.8 71.7 71.7 71.6 71.2 70.8 70.5 70.1 69.7 69.4 69.1 68.7 68.4 68.1 67.8 67.5 67.2 67.0

197
Table D-13: Industry value added (% of gross state domestic product)
Notes: Industry includes mining, manufacturing, infrastructure, construction and banking.
Sources: Reserve Bank of India, Handbook of Statistics on the Indian Economy (various years).
1990 1991 1992 1993 1994 1995 1996 1997 1998 1999 2000 2001 2002 2003 2004 2005 2006 2007 2008 2009 2010 2011 2012 2013 2014 2015Andhra Pradesh 0.31 0.34 0.35 0.36 0.37 0.37 0.37 0.40 0.38 0.40 0.39 0.41 0.43 0.42 0.46 0.47 0.48 0.48 0.49 0.47 0.47 0.52 0.48 0.47 0.46 0.46Assam 0.27 0.27 0.27 0.28 0.26 0.26 0.26 0.28 0.27 0.28 0.28 0.29 0.33 0.34 0.42 0.39 0.39 0.38 0.38 0.38 0.40 0.48 0.46 0.47 0.46 0.46Bihar 0.17 0.17 0.17 0.18 0.17 0.19 0.17 0.21 0.17 0.25 0.23 0.24 0.23 0.23 0.29 0.31 0.30 0.33 0.33 0.34 0.36 0.40 0.37 0.37 0.35 0.32Gujarat 0.68 0.61 0.57 0.55 0.52 0.56 0.52 0.51 0.51 0.57 0.56 0.53 0.56 0.54 0.64 0.63 0.62 0.62 0.63 0.65 0.60 0.59 0.63 0.60 0.61 0.61Haryana 0.23 0.31 0.35 0.37 0.39 0.43 0.40 0.43 0.42 0.42 0.42 0.45 0.47 0.55 0.58 0.59 0.57 0.56 0.54 0.56 0.54 0.56 0.57 0.58 0.58 0.59Himachal Pradesh 0.28 0.36 0.39 0.38 0.42 0.43 0.43 0.42 0.42 0.46 0.45 0.45 0.46 0.46 0.53 0.53 0.55 0.53 0.55 0.57 0.56 0.61 0.61 0.61 0.61 0.61Jammu & Kashmir 0.28 0.28 0.28 0.30 0.26 0.29 0.27 0.27 0.30 0.33 0.34 0.35 0.34 0.34 0.43 0.44 0.45 0.45 0.44 0.44 0.42 0.48 0.46 0.46 0.47 0.46Karnataka 0.28 0.35 0.37 0.39 0.40 0.40 0.40 0.42 0.42 0.42 0.43 0.47 0.50 0.53 0.60 0.59 0.63 0.62 0.63 0.62 0.60 0.67 0.67 0.66 0.66 0.66Kerala 0.25 0.31 0.34 0.36 0.36 0.37 0.37 0.38 0.39 0.40 0.43 0.44 0.45 0.46 0.51 0.51 0.52 0.53 0.52 0.52 0.54 0.67 0.67 0.66 0.66 0.66Madhya Pradesh 0.34 0.35 0.35 0.34 0.37 0.37 0.36 0.37 0.36 0.37 0.39 0.38 0.40 0.37 0.47 0.47 0.50 0.51 0.52 0.51 0.50 0.46 0.39 0.40 0.39 0.37Maharashtra 0.60 0.59 0.58 0.58 0.58 0.59 0.54 0.57 0.58 0.55 0.55 0.55 0.55 0.57 0.66 0.68 0.68 0.68 0.69 0.68 0.67 0.67 0.67 0.66 0.68 0.67Orissa 0.40 0.38 0.36 0.35 0.36 0.34 0.34 0.32 0.34 0.38 0.39 0.38 0.40 0.39 0.52 0.51 0.53 0.52 0.54 0.48 0.50 0.59 0.55 0.55 0.53 0.55Punjab 0.21 0.26 0.28 0.30 0.31 0.33 0.32 0.33 0.34 0.33 0.33 0.33 0.34 0.34 0.46 0.47 0.49 0.50 0.48 0.49 0.49 0.43 0.43 0.42 0.42 0.42Rajasthan 0.47 0.42 0.40 0.39 0.39 0.40 0.36 0.38 0.38 0.39 0.40 0.39 0.44 0.39 0.51 0.52 0.53 0.52 0.52 0.52 0.46 0.50 0.49 0.49 0.48 0.48Tamil Nadu 0.59 0.55 0.53 0.50 0.51 0.53 0.52 0.50 0.49 0.50 0.50 0.49 0.53 0.54 0.63 0.62 0.62 0.62 0.61 0.61 0.61 0.64 0.65 0.62 0.61 0.60Uttar Pradesh 0.32 0.33 0.34 0.33 0.34 0.35 0.34 0.35 0.34 0.36 0.36 0.36 0.37 0.37 0.47 0.48 0.50 0.50 0.47 0.48 0.48 0.50 0.50 0.50 0.51 0.51West Bengal 0.52 0.45 0.42 0.41 0.40 0.41 0.39 0.39 0.39 0.37 0.39 0.39 0.40 0.42 0.47 0.46 0.47 0.47 0.46 0.44 0.43 0.44 0.42 0.41 0.41 0.40

198
Table D-14: Centre-state relationship
Notes: AITC=All India Trinamool Congress; ADK=All India Anna Dravida Munnetra Kazhagam; AGP=Asom Gana Parishad; BAC=Bangla Congress; BJD=Biju Janata Dal; BJP=Bharatiya Janata Party;
BSP=Bahujan Samaj Party; CPI=Communist Party of India; DMK=Dravida Munitra Kazhagam; HPU=Hill People Union; INC=Indian National Congress; JD=Janata Dal; JKN=Jammu&Kashmir
National Conference; JKPDP=Jammu & Kashmir People’s Democratic Party; JNP=Janata Party; MPP=Manipur People’s Party; MSCP=Manipur State Congress Party; MNF=Mizo National Front;
NPF=Nagaland People’s Front; PDP=People’s Democratic Party; RJD=Rashtriya Janata Dal; SAD=Shiromani Akali Dal; SHS=Shiv Sena; SP=Samajwadi Party; TDP=Telugu Desam; UDP=United
Democratic Party
Sources: Election Commission of India
1990 1991 1992 1993 1994 1995 1996 1997 1998 1999 2000 2001 2002 2003 2004 2005 2006 2007 2008 2009 2010 2011 2012 2013 2014 2015Central JDAndhra PradeshArunachal PradeshAssam AGPBihar JDDehli BJP+JNPGoaGujaratHaryana JDHimachal PradeshJammu & KashmirKarnatakaKerala CPMMadhya PradeshMaharashtraManipurMeghalayaMizoramNagalandOrissaPunjabRajasthanTamil Nadu DMKTripuraUttar Pradesh JDWest Bengal CPM
INC
SAD
INC
INC
INC
JKNINC
INC+HPUINC
INC INC TDPTDPINC
INC
BJP INC BJPTDP
INC INCINC INC INC INC INC
RJD JD JDINC AGP
BJP BJP
INCJD JD
BJP INC INC BJPINC BJP INC BJP
JD BJPINC
BJP BJP BJP BJP
INCBJP INC BJP INCJKPDPJKN INC+PDP JKN
JD INC BJP
BJP BJP INC INC BJPBJP
INCINC CPM INC INC
BJPINC
INC+JD+BJPCPM
INC BJPINC INC BJP BJPBJP
INC SHSMPP MSCP INC
INC
INCINC INC INC
INC UDP INC INC
JD
INCINC INC NPF NPF NPF
MNF MNF INC INC
BJP INC BJP INC BJP
BJD BJD BJD BJDINCINC SAD INC SAD SAD
BJP
CPMADK DMK ADK DMK ADK
CPM CPM CPM CPM
CPM CPM AITCBJP BJP BJP SP BSP
CPM CPMSP

199
Appendix E: Results of the analysis for assessing the industry performance
This appendix presents the results of the analysis conducted in the research to assess the
performance of electricity industry in India. It contains the following tables:
Table E-1: Correlation matrix of selected variables
Table E-2: Akaike information criterion (AIC)
Table E-3: Estimation results of Granger causality models
Table E-4: Impact of industry governance structure (GS) on industry performance (IP)
Table E-5: Impacts of wider influencing factors (WIF) on electricity institutions (EI)
Table E-6: Impacts of WIF on the relationship between EI and IP

200
Table E-1: Correlation matrix of selected variables

201
Table E-2: Akaike information criterion (AIC)
no lag 1 lag 2 lags 3 lags 4 lags 5 lags Electricity Governance Structure (GS) ↔ Industry Performance (IP)
Stru
ctur
e (S
) ED 8.107 4.874 4.886 4.882 4.896 4.913 PD 8.665 5.852 5.840 5.844 5.862 5.881 FoR 9.324 4.787 4.780 4.776 4.778 4.796 NL 9.087 5.112 5.124 5.142 5.154 5.172 PCI 2.810 -0.375 -0.380 -0.377 -0.355 -0.370 PCA 2.093 -1.563 -1.552 -1.533 1.518 -1.507
Priv
atis
atio
n (P
)
ED 5.733 1.863 1.869 1.834 1.855 1.841 PD 6.369 2.854 2.840 2.798 2.810 2.801 FoR 7.022 1.781 1.800 1.762 1.763 1.757 NL 6.581 2.146 2.167 2.129 2.130 2.124 PCI 0.518 -3.348 -3.346 -3.398 -3.379 -3.399 PCA -0.195 -4.569 -4.562 -4.594 -4.582 -4.612
Reg
ulat
ion
(R)
ED 7.870 4.982 4.992 5.013 5.028 5.049 PD 8.461 5.962 5.956 5.965 5.985 6.002 FoR 9.137 4.895 4.914 4.926 4.946 4.956 NL 8.874 5.193 5.201 5.206 5.221 5.210 PCI 2.658 -0.240 -0.259 -0.253 -0.270 -0.267 PCA 1.881 -1.436 -1.415 -1.397 -1.391 -1.379 National Governance Paradigm (NGP) ↔ Electricity Governance Structure (GS)
RI
S -0.123 -9.146 -11.172 -11.155 -11.136 -11.119 P -2.447 -12.091 -14.175 -14.222 -14.198 -14.203 R -0.356 -8.972 -11.076 -11.080 -11.059 -11.040
DB
I
S -0.280 -4.756 -4.784 -4.780 -4.759 -4.754 P -2.704 -7.763 -7.776 -7.818 -7.805 -7.819 R -0.574 -4.654 -4.660 -4.650 -4.629 -4.613
EP
S 2.428 -0.042 -0.324 -0.328 -0.379 -0.498 P 0.303 -2.998 -3.299 -3.387 -3.440 -3.562 R 2.020 -0.019 -0.278 -0.295 -0.342 -0.449
CSR
S 2.750 0.270 0.289 0.309 0.320 0.337 P 0.442 -2.739 -2.724 -2.758 -2.747 -2.754 R 2.562 0.387 0.403 0.408 0.409 0.425

202
Table E-3: Estimation results of Granger causality models
1 lag 2 lags 3 lags 4 lags 5 lags Electricity Governance Structure (GS) ↔ Industry Performance (IP)
Stru
ctur
e (S
)
ED 0.0050 0.9825 0.0173 0.8866 0.0007 0.9397 0.0026 0.8699 0.0035 0.7960 PD 0.0385 0.6780 0.0190 0.4490 0.0083 0.7613 0.0138 0.8169 0.0389 0.9266 FoR 0.2301 0.0712 0.1619 0.0253 0.1380 0.0819 0.2982 0.0698 0.3763 0.0151 NL 0.0000 0.2906 0.0000 0.2724 0.0000 0.4291 0.0000 0.6895 0.0002 0.7529 PCI 0.0000 0.9506 0.0000 0.7122 0.0000 0.8907 0.0000 0.7856 0.0000 0.5862 PCA 0.0704 0.2985 0.1301 0.4915 0.3745 0.7015 0.2785 0.7926 0.2253 0.8819
Priv
atis
atio
n (P
)
ED 0.0038 0.8411 0.0021 0.7066 0.0061 0.8692 0.0278 0.7613 0.0364 0.6222 PD 0.2521 0.4837 0.0985 0.1506 0.1484 0.1599 0.2844 0.3799 0.3630 0.4979 FoR 0.0156 0.1535 0.0080 0.0525 0.0286 0.0693 0.0539 0.1168 0.1054 0.1376 NL 0.0024 0.1105 0.0085 0.2524 0.0090 0.3645 0.0144 0.3896 0.0162 0.4236 PCI 0.0064 0.3415 0.0130 0.4873 0.0396 0.5136 0.0869 0.3361 0.1476 0.1875 PCA 0.2733 0.4996 0.5291 0.6475 0.7886 0.8242 0.8867 0.7924 0.9169 0.7341
Reg
ulat
ion
(R)
ED 0.0514 0.3111 0.0904 0.5541 0.2755 0.6542 0.4262 0.6988 0.5920 0.7427 PD 0.2365 0.0206 0.2365 0.0206 0.2342 0.0781 0.3596 0.1158 0.5658 0.2891 FoR 0.1529 0.5309 0.1529 0.5309 0.0212 0.6576 0.1289 0.7288 0.1893 0.8628 NL 0.0000 0.0359 0.0000 0.0234 0.0000 0.0371 0.0000 0.0227 0.0000 0.0136 PCI 0.0000 0.6200 0.0002 0.5256 0.0006 0.6483 0.0007 0.5833 0.0005 0.3773 PCA 0.0267 0.8191 0.0905 0.9331 0.3036 0.9820 0.2965 0.6820 0.2008 0.4045
National Governance Paradigm (NGP) ↔ Electricity Governance Structure (GS)
RI
S 0.0578 0.1985 0.1387 0.2395 0.2583 0.5375 0.2988 0.6781 0.3680 0.7576 P 0.9985 0.6988 0.7924 0.5321 0.2356 0.1697 0.1569 0.4872 0.0708 0.6277 R 0.0211 0.3781 0.0300 0.4170 0.1697 0.2356 0.1029 0.3369 0.0554 0.4473
DB
I
S 0.0008 0.3985 0.0017 0.5945 0.0029 0.4841 0.0159 0.3369 0.0259 0.2307 P 0.1356 0.9961 0.0607 0.8650 0.0174 0.6146 0.0986 0.7468 0.2681 0.8727 R 0.2684 0.0009 0.3984 0.0029 0.6867 0.1251 0.7358 0.1369 0.8572 0.1634
Notes: The first values indicate the causal relationship from right to left; the second values indicate the causal relationship from left to right.
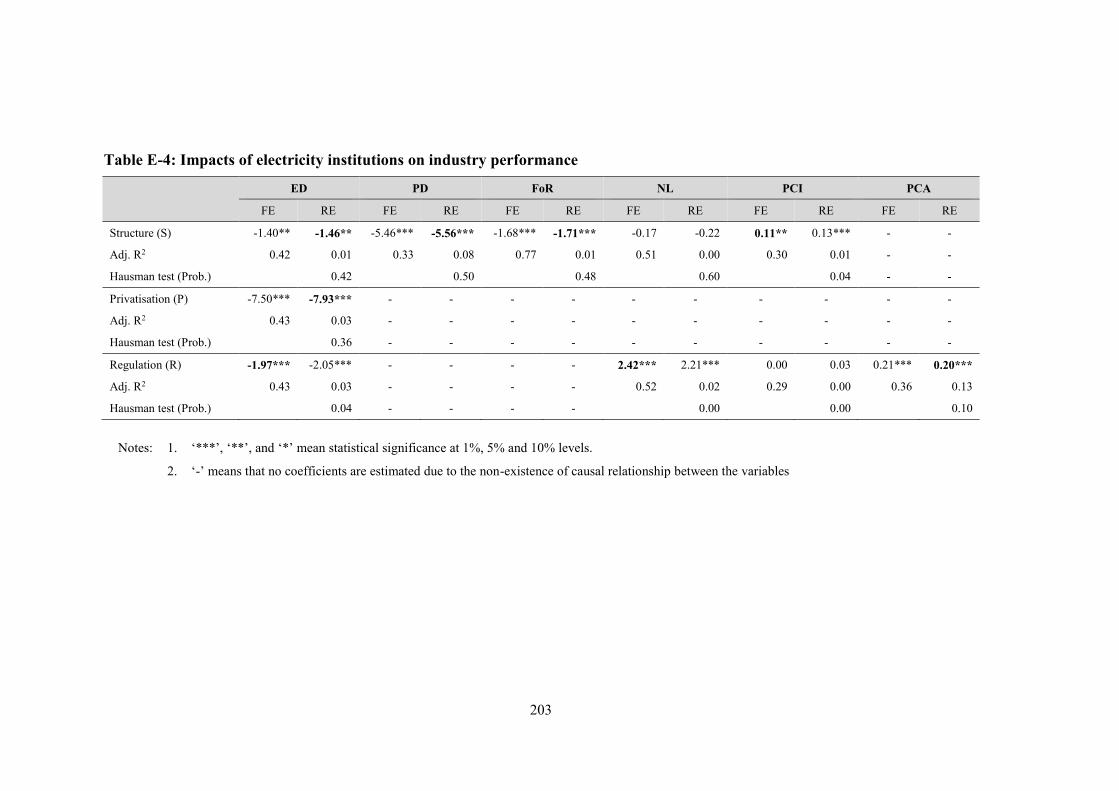
203
Table E-4: Impacts of electricity institutions on industry performance
ED PD FoR NL PCI PCA
FE RE FE RE FE RE FE RE FE RE FE RE
Structure (S) -1.40** -1.46** -5.46*** -5.56*** -1.68*** -1.71*** -0.17 -0.22 0.11** 0.13*** - -
Adj. R2 0.42 0.01 0.33 0.08 0.77 0.01 0.51 0.00 0.30 0.01 - -
Hausman test (Prob.) 0.42 0.50 0.48 0.60 0.04 - -
Privatisation (P) -7.50*** -7.93*** - - - - - - - - - -
Adj. R2 0.43 0.03 - - - - - - - - - -
Hausman test (Prob.) 0.36 - - - - - - - - - -
Regulation (R) -1.97*** -2.05*** - - - - 2.42*** 2.21*** 0.00 0.03 0.21*** 0.20***
Adj. R2 0.43 0.03 - - - - 0.52 0.02 0.29 0.00 0.36 0.13
Hausman test (Prob.) 0.04 - - - - 0.00 0.00 0.10
Notes: 1. ‘***’, ‘**’, and ‘*’ mean statistical significance at 1%, 5% and 10% levels.
2. ‘-’ means that no coefficients are estimated due to the non-existence of causal relationship between the variables

204
Table E-5: Impacts of WIF on EI
Structure
FE RE
DBI 3.11*** 2.90***
Adj. R2 0.47 0.30
Hausman test (Prob.) 0.00
EP -0.62*** -0.62***
Adj. R2 0.52 0.38
Hausman test (Prob.) 1.00
Notes: ‘***’ means statistical significance at 1% level

205
Table E-6: Impacts of WIF on the relationship between EI and IP
ED PD FoR NL PCI PCA
S -23.44*** -12.30*** 16.35*** 2.56*** -0.81*** -0.21***
S×RI 21.16*** 5.67*** -25.47*** -2.71*** 0.88*** 0.15***
S×DBI 13.50*** 6.90*** 5.93*** -2.17*** 0.81*** 0.79***
S×EP - - - - - -
S×CSR 2.79*** -1.20*** -4.96*** 0.56*** -0.25*** -0.25***
P -219.35*** -244.87*** 6.77*** 107.75*** -5.25*** 9.35***
P×RI 195.70*** 209.88*** -22.88*** -105.35*** 5.43*** -7.74***
P×DBI 140.91*** 170.05*** 38.36*** -102.15*** 3.56*** 8.47***
P×EP - - - - - -
P×CSR -16.06*** -41.46*** -2.82*** 44.63*** 1.49*** 3.63***
R -17.08*** -6.07*** -6.81*** -12.93*** -1.18*** -0.66***
R×RI 13.68*** -2.28*** -10.03*** -11.49*** 1.49*** 0.90***
R×DBI 11.67*** -5.12*** -0.27*** -7.90*** 0.19*** 0.44***
R×EP - - - - - -
R×CSR 1.31*** 0.15*** 0.52*** 4.34*** -0.08*** 0.08***
Notes: ‘***’, ‘**’, and ‘*’ mean statistical significance at 1%, 5% and 10% levels.

206
Bibliography
Aghdam, R.F., Sharma, D., Al-Hajji, M. & Ulussever, T. 2013, 'Macroeconomic Impacts
of Contemporary Electricity Reform: 19 OECD and Seven Australian States',
Journal of Energy and Power Engineering, vol. 7, pp. 949-62.
Ahn, S. & Graczyk, D. 2012, Understanding Energy Challenges in India: Policies,
Players and Issues, International Energy Agency, France.
Ambirajan, S. 1978, Classical Political Economy and British Policy in India, Cambridge
University Press.
Ansell, C. & Torfing, J. 2016, 'Introduction', in C. Ansell & J. Torfing (eds), Handbook
on theories of governance, Edward Elgar.
Assadi, M.H. 1997, Peasant Movement in Karnataka 1980-94, Shipra Publications, New
Delhi.
Banerjee, S.G., Barnes, D., Singh, B., Mayer, K. & Samad, H. 2015, Power for All:
Electricity Access Challenge in India, The World Bank, Washington, DC.
Basu, K. 1993, 'Structural Reform in India, 1991-93: Experience and Agenda', Economic
and Political Weekly, vol. 28, no. 48, pp. 2599-605.
Baviskar, A. 2010, 'Social Movements', in N.G. Jayal & P.B. Mehta (eds), The Oxford
Companion to Politics in India, Oxford University Press.
Bell, S. & Hindmoor, A. 2009, Rethinking Governance: The Centrality of the State in
Modern Society, Cambridge University Press.
Bevir, M. 2009, Key Concepts in Governance, SAGE Publications Ltd.
Bevir, M. 2011, 'Governance and Governmentality After Neoliberalism', Policy &
Politics, vol. 39, pp. 457-71.
Bevir, M. 2012, Governance: A Very Short Introduction, Oxford University Press.
Bhattacharyya, R. & Ganguly, A. 2017, 'Cross Subsidy Removal in Electricity Pricing in
India', Energy Policy vol. 100, pp. 181-90.
Bhattacharyya, S.C. 2007, 'Power Sector Reform in South Asia: Why Slow and Limited
So Far?', Energy Policy, vol. 35, pp. 317-32.

207
Bose, R.K., Shukla, M., Srivastava, L. & Yaron, G. 2006, 'Cost of unserved power in
Karnataka, India', Energy Policy, vol. 34, no. 12, pp. 1434-47.
Burroughs, P. 2001, 'Imperial Institutions and the Government of Empire', in A. Porter
(ed.), Oxford History of the British Empire, Oxford University Press, London.
Chatterjee, P. 2010, 'The State', in N.G. Jayal & P.B. Mehta (eds), The Oxford Companion
to Politics in India, Oxford University Press.
Chattopadhyay, P. 2004, 'Corss-subsidy in Electricity Tariffs: Evidence from India',
Energy Policy, vol. 32, pp. 673-84.
Chibber, V. & Usmani, A. 2013, 'The State and the Capitalist Class in India', in A. Kohli
& P. Singh (eds), Routledge Handbook of Indian Politics, Routledge, London and
New York.
Chikkatur, A.P., Sagar, A.D. & Sankar, T.L. 2009, 'Sustainable Development of the
Indian Coal Sector', Energy, vol. 34, pp. 942-53.
Coppedge, M. 2001, 'Political Darwinism in Latin America's Lost Decade', in L. Diamond
& R. Gunther (eds), Political Parties and Democracy, The Johns Hopkins
University Press.
Crozier, M., Huntington, S. & Watanuki, J. 1975, The Crisis of Democracy, Trilateral
Commission.
D'Sa, A., Murthy, K.V.N. & Reddy, A.K.N. 1999, 'India's Power Sector Liberalisation:
An Overview', Economic and Political Weekly, vol. 34, no. 23, pp. 1427-34.
Dahrendorf, R. 1980, 'Effectiveness and Legitimacy: On the 'Governability' of
Democracies', The Political Quarterly, vol. 51, pp. 393-409.
Dixit, A.K. 2008, 'Economic Governance', in S.N. Durlauf & L.E. Blume (eds), The New
Palgrave Dictionary of Economics, Palgrave Macmillan.
Dixit, S., Sant, G. & Wagle, S. 1998, 'WB-Orissa Model of Power Sector Reform: Cure
Worse Than Disease', Economic and Political Weekly, vol. 33, no. 17, pp. 944-9.
Dubash, N.K. & Rajan, S.C. 2001, 'Power Politics: Process of Power Sector Reform in
India', Economic and Political Weekly, vol. 36, no. 35, pp. 3367-87+89-90.

208
Dumont, L. 1970, Homo Hierarchicus: An Essay on the Caste System, University of
Chicago Press, London: Weindenfeld & Nicolson.
Edward, S. 1949, Language: An Introduction to the Study of Speech, Harcourt Brace New
York.
Erdogdu, E. 2011, 'What happened to efficiency in electricity industries after reforms? ',
Energy Policy, vol. 39, no. 10, pp. 6551-60.
Erdogdu, E. 2014, 'Investment, Security of Supply and Sustainability in the Aftermath of
Three Decades of Power Sector Reform', Renewable and Sustainable Energy
Reviews, vol. 31, pp. 1-8.
Fiorio, C.V. & Florio, M. 2013, 'Electricity Prices and Public Ownership: Evidence from
the EU15 over Thirty Years', Energy Economics, vol. 39, pp. 222-32.
Frankel, F. 2005, India's Poilitical Economy, 1947-2004: The Gradual Revolution,
Oxford University Press, New Delhi.
Fukuyama, F. 2011, The Origins of Political Order: From Prehuman Times to the French
Revolution, Farrar, Straus and Giroux.
Fuller, C.J. & Harriss, J. 2000, 'For an Anthropology of the Modern Indian State', in C.J.
Fuller & V. Benei (eds), The Everyday State and Society in Modern India, Social
Science Press, New Delhi.
Ganguly, S. & Mukherji, R. 2011, India Since 1980, Cambridge University Press.
Garg, A., Gaha, V. & Bajaj, J.L. 2008, Regulation in Practice: Impact of Tariff Orders
on the Indian Electricity Sector, TERI: The Energy and Resources Institute.
Ghosh, B.N. 2007, Gandhian Political Economy, ASHGATE.
Gilbert, R.J., Kahn, E.P. & Newbery, D.M. 1996, 'Introduction: International
Comparisons of Electricity Regulation', in R.J. Gilbert & E.P. Kahn (eds),
International Comparisons of Electricity Regulation, Cambridge University Press.
Government of India 2000, Conference of Power Ministers: Agenda Notes, New Delhi.
Government of India 2001, 2001 Census of India: General Note, Ministry of Home
Affairs, Office of the Registrar General & Census Commissioner, India.

209
Government of India 2011, 2011 Census of India: Population by Religious Community,
Ministry of Home Affairs, Office of the Registrar General & Census
Commissioner, India.
Gugler, K., Rammerstorfer, M. & Schmitt, S. 2011, 'The Trade-Off Between Static and
Dynamic Efficiency in Electricity Markets - A Cross Country Study', Research
Institute for Regulatory Economics, WU Vienna University of Economics and
Business, Vienna.
Guha, R. 2010, 'Political Leadership', in N.G. Jayal & P.B. Mehta (eds), The Oxford
Companion to Politics in India, Oxford University Press.
Gujarati, D. 2011, Econometric by Example, Palgrave.
Hardgrave Jr, R.L. 1970, India: Government and Politics in a Developing Nation,
Harcourt, Brace & World, Inc. .
Hardgrave, J.R.L. 1970, Government and Politics in A Developing Nation, Harcourt,
Brace & World, Inc. .
Harvey, D. 2005, Brief History of Neoliberalism, OUP Oxford.
Hattori, T. & Tsutsui, M. 2004, 'Economic Impact of Regulatory Reforms in the
Electricity Supply Industry: A Panel Data Analysis for OECD Countries', Energy
Policy, vol. 32, pp. 823-32.
Henderson, P.D. 1975, India: The Energy Sector, World Bank.
Heritier, A. 2002, 'New modes of governance in Europe: Policy-making without
legislatiing', in A. Heritier (ed.), Common goods: Reinventing European and
international governance, Littlefield & Roman.
Hobson, J.A. 1902, Imperialism: A Study, Cosimo.
Hox, J.J. 1995, Applied Multilevel Analysis, TT-Publikaties, Amsterdam.
Hunt, E.K. 2002, History of Economic Thought, M.E. Sharpe.
Huntington, S. 1968, Political Order in Changing Societies, Yale University Press.
IEA 2016a, 'IEA Electricity Information Statistics'.
IEA 2016b, 'IEA Energy Prices and Taxes Statistics'.

210
Jain, V. 2006, 'Political Economy of the Electricity Subsidy: Evidence from Punjab',
Economic and Political Weekly, vol. 41, no. 38, pp. 4072-80.
Jessop, B. 1998, 'The rise of governance and the risk of failure: The case of economic
development', International Social Science Journal, vol. 50, pp. 29-45.
Jessop, B. 2016, 'State Theory', in C. Ansell & J. Torfing (eds), Handbook on Theories of
Governance, Edward Elgar Publishing Limited.
Joseph, K.L. 2010, 'The Politics of Power: Electricity Reform in India', Energy Policy,
vol. 38, pp. 503-11.
Joskow, P.L. 2006, 'Lessons Learned from Electricity Market Liberalisation', in F.P.
Sioshansi & W. Pfaffenberger (eds), Electricity Market Reform: An International
Perspective, Elsevier.
Kale, S. 2004, 'Current Reforms: The Politics of Policy Change in India's Electricity
Sector', Pacific Affairs, vol. 77, no. 3, pp. 467-91.
Kale, S. 2014a, Electrifying India: Regional Political Economies of Development,
Stanford University Press.
Kale, S. 2014b, 'Structure of Power: Electrification in Colonial India', Comparative
Studies of South Asia, Africa and the Middle East, vol. 34, no. 3, pp. 454-75.
Kannan, K.P. & Pillai, N.V. 2001a, 'Plight of Power Sector in India II: Financial
Performance of SEBs', Economic and Political Weekly, vol. 36, no. 3, pp. 234-46.
Kannan, K.P. & Pillai, N.V. 2001b, 'Plight of Power Sector in India: I: Physical
Performance of SEBs', Economic and Political Weekly, vol. 36, no. 2, pp. 130-9.
Kaviraj, S. 1986, 'Indira Gandhi and Indian Politics', Economic and Political Weekly, vol.
21, pp. 20-7.
Kennedy, L. 2014, The Politics of Economic Restructuring in India: Economic
Governance and State Spatial Rescaling, Routledge, London and New York.
Khurana, M. & Banerjee, S.G. 2015, Beyond Crisis: the Financial Performance of India's
Power Sector, The World Bank, Washington DC.
Kingston, C. & Caballero, G. 2009, 'Comparing Theories of Institutional Change',
Journal of Institutional Economics, vol. 5, pp. 151-80.

211
Kjaer, A.M. 2004, Governance, Polity Press.
Kodwani, D.G. 2009, 'Regulatory Challenges in Electricity Markets in India', in P.S.
Mehta & S.J. Evenett (eds), Politics Triumphs Economics? Political Economy and
the Implementation of Competitive Law and Economic Regulation in Developing
Countries, Academic Foundation, New Delhi.
Kohli, A. 1990, Democracy and Discontent: India's Growing Crisis of Governability,
Cambridge University Press.
Kohli, A. & Singh, P. 2013, 'Introduction: Politics in India - An Overview', in A. Kohli
& P. Singh (eds), Routledge Handbook of Indian Politics, Routledge, London and
New York.
Kooiman, J. 1993, 'Socio-political governance: Introduction', in J. Kooiman (ed.),
Modern governance: New government-society interactions, Sage.
Koop, G. 2000, Analysis of Economic Data, John Wiley & Sons, New York.
Krishna, A. 2010, 'Local Politics', in N.G. Jayal & P.B. Mehta (eds), The Oxford
Companion to Politics in India, Oxford University Press.
Kumar, A. & Chatterjee, S.K. 2012, Electricity Sector in India: Policy and Regulation,
Oxford University Press.
Lal, S. 2005, 'Can Good Economics Ever Be Good Politics? Case Study of the Power
Sector in India', Economic and Political Weekly, vol. 40, no. 7, pp. 649-56.
Levi-Faur, D. 2012, 'From 'Big Government' to 'Big Governance'?', in D. levi-Faur (ed.),
Oxford Handbook of Governance, Oxford University Press.
Levitsky, S. 2008, 'Argentina: Democracy and Institutional Weakness', in J.I. Dominguez
& M. Shifter (eds), Constructing Democratic Governance, The Johns Hopkins
University Press.
Lobel, O. 2012, 'New Governance as Regulatory Governance', in D. levi-Faur (ed.),
Oxford Handbook of Governance, Oxford University Press.
Lynn, L.E.J. 2012, 'The Many Faces of Governance: Adaptation? Transformation?', in D.
levi-Faur (ed.), Oxford Handbook of Governance, Oxford University Press.
212
Lynn, M. 1999, British Policy, Trade, and Informal Empire in the Mid-Nineteenth
Century, Oxford University Press.
Mahalanobis, P.C. 1955, 'The Approach of Operational Research to Planning in India',
Sankhya: The Indian Journal of Statistics vol. 16, pp. 3-130.
Mainwaring, S. 1993, 'Presidentialism, Multipartism, and Democracy: The Difficult
Combination', Comparative Political Studies, vol. 26, pp. 198-228.
Migdal, J.S. 2001, State in Society: Studying How States and Societies Transform and
Constitute One Another, Cambridge Unviersity Press.
Min, B. & Golden, M. 2014, 'Electoral Cycles in Electricity Losses in India', Energy
Policy, vol. 65, pp. 619-25.
Mishra, G. 2014, 'Nehru and Planning in India', Mainstream Weekly, vol. LII, no. 47.
Mitra, S.K. 2011a, 'Politics in India: Structure, Process and Policy', Routledge.
Mitra, S.K. 2011b, 'Politics in India: Structure, Process and Policy', Routledge.
Mitra, S.K. & Pehl, M. 2010, 'Federalism', in N.G. Jayal & P.B. Mehta (eds), The Oxford
Companion to Politics in India, Oxford University Press.
Mukherjee, M. 2014, Private Participation in the Indian Power Sector: Lessons from
Two Decades of Experience, The World Bank, Washington, D.C.
Nagayama, H. 2007, 'Effects of Regulatory Reforms in the Electricity Supply Industry on
Electricity Prices in Developing Countries', Energy Policy, vol. 35, pp. 3440-62.
Nagayama, H. 2010, 'Impacts on Investments, and Transmission/Distribution Loss
Through Sector Reforms', Energy Policy, vol. 38, pp. 3453-67.
Nasr, S.V.R. 1992, 'Democracy and the Crisis of Governability in Pakistan', Asian Survey
vol. 32, pp. 521-37.
Nehru, J. 1946, The Discovery of India, John Day.
Nehru, J. 1961, Discovery of India, Asia Publishing House, Delhi.
North, D.C. 1990, Institutions, Institutional Change and Economic Performance,
Cambridge University Press.

213
North, D.C. & Thomas, R.P. 1973, The Rise of the Western World: An New Economic
History, Cambridge University Press.
O'Brien, R. & Williams, M. 2010, Global Political Economy: Evolution and Dynamics,
Palgrave Macmillan.
Pai, S. 2010, Farmers' Movement, Oxford University Press.
Parekh, B. 1991, 'Nehru and the National Philosophy of India', Economic and Political
Weekly, vol. 26, no. 1/2, pp. 35-48.
Pargal, S. & Banerjee, S.G. 2014, More Power to India: The Challenge of Electricity
Distribution, World Bank, Washington, D.C.
Pargal, S. & Mayer, K. 2014, Governance of Indian State Power Utilities: An Ongoing
Journey, World Bank.
Patnaik, U. 2004, 'A Crisis Rooted in Economic Reform', Frontline, vol. 21, no. 5, pp. 5-
16.
Peters, B.G. 2012, 'Governance as Political Theory', in D. levi-Faur (ed.), Oxford
Handbook of Governance, Oxford University Press.
Pierre, J. 2002, 'Introduction: Understanding Governance', in J. Pieere (ed.), Debating
Governance: Authority, Steering and Democracy, Oxford University Press.
Pierre, J. & Peters, B.G. 2000, Governance, Politics and the State, Macmillan.
Planning Commission 2001, Annual Report (2000-01) on the Working of State Electricity
Boards and Electricity Departments, Power and Energy Division, Planning
Commission, Government of India.
Planning Commission 2006a, Integrated Energy Policy: Report of the Expert Committee,
New Delhi.
Planning Commission 2006b, Report of the Expert Committee on Integrated Energy
Policy, Planning Commission, Government of India, New Delhi.
Planning Commission 2014, Annual report on the Working of State Power Utilities &
Electricity Departments, New Delhi.

214
Pompei, F. 2013, 'Heterogeneous effects of regulation on the efficiency of the electricity
industry across European Union countries', Energy Economics, vol. 40, pp. 569-
85.
Rajan, A.T. 2000, 'Power Sector Reform in Orissa: An Ex-post Analysis of the Causal
Factors', Energy Policy, vol. 28, pp. 657-69.
Ranganthan, V. 2004, 'Electricity Act 2003: Moving to a Competitive Environment',
Economic and Political Weekly, vol. 39, no. 20, pp. 2001-5.
Rao, C.H. 2004, 'Saving Small Farmers', The Hindu, 11 June.
Rao, S. & Lourdusamy, J. 2010, 'Colonialism and the Development of Electricity: The
Case of Madras Presidency', Science, Technology & Society, vol. 15, no. 1, pp.
27-54.
Rao, S.L. 2002, 'The Political Economy of Power', Economic and Political Weekly, vol.
37, no. 33, pp. 3433-44.
Reddy, A.K.N. 2000, 'Paying for Power', The Hindu, June 15.
Reddy, A.K.N. & Sumithra, G. 1997, 'Karnataka's Power Sector - Some Revelations',
Economic and Political Weekly, vol. 32, pp. 585-600.
Reserve Bank of India 2015, Handbook of Statistics on Indian Economy.
Rhodes, R. 1997, Understanding Governance: Policy Networks, Governance, Reflexivity,
and Accountability, Open University Press.
Risse, T. 2012, 'Governance in Areas of Limited Statehood', in D. Levi-Faur (ed.), Oxford
Handbook of Governance, Oxford University Press.
Rosenau, J.N. 1995, 'Governance in the Twenty-First Century', Global Goverance, vol.
1, pp. 13-43.
Roy, T. 2012, India in the World Economy: From Antiquity to the Present, Cambridge
University Press.
Ruet, J. 2005, Privatsing Power Cuts?: Ownership and Reform of State Electricity Boards
in India, Academic Foundation, Ghaziabad, India.
Salamon, L. 2002, The Tools of Government: A Guide to the New Governance, Oxford
University Press.

215
Sankar, T.L. & Ramachandra, U. 2000, 'Regulation of the Indian Power Sector', ASCI
Journal of Management, vol. 29.
Santhakumar, V. 2008, Analysing Social Opposition to Reforms: The Electricity Sector
in India, SAGE.
Santiso, C. 2001, 'Good Governance and Aid Effectiveness: the World Bank and
Conditionality', The Georgetown Public Policy Review, vol. 7, pp. 1-22.
Sauquet, M. & Vielajus, M. 2009, 'Legitimacies, Actors and Territories: Rooting
Governance in the Diversity of Cultures', in S. Bellina, H. Magro & V. de
Villemeur (eds), Democratic Governance: A New Paradigm for Development?,
Hurst & Company, London.
Sellers, J.M. 2011, 'State-Society Relations', in M. Bevir (ed.), The SAGE Handbook of
Governance, SAGE Publications Ltd.
Sen, A. & Jamasb, T. 2013, 'Not Seeing the Wood for the Trees? Electricity Market
Reform in India', in F.P. Sioshansi (ed.), Evolution of Global Electricity Markets:
New Paradigms, New Challenges, New Approaches, Elsevier.
Seth, A. 2007, 'Granger Causality', Scholarpedia, vol. 2, p. 1667.
Sharma, D. 1990, 'Power Project Performance and Planning for Northern India: Issues,
Impacts, Causal Factors', Asian Institute of Technology, Bangkok, Thailand.
Sherlock, S. 1989, 'Railway Workers and Their Unions: Origins of 1974 Indian Railways
Strike', Economic and Political Weekly, vol. 24, no. 1, pp. 2311-5+7-9+21-22.
Shifter, M. 2008, 'Emerging Trends and Determining Factors in Democratic Governance',
in J.I. Dominguez & M. Shifter (eds), Constructing Democratic Governance in
Latin America, The Johns Hopkins University Press.
Shunglu Committee 2011, Report of High Level Panel on Financial Position of
Distribution Utilities, Government of India, New Delhi.
Shylajan, C.S., Sreejesh, S. & Suresh, K.G. 2011, 'Rupee-Dollar Exchange Rate and
Macroeconomic Fundamentals: An Empirical Analysis Using Flexible-Price
Monetary Model', Journal of International Business and Economy, vol. 12, no. 2,
pp. 89-105.

216
Sidanius, J. & Pratto, F. 1999, Social Domiance: An Intergroup Theory of Social
Hierarchy and Oppression, Cambridge University Press.
Sinha, A. 2010, 'Business and Politics', in N.G. Jayal & P.B. Mehta (eds), The Oxford
Companion to Politics in India, Xoford University Press.
Skocpol, T. 1985, 'Bringing the State Back in: Staregies of Analysis in Current Research',
in P.B. Evans, D. Rueschemeyer & T. Skocpol (eds), Bringing the State Back in,
Cambridge University Press, Cambridge.
Speyer, H.R. 1913, 'The Development of Electric Power for Industrial Purposes in India',
Journal of the Institution of Electrical Engineers, vol. 53, no. 246, pp. 597-604.
Sridharan, E. 2010, 'The Party System', in N.G. Jayal & P.B. Mehta (eds), The Oxford
Companion to Politicis in India, Oxford University Press.
Steiner, F. 2001, 'Regulation, Industry Structure and Performance in the Electricity
Supply Industry', OECD Economic Studies, vol. 32, pp. 143-82.
Stokes, E. 1959, The English Utilitarians and India, The Clarendon Press, Oxford.
Tenhunen, S. & Saavala, M. 2012, An Introduction to Changing India: Culture, Politics
and Development, Anthem Press.
Thakker, U. 2011, Gandhian Perspective of Development, Bombay Sarvodaya Mandal &
Gandhi Research Foundation, 2015,
<http://www.mkgandhi.org/articles/gandhian-perspective-of-development.html>.
Thauer, C.R. 2016, 'It's Time for History! Thucydides in International Relations: Toward
a Post- 'Westphalian' Readind of a Pre-'Westphalian' Author', in C.R. Thauer & C.
Wendt (eds), Thucydides and Political Order: Concepts of Order and the History
of the Peloponnesian War, Palgrave Macmillan.
The Indian Electricity Act 1910.
Tongia, R. 2009, 'The Political Economy of Indian Power Sector Reforms', in D.G. Victor
& T.C. Heller (eds), The Political Economy of Power Sector Reform: The
Experience of Five Major Developing Countries, Cambridge University Press.
Torfing, J. 2012, 'Governance networks', in D. Levi-Faur (ed.), The Oxford handbook of
governance, Oxford University Press.

217
UNDP 1997, Governance for Sustainable Human Development, United Nations
Development Programme, New York.
United Nations 2004, The Role of Parliament in Promoting Good Governance.
Varshney, A. 1995, Democracy, Development, and the Countryside: Urban-Rural
Struggles in India, Cambridge University Press.
Venkataraman Committee 1964, Report of the Power Tariff Policy Committee,
Government of India, New Delhi.
Venkataraman, K.I. 1972, Power Development in India: The Financial Aspects, Wiley
Eastern.
Weiner, M. 1962, The Politics of Scarcity: Public Pressure and Political Response in
India, University of Chicago Press, Chicago.
Weinraub, B. 1991, 'Economic Crisis Forcing Once Self-Reliant India to Seek Aid', The
New York Times, June 29.
Williamson, E.O. 1975, Markets and Hierarchies: Analysis and Antitrust Implications,
The Free Press, New York.
Williamson, O.E. 2000, 'The New Institutional Economics: Taking Stock, Looking
Ahead', Journal of Economic Literature, vol. 38, pp. 595-613.
World Bank 1979, India: Economic Issues in the Power Sector, Washington, D.C.
World Bank 1984, Situation and Prospects of the Indian Economy - A Medium Term
Perspective, The World Bank, Washington, D.C.
World Bank 1989, Sub-Saharan Africa: From Crisis to Sustainable Growth, Washington,
D.C.
World Bank 1990, India: Recent Developments and Meidum-Term Issues, Washington,
D.C.
World Bank 1993a, Governance, Washington, DC.
World Bank 1993b, The World Bank's Role in the Electric Power Sector: Policies for
Effective Institutional, Regulatory, and Financial Reform, Washington, D.C.

218
World Bank 1999, Meeting India's Energy Needs (1978-1999): A Country Sector Review,
vol. Report No. 19972, The World Bank.
World Bank 2014, India: Country Profile 2014, The World Bank, Washingtion DC.
World Bank 2016a, Making Politics Work for Development: Harnessing Transparency
and Citizen Engagement, Washington, D.C. .
World Bank 2016b, 'World Bank national account data'.
World Bank 2017, World Development Report: Governance and the Law, Washington,
D.C.
World Economic Forum 2016, The Global Competitiveness Report 2015-2016, Geneva.
Zhang, Y.-F., Parker, D. & Kirkpatrick, C. 2002, Electricity Sector Reform in Developing
Countries: An Econometric Assessment of the Effects of Privatisation,
Competition and Regulation, Aston Business School Research Institute.
Zhang, Y.F., Parker, D. & Kirkpatrick, C. 2008, 'Electricity sector reform in developing
countries: an econometric assessment of the effects of privatisation, competition
and regulation', Journal of regulatory economics, vol. 33, pp. 159-78.