a growth type explanation for persistence in retained...
TRANSCRIPT
A Growth Type Explanation for Persistence in Retained Earnings and
Propensity to Pay Dividends
Xueping Wu and Chau Kin Au Yeung*
This version: August 2010
*Correspondence addresses: (Wu) Department of Economics and Finance, City University of Hong Kong, 83 Tat
Chee Avenue, Kowloon, Hong Kong; Tel: (852) 2788 7577; Fax: (852) 2788 8842; email: [email protected];
(Au Yeung) Department of Economics and Finance, City University of Hong Kong; email: [email protected].
The authors wish to thank Edwin Elton, Cheng Hsiao, Micah Officer, John Wei, Scott Weisbenner, Chaopeng Wu
and seminar/conference participants at the 2009 CICF in Guangzhou (China), the 2009 City University of Hong
Kong International Conference on Corporate Finance and Financial Institutions, and HKPolyU and HKU for helpful
discussions and comments.
1
A Growth Type Explanation for Persistence in Retained Earnings and
Propensity to Pay Dividends
Abstract
We show that while firms that typically pay dividends already have high ratios of retained-
earnings-to-total-equity (RE/TE) and high propensities to pay (PTP) early on, firms that typically
do not pay dividends have persistently low RE/TE and low PTP even after 20 years of growth.
This non-ergodic phenomenon goes beyond a lifecycle explanation. We propose a growth type
view, in which low growth type can accommodate the popular distribution-retention tradeoff
argument in the lifecycle explanation for high RE/TE and PTP, but high growth type is
responsible for persistently low RE/TE and PTP. The growth type view can explain why low
RE/TE and PTP can be surprisingly long-lived, and suggests that typical non-payers deliberately
do not pay dividends even when they can, because doing so may confuse the market.
Key Words: Dividends, Propensity to Pay, Retained Earnings, Growth Type, Persistence
JEL Classification Code: G32, G35

2
1. Introduction
In the literature, dividend determinants such as profitability, sales growth and firm size are often
used to explain firm propensity to pay dividends (e.g., Fama and French, 2001). Recent research
by DeAngelo, DeAngelo and Stulz (2006) finds that the propensity to pay (PTP) is strongly
related to a new variable, retained-earnings-to-total-equity ratio (RE/TE), and provides a
lifecycle explanation in light of the maturity hypothesis from Grullon, Michaely and
Swaminathan (2002).
Lifecycle theory contends that dividend policy is driven by the tradeoff between
distribution and retention of corporate earnings and that this tradeoff depends on firm maturity
stage. The firm maturity stage enters the picture because it is believed that young firms rely more
on new equity (or contributed equity) for early growth while mature firms rely more on self-
financing and are more able to pay dividends because of ample accumulative profits.
Lifecycle theory explicitly explains within-firm variation in PTP. To be consistent with
this theory, the positive relationship between RE/TE and PTP should come largely from within-
firm time variation. However, the finding of Brav, Graham, Harvey and Michaely (2005) that
77% of CFO’s from non-payers indicate that they perhaps will never initiate dividends obviously
falls outside the explaining power of the lifecycle theory. Similarly, this paper shows in a large
sample that while typical dividend payers already pay dividends early on, typical non-payers do
not pay dividends even after 20 years of growth, undermining the concept of maturity stage.
We find that high or low RE/TE ratios and PTP are strongly persistent. We sort
COMPUSTAT US non-utility-and-financial firms for 1963-2006 into quartiles, according to
their initial RE/TE ratios: RE/TE1 (lowest), RE/TE2 (low), RE/TE3 (medium), and RE/TE4
(high). A firm’s initial RE/TE ratio is defined as the average of the firm’s annual RE/TE ratios
3
over the first three years since the start of the firm’s whole sample or hereafter in this paper, IPO
year. At each cross section, we calculate the average RE/TE ratio within each quartile. We plot
the annual average RE/TE ratios of individual initial-RE/TE-sorted quartiles and find a persistent
pattern for the cross-section of RE/TE ratios over event years as well as calendar years. For
example, for 20 event years, the high-RE/TE quartile has annual average RE/TE ratios of around
0.60. At the other extreme, the lowest-RE/TE quartile always has annual average RE/TE ratios
of a negative value (due to aggressive R&D investments which are typically expensed and
funded heavily by new equity, as we will show later). Firms with persistently low and often
negative RE/TE ratios are common. In effect, 42% of firms in our total sample start with
negative initial-RE/TE ratios.
More revealingly, the initial-RE/TE-sorted quartiles also demonstrate a persistent pattern
for the cross-section of PTP. The high-RE/TE quartile always has the highest PTP where some
40% of firms start to pay dividends from IPO and, after natural attrition, some 70% pay after 20
years. In contrast, the lowest-RE/TE quartile usually do not pay dividends, where less than one
percent of firms start to pay from IPO and only about 12% of firms pay after 20 years. The
reluctance to pay is not confined to the lowest quartile. The low-RE/TE peer, RE/TE2, starts
with a PTP of less than 3% and ends up with a PTP of less than 20% after 20 years. In short, a
typical firm from the lower RE/TE quartiles, or about half the sample, is always a nonpayer. For
PTP with 20-year-and-plus survivors, the persistent patterns above become even more
pronounced.
It is true that the strong persistence in high RE/TE and PTP can be consistent with the
lifecycle story if we believe that high RE/TE firms may already become mature at IPO. Yet it is
hard to imagine that a typical young firm that starts with a low and negative RE/TE ratio is still

4
“young” after 20 years of growth and remains reluctant to pay dividends because of lifecycle
reasons. The paucity of dividend payers among an easily identifiable group of well-seasoned
firms over 20 years—an extended period much longer than a typical CEO’s tenure—calls for
rethinking the theory of dividends.
In the literature, disciplining and signaling are two major reasons for dividend payments
in imperfect markets fraught with agency conflicts and asymmetric information (see early
models of Easterbrook, 1984, for disciplining, and Bhattacharya, 1979, and Miller and Rock,
1985, for signaling). Empirical findings largely support the disciplining role of dividends in
mitigating agency problems but casts doubt on the signaling role in mitigating asymmetric
information problems (see Allen and Michaely, 2003, and Kalay and Lemmon, 2008, for
literature reviews). Based on earlier empirical studies (e.g., Fama and Babiak, 1968; Watts,
1973), Miller (1987) noticed that dividends are better described by lagged earnings—smoothing
by themselves—instead of leading uncertain earnings, consistent with Lintner’s (1956)
description of dividend smoothing. The managers recently surveyed in Brav, Graham, Harvey
and Michaely (2005) confirm that dividends are sticky and they do not view dividends as a
costly signaling vehicle.
The tradeoff between retention and distribution of profits that motives the lifecycle theory
of dividends is largely consistent with the disciplining explanation, and is important to firms that
potentially have the agency problems such as Jensen’s (1986) free cash flow problem. In effect,
the maturity hypothesis on the timing of changes in dividends in Grullon, Michaely and
Swaminathan (2002) is supported in a sample of payers with noticeable levels of dividends, or
typical payers.

5
The retention-distribution tradeoff, however, should be unimportant to high growth firms,
which tend to have high valuations and are unlikely to be subject to the free cash flow problem.
One may argue that the asymmetric information problem in Myers and Majluf (1984) encourages
retention because of external financing being more costly than retained earnings. But this classic
retention argument based on the Myers-Maljuf adverse selection logic does not seem to
meaningfully prevent high growth firms from external equity financing (Fama and French, 2002,
2005).
It is important to note that many high growth firms seem able to convince the market even
for a long time that they are good at attracting valuable new investments, despite a lot of
uncertainty about their growth opportunities (Zingales, 2000). The generalized Myers-Majluf
model, developed by Cooney and Kalay (1993) and Wu and Wang (2005), shows that unlike the
asymmetric information about assets-in-place, the asymmetric information about growth
opportunities (which is more relevant to high growth firms) can facilitate new equity issuance,
undermining Myers’ (1984) pecking order in financing. As a result, high growth firms simply do
not need dividend signaling to lower costs of equity financing.
Empirically, high growth firms are likely to be firms with low RE/TE ratios. Since total
equity is the sum of retained earnings (or earned equity) and contributed equity, low RE/TE
ratios simply reflect a lot of contributed equity for high R&D investments, which are expensed
and typically have a slow payoff. It is these vigorous investments in R&D that provide an engine
6
for supporting high growth.1 Thus, the classic retention concern of the RE/TE-based lifecycle
theory is not really important to high growth firms.
We use a growth-type explanation for the persistent patterns for RE/TE and PTP. In view
of the initial determination of leverage suggested by Lemmon, Roberts and Zender (2008), Wu
and Au Yeung (2009) find that initial leverage determinants play a stable role in anchoring long-run
capital structure. To understand this fundamental persistence, they provide a parsimonious explanation
for leverage persistence. More importantly, they show that non-ergodic behavior, as sorted by
initial growth type, is ubiquitous in corporate finance.
Firm growth type is defined based on combinations of initial market-to-book and asset
tangibility, unlike combinations of updated profitability and market-to-book, commonly used, for
example, in Fama and French (2001) and DeAngelo, DeAngelo and Stulz (2006). The firm
growth-type view suggests that firms with similar growth types attract and accommodate similar
types of human capital that is competitively available, underlying persistently distinct investment
styles (of tangible versus R&D or intangible investments); this gives rise to specific market
imperfections or information environments and induces persistently distinct financial policies in
response. The survey results in Brav, Graham, Harvey and Michaely (2005) suggest that
maintaining the dividend level (or persistent financial policy) is a priority on par with
investment decisions, a first-order concern to managers, and hence are consistent with the
growth type view.
1 Mikkelson and Partch (2003) also find that persistently high cash holdings for R&D intensive firms do not suffer
the free cash flow problem and hinder firm performance.

7
Supporting the growth-type view, our initial-RE/TE sorts also demonstrate the growth-
type-related persistence. Low RE/TE firms tend to be high growth type firms, and high RE/TE
firms tend to be low growth type firms, and vice versa. In effect, whereas high RE/TE firms
persistently focus on tangible investments funded by all the three sources roughly equally:
retained earnings, debt and new equity, low RE/TE firms have persistently large R&D or
intangible investments through heavy issues of new equity. Wu and Au Yeung (2009) argue that
the classic adverse selection of Myers and Majluf (1984) is not necessarily in the way of high
growth type firms in raising outside equity, because while the asymmetric information about
assets-in-place tends to inhibit new equity issues, the asymmetric information about growth
opportunities—befitting high-growth-type firms—can facilitate new equity issuance, according
to the prediction by the generalized Myers-Majluf model.
There has been a popular notion that because of the last resort of new equity in Myers’
(1984) pecking order of financing, high growth firms cannot afford to pay dividends (DeAngelo,
DeAngelo and Stulz, 2006). The growth-type view, however, suggests that since high growth
type can facilitate new equity issuance, it is unnecessary for high growth type firms to use
dividends to signal their high growth type. Actually, theory predicts that money burning via
dividends financed by financial slack and new equity is not an efficient signal for separation
(Proposition 4, Daniel and Titman, 1995). Worse, if they paid dividends, they would confuse the
market and invite noisy outside evaluations, putting themselves at risk of being pooled with low
growth type firms that usually pay dividends. Thus, consistent with the growth-type view, the
absence of dividends befits high growth type and does not hinder the investment plans of high

8
growth firms which typically have low RE/TE ratios.2
Largely circumstantial, our main results of persistence in RE/TE and PTP are robust after
controlling for industry medians according to the Fama-French classification of 10 industries. In
addition, we find that cross-sectional effects overwhelm within-firm effects on PTP in Logit
regressions with firm-level panel data. These regression results stand the robustness check by
various sub-periods and by splitting all firms into old and new firms where the latter are listed
after 1978. We also show that the phenomenon of disappearing dividends in Fama and French
(2001) is contributed by the new firms much more than by their old peers in terms of PTP.
The remainder of the paper proceeds as follows. Section 2 describes the sorts on initial
values. Section 3 reports the main results. Section 4 runs Logit regressions with firm-level panel
data to gauge cross-sectional versus within-firm effects on PTP. Section 5 concludes.
2. Description of Initially Sorted Firm Portfolios
In this section, we first describe the data (Section 2.1), and then detail the formation of initial-
RE/TE quartiles and three growth types (Section 2.2). We also provide preliminary evidence to
establish connections between firm growth type and the relationship of RE/TE and PTP.
2.1 The Data
We use a sample of US firms from the COMPUSTAT and CRSP databases for the period from
1963 to 2006. Similar to Fama and French (2001) and DeAngelo, DeAngelo and Stulz (2006),
2 Brown, Fazzari and Petersen (2009) suggest that shifts in the supply of equity finance may have driven much of
the 1990s R&D boom that they find concentrate almost entirely in young high-tech firms and imply that non-
fundamentals may cause the supply shifts. In contrast, our evidence of persistently distinct investment styles and
financing behavior in response across firms comes from a larger sample of almost all industries for about four

9
we process the data as follows. (1) We exclude utilities (SIC 4900 – 4949) and financials (SIC
6000 – 6999). (2) For each firm, we define event year 0 as the year in which COMPUSTAT
reports its market equity value: stock price (Data item: 199) times common shares outstanding
(25). (3) We intersect the COMPUSTAT firms in year t with CRSP (NYSE, AMEX and
NASDAQ) firms that have share codes of 10 and 11 and have market equity data for December
of year t to be in the CRSP sample of that year. (4) We exclude firms that have annual market
equity data for less than three consecutive years. (5) We exclude firms with book equity below
$250,000 or assets below $500,000. (6) We restrict book leverage ratio to be no greater than
unity, and market-to-book ratio to be no greater than 20.
Finally, we trim firm year observations for these variables: retained earnings to total asset
ratio, RE/A, retained earnings to total equity ratio, RE/TE, total equity to total asset ratio, TE/A,
profitability, E/A, sales growth rate, SGR, cash holdings to total asset ratio, Cash/A, tangible
investment expenditure to total asset ratio, Capex/A, R&D to total asset ratio, R&D/A, change in
retained earnings to total asset ratio, RE/A, net debt issue to total asset ratio, Debt/A, and net
equity issue to total asset ratio, Equity/A, by the top and bottom 0.5 percent of each variable,
and we do this simultaneously to avoid excessive trimming. The construction of the variables we
use in this paper is detailed in Appendix A.
2.2 Initial-RE/TE-sorted Quartiles and Three Growth Types
To demonstrate a persistent pattern for the cross section of PTP and understand the reasons
behind this pattern, we start with the formation of initial-RE/TE-sorted quartiles and three initial
decades, and our growth type view takes the stand that appropriate financing behavior in response to specific
investment style is a first-order concern and that financing per se can hardly create desired investment style.
10
firm growth types. For each firm, the initial value is the annual average over the first three years
when firms enter the full sample. Following Lemmon, Roberts, and Zenders (2008) and Wu and
Au Yeung (2009), we take a firm’s first data entry year in COMPUSTAT to be year 0 (or
actually the IPO year for many firms). Then the first three years are year 0, 1 and 2.
Initial-RE/TE Quartiles. We sort into quartiles, according to initial RE/TE ratios, the sample of
US firms for 1963-2006. Thus, we have four portfolios: RE/TE1 (lowest), RE/TE2 (low),
RE/TE3 (medium), and RE/TE4 (high).
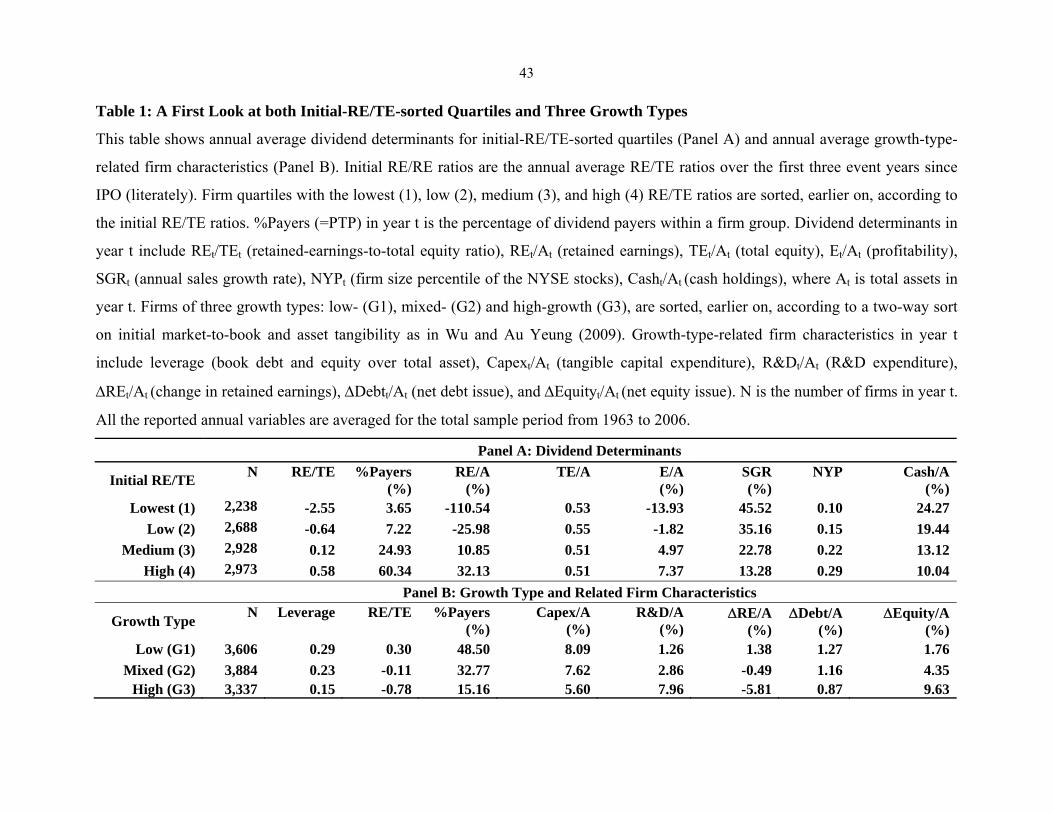
As shown in Panel A of Table 1, these initial-RE/TE sorts clearly span the average cross-
sectional dispersions of important dividend determinants for the whole sample period from 1963
to 2006. First, the average relationship between future RE/TE ratios and PTP for our four initial-
RE/TE-sorted quartiles is clear. Firms from the lowest- to high-RE/TE quartiles have, on average,
annual average RE/TE ratios (in fractional form) from -2.55 to 0.58, and a PTP from 3.65% to
60.34%. Second, these firm quartiles have, on average, annual average retained earnings (RE/A)
from 111% to 32%, profitability (E/A) from 14% to 7%, sales growth rate (SGR) from 46% to
13%, firm size percentile (in fractional form) from 0.10 to 0.29, and cash holdings (Cash/A)
from 24% to 10%, all in a clear order. In other words, on average, low RE/TE firms tend to have
negative earnings but high sales growth and cash holdings; conversely, high RE/TE firms tend to
have positive and high earnings but low sales growth and cash holdings.
The fact that low RE/TE firms tend to have a low PTP and high cash holdings immediately
suggests that they are likely to have high investment opportunities, similar to firms of high
growth type in Wu and Au Yeung (2009) where firm growth type has connotations of persistence.
Wu and Au Yeung (2009) argue that firm growth type gives rise to distinct market
imperfection in terms of asymmetric information and related agency conflicts. The growth type
11
theory suggests that growth type predetermines persistently distinct investment styles, giving rise
to specific market imperfections and hence firm financing behavior in response.
Three firm growth-types. Similar to Wu and Au Yeung (2009), we use a two-way independent
sort on initial market-to-book and asset tangibility of all firms for the total sample period. With
breakpoints at medians, the two-way sort generates four portfolios of firms in terms of initial
value: low market-to-book ratio and high tangibility (LH), low market-to-book ratio and low
tangibility (LL), high market-to-book ratio and high tangibility (HH), and high market-to-book
ratio and low tangibility (HL). We then rearrange the four portfolios into three firm groups. The
lopsided LH firms are low-growth-type firms (G1). The lopsided HL firms are high-growth-type
(G3). The remaining less lopsided LL and HH firms are firms of mixed-growth-type firms (G2).
Wu and Au Yeung (2009) argue that in a world with asymmetric information, firms of low-
growth-type (G1) are most likely to have more asymmetric information about assets-in-place
than about investment opportunities; conversely, firms of high-growth-type (G3) are most likely
to have more asymmetric information about growth opportunities than about assets-in-place—
likely characterizing Zingales’ (2000) New Firm with predominant intangibles including growth
opportunities that are not necessarily firm specific and whose attachment to the firm can be very
uncertain. For the remaining less lopsided LL and HH firms, as it is unclear which type of
asymmetric information predominates, these firms are of mixed-growth-type (G2).
As shown in Panel B of Table 1, there is a clear pattern that low-growth firms (G1) have high
leverage, high-growth firms (G3) have low leverage, and firms of mixed growth (G2) are in the
middle, confirming the growth-type story in Wu and Au Yeung (2009) which parsimoniously
explains leverage persistence documented by Lemmon, Roberts, and Zender (2008).
Interestingly, both RE/TE and PTP also line up well with growth type in the cross section. More

12
precisely, G1 firms have high RE/TE ratios (with an average value of 0.30) and a high PTP (of
48.50%) while G3 firms have low RE/TE ratios (with an average value of -0.78) and a low PTP
(of 15.16%). There is a strong indication that the relationship between RE/TE and PTP is related
to growth type.
The growth-type view in Wu and Au Yeung (2009) contends that firm growth type
predetermines firm investment style and financing behavior. We confirm this in Panel B of Table
1. As we can see, on average, low-growth firms, G1, have large tangible investments scaled by
total assets, Capax/A, at 8.1%, and very small R&D or intangible investments at 1.3%. In
contrast, high-growth firms, G3, have lower tangible investments at 5.6% (compared to 8.1%)
and much higher R&D investments at 8.0% (compared to 1.3%). In other words, while low-
growth firms, G1, tend to focus on tangible investments, high-growth firms, G3, make
aggressive investments in R&D or intangibles. In short, most R&D activities tend to take place
in G3 firms.
As also shown in Panel B of Table 1, the three funding sources for new investments: changes
in retained earnings, RE/A, issues of new debt, Debt/A, and new equity, Equity/A, are, on
average, 1.4%, 1.3% and 1.8% for low-growth firms, G1, compared to -5.8%, 0.9% and 9.6% for
high-growth firms, G3, respectively. Thus, confirming the findings of Wu and Au Yeung (2009),
while low-growth firms, G1, fund their new investments rather evenly from all the three sources,
high-growth firms, G3, have large negative changes in retained earnings which tend to be
balanced mainly by heavy issues of new equity. Wu and Au Yeung (2009) point out that the
large negative changes in retained earnings reflect the expensing or amortizing of the relentless
R&D investments that pay off slowly; firms with high-growth-type are able to make large
intangible investments because of their external financing ability through heavy issues of new
13
equity. Befitting high-growth firms, according to the generalized Myers-Majluf model developed
by Cooney and Kalay (1993) and Wu and Wang (2005), new equity can have much lower costs
than predicted by the classic adverse selection model of Myers and Majluf (1984), defying
Myers’ (1984) pecking order in financing.
In summary, we have clearly seen an average relationship of RE/TE and PTP in the cross
section, and that this strong relationship is related to firm growth type. The link is important
because growth type predetermines persistently distinct firm investment style and financing
behavior, including PTP. If the relationship is persistent over, say, 20 years, firm growth type
will be an alternative explanation to a lifecycle explanation for PTP. For example, if many firms
start with a low, negative RE/TE ratio and pay no dividends, and if these firms remain with a low
RE/TE after 20 years and are still reluctant to pay dividends, a RE/TE-based lifecycle
explanation, if driven by the free cash flow concern, seems misplaced, and if driven by the
retention indication of Myers and Majluf (1984), seems problematic.
3. A Growth Type Explanation for the Persistence in RE/TE and PTP
In this section, we first report the persistent relationship of RE/TE and PTP in the cross section
of the panel data (Section 3.1), check industry-adjusted results for such persistence (Section 3.2),
and explain why this relationship is consistent with a firm growth type view (Section 3.3).
3.1 Persistence in RE/TE and PTP
The literature has already shown a strong relationship between RE/TE and PTP (DeAngelo,
DeAngelo and Stulz, 2006). We emphasize that this relationship arises largely from cross-
sectional variation that indicates non-ergodic corporate behavior. The cross-sectional pattern for
this relationship, as shown in Panel A of Table 1, is an average result for the whole sample

14
period. To study persistence, we need to examine the evolutions of RE/TE and PTP in detail. If
there is indeed strong persistence in RE/TE and PTP, our initial-RE/TE-sorted firms will
demonstrate persistent patterns for future RE/TE and PTP.
Event Year. In Fig. 1, year 0 can be considered as the IPO year, and firms are only sorted
once according to their initial RE/TE ratios. At each cross section, we calculate the annual mean
RE/TE ratios and a PTP for firms within a particular quartile.
In Panel A of Fig. 1, we plot the annual mean RE/TE ratios of individual quartiles over 20
event years after IPO. The RE/TE ratios turn out to be strongly persistent. The high-RE/TE
quartile shows persistently high RE/TE ratios above 0.5, and the medium-RE/TE quartile,
RE/TE3, tends to have persistently lower but still positive RE/TE ratios. The low, RE/TE2, and
lowest quartiles remain mainly in negative territory. The annual mean RE/TE ratios of the low-
RE/TE quartile, starting with a negative value, deteriorate for more than 5 years after IPO and
remain negative all the way up to 20 years. The lowest-RE/TE quartile has indisputably the
lowest RE/TE ratios despite steady improvement over time from the all-time-low of -3.5 just a
couple of years after IPO. Later on, we will show that the deterioration of already negative
RE/TE ratios of low- and lowest-RE/TE firms soon after IPO reflects the continuation of
vigorous R&D investments through heavy issues of new equity; and these intangible investments
cause typically large immediate expenses but seem to pay off explicitly mainly in the long run.
In Panel B of Fig. 1, we plot annual percentage of payers (in fractional form), a measure for
PTP, of initial-RE/TE-sorted quartiles over event years. We immediately see a persistent pattern
for PTP as well. The PTP of the high-RE/TE quartile is always the highest, and the PTP of the
medium-RE/TE quartile is a distant second. This is then followed by the low- and lowest-
quartiles, together, as a distant third and fourth. While the PTP looks improving over time, yet

15
less than 20% of the low-RE/TE firms pay dividends even after 20 years. Likewise, the lowest-
RE/TE firms always have a meager PTP, lower than the PTP of their low-RE/TE peers. It is of
little surprise that firms with higher initial RE/TE ratios are more likely to pay dividends if one
believes that they always face the free cash flow problem because they may already become
mature at IPO. But the fact that the low- and lowest-RE/TE firms always have a very low PTP
over their whole listed life as long as 20 years questions the notion that RE/TE ratio is simply a
proxy for lifecycle stage.
Survivorship of listed firms may confound the patterns in Panel A and B due to attrition in
the total sample over time. In Panel C and D of Fig. 1, we examine the sample of firms that
survive for at least 20 years. We find that the persistent patterns for RE/TE ratios and the
corresponding PTP remain evident. Persistence in PTP is stronger among these survivors. For
one thing, the high-RE/TE quartile start with a PTP of 64% and end up with a PTP of 69%,
where the evolution of PTP over time is much flatter than that in Panel B of Fig. 1. On the other
hand, the low- and lowest-RE/TE quartiles still always have similarly negative RE/TE ratios, and
a PTP of less than 20% even after 20 years. Note that significant improvement over time in
negative RE/TE ratios of the lowest-RE/TE quartile, as also shown in Panel C of Fig. 1, does not
seem to affect PTP drastically. The RE/TE-based lifecycle theory of dividends will find it
difficult to explain this evidence of persistence. The main message here is that the huge
differences in PTP among listed firms are largely determined initially. Note that initially
determined leverage persistence documented by Lemmon, Roberts and Zender (2008) is another
similar phenomenon in corporate finance.
Calendar Year. New firms enter the sample every year. Fama and French (2001) find a
structural break regarding PTP around 1978, followed by a drastic disappearing of dividend

16
payers. DeAngelo, DeAngelo and Stulz (2006) find that these newly listed firms typically have
negative RE/TE ratios. Thus, it is necessary to look at the relationship between RE/TE and PTP
by calendar year. We will see if the persistent patterns survive this structural break.
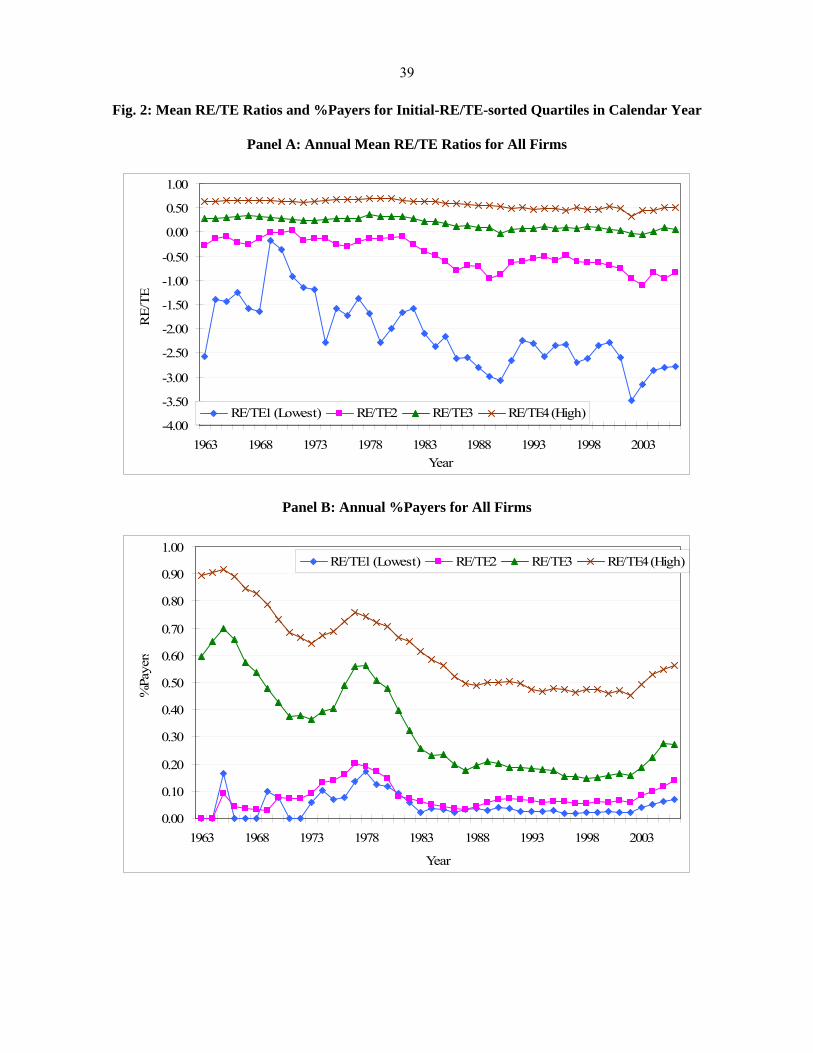
As shown in Panel A and B of Fig. 2, our initial-RE/TE quartiles still show persistent
patterns for the cross-section of RE/TE ratios (Panel A) and PTP (Panel B) by calendar year. In
Panel B of Fig. 2, the percentage of payers in each quartile drastically declines after a temporary
peak in 1978 and tend to level off starting in the late 1980s. Fama and French (2001) call this
long-lasting widespread decline in dividend payers as “disappearing dividends” and attribute this
phenomenon to (1) the inclusion of newly listed firms which are mostly lacking payer
characteristics—changing characteristics, and (2) changing propensity-to-pay, PTP, of firms
even with the same payer characteristics as before. It is the second reason that Fama and French
(2001) find most perplexing.
When we limit the sample to old firms which are listed in or before 1978, we find that the old
firms have the least to do with the dividend disappearing after 1978. It is true that as shown in
Panel C of Fig. 2, the cross sectional patterns for RE/TE ratios after 1978 become unclear for the
old firms due to a much smaller sample size of the old firms in the low- and lowest-RE/TE
quartiles (detailed later in Table 2). Yet, as shown in Panel D of Fig. 2, the post-1978 PTP of the
old firms in all quartiles does not drop drastically, compared to the pattern for all firms in Panel
B of Fig. 2. This suggests that the new firms are the main reason for the dividend disappearing
and that the apparent difference in PTP between the old and new firms may not simply reflect
changing PTP in general. This is consistent with the claim that the aggregate dividends paid have
not declined due to the dividend concentration in old big payers (DeAngelo, DeAngelo, and
Skinner, 2004).

17
Firm propensities to pay do drastically change occasionally, but largely in tandem. As shown
in Panel B of Fig. 2, the notable rises and declines in PTP occur around 1965 and 1978; and
2003 witnesses a recent rise from the long decay in PTP since 1978. Such waves in PTP may
reflect the fact that firms optimally respond to changing regulation and market imperfections.
For example, the Jobs and Growth Tax Relief Reconciliation Act of 2003 is the likely reason for
the recent upward trend of PTP since 2003 (Julio and Ikenberry, 2004; Chetty and Saez, 2005;
Brown, Liang and Weisbenner, 2007). More precisely, this tax reform has at least two
implications on dividend policy in the same direction. First, it lowers the dividend tax to 15% for
most investors, possibly facilitating firms to pay dividends due to the standard tax reason.
Second, in the wake of the breakouts of corporate scandals during 2001-2002, firms that have
high cash holdings and seem to be able to pay dividends have to yield to the market and perhaps
implicitly regulatory pressures for perceived good practices in corporate governance, in which
paying out cash to shareholders is deemed to be shareholder value oriented.
Interestingly, the two implications affect drastically the old firms that mainly belong to the
low- and lowest-RE/TE quartiles, as shown in Panel C of Fig. 2. These old firms which were
already listed by 1978 typically did not pay dividends. We are not sure if this recent change in
PTP is permanent in view of the rises and declines in PTP in history. In particular, if a typical
nonpayer initiates dividends under duress because of the pressure for popularly perceived good
governance practices, its heightened PTP may not be as sustainable as the high PTP for a
traditional payer unless we truly understand why a typical nonpayer does not pay dividends.
Put together, Fig. 1 and 2 have shown strong persistence in PTP, in part because RE/TE
ratios are largely persistent. Despite noted improvement in RE/TE ratios especially for the
lowest-RE/TE firms over time, the fact that the low- and lowest-RE/TE firms, which consist of
18
half of the sample, maintain a meager PTP suggests that firms that start with negative RE/TE
ratios typically continue to ignore the lifecycle indication to initiate dividends even after 20
years of growth. By implication, there must be some long-lasting cross-sectional factor(s) behind
this persistence in PTP.
3.2 Persistence in Industry-adjusted RE/TE and PTP
One may suspect that the persistent patterns for RE/TE and PTP may simply reflect an industry
effect, because individual initial-RE/TE quartiles may exclusively contain a cluster of industries.
But as shown in Panel A of Table 2 for the total sample period of 1963-2006, firms from each
industry, according to the Fama-French classification of 10 industries (excluding utilities in our
sample), do not heavily concentrate in a particular initial-RE/TE quartile. From the lowest- to
high-RE/TE quartile, the distribution of firms of a particular industry, on average, is 16.7, 26.3,
29.5, and 27.5 percent (as shown in the last column). The fact that fewer firms appear in the
lowest-RE/TE quartile (16.7%) than the high-RE/TE quartile (27.5%) for the total period is
mainly due to the situation of the early years of 1963-1978 (Panel B). Singled out in Panel B, the
lowest- and low-RE/TE quartiles contain, on average, only 3.3% and 8.3% of all firms of a
particular industry. We already mentioned this small sample problem when explaining the noisy
part of the cross sectional RE/TE patterns in Panel C of Fig. 2. Industry concentration, however,
seems to become muted for the post-1978 period (Panel C), where the distribution of firms of a
particular industry is, on average, 19.1, 30.0, 32.1, and 18.8 percent.
The results shown in Fig. 3 directly address the concern for an industry effect. As shown
in Fig. 3, where we control for individual industry medians, the persistence patterns are still
evident for industry-adjusted RE/TE (Panel A) and PTP (Panel B) across the initial industry-
adjusted RE/TE quartiles. Note that industry-adjusted RE/TE and PTP (%Payers in fractional

19
form) are defined as RE/TE and PTP minus industry median RE/TE and PTP, respectively; and
initial industry-adjusted RE/TE is initial RE/TE minus initial industry median RE/TE. The
results of Fig. 3 suggest that, controlling for industry medians, a firm with a marginally lower
initial RE/TE will always have a marginally lower future RE/TE ratio and PTP.
It is worth mentioning that the patterns shown in Panel B of Fig. 3, while still preserving
a meaningful cross-sectional persistence for PTP, are a manifestation of disappearing dividends
in Fama and French (2001). They document that all kinds of firms before 1979 were likely to
pay dividends. This means that an industry median or a typical firm’s PTP then is likely to be 1.
Consequently, a payer will have a marginal PTP of 0 (deviated from the industry median PTP)
and a non-payer will have a marginal PTP of -1. This explains why the plots of the industry-
adjusted PTP concentrate between 0 and -1 in those early years, as shown in Panel B of Fig. 3.
As dividends disappearing, more firms become unlikely to pay dividends as Fama and French
(2001) emphasize. This means that an industry median PTP is likely to be 0. A payer will have a
marginal PTP of 1 and a non-payer will have a marginal PTP of 0. This explains why the plots of
the industry-adjusted PTP stay above 0 in the late years. Put together, all this suggests that
despite the structure break around 1978, there must be a persistent cross sectional factor, more
fundamental than simply an industry identity, in determining PTP.
3.3 A Growth Type View through RE/TE on PTP
The persistence in RE/TE ratios and PTP may reflect persistence in firm fundamentals in general.
In this section, we show that the initial-RE/TE quartiles have explicit growth-type characteristics
because RE/TE ratios are outcomes of investment styles and financing behavior.
In Table 3, event years are packed for four periods: 1-5, 6-10, 11-15 and 16-20; and an
annual average (pooled mean) is defined as the average taken over firms within each initial-

20
RE/TE quartile and over event years in each period. As shown in Panel A, from the lowest- to
high-RE/TE quartile (1 to 4), market-to-book ratios always decrease while asset tangibility
always increases, regardless of which period we examine. For example, for the period of event
years 6-10, annual average market-to-book decreases from 2.21 to 1.10 while annual average
tangibility ratio increases from 0.36 to 0.57. The relationships are monotonic and significant
across RE/TE quartiles. Thus, low RE/TE firms always have high market-to-book and low
tangibility; conversely, high RE/TE firms always have low market-to-book and high tangibility.
As such combinations of market-to-book and tangibility parsimoniously characterize firm
growth type as described in Wu and Au Yeung (2009), it is reasonable to say that low RE/TE
firms tend to be high growth type and high RE/TE firms low growth type.
Since RE/TE ratios bear explicit growth-type characteristics, like initial-growth-type-
sorted firm groups in Wu and Au Yeung (2009), the initial-RE/TE-sorted quartiles should predict
persistently distinct firm fundamentals as well. As shown in Panel B of Table 3, from the lowest-
to high-RE/TE quartile (1 to 4), both sales growth rates and cash holdings decrease significantly
in each period. For example, for the period of event years 6-10, the annual average sales growth
rate decreases steadily from 29.68% to 14.80%, and the annual average cash holdings decline
steadily from 21.86% to 9.91%. We already know, from Panel A of Table 1, that low RE/TE
firms have, on average, high sales growth and cash holdings while high RE/TE firms have, on
average, low sales growth and cash holdings. The new findings here suggest that this strong
cross sectional relationship is persistent over 20 years after IPO.
Is the free cash flow problem lurking in high growth firms in view of their high cash
holdings? In a sample of 89 US firms, Mikkelson and Partch (2003) find that persistently high
cash holdings do not hinder firm performance and that firms with high cash holdings actually

21
make vigorous investments in R&D. Our evidence from a large sample here also shows that high
market-to-book (Panel A), high cash holdings (Panel B), and aggressive investments in R&D
(detailed in Panel C next) can persistently go together.
As further shown in Panel C of Table 3, there is also persistently distinct investment style
across the initial-RE/TE quartiles in each period. For example, again for the period of event
years 6-10, from the lowest- to high-RE/TE quartile (1 to 4), annual average capital expenditure,
Capex/A, a measure for tangible investment, increases from 5.89% to 7.03%, and R&D/A, a
measure for intangible investment, decreases from 8.00% to merely 1.79%. While the difference
in tangible investments between the two extreme RE/TE quartiles is always smaller than 2%, the
difference in intangible investments is much larger, for example, at 6.21% (=8.00%-1.79%). The
relentless investments in R&D or intangibles by low RE/TE firms are likely to provide an engine
for persistently high sales growth and help support persistently high market-to-book ratios.
As shown in Panel D of Table 3, both profitability and change in retained earnings
monotonically increase across firms. For example, for the period of event years 6-10, from the
lowest- to high-RE/TE quartile (1 to 4), annual average profitability, E/A, increases from
6.26% to 6.60%, and annual average change in retained earnings, RE/A, increases from
9.23% to 2.34% across initial RE/TE quartiles. Thus, persistently low RE/TE firms tend to have
low, negative earnings and changes in retained earnings whereas high RE/TE firms tend to have
high earnings and changes in retained earnings. This means that the persistently large R&D or
intangible investments by low RE/TE firms, as shown in Panel C of Table 3, must be funded
mainly through external finance (see also Kim and Weisbach, 2008).
As shown in Panel E of Table 3, while new debt issues across firms do not show much
difference, new equity issues decrease noticeably and profoundly. For example, again for the

22
period of event years 6-10, from the lowest- to high-RE/TE quartile (1 to 4), annual average
issues of net debt, Debt/A, change from 1.06% to 0.88%, hardly significant, but annual average
issues of net equity, Equity/A, decrease drastically from 8.13% to merely 0.88% across the
initial-RE/TE quartiles. Thus, while high RE/TE firms raise roughly equal new debt and equity
where annual average issues of net debt are close to the level for low RE/TE firms, it is a
pronounced phenomenon that low RE/TE firms persistently rely on heavy issues of new equity.
Thus, it is the ability of low RE/TE firms to tap into outside equity that supports their
persistently large R&D or intangible investments, compatible with their persistently high market-
to-book ratios. This also explains why low RE/TE firms tend to have persistently high sales
growth and cash holdings. All this goes on despite the typical nonpayer status for low RE/TE
firms.
Recent literature seems to have reached a consensus that dividends do not signal future
earnings (see the survey paper by Allen and Michaely, 2003). Yet most studies have offered little
explanation for that if high growth firms are especially keen to convince capital markets that
they have valuable investment opportunities to finance, why don’t they use dividends as a costly
signal to separate them from firms with fewer investment opportunities? Can dividends-paying
lower the costs of new equity financing which is much needed for their vigorous investments?
Perhaps contrary to the belief of some researchers, high growth firms on average have high cash
holdings that come typically from new equity issues, and hence appear to be able to pay
dividends. In theory, money burning, such as paying dividends, financed by new equity and cash
holdings is not an efficient signal for separation (Daniel and Titman, 1995). Worse, increases in
payouts tend to convey the information that firms have free cash flows (Lie, 2000, Allen and
Michaely, 2003) and a decrease in future firm operating volatility (Lie, 2005). All this suggests
23
that entering the province of dividend paying may invite noisy outside evaluations only to
confuse the market regarding the growth type of high growth firms, because firms with a lot of
growth options should have high future volatility (Cao, Simin and Zhao, 2008). These are
legitimate concerns even to well-seasoned firms of high growth type.
In summary, the initial-RE/TE quartiles line up with persistently distinct investment
styles and financing behavior related to growth type as described in Wu and Au Yeung (2009).
In effect, the initial-RE/TE quartiles have explicit growth-type characteristics. All this indicates
that RE/TE ratios may contain more information about growth type than simply maturity stage in
determining PTP. It is likely an equilibrium result that growth type is persistent and
predetermines persistently distinct firm investment style and financing behavior, including PTP.
As a result, if low RE/TE firms, normally reflecting high growth type, paid dividends, their out-
of-equilibrium move would confuse the market, putting themselves at risk of being pooled with
low growth type firms that are typically dividend payers.
One may argue that the retention indication of Myers and Majluf (1984) can already
explain the reluctance to pay dividends by high growth firms. But the problem is that the same
asymmetric information argument cannot explain why these firms do not seem to raise new
equity under duress (Fama and French, 2002, 2005) and why they enjoy high cash holdings
which do not necessarily come from retention as documented, for example, in this paper. Our
growth type view, based on the generalized Myers-Majluf model, can integrate the lifecycle
argument for high RE/TE firms, because these firms are likely to be firms of low growth type—
many being mature firms—and hence are likely to have the agency conflicts due to free cash
flows and suffer from the asymmetric information problem mainly regarding assets-in-place, all
being the important ingredients to the distribution-retention tradeoff. What is totally new in this
24
paper is that the growth type view can fundamentally address why low RE/TE firms are typically
non-payers regardless of maturity stages of their listed life. The insight is that these firms are
likely to be high growth type firms and hence the absence of dividend paying, befitting their high
growth type, does not hinder their vigorous investment plans through new equity financing.
4. Cross-sectional versus Within-Firm Effects in Panel Data Regression
We have seen strong persistent patterns for RE/TE and PTP in the previous section. More
fundamentally, there is also persistently distinct investment style and financing behavior across
the initial-RE/TE-sorted quartiles. Since Wu and Au Yeung (2009) document a similar pattern
for these firm fundamentals sorted by growth type, we expect RE/TE ratio to contain significant
information about firm growth type, a cross-sectional concept with connotations of persistence.
If persistence prevails, regression results from firm-level panel data in corporate finance
tend to capture mainly variations across firms rather than over time as firms grow from young to
old. Thus, in a regression such as in DeAngelo, DeAngelo and Stulz (2006), if the within-firm
effect by RE/TE on PTP is much smaller over a long period than the cross-sectional effect,
RE/TE ratio cannot be simply a proxy for firm maturity stage which has an explicit implication
of a within-firm effect.
In this section, we use detailed firm-level panel data to gauge a cross-sectional effect,
reflecting a type story, versus a within-firm effect, reflecting a RE/TE-based lifecycle story. As
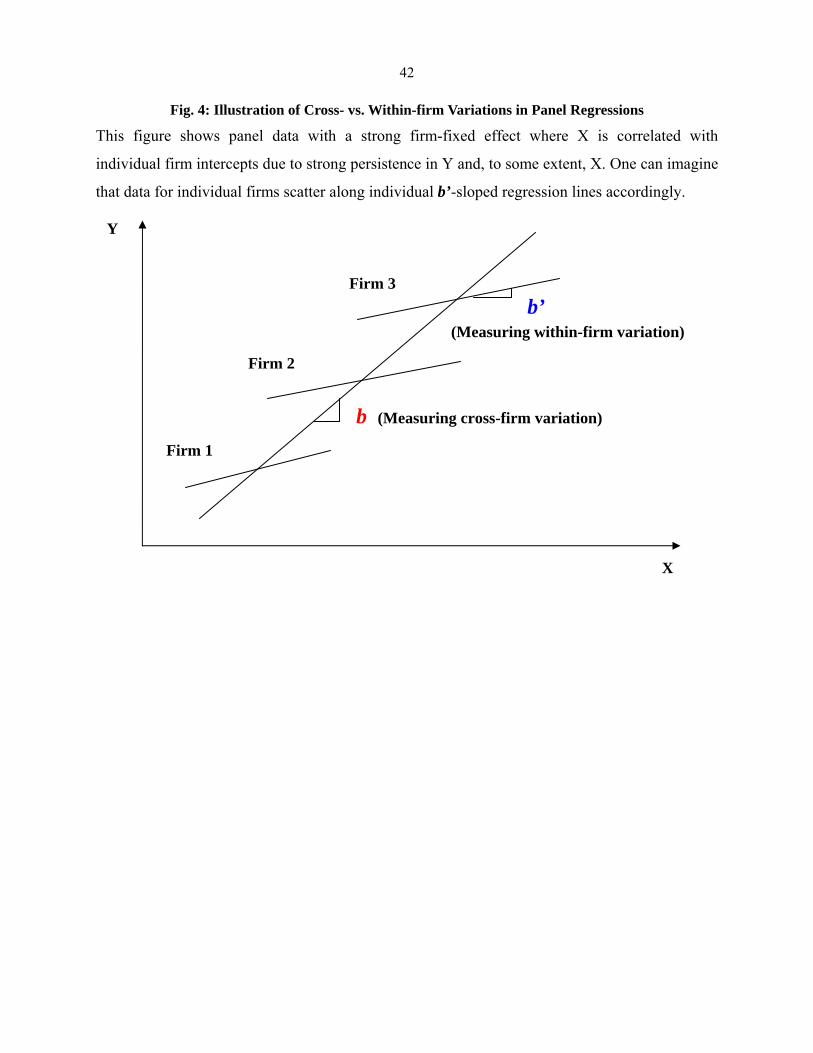
illustrated in Fig. 4, the slope estimate, b, in panel data regressions suggests a cross-sectional
effect of an explanatory variable X (such as RE/TE ratio) on a dependent variable Y (such as
PTP). If there is strong firm-fixed effect in the panel data where X is correlated with individual
intercepts, unless we know reasonably what underpins different individual intercepts, X is still
the best proxy for measuring an explainable cross-firm effect. On the other hand, the slope

25
estimate, b’, simply indicates a within-firm effect.3 If there is strong firm-fixed effect in the
panel data as a result of cross sectional persistence in Y and, to some extent, X, the estimate, b’,
will be notably different from (and in our illustrated case, much smaller than) b, as shown in Fig.
4. In short, both estimates of b and b’ can have economic meanings.4
Following the literature, we run Logit regressions to explain PTP. We use the Fama-
MacBath (FM) method to measure an average cross-sectional effect for a sample period based on
Logit regression estimates. In the Logit regression, the dependent variable, PTP, is the payer
status with payer =1 and non-payer =0 at year t. The key independent variable is annual RE/TE
ratio, a proxy for maturity stage as interpreted by DeAngelo, DeAngelo and Stulz (2006). To see
if RE/TE ratio conveys cross-sectional information beyond that contained by growth type in
terms of the three initially determined firm groups, we take the mixed group type (G2) as the
baseline case in an intercept specification. Thus, the intercept is the level estimate for G2 firms
and the two growth type dummies pick up the marginal effects of low (G1) and high (G3) growth
types, respectively. The list of control variables, as used by DeAngelo, DeAngelo and Stulz
(2006), is (1) total equity to asset ratio, TE/TA, a control for variation in total equity in RE/TE,
(2) earnings, E/A, (defined the same way as return on assets, ROA, used by many), measuring
3 We thank Cheng Hsiao for his suggestion to include this illustration.
4 In panel data for corporate finance research, it is not obvious that the estimate, b, is “biased” given the existence of
unobserved firm heterogeneity. For example, Himmelberg, Hubbard, and Palia (1999) suggest that the unobserved
firm heterogeneity affects insider ownership, making the observed relationship between firm value (Y) and insider
ownership (X) spurious. However, controlling for unobserved firm heterogeneity, which is typically correlated with
X, may not really address the issue, as Zhou (2002) finds that the use of firm fixed effect in Himmelberg, Hubbard,
and Palia (1999) may simply throw away the genuine incentive alignment effect of insider ownership across firms.

26
profitability, (3) sales growth rate, SGR, (4) book asset sizes at the percentiles of all NYSE firms,
NYP, and (5) cash holdings divided by assets, Cash/A.
To estimate the within-firm effects of dividend determinants on PTP, we run a within-
firm demeaned pooled Logit regression (equivalent to a panel regression with firm-fixed effect):
PTP=Logit{1*E(PTP) + ∑ slope*[X-E(X)]}, (1)
where E(PTP) and E(X) are time-series averages of PTP and an X-variable, respectively, for
individual firms. Note that the X variables in regression (1) include RE/TE and the control
variables listed above.
We report and examine the main results regarding the RE/TE effects on PTP in subsection
4.1, the growth type group dummies in subsection 4.2, and effects of other dividend determinants
in subsection 4.3.
4.1. The Effects of RE/TE Ratios on PTP
In Table 4, we report Logit regression estimates for all firms from three periods: the total period
from 1963 to 2006 (Panel A), the early period from 1963 to 1978 (Panel B), and the post-1978
period from 1979 to 2006. We find an overarching pattern for slope estimates for RE/TE ratio:
slope estimates for the RE/TE cross-sectional effects (FM Regression, w/o and w/ Control) are
overwhelmingly larger than slope estimates for the RE/TE within-firm effects (Within-firm
Demeaned Pool).
As a result, all one can say is, as Zhou (2002) points out, that the tiny within-firm effect simply reflects a slow
temporal improvement (time variation) in incentive alignment effect of insider ownership.

27
As shown in Panel A of Table 4, for the total period, the slope estimate for RE/TE ratio
(FM w/ Control) is 2.89, with a t-value of 19.40, indicating a significant cross-sectional effect. In
contrast, the estimate for RE/TE ratio (Within-firm Demeaned Pool) is merely 0.03, though
significant with a t-value of 4.64, suggesting a tiny within-firm effect. The R-square statistics
provide a startling contrast: 0.35 versus 0.01. And the results hold for sub-periods. One can see
the similarly huge contrasts also for the earlier period (Panel B) and the post-1978 period (Panel
C). In short, the effects of RE/TE ratios on PTP in firm-level panel data arise overwhelmingly
from the cross-sectional variation instead of the time-variation.
In Table 5, we further report the results by splitting firms into old firms (listed in or
before 1978) and new firms (listed after 1978). The predominance of the cross-sectional RE/TE
effect remains. Among the old firms for the total period (Panel A), the slope estimates are 2.87
(t-value=18.67) for the cross-sectional RE/TE effect and merely 0.24 (t-value=12.56) for the
within-firm RE/TE effect. Likewise, for the post-1978 period (Panel B), the slope estimates are
2.36 (t-value=14.92) versus 0.14 (t-value=7.27). New firms (Panel C) are qualitatively similar:
the slope estimates are 1.89 (t-value=16.33) for the cross-sectional RE/TE effect but insignificant
for the within-firm RE/TE effect. It seems that the significant within-firm RE/TE effect arises
mainly among the old firms. But it is still tiny, compared to the cross-sectional RE/TE effect, as
indicated convincingly by R-square statistics, for example, with a value of 0.35 versus 0.03 in
Panel A of Table 5.
4.2 Firm Group Dummies for Growth Type
As shown in Panel A of Table 4, growth type dummies, only relevant in FM regressions, are also
significant, regardless of with or without control variables. For example, with controls, the
marginal intercept estimate is 0.59 (t-value=13.80) for G1 and -0.41 (t-value=-7.44) for G3,
28
suggesting that, on average, firms with low growth type (G1) have significantly higher PTP and
firms with high-growth type (G3) have significantly lower PTP than firms with mixed growth
type (G2). Thus, both RE/TE ratio and growth type dummies together are able to capture the
cross-sectional variation significantly.
However, G3 tends to be insignificant for the old firms. The results are consistent in the
total period (Panel A of Table 5), the early period (Panel B of Table 4), and the post-1978 period
(Panel B of Table 5) where the estimate for G3, with controls, is -0.63 (t-value=-1.26), for
example. Since G1 is always significant, the marginal insignificance of G3 may mean that for the
PTP implication, only G2 and G3 are less clearly cut for the old firms than the new firms. We
already know from Panel B of Table 2 that there is a small sample problem in the early years due
to too few firms for the lowest- and low-RE/TE quartiles which are likely to be G3 firms. The
insignificant estimate for G3 here may also mean that RE/TE ratio is likely to contain much
stronger information about firm growth type among the old firms than the new firms. Since our
focus is RE/TE ratio, the good news is that the strong cross-sectional RE/TE effect is robust even
in the presence of the growth type dummies, parsimonious measures for capturing growth type.
4.3 Control Variables
We focus our discussion only on significant control variables. The slope estimates for the well-
known control variables in dividend determination: profitability, E/A, sales growth rate, SGR,
and firm size percentile, NYP, are always significant in the FM regressions, as shown in both
Table 4 and 5. The signs of the slope estimates are consistent with those reported in DeAngelo,
DeAngelo and Stulz (2006) and Fama and French (2001).
What we find new is that, like RE/TE, profitability and sales growth have generally small
within-firm effects on PTP. For example, as shown in Panel A of Table 4, the slope estimate for

29
E/A drops to an insignificant number of 0.09 with the within-firm regression from an estimate of
3.29 with the FM regression; similarly, the slope estimate for SGR drops in magnitude to a small
number of -0.06, though significant at the t-value of -4.70, from an estimate of -1.12.
A reliable within-firm effect consistently comes from firm size. Although smaller than
their cross-sectional effects, the within-firm size effects have the same magnitude regardless of
samples and sample periods. As shown in Table 4, the slope estimates for NYP with within-firm
regressions are 1.62 (Panel A), 1.68 (Panel B), and 1.23 (Panel C); likewise as shown in Table 5,
the estimates are 1.92 (Panel A), 1.36 (Panel B), and 1.10 (Panel), all reliably significant as well.
Thus, firm size, instead of RE/TE, should be a much more important proxy for maturity stage in
a lifecycle explanation for PTP.
Finally, unlike other control variables which are commonly used dividend determinants in
the literature, TE/A is used in DeAngelo, DeAngelo and Stulz (2006) mainly for controlling the
total equity in RE/TE. Consistent with their results, the estimates for TE/A are significant in
many situations in Table 4 and 5.
Taken together, other dividend determinants than RE/TE also capture overwhelmingly
much larger cross-sectional variation than within-firm variation in firm-level panel data
regressions to explain PTP. In FM regressions, these control variables increase the combined
explanatory power, for example, from 0.24 to 0.35 in terms of R-square statistics, as shown in
Panel A of Table 4. In contrast, the R-square statistics in within-firm regressions remain tiny,
with the biggest value of 0.03 as shown in Panel A of Table 5. Consistent with the notion of
sticky dividends, the findings indicate that a type story explains much more variation than a
time-variation-compatible lifecycle story in dividend determination.
5. Conclusion

30
Using a sample of US nonutility-and-nonfinancial firms for 1963-2006, we find that while firms
that typically pay dividends have persistently high RE/TE and PTP, firms that typically do not
pay dividends have persistently low RE/TE and PTP even after 20 years of growth.
We suggest that firm growth type can explain this non-ergodic corporate phenomenon.
Low growth type firms tend to have a lot of tangible assets and face the asymmetric information
about firm valuations that are mainly derived from assets-in-place, whereas high growth type
firms tend to have a lot of intangible assets and face the asymmetric information that mainly
arises from growth opportunities. Recent research has shown that growth type is surprisingly
persistent and suggested growth type compatibility in corporate finance. This growth type
framework argues that firms with similar growth types attract and accommodate similar types of
human capital that is competitively available, underlying persistently distinct investment styles
(of tangible versus R&D or intangible investments); this gives rise to specific market
imperfections or information environments and induces distinct financial policies in response. In
this growth type view, high growth type firms can be surprisingly long-lived.
We find that low RE/TE firms tend to be high growth type firms, and high RE/TE firms
low growth type firms. Consequently, persistently different RE/TE ratios reflect persistently
distinct firm investment styles as well as financing behaviors, again non-ergodic patterns similar
to those based on a growth-type sort. More precisely, high RE/TE firms, like low growth type
ones, always tend to focus on tangible investments which are funded by all the three sources
roughly equally: retained earnings, new debt and equity, and have low sales growth and market-
to-book ratios. In contrast, low RE/TE firms, like high growth type firms, tend to undertake
relentless investments in R&D whenever corporate investments arise. Funded typically by a lot
of new equity, these vigorous R&D activities are likely to provide an engine for high sales
31
growth and help support high market-to-book ratios. All this goes on despite the fact that low
RE/TE firms typically do not pay dividends.
In the literature, the nonpaying behavior of high growth firms has often been viewed as
being consistent with the implication of valuable financial slack in Myers and Majluf (1984); but
the problem is that this retention concern, based on the classic asymmetric information problem,
does not seem to meaningfully prevent high growth firms from raising new equity in the first
place. In effect, these firms can even enjoy high cash holdings through new equity issuance. All
this is not puzzling, however, in the generalized Myers-Majluf framework that explains why an
increase in the asymmetric information about growth opportunities can facilitate new equity
issuance such that high growth firms can enjoy much lower costs of new equity than predicted
by the original adverse selection model. Thus, it is high growth type that underlies the ability of
low RE/TE firms to rely heavily on new equity to finance their vigorous investments in
intangibles. This explains why the absence of dividend paying does not hinder their investment
plans.
The growth type view, based on the generalized Myers-Majluf model, can accommodate
the high PTP persistence in high RE/TE firms as well, because these firms are likely to be low
growth type firms which have (1) the asymmetric information problem mainly regarding assets-
in-place and (2) agency conflicts because of free cash flows, all being the ingredients to the
distribution-retention tradeoff as addressed in the lifecycle explanation. The novelty of the
growth type view, however, lies in its ability to address why low RE/TE firms are typically non-
payers for at least 20 years, an extended period much longer than a typical CEO’s tenure in the
US.

32
It is likely a result of separating equilibrium that high and low growth types and hence
dividend policies are persistent. Costly signaling may work for high RE/TE firms where firm
valuations are based largely on assets-in-place, but dividends cannot signal for low RE/TE firms
where firm valuations are based largely on intangibles including growth opportunities which are
mainly funded by new equity. If low RE/TE firms made an out-of-equilibrium move and paid
dividends, they would confuse the market and invite noisy outside evaluations, putting
themselves at risk of being pooled with low growth type firms that usually pay dividends. This
confusion undermines growth type compatibility in corporate finance. Thus, unlike low growth
type firms as typical payers as well understood in the literature, high growth type firms, which
can be surprisingly long-lived, deliberately do not pay dividends even when they can.

33
References
Allen, Franklin, and Roni Michaely, 2003, Payout policy, in George Constantinides, Milton
Harris, and Rene Stulz, eds.: North-Holland Handbooks of Economics of Finance
(Elsevier, Amsterdam, The Netherlands).
Bhattacharya, Sudipto, 1979, Imperfect information, dividend policy and the “bird in the hand”
fallacy, Bell Journal of Economics 10, 259-270.
Brav, Alon, John R. Graham, Campbell R. Harvey, and Roni Michaely, 2005, Payout policy in
the 21st century, Journal of Financial Economics 77, 483-527.
Brown, James, Steven Fazzari, and Bruce Petersen, 2009, Financing innovation and growth:
Cash flow, external equity, and the 1990s R&D boom, Journal of Finance 64, 151-185.
Brown, Jeffrey R., Nellie Liang, and Scott Weisbenner, 2007, Executive financial incentives and
payout policy: Firm responses to the 2003 dividend tax Cut, Journal of Finance 62,
1935-1965.
Cao, Charles, Tim Simin, and Jing Zhao, 2008, Can growth options explain the trend in
idiosyncratic risk? Review of Financial Studies 21, 2599-2633.
Chetty, Raj, and Emmanuel Saez, 2005, Dividend taxes and corporate behavior: Evidence from
the 2003 dividend tax cut, Quarterly Journal of Economics 120, 791-833.
Cooney, Jr John W., and Avner Kalay, 1993, Positive information from equity issue
announcements, Journal of Financial Economics 33, 149-172.
Daniel, Kent, Titman, Sheridan, 1995, Financing investment under asymmetric information, in:
Jarrow, R. A., W. T. Ziemba, and V. Maksimovic, eds., Finance, Handbooks in Operational
Research and Management Science, Vol. 9, (North-Holland, Amsterdam) 721-766.
DeAngelo, Harry, Linda DeAngelo, and Douglas J. Skinner, 2004, Are dividends disappearing?
Dividend concentration and the consolidation of earnings, Journal of Financial
Economics 72, 425-456.
DeAngelo, Harry, Linda DeAngelo, and Rene M. Stulz, 2006, Dividend policy and the
earned/contributed capital mix: A test of the life-cycle theory, Journal of Financial
Economics 81, 227-254.
Easterbrook, Frank, 1984, Two agency-cost explanations of dividends, American Economic
Review 74, 650-659.

34
Fama, Eugene F., and Harvey Babiak, 1968, Dividend policy of individual firms: an empirical
analysis, Journal of the American Statistical Association 63, 1132-61.
Fama, Eugene F., and Kenneth R. French, 2001, Disappearing dividends: Changing firm
characteristics or lower propensity to pay? Journal of Financial Economics 60, 3-44.
Fama, Eugene F., and Kenneth R. French, 2002, Testing trade-off and pecking order predictions
about dividends and debt, Review of Financial Studies 15, 1-33.
Fama, Eugene F., and Kenneth R. French, 2005, Financing decisions: Who issues stock? Journal
of Financial Economics 76, 549-582.
Grullon, Gustavo, Roni Michaely, and Bhaskaran Swaminathan, 2002, Are dividend changes a
sign of firm maturity, Journal of Business 35, 387-424.
Himmelberg, Charles P. & Hubbard, R. Glenn & Palia, Darius, 1999, Understanding the
determinants of managerial ownership and the link between ownership and performance,
Journal of Financial Economics 53, 353-383.
Jensen, Michael C., 1986, Agency costs of free cash flow, corporate finance, and takeovers, The
American Economic Review 76, 323-329.
John, Kose, and Joseph Williams, 1985, Dividends, dilution and taxes, Journal of Finance 40,
1053-1070.
Julio, Brandon, and David Ikenberry. 2004, Reappearing dividends, Journal of Applied
Corporate Finance 16, 89-100.
Kim, Woojin, and Michael Weisbach, 2008, Motivations for public equity offers: An
international perspective, Journal of Financial Economics 87, 281-307.
Lemmon, Michael, Michael Roberts, and Jaime Zender, 2008, Back to the beginning: Persistence
and the cross-section of corporate capital structure, Journal of Finance 63, 1575-1608.
Lie, Erik, 2000, Excess funds and agency problems: An empirical study of incremental cash
disbursements, Review of Financial Studies 13, 219-248.
Lie, Erik, 2005, Operating performance following dividend decreases and omissions, Journal of
Corporate Finance 12, 27-53.
Lintner, John, 1956, Distribution of incomes of corporations among dividends, retained earnings,
and taxes, American Economic Review 46, 97–113.
Mikkelson, Wayne, and Megan Partch, 2003, Do persistent large cash reserves hinder
performance? Journal of Financial and Quantitative Analysis 38, No. 2, 275-294.

35
Miller, Merton, 1987, The information content of dividends, J. Bossons, R. Dornbush and S.
Fischer. (eds.) Macroeconomics: Essays in Honor of Franco Modigliani (MIT press:
Cambridge MA) 37-61.
Miller, Merton, and Franco Modigliani, 1961, Dividend policy, growth, and the valuation of
shares, Journal of Business 34, 411-433.
Miller, Merton, and Kevin Rock, 1985, Dividend policy under asymmetric information, Journal
of Finance 40 1031-1051.
Myers, Stewart C., 1984, The capital structure puzzle, The Journal of Finance 39, 575-592.
Myers, Stewart C., and Nicholas S. Majluf, 1984, Corporate financing and investment decisions
when firms have information that investors do not have, Journal of Financial Economics 13,
187-221.
Watts, Ross L., 1973, The informational content of dividends, Journal of Business 46, 191-211.
Wu, Xueping, and Chau Kin Au Yeung, 2009, Understanding the fundamental persistence of
corporate capital structure, Working paper, City University of Hong Kong.
Wu, Xueping, and Zheng Wang, 2005, Equity financing in a Myers-Majluf framework with
private benefits of control, Journal of Corporate Finance 11, 915-945.
Zhou, Xianming, 2001, Understanding the determinants of managerial ownership and the link
between ownership and performance: Comment, Journal of Financial Economics 62, 559-571.
Zingales, Luigi, 2000, In search of new foundations, Journal of Finance 55, 1623-1653.

36
Appendix: Definition of Annual Variables
Payer A dividend payer dummy = 1 in year t, if it has positive dividends per share by the ex date (26), equal zero otherwise
Book Equity Shareholder’s Equity (216) [or Common Equity (60) + Preferred Stock Par Value (130) or Assets (6) – Liabilities (181)] – Preferred Stock + Balance Sheet Deferred Taxes and Investment Tax Credit (35) if available – Post Retirement Asset (330) if available.
Market Equity Stock Price (199) * Common Shares Outstanding (25) RE/TE Retained Earnings (36) / Book Equity, in year t RE/A Retained Earnings (36) / Asset (6), in year t TE/A Book Equity / Asset (6), in year t E/A Earnings Before Extraordinary Items (18) + Interest Expense (15) +
Income Statement Deferred Taxes (50) if available / Asset (6), in year t SGR Salest (12) – Salest-1 / Salest-1 Firm size, NYP The percentile of NYSE firms for the same or lower market capitalization,
in year t Cash/A Cash (1) / Asset (6), in year t Capex/A Capital Expenditure (128) / Asset (6), in year t R&D/A R&D (46) / Asset (6) (Note that missing values are replaced by zero), in
year t RE/A Changed in Retained Earnings (36) from year t-1 to year t / Asset (6) in
year t Debt/A Net Debt Issue (111 – 114) / Asset (6), in year t Equity/A Net Equity Issue (108 – 115) / Asset (6), in year t Leverage [Short-term Debt (34) + Long-term Debt (9)] / Asset (6), in year t Market-to-Book [Market Equity + Total Debt + Preferred Stock (10) – Deferred Tax (35)]
/ Asset (6), in year t Asset Tangibility [Inventory (3) + Property, Plant and Equipment (8)] / Asset (6), in year t

37
Fig. 1: Mean RE/TE Ratios and %Payers for Initial-RE/TE-sorted Quartiles in Event Year
Panel A: Annual Mean RE/TE Ratios for All Firms
-4.00
-3.50
-3.00
-2.50
-2.00
-1.50
-1.00
-0.50
0.00
0.50
1.00
0 1 2 3 4 5 6 7 8 9 10 11 12 13 14 15 16 17 18 19 20
Event Year
RE
/TE
RE/TE1 (Lowest) RE/TE2 RE/TE3 RE/TE4 (High)
Panel B: Annual %Payers for All Firms
0.00
0.10
0.20
0.30
0.40
0.50
0.60
0.70
0.80
0 1 2 3 4 5 6 7 8 9 10 11 12 13 14 15 16 17 18 19 20
Event Year
%Pa
yers
RE/TE1 (Lowest) RE/TE2 RE/TE3 RE/TE4 (High)

38
Panel C: Annual Mean RE/TE Ratios for 20+Years Survivors
-4.00
-3.50
-3.00
-2.50
-2.00
-1.50
-1.00
-0.50
0.00
0.50
1.00
0 1 2 3 4 5 6 7 8 9 10 11 12 13 14 15 16 17 18 19 20
Event Year
RE
/TE
RE/TE1 (Lowest) RE/TE2 RE/TE3 RE/TE4 (High)
Panel D: Annual %Payers for 20+Years Survivors
0.00
0.10
0.20
0.30
0.40
0.50
0.60
0.70
0.80
0 1 2 3 4 5 6 7 8 9 10 11 12 13 14 15 16 17 18 19 20
Event Year
%Pa
yers
RE/TE1 (Lowest) RE/TE2 RE/TE3 RE/TE4 (High)
39
Fig. 2: Mean RE/TE Ratios and %Payers for Initial-RE/TE-sorted Quartiles in Calendar Year
Panel A: Annual Mean RE/TE Ratios for All Firms
-4.00
-3.50
-3.00
-2.50
-2.00
-1.50
-1.00
-0.50
0.00
0.50
1.00
1963 1968 1973 1978 1983 1988 1993 1998 2003
Year
RE
/TE
RE/TE1 (Lowest) RE/TE2 RE/TE3 RE/TE4 (High)
Panel B: Annual %Payers for All Firms
0.00
0.10
0.20
0.30
0.40
0.50
0.60
0.70
0.80
0.90
1.00
1963 1968 1973 1978 1983 1988 1993 1998 2003
Year
%Pa
yers
RE/TE1 (Lowest) RE/TE2 RE/TE3 RE/TE4 (High)

40
Panel C: Annual Mean RE/TE Ratios for Firms Already Listed by 1978 (Old Firms)
-3.00
-2.50
-2.00
-1.50
-1.00
-0.50
0.00
0.50
1.00
1963 1968 1973 1978 1983 1988 1993 1998 2003
Year
RE
/TE
RE/TE1 (Lowest) RE/TE2 RE/TE3 RE/TE4 (High)
Panel D: Annual %Payers for Firms Already Listed by 1978 (Old Firms)
0.00
0.10
0.20
0.30
0.40
0.50
0.60
0.70
0.80
0.90
1.00
1963 1968 1973 1978 1983 1988 1993 1998 2003
Year
%Pa
yers
RE/TE1 (Lowest) RE/TE2 RE/TE3 RE/TE4 (High)

41
Fig. 3: Annual Average RE/TE Ratios and %Payers Adjusted for Industry Medians
For each firm, we subtract the variable in question by the firm’s industry median according to the Fama-French classification of 10 industries. We form firm quartiles the same way as in Figure 1 and 2 except that initial-RE/TE ratios are adjusted for initial industry medians accordingly. The full sample is used.
Panel A: Annual Average RE/TE Ratios Adjusted for Industry Median
Panel B: %Payers Adjusted for Industry Median
42
Fig. 4: Illustration of Cross- vs. Within-firm Variations in Panel Regressions
This figure shows panel data with a strong firm-fixed effect where X is correlated with
individual firm intercepts due to strong persistence in Y and, to some extent, X. One can imagine
that data for individual firms scatter along individual b’-sloped regression lines accordingly.
Y
X
b (Measuring cross-firm variation)
Firm 3
Firm 2
Firm 1
(Measuring within-firm variation)
b’
43
Table 1: A First Look at both Initial-RE/TE-sorted Quartiles and Three Growth Types
This table shows annual average dividend determinants for initial-RE/TE-sorted quartiles (Panel A) and annual average growth-type-
related firm characteristics (Panel B). Initial RE/RE ratios are the annual average RE/TE ratios over the first three event years since
IPO (literately). Firm quartiles with the lowest (1), low (2), medium (3), and high (4) RE/TE ratios are sorted, earlier on, according to
the initial RE/TE ratios. %Payers (=PTP) in year t is the percentage of dividend payers within a firm group. Dividend determinants in
year t include REt/TEt (retained-earnings-to-total equity ratio), REt/At (retained earnings), TEt/At (total equity), Et/At (profitability),
SGRt (annual sales growth rate), NYPt (firm size percentile of the NYSE stocks), Casht/At (cash holdings), where At is total assets in
year t. Firms of three growth types: low- (G1), mixed- (G2) and high-growth (G3), are sorted, earlier on, according to a two-way sort
on initial market-to-book and asset tangibility as in Wu and Au Yeung (2009). Growth-type-related firm characteristics in year t
include leverage (book debt and equity over total asset), Capext/At (tangible capital expenditure), R&Dt/At (R&D expenditure),
REt/At (change in retained earnings), Debtt/At (net debt issue), and Equityt/At (net equity issue). N is the number of firms in year t.
All the reported annual variables are averaged for the total sample period from 1963 to 2006.
Panel A: Dividend Determinants
Initial RE/TE N RE/TE %Payers
(%)RE/A
(%)TE/A E/A
(%)SGR(%)
NYP Cash/A(%)
Lowest (1) 2,238 -2.55 3.65 -110.54 0.53 -13.93 45.52 0.10 24.27
Low (2) 2,688 -0.64 7.22 -25.98 0.55 -1.82 35.16 0.15 19.44
Medium (3) 2,928 0.12 24.93 10.85 0.51 4.97 22.78 0.22 13.12
High (4) 2,973 0.58 60.34 32.13 0.51 7.37 13.28 0.29 10.04
Panel B: Growth Type and Related Firm Characteristics
Growth Type N Leverage RE/TE %Payers
(%)Capex/A
(%)R&D/A
(%)RE/A
(%)Debt/A
(%)Equity/A
(%)Low (G1) 3,606 0.29 0.30 48.50 8.09 1.26 1.38 1.27 1.76
Mixed (G2) 3,884 0.23 -0.11 32.77 7.62 2.86 -0.49 1.16 4.35High (G3) 3,337 0.15 -0.78 15.16 5.60 7.96 -5.81 0.87 9.63

44
Table 2: The Number of Firms and Distribution of Industries across Initial-RE/TE-sorted Quartiles
This table reports the number of firms in year 0 of each industry across the initial-RE/TE-sorted quartiles, shown in each column except the last
column of each panel where the percentages indicate an average distribution of industries. Year 0 means either the IPO year or the first data entry
year of the sample in each panel. The 9 industries we use are the Fama-French 10 industries excluding utilities. Initial RE/RE ratios are the annual
average RE/TE ratios over the first three event years since year 0 from the total sample. Firm quartiles with the lowest (1), low (2), medium (3),
and high (4) RE/TE ratios are sorted once, earlier on, according to the initial RE/TE ratios. Panel A shows the results of the total period of 1963-
2006; Panel B and C show the split sample period results for 1963-1978 and 1979-2006, respectively.
Initial-RE/TE Industry
NoDur Durbl Manuf Enrgy HiTec Telcm Shops Hlth Others 100%
Panel A: 1963-2006 (Total Period)
Lowest (1) 43 15 98 33 331 70 106 151 133 16.7%
Low (2) 75 33 165 63 456 93 209 200 233 26.3%
Medium (3) 131 65 272 70 512 20 344 149 349 29.5%
High (4) 198 86 396 57 262 16 271 76 232 27.5%
Panel B: 1963-1978 (Early Period)
Lowest (1) 1 2 4 3 7 1 4 0 5 3.3%
Low (2) 7 4 11 7 13 1 5 7 10 8.3%
Medium (3) 20 5 55 17 34 6 19 9 34 22.2%
High (4) 108 44 212 29 62 9 116 24 81 66.2%
Panel C: 1979-2006 (Post-1978 Period)
Lowest (1) 42 13 94 30 324 69 102 151 128 19.1%
Low (2) 68 29 154 56 443 92 204 193 223 30.0%
Medium (3) 111 60 217 53 478 14 325 140 315 32.1%
High (4) 90 42 184 28 200 7 155 52 151 18.8%
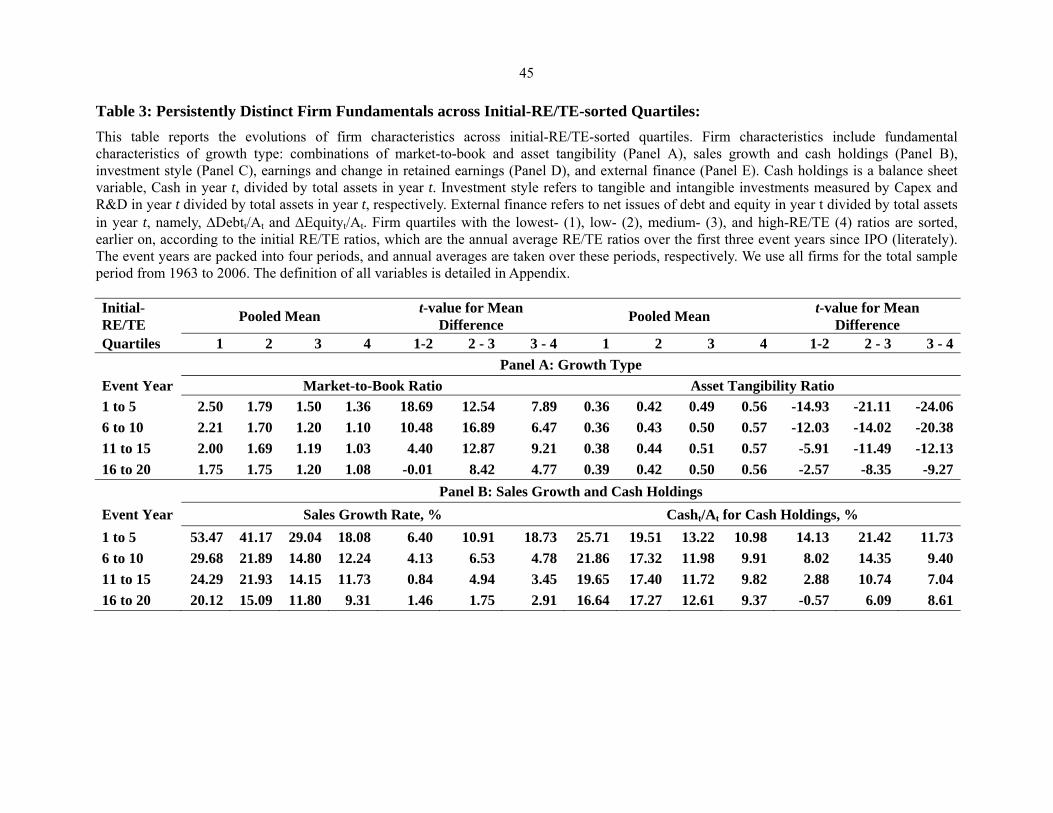
45
Table 3: Persistently Distinct Firm Fundamentals across Initial-RE/TE-sorted Quartiles:
This table reports the evolutions of firm characteristics across initial-RE/TE-sorted quartiles. Firm characteristics include fundamental characteristics of growth type: combinations of market-to-book and asset tangibility (Panel A), sales growth and cash holdings (Panel B), investment style (Panel C), earnings and change in retained earnings (Panel D), and external finance (Panel E). Cash holdings is a balance sheet variable, Cash in year t, divided by total assets in year t. Investment style refers to tangible and intangible investments measured by Capex and R&D in year t divided by total assets in year t, respectively. External finance refers to net issues of debt and equity in year t divided by total assets in year t, namely, Debtt/At and Equityt/At. Firm quartiles with the lowest- (1), low- (2), medium- (3), and high-RE/TE (4) ratios are sorted, earlier on, according to the initial RE/TE ratios, which are the annual average RE/TE ratios over the first three event years since IPO (literately). The event years are packed into four periods, and annual averages are taken over these periods, respectively. We use all firms for the total sample period from 1963 to 2006. The definition of all variables is detailed in Appendix. Initial- RE/TE
Pooled Mean t-value for Mean
Difference Pooled Mean
t-value for Mean Difference
Quartiles 1 2 3 4 1-2 2 - 3 3 - 4 1 2 3 4 1-2 2 - 3 3 - 4
Panel A: Growth Type
Event Year Market-to-Book Ratio Asset Tangibility Ratio
1 to 5 2.50 1.79 1.50 1.36 18.69 12.54 7.89 0.36 0.42 0.49 0.56 -14.93 -21.11 -24.06
6 to 10 2.21 1.70 1.20 1.10 10.48 16.89 6.47 0.36 0.43 0.50 0.57 -12.03 -14.02 -20.38
11 to 15 2.00 1.69 1.19 1.03 4.40 12.87 9.21 0.38 0.44 0.51 0.57 -5.91 -11.49 -12.13
16 to 20 1.75 1.75 1.20 1.08 -0.01 8.42 4.77 0.39 0.42 0.50 0.56 -2.57 -8.35 -9.27
Panel B: Sales Growth and Cash Holdings
Event Year Sales Growth Rate, % Casht/At for Cash Holdings, %
1 to 5 53.47 41.17 29.04 18.08 6.40 10.91 18.73 25.71 19.51 13.22 10.98 14.13 21.42 11.73
6 to 10 29.68 21.89 14.80 12.24 4.13 6.53 4.78 21.86 17.32 11.98 9.91 8.02 14.35 9.40
11 to 15 24.29 21.93 14.15 11.73 0.84 4.94 3.45 19.65 17.40 11.72 9.82 2.88 10.74 7.04
16 to 20 20.12 15.09 11.80 9.31 1.46 1.75 2.91 16.64 17.27 12.61 9.37 -0.57 6.09 8.61

46
Table 3 Cont’d Initial- RE/TE
Pooled Mean t-value for Mean
Difference Pooled Mean
t-value for Mean Difference
Quartiles 1 2 3 4 1-2 2 - 3 3 - 4 1 2 3 4 1-2 2 - 3 3 - 4
Panel C: Investment Style
Event Year Capext/At for Tangible Investment, % R&Dt/At for Intangible Investment, %
1 to 5 6.63 8.03 8.55 8.34 -9.62 -4.17 2.00 9.91 5.24 2.80 1.58 21.98 21.62 18.75
6 to 10 5.89 6.87 6.93 7.03 -5.21 -0.41 -0.89 8.00 5.32 3.01 1.79 10.35 14.69 14.53
11 to 15 5.69 6.67 7.04 6.89 -3.73 -1.81 1.17 7.27 5.16 3.21 1.79 5.65 8.59 13.02
16 to 20 5.55 5.81 6.78 6.95 -0.66 -3.47 -1.04 5.66 5.51 3.34 1.85 0.30 6.47 10.26
Panel D: Earnings and Change in Retained Earnings
Event Year Et/At for Profitability, % REt/At for Change in Retained Earnings, %
1 to 5 -21.18 -4.32 5.22 8.57 -35.96 -42.72 -27.98 -24.28 -7.11 2.09 4.65 -35.77 -39.90 -20.366 to 10 -6.26 -0.66 3.47 6.60 -10.35 -12.99 -17.51 -9.23 -3.58 -0.07 2.34 -9.83 -10.48 -12.9311 to 15 -3.58 2.17 4.52 7.00 -8.25 -6.16 -11.53 -6.40 -0.71 0.86 2.45 -7.81 -3.94 -7.0816 to 20 -0.93 1.12 4.89 6.90 -2.01 -6.06 -7.39 -3.95 -2.15 0.95 2.05 -1.67 -4.62 -3.91 Panel E: External Financing
Event Year Debtt/At for New Debt Issue, % Equityt/At for New Equity Issue, %
1 to 5 1.27 2.13 2.62 2.05 -4.58 -3.18 4.22 13.43 5.98 3.20 1.18 19.16 14.20 17.286 to 10 1.06 1.27 0.88 0.88 -0.81 2.03 0.03 8.13 3.81 1.44 0.51 9.80 10.72 8.8211 to 15 1.29 1.06 1.20 0.75 0.62 -0.55 2.74 5.53 2.61 1.14 0.35 5.27 5.16 6.0816 to 20 0.38 0.80 0.51 0.68 -0.74 0.78 -0.79 3.15 1.88 0.63 0.53 1.97 3.24 0.61

47
Table 4: Estimates for Cross-sectional and Within-firm Effects on PTP: All Firms
We run a Logit model using the Fama-Macbeth (FM) method to estimate the cross sectional effects of dividend determinants on propensity to pay (PTP=1 if payer or 0 if non-payer), and the within-firm demeaned pooled Logit regression: PTP=Logit{1*E(PTP)+∑slope*[X-E(X)]}, to estimate within-firm effects of dividend determinants on PTP. G1 (low) and G3 (high) are growth type group dummies. N is the annual average number of firms for the FM regressions, or firm-year observations for pooled regressions. Other variables are defined in Table 1. t-values are in parentheses.
Intercept G1 G3 RE/TE TE/A E/A SGR NYP Cash/A N R2
Panel A: 1963 - 2006 (Total Period)
FM w/o -2.08 0.40 -0.36 3.68
(-29.69) (12.33) (-6.17) (21.03) 2,129 0.26
FM w/ Control -3.03 0.59 -0.41 2.89 0.70 3.29 -1.12 3.52 -0.59
(-19.38) (13.80) (-7.44) (19.40) (3.48) (4.65) (-11.93) (30.28) (-3.35) 2,129 0.35
Within-firm 0.03 0.61 0.09 -0.06 1.62 -0.13
Demeaned Pool (4.64) (9.25) (1.24) (-4.70) (22.76) (-1.66) 95,786 0.01
Panel B: 1963 - 1978 (Early Period)
FM w/o -1.86 0.34 -0.02 4.79
(-14.20) (4.82) (-0.26) (29.11) 1,170 0.23
FM w/ Control -3.91 0.77 -0.23 3.80 1.98 5.88 -0.74 3.66 0.36
(-14.90) (10.01) (-1.84) (26.04) (8.83) (3.36) (-6.25) (30.88) (1.15) 1,170 0.33
Within-firm 0.34 0.22 1.81 -0.17 1.68 0.31
Demeaned Pool (6.40) (1.00) (4.31) (-3.26) (8.13) (0.95) 18,726 0.01
Panel C: 1979 - 2006 (Post-1978 Period)
FM w/o -2.20 0.42 -0.54 3.06
(-29.95) (13.98) (-11.34) (18.08) 2,657 0.28
FM w/ Control -2.54 0.50 -0.51 2.39 0.00 1.87 -1.33 3.44 -1.12
(-20.46) (11.73) (-12.08) (15.84) (-0.00) (5.54) (-11.73) (20.50) (-8.15) 2,657 0.35
Within-firm 0.02 0.50 0.03 -0.05 1.23 -0.18
Demeaned Pool (2.74) (6.85) (0.36) (-3.30) (14.52) (-2.25) 77,060 0.00

48
Table 5: Estimates for Cross-sectional and Within-firm Effects on PTP: Old versus New Firms (Listed after 1978) We run a Logit model using the Fama-Macbeth (FM) method to estimate the cross-sectional effects of dividend determinants on PTP (=1 if payer or 0 if non-payer), and the within-firm-demeaned pooled Logit regression: PTP=Logit{ 1*E(PTP) + ∑slope*[X-E(X)]}, to estimate within-firm effects of dividend determinants on PTP. G1 (low) and G3 (high) are growth type group dummies. N is the annual average number of firms for the FM regressions, or the number of firm-year observations for pooled regressions. The variables are defined in Table 1. t-values are in parentheses.
Intercept G1 G3 RE/TE TE/A E/A SGR NYP Cash/A N R2
Panel A: Old Firms for 1963 - 2006 (Total Period)
FM w/o -1.41 0.24 -0.35 3.48
(-15.65) (6.41) (-1.19) (18.44) 949 0.24
FM w/ Control -2.84 0.50 -0.49 2.87 0.91 4.58 -0.84 3.45 -0.31
(-17.31) (10.93) (-1.50) (18.67) (4.19) (5.77) (-6.42) (39.21) (-1.33) 949 0.35
Within-firm 0.24 0.92 1.19 -0.11 1.92 0.12
Demeaned Pool (12.56) (9.00) (6.69) (-3.35) (19.23) (0.77) 42,705 0.03
Panel B: Old Firms for 1979 - 2006 (Post-1978 Period)
FM w/o -1.16 0.18 -0.53 2.77
(-12.65) (4.58) (-1.17) (16.77) 827 0.25
FM w/ Control -2.24 0.34 -0.63 2.36 0.32 3.86 -0.89 3.34 -0.69
(-22.71) (11.25) (-1.26) (14.92) (1.25) (5.08) (-4.64) (28.77) (-2.26) 827 0.36
Within-firm 0.14 1.11 0.74 -0.01 1.36 -0.27
Demeaned Pool (7.27) (7.78) (3.60) (-0.11) (8.84) (-1.37) 23,979 0.02
Panel C: New Firms for 1979 - 2006 (Post-1978 Period) FM w/o -2.42 0.31 -0.53 2.37 (-27.20) (6.61) (-11.58) (20.47) 1,830 0.15
FM w/ Control -2.55 0.32 -0.49 1.89 -0.09 2.99 -1.39 2.57 -1.29
(-15.81) (7.17) (-8.63) (16.33) (-0.43) (6.11) (-9.35) (10.59) (-6.62) 1,830 0.20Within-firm 0.01 0.24 -0.06 -0.05 1.10 -0.09 Demeaned Pool (1.12) (2.73) (-0.81) (-3.15) (10.77) (-1.00) 53,081 0.00