a guide for reporting on rigorous evaluations ... - ed-msp… for... · mathematics and science...
TRANSCRIPT
A Guide for Reporting on
Evaluations for the US
Department of Education
Mathematics and Science
Partnerships (MSP)
A User-Friendly
Guide for MSP
Project Officials and
Evaluators
Contract # ED-CFO-10-A-0024
March 2015
Prepared for:
Patricia O’Connell Johnson
Irene Harwarth
U.S. Department of Education,
400 Maryland Ave, SW
Washington, DC 20208
Submitted by:
Abt Associates Inc.
Ellen Bobronnikov
Sarah D. Sahni
Meenakshi Fernandes
Laurie Bozzi
150 Wheeler Street
Cambridge, MA 0213
Guide for Reporting on Evaluations for the Mathematics and Science Partnerships (MSP)
Abt Associates Inc. ▌pg. i
Table of Contents
Introduction .......................................................................................................................................... 1
Criterion #1: Attrition .......................................................................................................................... 6 Description and Justification ........................................................................................................ 6
Recommended Data to Include in Evaluation Report .................................................................. 7
Criterion #2: Baseline Equivalence of Groups................................................................................... 8 Description and Justification ........................................................................................................ 8
Testing for Baseline Equivalence ................................................................................................ 8
Recommended Data to Include in Evaluation Report .................................................................. 9
Criterion #3: Quality of the Measurement Instruments ................................................................. 11 Description and Justification ...................................................................................................... 11
Recommended Data to Include in Evaluation Report ................................................................ 11
Criterion #4: Relevant Statistics Reported ...................................................................................... 13 Description and Justification ...................................................................................................... 13
Recommended Data to Include in Evaluation Report ................................................................ 13
Conclusions ......................................................................................................................................... 15
Resources ............................................................................................................................................. 16
Appendix A: Criteria for Classifying Designs of MSP Evaluations............................................... 20
Guide for Reporting on Evaluations for the Mathematics and Science Partnerships (MSP)
Abt Associates Inc. ▌pg. 1
Introduction
This is primarily a “how-to” guide for MSP state coordinators, project staff, and evaluators who are
seeking clear, practical advice on how to report on evaluations they conduct. Before describing our
recommendations for reporting on rigorous designs, in this section we 1) describe the evaluation
requirements and recommendations of the MSP Program; 2) define criteria the MSP Program uses to
determine whether an evaluation is considered “rigorous”1 and thus could yield scientifically valid
results; and 3) explain the process for reviewing evaluations annually to see if they meet these
criteria.
We recommend grantees and evaluators review this guide before conducting their evaluations in
order to familiarize themselves with the process by which the evaluation will be reviewed, as well as
to understand its logic and motivation. We expect this guide to also serve as a resource during the
evaluation and while assembling the information to include in the annual performance reports (APRs)
and evaluation reports. Lastly, we hope this guide will be useful for projects who are not yet ready to
conduct a fully rigorous evaluation, but who would like to learn more about what such an evaluation
requires or increase the rigor of their evaluation.
Evaluation Requirements and Recommendations of the MSP Program
Beginning in 2001, the federal No Child Left Behind Act called on educational practitioners to use
“scientifically-based research” to guide their decisions about the effectiveness of the programs they
were implementing. The MSP Program requires projects to develop an evaluation plan that includes
objectives that measure the impact of activities. However, since there is no single type of evaluation
design that is appropriate for all projects, it does not require a specific evaluation design. The MSP
Program only requires projects to report on two aspects of evaluation findings:
Changes in teacher content knowledge based on pre- and post-testing; and
Proficiency levels on state-level assessments of students of teachers who received
professional development.
When a program is still in the early stages of development and refinement, it often makes sense to
study how the program is working and whether it appears to be leading to desired outcomes using
small-scale evaluations. If the program seems promising, a next stage might be to evaluate it in a
larger study using a more rigorous evaluation, with a comparison group that does not participate in
the program, to examine what would have happened in the absence of the program.
Rigorous evaluations help to build a body of evidence about the effectiveness of interventions. For
the purpose of this guide, the term “intervention” refers to a specific program or practice that is
anticipated to affect a given outcome or set of outcomes. This provides valuable information to both
federal policy makers and to other educational programs about which interventions “work”.
Additionally, state level program officers often use evaluation reports as part of the decision making
process for continuation of funding. Finally, these rigorous evaluation help to meet the MSP
1 In this document, we use the term “rigorous evaluation” to refer to evaluations that are capable of producing
valid evidence of an intervention’s true effect.
Guide for Reporting on Evaluations for the Mathematics and Science Partnerships (MSP)
Abt Associates Inc. ▌pg. 2
Program’s Government Performance and Results Act (GPRA), as two of the GPRA indicators for the
MSP Program focus on evaluation design:
The percentage of MSP projects that report using an experimental or quasi-experimental
design for their evaluations.
The percentage of MSP projects using an experimental or quasi-experimental design for their
evaluations whose evaluations are conducted successfully and yield scientifically valid
results.
Projects that meet the criteria the MSP Program uses to determine whether an evaluation is “rigorous”
are also highlighted in the MSP annual report, and these studies become more visible to federal and
state policy makers.
MSP Criteria for Assessing whether an Evaluation is “Rigorous” and Could Yield Scientifically
Valid Results
In 2002 the Institute for Education Sciences (IES) within the U.S. Department of Education
established the What Works Clearinghouse (WWC) to provide the public with a reliable and proven
source of evidence regarding effective educational interventions.2 The WWC developed evidence
standards about an evaluation’s methodology to ensure that they only report impacts for studies for
which they have confidence that the effect can only be attributed to the intervention rather than to
other factors.
The criteria used for assessing the rigor of MSP are based on the WWC evidence standards. However,
they have been modified to make them more appropriate for MSP grantees with limited evaluation
resources (see appendix A for the full text of the Criteria for Classifying Designs of MSP
Evaluations). They were initially developed by Westat as part of the Data Quality Initiative at IES,
and have been modified by Abt Associates in order to improve the alignment with the WWC
evidence standards. The criteria identify four key elements for assessing whether the MSP evaluations
were conducted in a rigorous manner:
Attrition
Baseline Equivalence of Groups
Quality of Measurement Instruments
Relevant Statistics Reported
The following sections describe the process for reviewing MSP evaluations against these criteria and
how each of these key elements must be presented by MSP evaluations in order for them to be
considered rigorous. In subsequent sections each criterion is defined. Example calculations are
provided in some cases to clarify what information should be included in project documents. For the
full text of the MSP criteria, see Appendix A.
2 What Works Clearinghouse evidence standards which can be downloaded at
http://ies.ed.gov/ncee/wwc/pdf/wwc_procedures_v2_standards_handbook.pdf
Guide for Reporting on Evaluations for the Mathematics and Science Partnerships (MSP)
Abt Associates Inc. ▌pg. 3
Process for Reviewing MSP Evaluations
Each year, evaluations of final-year projects that report using a comparison-group design are
reviewed against the MSP criteria for assessing whether an evaluation is rigorous and could yield
scientifically valid results. The primary source of information for the review is the final evaluation
report that MSP projects upload in Section VII.J of the annual performance report (APR). If
additional information is required, the review team may also consult the data provided in other
sections of the APR, as well as any supplemental materials the project may have uploaded.
To ensure we have complete information for our review, we encourage MSP grantees to describe the
study characteristics, including a description of the intervention delivered, timeline of data collection,
and assessment instruments used. Grantees should also describe how the sample is created, including
how the treatment and comparison groups were selected, the number of participants at the beginning
of the study, and the number remaining at the end of the study, and ensure that any changes to the
sample are documented.
Comparison-Group Designs
In order to be reviewed, an evaluation must include a comparison between a group of people who
experienced the intervention being studied and a group of similar people who did not. For example,
an evaluation that just reports findings from a comparison of teachers’ content knowledge measured
before and after they participated in a professional development program would not qualify for this
review. In order to qualify for a review, the changes observed among these teachers would have to be
compared to the changes observed in another similar group of teachers who did not participate in the
professional development program.
Evaluations with a comparison group that qualify for a review fall into two design categories:
experimental and quasi-experimental.
Evaluations with an experimental design are also known as randomized controlled trials (RCTs). In
these evaluations, study participants are randomly assigned to a treatment or a comparison group,
either individually or in groups (e.g., teachers, classrooms, or schools), before an intervention is
introduced. The use of random assignment allows researchers to consider the treatment and
comparison groups to be statistically equivalent prior to the intervention. Since the two groups are
considered to be equivalent, and the intervention is implemented with the treatment group and not the
comparison group, differences in outcomes between the two groups can be attributed to the
intervention—and not to pre-existing differences between the groups. When this design is properly
implemented, findings from the study are considered to be the most rigorous evidence on the effects
of interventions.
Evaluations with a quasi-experimental design (QEDs) also include a comparison group, but
assignment to the treatment and comparison groups is not random. For example, an MSP project
might solicit middle school teachers to attend a professional development program on basic algebra.
The treatment group for this evaluation would be the teachers who volunteer to attend the
professional development. The comparison group might be a second group of teachers who are
“matched” on various characteristics to the treatment group (e.g., are in the same school, teach the
same grade levels, etc.) who did not attend the professional development. While well-implemented
experimental designs are considered to be the “gold standard” for evaluations, a carefully executed
quasi-experimental design can also qualify as a rigorous evaluation.

Guide for Reporting on Evaluations for the Mathematics and Science Partnerships (MSP)
Abt Associates Inc. ▌pg. 4
Whether the evaluation uses an experimental or a quasi-experimental design, the comparison group
should meet certain standards to be considered valid. The intervention delivered to the treatment
group should be distinct from the comparison group, and outcomes for both the treatment and
comparison groups should be assessed at the same time points.
Benchmark Comparison
Many MSP projects compare the findings from a treatment group to a benchmark, such as a district-
wide or statewide average of student assessment scores. However, in order to serve as a valid
comparison group, the benchmark would need to be distinct from the treatment group, and should not
include individuals from the treatment group. This is usually not possible with a district-wide or state-
wide average. Therefore many of these evaluations do not qualify for review and cannot be rated as
“rigorous.”
Outcomes Reviewed
An MSP project may evaluate many types of outcomes. In our review process, three types of
outcomes are evaluated. An evaluation may meet the criteria using any of the following outcomes:
Teacher content knowledge of mathematics and science: Teachers’ knowledge of a specific
content area. This may also include pedagogical content knowledge, the knowledge of how to
teach specific content. For example, an evaluation may investigate how a project’s
intervention affects teachers’ knowledge of cell biology or how to teach cell biology. This
does not include general teaching practices or classroom practices.
Classroom practices: What the teacher does in the classroom or how the teacher sets up the
classroom. For example, this may include the number of minutes a teacher spends on a topic,
how often teachers engage students one-on-one, or what the classroom environment looks
like.
Student achievement in mathematics and science: Measures of student achievement can
include state and standardized tests. 3
The evaluations of each of the outcome areas of an MSP project are reviewed independently. For
example, if a project has investigated the effects of its professional development on both teacher
content knowledge and student achievement, raters review the teacher content knowledge evaluation
and judge whether it meets the criteria separately from the evaluation of student achievement.
An Overview to the Rest of This Guide
The subsequent sections in this guide each present one criterion, providing the full text of the
criterion, a description and justification for its inclusion in our review, the recommended data that you
should include in your evaluation report, and a description of common pitfalls. Examples are also
included to illustrate the kind of data that should be included and to clarify the calculations. Project
staff and evaluators will both benefit from reviewing these sections.
3 Other outcomes commonly evaluated by MSP projects include teacher efficacy, leadership capacity, and
student engagement, but these are not included in our review of rigor.
Guide for Reporting on Evaluations for the Mathematics and Science Partnerships (MSP)
Abt Associates Inc. ▌pg. 5
It is important to note that this guide does not provide recommendations for how to choose or
implement specific evaluation designs for specific types of projects. For design-related questions
please refer to the references provided at the end of this document.
Guide for Reporting on Evaluations for the Mathematics and Science Partnerships (MSP)
Abt Associates Inc. ▌pg. 6
Criterion #1: Attrition
An experimental evaluation meets the attrition criterion if the following two conditions are met:
The overall attrition rate for the treatment and comparison groups is less than or equal
to 30 percent,
AND
The difference in the attrition rates between the two groups is equal to or less than 15
percent.
Note: This criterion is only applicable to evaluations that use experimental designs.
Description and Justification
During the course of an intervention (e.g., a teacher training or professional development session),
some teachers or students may change schools or decide not to participate in the evaluation or not to
take a final assessment. This loss of participants leads to missing outcome data, which is also known
as attrition. Attrition can be problematic for an experimental study because the groups that were
considered to be statistically equivalent due to the randomization that happened in the beginning of
the study may no longer be equivalent after some participants are lost.
Evaluations that use randomization to assign participants to treatment and control groups have the
ability to produce the most rigorous evidence on interventions’ effectiveness. Randomization is a
powerful process because it creates groups that can be considered statistically equivalent. This
equivalence allows us to attribute any differences between the groups on the outcomes (e.g., scores on
an assessment of content knowledge) to the intervention, and not to other differences that exist
between the two groups. When there is a lot of attrition, or participant loss, we cannot be sure that the
equivalence created by the randomization still holds. This can affect our ability to attribute
differences between the groups to the intervention. This is especially true if there is significantly more
attrition in one of the groups than the other.
For example, imagine a treatment that requires participants to attend an intensive training course.
Random assignment produces two groups of teachers who are similar to one another. The treatment
group of teachers attends the training, while the other does not. However, because of the intensive
time commitment, only the most motivated treatment teachers follow through by attending the entire
training, while the less motivated treatment teachers leave the study. This may lead to high attrition in
the treatment group. Consequently, the treatment group is now composed primarily of teachers who
are highly motivated to attend the training course, while the control group has not changed at all. The
treatment and control groups can no longer be considered to be comparable to each other. If
differences in the two groups’ outcomes are found, it will be impossible to know whether they are due
to the intervention or to a difference in the motivation level of participants in the two groups.
In order to mitigate the risk of high attrition, we recommend that projects take steps to maintain their
original sample for the entire period of the study. If they cannot do so, they should take great care to
document the circumstances of the attrition and when it occurred.

Guide for Reporting on Evaluations for the Mathematics and Science Partnerships (MSP)
Abt Associates Inc. ▌pg. 7
Recommended Data to Include in Evaluation Report
In order to assess the attrition criterion, data must be reported on the number of people in each group
being compared, both at pre-test and at post-test. Group sizes should be reported for each outcome
because people can have missing data for some outcomes and not others. If outcomes from more than
one time period are reported (e.g., directly after an intervention and 1 year later), the group sizes at
each point in time should be reported as well.
Common Pitfalls
A common practice among projects is to present varying sample sizes at different time points without
an accompanying explanation. Another common mistake is to report the number of people in each
group, but fail to report the number of people who were missing data for each outcome. We
recommend that projects report the sample sizes of treatment and comparison groups used in the
analysis of each outcome in a table. In addition, provide explanations in the accompanying text of
changes that occurred in the sample. Analogous information for all subgroups analyzed should also be
reported. The example below presents a table for a hypothetical evaluation and walks the reader
through the calculations for assessing this criterion.
Example of Attrition Calculation
In this example, a total of 200 teachers were selected for an experimental evaluation and 100 teachers
were randomly assigned to the treatment group. All teachers were assessed on content knowledge at
baseline, before the intervention was introduced. While some of the teachers changed schools or
could not continue to participate in the project, the remaining teachers were tested again at the end of
the school year. The sample sizes are presented in the table below.
Baseline
Sample End of Year
Treatment group 100 teachers 90 teachers
Comparison group 100 teachers 66 teachers
The overall attrition rate is calculated as the change in the sample size, from the baseline assessment
to each of the follow-up time points, divided by the total baseline sample size.
Using the example above, the overall attrition rate is:
[(100 + 100) – (90 + 66)] / (100 + 100) = 22%
As 22% < 30%, the evaluation meets the first condition of the criterion.
The differential attrition rate is calculated as the difference between the attrition rate of the treatment
and comparison groups.
The differential attrition rate is:
[(100 – 66) / 100] – [(100 – 90) / 100] = 24%
As 24 percent is greater than 15 percent, the evaluation does not meets the differential attrition
condition, and thus does not satisfy this criterion.
Guide for Reporting on Evaluations for the Mathematics and Science Partnerships (MSP)
Abt Associates Inc. ▌pg. 8
Criterion #2: Baseline Equivalence of Groups
To meet the baseline equivalence criterion, one of the following two conditions must be met:
The difference between treatment and comparison group means on the outcome
measure is less than or equal to 5 percent of the pooled standard deviation of the two
groups,
OR
The difference between treatment and comparison group means on the outcome
measure is greater than 5 percent and less than 25 percent, and the analysis controls for
the baseline differences in the analysis.
Note: If the evaluation uses an experimental design that meets Criterion #1, then Criterion #2 is
not applicable and is skipped. Baseline equivalence is assessed for all quasi-experimental
designs and for experimental designs that fail Criterion #1.
Description and Justification
The two groups being compared to one another in an evaluation must be statistically equivalent at
baseline, before the intervention is introduced. This ensures that any differences between the groups
found in the outcome (e.g. scores on an assessment of content knowledge) after the intervention can
be attributed to the intervention rather than to pre-existing differences between the groups. Quasi-
experimental designs can test whether the groups are similar this by measuring the two groups on key
outcomes, prior to the intervention, for example, using pre-test scores on an assessment of content
knowledge. This is described in more detail in the next section.
The establishment of baseline equivalence is typically not necessary in an experimental design, since
the process of random assignment creates groups that can be considered equivalent. Maintaining the
study sample (i.e., keeping attrition low) in both groups ensures that post-intervention differences can
be attributed to the treatment. Therefore experimental designs that meet the attrition criterion do not
need to be assessed on this criterion. However, baseline equivalence must be established for
experimental designs that fail the attrition criterion, in order for them to be considered rigorous.
Testing for Baseline Equivalence
For the purposes of MSP project evaluations, this baseline equivalence is tested by comparing the
treatment and comparison groups on the outcome measure, or a related measure, prior to the
intervention. This comparison should be made of the analytic sample, which is defined as the sample
of participants for which an outcome, or related measure, was collected at both pre-test and post-test.
Therefore participants for whom there is a baseline measure but no follow-up measure should be
excluded from this analysis, as they are not part of the analytic sample.
If the mean difference between the treatment and control group at pre-test is less than 5 percent of the
pooled standard deviation, then the two groups are considered to be similar and baseline equivalence
has been achieved. If the mean difference is greater than 5 percent but less than 25 percent of the
pooled standard deviation, the baseline difference is considered to be sufficiently large such that it
should be controlled for in the analysis.

Guide for Reporting on Evaluations for the Mathematics and Science Partnerships (MSP)
Abt Associates Inc. ▌pg. 9
Several approaches can be taken to control for baseline differences in the analyses. The best method
is to account for pre-test differences by including the variable on which the groups differ in the
analysis. Depending on the analytic model, one can do this by using the pre-test variable as a
covariate. If the mean difference is greater than 25 percent of the pooled standard deviation, then the
baseline difference is considered to be too large to be adjusted for when estimating the impact of the
intervention. Therefore, an evaluation in which the baseline differences between groups exceed this
level would fail this criterion.
Recommended Data to Include in Evaluation Report
The information typically needed to assess baseline equivalence is the sample size, mean and standard
deviation of the baseline measures of the analytic sample for the treatment and comparison groups. If
this information is only available for the full baseline sample, you should provide this information.
Common Pitfalls
A common practice for evaluation reports is to provide some but not all relevant information. For
example, projects may provide means but not standard deviations to assess baseline equivalence. We
recommend that projects provide all the relevant information for both the treatment and comparison
groups, and for all subgroups and outcomes for which there was an evaluation. Alternative statistics
such as normalized scores, proportions or effect sizes should be presented instead if they are better
suited for the chosen outcome measures. It is important to describe the outcome measure, how to
interpret it, whether it was standardized and whether it has been normed.
Another common practice in MSP evaluations is to use a t-test to assess baseline equivalence and rely
on the p-value to determine whether groups are equivalent. This method is not recommended because
it is often misleading, especially when sample sizes are small. It is not uncommon for a t-test to show
that there is not a significant difference between the groups at baseline (because the p-value is above
.05), and at the same time for there to be a difference between groups that is greater than 5 percent of
the pooled standard deviation. In these cases, evaluations might fail this criterion because they did not
statistically control for the baseline differences. Therefore we recommend that you follow our
example below when determining whether your groups have baseline equivalence, in addition to any
other approaches to baseline equivalence you customarily use.
Example of a Calculation of Baseline Equivalence for a Quasi-Experimental Evaluation
In a quasi-experimental evaluation, the original, baseline sample was composed of 450 children in the
treatment group and 520 children in the comparison group. However, due to some students changing
schools, the analytic sample was reduced to 420 children in the treatment group and 495 children in
the comparison group. All of these children were assessed at baseline before the intervention was
introduced and again after the intervention was delivered, so this is the analytic sample. The mean
and standard deviation for the children in the treatment group were 50.4 and 15.3 respectively. For the
comparison group, the mean and standard deviation were 51.2 and 19.2 respectively.
Analytic Sample
N
Mean of Baseline Measure
Standard Deviation of Baseline Measure
Treatment Group 420 50.4 15.3
Comparison Group 495 51.2 19.2
Guide for Reporting on Evaluations for the Mathematics and Science Partnerships (MSP)
Abt Associates Inc. ▌pg. 10
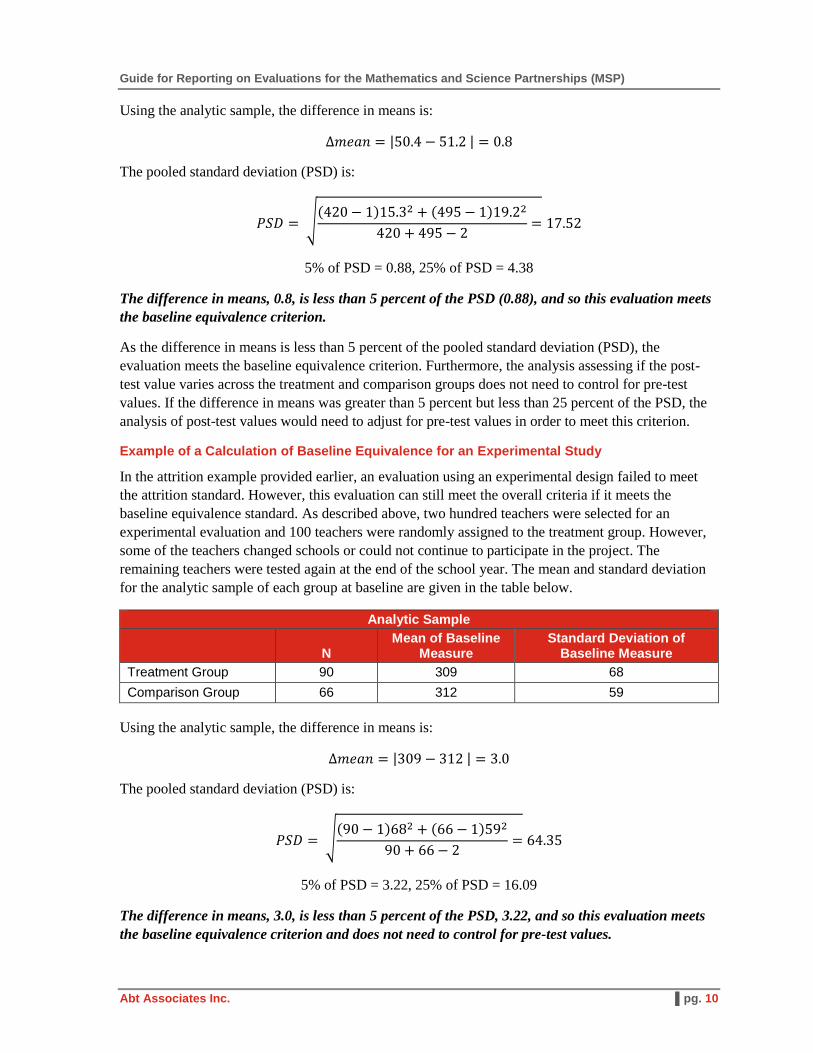
Using the analytic sample, the difference in means is:
∆𝑚𝑒𝑎𝑛 = |50.4 − 51.2 | = 0.8
The pooled standard deviation (PSD) is:
𝑃𝑆𝐷 = √(420 − 1)15.32 + (495 − 1)19.22
420 + 495 − 2= 17.52
5% of PSD = 0.88, 25% of PSD = 4.38
The difference in means, 0.8, is less than 5 percent of the PSD (0.88), and so this evaluation meets
the baseline equivalence criterion.
As the difference in means is less than 5 percent of the pooled standard deviation (PSD), the
evaluation meets the baseline equivalence criterion. Furthermore, the analysis assessing if the post-
test value varies across the treatment and comparison groups does not need to control for pre-test
values. If the difference in means was greater than 5 percent but less than 25 percent of the PSD, the
analysis of post-test values would need to adjust for pre-test values in order to meet this criterion.
Example of a Calculation of Baseline Equivalence for an Experimental Study
In the attrition example provided earlier, an evaluation using an experimental design failed to meet
the attrition standard. However, this evaluation can still meet the overall criteria if it meets the
baseline equivalence standard. As described above, two hundred teachers were selected for an
experimental evaluation and 100 teachers were randomly assigned to the treatment group. However,
some of the teachers changed schools or could not continue to participate in the project. The
remaining teachers were tested again at the end of the school year. The mean and standard deviation
for the analytic sample of each group at baseline are given in the table below.
Analytic Sample
N
Mean of Baseline Measure
Standard Deviation of Baseline Measure
Treatment Group 90 309 68
Comparison Group 66 312 59
Using the analytic sample, the difference in means is:
∆𝑚𝑒𝑎𝑛 = |309 − 312 | = 3.0
The pooled standard deviation (PSD) is:
𝑃𝑆𝐷 = √(90 − 1)682 + (66 − 1)592
90 + 66 − 2= 64.35
5% of PSD = 3.22, 25% of PSD = 16.09
The difference in means, 3.0, is less than 5 percent of the PSD, 3.22, and so this evaluation meets
the baseline equivalence criterion and does not need to control for pre-test values.
Guide for Reporting on Evaluations for the Mathematics and Science Partnerships (MSP)
Abt Associates Inc. ▌pg. 11
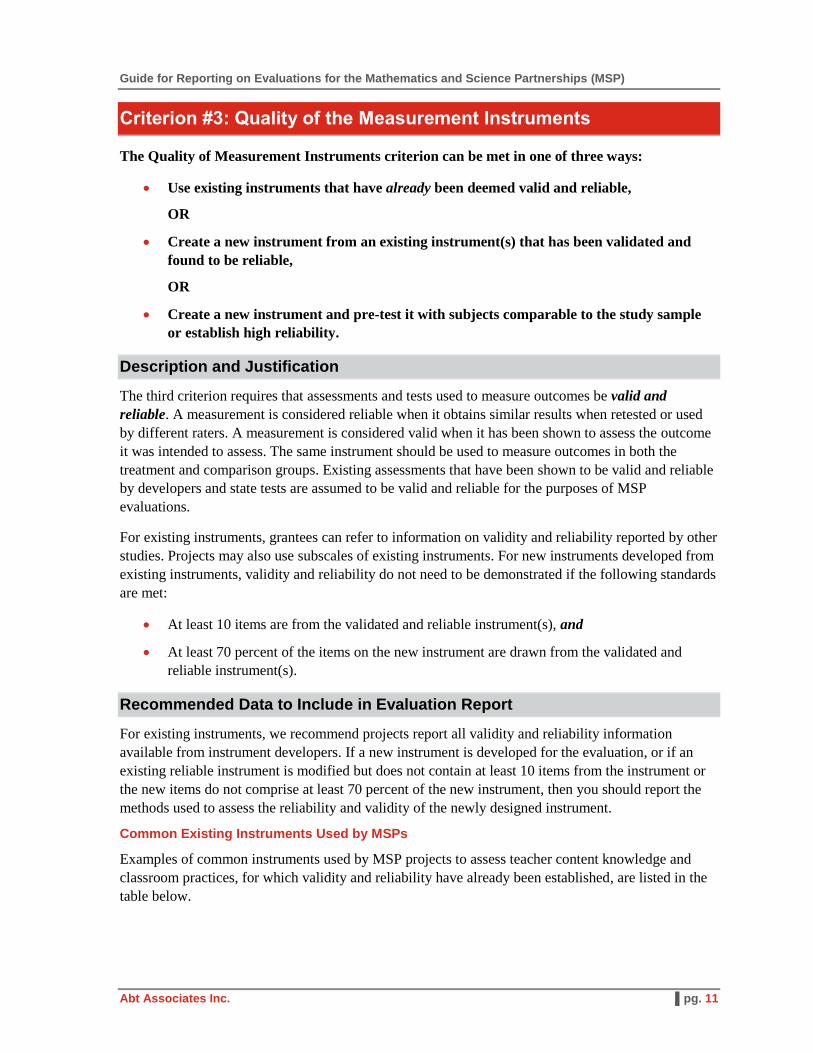
Criterion #3: Quality of the Measurement Instruments
The Quality of Measurement Instruments criterion can be met in one of three ways:
Use existing instruments that have already been deemed valid and reliable,
OR
Create a new instrument from an existing instrument(s) that has been validated and
found to be reliable,
OR
Create a new instrument and pre-test it with subjects comparable to the study sample
or establish high reliability.
Description and Justification
The third criterion requires that assessments and tests used to measure outcomes be valid and
reliable. A measurement is considered reliable when it obtains similar results when retested or used
by different raters. A measurement is considered valid when it has been shown to assess the outcome
it was intended to assess. The same instrument should be used to measure outcomes in both the
treatment and comparison groups. Existing assessments that have been shown to be valid and reliable
by developers and state tests are assumed to be valid and reliable for the purposes of MSP
evaluations.
For existing instruments, grantees can refer to information on validity and reliability reported by other
studies. Projects may also use subscales of existing instruments. For new instruments developed from
existing instruments, validity and reliability do not need to be demonstrated if the following standards
are met:
At least 10 items are from the validated and reliable instrument(s), and
At least 70 percent of the items on the new instrument are drawn from the validated and
reliable instrument(s).
Recommended Data to Include in Evaluation Report
For existing instruments, we recommend projects report all validity and reliability information
available from instrument developers. If a new instrument is developed for the evaluation, or if an
existing reliable instrument is modified but does not contain at least 10 items from the instrument or
the new items do not comprise at least 70 percent of the new instrument, then you should report the
methods used to assess the reliability and validity of the newly designed instrument.
Common Existing Instruments Used by MSPs
Examples of common instruments used by MSP projects to assess teacher content knowledge and
classroom practices, for which validity and reliability have already been established, are listed in the
table below.

Guide for Reporting on Evaluations for the Mathematics and Science Partnerships (MSP)
Abt Associates Inc. ▌pg. 12
Teacher Content Knowledge in Mathematics
Learning Mathematics for Teaching (LMT)
Diagnostic Mathematics Assessments for Middle School Teachers
State Teacher Assessment
Knowledge of Algebra for Teaching
PRAXIS II
Teacher Content Knowledge in Science
MOSART: Misconception Oriented Standards-Based Assessment
Diagnostic Teacher Assessments in Mathematics and Science (DTAMS)
State Teacher Assessment
Assessing Teacher Learning about Science Teaching (ATLAST)
Force Concept Inventory
PRAXIS II
Classroom Practices
Reformed Teaching Observation Protocol (RTOP)
Surveys of Enacted Curriculum
Inside the Classroom Observation Protocol

Guide for Reporting on Evaluations for the Mathematics and Science Partnerships (MSP)
Abt Associates Inc. ▌pg. 13
Criterion #4: Relevant Statistics Reported
To meet the relevant statistics reported criterion, one of the following conditions must be met:
Post-test means for treatment and comparison groups and tests of statistical significance
for key outcomes are presented. Tests of statistical significance should directly compare
the treatment and comparison groups.
OR
Sufficient information for calculation of statistical significance (e.g., mean, sample size,
standard deviation/standard error) is presented.
Description and Justification
Projects should report relevant statistics so that readers can understand the effects of the intervention.
The particular statistics that accomplish this varies depending on the design of the evaluation.
However, it is always good to include post-test means, standard deviations, sample sizes, and
significance levels for any key comparisons.
To meet this final criterion, you must present sufficient information regarding the estimation of the
intervention’s impact, as well as the statistical significance of the impact’s estimate. Relevant
statistics must be reported regardless of whether or not they reveal significant findings. The
significance of findings, or lack thereof, does not affect whether the evaluation meets this criterion.
Recommended Data to Include in Evaluation Report
We recommend that you describe the analytic model and methods, covariates used in multivariate
analyses, and any adjustments. To demonstrate that the relevant statistics are reported, projects should
report the following statistics for all tests of statistical significance on key outcomes:
Baseline sample size (for experimental designs only) of treatment and comparison groups—
the sample at randomization
Analytic sample size4 of treatment and comparison groups—the sample for which you have
both pre and post intervention data
Post-test means on outcome measures for both treatment and comparison groups
Standard deviation of post-test outcome measures for both treatment and comparison group
p-values
These relevant statistics should be provided for all analyses looking at key outcomes, as well as for
any subgroups evaluated on the key outcomes.
4 For both baseline and analytic sample size include the number of schools, teachers, and students as relevant.
Guide for Reporting on Evaluations for the Mathematics and Science Partnerships (MSP)
Abt Associates Inc. ▌pg. 14
Common Pitfalls
A common practice is to use results from the MSP TCK tool (included as part of the annual
performance reporting system) to report on impacts. While this tool is designed to assist grantees in
reporting on their treatment teachers, it should only be used when examining a single group. When
assessing differences between treatment and comparison groups for the evaluation, the two groups
should be directly compared using an appropriate analytic strategy (e.g., ANOVA, ANCOVA, HLM
or t-test).
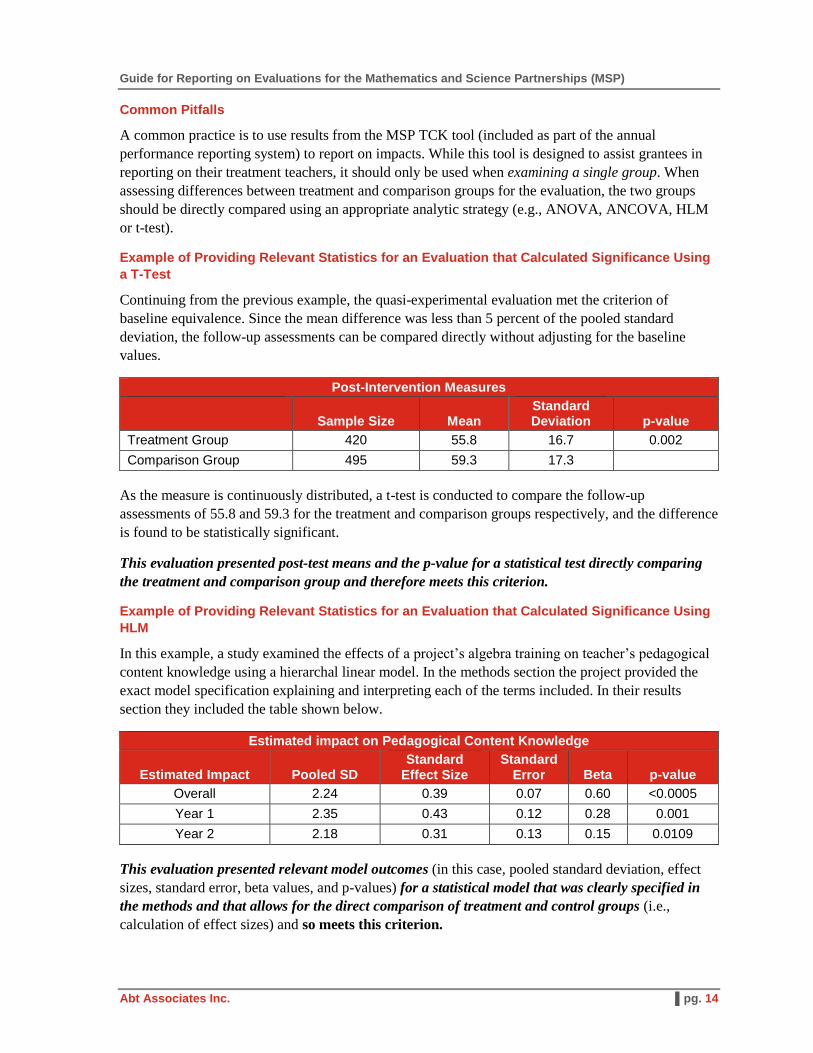
Example of Providing Relevant Statistics for an Evaluation that Calculated Significance Using
a T-Test
Continuing from the previous example, the quasi-experimental evaluation met the criterion of
baseline equivalence. Since the mean difference was less than 5 percent of the pooled standard
deviation, the follow-up assessments can be compared directly without adjusting for the baseline
values.
Post-Intervention Measures
Sample Size Mean
Standard Deviation p-value
Treatment Group 420 55.8 16.7 0.002
Comparison Group 495 59.3 17.3
As the measure is continuously distributed, a t-test is conducted to compare the follow-up
assessments of 55.8 and 59.3 for the treatment and comparison groups respectively, and the difference
is found to be statistically significant.
This evaluation presented post-test means and the p-value for a statistical test directly comparing
the treatment and comparison group and therefore meets this criterion.
Example of Providing Relevant Statistics for an Evaluation that Calculated Significance Using
HLM
In this example, a study examined the effects of a project’s algebra training on teacher’s pedagogical
content knowledge using a hierarchal linear model. In the methods section the project provided the
exact model specification explaining and interpreting each of the terms included. In their results
section they included the table shown below.
Estimated impact on Pedagogical Content Knowledge
Estimated Impact Pooled SD Standard
Effect Size Standard
Error Beta p-value
Overall 2.24 0.39 0.07 0.60 <0.0005
Year 1 2.35 0.43 0.12 0.28 0.001
Year 2 2.18 0.31 0.13 0.15 0.0109
This evaluation presented relevant model outcomes (in this case, pooled standard deviation, effect
sizes, standard error, beta values, and p-values) for a statistical model that was clearly specified in
the methods and that allows for the direct comparison of treatment and control groups (i.e.,
calculation of effect sizes) and so meets this criterion.
Guide for Reporting on Evaluations for the Mathematics and Science Partnerships (MSP)
Abt Associates Inc. ▌pg. 15
Conclusions
By following this guide, we expect that MSP evaluations will have the best chance of meeting the
MSP criteria for assessing whether an evaluation is rigorous and could yield scientifically valid
results. Experimental studies can meet the criteria by meeting either the attrition or baseline
equivalence standard, and both the quality of measurement instruments and relevant statistics reported
criteria. Quasi-experimental studies meet the criteria by meeting the baseline equivalence criterion
and both the quality of measurement instruments and relevant statistics reported criteria. Those
projects that meet the criteria based on an evaluation of one or more outcomes will be highlighted in
the MSP annual report, which will be publicly available on the MSP website.
The following information will be highlighted in the final report: general background information
describing the project, a description of the professional development, and a description of the
evaluation and findings of g outcomes that meet the criteria. If a study evaluates multiple outcomes,
and only one outcome (e.g., student achievement of 4th graders) meets the criteria, the evaluation of
that outcome will be highlighted in the report. Evaluations that do not meet the criteria are not
penalized in any way, but will not be highlighted in the final report.
In the following section we provide a directory of other resources that may be useful to projects.
Appendix A provides the full MSP criteria for assessing whether an evaluation is rigorous and could
yield scientifically valid results. We hope that this guide will be helpful in preparing your MSP
evaluation reports and will serve as a useful resource.
Guide for Reporting on Evaluations for the Mathematics and Science Partnerships (MSP)
Abt Associates Inc. ▌pg. 16
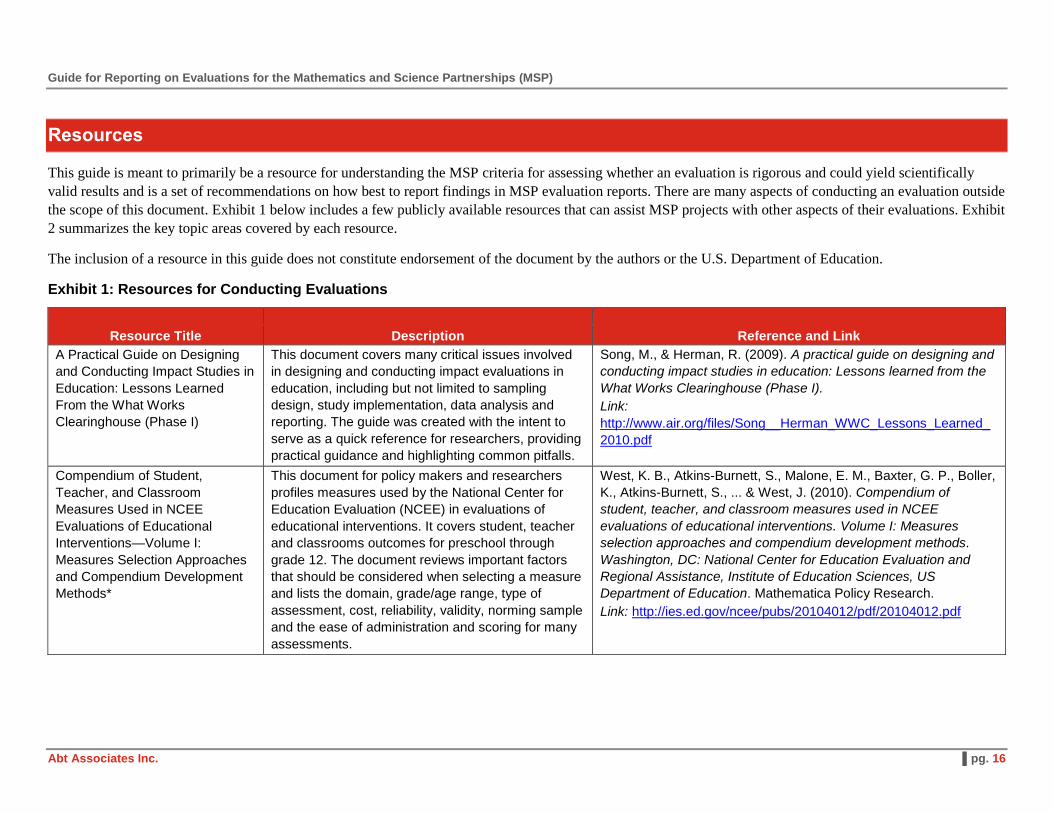
Resources
This guide is meant to primarily be a resource for understanding the MSP criteria for assessing whether an evaluation is rigorous and could yield scientifically
valid results and is a set of recommendations on how best to report findings in MSP evaluation reports. There are many aspects of conducting an evaluation outside
the scope of this document. Exhibit 1 below includes a few publicly available resources that can assist MSP projects with other aspects of their evaluations. Exhibit
2 summarizes the key topic areas covered by each resource.
The inclusion of a resource in this guide does not constitute endorsement of the document by the authors or the U.S. Department of Education.
Exhibit 1: Resources for Conducting Evaluations
Resource Title Description Reference and Link
A Practical Guide on Designing
and Conducting Impact Studies in
Education: Lessons Learned
From the What Works
Clearinghouse (Phase I)
This document covers many critical issues involved
in designing and conducting impact evaluations in
education, including but not limited to sampling
design, study implementation, data analysis and
reporting. The guide was created with the intent to
serve as a quick reference for researchers, providing
practical guidance and highlighting common pitfalls.
Song, M., & Herman, R. (2009). A practical guide on designing and
conducting impact studies in education: Lessons learned from the
What Works Clearinghouse (Phase I).
Link:
http://www.air.org/files/Song__Herman_WWC_Lessons_Learned_
2010.pdf
Compendium of Student,
Teacher, and Classroom
Measures Used in NCEE
Evaluations of Educational
Interventions—Volume I:
Measures Selection Approaches
and Compendium Development
Methods*
This document for policy makers and researchers
profiles measures used by the National Center for
Education Evaluation (NCEE) in evaluations of
educational interventions. It covers student, teacher
and classrooms outcomes for preschool through
grade 12. The document reviews important factors
that should be considered when selecting a measure
and lists the domain, grade/age range, type of
assessment, cost, reliability, validity, norming sample
and the ease of administration and scoring for many
assessments.
West, K. B., Atkins-Burnett, S., Malone, E. M., Baxter, G. P., Boller,
K., Atkins-Burnett, S., ... & West, J. (2010). Compendium of
student, teacher, and classroom measures used in NCEE
evaluations of educational interventions. Volume I: Measures
selection approaches and compendium development methods.
Washington, DC: National Center for Education Evaluation and
Regional Assistance, Institute of Education Sciences, US
Department of Education. Mathematica Policy Research.
Link: http://ies.ed.gov/ncee/pubs/20104012/pdf/20104012.pdf
Guide for Reporting on Evaluations for the Mathematics and Science Partnerships (MSP)
Abt Associates Inc. ▌pg. 17
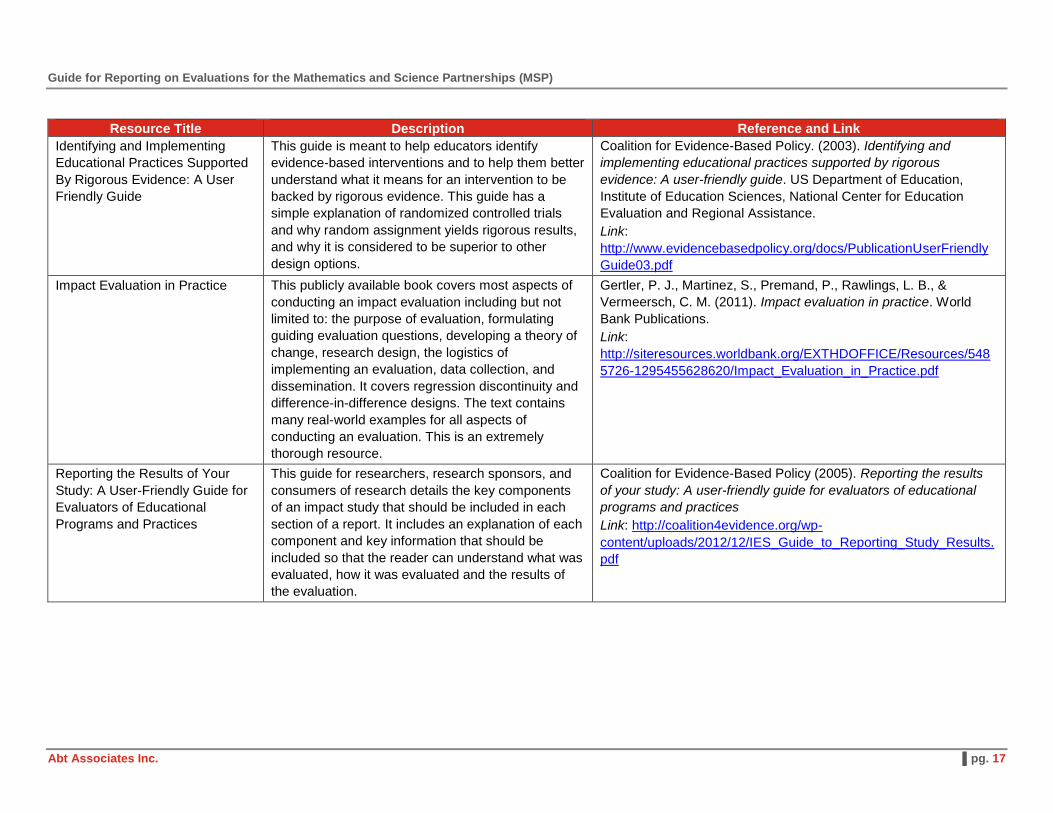
Resource Title Description Reference and Link
Identifying and Implementing
Educational Practices Supported
By Rigorous Evidence: A User
Friendly Guide
This guide is meant to help educators identify
evidence-based interventions and to help them better
understand what it means for an intervention to be
backed by rigorous evidence. This guide has a
simple explanation of randomized controlled trials
and why random assignment yields rigorous results,
and why it is considered to be superior to other
design options.
Coalition for Evidence-Based Policy. (2003). Identifying and
implementing educational practices supported by rigorous
evidence: A user-friendly guide. US Department of Education,
Institute of Education Sciences, National Center for Education
Evaluation and Regional Assistance.
Link:
http://www.evidencebasedpolicy.org/docs/PublicationUserFriendly
Guide03.pdf
Impact Evaluation in Practice This publicly available book covers most aspects of
conducting an impact evaluation including but not
limited to: the purpose of evaluation, formulating
guiding evaluation questions, developing a theory of
change, research design, the logistics of
implementing an evaluation, data collection, and
dissemination. It covers regression discontinuity and
difference-in-difference designs. The text contains
many real-world examples for all aspects of
conducting an evaluation. This is an extremely
thorough resource.
Gertler, P. J., Martinez, S., Premand, P., Rawlings, L. B., &
Vermeersch, C. M. (2011). Impact evaluation in practice. World
Bank Publications.
Link:
http://siteresources.worldbank.org/EXTHDOFFICE/Resources/548
5726-1295455628620/Impact_Evaluation_in_Practice.pdf
Reporting the Results of Your
Study: A User-Friendly Guide for
Evaluators of Educational
Programs and Practices
This guide for researchers, research sponsors, and
consumers of research details the key components
of an impact study that should be included in each
section of a report. It includes an explanation of each
component and key information that should be
included so that the reader can understand what was
evaluated, how it was evaluated and the results of
the evaluation.
Coalition for Evidence-Based Policy (2005). Reporting the results
of your study: A user-friendly guide for evaluators of educational
programs and practices
Link: http://coalition4evidence.org/wp-
content/uploads/2012/12/IES_Guide_to_Reporting_Study_Results.
Guide for Reporting on Evaluations for the Mathematics and Science Partnerships (MSP)
Abt Associates Inc. ▌pg. 18
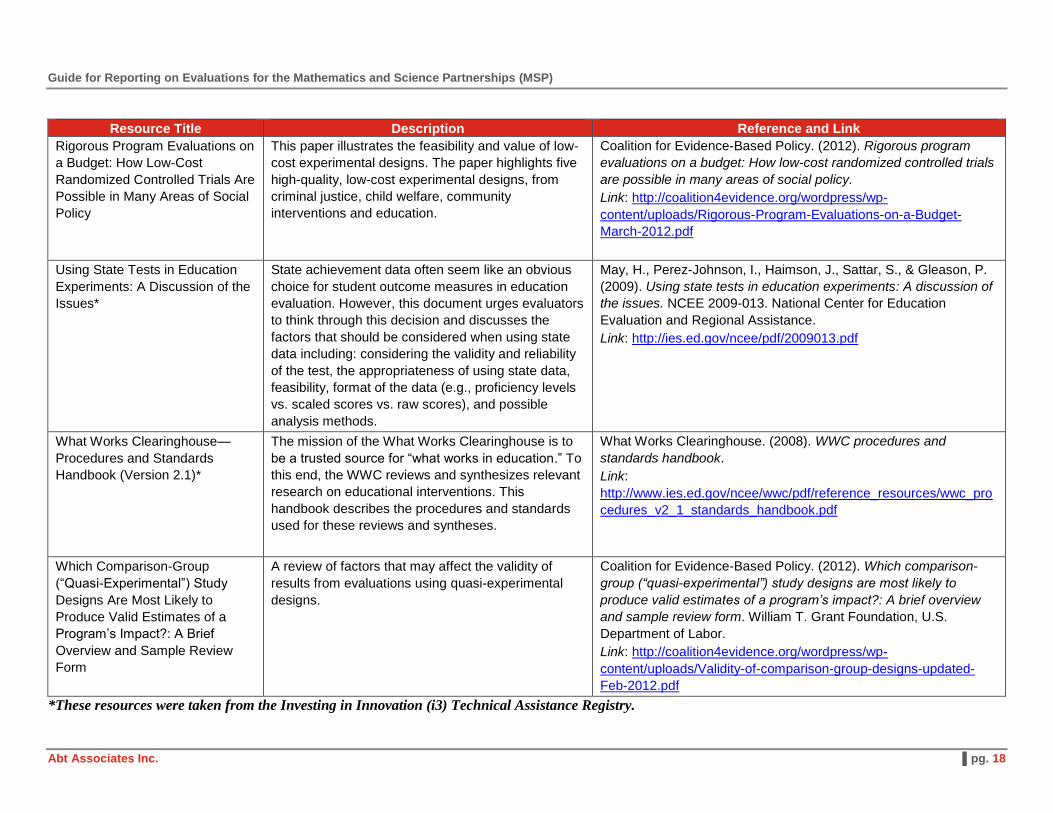
Resource Title Description Reference and Link
Rigorous Program Evaluations on
a Budget: How Low-Cost
Randomized Controlled Trials Are
Possible in Many Areas of Social
Policy
This paper illustrates the feasibility and value of low-
cost experimental designs. The paper highlights five
high-quality, low-cost experimental designs, from
criminal justice, child welfare, community
interventions and education.
Coalition for Evidence-Based Policy. (2012). Rigorous program
evaluations on a budget: How low-cost randomized controlled trials
are possible in many areas of social policy.
Link: http://coalition4evidence.org/wordpress/wp-
content/uploads/Rigorous-Program-Evaluations-on-a-Budget-
March-2012.pdf
Using State Tests in Education
Experiments: A Discussion of the
Issues*
State achievement data often seem like an obvious
choice for student outcome measures in education
evaluation. However, this document urges evaluators
to think through this decision and discusses the
factors that should be considered when using state
data including: considering the validity and reliability
of the test, the appropriateness of using state data,
feasibility, format of the data (e.g., proficiency levels
vs. scaled scores vs. raw scores), and possible
analysis methods.
May, H., Perez-Johnson, I., Haimson, J., Sattar, S., & Gleason, P.
(2009). Using state tests in education experiments: A discussion of
the issues. NCEE 2009-013. National Center for Education
Evaluation and Regional Assistance.
Link: http://ies.ed.gov/ncee/pdf/2009013.pdf
What Works Clearinghouse—
Procedures and Standards
Handbook (Version 2.1)*
The mission of the What Works Clearinghouse is to
be a trusted source for “what works in education.” To
this end, the WWC reviews and synthesizes relevant
research on educational interventions. This
handbook describes the procedures and standards
used for these reviews and syntheses.
What Works Clearinghouse. (2008). WWC procedures and
standards handbook.
Link:
http://www.ies.ed.gov/ncee/wwc/pdf/reference_resources/wwc_pro
cedures_v2_1_standards_handbook.pdf
Which Comparison-Group
(“Quasi-Experimental”) Study
Designs Are Most Likely to
Produce Valid Estimates of a
Program’s Impact?: A Brief
Overview and Sample Review
Form
A review of factors that may affect the validity of
results from evaluations using quasi-experimental
designs.
Coalition for Evidence-Based Policy. (2012). Which comparison-
group (“quasi-experimental”) study designs are most likely to
produce valid estimates of a program’s impact?: A brief overview
and sample review form. William T. Grant Foundation, U.S.
Department of Labor.
Link: http://coalition4evidence.org/wordpress/wp-
content/uploads/Validity-of-comparison-group-designs-updated-
Feb-2012.pdf
*These resources were taken from the Investing in Innovation (i3) Technical Assistance Registry.
Guide for Reporting on Evaluations for the Mathematics and Science Partnerships (MSP)
Abt Associates Inc. ▌pg. 19
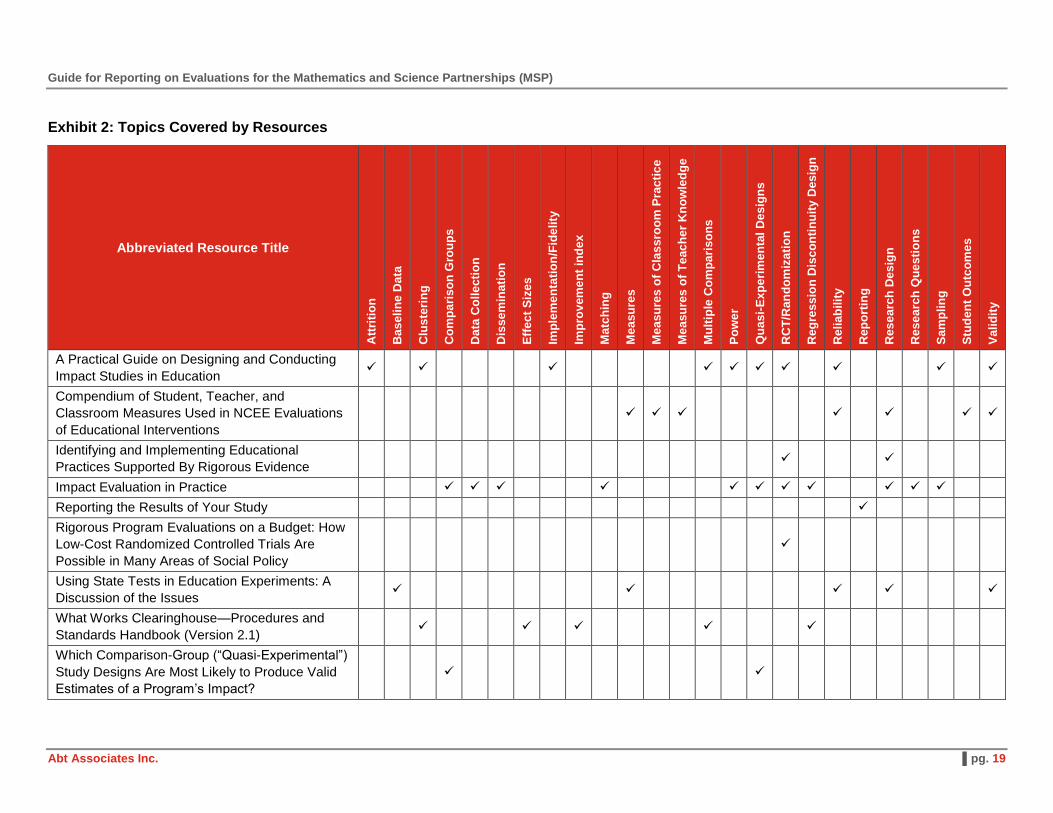
Exhibit 2: Topics Covered by Resources
Abbreviated Resource Title
Att
riti
on
Bas
eli
ne D
ata
Clu
ste
rin
g
Co
mp
ari
so
n G
rou
ps
Data
Co
lle
cti
on
Dis
se
min
ati
on
Eff
ec
t S
ize
s
Imp
lem
en
tati
on
/Fid
eli
ty
Imp
rov
em
en
t in
de
x
Ma
tch
ing
Me
asu
res
Me
asu
res
of
Cla
ss
roo
m P
rac
tic
e
Me
asu
res
of
Te
ac
he
r K
no
wle
dg
e
Mu
ltip
le C
om
pa
ris
on
s
Po
wer
Qu
as
i-E
xp
eri
me
nta
l D
es
ign
s
RC
T/R
an
do
miz
ati
on
Reg
res
sio
n D
isc
on
tin
uit
y D
es
ign
Reli
ab
ilit
y
Rep
ort
ing
Res
ea
rch
De
sig
n
Res
ea
rch
Qu
es
tio
ns
Sa
mp
lin
g
Stu
de
nt
Ou
tco
me
s
Va
lid
ity
A Practical Guide on Designing and Conducting
Impact Studies in Education
Compendium of Student, Teacher, and
Classroom Measures Used in NCEE Evaluations
of Educational Interventions
Identifying and Implementing Educational
Practices Supported By Rigorous Evidence
Impact Evaluation in Practice
Reporting the Results of Your Study
Rigorous Program Evaluations on a Budget: How
Low-Cost Randomized Controlled Trials Are
Possible in Many Areas of Social Policy
Using State Tests in Education Experiments: A
Discussion of the Issues
What Works Clearinghouse—Procedures and
Standards Handbook (Version 2.1)
Which Comparison-Group (“Quasi-Experimental”)
Study Designs Are Most Likely to Produce Valid
Estimates of a Program’s Impact?
Guide for Reporting on Evaluations for the Mathematics and Science Partnerships (MSP)
Abt Associates Inc. ▌pg. 20
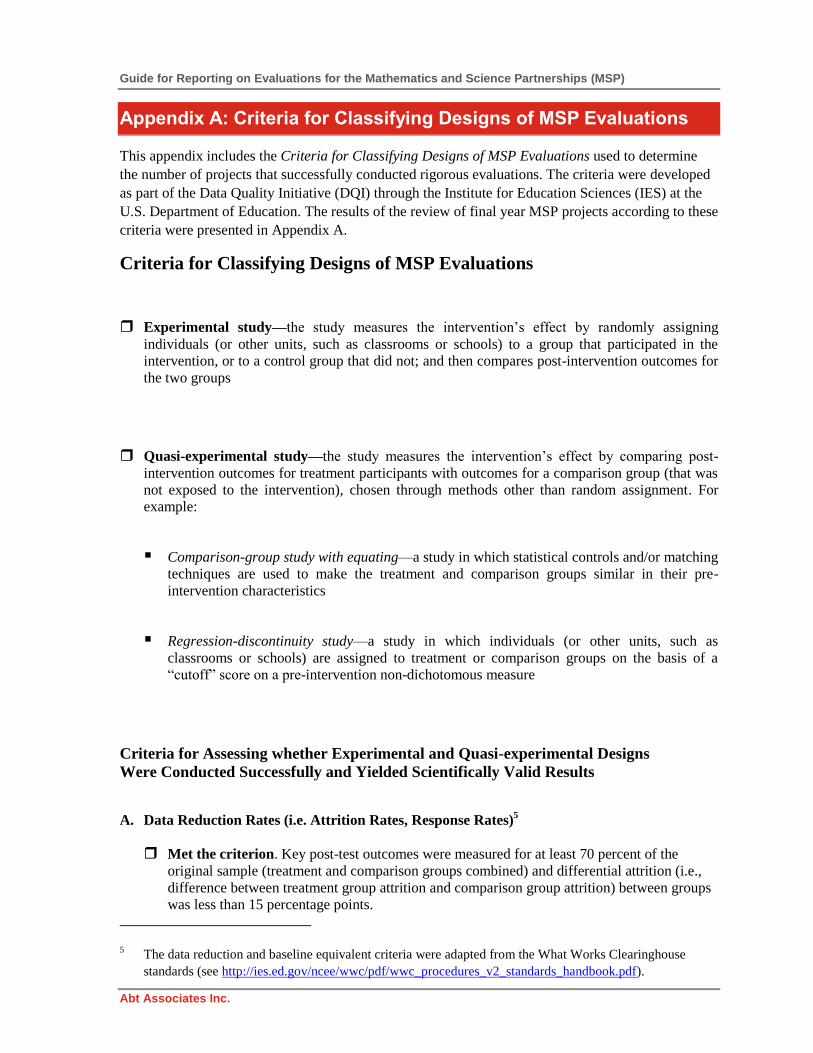
Appendix A: Criteria for Classifying Designs of MSP Evaluations
This appendix includes the Criteria for Classifying Designs of MSP Evaluations used to determine
the number of projects that successfully conducted rigorous evaluations. The criteria were developed
as part of the Data Quality Initiative (DQI) through the Institute for Education Sciences (IES) at the
U.S. Department of Education. The results of the review of final year MSP projects according to these
criteria were presented in Appendix A.
Criteria for Classifying Designs of MSP Evaluations
Experimental study—the study measures the intervention’s effect by randomly assigning
individuals (or other units, such as classrooms or schools) to a group that participated in the
intervention, or to a control group that did not; and then compares post-intervention outcomes for
the two groups
Quasi-experimental study—the study measures the intervention’s effect by comparing post-
intervention outcomes for treatment participants with outcomes for a comparison group (that was
not exposed to the intervention), chosen through methods other than random assignment. For
example:
Comparison-group study with equating—a study in which statistical controls and/or matching
techniques are used to make the treatment and comparison groups similar in their pre-
intervention characteristics
Regression-discontinuity study—a study in which individuals (or other units, such as
classrooms or schools) are assigned to treatment or comparison groups on the basis of a
“cutoff” score on a pre-intervention non-dichotomous measure
Criteria for Assessing whether Experimental and Quasi-experimental Designs
Were Conducted Successfully and Yielded Scientifically Valid Results
A. Data Reduction Rates (i.e. Attrition Rates, Response Rates)5
Met the criterion. Key post-test outcomes were measured for at least 70 percent of the
original sample (treatment and comparison groups combined) and differential attrition (i.e.,
difference between treatment group attrition and comparison group attrition) between groups
was less than 15 percentage points.
5 The data reduction and baseline equivalent criteria were adapted from the What Works Clearinghouse
standards (see http://ies.ed.gov/ncee/wwc/pdf/wwc_procedures_v2_standards_handbook.pdf).

Guide for Reporting on Evaluations for the Mathematics and Science Partnerships (MSP)
Abt Associates Inc. ▌pg. 21
Did not meet the criterion. Key post-test outcomes was measured for less than 70 percent of
the original sample (treatment and comparison groups combined) and/or differential attrition
(i.e., difference between treatment group attrition and comparison group attrition) between
groups was 15 percentage points or higher.
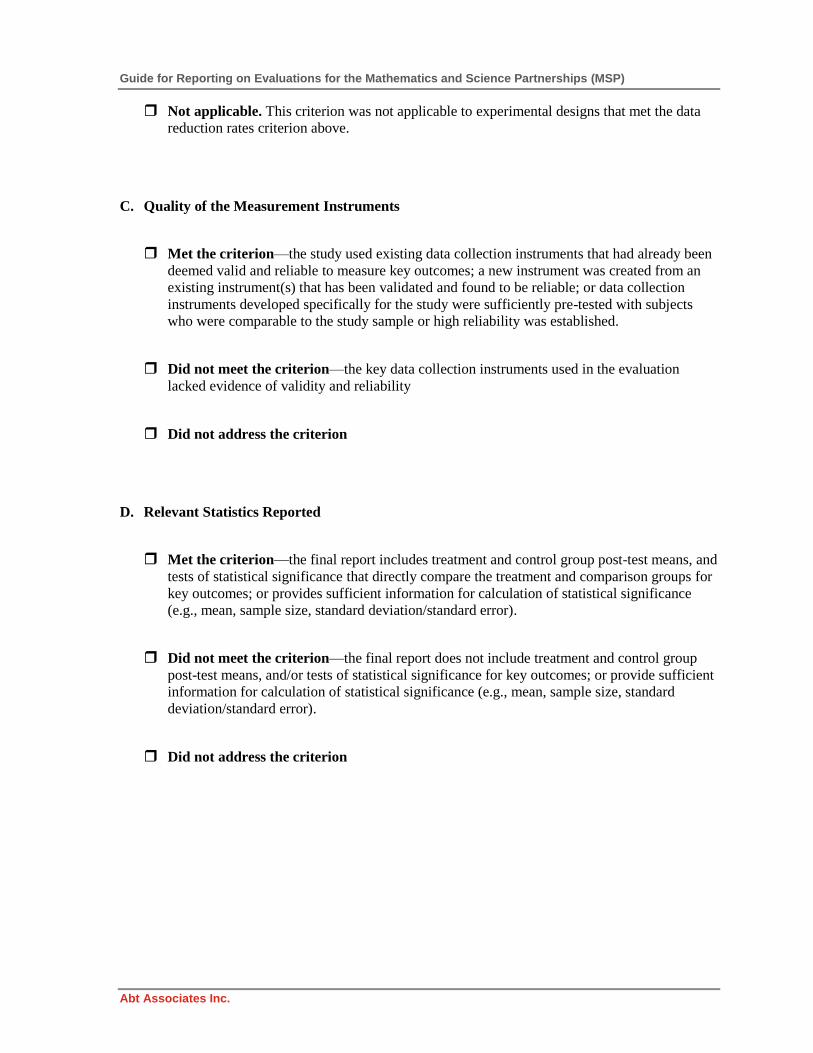
Not applicable. This criterion was not applicable to quasi-experimental designs unless it was
required for use in establishing baseline equivalence (see the Baseline Equivalence of Groups
criterion below).
B. Baseline Equivalence of Groups
Met the criterion (quasi-experimental studies). There were no significant pre-intervention
differences, as defined below, between treatment and comparison group participants in the
analytic sample on the outcomes studied, or on variables related to the study’s key outcomes.
Two groups are considered to have baseline equivalence when:
the mean difference in the baseline measures was less than or equal to five percent of
the pooled sample standard deviation; or
the mean difference in the baseline measures was more than five percent but less than
or equal to twenty-five percent of the pooled sample standard deviation, and the
differences were adjust for in analyses (e.g., by controlling for the baseline measure);
or
If the data required for establishing baseline equivalence in the analytic sample were
missing (and there was evidence that equivalence was tested), then baseline
equivalence could have been established in the baseline sample providing the data
reduction rates criterion above was met.
Met the criterion (experimental evaluations that did not meet the data reduction rates
criterion above). There were no significant pre-intervention differences, as defined above,
between treatment and comparison group participants in the analytic sample on the outcomes
studied, or on variables related to the study’s key outcomes.
Did not meet the criterion. Baseline equivalence between groups in a quasi-experimental
design was not established (i.e. one of the following conditions was met):
A. Baseline differences between groups exceeded the allowable limits; or
B. The statistical adjustments required to account for baseline differences were not
conducted in analyses; or
C. Baseline equivalence was not examined or reported in a quasi-experimental evaluation
(or an experimental evaluation that did not meet the data reduction rates criterion
above) and the necessary information was not provided such that reviewers could
calculate it themselves.
Guide for Reporting on Evaluations for the Mathematics and Science Partnerships (MSP)
Abt Associates Inc. ▌pg. 22
Not applicable. This criterion was not applicable to experimental designs that met the data
reduction rates criterion above.
C. Quality of the Measurement Instruments
Met the criterion—the study used existing data collection instruments that had already been
deemed valid and reliable to measure key outcomes; a new instrument was created from an
existing instrument(s) that has been validated and found to be reliable; or data collection
instruments developed specifically for the study were sufficiently pre-tested with subjects
who were comparable to the study sample or high reliability was established.
Did not meet the criterion—the key data collection instruments used in the evaluation
lacked evidence of validity and reliability
Did not address the criterion
D. Relevant Statistics Reported
Met the criterion—the final report includes treatment and control group post-test means, and
tests of statistical significance that directly compare the treatment and comparison groups for
key outcomes; or provides sufficient information for calculation of statistical significance
(e.g., mean, sample size, standard deviation/standard error).
Did not meet the criterion—the final report does not include treatment and control group
post-test means, and/or tests of statistical significance for key outcomes; or provide sufficient
information for calculation of statistical significance (e.g., mean, sample size, standard
deviation/standard error).
Did not address the criterion