a guide to our company -...
TRANSCRIPT

A GUIDE
TO OUR
COMPANYANNUAL REPORT 2012-13

NetComm Wireless builds devices that connect machines, networks and people worldwide

Annual Report 2012-2013 - NetComm Wireless - 1
Table of Contents
Chairman’s Report 2
Managing Director’s Report 4
Board of Directors 6
Highlights 8
Our Innovation 10
Our Strategy 12
M2M in Healthcare 14
M2M in Transportation 16
M2M in Point-of-Sale 18
M2M in Asset Management 20
M2M in Utilities 22
M2M in Business Services 24
Keeping business connected 26
Corporate Governance 28
Financials 30

2 - NetComm Wireless - Annual Report 2012-2013
Chairman’s Report
During fiscal 2013, we continued NetComm Wireless’ transition from a consumer based technology developer to a company focused on wireless M2M, an endeavour set in motion in the second half of fiscal 2011. The costs associated with this transformation have impacted statutory profit for 2012/2013, but these short-term impacts will be more than offset by the long-term advantages of wireless M2M.
Our M2M successes show that we implemented the right strategy at the right time. We had the foresight to shift our focus ahead of substantial M2M market growth, and a number of major supply contracts and distribution partnerships have been secured as a result. With a solid sales pipeline and long-term contracts with global carrier and channel partners now in place, we expect to see strong growth in revenue and earnings over the coming years.
2013 Financial PerformanceRevenue for the year ended 30 June 2013 was $42.9 million, $16.5 million below the previous year.
Earnings Before Interest, Tax, Depreciation and Amortisation (EBITDA) from continuing operations was $803,000, in line with previous guidance, and an underlying EBITDA of $1.6 million was generated after excluding $0.5m, unrealised foreign exchange losses on the Company’s US$ denominated borrowings as well as $0.3 million restructuring costs taken during the year.
Successful $5.7 million capital raising On 3 June 2013, NetComm Wireless announced the successful completion of a $5.0 million equity placement. The placement was substantially oversubscribed, supported by existing shareholders as well as a number of new institutions and sophisticated investors.
A Share Purchase Plan (SPP) was offered to eligible shareholders, which was also oversubscribed and scaled back to raise an additional $700,000. The SPP shares were allotted on 28 June 2013.
2013 was a significant year for NetComm Wireless. We achieved solid progress
against the strategic priorities announced in 2011/2012, successfully positioning the
Company for the future in terms of product innovation, commercial flexibility and
continued growth in the global Machine-to-Machine (M2M) market.

Annual Report 2012-2013 - NetComm Wireless - 3
Dividend policy The Directors decided to preserve cash and not pay a dividend for 2013 because of the Company’s continued investment in its global expansion, with a particular focus on the growth opportunities presented by significant M2M growth across all vertical industry sectors worldwide. NetComm Wireless’ dividend policy will be reinstated as soon as it is deemed prudent.
Despite reinvesting for growth in the global M2M market, NetComm Wireless’ balance sheet was strengthened through a reduction of net debt, which was reduced from $5.3 million in fiscal 2012 to $3.2 million in fiscal 2013.
A resilient share price has been maintained due to NetComm Wireless’ strategy to underpin its position in the wireless M2M market through the securing of long-term contracts that will continue to deliver long-term returns for the Company and its shareholders. We have actively engaged new investors over the past year and, coupled with our successful capital raising, NetComm Wireless’ share price has sustained a steady position.
I am encouraged by the progress made to date by the three committees that were established to help the Board fulfil its responsibilities in the areas of: Nominations and Remuneration; Audit and Risk Management and Investor Relations. As chair of the Investor Relations committee, considerable time was spent engaging with investors on issues ranging from executive remuneration to capital management, and I am committed to further strengthening our shareholder communications.
We remain committed to creating greater long-term value for our customers, partners and shareholders; and remain focused on delivering on our fiscal 2014 priorities through continued innovation, a disciplined approach to capital management and increased market share as global demand for custom M2M technologies continues to grow.
The outstanding achievements of the past year demonstrate the strength of our strategy and the quality of our people. Our culture of innovation is what sets us apart and on behalf of the Board, I would like to thank our Managing Director and CEO, David Stewart, and his senior management team and staff for their exceptional contribution and commitment.
I am excited about the opportunities we see in fiscal 2014 and beyond, and I would like to thank you, our shareholders, for your continued support and confidence.
Justin MilneChairman
4 - NetComm Wireless - Annual Report 2012-2013
Over the past year, we achieved a balance between maintaining existing processes where appropriate and making modifications where needed, while continuing our transition to wireless M2M. We heightened our competitive advantage through scalable production and tailored solutions, and continued to cultivate relationships with market leading telecommunications companies and enterprise partners as part of our ‘coat-tails’ strategy which enables us to significantly reduce the risks involved with growing and diversifying across geographies and markets.
We continued to invest in the acquisition of additional engineering and sales capabilities to support global growth, realigned resources to support key opportunities and strengthened our operational efficiencies. We remained focused on working with our strategic carrier and channel partners to deliver cutting-edge technologies to value added resellers, system integrators and vertical industry sectors worldwide.
Working with industry-leaders in the M2M spaceVodafone Global Enterprise approved the MachineLink 3G for mass production and global deployment in the third quarter of fiscal year 2013; and we expect volumes to increase substantially over the next two to five years with Vodafone currently targeting the top 1,500 companies worldwide.
Also in the M2M space, we expect additional volume from Cubic Transportation, South East Water and other M2M contracts. With a lag between contract and delivery, we anticipate that volumes from these contracts and others in the pipeline will build substantially in fiscal year 2015 and beyond.
We secured strategic distribution agreements with SYNNEX in North America in order to support our long-term M2M growth strategy which centres on the delivery of wireless M2M technologies to vertical markets across North America as well as the UK and Europe. These distribution partnerships will drive volume growth and profitability in line with our continued penetration of the global M2M market.
The smart meter opportunityWe set our sights on the smart meter market in 2011, and are now engaged in one of the largest 3G smart meter deployments to date – the Victorian Government’s mandatory state-wide rollout of smart meters. We have a supply contract with Ericsson and as announced to the market in May 2013, the initial order will represent revenue of AUD $12.5 million to NetComm Wireless with all of this revenue to be earned in fiscal 2014.
Managing Director’s ReportNetComm Wireless made good progress this year. The Company strengthened its
position as a leading developer of wireless Machine-to-Machine (M2M) devices,
further expanded into the fast growing global M2M sector and focused investment in
areas that will deliver long-term returns.

Annual Report 2012-2013 - NetComm Wireless - 5
Further smart meter opportunities are also being pursued in Europe, Middle East, USA and Australasia. This year we entered into our second major M2M supply agreement with Mobily to support the strong demand for wireless M2M communications across industry sectors such as utilities, oil and gas and transport and other businesses located in areas with limited access to fixed line (ADSL, cable, fibre) services.
A focus on innovationOne of our key differentiators is our ability to innovate and adapt ahead of network advances and fast evolving market transitions, and we remain focused on capturing the opportunities created by these transitions. A significant current transition is the shift to flexible M2M application development to support specific functions such as: energy management (Ericsson, smart metering); transport ticketing (Cubic Transportation); sea level monitoring (Bureau of Meteorology) and sewer station control (South East Water). Our innovative open source approach will continue to drive the uptake of M2M across diverse industry sectors by removing the roadblocks to developing customised M2M applications.
We have also identified business continuity as a key growth area as the cost of Internet downtime escalates in line with increased business automation and reliance on IP-bases services such as Point of Sale (PoS), VoIP, M2M and cloud-based systems.
In recognition of NetComm Wireless’ solid commitment to innovation, we are pleased to have won the prestigious 2013 ACOMMS Award for Innovation and three categories of The Australian Business Awards 2013: Business Innovation; Best Industrial Product and Product Innovation for the second consecutive year.
Looking aheadNetComm Wireless expects to generate substantial growth from fiscal 2014 onward as it secures further M2M contracts in line with our strategic plan to grow M2M market share.
The change of government may impact the timing of our deliveries relating to our contract with Ericsson for the supply of fixed-wireless devices for the National Broadband Network (NBN).
Our strategy remains focused on operational excellence and growing our share of the global M2M market, while also enhancing margins in the fast growing business continuity and rural broadband markets.
With 50 per cent of organisations worldwide expected to have adopted M2M by 2015, and 78% citing M2M as crucial to business success, there will be increased demand for the wireless M2M technology that we develop and we remain optimistic about the long-term outlook for NetComm Wireless.
I thank you and all of our employees for your continued support. We have pursued a consistent strategy and laid the groundwork for future growth, and I am certain that when I report back to you on our progress at this time next year, we will have built an even stronger Company which remains committed to creating greater value for our shareholders.
David StewartCEO and Managing Director

6 - NetComm Wireless - Annual Report 2012-2013
Justin Milne ChairmanIndependent Non-ExecutiveMr Milne has substantial telecommunications industry experience and he is an experienced company director having served in diverse industry sectors with a multinational focus. He had an executive career in telecommunications, marketing and media. From 2002 to 2010 he was Group Managing Director of Telstra’s broadband and media businesses, and headed up Telstra’s New Media businesses in China. He is currently a Non-Executive Director of Tabcorp Holdings Limited and Members Equity Bank Pty Ltd. He is also a board member of Basketball Australia and Sydney Children’s Hospital Foundation.
David Stewart Chief Executive Officer and Managing Director Mr Stewart is an experienced CEO and successful entrepreneur with more than 30 years in management and business leadership roles. David founded Banksia Technology Pty Limited in 1988 and successfully managed the company as a fast growing and highly profitable business.
In 1996, he instigated the successful takeovers of a number of his competitors, including NetComm Limited, which was completed in November 1997. David assumed the role of Managing Director of the merged entity and remains the single
largest shareholder of NetComm Wireless Limited. David has a strong financial background, extensive experience in sales and marketing and has a strong interest in new technologies.
Ken Sheridan CFOExecutive Director Mr Sheridan joined the Board in December, 2010. He is a chartered accountant with over 30 years’ experience in senior management roles. Ken provides advice and direction on financial, HR, IT, risk management and company secretarial matters as well as business strategy. He is actively involved in the Company’s business planning and review activities and is also responsible for the design and implementation of the Company’s governance framework.
Ken BoundyDirector Independent Non-ExecutiveMr Boundy joined the Board in August, 2012 and is Chairman of the Nominations and Remuneration Committee.
He is currently Chairman and/ or non-executive director on four boards, member of two advisory boards and part owner of two businesses. Ken has held a number of prominent positions over the past thirty years including: Managing Director of the Australian Tourist Commission,
Tourism Australia; Executive General Manager, International, of James Hardie Industries Limited; Group General Manager, Corporate Development, of Goodman Fielder Limited (GFL); CEO, of Goodman Fielder Asia, Singapore (GFA) and Director, Industry Development, of the Victorian Department of Industry Commerce and Technology.
Stuart Black, AMDirectorIndependent Non-ExecutiveMr Black joined the Board in March, 2013 and is Chairman of the Audit & Risk Committee.
Mr Black is a prominent Chartered Accountant and experienced Company Director. He is the former Managing Partner in the chartered accounting firm Chapman Eastway and has extensive experience in professional services, agribusiness, financial services, manufacturing, import, distribution, IT and biotechnology. Mr Black is Non-Executive Director of Australian Agricultural Company Limited and Coffey International Limited, Chair of Chartered Accountants Benevolent Foundation Ltd and a Non-Executive Director of The Country Education Foundation of Australia Ltd. He was the former acting Chair and current Director of the Accounting Professional and Ethical Standards Board Ltd and Past President of the Institute of Chartered Accountants in Australia.
Board of Directors

Annual Report 2012-2013 - NetComm Wireless - 7
Justin Milne Chairman
Independent Non-Executive
Ken Sheridan Chief Financial Officer
Executive Director
Ken Boundy DirectorIndependent Non-Executive
David Stewart Chief Executive Officer & Managing Director
Stuart Black, AM Director
Independent Non-Executive

8 - NetComm Wireless - Annual Report 2012-20138 - NetComm Wireless - Annual Report 2012-2013
1
2 3
4
5
6
7

Annual Report 2012-2013 - NetComm Wireless - 9
The Vodafone MachineLink 3G hits the global M2M market Since its official launch by Vodafone at the Mobile World Congress 2013, the Vodafone MachineLink 3G has been approved for mass production and global deployment.
NetComm Wireless wins big for the second year running• 2013 ACOMMS Award for Innovation • 2013 Australian Business Award for Business Innovation• 2013 Australian Business Award for Product Innovation• 2013 Australian Business Award for Best Industrial Product
Working with Ericsson on one of the world’s largest 3G smart meter rolloutsEricsson selected NetComm Wireless to supply the 3G communications card component of the rollout of smart meters to a Victorian electricity utility.
Driving M2M growth in the Middle East with MobilyNetComm Wireless entered into a second major Machine-to-Machine (M2M) supply agreement with Mobily, a leading telecommunications service provider in the Kingdom of Saudi Arabia.
The multi-award winning Outdoor Router makes its global debutThe Outdoor Router (NTC-30) is the first device of its kind successfully launched by: Telstra (Telstra Outdoor Gateway) and Mobily (NTC-30WV).
Agreement with Etisalat group to supply M2M technologies in the Middle East, Asia and Africa The agreement extends NetComm Wireless’ M2M product portfolio to the operations of Etisalat Group in fifteen countries providing widespread access to M2M solutions and services in areas such as smart metering, mHealth, digital signage, transportation and security.
A new choice for North America’s M2M marketNetComm Wireless and SYNNEX sign distribution agreement to enhance M2M and end-to-end mobility solutions services to more than 8,000 resellers in Canada and the USA.
Highlights
Annual Report 2012-2013 - NetComm Wireless - 9
1
2
3
4
5
6
7

10 - NetComm Wireless - Annual Report 2012-2013
What started out as a small team responsible for developing Australia’s very first
modem is today recognised as one of the world’s most innovative companies.
Our strength is in our ability to see waves in technology, assess the benefits and pioneer change ahead of network advances and market trends.
Our technological innovations are focused on:
• Wireless M2M devices that connect equipment such as utility metres; vehicles; PoS terminals, security cameras; medical devices, machines and systems to enable real-time awareness and control
• Superfast fibre and 4G/LTE network access devices designed to meet the phenomenal demand for data which is doubling each year
• Business continuity devices where businesses can rest assured that their businesses will stay on line with wireless broadband in the event their fixed line connection fails
Our innovatorsOur business was built on the strength of our innovators and our culture of innovation underpins our achievements. We have attracted, developed and retained the people needed to innovate leading-edge wireless M2M technologies designed to transform the way the world communicates. With the resources and systems in place to encourage, nurture and grow new ideas, innovators across our research and development (R&D), marketing, product management, sales and operations teams add ongoing value to our organisation.
OurInnovation

Annual Report 2012-2013 - NetComm Wireless - 11
Extend broadbandMulti-award winning Outdoor Router Series
(NTC-30) routers are the first and only technology
to optimise 3G/4G signal strength and eradicate
black spots by attaching to the outside of a
premise to create a powerful indoor/outdoor WiFi
network virtually anywhere.
Decrease downtimeInternet downtime is costly in terms of revenue,
productivity and output for businesses, and can
be life threatening in vertical sectors such as
health and meteorology. NetComm Wireless has
equipped devices with multi-system monitoring
and automatic failover to keep communications
up and running.
Future ready
NetComm Wireless was the first to introduce
technologies that provide a future-proof central
connection point for all online activities with
support for changing user requirements,
emerging technologies and network upgrades
through innovation.
Connect machines
A global push for real-time asset monitoring
and management across all industry verticals
requires a solution that covers a diverse range
of applications and deployments. Our M2M
devices run on an open source Linux platform,
familiar to millions of developers worldwide. This
combined with our Software Development Kit
removes many of the roadblocks to developing
customised M2M applications.

12 - NetComm Wireless - Annual Report 2012-2013
Our strategic priority is to create long-term shareholder value by continuing to lead
innovation, capture global expansion opportunities, grow our Machine-to-Machine
(M2M) business, build partnerships and sustain our unique differentiators.
Due to the fast evolving nature of our industry, we have implemented a clear strategy
which is regularly reviewed by the Board to ensure the most advantageous mix of
growth, efficiency, risk and return.
OurStrategy
Global expansion strategyOur global growth strategy involves expanding our customer base and winning long-term contracts in targeted overseas markets through strategic partnerships; and identifying customers that will deliver sustainable revenues and appropriate margins.
Our efforts are heavily concentrated on global 3G/4G markets, with a particular focus on wireless M2M communications which is innovating the way that every ‘thing’ communicates. We are transitioning from a company that transformed consumer communications into a company that is now pioneering M2M communications through the development of technologies that support the remote monitoring and management of equipment and systems across diverse vertical industry sectors including: health, retail, utilities, security, transport, meteorology and mining.
Growing our M2M businessOur strategy is to sustain long-term growth in the global M2M market by leveraging cross industry opportunities and partnerships based on three key models:
1. Project based supply2. Telecommunication carrier partnerships3. Distribution / channel partnerships
Project based supplyOur key differentiator is our ability to deliver custom designed communication devices to meet the specific software and hardware requirements of our industry partners and enterprise customers. To deliver this capability requires expertise in a broad range of areas including solution architecture, network expertise and the ability to integrate our product design into the application.
Our adaptable approach has enabled us to secure project based M2M supply deals in areas such as energy utilities, security, healthcare and ticketing.

Annual Report 2012-2013 - NetComm Wireless - 13
Telecommunication carrier partnershipsTo deliver on our strategy and meet the challenges of the fast evolving technological environment, we are building strong and enduring partnerships with leading telecommunications carriers such as: Telstra; Vodafone Global Enterprises; Rogers & TELUS in Canada; Etisalat and Mobily in the Middle East and Telecom New Zealand.
We will continue to strengthen our position in the global M2M market, reduce risk and create market value through our coat-tails strategy of working with large organisations to capture opportunities in global markets.
Distribution / channel partnershipsExpanding our partner network presents an exciting growth opportunity for NetComm Wireless. We partner with experienced, established and respected channel partners to help extend our reach into new geographies and vertical markets. Our strategy is to take a selective approach, engaging partners with strong technical expertise and considerable vertical market experience. We provide access to a diverse range of marketing resources and intellectual property to help differentiate our products and add value to resellers, system integrators and vertical market sectors.
In delivering on our channel partner strategy we have signed a key supply contract in North America with SYNNEX Corporation.
Innovation strategyFor over 31 years we have launched several first-to-market product innovations and our strategy is to continue this momentum by: staying ahead of network and market changes; investing in our engineers and R&D resources and cultivating a culture of innovation across every department by encouraging and rewarding new ideas.
Our innovation strategy involves:
• Growing an innovative wireless M2M, business continuity and wireless product portfolio designed to meet the unique requirements of industrial markets worldwide
• Sustaining multifaceted knowledge of wireless technologies, market trends and network evolution
• Developing products that can be customised to meet the requirements of different regions and vertical industry sectors worldwide
• Fostering continued growth through the development of our own intellectual property
• Delivering advanced hardware, firmware and software solutions
• Growing our software development team to deliver innovative firmware features
• Reducing reliance on 3rd party R&D suppliers to further strengthen our intellectual property
• Improving our knowledge of modules and chipsets to help refine our product features
• Continuing to improve end user experience through continuous refinement of our user interface
• Working closely with our customers to innovate products designed to help them grow in existing markets
Unique differentiators Customisation is our key differentiator. We seek to achieve a significant advantage over competitors that develop ‘one size fits all’ products by engineering technologies designed to meet our customers specific requirements such as the products features, design, budget or delivery timeframe. Long-term contracts that provide sustainable revenue are won by working closely with customers that require specialised devices for diverse and unique applications. Rather than compete in high volume, low price market segments, our strategy is to develop high-performance specialised and customised devices for leading companies globally.

14 - NetComm Wireless - Annual Report 2012-2013
M2M in Healthcare Healthcare needs are shifting as the population ages. A growing shortage of
doctors and healthcare professionals in rural and regional communities is coinciding
with an aging demographic and chronic illness epidemic – making reliable M2M
communications for remote healthcare more critical than ever.

Annual Report 2012-2013 - NetComm Wireless - 15
For many patients, making regular trips to a hospital or medical centre simply isn’t possible, meaning healthcare providers need to help patients overcome distance barriers by finding innovative new ways to provide personalised care.
A NetComm Wireless M2M device gives practitioners and their patients a whole new level of flexibility and freedom by enabling the remote tracking, monitoring and control of medical devices over a wireless 3G/4G network.
Freedom for patientsConnecting patients and medical equipment to doctors over a wireless 3G/4G network means more control over treatment schedules and the freedom to get on with life. With medical professionals now able to remotely monitor and analyse data relating to blood pressure, heart rate and blood levels, the need for face-to-face checkups can be significantly reduced.
As well as monitoring health, NetComm Wireless’ wireless M2M devices can be used to maintain health for patients needing ongoing therapy, such as dialysis treatment for renal failure. Rather than sit in a sterile clinical environment for hours on end, patients can now be treated in the comfort of their own homes with the peace of mind that their doctor is watching.
Flexibility for practitionersThe opportunities are endless for doctors wanting to provide clinical healthcare remotely by monitoring and controlling medical equipment, or connecting with their patients via video over a wireless network.
Making the best use of available resources is now more vital than ever as increasing demands are placed on the healthcare sector. With tight certification regulations around the use of medical equipment, organisations are choosing not to integrate communications intelligence into individual pieces of medical equipment. Instead, wireless M2M devices are deployed to create a connection that can be shared between any number of Ethernet-enabled medical machines without the need to certify each device.

16 - NetComm Wireless - Annual Report 2012-2013
M2M in TransportationWhether transporting people, products or produce, real-time awareness is critical for
enabling cost-effective improvements to efficiency, safety, maintenance, logistics and
customer loyalty.

Annual Report 2012-2013 - NetComm Wireless - 17
Mobile by nature, the transportation sector represents one of the greatest opportunities for wireless M2M. The live observation and management of trucks, buses, trains, ships and other vehicles over global 3G / 4G networks supports applications such as: electronic ticketing, asset tracking, road freight, fleet management, security emergency / roadside assistance, vehicle recovery, traffic information, navigation and voice.
Public transportM2M supports the global shift to cashless transport systems that will see cash and paper tickets replaced with smartcards that commuters can link to online accounts, or credit and debit cards to improve the fare collection process, eliminate cash handling risks and to improve business efficiencies with live access to customer data.
NetComm Wireless has developed 3G M2M devices for the Australian NSW State Government’s integrated electronic ticketing system which is set to operate across the state’s public ferries, trains and buses. The technology can also be adapted to connect multiple devices such as video surveillance cameras, digital displays and GPS systems to 3G.
Commercial transportIn the commercial road and sea freight sector, wireless M2M supports the remote monitoring, management and regulation of vehicles, their devices and their loads. NetComm Wireless’ 3G M2M devices improve supply chain productivity by enabling: improved management and asset coordination, visibility of inventory movements along the supply chain, information to proactively manage driver behaviour, vehicle speeds, loading, engine performance and fuel consumption as well as the improved management of regulatory and compliance obligations.
Emergency transportEmergency services cover a diverse and challenging range of M2M requirements in areas such as remote diagnostics, messaging, vehicle management, real-time tracking and traffic information. The ability to transmit information back to a central emergency centre dramatically improves the effective handling of emergency situations.
Emergency vehicle cameras can be monitored 24/7 to observe traffic congestion, general incident or emergency situations that may arise. Streaming video, audio and text via a web interface, can prepare hospitals for incoming patients and provide in-transit care from the information being relayed.

18 - NetComm Wireless - Annual Report 2012-2013
M2M in Point-of-Sale Retailers, supermarkets, restaurants, service stations and other businesses that
were once restricted to permanent locations with costly and cumbersome fixed
line services can now utilise wireless Point-of-Sale (POS) terminals to set up shop
virtually anywhere.

Annual Report 2012-2013 - NetComm Wireless - 19
With access to wireless networks, fast and secure transactions can be made at events, trade fairs, exhibitions, markets, carnivals and other outdoor and temporary locations. Wireless POS systems also allow trades people, couriers, taxis and other businesses that operate on the move to save time, streamline processes and improve customer convenience by processing on the spot payments at the job site or on the road. Whether selling goods or services, a NetComm Wireless 3G M2M device gives any business the freedom to operate anywhere.
M2M in Point-of-Sale
POS anywhereAs consumers become more mobile, it is critical that businesses have the flexibility to trade at any location.
Using a wireless POS terminal, secure real-time payments can be made wherever wireless network coverage exists meaning businesses can benefit from faster transactions and the ability to increase revenue by making sales where fixed line connectivity is unavailable or unfeasible.
Smart salesAs well as offering flexibility and mobility, wireless Machine-to-Machine (M2M) retail applications reduce costly phone line rental costs, do away with cluttered wires and cables and can be used to track purchases and communicate information for improved supply chain management.
Wireless POS can also be used to support self-service solutions, customer profiling and other value-added customer applications.
Mobile wallets NFC-ready POS terminals are on the rise with Berg Insight forecasting that the global installed base of NFC-ready POS terminals will grow at a compound annual growth rate (CAGR) of 49.4 percent from 3.9 million units in 2011 to 43.4 million units in 2017. Mobile wallet services provide retailers with the opportunity to engage customers in real-time while they are making purchasing decisions by providing personalised offers in-store; while also supporting value-added services such as loyalty cards and deal coupons.

20 - NetComm Wireless - Annual Report 2012-2013
M2M in Asset Management Faced with increased challenges and demands, industry must become ever more
efficient, productive and sustainable to succeed. Seizing a competitive advantage is
all about finding effective new ways to monitor, measure and manage business assets
such as site equipment, machines, vehicles and systems.

Annual Report 2012-2013 - NetComm Wireless - 21
Assets that work solo lack the Machine-to-Machine (M2M) communication capabilities needed to drive down costs and achieve a high degree of accuracy, consistency and safety. M2M gives industry the freedom to connect, monitor and control remote assets from virtually any location, making it simpler to manage system inconsistencies, control operations and reduce manual labour costs.
Sending technicians to perform maintenance tasks or troubleshoot problems can be costly and time consuming, particularly for industries such as mining, agriculture, forestry and meteorology which are often based in isolated locations or dispersed across vast and difficult to access areas.
M2M can be used to monitor and control remote equipment and systems over 3G in real time to help businesses detect and respond to maintenance issues, protect and manage assets, maintain continuity, boost productivity and cut costs.NetComm Wireless’ 3G M2M devices increase visibility into how remote assets are performing, empowering businesses to take control.
Access assets anywhereWireless communication is often the only option for industries based in remote or inaccessible areas. With 3G, industries operating in isolated locations, or spread across difficult to access areas, have the freedom to access assets remotely.
With a clear view of asset conditions from virtually any location, businesses can save time and money with a fast response to faults or security breaches. Using wireless M2M communications, malfunction alerts and accurate status information relating to temperature, location, fuel level, pressure, usage and performance can be sent to the office over 3G for immediate action.
NetComm Wireless’ 3G M2M devices optimise processes and enhance business efficiency with the power of real time awareness.
Commanding controlWhether responding to a fault or failure alert, performing scheduled maintenance or installing an upgrade, with simple access to 3G remote assets can be managed from virtually any place, at any time without human intervention.
Devices transmit real time data relating to their condition so organisations can take control by restarting systems, adjusting temperature levels, regulating pressure and making upgrades over 3G to avoid costly and inefficient manual processes.
SafetyM2M enabled machines can also protect workers by taking on tasks in dangerous environments. Remotely controlled assets and equipment can step in where heat or hazardous substance levels are deemed unsafe and can be used to improve workplace safety by doing the heavy lifting and endurance work.

22 - NetComm Wireless - Annual Report 2012-2013
M2M in Utilities ‘What gets measured gets managed,’ Peter Drucker.
Because electricity cannot be typically stored, and consumption patterns fluctuate
across days, seasons and regions – for utilities to better manage energy, supply into
the grid must match real-time usage.

Annual Report 2012-2013 - NetComm Wireless - 23
The difference between peak and average demands on the grid can be substantial; but spending billions on expanding networks to meet peak demand, which spikes less than 1 per cent of the time, is no longer viable.
Unlike conventional utility service meters which use electro-mechanical counters to record only the most basic consumption information on a quarterly basis, smart meters automatically record and relay usage data at regular intervals to precisely measure energy use, thereby taking pressure off networks by giving consumers the ability to shift consumption to off peak times of the day.
Smart energy For the customer, smart energy is all about using smart meters to save energy with the insight needed to avoid using clothes dryers, air conditioners and other high energy pieces of equipment during high-demand periods. Detailed usage information also offers financial savings to customers that choose to move their consumption to lower-prices periods; and accurate billing eliminates the potential for bill shock resulting from estimated charges.
Utilities benefit from the ability to: avoid manual meter reading costs, improve customer service, fully automate billing systems, automatically determine load profiles, improve efficiency and remotely monitor and manage grid assets.
Smart waterWater, sewerage, trade waste and water saving services can be monitored and managed using smart meters to automatically transfer data to a central host system over 3G. In the same way that energy utilities use smart meters to manage energy, water utilities can achieve cost savings and efficiency benefits using smart meters to enable the undisrupted remote observation and control of pumped sewer systems, water reserves, tanks and other equipment from any location without fixed-line limitations. Water utilities can also deploy a NetComm Wireless 3G M2M device to take data from the Serial port, and using the embedded IP stack, send it over a 3G network to any IP network enabled device such as a computer, tablet or smart phone.
Smart metersSmart meters record and relay usage data at regular intervals, allowing for the precise measurement of energy and water use, offering a range of benefits to both the consumer, the utility and the environment.
NetComm Wireless designs, develops and manufactures Grid Net-enabled 3G wireless communications cards for the global smart grid market and plays a key role in the communications component of smart metre deployments both in Australia and throughout the world.

24 - NetComm Wireless - Annual Report 2012-2013
M2M in Business Services Today’s businesses operate in a fast-paced ‘always-on’ environment. Products
and services are delivered around-the-clock via vending machines and kiosks;
and information relating to flight times, traffic alerts, retail sales, exchange rates
and even the score at sporting events can be communicated to audiences
in real time using digital signage.

Annual Report 2012-2013 - NetComm Wireless - 25
Wireless Machine-to-Machine (M2M) gives businesses the ability to monitor and manage remote assets such as vending machines and kiosks; while allowing for live updates to digital signs which are flourishing around airports, cinemas, shopping centres, medical centres, sporting events and train stations to promote, inform, educate and entertain.
With the right 3G M2M technology in place, businesses can remotely observe stock levels, manage inventory, communicate with customers in real time and reduce the cost and time involved with sending staff on the road.
M2M in Business Services
Connecting anywhere Digital displays once required a costly fixed line connection to connect to the Internet, or else time and money would be wasted sending technicians to individual sites to manually load new content to the sign’s hard drive.
Today, digital displays are springing up everywhere as access to 3G networks provides the freedom to install signs at outdoor sites such as bus stops or events and to switch between locations. Vending machines and interactive kiosks can also be moved between locations and setup at temporary locations such as outdoor festivals and events.
With easy access to 3G, an entire network of screens across multiple locations can be simultaneously updated in real time from a central location ensuring that businesses get the right message to the right people at the right time.
Connecting with customersIn a world of sensory overload, attracting attention is all about standing out in the crowd. Remote access to digital displays, vending machines and kiosks enables a two-way flow of information over 3G, making it easy to interact with the target audience through the machine.
Using M2M, digital signs can also engage customers through mobile and touch technologies, while allowing live behavioural and demographic information to be captured sent to a central office for analysis.
Cost savingsVending machines and kiosks that interact over 3G send real time sales data to a central database so pricing can be automatically adjusted in line with demand. Designed to provide supersized savings, NetComm Wireless’ 3G M2M devices streamline business operations by sending consumption information to the operator over 3G to reduce the cost of manual checks, ensuring that machines are never out of stock.
Savings are also achieved by anticipating faults or requirements such as ink levels in photo kiosks, and helping operators drive sales with cashless payments and by influencing customers with direct interaction.

26 - NetComm Wireless - Annual Report 2012-2013
escalation of the cost of downtime between 2010-2012 $138,000
the average cost of an hour of downtime for internet reliant businesses
39.6hoursaverage amount of disruption due to internet outage experienced annually
30%of midsize companies are expected to have recovery-in-the-cloud by 2014
In today’s around-the-clock business environment, maintaining a solid Internet
connection in the event of primary connection failure is vital.
Keeping businessconnected
38%

Annual Report 2012-2013 - NetComm Wireless - 27
Whether the threat is a disaster in the form of a Tsunami, hurricane, flood or fire, or simply a disturbance caused by a network outage or technical fault, achieving ‘always-on’ connectivity is now more critical than ever as businesses of all sizes become more automated and reliant on IP-bases services such as Point of Sale (PoS), VoIP, Machine-to-Machine (M2M) and cloud-based systems.
According to a recent report by Aberdeen Group, increased dependence on the Internet resulted in a 38% escalation of the cost of downtime between 2010-2012. Losing a network connection is a very real risk and a primary concern for businesses worldwide with 74% of the 459 organisations across 49 countries surveyed by the Business Continuity Institute identifying unplanned IT and telecom outages as being the number one threat to business continuity.
In an increasingly cashless economy, even a short disruption can have a considerable impact with the average cost of an hour of downtime hitting $138,000. Depending on the continuity solutions in place, businesses can experience up to 39.6 hours of disruption annually. As well as significantly affecting revenue, this can severely impact productivity, customer service and credibility.
Keeping the network connection up and running is also critical for M2M applications which are moving to the cloud thanks to the incentive of scalability, performance and the reduction of upfront investment barriers. The cloud is increasingly used for disaster recovery as a service (DRaaS), backup and business continuity with InformationWeek reporting that 23% of respondents have already incorporated cloud services into their
business continuity and disaster recovery strategies. Forrester Research came to a similar conclusion, having found that as many as two thirds of enterprises surveyed have adopted, or are interested in, DRaaS.
With reliance on the cloud at an all time high, guarding against the threat of network failure is essential because if the Internet connection is lost, so too is access to the cloud.
Should the primary interface (which is most often a fixed line ADSL, cable or fibre connection) fail, Internet-critical businesses can confidently sustain their revenue and uphold their reputation using a wireless continuity and recovery solution.
Progressive businesses have long recognised the economic and practical benefits of using wireless technology for a fully redundant solution. 3G/4G mobile broadband offers a failover solution that can be cost-effectively deployed across multiple sites, making it a flexible backup option for businesses that operate multiple food outlets, retail stores or business branches. With 30 per cent of midsize companies expected to have recovery-in-the-cloud services in place by 2014, 3G/4G failover offers an economical complimentary solution.
NetComm Wireless has identified business continuity as a critical need, developing a solid portfolio of high-speed 3G/4G WiFi devices equipped with automatic failover to protect businesses from lost revenue, customer dissatisfaction and a breakdown of internal and external communications.

28 - NetComm Wireless - Annual Report 2012-2013
Principle 1 – Lay solid foundations for management & oversight The Board of Directors is responsible for the corporate governance of the Group and operates in accordance with the principles set out in its Charter, which is available in the corporate governance section of NetComm Wireless Limited’s (the Company’s) website. To ensure that the Board is well equipped to discharge its responsibilities it has established guidelines for the nomination and selection of directors and for the operation of the Board. A summary of the Board Charter is available on the Company’s website.
The responsibility for the operation and administration of the Group is delegated by the Board to the Chief Executive Officer (‘CEO’) / Managing Director (MD) and the executive management team. The Board ensures that both the MD and executive team are appropriately qualified and experienced to discharge their responsibilities.
To ensure that the responsibilities of the Board are upheld and executed, the Board has established the following sub-committees: • Audit and Risk Committee.• Nominations and Remuneration Committee.
Sub-committees are able to focus on a particular responsibility and provide informed feedback to the Board. Each of these sub-committees have established Charters and operating procedures in place, which are reviewed on a regular basis.
The Board reviews the performance of the MD on a yearly basis. The Nominations and Remuneration Committee annually reviews and determines the remuneration arrangements for the MD, submitting their recommendations to the Board for approval.
Principle 2 – Structure the Board to add valueBoard policy is that the Board will constantly review and monitor its performance. As part of this process the Board may seek to appoint persons who, in the opinion of the Board, will provide specialist expertise required for the Board to adequately perform its role. Additionally, the Board will also review its composition and advise Board members where it is felt that a Director’s skills are different from those required by the Company.
The skills, experience and expertise of each director in office at the date of this report and their period of office are detailed in the Directors Report. This also identifies the independent directors. None of the independent directors have any relationship with the company (as defined in accordance with the ASX recommendations) which may affect their independent status. Directors are entitled to obtain independent external advice on matters relating to accounting, law and other relevant professional matters at the expense of the company.
The Board has appointed a Nominations and Remuneration Committee, whose responsibilities include assisting the Board to identify, interview and assesses new Director candidates having regard to prerequisite requirements. A copy of the Committee’s Charter is available on the Company’s website. The members and attendance at meetings of the committee are detailed in the Director’s Report.
The independence of directors is reviewed annually prior to completion of the Annual Report. Independence is defined in accordance with the definitions contained within the ASX recommendations. Relevant disclosure is then made in the Annual Report.
The procedures for selecting and nominating new candidates for the Board are more fully described in the Corporate Governance Statement and are available on the Company’s website.
Principle 3 – Promote ethical & responsible decision-making The Board has approved a Code of Conduct a summary of which is available on the Company’s website. All directors, executives and employees are required to comply with that Code. Failure to comply will result in disciplinary action and may include reprimand, formal warning, demotion or, in extreme cases, termination of employment. The Code of Conduct addresses expectations for conduct in the following areas:• Confidential information• Rights of Security Holders• Privacy
• Security trading• Conflicts of interest• Responsibility to suppliers and customers• Employment policies and procedures
Copies of the main provisions of the Code of Conduct and Security Dealing Guidelines are available on the Company’s website. The Company has adopted the so called “whistle blower” recommendations.
The Company’s policy regarding directors and employees trading in its securities is set out in Dealing Rules. The policy restricts Directors and employees from acting on material information until it has been released to the market and adequate time has been given for this to be reflected in the securities prices.
The company is committed to diversity and recognises the benefits arising from employee and board diversity and the importance of benefiting from all available talent. Diversity includes but is not limited to gender, age, disability, ethnicity, religion and cultural background. A copy of the company’s diversity policy is available on the Company’s website.
Principle 4 – Safeguard integrity in financial reportingThe Company has established an Audit and Risk Committee whose role and operations are documented in a Charter which is approved by the Board. This Charter is available on the Company’s website.
The Committee’s Charter provides that a minimum of 3 members of the Audit and Risk Committee must be Non-Executive Directors and that the Chair will be the person appointed as Chairman by the Board. Members of the Committee at the date of this report are Mr S Black AM (Chair), Mr J Milne and Mr K Boundy, all of whom are Non-Executive Directors of the Company.
The purpose of the Committee is to: • Review the integrity of NetComm Wireless’s financial
information and systems, internal and external reporting.• Review and assess the external auditors’ activities, scope and
independence.• Review the management process for the identification of
significant business risks and exposures and review and assess the adequacy of management information and internal control structures.
• Provide assurance to the full Board that NetComm Wireless is adequately managing risks relating to corporate governance and business operations and is maintaining appropriate controls against conflicts of interest and fraud.
The Audit and Risk Committee is required under the Charter to meet at least two times per year. The Committee met three times during the year and Committee members’ attendance records are disclosed in the Directors’ Meetings section of the Directors’ Report.
The Managing Director, Chief Financial Officer and external auditor also regularly attend the Committee meetings by standing invitation. Other Directors and management are invited to attend Committee meetings and participate in discussion relating to specific issues that they have an interest in as necessary.
The Committee is authorised to obtain independent legal advice at the Company’s expense if it considers appropriate to assist it in meeting its responsibilities.
Principle 5 – Make timely and balanced disclosureThe Company has adopted policies concerning shareholder communication and continuous disclosure. The policies are designed to promote investor confidence by providing full and timely information to all security holders and market participants about the Group’s activities, so as to comply with the requirements of the Corporations Act 2001 and the ASX Listing Rules. A summary of the continuous disclosure policy and the communications policy are available on the Company’s website.
Principle 6 – Respect the rights of shareholdersThe Company has established a link to the ASX website listing all of the Company’s announcements to the market. Shareholders and market participants registering their email addresses with the Company are provided with a copy of each announcement.
Principle 7 – Recognise and manage riskThe Board has adopted a detailed risk management policy a summary of which is available on the Company’s website. It is
a policy of companies in the Group to adopt a common sense approach to the management of risk. This approach involves a clear strategy defining the risks that the Company is in business to take and those that it is not.
The basis of this policy is the obligation and desire to protect:• the Company’s people and customers;• the environment in which the Group operates;• the Company’s position as a provider of the highest quality
services and products.
The Company’s policy in respect of these foundations attributes that its physical, financial and human resources will be applied to ensure that the Company’s standards of products and services achieve and exceed expectations. To do this the Company must pursue opportunities that involve some degree of risk. Shareholders and stakeholders must expect that optimisation of such rewards are only gained from this degree of risk taking.
Management reported to the Board during the relevant reporting period as to the effectiveness of the Company’s management of its material business risk. The Board received assurance from the CEO/Managing Director and CFO that the declaration provided in accordance with section 295A of the Corporations Act was founded on a sound system of risk management and internal control and that the system is operating effectively in all material respects in relation to financial report risks.
The Audit and Risk Committee has also been delegated responsibility by the Board to oversee the implementation and review of risk management and related internal compliance and control systems throughout the Group. The Committee reviews the appropriateness and adequacy of internal processes for determining, assessing and monitoring risk areas including the assessment of the effectiveness of the Group’s internal compliance and controls. The Audit and Risk Committee reports to the Board on the major issues and findings that are presented and discussed at its meetings.
Principle 8 – Remunerate fairly and responsiblyThe Board has established a Nominations and Remuneration Committee whose role is documented in a Charter which is approved by the Board. A copy of this charter is available on the Company’s website.
The Committee’s Charter provides that a minimum of 3 members of the Nominations and Remuneration Committee and the Chair will be the person appointed as Chairman by the Board. Members of the Committee at the date of this report are Mr K Boundy (Chair), Mr J Milne and Mr S Black AM, all of whom are Non-Executive Directors of the Company.
The objective of the Committee with respect to its remuneration function is to assist the Board in determining appropriate remuneration arrangements for the Directors and executive management.
These objectives include: • Reviewing the remuneration guidelines for senior management,
including base salary, bonuses, share rights and options, salary packaging and final contractual agreements.
• Reviewing non-executive fees and costs by seeking external benchmarks.
• Reviewing the CEO/Managing Director’s remuneration, allowances and incentives and final package in consultation with both independent and external reference.
The Committee will submit their recommendations to the Board regarding the remuneration arrangements and performance incentives for the Managing Director and executive team. The Board will review these recommendations before providing their approval.
Details of the Company’s remuneration structure and details of key executives’ remuneration and incentives are set out in the Remuneration Report contained within the Directors’ Report. The Remuneration Report also contains details on the remuneration structure of Non-Executive Director Remuneration.
Corporate Governance
Adoption of ASX Principles Recommendations
A summary of the main provisions of the Code of Conduct for
directors and key executives and the main provisions of the
Securities Dealing Policy are available in the corporate governance
section of NetComm Wireless Limited’s website.

Annual Report 2012-2013 - NetComm Wireless - 29
Annual Report for the year ended 30 June 2013
ACN 002 490 486
NetCommWirelessLimited

30 - NetComm Wireless - Annual Report 2012-2013
NetComm Wireless Limited Directors’ Report For the Year Ended 30 June 2013
1
Your directors present their report on the company and its controlled entities for the financial year ended 30 June 2013. 1. General information a Directors
The names of the directors in office at any time during, or since the end of, the year are:
Name Position held J Milne Non-Executive Director & Chairman J A Brennan Non-Executive Director – Resigned 21 March 2013 K Boundy Non-Executive Director – Appointed 24 August 2012 S Black AM Non-Executive Director – Appointed 21 March 2013 J M Burton Non-Executive Director – Retired 21 November 2012 D P J Stewart CEO & Managing Director K J P Sheridan CFO & Executive Director
Directors have been in office since the start of the financial year to the date of this report unless otherwise stated.
b Company Secretary
Mr Ken J P Sheridan, the company's CFO & Executive Director, is also the company secretary. c Principal Activities
NetComm Wireless Limited (ASX: NTC) is a leading developer of innovative broadband products sold globally to major telecommunications carriers, core network providers and system integrators. For 31 years NetComm has developed a portfolio of world first data communication products, and is a respected global provider of 3G and 4G wireless devices servicing the major telecommunications carriers, Machine to Machine (M2M) and Rural Broadband markets. NetComm’s products are designed to meet the growing needs of today’s data-intensive home, business and industrial broadband applications and customized to optimise performance in line with global network advancements.

Annual Report 2012-2013 - NetComm Wireless - 31
NetComm Wireless Limited Directors’ Report For the Year Ended 30 June 2013
1
Your directors present their report on the company and its controlled entities for the financial year ended 30 June 2013. 1. General information a Directors
The names of the directors in office at any time during, or since the end of, the year are:
Name Position held J Milne Non-Executive Director & Chairman J A Brennan Non-Executive Director – Resigned 21 March 2013 K Boundy Non-Executive Director – Appointed 24 August 2012 S Black AM Non-Executive Director – Appointed 21 March 2013 J M Burton Non-Executive Director – Retired 21 November 2012 D P J Stewart CEO & Managing Director K J P Sheridan CFO & Executive Director
Directors have been in office since the start of the financial year to the date of this report unless otherwise stated.
b Company Secretary
Mr Ken J P Sheridan, the company's CFO & Executive Director, is also the company secretary. c Principal Activities
NetComm Wireless Limited (ASX: NTC) is a leading developer of innovative broadband products sold globally to major telecommunications carriers, core network providers and system integrators. For 31 years NetComm has developed a portfolio of world first data communication products, and is a respected global provider of 3G and 4G wireless devices servicing the major telecommunications carriers, Machine to Machine (M2M) and Rural Broadband markets. NetComm’s products are designed to meet the growing needs of today’s data-intensive home, business and industrial broadband applications and customized to optimise performance in line with global network advancements.
NetComm Wireless Limited Directors’ Report For the Year Ended 30 June 2013
2
2. Review of operations and financial results a Operating Results
The consolidated loss of the Group after providing for income tax amounted to $541,624 (2012: $840,511 profit).
Consolidated Results and Dividends 2013 2012 $ $
The Group has experienced a decline in revenue and profitability as a result of a planned move away from supplying consumer focussed products in order to focus on the global machine to machine (“M2M”) market. As part of this activity, restructuring costs of $0.3 million were incurred during the year. The Group also experienced $0.5 million loss as a result of revaluing net monetary liabilities denominated in predominantly US$ as a result of the rapid depreciation of the A$ in the last 2 months of the year. The higher level of income tax benefit reflected additional research and development claims permitted by the ATO and an over provision for tax in the prior year. There were a number of key milestones achieved during the course of the year that were very favourable in relation to our M2M strategy. The following deserve particular mention:
In October 2012, it was announced that following a world-wide tender process, NetComm Wireless had been selected by Vodafone Global Enterprise to be their supplier of M2M IP modems for global deployment. The product, Vodafone MachineLink 3G, was officially launched at Mobile World Congress in late February 2013. The first orders were shipped to Vodafone for initial customer trials in May 2013.
In May 2013, the company announced that it had been selected by Ericsson, as the integration partner for SP AusNet, to supply the 3G communications card component for the rollout of smart meters in Victoria. This is a contract with revenue of $12.5 million which will be earned during FY14.
In June 2013, the company undertook a capital raising process by way of a placement and a Share
Purchase Plan. Total proceeds raised, net of costs, was $4.3 million. A conditional placement, which was subject to an EGM held in July 2013, raised an additional $0.9 million. These funds will assist the company in executing its M2M strategy.
Total Revenue & other income from Continuing Operations 42,857,600 59,361,477 EBITDA from Continuing Business 803,021 4,854,600 Operating Profit/(loss) from Continuing Business before Taxation
(2,681,095)
1,772,049
Income Tax Benefit/(Expense) 2,139,471 (201,870) Net Profit/(Loss) for the year after tax from continuing operations
(541,624)
1,570,179
Loss for the year from discontinued operations - (729,668)
Profit/(Loss) for the year (541,624) 840,511

32 - NetComm Wireless - Annual Report 2012-2013
NetComm Wireless Limited Directors’ Report For the Year Ended 30 June 2013
3
2. Review of operations and financial results (continued)
b Significant Changes in State of Affairs
During the year the following changes occurred within the Group:
Issue of share capital as outlined in section 2a of this report. Significant Board renewal was undertaken as outlined in section 1a of this report.
c Subsequent Events
The company held an EGM on 15 July 2013 to approve the conditional placement of shares announced in June 2013. There was overwhelming support for the conditional placement which resulted in the company obtaining additional capital in the amount of $0.9 million, net of costs.
d Environmental Regulations
The Group is not subject to significant environmental regulation.
e Likely Developments, Business Strategies and Prospects
The Group is continuing to concentrate its efforts on the M2M strategy. The M2M market is a high growth
global market. Ericsson and Qualcomm have predicted that there will be 50 billion connected devices by 2020. The M2M market is still in its infancy and there are no dominant players, with many industry participants specialising in select verticals.
NetComm Wireless is planning to be one of the leading M2M device providers globally. Based on key customer wins, such as Vodafone Global Enterprise, we have gained a reputation as an innovative device supplier. This has provided us with introductions to other leading international telecommunications carriers. We plan to have relationships with between 6-8 of the top 20 global communications carriers.
We will continue to leverage our capability to design customised solutions to meet the specific needs of our customers. This approach allows us to develop tight customer relationships with a high degree of longevity and stickiness. The cycle time to deliver a new customised product can take between 9 to 12 months and so considerable investment, mainly of people time, is required before revenues begin to flow. This investment can be seen in the level of capitalised development carried on the balance sheet. All of our manufacturing occurs offshore, in China. By using contract manufacturers we have the ability to scale our business rapidly with low incremental capital expenditure. As well as global telecommunications carriers, we are targeting the following key M2M industry verticals:
Utility smart grids (electricity and water) E-health in respect of connected in-home devices which need central monitoring Business services, including point of sale, digital signage and vending machines/kiosks Manufacturing and construction Transportation ticketing Business continuity
A key component of our strategy is to leverage “coat tail” relationships. This is where we form relationships with key suppliers or ecosystem players and leverage their knowledge, contacts and reputation within key verticals.

Annual Report 2012-2013 - NetComm Wireless - 33
NetComm Wireless Limited Directors’ Report For the Year Ended 30 June 2013
3
2. Review of operations and financial results (continued)
b Significant Changes in State of Affairs
During the year the following changes occurred within the Group:
Issue of share capital as outlined in section 2a of this report. Significant Board renewal was undertaken as outlined in section 1a of this report.
c Subsequent Events
The company held an EGM on 15 July 2013 to approve the conditional placement of shares announced in June 2013. There was overwhelming support for the conditional placement which resulted in the company obtaining additional capital in the amount of $0.9 million, net of costs.
d Environmental Regulations
The Group is not subject to significant environmental regulation.
e Likely Developments, Business Strategies and Prospects
The Group is continuing to concentrate its efforts on the M2M strategy. The M2M market is a high growth
global market. Ericsson and Qualcomm have predicted that there will be 50 billion connected devices by 2020. The M2M market is still in its infancy and there are no dominant players, with many industry participants specialising in select verticals.
NetComm Wireless is planning to be one of the leading M2M device providers globally. Based on key customer wins, such as Vodafone Global Enterprise, we have gained a reputation as an innovative device supplier. This has provided us with introductions to other leading international telecommunications carriers. We plan to have relationships with between 6-8 of the top 20 global communications carriers.
We will continue to leverage our capability to design customised solutions to meet the specific needs of our customers. This approach allows us to develop tight customer relationships with a high degree of longevity and stickiness. The cycle time to deliver a new customised product can take between 9 to 12 months and so considerable investment, mainly of people time, is required before revenues begin to flow. This investment can be seen in the level of capitalised development carried on the balance sheet. All of our manufacturing occurs offshore, in China. By using contract manufacturers we have the ability to scale our business rapidly with low incremental capital expenditure. As well as global telecommunications carriers, we are targeting the following key M2M industry verticals:
Utility smart grids (electricity and water) E-health in respect of connected in-home devices which need central monitoring Business services, including point of sale, digital signage and vending machines/kiosks Manufacturing and construction Transportation ticketing Business continuity
A key component of our strategy is to leverage “coat tail” relationships. This is where we form relationships with key suppliers or ecosystem players and leverage their knowledge, contacts and reputation within key verticals.
NetComm Wireless Limited Directors’ Report For the Year Ended 30 June 2013
4
e Likely Developments, Business Strategies and Prospects (continued)
Financial year 2014 (FY14) will represent an inflection point in product revenue mix. We anticipate a modest decline in our “base business” in FY14 but substantial growth in M2M revenues, particularly based on the recent Victorian smart meter contract win through our utilities partner, Ericsson. We anticipate M2M revenues to represent more than 55% of total revenues from FY14 and continue to grow in future years. We have plans in place to expand our geographic footprint and source additional revenues from overseas jurisdictions, with particular emphasis on North America, Europe and the Middle East. The Ericsson NBN fixed wireless contract is a key domestic M2M contract. We are confident that this contract will deliver substantial value to the company. However, there have been ongoing delays in the rollout of the NBN, principally associated with long haul fibre and wireless tower completions, which have delayed revenue generation to the company. We anticipate small volumes in FY14 with a substantial ramp up in FY15 and FY16.

34 - NetComm Wireless - Annual Report 2012-2013
NetComm Wireless Limited Directors’ Report For the Year Ended 30 June 2013
5
3. Directors’ Information
a Information on Directors
Mr Justin Milne Non-Executive Director & Chairman
Mr Milne has substantial telecommunications industry experience and he is an
experienced company director having served in diverse industry sectors with a multinational focus. He had an executive career in telecommunications, marketing and media. From 2002 to 2010 he was Group Managing Director of Telstra’s broadband and media businesses, and headed up Telstra’s New Media businesses in China. He is currently a Non-Executive Director of Tabcorp Holdings Limited and Members Equity Bank Pty Ltd. He is also a board member of Basketball Australia and Sydney Children’s Hospital Foundation.
Mr John A Brennan FAICD, FAIM, Non-Executive Director (Resigned 21 March 2013)
Mr Brennan’s previous roles include National General Manager, Corporate and Government Sales for Telstra, General Manager Corporate Services for Advance Bank and Regional Manager (Computers and Telecommunications) with the PA Consulting Group.
Mr Ken Boundy Non-Executive Director (Appointed 24 August 2012)
Mr Boundy has significant marketing, distribution and international business experience across a diverse range of industry sectors. He is currently Chairman and/or Non-Executive Director on four boards, member of two advisory boards and part owner of two businesses. He has held a number of prominent positions over the past thirty years including: Managing Director of the Australian Tourist Commission, Tourism Australia; Executive General Manager, International, of James Hardie Industries Limited; Group General Manager, Corporate Development, of Goodman Fielder Limited; CEO, of Goodman Fielder Asia, Singapore and Director, Industry Development, of the Victorian Department of Industry Commerce and Technology.
Mr Stuart Black AM Non-Executive Director (Appointed 21 March 2013)
Mr Black is a prominent Chartered Accountant and experienced Company Director. He is the former Managing Partner in the chartered accounting firm Chapman Eastway and has extensive experience in professional services, agribusiness, financial services, manufacturing, import, distribution, IT and biotechnology. Mr Black is Non-Executive Director of Australian Agricultural Company Limited and Coffey International Limited, Chair of Chartered Accountants Benevolent Foundation Ltd and a Non-Executive Director of The Country Education Foundation of Australia Ltd. He was the former acting Chair and current Director of the Accounting Professional and Ethical Standards Board Ltd and Past President of the Institute of Chartered Accountants in Australia.
Mr John M Burton Non-Executive Director (Retired 21 November 2012)
With more than 25 years experience in the telecommunications industry, both in
Australia and overseas, Mr Burton has an in depth understanding of the factors that drive commercial success in the telecommunications arena. His professional background includes senior management roles with Telecom (now Telstra), KPMG Management Consulting, DSC Communications and Nextgen Networks. Mr Burton is also the Chairman of Spatial Vision Innovations Pty Ltd, a company that uses digital technology to address business and environmental problems. He is currently CEO of Manson Consulting, a company which provides consultancy services to a range of telecommunications organisations.

Annual Report 2012-2013 - NetComm Wireless - 35
NetComm Wireless Limited Directors’ Report For the Year Ended 30 June 2013
5
3. Directors’ Information
a Information on Directors
Mr Justin Milne Non-Executive Director & Chairman
Mr Milne has substantial telecommunications industry experience and he is an
experienced company director having served in diverse industry sectors with a multinational focus. He had an executive career in telecommunications, marketing and media. From 2002 to 2010 he was Group Managing Director of Telstra’s broadband and media businesses, and headed up Telstra’s New Media businesses in China. He is currently a Non-Executive Director of Tabcorp Holdings Limited and Members Equity Bank Pty Ltd. He is also a board member of Basketball Australia and Sydney Children’s Hospital Foundation.
Mr John A Brennan FAICD, FAIM, Non-Executive Director (Resigned 21 March 2013)
Mr Brennan’s previous roles include National General Manager, Corporate and Government Sales for Telstra, General Manager Corporate Services for Advance Bank and Regional Manager (Computers and Telecommunications) with the PA Consulting Group.
Mr Ken Boundy Non-Executive Director (Appointed 24 August 2012)
Mr Boundy has significant marketing, distribution and international business experience across a diverse range of industry sectors. He is currently Chairman and/or Non-Executive Director on four boards, member of two advisory boards and part owner of two businesses. He has held a number of prominent positions over the past thirty years including: Managing Director of the Australian Tourist Commission, Tourism Australia; Executive General Manager, International, of James Hardie Industries Limited; Group General Manager, Corporate Development, of Goodman Fielder Limited; CEO, of Goodman Fielder Asia, Singapore and Director, Industry Development, of the Victorian Department of Industry Commerce and Technology.
Mr Stuart Black AM Non-Executive Director (Appointed 21 March 2013)
Mr Black is a prominent Chartered Accountant and experienced Company Director. He is the former Managing Partner in the chartered accounting firm Chapman Eastway and has extensive experience in professional services, agribusiness, financial services, manufacturing, import, distribution, IT and biotechnology. Mr Black is Non-Executive Director of Australian Agricultural Company Limited and Coffey International Limited, Chair of Chartered Accountants Benevolent Foundation Ltd and a Non-Executive Director of The Country Education Foundation of Australia Ltd. He was the former acting Chair and current Director of the Accounting Professional and Ethical Standards Board Ltd and Past President of the Institute of Chartered Accountants in Australia.
Mr John M Burton Non-Executive Director (Retired 21 November 2012)
With more than 25 years experience in the telecommunications industry, both in
Australia and overseas, Mr Burton has an in depth understanding of the factors that drive commercial success in the telecommunications arena. His professional background includes senior management roles with Telecom (now Telstra), KPMG Management Consulting, DSC Communications and Nextgen Networks. Mr Burton is also the Chairman of Spatial Vision Innovations Pty Ltd, a company that uses digital technology to address business and environmental problems. He is currently CEO of Manson Consulting, a company which provides consultancy services to a range of telecommunications organisations.
NetComm Wireless Limited Directors’ Report For the Year Ended 30 June 2013
6
3. Directors’ Information (continued)
a Information on Directors Mr David P J Stewart
CEO & Managing Director
Mr Stewart founded Banksia Technology Pty Limited in 1988 and successfully managed the company as a fast growing and highly profitable business. In 1996, he instigated the successful takeovers of a number of his competitors including NetComm Wireless Limited, which was completed in November 1997. Mr Stewart assumed the role of Managing Director of the merged entity and remains the single largest shareholder of NetComm Wireless. He has a strong financial background, extensive experience in sales and marketing and has maintained an ongoing interest in new technologies. While being very active in the operational aspects of the business, Mr Stewart also focuses on the strategic direction of the company.
Mr Kenneth J P Sheridan
CFO & Executive Director
Mr Sheridan is a Chartered Accountant with over 30 years’ experience in senior management in major corporations in Australia and Asia. He spent 11 years with KPMG before he moved into the commercial sector where he held several CFO roles with large multinational companies in Australia and Asia including three years as Finance Director of a top 10 Malaysian listed consumer goods company. Mr Sheridan was the Group CFO for Tenix, one of Australia’s largest private companies. In the 6 years prior to joining NetComm Wireless, Mr Sheridan was Managing Director and major shareholder of Acelero Pty Ltd, a human resources software company.
At the date of this report, the interest of the Directors in the ordinary shares and options of the Company are:
Ordinary Shares Options J Milne 180,588 - J A Brennan 302,795 - K Boundy 450,000 - S Black AM - - J M Burton 359,450 - D P J Stewart 22,974,596 - K J P Sheridan 204,588 -

36 - NetComm Wireless - Annual Report 2012-2013
NetComm Wireless Limited Directors’ Report For the Year Ended 30 June 2013
7
b Meetings of Directors
The number of meetings of directors (including meetings of committees of directors) held during the year and the number of meetings attended by each director during the year were as follows:
Director
Board Meetings
Audit and Risk
Committee
Nominations and
Remuneration Committee
A B A B A B
J A Brennan 6 6 2 2 1 1 J M Burton 4 3 - - - - J Milne 11 11 3 3 2 2 K Boundy 10 10 3 3 2 2 S Black AM 4 4 1 1 1 1 D P J Stewart 11 11 - - - - K J P Sheridan 11 11 - - - -
A is the number of meetings the Director was entitled to attend B is the number of meetings the Director attended
As announced at the AGM in November 2011, the Board instituted two new committees: Audit and Risk Committee & Nominations and Remuneration Committee.
4. Share Options
At the date of this report, there are 200,000 options (2012: 3,082,500) issued to 1 employee (2012: 11 employees) to acquire ordinary shares. These options have all vested but have not been exercised. The details are as follows:
Date Options granted Expiry date Exercise price Number of options
10/12/2008 10/12/2013 0.162 100,000 12/02/2009 12/02/2014 0.113 100,000
200,000 .
The holders of these options do not have any rights under the options to participate in any share issue of the company or of any other entity.
NetComm Wireless Limited Directors’ Report For the Year Ended 30 June 2013
8
4. Share Options (continued)
The following ordinary shares of NetComm Wireless Limited were issued during or since the end of the financial year as a result of exercise of options granted.
Date Options granted Issue price of shares Number of shares issued
19/07/2007 0.060 50,000 17/12/2007 0.070 195,000 27/02/2008 0.075 157,500 03/03/2008 0.071 100,000 31/07/2008 0.185 100,000 30/08/2008 0.162 180,000 30/10/2008 0.162 540,000
1,322,500 No amounts are unpaid on these shares. During or since the end of the financial year, no options were granted by NetComm Wireless Limited to Directors and Executives of the Group as part of their remuneration.
5. Share Rights
Details of share rights held directly, indirectly or beneficially by key management personnel and their related parties are as follows:
Balance on 1 July
2012
Share Rights
Granted during
the year
Share Rights
Exercised Share Rights Relinquished
Balance at 30
June 2013
Total Vested at 30 June
2013
Type of Share Right
D P J Stewart 1,500,000 - - (1,500,000) - 0% Cash K J P Sheridan 450,000 - - (450,000) - 0% Cash
D Morrison 250,000 - - - 250,000 0% Shares S Collins 250,000 - - - 250,000 0% Shares B Stevens 250,000 - - - 250,000 0% Shares M Cornelius 250,000 - - - 250,000 0% Shares Total 2,950,000 - - (1,950,000) 1,000,000
On July 1, 2011 NetComm Wireless Limited Executive Employee Share Plan" ("EESP") was introduced for invited Participants selected on the basis of their capability to be able to directly impact the Company's performance. Under this Plan, a Participant is made an offer of a number of Share Rights, as determined by the Board. A Share Right is an entitlement to a cash (for cash participants) or equity (for equity participants) amount equivalent to the value of one fully paid ordinary share in the Company for nil consideration, subject to the achievement of vesting conditions which include service and company performance over a 3-year period. The Share Rights will vest when the Company meets or exceeds a “performance hurdle” based on a specific EBITDA target as at the end of years 1, 2 and 3 respectively, if the Participant remains employed with the Company at that time. If the Company does not meet a performance hurdle at a given year (either year 1 or year 2), the hurdle can be “re-tested” in the subsequent year. The “re-test” would be based on a comparison of the cumulative actual EBITDA results for the current and past years compared to the cumulative EBITDA performance hurdle. The Board has resolved that any entitlements to shares in NetComm Wireless resulting from the EESP will be purchased on market. As previously advised at the Company’s Annual General Meeting in November 2012, Mr Stewart and Mr Sheridan agreed to relinquish their entitlements to share rights and will take no further part in the EESP formed on 1 July 2011.

Annual Report 2012-2013 - NetComm Wireless - 37
NetComm Wireless Limited Directors’ Report For the Year Ended 30 June 2013
7
b Meetings of Directors
The number of meetings of directors (including meetings of committees of directors) held during the year and the number of meetings attended by each director during the year were as follows:
Director
Board Meetings
Audit and Risk
Committee
Nominations and
Remuneration Committee
A B A B A B
J A Brennan 6 6 2 2 1 1 J M Burton 4 3 - - - - J Milne 11 11 3 3 2 2 K Boundy 10 10 3 3 2 2 S Black AM 4 4 1 1 1 1 D P J Stewart 11 11 - - - - K J P Sheridan 11 11 - - - -
A is the number of meetings the Director was entitled to attend B is the number of meetings the Director attended
As announced at the AGM in November 2011, the Board instituted two new committees: Audit and Risk Committee & Nominations and Remuneration Committee.
4. Share Options
At the date of this report, there are 200,000 options (2012: 3,082,500) issued to 1 employee (2012: 11 employees) to acquire ordinary shares. These options have all vested but have not been exercised. The details are as follows:
Date Options granted Expiry date Exercise price Number of options
10/12/2008 10/12/2013 0.162 100,000 12/02/2009 12/02/2014 0.113 100,000
200,000 .
The holders of these options do not have any rights under the options to participate in any share issue of the company or of any other entity.
NetComm Wireless Limited Directors’ Report For the Year Ended 30 June 2013
8
4. Share Options (continued)
The following ordinary shares of NetComm Wireless Limited were issued during or since the end of the financial year as a result of exercise of options granted.
Date Options granted Issue price of shares Number of shares issued
19/07/2007 0.060 50,000 17/12/2007 0.070 195,000 27/02/2008 0.075 157,500 03/03/2008 0.071 100,000 31/07/2008 0.185 100,000 30/08/2008 0.162 180,000 30/10/2008 0.162 540,000
1,322,500 No amounts are unpaid on these shares. During or since the end of the financial year, no options were granted by NetComm Wireless Limited to Directors and Executives of the Group as part of their remuneration.
5. Share Rights
Details of share rights held directly, indirectly or beneficially by key management personnel and their related parties are as follows:
Balance on 1 July
2012
Share Rights
Granted during
the year
Share Rights
Exercised Share Rights Relinquished
Balance at 30
June 2013
Total Vested at 30 June
2013
Type of Share Right
D P J Stewart 1,500,000 - - (1,500,000) - 0% Cash K J P Sheridan 450,000 - - (450,000) - 0% Cash
D Morrison 250,000 - - - 250,000 0% Shares S Collins 250,000 - - - 250,000 0% Shares B Stevens 250,000 - - - 250,000 0% Shares M Cornelius 250,000 - - - 250,000 0% Shares Total 2,950,000 - - (1,950,000) 1,000,000
On July 1, 2011 NetComm Wireless Limited Executive Employee Share Plan" ("EESP") was introduced for invited Participants selected on the basis of their capability to be able to directly impact the Company's performance. Under this Plan, a Participant is made an offer of a number of Share Rights, as determined by the Board. A Share Right is an entitlement to a cash (for cash participants) or equity (for equity participants) amount equivalent to the value of one fully paid ordinary share in the Company for nil consideration, subject to the achievement of vesting conditions which include service and company performance over a 3-year period. The Share Rights will vest when the Company meets or exceeds a “performance hurdle” based on a specific EBITDA target as at the end of years 1, 2 and 3 respectively, if the Participant remains employed with the Company at that time. If the Company does not meet a performance hurdle at a given year (either year 1 or year 2), the hurdle can be “re-tested” in the subsequent year. The “re-test” would be based on a comparison of the cumulative actual EBITDA results for the current and past years compared to the cumulative EBITDA performance hurdle. The Board has resolved that any entitlements to shares in NetComm Wireless resulting from the EESP will be purchased on market. As previously advised at the Company’s Annual General Meeting in November 2012, Mr Stewart and Mr Sheridan agreed to relinquish their entitlements to share rights and will take no further part in the EESP formed on 1 July 2011.

38 - NetComm Wireless - Annual Report 2012-2013
NetComm Wireless Limited Directors’ Report For the Year Ended 30 June 2013
9
6. Remuneration Report - Audited
This remuneration report, which forms part of the Directors’ Report, sets out the information about the remuneration of NetComm Wireless Limited’s directors and its senior management for the financial year ended 30 June 2013. The following persons were key management personnel of NetComm Wireless Limited during the financial year:
Remuneration Policy
The Board’s policy for determining the nature and amount of remuneration of key management personnel for the Group is as follows:
• As announced at the 2012 AGM, the Board has reinstated a Nominations & Remuneration Committee,
comprising the non-executive directors of the company.
• The Nominations & Remuneration Committee assume responsibility for making recommendations to the Board in respect of remuneration policies and practices generally, and making recommendations to the Board on remuneration packages and other terms of employment for executive directors, other senior executives and non-executive directors.
• The Board reviews the remuneration packages of all directors and other key management personnel on an
annual basis. Remuneration packages are reviewed and determined with due regard to current market rates and are benchmarked against comparable industry salaries. The overall objective is to ensure maximum shareholder benefit from the retention of a quality Board and Executive Team. To assist in achieving this objective, the nature and amount of the Executives’ and Executive Directors’ and other key management personnel’s emoluments is linked to the Group’s financial and operational performance, as determined by the Board.
The Chairman of the company presently receives an annual fee of $97,500 with all other directors receiving $57,500 per annum. Given the size of the company and the Board, no additional payments are made in respect of Chairmanship or Membership of any of the Board Committees.
Name Position held J Milne Non-Executive Director & Chairman J A Brennan Non-Executive Director K Boundy Non-Executive Director S Black AM Non-Executive Director J M Burton Non-Executive Director D P J Stewart CEO & Managing Director K J P Sheridan CFO & Executive Director B Stevens Chief Technology Officer M Cornelius Research & Development Director D Morrison General Manager - Sales S Collins Head of Engineering & Product Development

Annual Report 2012-2013 - NetComm Wireless - 39
NetComm Wireless Limited Directors’ Report For the Year Ended 30 June 2013
9
6. Remuneration Report - Audited
This remuneration report, which forms part of the Directors’ Report, sets out the information about the remuneration of NetComm Wireless Limited’s directors and its senior management for the financial year ended 30 June 2013. The following persons were key management personnel of NetComm Wireless Limited during the financial year:
Remuneration Policy
The Board’s policy for determining the nature and amount of remuneration of key management personnel for the Group is as follows:
• As announced at the 2012 AGM, the Board has reinstated a Nominations & Remuneration Committee,
comprising the non-executive directors of the company.
• The Nominations & Remuneration Committee assume responsibility for making recommendations to the Board in respect of remuneration policies and practices generally, and making recommendations to the Board on remuneration packages and other terms of employment for executive directors, other senior executives and non-executive directors.
• The Board reviews the remuneration packages of all directors and other key management personnel on an
annual basis. Remuneration packages are reviewed and determined with due regard to current market rates and are benchmarked against comparable industry salaries. The overall objective is to ensure maximum shareholder benefit from the retention of a quality Board and Executive Team. To assist in achieving this objective, the nature and amount of the Executives’ and Executive Directors’ and other key management personnel’s emoluments is linked to the Group’s financial and operational performance, as determined by the Board.
The Chairman of the company presently receives an annual fee of $97,500 with all other directors receiving $57,500 per annum. Given the size of the company and the Board, no additional payments are made in respect of Chairmanship or Membership of any of the Board Committees.
Name Position held J Milne Non-Executive Director & Chairman J A Brennan Non-Executive Director K Boundy Non-Executive Director S Black AM Non-Executive Director J M Burton Non-Executive Director D P J Stewart CEO & Managing Director K J P Sheridan CFO & Executive Director B Stevens Chief Technology Officer M Cornelius Research & Development Director D Morrison General Manager - Sales S Collins Head of Engineering & Product Development
NetComm Wireless Limited Directors’ Report For the Year Ended 30 June 2013
10
6. Remuneration Report – Audited (continued) Relationship between the remuneration policy and company performance
The following tables set out summary information about the consolidated entity’s earnings and movements in shareholder wealth for the five years to June 2013:
Continuing Operations
30 June 2013
$
30 June 2012
$
30 June 2011
$
30 June 2010
$
30 June 2009
$ Revenue 42,857,600 59,361,477 67,602,485 55,264,440 78,473,388 Net Profit/(loss) before tax (2,681,095) 1,772,049 2,145,565 2,294,204 5,296,429 Net Profit/(loss) after tax (541,624) 1,570,179 1,057,464 1,624,988 5,891,378 Net (Loss)/profit from discontinued operations*
-
(729,668)
(2,259,611)
-
-
Profit/(loss) for the year (541,624) 840,511 (1,202,147) 1,624,988 5,891,378 30 June
2013 $
30 June 2012
$
30 June 2011
$
30 June 2010
$
30 June 2009
$ Share price at start of the year 0.12 0.13 0.20 0.17 0.18 Share price at end of the year 0.26 0.12 0.13 0.20 0.17 Interim dividend - - 0.5cps 1cps - Final dividend - - - - - Continuing Operations Basic earnings per share (cents) (0.51) 1.51 1.02 1.58 6.01 Diluted earnings per share (cents) (0.51) 1.50 1.02 1.56 5.95 Discontinued Operations Basic earnings per share (cents) - (0.70) (2.18) - - Diluted earnings per share (cents) - (0.70) (2.18) - -
As stated above the overall objective of the Board’s remuneration policy is to ensure maximum shareholder benefit from the retention of a quality Board and Executive team and to assist in achieving this objective by linking executive rewards to the group’s financial and operational performance. The Board is of the opinion that the remuneration policy and company performance are closely aligned.
*Information for 2010 & prior is not disclosed as it is not material.

40 - NetComm Wireless - Annual Report 2012-2013
NetC
omm
Wireless Lim
ited D
irectors’ Report
For the Year Ended 30 June 2013
11
6. R
emuneration R
eport – Audited (continued)
D
etails of remuneration for year ended 30 June 2013.
Details of each elem
ent of the remuneration of key m
anagement personnel and other executives of N
etCom
m W
ireless Limited are set out in the follow
ing tables:
Year ended 30 June 2013:
Short Term Em
ployee Benefits
Post Em
ployment
Benefits
Long Term
benefits Share B
ased Paym
ents O
ther B
enefits Total
% of
Rem
uneration that is
performance
based
% of
Rem
uneration that consists
of options /share
rights
Salary & Fees
Short Term
Incentive Plan N
on-Monetary
Benefits
Super-annuation
Long Service Leave
Share Rights
Termination
Benefits
Independent Non-Executive D
irectors J M
ilne 78,958
- -
- -
- -
78,958 -
-
J A B
rennan* 64,736
- -
- -
- -
64,736 -
-
K B
oundy** 43,125
- -
- -
- -
43,125 -
-
S B
lack AM
*** 13,476
- -
1,212 -
- -
14,688 -
-
J M B
urton**** 23,958
- -
- -
- -
23,958 -
- Executive D
irectors
D P
J Stew
art 416,538
- -
33,462 11,758
- -
461,758 -
-
K J P
Sheridan
265,526 45,000
- 23,897
- -
- 334,423
13%
-
Executive Officers
D M
orrison 167,500
26,880 15,000
15,075 2,721
- -
227,176 12%
-
M C
ornelius 150,000
25,000 15,000
13,500 2,439
- -
205,939 12%
-
S C
ollins 151,376
25,000 15,000
13,624 -
- -
205,000 12%
B S
tevens 142,202
- 5,000
12,798 2,312
- -
162,312 -
- Total key m
anagement
personnel compensation
1,517,395 121,880
50,000 113,568
19,230 -
- 1,822,073
* Mr J A
Brennan resigned on 21 M
arch 2013. **
Mr K
Boundy w
as appointed as Non-E
xecutive Director on 24 A
ugust 2012. *** M
r S Black AM
was appointed as N
on-Executive D
irector on 21 March 2013.
**** Mr J M
Burton retired as N
on-Executive D
irector on 21 Novem
ber 2012.

Annual Report 2012-2013 - NetComm Wireless - 41
NetC
omm
Wireless Lim
ited D
irectors’ Report
For the Year Ended 30 June 2013
11
6. R
emuneration R
eport – Audited (continued)
D
etails of remuneration for year ended 30 June 2013.
Details of each elem
ent of the remuneration of key m
anagement personnel and other executives of N
etCom
m W
ireless Limited are set out in the follow
ing tables:
Year ended 30 June 2013:
Short Term Em
ployee Benefits
Post Em
ployment
Benefits
Long Term
benefits Share B
ased Paym
ents O
ther B
enefits Total
% of
Rem
uneration that is
performance
based
% of
Rem
uneration that consists
of options/share
rights
Salary & Fees
Short Term
Incentive Plan N
on-Monetary
Benefits
Super-annuation
Long Service Leave
Share Rights
Termination
Benefits
Independent Non-Executive D
irectors J M
ilne 78,958
- -
- -
- -
78,958 -
-
J A B
rennan* 64,736
- -
- -
- -
64,736 -
-
K B
oundy** 43,125
- -
- -
- -
43,125 -
-
S B
lack AM
*** 13,476
- -
1,212 -
- -
14,688 -
-
J M B
urton**** 23,958
- -
- -
- -
23,958 -
- Executive D
irectors
D P
J Stew
art 416,538
- -
33,462 11,758
- -
461,758 -
-
K J P
Sheridan
265,526 45,000
- 23,897
- -
- 334,423
13%
-
Executive Officers
D M
orrison 167,500
26,880 15,000
15,075 2,721
- -
227,176 12%
-
M C
ornelius 150,000
25,000 15,000
13,500 2,439
- -
205,939 12%
-
S C
ollins 151,376
25,000 15,000
13,624 -
- -
205,000 12%
B S
tevens 142,202
- 5,000
12,798 2,312
- -
162,312 -
- Total key m
anagement
personnel compensation
1,517,395 121,880
50,000 113,568
19,230 -
- 1,822,073
* Mr J A
Brennan resigned on 21 M
arch 2013. **
Mr K
Boundy w
as appointed as Non-E
xecutive Director on 24 A
ugust 2012. *** M
r S Black AM
was appointed as N
on-Executive D
irector on 21 March 2013.
**** Mr J M
Burton retired as N
on-Executive D
irector on 21 Novem
ber 2012.
NetC
omm
Wireless Lim
ited D
irectors’ Report
For the Year Ended 30 June 2013
12
6. R
emuneration R
eport – AU
DITED
(continued)
Details of rem
uneration for year ended 30 June 2012. D
etails of each element of the rem
uneration of key managem
ent personnel and other executives of NetC
omm
Wireless Lim
ited are set out in the following tables:
Year ended 30 June 2012:
Short Term Em
ployee Benefits
Post Em
ployment
Benefits
Long Term
benefits Share B
ased Paym
ents O
ther B
enefits Total
% of
Rem
uneration that is
performance
based
% of
Rem
uneration that consists
of options /share
rights
Salary & Fees
Short Term
Incentive Plan N
on-Monetary
Benefits
Super-annuation
Long Service Leave
Share R
ights**** Term
ination B
enefits
Independent Non-Executive D
irectors T R
Winters*
69,750 -
- -
- -
- 69,750
- -
J A B
rennan 63,333
- -
- -
- -
63,333 -
-
J M B
urton 57,500
- -
- -
- -
57,500 -
-
J Milne**
19,167 -
- -
- -
- 19,167
- -
Executive Directors
D P
J Stew
art 433,444
270,000 -
39,010 7,249
65,000 -
814,703 41%
8%
K J P
Sheridan
229,358 51,600
- 20,642
- 19,500
- 321,100
22%
6%
Executive Officers
D M
orrison 168,079
51,600 15,000
15,577 2,791
10,833 -
263,880 22%
4%
M C
ornelius 150,000
75,000 15,000
13,500 2,500
10,833 -
266,833 32%
4%
S C
ollins 151,376
44,000 15,000
13,624 -
10,833 -
234,833 23%
5%
B S
tevens 150,617
43,000 5,000
13,971 2,370
10,833 -
225,791 24%
5%
J Lahey*** 174,730
31,500 14,856
13,023 -
- -
234,109 13%
0%
Total key m
anagement
personnel compensation
1,667,354 566,700
64,856 129,347
14,910 127,832
- 2,570,999
* M
r T Winters retired as C
hairman on 13 D
ecember 2011.
** Mr J M
ilne was appointed as N
on-Executive D
irector on 7 March 2012.
*** Mr J Lahey joined in S
eptember 2011.
**** Share rights for all participants have not yet vested, have not been paid and are not payable until vesting criteria have been m
et.

42 - NetComm Wireless - Annual Report 2012-2013
NetComm Wireless Limited Directors’ Report For the Year Ended 30 June 2013
13
6. Remuneration Report – AUDITED (continued)
Short term Incentive Plan - Cash bonuses
Key management personnel and other executives are entitled to a short-term cash incentive based on performance criteria which is defined and granted at the discretion of the Board. Where performance criteria are not met in the current year the bonus is forfeited and may not be carried forward to a future year. Short term Incentive plans are based on the achievement of specified Revenue and EBITDA levels and personal objectives. For the year ended 30 June 2013, following table discloses the total entitlement and the amount achieved.
Participants Role Total Entitlement Total Achieved % Achieved D P J Stewart CEO & Managing
Director
$450,000 -
-
K J P Sheridan CFO & Executive Director
$100,000
$45,000
45%
D Morrison General Manager - Sales
$60,000
$26,880
45%
S Collins Head of Engineering & Product Development
$50,000
$25,000
50% B Stevens Chief Technology
Officer
$50,000 -
-
M Cornelius Research & Development Director
$75,000
$25,000
33% Total
$785,000
$121,880
Share Options
An employee share option plan is in place for all employees, including directors and key management personnel. The board of directors has discontinued the issuance of share options at the beginning of the 2011 financial year. Each option entitles the holder to subscribe for and be allotted one share in the capital of the company at a pre-determined exercise price per share. Shares issued on the exercise of options will rank pari passu with all existing shares in the capital of the company from the date of issue. The option holder must remain employed with the company in order to meet the performance conditions attached to the options. No options vested or were granted to key management personnel and executives during the year. Mr David Stewart, CEO and Managing Director, relinquished 1,500,000 vested options during the year as announced at the Company’s 2012 Annual General Meeting held in November 2012.
560,000 options were exercised by key management personnel and executives during the year:
Number of options
Fair Value at grant date
D Morrison 100,000 $ 7,000 B Stevens 100,000 $18,500 J M Burton 360,000 $58,320 Total 560,000 $83,820
NetC
omm
Wireless Lim
ited D
irectors’ Report
For the Year Ended 30 June 2013
14
6. R
emuneration R
eport – AU
DITED
(continued)
Share Rights held by key m
anagement personnel
O
n July 1, 2011 NetC
omm
Wireless Lim
ited Executive Employee S
hare Plan" ("E
ESP
") was introduced for invited Participants selected on the basis of their
capability to be able to directly impact the C
ompany's perform
ance. Under this P
lan, a Participant is made an offer of a num
ber of Share Rights, as determ
ined by the Board. A
Share Right is an entitlem
ent to a cash (for cash participants) or equity (for equity participants) amount equivalent to the value of one fully paid
ordinary share in the Com
pany for nil consideration, subject to the achievement of vesting conditions w
hich include service and company perform
ance over a 3-year period. The Share R
ights will vest w
hen the Com
pany meets or exceeds a “perform
ance hurdle” based on a specific EBITDA target as at the end of years 1,
2 and 3 respectively, if the Participant remains em
ployed with the C
ompany at that tim
e. If the Com
pany does not meet a perform
ance hurdle at a given year (either year 1 or year 2), the hurdle can be “re-tested” in the subsequent year. The “re-test” w
ould be based on a comparison of the cum
ulative actual EBITD
A results for the current and past years com
pared to the cumulative EB
ITDA hurdle am
ounts. The Board has resolved that any entitlements to shares in N
etCom
m
Wireless resulting from
the EESP
will be purchased on m
arket. D
etails of share rights held directly, indirectly or beneficially by key managem
ent personnel and their related parties are as follows:
B
alance on 1 July 2012
Share Rights
Granted during
the year
Rights
Relinquished
Minim
um fair
value of Rights
Maxim
um fair
value of Rights
Rights
Exercised
Balance at 30 June 2013
Total Vested at 30 June 2013
Type of Share R
ight
D P
J Stew
art 1,500,000
- (1,500,000)
- -
- -
- C
ash K
J P S
heridan 450,000
- (450,000)
- -
- -
- C
ash D
Morrison
250,000 -
- -
- -
250,000 0%
S
hares S
Collins
250,000 -
- -
- -
250,000 0%
S
hares B
Stevens
250,000 -
- -
- -
250,000 0%
S
hares M
Cornelius
250,000 -
- -
- -
250,000 0%
S
hares Total
2,950,000
-
(1,950,000) -
- -
1,000,000
As at 1 July 2013, the EB
ITDA perform
ance hurdles for years 1 and 2 were not m
et so Plan P
articipants had no vesting of their Share Rights. B
ased on estim
ates of EBITDA for the year ending 30 June 2014, the Board is of the view
that the EBITD
A performance hurdles w
ill not be met and that no share rights w
ill vest for any Participant. Accordingly, the fair value of these R
ights has been assessed as nil.

Annual Report 2012-2013 - NetComm Wireless - 43
NetC
omm
Wireless Lim
ited D
irectors’ Report
For the Year Ended 30 June 2013
14
6. R
emuneration R
eport – AU
DITED
(continued)
Share Rights held by key m
anagement personnel
O
n July 1, 2011 NetC
omm
Wireless Lim
ited Executive Employee S
hare Plan" ("E
ESP
") was introduced for invited Participants selected on the basis of their
capability to be able to directly impact the C
ompany's perform
ance. Under this P
lan, a Participant is made an offer of a num
ber of Share Rights, as determ
ined by the Board. A
Share Right is an entitlem
ent to a cash (for cash participants) or equity (for equity participants) amount equivalent to the value of one fully paid
ordinary share in the Com
pany for nil consideration, subject to the achievement of vesting conditions w
hich include service and company perform
ance over a 3-year period. The Share R
ights will vest w
hen the Com
pany meets or exceeds a “perform
ance hurdle” based on a specific EBITDA target as at the end of years 1,
2 and 3 respectively, if the Participant remains em
ployed with the C
ompany at that tim
e. If the Com
pany does not meet a perform
ance hurdle at a given year (either year 1 or year 2), the hurdle can be “re-tested” in the subsequent year. The “re-test” w
ould be based on a comparison of the cum
ulative actual EBITD
A results for the current and past years com
pared to the cumulative EB
ITDA hurdle am
ounts. The Board has resolved that any entitlements to shares in N
etCom
m
Wireless resulting from
the EESP
will be purchased on m
arket. D
etails of share rights held directly, indirectly or beneficially by key managem
ent personnel and their related parties are as follows:
B
alance on 1 July 2012
Share Rights
Granted during
the year
Rights
Relinquished
Minim
um fair
value of Rights
Maxim
um fair
value of Rights
Rights
Exercised
Balance at 30 June 2013
Total Vested at 30 June 2013
Type of Share R
ight
D P
J Stew
art 1,500,000
- (1,500,000)
- -
- -
- C
ash K
J P S
heridan 450,000
- (450,000)
- -
- -
- C
ash D
Morrison
250,000 -
- -
- -
250,000 0%
S
hares S
Collins
250,000 -
- -
- -
250,000 0%
S
hares B
Stevens
250,000 -
- -
- -
250,000 0%
S
hares M
Cornelius
250,000 -
- -
- -
250,000 0%
S
hares Total
2,950,000
-
(1,950,000) -
- -
1,000,000
As at 1 July 2013, the EB
ITDA perform
ance hurdles for years 1 and 2 were not m
et so Plan P
articipants had no vesting of their Share Rights. B
ased on estim
ates of EBITDA for the year ending 30 June 2014, the Board is of the view
that the EBITD
A performance hurdles w
ill not be met and that no share rights w
ill vest for any Participant. Accordingly, the fair value of these R
ights has been assessed as nil.

44 - NetComm Wireless - Annual Report 2012-2013
NetComm Wireless Limited Directors’ Report For the Year Ended 30 June 2013
15
6. Remuneration Report - Audited (continued)
Service contracts The following table provides employment details of persons who were, during the financial year, the directors and executive officers of the consolidated group receiving the highest remuneration.
END OF AUDITED REMUNERATION REPORT
Position held as at 30 June 2013 Contract details (duration & termination)
J Milne Non-Executive Director & Chairman No fixed term. K Boundy Non-Executive Director No fixed term (appointed 24 August 2012). J A Brennan Non-Executive Director Resigned 21 March 2013 J M Burton Non-Executive Director Retired 21 November 2012. S Black AM Non-Executive Director No fixed term (appointed 21 March 2013). D P J Stewart CEO & Managing Director 12 month contract automatically renewed.
12 months notice required to terminate. Entitled to 12 months gross salary upon termination.
K J P Sheridan CFO & Executive Director Standard employment agreement. 2 months notice required to terminate. Entitled to 2 months gross salary upon termination.
S Collins Head of Engineering & Product Development
Standard employment agreement. 2 months notice required to terminate. Entitled to 2 months gross salary upon termination.
D Morrison General Manager - Sales Standard employment agreement. 2 months notice required to terminate. Entitled to 2 months gross salary upon termination.
M Cornelius Research & Development Director Standard employment agreement. 2 months notice required to terminate. Entitled to 2 months gross salary upon termination.
B Stevens Chief Technology Officer Standard employment agreement. 2 months notice required to terminate. Entitled to 2 months gross salary upon termination.

Annual Report 2012-2013 - NetComm Wireless - 45
NetComm Wireless Limited Directors’ Report For the Year Ended 30 June 2013
15
6. Remuneration Report - Audited (continued)
Service contracts The following table provides employment details of persons who were, during the financial year, the directors and executive officers of the consolidated group receiving the highest remuneration.
END OF AUDITED REMUNERATION REPORT
Position held as at 30 June 2013 Contract details (duration & termination)
J Milne Non-Executive Director & Chairman No fixed term. K Boundy Non-Executive Director No fixed term (appointed 24 August 2012). J A Brennan Non-Executive Director Resigned 21 March 2013 J M Burton Non-Executive Director Retired 21 November 2012. S Black AM Non-Executive Director No fixed term (appointed 21 March 2013). D P J Stewart CEO & Managing Director 12 month contract automatically renewed.
12 months notice required to terminate. Entitled to 12 months gross salary upon termination.
K J P Sheridan CFO & Executive Director Standard employment agreement. 2 months notice required to terminate. Entitled to 2 months gross salary upon termination.
S Collins Head of Engineering & Product Development
Standard employment agreement. 2 months notice required to terminate. Entitled to 2 months gross salary upon termination.
D Morrison General Manager - Sales Standard employment agreement. 2 months notice required to terminate. Entitled to 2 months gross salary upon termination.
M Cornelius Research & Development Director Standard employment agreement. 2 months notice required to terminate. Entitled to 2 months gross salary upon termination.
B Stevens Chief Technology Officer Standard employment agreement. 2 months notice required to terminate. Entitled to 2 months gross salary upon termination.
NetComm Wireless Limited Directors’ Report For the Year Ended 30 June 2013
16
7. Other information
a Indemnification and Insurance of Directors and Auditors
All Directors of the Group, its secretaries and executive officers are entitled to be indemnified under Clause 23 of the Company’s Constitution to the maximum extent permitted by law unless the liability arises out of conduct involving a lack of good faith. Since the end of the previous financial year, the Group has paid insurance premiums in respect of a directors and officers liability insurance contract against certain liabilities (subject to exclusions), for all current and former officers of the Group, including all directors named in this report, the company secretaries and executive officers of the Group, and directors and officers who have retired or relinquished their positions. The insurance policies prohibit disclosure of the premiums paid in respect of those policies and the nature of the liabilities insured by the policies. The Group has not otherwise, during or since the end of the financial year, except to the extent permitted by law, indemnified or agreed to indemnify any current or former officer or auditor of the Group against a liability incurred by such an officer or auditor.
b Proceedings on behalf of the Company
No person has applied to the Court under section 237 of the Corporations Act 2001 for leave to bring proceedings on behalf of the company, or to intervene in any proceedings to which the company is a party, for the purpose of taking responsibility on behalf of the company for all or part of those proceedings.
No proceedings have been brought or intervened in on behalf of the company with leave of the Court under section 237 of the Corporations Act 2001.
c Auditors Independence Declaration
The lead auditor’s independence declaration for the year ended 30 June 2013 has been received and can be found on page 18 of the financial report.
d Non Audit Services
The directors are satisfied that the provision of non audit services during the year is compatible with the general standard of independence for auditors imposed by the Corporations Act 2001, because the nature and scope of each type of non audit service provided means that auditor independence was not compromised. Fees for non audit services which were paid/payable to the external auditors (Grant Thornton Audit Pty Ltd) during the year ended 30 June 2013 are disclosed at Note 3.
e Corporate Governance
The Directors of NetComm Wireless Limited have always recognised the need for appropriate standards of corporate behaviour and accountability to ensure the quality of the company’s financial reporting. Recent commentary and directions from Australian regulatory authorities have further emphasised this issue in the minds of investors. The Directors of NetComm Wireless Limited reaffirm their support for the principles of corporate governance and transparency and have reviewed their policies with regard to current best practice.

46 - NetComm Wireless - Annual Report 2012-2013
NetComm Wireless Limited Directors’ Report For the Year Ended 30 June 2013
17
7. Other information (continued) f Dividends
No dividends were paid during the financial year 2013 (2012: Nil).
The directors’ report is signed in accordance with a resolution of directors made pursuant to s.298(2) of the Corporations Act 2001. On behalf of the Directors Director: Director:
J Milne, Chairman Sydney
D P J Stewart, CEO & Managing Director Sydney
27 September 2013 27 September 2013
Grant Thornton Audit Pty Ltd ACN 130 913 594 Level 19, 2 Market Street Sydney NSW 2000 Locked Bag Q800 QVB Post Office Sydney NSW 1230 T +61 2 8297 2400 F +61 2 9299 4445 E [email protected] W www.grantthornton.com.au
18
‘Grant Thornton’ refers to the brand under which the Grant Thornton member firms provide assurance, tax and advisory services to their clients and/or refers to one or more member firms, as the context requires. Grant Thornton Australia Ltd is a member firm of Grant Thornton International Ltd (GTIL). GTIL and the member firms are not a worldwide partnership. GTIL and each member firm is a separate legal entity. Services are delivered by the member firms. GTIL does not provide services to clients. GTIL and its member firms are not agents of, and do not obligate one another and are not liable for one another’s acts or omissions. In the Australian context only, the use of the term ‘Grant Thornton’ may refer to Grant Thornton Australia Limited ABN 41 127 556 389 and its Australian subsidiaries and related entities. GTIL is not an Australian related entity to Grant Thornton Australia Limited. Liability limited by a scheme approved under Professional Standards Legislation. Liability is limited in those States where a current scheme applies.
Auditor’s Independence Declaration To the Directors of NetComm Wireless Limited In accordance with the requirements of section 307C of the Corporations Act 2001, as lead auditor for the audit of NetComm Wireless Limited for the year ended 30 June 2013, I declare that, to the best of my knowledge and belief, there have been:
a no contraventions of the auditor independence requirements of the Corporations Act 2001 in relation to the audit; and
b no contraventions of any applicable code of professional conduct in relation to the audit.
GRANT THORNTON AUDIT PTY LTD Chartered Accountants
Simon Coulton Partner - Audit & Assurance Sydney, 27 September 2013

Annual Report 2012-2013 - NetComm Wireless - 47
Grant Thornton Audit Pty Ltd ACN 130 913 594 Level 19, 2 Market Street Sydney NSW 2000 Locked Bag Q800 QVB Post Office Sydney NSW 1230 T +61 2 8297 2400 F +61 2 9299 4445 E [email protected] W www.grantthornton.com.au
18
‘Grant Thornton’ refers to the brand under which the Grant Thornton member firms provide assurance, tax and advisory services to their clients and/or refers to one or more member firms, as the context requires. Grant Thornton Australia Ltd is a member firm of Grant Thornton International Ltd (GTIL). GTIL and the member firms are not a worldwide partnership. GTIL and each member firm is a separate legal entity. Services are delivered by the member firms. GTIL does not provide services to clients. GTIL and its member firms are not agents of, and do not obligate one another and are not liable for one another’s acts or omissions. In the Australian context only, the use of the term ‘Grant Thornton’ may refer to Grant Thornton Australia Limited ABN 41 127 556 389 and its Australian subsidiaries and related entities. GTIL is not an Australian related entity to Grant Thornton Australia Limited. Liability limited by a scheme approved under Professional Standards Legislation. Liability is limited in those States where a current scheme applies.
Auditor’s Independence Declaration To the Directors of NetComm Wireless Limited In accordance with the requirements of section 307C of the Corporations Act 2001, as lead auditor for the audit of NetComm Wireless Limited for the year ended 30 June 2013, I declare that, to the best of my knowledge and belief, there have been:
a no contraventions of the auditor independence requirements of the Corporations Act 2001 in relation to the audit; and
b no contraventions of any applicable code of professional conduct in relation to the audit.
GRANT THORNTON AUDIT PTY LTD Chartered Accountants
Simon Coulton Partner - Audit & Assurance Sydney, 27 September 2013

48 - NetComm Wireless - Annual Report 2012-2013
Index to the financial statements
Contents Page
Consolidated statement of profit or loss and other comprehensive income 20
Consolidated statement of financial position 21
Consolidated statement of changes in equity 22
Consolidated statement of cash flows 23
Notes to the financial statements
1. Significant accounting policies 24
2. Revenue and other income from continuing operations 38
3. Expenses 38
4. Income tax expense/(benefit) 39
5. Dividends 39
6. Cash and cash equivalents 40
7. Trade and other receivables 40
8. Inventories 41
9. Other assets 41
10. Property, plant and equipment 41
11. Goodwill 42
12. Other intangible assets 43
13. Trade and other payables 43
14. Borrowings 43
15. Provisions 44
16. Other liabilities 44
17. Issued capital 44
18. Reserves 44
19. Contingent liabilities 45
20. Expenditure commitments 45
21. Cash flow information 45
22. Key management personnel compensation 46
23. Related party transactions 48
24. Share based payments 48
25. Retirement benefit obligations 50
26. Earnings per share 50
27. Financial instruments 51
28. Events after the reporting date 55
29. Segment reporting 55
30. Parent entity disclosures 57
31. Discontinued operations 58
32. Company details 59
Director’s declaration 60
Independent auditor's report 61
ASX additional information 63
Corporate directory 64
NetComm Wireless LimitedIndex to the financial statements
30 June 2013
19

Annual Report 2012-2013 - NetComm Wireless - 49
2013 2012
Note $ $
Continuing Operations
Revenue from the sale of goods 2 42,779,990 59,186,120
Other income 2 77,610 175,357
Change in inventories (890,231) 3,535,241
Raw materials consumed (28,066,042) (44,756,740)
Employee benefits (7,017,679) (8,412,348)
Other expenses 3 (6,080,627) (4,873,030)
Earnings before interest, tax, depreciation and amortisation (EBITDA) 803,021 4,854,600
Depreciation and amortisation expense 3 (2,902,008) (2,622,465)
Finance costs 3 (582,108) (460,086)
Profit/(Loss) before income tax (2,681,095) 1,772,049
Income tax benefit/(expense) 4 2,139,471 (201,870)
Profit/(Loss) for the year from continuing operations (541,624) 1,570,179
Loss for the year from discontinued operations 31 (a) - (729,668)
Profit/(Loss) for the year (541,624) 840,511
Attributable to equity holders of the parent (541,624) 840,511
Other comprehensive income/(expense)
Items that may be reclassified subsequently to profit or loss:
Exchange differences arising on translation of foreign operations 177,758 22,125
Net change in the fair value of cash flow hedges recognised in equity (984,410) -
Income tax relating to components of other comprehensive income 4 295,323 -
Other comprehensive income for the period (net of tax) (511,329) 22,125
Total comprehensive income/(loss) for the period (1,052,953) 862,636
Attributable to equity holders of the parent (1,052,953) 862,636
(1,052,953) 862,636
Earnings per share from continuing operations:
Basic earnings per share (cents per share) 26 (0.51) 1.51
Diluted earnings per share (cents per share) 26 (0.51) 1.50
Earnings per share from discontinued operations:
Basic earnings per share (cents per share) 26 - (0.70)
Diluted earnings per share (cents per share) 26 - (0.70)
NetComm Wireless LimitedConsolidated statement of profit or loss & other comprehensive income
For the year ended 30 June 2013
The above consolidated statement of profit or loss & other comprehensive income should be read in conjunction with the
accompanying notes.
20

50 - NetComm Wireless - Annual Report 2012-2013
2013 2012
Note $ $
ASSETS
Current assets
Cash and cash equivalents 6 3,882,067 7,049,729
Trade and other receivables 7 4,700,381 9,333,294
Inventories 8 9,857,493 9,863,695
Other assets 9 1,252,681 1,087,316
Total current assets 19,692,622 27,334,034
Assets from discontinued operations 31 (b) - 5,300
Non-current assets
Property, plant and equipment 10 1,877,280 2,228,612
Deferred tax assets 4 (c) 4,441,435 2,027,119
Goodwill 11 895,999 895,999
Other intangible assets 12 6,216,712 4,389,931
Other assets 9 302,143 302,143
Total non-current assets 13,733,569 9,843,804
TOTAL ASSETS 33,426,191 37,183,138
LIABILITIES
Current liabilities
Trade and other payables 13 5,900,269 7,239,460
Borrowings 14 7,066,858 12,319,681
Provisions 15 634,460 908,542
Income tax liability - 128,216
Other current liabilities 16 203,299 421,555
Total current liabilities 13,804,886 21,017,454
Non-current liabilities
Borrowings 14 79,462 116,017
Provisions 15 313,076 222,752
Total non-current liabilities 392,538 338,769
TOTAL LIABILITIES 14,197,424 21,356,223
NET ASSETS 19,228,767 15,826,915
EQUITY
Issued capital 17 14,331,878 9,877,073
Reserves 18 (199,244) 312,085
Retained earnings 5,096,133 5,637,757
TOTAL EQUITY 19,228,767 15,826,915
NetComm Wireless LimitedConsolidated statement of financial position
For the year ended 30 June 2013
The above consolidated statement of financial position should be read in conjunction with the accompanying notes.
21

Annual Report 2012-2013 - NetComm Wireless - 51
Ord
inary
Reta
ined
Fo
reig
nF
ore
ign
Op
tion
s a
nd
To
tal
Sh
are
sE
arn
ing
sC
urre
ncy
Exch
an
ge
Sh
are
Rig
hts
Tra
nsla
tion
Hed
gin
gR
eserv
e
Reserv
eR
eserv
e
No
te$
$$
$$
$
9,7
96,7
73
4,7
97,2
46
(1
05,8
48)
-
352,4
76
14,8
40,6
47
-
840,5
11
-
-
-
840,5
11
-
-
22,1
25
-
-
22,1
25
-
840,5
11
22,1
25
-
-
862,6
36
18 (a
)-
-
-
-
43,3
32
43,3
32
17 (a
)80,3
00
-
-
-
-
80,3
00
9,8
77,0
73
5,6
37,7
57
(8
3,7
23)
-
395,8
08
15,8
26,9
15
9,8
77,0
73
5,6
37,7
57
(8
3,7
23)
-
395,8
08
15,8
26,9
15
-
(541,6
24)
-
-
-
(5
41,6
24)
18 (b
)-
-
177,7
58
-
-
177,7
58
18 (C
)-
-
-
(6
89,0
87)
-
(6
89,0
87)
-
(541,6
24)
177,7
58
(6
89,0
87)
-
(1
,052,9
53)
17 (a
)4,3
42,4
22
-
-
-
-
4,3
42,4
22
17 (a
)112,3
83
-
-
-
-
112,3
83
14,3
31,8
78
5,0
96,1
33
94,0
35
(6
89,0
87)
395,8
08
19,2
28,7
67
Co
nso
lidate
d s
tate
men
t of c
han
ges in
eq
uity
Fo
r the y
ear e
nd
ed
30 J
un
e 2
013
Pro
fit for th
e p
erio
d
NetC
om
m W
irele
ss L
imite
d
To
tal c
om
pre
hen
siv
e in
co
me fo
r the p
erio
d
Bala
nce a
t 1 J
uly
2011
Recognitio
n o
f share
based p
aym
ents
Exchange d
iffere
nce o
n tra
nsla
tion o
f fore
ign o
pera
tions
The a
bove c
onsolid
ate
d s
tate
ment o
f changes in
equity
should
be re
ad in
conju
nctio
n w
ith th
e a
ccom
panyin
g n
ote
s.
Exerc
ise o
f optio
ns
Bala
nce a
t 30 J
un
e 2
012
Bala
nce a
t 30 J
un
e 2
013
Fore
ign e
xchange h
edgin
g (N
et o
f tax)
Exerc
ise o
f optio
ns
To
tal c
om
pre
hen
siv
e in
co
me fo
r the p
erio
d
Loss fo
r the p
erio
d
Bala
nce a
t 1 J
uly
2012
Issue o
f ord
inary
share
s (N
et o
f transactio
n c
osts
and ta
x)
Exchange d
iffere
nce o
n tra
nsla
tion o
f fore
ign o
pera
tions
22

52 - NetComm Wireless - Annual Report 2012-2013
2013 2012
Note $ $
Cash flows from operating activities:
Receipts from customers 52,153,952 66,590,970
Payments to suppliers and employees (49,579,804) (66,208,860)
Finance costs (582,108) (460,086)
Income taxes paid - (193,522)
Net cash (used in) continuing operations 1,992,040 (271,498)
Net cash provided by discontinued operations 31(c) - 78,406
Net cash (used in) / provided by operating activities 21 1,992,040 (193,092)
Cash flows from investing activities:
Proceeds from sale of plant and equipment - 11,472
Interest received 77,575 95,388
Acquisition of property, plant and equipment (556,734) (421,041)
Acquisition of intangible assets (3,845,970) (3,631,462)
Net cash (used in) by investing activities (4,325,129) (3,945,643)
Cash flows from financing activities:
Proceeds from issue of shares & options (net of transaction costs & tax) 17 (a) 4,454,805 80,300
Proceeds from borrowings 48,510,971 62,029,949
Repayment of borrowings (53,800,349) (55,569,716)
Net cash provided by / (used in) financing activities (834,573) 6,540,533
Net increase in cash and cash equivalents held (3,167,662) 2,401,798
Cash and cash equivalents at beginning of financial period 7,049,729 4,647,931
Cash and cash equivalents at end of financial period 6 3,882,067 7,049,729
NetComm Wireless LimitedConsolidated statement of cash flows
For the year ended 30 June 2013
The above consolidated statement of cash flows should be read in conjunction with the accompanying notes.
23

Annual Report 2012-2013 - NetComm Wireless - 53
NetComm Wireless Limited Notes to the financial statements For the year ended 30 June 2013
24
1 Statement of Significant Accounting Policies General information
The financial statements are general purpose financial statements that have been prepared in accordance with Australian Accounting Standards, including Interpretations, other authoritative pronouncements of the Australian Accounting Standards Board and the Corporations Act 2001. The financial statements cover the consolidated Group of NetComm Wireless Limited (“the Group” or the “consolidated entity”). NetComm Wireless Limited is a listed public company, incorporated and domiciled in Australia, and is a for-profit entity for the purpose of preparing financial statements. Compliance with Australian Accounting Standards results in the compliance with the International Financial Reporting Standards (IFRS) as issued by the International Accounting Standards Board (IASB).
The financial statements were authorised for issue by the directors on 27 September 2013. The following is a summary of the material accounting policies adopted by the Group in the preparation of the financial statements. The accounting policies have been consistently applied, unless otherwise stated.
Basis of Preparation
The financial statements have been prepared on an accruals basis and are based on historical costs modified by the revaluation of selected non current assets, financial assets and financial liabilities for which the fair value basis of accounting has been applied. Cost is based on the fair values of the consideration given in exchange for assets. All amounts are presented in Australian dollars, unless otherwise noted.
Critical accounting judgements and key sources of uncertainty
In the application of the Group’s accounting policies, management is required to make judgements, estimates and assumptions about carrying values of assets and liabilities that are not readily apparent from other sources. The estimates and associated assumptions are based on historical experience and other factors that are considered to be relevant. Actual results may differ from these estimates. The estimates and underlying assumptions are reviewed on an ongoing basis. Revisions to accounting estimates are recognised in the period in which the estimate is revised if the revision affects only that period or in the period of the revision and future periods if the revision affects current and future periods. Refer to note 1(w) for a discussion of critical judgements in applying the entity’s accounting policies and key sources of estimation uncertainty.
Adoption of new and revised Accounting Standards
None of the new standards and amendments that are mandatory for the first time for the financial year beginning 1 July 2012 affected any of the amounts recognised in the current period or any prior period and are not likely to affect future periods. However, amendments made to AASB 101: Presentation of Financial Statements effective 1 July 2012 now require the statement of profit or loss and other comprehensive income to show the items of comprehensive income grouped into those that are not permitted to be reclassified to profit or loss in the future period and those that may have to be reclassified if certain conditions are met.

54 - NetComm Wireless - Annual Report 2012-2013
NetComm Wireless Limited Notes to the financial statements For the year ended 30 June 2013
25
1 Statement of Significant Accounting Policies (continued)
(a) Principles of Consolidation
The consolidated financial statements incorporate the assets and liabilities of all subsidiaries of NetComm Wireless Limited as at 30 June 2013 and the results of all subsidiaries for the year then ended. A subsidiary is an entity over which NetComm Wireless Limited has the power to control the financial and operating policies of an entity so as to obtain benefits from its activities. A list of subsidiaries is contained in Note 30(d) to the financial statements. All subsidiaries have a 30 June financial year end. All intercompany balances and transactions between entities in the consolidated entity, including any unrealised profits or losses, have been eliminated on consolidation. Accounting policies of subsidiaries have been changed where necessary to ensure consistencies with those policies applied by the parent entity. Subsidiaries are fully consolidated from the date which control is transferred to the Group. They are deconsolidated from the date control ceases.
(b) Business Combinations Acquisitions of subsidiaries and businesses are accounted for using the acquisition method. The cost of the
business combination is measured as the aggregate of the fair values (at the date of exchange) of assets given, liabilities incurred or assumed, and equity instruments issued by the Group in exchange for control of the acquiree. Acquisition related costs are recognised in the profit or loss as incurred. The acquiree’s identifiable assets, liabilities and contingent liabilities that meet the conditions for recognition under AASB 3 ‘Business Combinations’ are recognised at their fair values at the acquisition date, except for non-current assets (or disposal groups) that are classified as held for sale in accordance with AASB 5 ‘Non-current Assets Held for Sale and Discontinued Operations’, which are recognised and measured at fair value less costs to sell. Goodwill arising on acquisition is recognised as an asset and initially measured at cost, being the excess of the cost of the business combination over the Group’s interest in the net fair value of the identifiable assets, liabilities and contingent liabilities recognised. If, after reassessment, the Group’s interest in the net fair value of the acquiree’s identifiable assets, liabilities and contingent liabilities exceeds the cost of the business combination the excess is recognised immediately in profit or loss. The interest of minority shareholders in the acquiree is initially measured at the minority’s proportion of the net fair value of the assets, liabilities and contingent liabilities recognised. Where settlement of any part of cash consideration is deferred, the amounts payable in the future are discounted to their present value as at the date of exchange. The discount rate used is the entity’s incremental borrowing rate, being the rate at which a similar borrowing could be obtained from an independent financier under comparable terms and conditions.

Annual Report 2012-2013 - NetComm Wireless - 55
NetComm Wireless Limited Notes to the financial statements For the year ended 30 June 2013
25
1 Statement of Significant Accounting Policies (continued)
(a) Principles of Consolidation
The consolidated financial statements incorporate the assets and liabilities of all subsidiaries of NetComm Wireless Limited as at 30 June 2013 and the results of all subsidiaries for the year then ended. A subsidiary is an entity over which NetComm Wireless Limited has the power to control the financial and operating policies of an entity so as to obtain benefits from its activities. A list of subsidiaries is contained in Note 30(d) to the financial statements. All subsidiaries have a 30 June financial year end. All intercompany balances and transactions between entities in the consolidated entity, including any unrealised profits or losses, have been eliminated on consolidation. Accounting policies of subsidiaries have been changed where necessary to ensure consistencies with those policies applied by the parent entity. Subsidiaries are fully consolidated from the date which control is transferred to the Group. They are deconsolidated from the date control ceases.
(b) Business Combinations Acquisitions of subsidiaries and businesses are accounted for using the acquisition method. The cost of the
business combination is measured as the aggregate of the fair values (at the date of exchange) of assets given, liabilities incurred or assumed, and equity instruments issued by the Group in exchange for control of the acquiree. Acquisition related costs are recognised in the profit or loss as incurred. The acquiree’s identifiable assets, liabilities and contingent liabilities that meet the conditions for recognition under AASB 3 ‘Business Combinations’ are recognised at their fair values at the acquisition date, except for non-current assets (or disposal groups) that are classified as held for sale in accordance with AASB 5 ‘Non-current Assets Held for Sale and Discontinued Operations’, which are recognised and measured at fair value less costs to sell. Goodwill arising on acquisition is recognised as an asset and initially measured at cost, being the excess of the cost of the business combination over the Group’s interest in the net fair value of the identifiable assets, liabilities and contingent liabilities recognised. If, after reassessment, the Group’s interest in the net fair value of the acquiree’s identifiable assets, liabilities and contingent liabilities exceeds the cost of the business combination the excess is recognised immediately in profit or loss. The interest of minority shareholders in the acquiree is initially measured at the minority’s proportion of the net fair value of the assets, liabilities and contingent liabilities recognised. Where settlement of any part of cash consideration is deferred, the amounts payable in the future are discounted to their present value as at the date of exchange. The discount rate used is the entity’s incremental borrowing rate, being the rate at which a similar borrowing could be obtained from an independent financier under comparable terms and conditions.
NetComm Wireless Limited Notes to the financial statements For the year ended 30 June 2013
26
1 Statement of Significant Accounting Policies (continued)
(c) Foreign Currency Transactions and Balances & policy on hedge accounting for FX exposures Functional and presentation currency
The functional currency of each of the Group’s entities is measured using the currency of the primary economic environment in which that entity operates. The consolidated financial statements are presented in Australian dollars which is the parent entity’s functional and presentation currency.
Transaction and balances
Foreign currency transactions are translated into functional currency using the exchange rates prevailing at the date of the transaction. Foreign currency monetary items are translated at the year end exchange rate. Non monetary items measured at historical cost continue to be carried at the exchange rate at the date of the transaction. Non monetary items measured at fair value are reported at the exchange rate at the date when fair values were determined. Exchange differences arising on the translation of monetary items are recognised in profit or loss in the period in which they arise.
Group companies
The financial results and position of foreign operations whose functional currency is different from the Group’s presentation currency are translated as follows: • assets and liabilities are translated at year end exchange rates prevailing at that reporting date;
• income and expenses are translated at average exchange rates for the period; and
• all resulting exchange differences shall be recognised in other comprehensive income and as a separate
component of equity. Exchange differences arising on translation of foreign operations are transferred directly to the Group’s foreign currency translation reserve in the statement of financial position. These differences are recognised in profit or loss in the period in which the operation is disposed. Goodwill and fair value adjustments arising on the acquisition of a foreign entity on or after the date of transition to IFRS are treated as assets and liabilities of the foreign entity and translated at exchange rates prevailing at the reporting date.
Derivative financial instruments and hedge accounting
Derivative financial instruments are accounted for as financial assets at fair value through profit or loss (FVTPL) except for derivatives designated as hedging instruments in cash flow hedge relationships, which requires a specific accounting treatment. To qualify for hedge accounting, the hedging relationship must meet several strict conditions with respect to documentation, probability of occurrence of the hedged transaction and hedge effectiveness. All derivative financial instruments used for hedge accounting are recognised initially at fair value and reported subsequently at fair value in the statement of financial position.

56 - NetComm Wireless - Annual Report 2012-2013
NetComm Wireless Limited Notes to the financial statements For the year ended 30 June 2013
27
1 Statement of Significant Accounting Policies (continued)
Derivative financial instruments and hedge accounting (continued)
To the extent that the hedge is effective, changes in the fair value of derivatives designated as hedging instruments in cash flow hedges are recognised in other comprehensive income and included within the cash flow hedge reserve in equity. Any ineffectiveness in the hedge relationship is recognised immediately in profit or loss. At the time the hedged item affects profit or loss, any gain or loss previously recognised in other comprehensive income is reclassified from equity to profit or loss and presented as a reclassification adjustment within other comprehensive income. However, if a non-financial asset or liability is recognised as a result of the hedged transaction, the gains and losses previously recognised in other comprehensive income are included in the initial measurement of the hedged item.
If a forecast transaction is no longer expected to occur or if the hedging instrument becomes ineffective, any related gain or loss recognised in other comprehensive income is transferred immediately to profit or loss.
(d) Goods and Services Tax (GST)
Revenues, expenses and assets are recognised net of the amount of GST, except where the amount of GST incurred is not recoverable from the taxation authority or it is recognised as part of the cost of acquisition of an asset or part of an item of expenses. Receivables and payables in the statement of financial position are shown inclusive of GST and the net amount of GST recoverable from, or payable to, the taxation authority is included as part of receivables or payables. Cash flows are presented in the statement of cash flows on a gross basis, except for the GST component of investing and financing activities, which are disclosed as operating cash flows.
(e) Income Tax
The charge for current income tax expense is based on the profit for the year adjusted for any non-assessable or disallowed items. It is calculated using the tax rates that have been enacted or are substantively enacted by the balance date.
Deferred tax is accounted for in respect of temporary differences arising between the tax bases of assets and liabilities and their carrying amounts in the financial statements. No deferred income tax will be recognised from the initial recognition of an asset or liability, excluding a business combination, where there is no effect on accounting or taxable profit or loss.
Deferred tax is calculated at the tax rates that are expected to apply to the period when the asset is realised or liability is settled. Deferred tax is credited in profit or loss except where it relates to items that may be credited directly to equity, in which case the deferred tax is adjusted directly against equity. Deferred tax assets are recognised to the extent that it is probable that future tax profits will be available against which deductible temporary differences can be utilised.
NetComm Wireless Limited Notes to the financial statements For the year ended 30 June 2013
28
1 Statement of Significant Accounting Policies (continued) (e) Income Tax (continued)
The amount of benefits brought to account or which may be realised in the future is based on the assumption that no adverse change will occur in income taxation legislation and the anticipation that the consolidated Group will derive sufficient future assessable income to enable the benefit to be realised and comply with the conditions of deductibility imposed by the law.
NetComm Wireless Limited and its wholly-owned Australian subsidiaries have formed an income tax consolidated group under the tax consolidation regime. The group notified the Australian Tax Office that it had formed an income tax consolidated group to apply from 20 August 2006.
The stand-alone taxpayer within a group approach has been used to allocate current income tax expense and deferred tax expense to wholly-owned subsidiaries that form part of the tax consolidated group. Each entity in the group recognises its own current and deferred tax assets and liabilities, as if they continue to be a separate taxable entity in their own right, except for any deferred tax assets resulting from unused tax losses and tax credits, which are immediately assumed by the parent entity. The current tax liability of each group entity is then subsequently assumed by the parent entity.
(f) Revenue Recognition
Revenue is measured at the fair value of consideration received or receivable. Revenue is reduced for estimated customer returns, rebates and other similar allowances. Revenue from the sale of goods, including communications and networking devices, are recognised at the time goods are dispatched to customers. Revenue from a contract to provide services is recognised on a pro-rata basis over the term of the service agreement. Interest revenue is accrued on a time basis, by reference to the principal outstanding and at the effective interest rate applicable, which is the rate that exactly discounts estimated future cash receipts through the expected life of the financial asset to that asset’s net carrying amount. Other revenue is recognised when the right to receive the revenue has been established. All revenue is stated net of the amount of goods and services tax (GST).
(g) Share-based Payments
Equity settled compensation benefits are provided to employees via the Employee Option Plan and the NetComm Wireless Limited Executive Employee Share Plan. Information relating to these plans is set out in notes 22 & 24. The fair value of options granted is recognised as an employee benefit expense with a corresponding increase in equity. The fair value is measured at grant date and recognised over the period during which the employees become unconditionally entitled to the options.
The fair value at grant date is independently determined using a Binomial Approximation option pricing model that takes into account the exercise price, the term of the option, the share price at grant date, the expected volatility of the underlying share, the expected dividend yield and the risk free rate for the term of the option. The fair value of the options granted excludes the impact of any non market vesting conditions. Non market vesting conditions are included in assumptions about the number of options that are expected to vest. At each balance date, the entity revises its estimate of the number of options that are expected to vest. The employee benefit expense recognised each period takes into account the most recent estimate.

Annual Report 2012-2013 - NetComm Wireless - 57
NetComm Wireless Limited Notes to the financial statements For the year ended 30 June 2013
28
1 Statement of Significant Accounting Policies (continued) (e) Income Tax (continued)
The amount of benefits brought to account or which may be realised in the future is based on the assumption that no adverse change will occur in income taxation legislation and the anticipation that the consolidated Group will derive sufficient future assessable income to enable the benefit to be realised and comply with the conditions of deductibility imposed by the law.
NetComm Wireless Limited and its wholly-owned Australian subsidiaries have formed an income tax consolidated group under the tax consolidation regime. The group notified the Australian Tax Office that it had formed an income tax consolidated group to apply from 20 August 2006.
The stand-alone taxpayer within a group approach has been used to allocate current income tax expense and deferred tax expense to wholly-owned subsidiaries that form part of the tax consolidated group. Each entity in the group recognises its own current and deferred tax assets and liabilities, as if they continue to be a separate taxable entity in their own right, except for any deferred tax assets resulting from unused tax losses and tax credits, which are immediately assumed by the parent entity. The current tax liability of each group entity is then subsequently assumed by the parent entity.
(f) Revenue Recognition
Revenue is measured at the fair value of consideration received or receivable. Revenue is reduced for estimated customer returns, rebates and other similar allowances. Revenue from the sale of goods, including communications and networking devices, are recognised at the time goods are dispatched to customers. Revenue from a contract to provide services is recognised on a pro-rata basis over the term of the service agreement. Interest revenue is accrued on a time basis, by reference to the principal outstanding and at the effective interest rate applicable, which is the rate that exactly discounts estimated future cash receipts through the expected life of the financial asset to that asset’s net carrying amount. Other revenue is recognised when the right to receive the revenue has been established. All revenue is stated net of the amount of goods and services tax (GST).
(g) Share-based Payments
Equity settled compensation benefits are provided to employees via the Employee Option Plan and the NetComm Wireless Limited Executive Employee Share Plan. Information relating to these plans is set out in notes 22 & 24. The fair value of options granted is recognised as an employee benefit expense with a corresponding increase in equity. The fair value is measured at grant date and recognised over the period during which the employees become unconditionally entitled to the options.
The fair value at grant date is independently determined using a Binomial Approximation option pricing model that takes into account the exercise price, the term of the option, the share price at grant date, the expected volatility of the underlying share, the expected dividend yield and the risk free rate for the term of the option. The fair value of the options granted excludes the impact of any non market vesting conditions. Non market vesting conditions are included in assumptions about the number of options that are expected to vest. At each balance date, the entity revises its estimate of the number of options that are expected to vest. The employee benefit expense recognised each period takes into account the most recent estimate.

58 - NetComm Wireless - Annual Report 2012-2013
NetComm Wireless Limited Notes to the financial statements For the year ended 30 June 2013
29
1 Statement of Significant Accounting Policies (continued)
(g) Share-based Payments (continued)
Equity-settled share based payment transactions with other parties are measured at the fair value of the goods and services received, except where the fair value cannot be estimated reliably, in which case they are measured at the fair value of the equity instruments granted, measured at the date the entity obtains the goods or the counterparty renders the service. For cash-settled share-based payments, a liability equal to the portion of the goods or services received is recognised at the current fair value determined at each reporting date.
(h) Property, Plant and Equipment
Each class of property, plant and equipment is carried at cost less, where applicable, any accumulated depreciation and impairment losses. Cost includes all directly attributable expenditure incurred including costs to get the asset ready for its use as intended by management. Costs include an estimate of any expenditure expected to be incurred at the end of the asset’s useful life, including restoration, rehabilitation and decommissioning costs. The carrying amount of property, plant and equipment is reviewed annually by directors for indications of impairment. If any such indications exist, an impairment test is carried out, and any impairment losses on the assets recognised.
Depreciation
The depreciable amount of all fixed assets is depreciated on a straight line basis over their useful lives to the Group commencing from the time the asset is held ready for use. Leasehold improvements are depreciated over the shorter of either the unexpired period of the lease or the estimated useful lives of the improvements. The depreciable amount is the carrying value of the asset less estimated residual amounts. The residual amount is based on what a similar asset of the expected condition of the asset at the end of its useful life could be sold for.
The depreciation rates used for each class of depreciable assets are:
Class of Asset Useful Life Plant and equipment 2-6 years Leasehold improvements Over the term of the lease Development assets 2-6 years
The assets’ residual values and useful lives are reviewed, and adjusted if appropriate, at each balance date. Gains and losses on disposals are determined by comparing proceeds with the carrying amount. These gains and losses are recognised in profit or loss.

Annual Report 2012-2013 - NetComm Wireless - 59
NetComm Wireless Limited Notes to the financial statements For the year ended 30 June 2013
29
1 Statement of Significant Accounting Policies (continued)
(g) Share-based Payments (continued)
Equity-settled share based payment transactions with other parties are measured at the fair value of the goods and services received, except where the fair value cannot be estimated reliably, in which case they are measured at the fair value of the equity instruments granted, measured at the date the entity obtains the goods or the counterparty renders the service. For cash-settled share-based payments, a liability equal to the portion of the goods or services received is recognised at the current fair value determined at each reporting date.
(h) Property, Plant and Equipment
Each class of property, plant and equipment is carried at cost less, where applicable, any accumulated depreciation and impairment losses. Cost includes all directly attributable expenditure incurred including costs to get the asset ready for its use as intended by management. Costs include an estimate of any expenditure expected to be incurred at the end of the asset’s useful life, including restoration, rehabilitation and decommissioning costs. The carrying amount of property, plant and equipment is reviewed annually by directors for indications of impairment. If any such indications exist, an impairment test is carried out, and any impairment losses on the assets recognised.
Depreciation
The depreciable amount of all fixed assets is depreciated on a straight line basis over their useful lives to the Group commencing from the time the asset is held ready for use. Leasehold improvements are depreciated over the shorter of either the unexpired period of the lease or the estimated useful lives of the improvements. The depreciable amount is the carrying value of the asset less estimated residual amounts. The residual amount is based on what a similar asset of the expected condition of the asset at the end of its useful life could be sold for.
The depreciation rates used for each class of depreciable assets are:
Class of Asset Useful Life Plant and equipment 2-6 years Leasehold improvements Over the term of the lease Development assets 2-6 years
The assets’ residual values and useful lives are reviewed, and adjusted if appropriate, at each balance date. Gains and losses on disposals are determined by comparing proceeds with the carrying amount. These gains and losses are recognised in profit or loss.
NetComm Wireless Limited Notes to the financial statements For the year ended 30 June 2013
30
1 Statement of Significant Accounting Policies (continued)
(i) Impairment of Assets
At each reporting date, the Group reviews the carrying values of its tangible and intangible assets to determine whether there is any indication that those assets have been impaired. If such an indication exists, the recoverable amount of the asset, being the higher of the asset’s fair value less costs to sell and value in use, is compared to the asset’s carrying value. Any excess of the asset’s carrying value over its recoverable amount is recognised in profit or loss. In assessing value in use, the estimated future cash flows are discounted to their present value using a pre tax discount rate that reflects current market assessments of the time value of money and the risks specific to the asset for which the estimates of future cash flows have not been adjusted.
Where it is not possible to estimate the recoverable amount of an individual asset, the Group estimates the recoverable amount of the cash generating unit to which the asset belongs. Where an impairment loss subsequently reverses, the carrying amount of the asset or cash generating unit is increased to the revised recoverable amount, but so that the increased carrying amount does not exceed the carrying amount that would have been determined had no impairment loss been recognised in prior years. A reversal of an impairment loss is recognised immediately in profit or loss. Impairment of goodwill is not reversed. Refer also to note 1(y) on goodwill.
(j) Leases
Leases of fixed assets where substantially all the risks and benefits incidental to the ownership of the asset, but not the legal ownership that are transferred to entities in the Group are classified as finance leases. Finance leases are capitalised by recording an asset and a liability at the lower of the amounts equal to the fair value of the leased property or the present value of the minimum lease payments, including any guaranteed residual values. Lease payments are allocated between the reduction of the lease liability and the lease interest expense for the period. The interest expense is recognised in the profit or loss so as to achieve a constant periodic rate of interest on the remaining balance of the liability outstanding. Lease payments for operating leases, where substantially all of the risks and benefits remain with the lessor, are recognised in profit or loss on a straight line basis over the lease term. Contingent rentals are recognised as an expense in the period in which they are incurred.
Lease incentives under operating leases are recognised as a liability and amortised on a straight line basis over the life of the lease.
(k) Derivative Financial Instruments
The fair value of all derivative financial instruments outstanding at reporting date are recognised in the statement of financial position as either financial assets or financial liabilities. Changes in the fair value of derivative financial instruments that are designated and effective as hedges of future cash flows are recognised directly in equity, with any ineffective portion being recognised in profit or loss. Changes in the fair value of derivative financial instruments are recognised in profit or loss as they arise. Derivatives embedded in other financial instruments, or other non financial host contracts, are treated as separate derivatives when their risks and characteristics are not closely related to those of the host contract, and the host contract is not carried at fair value with unrealised gains or losses reported in profit or loss.

60 - NetComm Wireless - Annual Report 2012-2013
NetComm Wireless Limited Notes to the financial statements For the year ended 30 June 2013
31
1 Statement of Significant Accounting Policies (continued) (l) Financial Assets
Financial assets are classified into the following specified category: ‘loans and receivables’. The classification depends on the nature and purpose of the financial assets and is determined at the time of initial recognition.
Loans and receivables
Trade receivables, loans and other receivables that have fixed or determinable payments that are not quoted in an active market are classified as ‘loans and receivables’. Loans and receivables are measured at amortised cost using the effective interest method less impairment. Interest income is recognised by applying the effective interest rate. Appropriate allowances for estimated irrecoverable amounts are recognised in profit or loss when there is objective evidence that the asset is impaired. The allowance recognised is measured as the difference between the asset’s carrying amount and the present value of estimated future cash flows discounted at the effective interest rate computed at initial recognition.
Effective interest method
The effective interest method is a method of calculating the amortised cost of a financial asset and of allocating interest income over the relevant period. The effective interest rate is the rate that exactly discounts estimated future cash receipts (including all fees on points paid or received that form an integral part of the effective interest rate, transaction costs and other premiums or discounts) through the expected life of the financial asset, or, where appropriate, a shorter period. Income is recognised on an effective interest basis for debt instruments.
(m) Cash and Cash Equivalents
Cash and cash equivalents include cash on hand and in banks, deposits held at call with banks and financial institutions, investments in money market instruments with maturities of three months or less from the date of acquisition, and bank overdrafts. Bank overdrafts are shown within short term borrowings in current liabilities on the statement of financial position.
(n) Inventories
Finished goods and raw materials are valued at the lower of cost and net realisable value. Cost is the direct cost of purchase, plus freight and duty and any other costs directly attributable to acquisition. Net realisable value represents the estimated selling price for inventories less all estimated costs of completion and costs necessary to make the sale. Inventory is recognised on a weighted average cost basis.

Annual Report 2012-2013 - NetComm Wireless - 61
NetComm Wireless Limited Notes to the financial statements For the year ended 30 June 2013
31
1 Statement of Significant Accounting Policies (continued) (l) Financial Assets
Financial assets are classified into the following specified category: ‘loans and receivables’. The classification depends on the nature and purpose of the financial assets and is determined at the time of initial recognition.
Loans and receivables
Trade receivables, loans and other receivables that have fixed or determinable payments that are not quoted in an active market are classified as ‘loans and receivables’. Loans and receivables are measured at amortised cost using the effective interest method less impairment. Interest income is recognised by applying the effective interest rate. Appropriate allowances for estimated irrecoverable amounts are recognised in profit or loss when there is objective evidence that the asset is impaired. The allowance recognised is measured as the difference between the asset’s carrying amount and the present value of estimated future cash flows discounted at the effective interest rate computed at initial recognition.
Effective interest method
The effective interest method is a method of calculating the amortised cost of a financial asset and of allocating interest income over the relevant period. The effective interest rate is the rate that exactly discounts estimated future cash receipts (including all fees on points paid or received that form an integral part of the effective interest rate, transaction costs and other premiums or discounts) through the expected life of the financial asset, or, where appropriate, a shorter period. Income is recognised on an effective interest basis for debt instruments.
(m) Cash and Cash Equivalents
Cash and cash equivalents include cash on hand and in banks, deposits held at call with banks and financial institutions, investments in money market instruments with maturities of three months or less from the date of acquisition, and bank overdrafts. Bank overdrafts are shown within short term borrowings in current liabilities on the statement of financial position.
(n) Inventories
Finished goods and raw materials are valued at the lower of cost and net realisable value. Cost is the direct cost of purchase, plus freight and duty and any other costs directly attributable to acquisition. Net realisable value represents the estimated selling price for inventories less all estimated costs of completion and costs necessary to make the sale. Inventory is recognised on a weighted average cost basis.
NetComm Wireless Limited Notes to the financial statements For the year ended 30 June 2013
32
1 Statement of Significant Accounting Policies (continued) (o) Intangibles Research and development costs
Expenditure during the research phase of a project is recognised as an expense when incurred. Development costs (relating to the design and testing of new or improved products) are recognised as intangible assets when it is probable that the project will generate future benefits considering its commercial and technical feasibility and its cost can be measured reliably. The expenditure capitalised consists of all directly attributable costs. Capitalised development costs are amortised from the point at which the product is ready for use and for no longer than 3 years.
Subsequent to initial recognition, intangible assets are reported at cost less accumulated amortisation and impairment costs.
Computer software
Computer software is measured on a cost basis less amortisation and impairment losses. Computer software is amortised on a straight line basis over 3.3 years, commencing from the time the software is ready for use.
Development assets Cost incurred in acquiring assets for research and development is measured at costs less accumulated amortisation and any accumulated impairment losses. Development assets are amortised on a straight line basis over 2-6 years.
(p) Borrowing Costs Borrowing costs are recognised in profit or loss in the period in which they are incurred.
(q) Employee Benefits
Provision is made for the Group’s liability for employee benefits arising from services rendered by employees to balance date, including wages and salaries, annual leave and long service leave. Employee benefits that are expected to be settled within one year have been measured at the amounts expected to be paid when the liability is settled, plus related on costs. Employee benefits payable later than one year have been measured at present value of the estimated future cash outflows to be made for those benefits. Contributions are made by the Group to employee superannuation funds which are of the defined contribution type. Contributions to these defined contribution superannuation schemes are recognised as an expense in the period they are payable.
(r) Financial instruments Debt and equity instruments
Debt and equity instruments are classified as either liabilities or equity in accordance with the substance of the contractual arrangement. An equity instrument is any contract that evidences a residual interest in the assets of an entity after deducting all of its liabilities. Equity instruments issued by the Group are recorded at the proceeds received, net of direct issue costs.

62 - NetComm Wireless - Annual Report 2012-2013
NetComm Wireless Limited Notes to the financial statements For the year ended 30 June 2013
33
1 Statement of Significant Accounting Policies (continued)
(r) Financial instruments (continued) Other financial liabilities
Other financial liabilities, including borrowings, are initially measured at fair value, net of transaction costs and are subsequently measured at amortised cost using the effective interest method, with the interest expense recognised on an effective yield basis. The effective interest method is a method of calculating the amortised cost of a financial liability and of allocating interest expense over the relevant period. The effective interest rate is the rate that exactly discounts estimated future cash payments through the expected life of the financial liability, or, where appropriate, a shorter period.
Trade payables
Trade payables are initially measured at fair value, and are subsequently measured at amortised cost.
(s) Provisions
Provisions are recognised when the Group has a legal or constructive obligation, as a result of past events, for which it is probable that an outflow of economic benefits will result and that outflow can be reliably measured.
(t) Earnings per share Basic earnings per share is determined by dividing net profit after income tax attributable to members of the company, by the weighted average number of ordinary shares outstanding during the financial year, adjusted for bonus elements in ordinary shares issued during the year. Diluted earnings per share adjusts the figures in the determination of basic earnings per share by taking into account the after income tax effect of interest and other financing costs associated with dilutive potential ordinary shares and the weighted average number of shares assumed to have been issued for no consideration in relation to dilutive potential ordinary shares.
(u) Dividends
A liability is recorded for the amount of any dividend declared, determined or publicly recommended by the directors on or before the end of financial year but not distributed at balance date.
(v) Issued capital
Ordinary shares are classified as equity.
Incremental costs directly attributable to the issue of new shares are shown in equity as a deduction, net of transaction costs and tax, from the proceeds.
NetComm Wireless Limited Notes to the financial statements For the year ended 30 June 2013
34
1 Statement of Significant Accounting Policies (continued) (w) Standards and Interpretations issued not yet effective
Certain new accounting standards and interpretations have been published that are not mandatory for 30 June, 2013 reporting periods. The Group’s assessment of the impact of these new standards and Interpretations are set out below. (i) AASB 9 Financial Instruments (effective from 1 January, 2015) AASB 9 aims to replace AASB 139 Financial Instruments: Recognition and Measurement in its entirety. AASB 9 requires that gains or losses on financial liabilities measured at fair value are recognised in profit or loss, except that the effects of changes in the liability’s credit risk are recognised in other comprehensive income. The amendments require that any changes in fair value attributable to the liability’s credit risk be recognised in other comprehensive income instead of profit or loss. The replacement standard (AASB 9) is being issued in phases. To date, the chapters dealing with recognition, classification, measurement and derecognition of financial assets and liabilities have been issued. These chapters are effective for annual periods beginning 1 January 2015. Further chapters dealing with impairment methodology and hedge accounting are still being developed.
Management have yet to assess the impact that this amendment is likely to have on the financial statements of the Group. However, they do not expect to implement the amendments until all chapters of AASB 9 have been published and they can comprehensively assess the impact of all changes. (ii) AASB 10 Consolidated Financial Statements (effective from 1 January, 2014) AASB 10 establishes a revised control model which broadens the situations when an entity is considered to be controlled by another entity. The effect of this change may lead to more entities being consolidated into the Group. The Company does not expect that this change with have any impact on the financial statements due to there currently not being any entities or investment within the group that are not currently consolidated. (iii) AASB 13 Fair Value Measurement (effective from 1 January, 2014) Currently, fair value measurement requirements are included in several Accounting Standards. AASB 13 establishes a single framework for measuring fair value of financial and non-financial items recognized at fair value in the statement of financial position or disclosed in the notes in the financial statements. The Company has not yet conducted a detailed analysis of the differences between the current fair value calculation methodologies used and those required by AASB 13. The Group’s management have yet to assess the impact of this new standard.
(iv) AASB 119 Employee Benefits (effective1 January, 2013). The Company currently calculates its liability for annual leave employee benefits on the basis that it is due to be settled within 12 months of the end of the reporting period because employees are entitled to use this leave at any time. The amendments to AASB 119 require that such liabilities be calculated on the basis of when the leave is expected to be taken, i.e. expected settlement.
When this standard is first adopted for the 30 June, 2014 year end, annual leave liabilities will be recalculated on 1 July 2012. Leave liabilities for any employees with significant balances of leave outstanding who are not expected to take their leave within 12 months will be discounted, which may result in a reduction of the annual leave liabilities recognised on 1 July 2012, and a corresponding increase in retained earnings at that date.

Annual Report 2012-2013 - NetComm Wireless - 63
NetComm Wireless Limited Notes to the financial statements For the year ended 30 June 2013
33
1 Statement of Significant Accounting Policies (continued)
(r) Financial instruments (continued) Other financial liabilities
Other financial liabilities, including borrowings, are initially measured at fair value, net of transaction costs and are subsequently measured at amortised cost using the effective interest method, with the interest expense recognised on an effective yield basis. The effective interest method is a method of calculating the amortised cost of a financial liability and of allocating interest expense over the relevant period. The effective interest rate is the rate that exactly discounts estimated future cash payments through the expected life of the financial liability, or, where appropriate, a shorter period.
Trade payables
Trade payables are initially measured at fair value, and are subsequently measured at amortised cost.
(s) Provisions
Provisions are recognised when the Group has a legal or constructive obligation, as a result of past events, for which it is probable that an outflow of economic benefits will result and that outflow can be reliably measured.
(t) Earnings per share Basic earnings per share is determined by dividing net profit after income tax attributable to members of the company, by the weighted average number of ordinary shares outstanding during the financial year, adjusted for bonus elements in ordinary shares issued during the year. Diluted earnings per share adjusts the figures in the determination of basic earnings per share by taking into account the after income tax effect of interest and other financing costs associated with dilutive potential ordinary shares and the weighted average number of shares assumed to have been issued for no consideration in relation to dilutive potential ordinary shares.
(u) Dividends
A liability is recorded for the amount of any dividend declared, determined or publicly recommended by the directors on or before the end of financial year but not distributed at balance date.
(v) Issued capital
Ordinary shares are classified as equity.
Incremental costs directly attributable to the issue of new shares are shown in equity as a deduction, net of transaction costs and tax, from the proceeds.
NetComm Wireless Limited Notes to the financial statements For the year ended 30 June 2013
34
1 Statement of Significant Accounting Policies (continued) (w) Standards and Interpretations issued not yet effective
Certain new accounting standards and interpretations have been published that are not mandatory for 30 June, 2013 reporting periods. The Group’s assessment of the impact of these new standards and Interpretations are set out below. (i) AASB 9 Financial Instruments (effective from 1 January, 2015) AASB 9 aims to replace AASB 139 Financial Instruments: Recognition and Measurement in its entirety. AASB 9 requires that gains or losses on financial liabilities measured at fair value are recognised in profit or loss, except that the effects of changes in the liability’s credit risk are recognised in other comprehensive income. The amendments require that any changes in fair value attributable to the liability’s credit risk be recognised in other comprehensive income instead of profit or loss. The replacement standard (AASB 9) is being issued in phases. To date, the chapters dealing with recognition, classification, measurement and derecognition of financial assets and liabilities have been issued. These chapters are effective for annual periods beginning 1 January 2015. Further chapters dealing with impairment methodology and hedge accounting are still being developed.
Management have yet to assess the impact that this amendment is likely to have on the financial statements of the Group. However, they do not expect to implement the amendments until all chapters of AASB 9 have been published and they can comprehensively assess the impact of all changes. (ii) AASB 10 Consolidated Financial Statements (effective from 1 January, 2014) AASB 10 establishes a revised control model which broadens the situations when an entity is considered to be controlled by another entity. The effect of this change may lead to more entities being consolidated into the Group. The Company does not expect that this change with have any impact on the financial statements due to there currently not being any entities or investment within the group that are not currently consolidated. (iii) AASB 13 Fair Value Measurement (effective from 1 January, 2014) Currently, fair value measurement requirements are included in several Accounting Standards. AASB 13 establishes a single framework for measuring fair value of financial and non-financial items recognized at fair value in the statement of financial position or disclosed in the notes in the financial statements. The Company has not yet conducted a detailed analysis of the differences between the current fair value calculation methodologies used and those required by AASB 13. The Group’s management have yet to assess the impact of this new standard.
(iv) AASB 119 Employee Benefits (effective1 January, 2013). The Company currently calculates its liability for annual leave employee benefits on the basis that it is due to be settled within 12 months of the end of the reporting period because employees are entitled to use this leave at any time. The amendments to AASB 119 require that such liabilities be calculated on the basis of when the leave is expected to be taken, i.e. expected settlement.
When this standard is first adopted for the 30 June, 2014 year end, annual leave liabilities will be recalculated on 1 July 2012. Leave liabilities for any employees with significant balances of leave outstanding who are not expected to take their leave within 12 months will be discounted, which may result in a reduction of the annual leave liabilities recognised on 1 July 2012, and a corresponding increase in retained earnings at that date.

64 - NetComm Wireless - Annual Report 2012-2013
NetComm Wireless Limited Notes to the financial statements For the year ended 30 June 2013
35
1 Statement of Significant Accounting Policies (continued) (w) Standards and Interpretations issued not yet effective (continued)
(vi) AASB 12 Disclosure of Interests in Other Entities (effective from 1 January, 2014) AASB 12 combines the disclosure requirements for subsidiaries, joint arrangements, associates and structured entities within a comprehensive disclosure standard. Its aim is to provide more transparency on ‘borderline’ consolidation decisions and includes enhanced disclosures centred on significant judgements and assumptions made around determining control, joint control and significant influence. The Company does not expect that this change will have any impact on the financial statements other than to add additional disclosure.
Then Group will adopt the new standards detailed above from their operative date. They will therefore be applied in the financial statement for the annual reporting ending 30 June 2014. There are no other standards that are not yet effective and that are expected to have a material impact on the Group in the current or future reporting periods and on foreseeable future transactions.
(x) Critical accounting estimates and judgements
The directors evaluate estimates and judgments incorporated into the financial statements based on historical knowledge and best available current information. Estimates assume a reasonable expectation of future events and based on current trends and economic data, obtained both externally and within the Group. The following are the critical judgements (apart from those involving estimations, which are dealt with below) that management has made in the process of applying the Group’s accounting policies and that have the most significant effect on the amounts recognised in the financial statements.
Inventories
Note 8 sets out the categories of inventories carried. The net realisable value of inventories is the estimated selling price in the ordinary course of business less estimated costs to sell which approximates fair value less costs to sell. The key assumptions require the use of management judgement and are reviewed annually. These key assumptions are the variables affecting the estimated costs to sell and expected selling price. Any reassessment of cost to sell or selling price in a particular year will affect the cost of goods sold. The following are the key assumptions concerning the future and other key sources of estimation uncertainty at the reporting date, that have a significant risk of causing a material adjustment to the carrying amounts of assets and liabilities within the next financial year:
Impairment of assets
The Group assesses impairment at each reporting date by evaluating conditions specific to the Group that may lead to impairment of assets. Where an impairment trigger exists, the recoverable amount of the asset is determined. Value in use calculations performed in assessing recoverable amounts incorporate a number of key estimates.

Annual Report 2012-2013 - NetComm Wireless - 65
NetComm Wireless Limited Notes to the financial statements For the year ended 30 June 2013
36
1 Statement of Significant Accounting Policies (continued)
(x) Critical accounting estimates and judgements (continued)
Deferred Tax Asset
Deferred tax is calculated at the tax rates that are expected to apply to the period when the asset is realised or liability is settled. Deferred tax is credited in profit or loss except where it relates to items that may be credited directly to equity, in which case the deferred tax is adjusted directly against equity. Deferred tax assets are recognised to the extent that it is probable that future tax profits will be available against which deductible temporary differences can be utilised.
The amount of benefits brought to account or which may be realised in the future is based on the assumption that no adverse change will occur in income taxation legislation and the anticipation that the consolidated Group will derive sufficient future assessable income to enable the benefit to be realised and comply with the conditions of deductibility imposed by the law.
Internally generated intangible assets – research and development expenditure Expenditure on research activities is recognised as an expense in the period in which it is incurred. An internally-generated intangible asset arising from development (or from the development phase of an internal project) is recognised if, and only if, all of the following have been demonstrated:
the technical feasibility of completing the intangible asset so that it will be available for use or sale;
the intention to complete the intangible asset and use or sell it; the ability to use or sell the intangible asset; how the intangible asset will generate probable future economic benefits; the availability of adequate technical, financial and other resources to complete the development
and to use or sell the intangible asset; and the ability to measure reliably the expenditure attributable to the intangible asset during its
development.
The amount initially recognised for internally-generated intangible assets is the sum of the expenditure incurred from the date when the intangible asset first meets the recognition criteria listed above. Where no internally-generated intangible asset can be recognised, development expenditure is recognised in profit or loss in the period in which it is incurred. Subsequent to initial recognition, internally-generated intangible assets are reported at cost less accumulated amortisation and accumulated impairment losses, on the same basis as intangible assets that are acquired separately.
(y) Goodwill
Goodwill acquired in a business combination is initially measured at its cost, being the excess of the cost of the business combination over the Group’s interest in the net fair value of the identifiable assets, liabilities and contingent liabilities recognised at the date of the acquisition. Goodwill is subsequently measured at its cost less any accumulated impairment losses.
For the purpose of impairment testing, goodwill is allocated to each of the Group’s cash generating units, or groups of cash-generating units, expected to benefit from the synergies of the business combination. Cash-generating units or groups of cash-generating units to which goodwill has been allocated are tested for impairment annually or more frequently if events or changes in circumstances indicate that goodwill might be impaired.

66 - NetComm Wireless - Annual Report 2012-2013
NetComm Wireless Limited Notes to the financial statements For the year ended 30 June 2013
37
1 Statement of Significant Accounting Policies (continued)
(y) Goodwill (continued) If the recoverable amount of the cash-generating unit (or group of cash-generating units) is less than the carrying amount of the cash-generating unit (or groups of cash-generating units), the impairment loss is allocated first to reduce the carrying amount of any goodwill allocated to the cash-generating unit (or groups of cash-generating units) and then to the other assets of the cash generating units pro-rata on the basis of the carrying amount of each asset in the cash-generating unit (or groups of cash-generating units). An impairment loss recognised for goodwill is recognised immediately in profit or loss and is not reversed in a subsequent period. On disposal of an operation within a cash-generating unit, the attributable amount of goodwill is included in the determination of the profit or loss on disposal of the operation.
(z) Discontinued operations In the consolidated statement of profit or loss and other comprehensive income, income and expenses from discontinued operations are reported separately from income and expenses from continuing operations. The resulting profit or loss (after taxes) is reported separately in the consolidated statement of profit or loss and other comprehensive income.

Annual Report 2012-2013 - NetComm Wireless - 67
NetComm Wireless Limited Notes to the financial statements For the year ended 30 June 2013
37
1 Statement of Significant Accounting Policies (continued)
(y) Goodwill (continued) If the recoverable amount of the cash-generating unit (or group of cash-generating units) is less than the carrying amount of the cash-generating unit (or groups of cash-generating units), the impairment loss is allocated first to reduce the carrying amount of any goodwill allocated to the cash-generating unit (or groups of cash-generating units) and then to the other assets of the cash generating units pro-rata on the basis of the carrying amount of each asset in the cash-generating unit (or groups of cash-generating units). An impairment loss recognised for goodwill is recognised immediately in profit or loss and is not reversed in a subsequent period. On disposal of an operation within a cash-generating unit, the attributable amount of goodwill is included in the determination of the profit or loss on disposal of the operation.
(z) Discontinued operations In the consolidated statement of profit or loss and other comprehensive income, income and expenses from discontinued operations are reported separately from income and expenses from continuing operations. The resulting profit or loss (after taxes) is reported separately in the consolidated statement of profit or loss and other comprehensive income.
2
2013 2012
$ $
Revenue
Sales revenue 42,779,990 59,186,120
42,779,990 59,186,120
Other income
Interest revenue 77,575 95,388
Other revenue 35 79,969
77,610 175,357
Total revenue and other income 42,857,600 59,361,477
3
Included in expenses are the following specific items
2013 2012
$ $
Other expenses comprising:
Advertising and marketing 615,176 (168,200)
Property expenses 934,189 832,115
Distribution and selling costs 813,722 952,478
Insurance expenses 332,212 267,437
Legal & professional fees 712,902 526,588
Travel expenses 833,763 739,287
Contractor costs 505,758 608,299
Other expenses 1,332,905 1,115,026
6,080,627 4,873,030
915,175 644,941
1,986,833 1,977,524
2,902,008 2,622,465
2013 2012
$ $
Auditors' remuneration
Auditing or reviewing the financial statements 101,500 51,510
Taxation services 30,399 12,750
Other services - consulting 9,086 -
140,985 64,260
2013 2012
$ $
Other auditors:
BDO Audit (NSW-VIC) Pty Limited
Auditing or reviewing the financial statements - 56,999
Taxation services - 14,275
Other services - consulting - 35,681
- 106,955
Deloitte
Taxation services 664 1,641
664 1,641
Crowe Horwath
Other services - consulting 19,200 -
19,200 -
Total auditors' remuneration 160,849 172,856
2013 2012
$ $
Rental expenses on operating leases
Minimum lease payments 819,752 645,208
Finance Costs
Bank borrowings 552,719 407,682
Finance leases 29,389 52,404
582,108 460,086
Cost of sales 28,956,158 41,221,500
(Reversal)/impairment of doubtful receivables 4,155 (98,357)
Defined contribution superannuation expenses 644,483 634,003
Loss on sale of property, plant and equipment (231) 15,393
Research & development costs 909,520 569,276
Share-based payments - equity settled benefit - 43,332
NetComm Wireless Limited
Notes to the Financial Statements
For the Year Ended 30 June 2013
Revenue and other income from continuing operations
Depreciation, amortisation and impairments:
Amortisation of intangible assets (note 12(b))
Expenses
Depreciation of property, plant and equipment (note 10(b))
Grant Thornton is the auditor of the Group. Amounts received or due and receivable by Grant Thornton are detailed below:
38

68 - NetComm Wireless - Annual Report 2012-2013NetComm Wireless Limited
Notes to the Financial Statements
For the Year Ended 30 June 2013
4
(a) Income tax recognised in profit or loss 2013 2012
$ $
Tax expense comprises:
Current tax (benefit)/expense (1,755,117) (371,655)
349,404 773,066
Under/(over) provision for tax in prior year (733,758) (199,541)
Income tax (benefit)/expense (2,139,471) 201,870
Income tax recognised in other comprehensive income
Income tax relating to components of other comprehensive income (295,323) -
(b)
2013 2012
$ $
i) Amounts recognised in profit or loss
Net profit/(loss) before tax (2,681,095) 1,772,049
(804,329) 531,615
- Share based payments - 13,000
- Entertainment 6,980 4,500
-Tax rate Difference in NZ - 28% (16,041) (22,514)
- Other items 4,287 31,844
- Non-deductible amortisation of intangibles - 158,500
Under/(over) provision for tax in prior years (733,758) (199,541)
(596,610) (315,534)
Income tax (benefit)/expense (2,139,471) 201,870
ii) Amounts recognised in equity
Net change in the fair value of cash flow hedges (984,410) -
(295,323) -
Total amounts recognised in equity (295,323) -
(c)
Opening Charged to Charged to Closing
balance income
other comprehensive
income balance
$ $ $ $
Unused tax losses 2,548,879 2,468,397 - 5,017,276
Temporary differences
Accrued expenses 8,019 41,613 - 49,632
Provisions 312,800 (26,157) - 286,643
Inventory 182,762 83,838 - 266,600
Intangibles and Other (1,025,341) (448,698) - (1,474,039)
Cash flow hedges - - 295,323 295,323
2,027,119 2,118,993 295,323 4,441,435
Opening Charged to Charged to Closing
balance income
other comprehensive
income balance
$ $ $ $
Unused tax losses 1,707,372 841,507 - 2,548,879
Temporary differences
Accrued expenses 44,200 (36,181) - 8,019
Provisions 343,417 (30,617) - 312,800
Inventory 243,364 (60,602) - 182,762
Intangibles and Other (379,675) (645,666) - (1,025,341)
1,958,678 68,441 - 2,027,119
5
Balance of franking account
2013 2012
$ $
591,961 591,961
2012
Dividends
No dividends were paid during the year-ended 30 June 2013 (2012: Nil).
The nature of the evidence supporting the recognition of tax losses incurred in prior periods includes forecast taxable income that is expected to
arise in the next 2 years as a result of new supply and distribution agreements entered into by the Group in prior years.
Income tax (benefit)/expense
Deferred tax (benefit) / expense relating to the origination and reversal of temporary differences
2013
Tax at the Australian tax rate of 30%
Tax at the Australian tax rate of 30%
Balance of franking account at period end adjusted for franking credits arising from dividends
recognised as receivables, and franking debits arising from payment of proposed dividends, and
franking credits that may be prevented from distribution in subsequent financial years
Research & Development tax concession
Deferred tax assets/(liabilities) arise from the following:
The prima facie income tax expense on pre-tax accounting profit from continuing operations and other comprehensive income
reconciles to the income tax expense in the financial statements as follows:
39
NetComm Wireless Limited
Notes to the Financial Statements
For the Year Ended 30 June 2013
6
(a) Cash on hand 2013 2012
$ $
Cash on hand 1,778 1,735
Cash at bank 3,880,289 7,047,994
3,882,067 7,049,729
(b) Effective interest rate
These funds are bearing floating interest rates of between 0.05% and 2% (2012: 0.05% to 2.0%).
2013 2012
$ $
Cash and cash equivalents 3,882,067 7,049,729
3,882,067 7,049,729
7
2013 2012
$ $
Trade receivables (i) 4,748,053 9,227,923
Income tax receivable - 148,888
Allowance for doubtful debts (47,672) (43,517)
4,700,381 9,333,294
(i)
Aging of past due but not impaired 2013 2012
$ $
0-30 Days 531,815 1,804,177
30-60 Days 136,519 605,290
60+ Days 82,351 12,879
750,685 2,422,346
The average credit period on sales of goods and rendering of services is 30 days, although a few customers have 45 day terms. No interest is
charged on overdue receivables. An allowance has been made for estimated unrecoverable trade receivable amounts arising from the past sale of
goods and rendering of services, determined by reference to past default experience. The Group will also consider any change in the quality of the
trade receivable from the date credit was initially granted up to the reporting date.
Before accepting any new customers, the Group obtain third party references to assess the potential customer’s credit quality and define the credit
limits by customer. Included in the Group’s trade receivable balance are debtors with a carrying amount of $750,685 (2012: $2,422,346 ) which are
past due at the reporting date for which the Group has not provided as there has not been a significant change in credit quality and the amounts are
still considered recoverable. The Group does not hold any collateral over these balances. The average age of these receivables is 59 days (2012:
53 days).
Trade and other receivables
Cash at the end of the financial year as shown in the statement of cash flows is reconciled to
items in the statement of financial position as follows:
Cash and cash equivalents
40

Annual Report 2012-2013 - NetComm Wireless - 69NetComm Wireless Limited
Notes to the Financial Statements
For the Year Ended 30 June 2013
6
(a) Cash on hand 2013 2012
$ $
Cash on hand 1,778 1,735
Cash at bank 3,880,289 7,047,994
3,882,067 7,049,729
(b) Effective interest rate
These funds are bearing floating interest rates of between 0.05% and 2% (2012: 0.05% to 2.0%).
2013 2012
$ $
Cash and cash equivalents 3,882,067 7,049,729
3,882,067 7,049,729
7
2013 2012
$ $
Trade receivables (i) 4,748,053 9,227,923
Income tax receivable - 148,888
Allowance for doubtful debts (47,672) (43,517)
4,700,381 9,333,294
(i)
Aging of past due but not impaired 2013 2012
$ $
0-30 Days 531,815 1,804,177
30-60 Days 136,519 605,290
60+ Days 82,351 12,879
750,685 2,422,346
The average credit period on sales of goods and rendering of services is 30 days, although a few customers have 45 day terms. No interest is
charged on overdue receivables. An allowance has been made for estimated unrecoverable trade receivable amounts arising from the past sale of
goods and rendering of services, determined by reference to past default experience. The Group will also consider any change in the quality of the
trade receivable from the date credit was initially granted up to the reporting date.
Before accepting any new customers, the Group obtain third party references to assess the potential customer’s credit quality and define the credit
limits by customer. Included in the Group’s trade receivable balance are debtors with a carrying amount of $750,685 (2012: $2,422,346 ) which are
past due at the reporting date for which the Group has not provided as there has not been a significant change in credit quality and the amounts are
still considered recoverable. The Group does not hold any collateral over these balances. The average age of these receivables is 59 days (2012:
53 days).
Trade and other receivables
Cash at the end of the financial year as shown in the statement of cash flows is reconciled to
items in the statement of financial position as follows:
Cash and cash equivalents
40
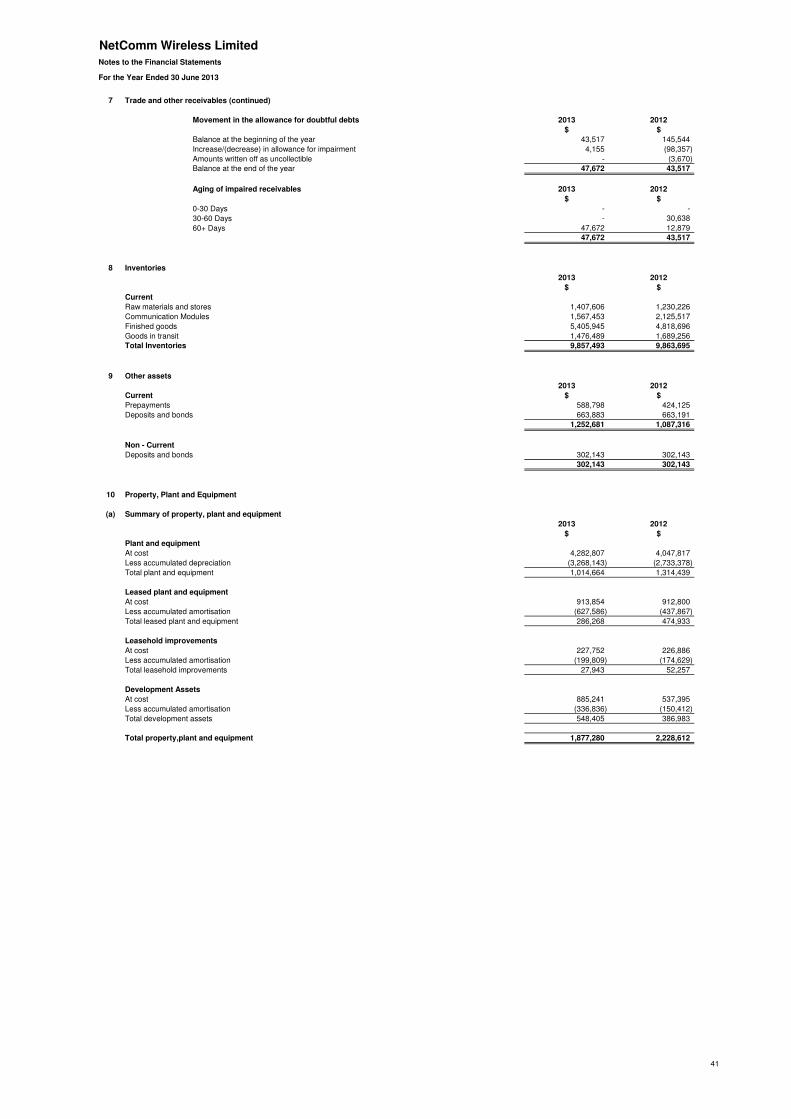
70 - NetComm Wireless - Annual Report 2012-2013NetComm Wireless Limited
Notes to the Financial Statements
For the Year Ended 30 June 2013
7
Movement in the allowance for doubtful debts 2013 2012
$ $
Balance at the beginning of the year 43,517 145,544
Increase/(decrease) in allowance for impairment 4,155 (98,357)
Amounts written off as uncollectible - (3,670)
Balance at the end of the year 47,672 43,517
Aging of impaired receivables 2013 2012
$ $
0-30 Days - -
30-60 Days - 30,638
60+ Days 47,672 12,879
47,672 43,517
8
2013 2012
$ $
Current
Raw materials and stores 1,407,606 1,230,226
Communication Modules 1,567,453 2,125,517
Finished goods 5,405,945 4,818,696
Goods in transit 1,476,489 1,689,256
Total Inventories 9,857,493 9,863,695
9
2013 2012
Current $ $
Prepayments 588,798 424,125
Deposits and bonds 663,883 663,191
1,252,681 1,087,316
Non - Current
Deposits and bonds 302,143 302,143
302,143 302,143
10
(a) Summary of property, plant and equipment
2013 2012
$ $
Plant and equipment
At cost 4,282,807 4,047,817
Less accumulated depreciation (3,268,143) (2,733,378)
Total plant and equipment 1,014,664 1,314,439
Leased plant and equipment
At cost 913,854 912,800
Less accumulated amortisation (627,586) (437,867)
Total leased plant and equipment 286,268 474,933
Leasehold improvements
At cost 227,752 226,886
Less accumulated amortisation (199,809) (174,629)
Total leasehold improvements 27,943 52,257
Development Assets
At cost 885,241 537,395
Less accumulated amortisation (336,836) (150,412)
Total development assets 548,405 386,983
Total property,plant and equipment 1,877,280 2,228,612
Inventories
Trade and other receivables (continued)
Property, Plant and Equipment
Other assets
41

Annual Report 2012-2013 - NetComm Wireless - 71NetComm Wireless Limited
Notes to the Financial Statements
For the Year Ended 30 June 2013
10
(b) Movements in carrying amounts
Plant and
equipment
Leased plant and
equipment
Leasehold
improvements
Development assets Total
$ $ $ $ $
2013
Balance at the beginning of the year 1,314,439 474,933 52,257 386,983 2,228,612
Additions 214,805 1,053 - 347,846 563,704
Disposals (370) - - - (370)
Net foreign currency translation differences 342 1 166 - 509
Depreciation expenses (514,552) (189,719) (24,480) (186,424) (915,175)
Carrying amount at the end of the year 1,014,664 286,268 27,943 548,405 1,877,280
2012
Balance at the beginning of the year 1,235,681 697,456 71,414 2,435 2,006,986
Additions 425,436 - - 452,649 878,085
Disposals (750) (13,798) - - (14,548)
Net foreign currency translation differences 252 53 109 - 414
Depreciation expenses (346,180) (208,778) (19,266) (68,101) (642,325)
Carrying amount at the end of the year 1,314,439 474,933 52,257 386,983 2,228,612
11
2013 2012
$ $
Gross carrying amount
Balance at beginning of financial year 895,999 895,999
Balance at end of financial year 895,999 895,999
Net book value
At the beginning of the financial year 895,999 895,999
At the end of the financial year 895,999 895,999
(a) Impairment testing
2013 2012
$ $
Call Direct Cellular Solutions 2003 Pty Limited 766,023 766,023
C10 Communications Pty Limited 129,976 129,976
895,999 895,999
(b) Key Assumptions Used
i) Call Direct Cellular Solutions 2003 Pty Limited
Cash flows:
Growth rates:
Discount rates:
ii) C10 Communications Pty Limited
Cash flows:
Growth rates:
Discount rates:
The primary assumptions underlying the cash flow projections for impairment testing include revenue growth of 32% in FY14 (off a low base in FY13) (FY13 actual
growth: 1%). The increase against the prior year is due to increased focus on M2M wireless opportunities followed by, for the purposes of this impairment testing, a
continuous revenue growth of 10% per annum till 2017 with no terminal value. As the forecasts reported to the Chief Operating Decision Maker extend out to FY17
only, no terminal growth rate has been included in the calculation.
The primary assumptions underlying the cash flow projections for impairment testing include an 2% increase in revenue in FY14 (FY13 actual growth : -7%) and flat
growth during FY15-FY17 due to the maturity level of ADSL internet gateways in the market.
Goodwill
The Group assessed the recoverable amount of goodwill by apply a value in use ("VIU") model for each identified cash-generating unit. The recoverable amounts of
the cash -generating units were determined based on past experience and expectations for the future, utilising both internal and external sources of data and relevant
industry trends.
For the purpose of annual impairment testing, goodwill has been allocated for impairment testing purposes to the following cash-generating units representing the
goodwill that arose in the acquisition of each business:
The following describes the key assumptions on which the Group has based its cash flow projections when determining value in use ("VIU") relating to the cash-
generating units.
The VIU calculations use after tax cash flow projections based on actual operating results and financial forecasts for the next four years which have been approved by
management. These forecasts are based on managements best estimates to determine income, expenditure and cash flow for Call Direct Cellular Solutions 2003 Pty
Limited. The present value of the expected cash flows of each CGU is determined by applying a discount rate.
Discount rates used are the pre-tax weighted average cost of capital ("WACC") with appropriate adjustments for the risk profile relating to each CGU. Having assessed
the risk specific to each CGU, the management has applied a WACC of 12% (2012: 12%) to each CGU on the basis that the risk fall within a similar range across all
CGUs.
The VIU calculations use after tax cash flow projections based on actual operating results and financial forecasts for the next four years which have been approved by
management. These forecasts are based on management best estimates to determine income, expenditure and cash flow for C10 Communications Pty Limited.
Discount rates used are the pre-tax weighted average cost of capital ("WACC") with appropriate adjustments for the risk profile relating to each CGU. Having assessed
the risk specific to each CGU, the management has applied a WACC of 12% (2012: 12%) to each CGU on the basis that the risk fall within a similar range across all
CGUs.
It was determined that goodwill associated with the Group's activities was not impaired and there was no other circumstances in the performance of acquired entities
indicating impairment. Both businesses have continued to operate and perform in accordance with the expectations of the Group.
Property, Plant and Equipment (continued)
All Goodwill has arisen from acquisitions made during prior financial years.
42

72 - NetComm Wireless - Annual Report 2012-2013NetComm Wireless Limited
Notes to the Financial Statements
For the Year Ended 30 June 2013
11
(c) Impairment of goodwill
12
(a) Summary of intangible assets
2013 2012
$ $
Product Development costs
Cost 11,405,501 7,599,624
Accumulated amortisation (5,227,104) (3,275,383)
Net carrying value 6,178,397 4,324,241
Computer software
Cost 804,080 792,008
Accumulated amortisation (787,013) (753,194)
Net carrying amount 17,067 38,814
Other intangibles
Cost 2,470,140 2,470,140
Accumulated amortisation (2,448,892) (2,443,264)
Net carrying amount 21,248 26,876
Total 6,216,712 4,389,931
(b) Movements in carrying amounts
Product
development
costs
Computer
software
Other intangibles Total
$ $ $ $
Balance at the beginning of the year 4,324,241 38,814 26,876 4,389,931
Additions 3,805,877 7,690 - 3,813,567
Net foreign currency translation differences - 47 - 47
Amortisation (1,951,721) (29,484) (5,628) (1,986,833)
Carrying amount at year end 6,178,397 17,067 21,248 6,216,712
Balance at the beginning of the year 2,520,631 124,762 543,247 3,188,640
Additions 3,155,340 10,180 28,140 3,193,660
Disposals - - (12,317) (12,317)
Net foreign currency translation differences - 88 - 88
Amortisation (1,351,730) (96,216) (532,194) (1,980,140)
Carrying amount at year end 4,324,241 38,814 26,876 4,389,931
13
2013 2012
$ $
Current unsecured liabilities
Trade payables (i) 4,191,006 5,201,100
Sundry payables and accrued expenses 1,600,534 1,833,916
Letter of credit (ii) 108,729 204,444
Total current trade and other payables 5,900,269 7,239,460
(i)
(ii)
14
2013 2012
$ $
Current - Secured
Finance lease 171,104 322,738
Trade refinance (i) 6,895,754 11,996,943
7,066,858 12,319,681
Non-Current - Secured
Finance lease 79,462 116,017
Total borrowings 7,146,320 12,435,698
Borrowings
The letter of credit facility is secured by a General Security Agreement with a fixed and floating charge over all assets and liabilities of NetComm
Wireless Limited.
The average credit period on purchases of certain goods from various Asian countries is 30 days, although some request payment in advance of
shipment. No interest is charged on overdue payables. The Group has financial risk management policies in place to ensure that all payables are
paid within the credit timeframe.
(ii) Banking Covenants: At 30 June 2013 the company was in breach of one of its banking covenants given the low EBITDA experienced for the year ended 30 June
2013. The Company obtained written confirmation indicating that, while reserving its rights, the bank would take no further action at this time.
Trade and other payables
(i) The trade refinance facility is secured by a General Security Agreement with a fixed and floating charge over all assets and liabilities of NetComm Wireless Limited.
The finance lease is secured against the underlying finance lease asset. Refer to Note 20 for further details of this borrowing.
Other intangible assets
Goodwill (continued)
There was no impairment of goodwill during the year (2012: Nil).
Management believes that any reasonably possible change in the above key assumptions on which recoverable amounts are based would not cause the aggregate
amount to exceed the recoverable amount of the CGUs.
2013
2012
43
NetComm Wireless Limited
Notes to the Financial Statements
For the Year Ended 30 June 2013
15
2013 2012
$ $
Current
Employee entitlements 634,460 908,542
Non - current
Employee entitlements 313,076 222,752
Total provisions 947,536 1,131,294
16
2013 2012
Current $ $
Deferred income - current 203,299 421,555
203,299 421,555
17
2013 2012
$ $
14,331,878 9,877,073
(a) Movements in issued and paid up ordinary share capital of the company
2013 2012 2013 2012
No. No. $ $
At the beginning of the reporting period 104,833,864 103,757,614 9,877,073 9,796,773
Shares issued during the year - - - -
- 07/06/2013 15,800,000 - 3,642,823 -
- 26/06/2013 2,743,526 - 699,599 -
Exercise of options 962,500 1,076,250 112,383 80,300
At reporting date 124,339,890 104,833,864 14,331,878 9,877,073
18
(a) Movements in share options & share rights reserve
2013 2012
$ $
Balance at the beginning of the year 395,808 352,476
Recognition of share based payments - 43,332
Balance at the end of the year 395,808 395,808
The option reserve is used to recognise the fair value of options and equity based share rights issued but not exercised.
(b) Movements in foreign exchange reserve
2013 2012
$ $
Balance at the beginning of the year (83,723) (105,848)
Exchange difference on translation of foreign operations 177,758 22,125
Balance at the end of the year 94,035 (83,723)
(c) Movements in foreign exchange hedging reserve
2013 2012
$ $
Balance at the beginning of the year - -
Net change in the fair value of cash flow hedges (984,410) -
Tax benefit 295,323 -
Balance at the end of the year (689,087) -
Provisions
Other liabilities
Issue costs $386,177 associated with the issue of shares have been directly paid from the proceeds of the issues. These costs have been
deducted from the issued capital in the statement of financial position, rather than charged as an expense of the Company, as they are considered
to form part of the net equity raised. (2012: Nil)
If a forecast transaction is no longer expected to occur or if the hedging instrument becomes ineffective, any related gain or loss recognised in other
comprehensive income is transferred immediately to profit and loss.
Issued Capital
Changes to the then Corporations Law abolished the authorised capital and par value concept in relation to share capital from 1 July 1998.
Therefore, the company does not have a limited amount of authorised capital and issued shares do not have a par value. Ordinary shares confer
on their holders the right to participate in dividends and/or capital returns declared by the board and an entitlement to vote at any general meeting of
the company.
Exchange differences arising on translation of the foreign controlled entities are taken to the foreign currency translation reserve. The reserve is
recognised in profit or loss when the net investment is disposed of.
124,399,890 (2012: 104,833,864) Ordinary shares - paid up no par value
Reserves
The hedge reserve comprises the effective portion of the cumulative net change in the fair value of cash flow hedging instruments, net of tax,
related to hedged transactions that have not yet occurred. The Group uses USD denominated borrowings as a hedge against USD sales that are
expected to occur close to the maturity date of the borrowings. The cumulative deferred gain or loss on the hedge is recognised in other
comprehensive income and included within the cash flow hedge reserve in equity.
On 7 June 2013, the Group issued a total of 15,800,000 ordinary shares at an exercise price of $0.255 per share.
Additionally, 962,500 ordinary shares were issued as a result of the exercise of vested options arising from the employee shares options plan
granted to employees. Options were exercised at an average price of $0.117 per option. (see Note 24) (2012: 1,076,250 )
On 26 June 2013, the Group issued a total of 2,743,526 shares under share purchase plan at the issue price of $0.255 per share.
44

Annual Report 2012-2013 - NetComm Wireless - 73NetComm Wireless Limited
Notes to the Financial Statements
For the Year Ended 30 June 2013
15
2013 2012
$ $
Current
Employee entitlements 634,460 908,542
Non - current
Employee entitlements 313,076 222,752
Total provisions 947,536 1,131,294
16
2013 2012
Current $ $
Deferred income - current 203,299 421,555
203,299 421,555
17
2013 2012
$ $
14,331,878 9,877,073
(a) Movements in issued and paid up ordinary share capital of the company
2013 2012 2013 2012
No. No. $ $
At the beginning of the reporting period 104,833,864 103,757,614 9,877,073 9,796,773
Shares issued during the year - - - -
- 07/06/2013 15,800,000 - 3,642,823 -
- 26/06/2013 2,743,526 - 699,599 -
Exercise of options 962,500 1,076,250 112,383 80,300
At reporting date 124,339,890 104,833,864 14,331,878 9,877,073
18
(a) Movements in share options & share rights reserve
2013 2012
$ $
Balance at the beginning of the year 395,808 352,476
Recognition of share based payments - 43,332
Balance at the end of the year 395,808 395,808
The option reserve is used to recognise the fair value of options and equity based share rights issued but not exercised.
(b) Movements in foreign exchange reserve
2013 2012
$ $
Balance at the beginning of the year (83,723) (105,848)
Exchange difference on translation of foreign operations 177,758 22,125
Balance at the end of the year 94,035 (83,723)
(c) Movements in foreign exchange hedging reserve
2013 2012
$ $
Balance at the beginning of the year - -
Net change in the fair value of cash flow hedges (984,410) -
Tax benefit 295,323 -
Balance at the end of the year (689,087) -
Provisions
Other liabilities
Issue costs $386,177 associated with the issue of shares have been directly paid from the proceeds of the issues. These costs have been
deducted from the issued capital in the statement of financial position, rather than charged as an expense of the Company, as they are considered
to form part of the net equity raised. (2012: Nil)
If a forecast transaction is no longer expected to occur or if the hedging instrument becomes ineffective, any related gain or loss recognised in other
comprehensive income is transferred immediately to profit and loss.
Issued Capital
Changes to the then Corporations Law abolished the authorised capital and par value concept in relation to share capital from 1 July 1998.
Therefore, the company does not have a limited amount of authorised capital and issued shares do not have a par value. Ordinary shares confer
on their holders the right to participate in dividends and/or capital returns declared by the board and an entitlement to vote at any general meeting of
the company.
Exchange differences arising on translation of the foreign controlled entities are taken to the foreign currency translation reserve. The reserve is
recognised in profit or loss when the net investment is disposed of.
124,399,890 (2012: 104,833,864) Ordinary shares - paid up no par value
Reserves
The hedge reserve comprises the effective portion of the cumulative net change in the fair value of cash flow hedging instruments, net of tax,
related to hedged transactions that have not yet occurred. The Group uses USD denominated borrowings as a hedge against USD sales that are
expected to occur close to the maturity date of the borrowings. The cumulative deferred gain or loss on the hedge is recognised in other
comprehensive income and included within the cash flow hedge reserve in equity.
On 7 June 2013, the Group issued a total of 15,800,000 ordinary shares at an exercise price of $0.255 per share.
Additionally, 962,500 ordinary shares were issued as a result of the exercise of vested options arising from the employee shares options plan
granted to employees. Options were exercised at an average price of $0.117 per option. (see Note 24) (2012: 1,076,250 )
On 26 June 2013, the Group issued a total of 2,743,526 shares under share purchase plan at the issue price of $0.255 per share.
44

74 - NetComm Wireless - Annual Report 2012-2013NetComm Wireless Limited
Notes to the Financial Statements
For the Year Ended 30 June 2013
19
20
Non-cancellable operating lease commitments
2013 2012
$ $
Not longer than 1 year 566,824 675,702
Longer than 1 year and not longer than 5 years 877,456 1,634,178
1,444,280 2,309,880
2013 2012
$ $
Not longer than 1 year 156,555 357,182
Longer than 1 year and not longer than 5 years 104,316 119,722
Minimum future lease payments 260,871 476,904
Less future finance charges (10,305) (38,149)
Present value of minimum lease payments 250,566 438,755
Included in the financial statements:
Current borrowings (note 14) 171,104 322,738
Non - current borrowings (note 14) 79,462 116,017
250,566 438,755
21
Reconciliation of cash flow from operations with profit after income tax
2013 2012
$ $
(Loss)/Profit for the year (541,624) 840,511
Non-cash flows in profit
Depreciation and amortisation 2,902,008 2,622,465
Share based payments - 43,332
Interest received (77,575) (95,388)
Changes in operating assets and liabilities:
Decrease/(increase) in trade and other receivable 4,638,213 1,127,671
Decrease/(increase) in inventories 6,202 (2,629,716)
Decrease/(increase in other assets (165,365) (508,159)
Decrease/(increase) in deferred tax assets (2,414,316) (68,441)
(Decrease)/increase in trade and other payables (1,339,188) (1,960,918)
(Decrease)/increase in other liabilities (832,557) 338,509
(Decrease)/increase in provisions (183,758) 97,043
Net cash from operating activities 1,992,040 (193,092)
Non-cash financing and investing activities
The group leases its offices in Australia and New Zealand under operating leases. Leases generally provide the right of renewal at which time all terms are
renegotiated. Lease payments comprise a base amount and in some cases an incremental contingent rental. Contingent rents are normally based on movements in the
CPI or market reviews. In the current year, the Parent signed a new 5 year lease for its Head Office premises in Lane Cove and also renewed the lease on its
Melbourne premises.
Finance lease liabilities
Finance leases relate to plant and equipment. The Group has the option to purchase the plant and equipment at the conclusion of the lease arrangements. The Group’s
obligation under finance leases are secured by the lessor’s title to the leased assets.
Deferred payments arising from acquisitions recorded in other liabilities are investing related activities and thus have been excluded from this reconciliation.
Cash flow information
There were no contingent liabilities as at 30 June 2013 (2012 : Nil)
Contingent liabilities
Expenditure commitments
45
NetComm Wireless Limited
Notes to the Financial Statements
For the Year Ended 30 June 2013
22
(a) Directors and other key management personnel
The directors and other members of key management personnel of the Group during the year were:
J Milne Non Executive Director & Chairman
J A Brennan Non Executive Director (Resigned 21 March 2013)
K Boundy Non Executive Director (Appointed 24 August 2012)
S Black AM Non Executive Director (Appointed 21 March 2013)
J M Burton Non Executive Director (Retired 21 November 2012)
D P J Stewart CEO & Managing Director
K J P Sheridan CFO & Executive Director and Company Secretary
D Morrison General Manager - Sales
S Collins Head of Engineering & Product Development
M Cornelius Research & Development Director
B Stevens Chief Technology Officer
(b) Remuneration of key management personnel
2013 2012
$ $
Short term benefits 1,689,275 2,298,910
Post employment benefits 113,568 129,347
Other long term benefits 19,230 14,910
Termination benefits - 127,832
Share based payments - -
Total 1,822,073 2,570,999
(c) Shares held by key management personnel
No. No. No.
J Milne - 180,588 180,588
J A Brennan 122,795 - 122,795
K Boundy 450,000 - 450,000
S Black - - -
J M Burton 377,795 (18,345) 359,450
D P J Stewart* 22,944,008 30,588 22,974,596
K J P Sheridan 174,000 30,588 204,588
D Morrison 250,000 100,000 350,000
S Collins - - -
B Stevens 350,000 150,000 500,000
M Cornelius 2,486,170 - 2,486,170
27,154,768 473,419 27,628,187
* The 22,974,596 shares held by D P J Stewart's related entities.
T R Winters - - -
J Milne - - -
J A Brennan 122,795 - 122,795
J M Burton 377,795 - 377,795
D P J Stewart* 22,944,008 - 22,944,008
K J P Sheridan 174,000 - 174,000
D Morrison - 250,000 250,000
J Lahey - - -
S Collins - - -
B Stevens - 350,000 350,000
M Cornelius 2,486,170 - 2,486,170
26,104,768 600,000 26,704,768
* The 22,944,008 shares held by D P J Stewart's related entities.
2012
The aggregate compensation made to key management personnel of the Group is set out below:
Further information on remuneration of key management personnel can be found in the remuneration report within the Directors’ Report.
2013
Balance 1 July Movement during the
Year - on market
transactions
Balance 30 June
Key management personnel compensation
46

Annual Report 2012-2013 - NetComm Wireless - 75NetComm Wireless Limited
Notes to the Financial Statements
For the Year Ended 30 June 2013
22
(a) Directors and other key management personnel
The directors and other members of key management personnel of the Group during the year were:
J Milne Non Executive Director & Chairman
J A Brennan Non Executive Director (Resigned 21 March 2013)
K Boundy Non Executive Director (Appointed 24 August 2012)
S Black AM Non Executive Director (Appointed 21 March 2013)
J M Burton Non Executive Director (Retired 21 November 2012)
D P J Stewart CEO & Managing Director
K J P Sheridan CFO & Executive Director and Company Secretary
D Morrison General Manager - Sales
S Collins Head of Engineering & Product Development
M Cornelius Research & Development Director
B Stevens Chief Technology Officer
(b) Remuneration of key management personnel
2013 2012
$ $
Short term benefits 1,689,275 2,298,910
Post employment benefits 113,568 129,347
Other long term benefits 19,230 14,910
Termination benefits - 127,832
Share based payments - -
Total 1,822,073 2,570,999
(c) Shares held by key management personnel
No. No. No.
J Milne - 180,588 180,588
J A Brennan 122,795 - 122,795
K Boundy 450,000 - 450,000
S Black - - -
J M Burton 377,795 (18,345) 359,450
D P J Stewart* 22,944,008 30,588 22,974,596
K J P Sheridan 174,000 30,588 204,588
D Morrison 250,000 100,000 350,000
S Collins - - -
B Stevens 350,000 150,000 500,000
M Cornelius 2,486,170 - 2,486,170
27,154,768 473,419 27,628,187
* The 22,974,596 shares held by D P J Stewart's related entities.
T R Winters - - -
J Milne - - -
J A Brennan 122,795 - 122,795
J M Burton 377,795 - 377,795
D P J Stewart* 22,944,008 - 22,944,008
K J P Sheridan 174,000 - 174,000
D Morrison - 250,000 250,000
J Lahey - - -
S Collins - - -
B Stevens - 350,000 350,000
M Cornelius 2,486,170 - 2,486,170
26,104,768 600,000 26,704,768
* The 22,944,008 shares held by D P J Stewart's related entities.
2012
The aggregate compensation made to key management personnel of the Group is set out below:
Further information on remuneration of key management personnel can be found in the remuneration report within the Directors’ Report.
2013
Balance 1 July Movement during the
Year - on market
transactions
Balance 30 June
Key management personnel compensation
46

76 - NetComm Wireless - Annual Report 2012-2013NetComm Wireless Limited
Notes to the Financial Statements
For the Year Ended 30 June 2013
22
(d) Options held by key management personnel
Granted Exercised Relinquished
Balance during the during the during the Balance
1 July year year year 30 June
D P J Stewart 1,500,000 - - (1,500,000) -
J A Brennan 360,000 - - - 360,000
J M Burton 360,000 - (360,000) - -
M Cornelius - - - - -
J Milne - - - - -
J Lahey - - - - -
S Collins - - - - -
B Stevens 100,000 - (100,000) - -
D Morrison 200,000 - (100,000) - 100,000
K J P Sheridan - - - - -
2,520,000 - (560,000) (1,500,000) 460,000
Weighted Average Exercise Price 0.156 0.170 0.162 0.167
T R Winters 780,000 - - (780,000) -
D P J Stewart 4,000,000 - - (2,500,000) 1,500,000
J A Brennan 360,000 - - - 360,000
J M Burton 360,000 - - - 360,000
M Cornelius - - - - -
J Milne - - - - -
J Lahey - - - - -
S Collins - - - - -
B Stevens 450,000 - (350,000) - 100,000
D Morrison 450,000 - (250,000) - 200,000
K J P Sheridan - - - - -
6,400,000 - (600,000) (3,280,000) 2,520,000
Weighted Average Exercise Price 0.154 - 0.081 0.162 0.156
Balance Total Total Total
30 June vested exercisable unexercisable
D P J Stewart - - - -
J A Brennan 360,000 360,000 360,000 -
J M Burton - - - -
M Cornelius - - - -
J Milne - - - -
J Lahey - - - -
S Collins - - - -
B Stevens - - - -
D Morrison 100,000 100,000 100,000 -
K J P Sheridan - - - -
460,000 460,000 460,000 -
T R Winters
D P J Stewart 1,500,000 1,500,000 1,500,000 -
J A Brennan 360,000 360,000 360,000 -
J M Burton 360,000 360,000 360,000 -
M Cornelius - - - -
J Milne - - - -
J Lahey - - - -
S Collins - - - -
B Stevens 100,000 80,000 80,000 20,000
D Morrison 200,000 180,000 180,000 20,000
K J P Sheridan - - - -
2,520,000 2,480,000 2,480,000 40,000
The following is a list of options issued, vested and exercisable as at the end of the reporting period for key management personnel
2013
All share options issued to key management personnel were made in accordance with the provisions of the employee share option plan. During the
financial year 560,000 options (2012: 600,000) were exercised by key management personnel. Further details on the employee share option plan
and share options granted during the 2013 and 2012 financial years are contained at note 24.
2013
2012
2012
Key management personnel compensation (continued)
47

Annual Report 2012-2013 - NetComm Wireless - 77NetComm Wireless Limited
Notes to the Financial Statements
For the Year Ended 30 June 2013
22
(e) Share Rights held by key management personnel
Details of share rights held directly, indirectly or beneficially by key management personnel and their related parties are as follows:
PARTICIPANTSBalance on 1
July 2012
Fair Value at
grant date
Rights
Exercised
Rights
Relinquished
Balance at 30
June 2013
Total Vested at 30
June 2013
Type of Share
Right
David Stewart 1,500,000 195,000$ - (1,500,000) - - Cash
Ken Sheridan 450,000 58,500$ - (450,000) - - Cash
Danny Morrison 250,000 32,500$ - - 250,000 - Shares
Steve Collins 250,000 32,500$ - - 250,000 - Shares
Brett Stevens 250,000 32,500$ - - 250,000 - Shares
Michael Cornelius 250,000 32,500$ - - 250,000 - Shares
Total 2,950,000 383,500$ - (1,950,000) 1,000,000 -
Implicit Share Price used in determining value of initial share rights 0.20$
Actual share price on 1 July 2011 (the date of grant) 0.13$
Actual share price on 1 July 2012 (the first Vesting Date) 0.13$
Number of share rights 1,000,000
23
There are no related party transactions except as per Note 22.
24 Share-based Payments
Employee Option Plan
An employee share scheme was established in 1993 and current details are noted below.
a) each employee’s length of service;
b) the contribution to the group which has been made by the employee;
c) the potential contribution of the employee to the group; and
d) any other matters which the board considers relevant.
The Board has decided to discontinue using the Options Plan in favour of the new Share Rights Plan.
Entitlement
Vesting
On July 1, 2011 NetComm Wireless Limited Executive Employee Share Plan" ("EESP") was introduced for invited Participants selected on the
basis of their capability to be able to directly impact the Company's performance. Under this Plan, a Participant is made an offer of a number
of Share Rights, as determined by the Board. A Share Right is an entitlement to a cash (for cash participants) or equity (for equity participants)
amount equivalent to the value of one fully paid ordinary share in the Company for nil consideration, subject to the achievement of vesting
conditions which include service and company performance over a 3-year period. The Share Rights will vest when the Company meets or
exceeds a “performance hurdle” based on a specific EBITDA target as at the end of years 1, 2 and 3 respectively, if the Participant remains
employed with the Company at that time. If the Company does not meet a performance hurdle at a given year (either year 1 or year 2), the
hurdle can be “re-tested” in the subsequent year. The “re-test” would be based on a comparison of the cumulative actual EBITDA results for
the current and past years compared to the targeted EBITDA results. The Board has resolved that any entitlements to shares in NetComm
Wireless resulting from the EESP will be purchased on market.
Key management personnel compensation (continued)
As at 1 July 2013, the EBITDA performance hurdles for years 1 and 2 were not met so Plan Participants had no vesting of their Share Rights.
Based on estimates of EBITDA for the year ending 30 June 2014, the Board is of the view that the EBITDA performance hurdles will not be
met and that no share rights will vest for any Participant. Accordingly, the fair value of these Rights has been assessed as nil.
Related party transactions
The board of directors may at its discretion offer options to employees in such numbers and at such times as it thinks fit, having regard to:
Shares issued on the exercise of options will rank pari passu with all existing shares in the capital of the company from the date of issue.
All outstanding options have now vested.
Each option entitles the holder to subscribe for and be allotted one share in the capital of the company at the exercise price per share.
48

78 - NetComm Wireless - Annual Report 2012-2013NetComm Wireless Limited
Notes to the Financial Statements
For the Year Ended 30 June 2013
24 Share-based Payments (continued)
Exercise of Options
An option may be exercised:
i.
ii. Within 180 days:
iii.
iv.
2013
Number of
Options
Exercise Price
$
Expiry Date Number of
Options
Exercisable
30 June 2013
100,000 0.185 31-Jul-13 100,000
240,000 0.162 30-Oct-13 240,000
120,000 0.162 30-Oct-13 120,000
100,000 0.162 10-Dec-13 100,000
100,000 0.113 12-Feb-14 100,000
660,000 660,000
2012
Number of
Options
Exercise Price
$
Expiry Date Number of
Options
Exercisable
30 June 2012
50,000 0.600 19-Jul-12 50,000
105,000 0.700 17-Dec-12 105,000
100,000 0.710 03-Mar-13 100,000
100,000 0.185 31-Jul-13 80,000
1,480,000 0.162 30-Oct-13 1,480,000
740,000 0.162 30-Oct-13 740,000
100,000 0.070 17-Dec-12 100,000
100,000 0.185 31-Jul-13 80,000
157,500 0.075 27-Feb-13 157,500
100,000 0.162 10-Dec-13 80,000
100,000 0.113 12-Feb-14 80,000
3,132,500 3,052,500
There were options of 962,500 (2012: 1,076,250) exercised during the year ended 30 June 2013.
Subsequent to year end 360,000 (2012: 50,000) options were exercised by employees/directors.
Valuations of Options
(a)
(b)
(c)
(d)
Mr David Stewart, CEO and Managing Director, relinquished 1,500,000 vested options during the year as announced at the Company’s 2012
Annual General Meeting held in November 2012.
At 30 June 2013, there are 660,000 options (2012: 3,132,500) issued to 3 employees/directors (2012: 12 employees/directors) to acquire ordinary shares. These
options have all vested. Details as follows:
The fair value at grant date of all options is independently determined using the Binomial Approximation pricing model.
Options are granted in accordance with the terms of the Employee Option Plan (refer above for detail),
The expected price volatility is based on a daily closing share price for NetComm Limited over the 12 months immediately prior to date of
grant: N/A (2012: N/A),
The risk free interest rate is based on the 5 year Commonwealth Bond rate on date of issue: N/A
The expected dividend yield is based on the dividends received by shareholders of NetComm Limited during the 12 months prior to date
of grant: 0% (2012: 0%).
If any person or that person’s associate has acquired or become entitled to 40% or more of the company’s voting shares.
On July 1, 2011 NetComm Wireless Limited Executive Employee Share Plan" ("EESP") was introduced for invited Participants selected on the basis of their capability
to be able to directly impact the Company's performance. More details of this plan are disclosed under Note 22 (e).
No share based payments expense has been recognised for the year ended 30 June 2013 (2012: $127,832).
The 660,000 (2012: 3,132,500) options outstanding at 30 June 2013 have a weighted average exercise price of $0.158 (2012: $0.147) and a weighted average
remaining contractual life of 0.36 years (2012: 1.2 years). Exercise prices range from $0.113 to $0.185 in respect of options outstanding at 30 June 2013.
After an option has vested in accordance with the rules outlined above, but before expiry of the option, provided the participant is at the time of
exercise an employee or director of the Group.
Of the death, disablement or retirement of the participant; or
After an option has vested in accordance with the rules outlined above and the participant resigns or is retrenched.
If the Board otherwise permits it.
No options issued to employees expired during the financial year in accordance with the rules of the Share Option Plan (2012: 4,150,630).
No new options were issued during the year.
49

Annual Report 2012-2013 - NetComm Wireless - 79NetComm Wireless Limited
Notes to the Financial Statements
For the Year Ended 30 June 2013
25 Retirement Benefit Obligations
Superannuation Commitments
26 Earnings per Share
2013 2012
$ $
Earnings reconciliation
Net profit for the year (541,624) 1,570,179
Basic and diluted earnings (541,624) 1,570,179
2013 2012
Weighted average number of ordinary shares used as the denominator No. No.
Number for basic earnings per share 106,223,194 104,223,847
Effect of share options issued under the employee option plan not yet vested 70,015 229,212
Number for diluted earnings per share 106,293,209 104,453,059
2013 2012
Earnings per share Cents Cents
Basic earnings per share (0.51) 1.51
Diluted earnings per share (0.51) 1.50
2013 2012
$ $
Earnings reconciliation
Net (loss)/profit for the year - (729,668)
Basic and diluted earnings - (729,668)
2013 2012
Weighted average number of ordinary shares used as the denominator No. No.
Number for basic earnings per share 106,223,194 104,223,847
Effect of share options issued under the employee option plan not yet vested 70,015 229,212
Number for diluted earnings per share 106,293,209 104,453,059
2013 2012
Earnings per share Cents Cents
Basic earnings per share - (0.70)
Diluted earnings per share - (0.70)
EPS and DEPS for discontinued operations are the same as the Loss cannot be diluted
Continuing Operations
Continuing Operations
Discontinued Operations
Discontinued Operations
The Group provides employees with access to external superannuation plans that provide benefits on retirement, resignation, disability or death. This is a defined
contribution plan.
50

80 - NetComm Wireless - Annual Report 2012-2013
27 Financial Instruments
(a) Capital Risk Management
(b) Financial Risk Management Objectives
(c) Market Risk
(d) Foreign Currency Risk Management
2013 2012 2013 2012
US Dollars 8,776,990 16,428,388 4,518,693 8,502,482
Canadian Dollars - - - 1,036,752
Euros - - 264,814 -
Total 8,776,990 16,428,388 4,783,507 9,539,234
Foreign currency sensitivity
Most of the Group’s transactions are carried out in AUD. Exposures to currency exchange rates arise from the Group’s overseas
sales and purchases, which are primarily denominated in US dollars (USD).
The carrying amount of the Group’s foreign currency denominated monetary assets and monetary liabilities at the reporting date
that are denominated in a currency that is different to the functional currency of the respective entities holding the monetary
assets and liabilities are as follows:
To mitigate the Group’s exposure to foreign currency risk, non-AUD cash flows are monitored and hedging relationships are
formed between a portion of the bank borrowings and a portion of the sales that equate to ‘firm’ commitments in accordance with
the Group’s risk management policies.
Generally, the Group’s risk management procedures distinguish short-term foreign currency cash flows (due within 12 months)
from longer-term cash flows (due after 12 months). Where the amounts to be paid and received in a specific currency are
expected to largely offset one another, no further hedging activity is undertaken.
NetComm Wireless Limited
Notes to the Financial Statements
For the Year Ended 30 June 2013
The Group’s activities expose it to a variety of financial risks: market risk (including foreign currency and interest rate risk), credit
risk and liquidity risk. The Group’s overall risk management program focuses on the unpredictability of financial and exchange
rate markets and seeks to minimise potential adverse effects on the Group’s performance. Risk management is carried out by
the Board of Directors through the Audit and Risk Management Committee.
Market risk is the risk that the fair value or future cash flow of a financial asset or financial liability will fluctuate because of
changes in market prices. Market risk comprises foreign currency risk and interest rate risk. The Group’s activities expose it
primarily to the financial risks of changes in foreign currency exchange rates and interest rates.
Liabilities Assets
The Group manages its capital to ensure that entities in the Group will be able to continue as a going concern while maximising
the return to stakeholders through the optimisation of the debt and equity balance. The Group’s overall strategy is to focus on the
global M2M sector. The group raised $4.3M in equity during the financial year to fund the company's growth plan in the M2M
sector and provide additional working capital.
The capital structure of the Group consists of debt, which includes the borrowings disclosed in note 14, cash and cash
equivalents and equity attributable to equity holders of the parent, comprising issued capital, reserves and retained earnings.
Operating cash flows are used to maintain and expand the Group’s assets as well as to pay for operating expenses, including
tax liabilities.
Foreign currency denominated financial assets and liabilities which expose the Group to currency risk are disclosed below. The
amounts shown are those reported to key management translated into AUD at the closing rate 0.9138. (2012: 1.02336)
51

Annual Report 2012-2013 - NetComm Wireless - 81NetComm Wireless Limited
Notes to the Financial Statements
For the Year Ended 30 June 2013
27 Financial Instruments (continued)
(d) Foreign Currency Risk Management (continued)
Foreign currency sensitivity analysis
The Group is mainly exposed to US dollars (USD), and Euros (EUR). (2012: US dollars and Canadian dollars)
2013 2012
US Dollars 340,880 695,746
Canadian Dollars - 114,894
Euros 29,424 -
2013 2012
New Zealand Dollars 9,601 (8,364)
(e) Interest rate risk management
The following table details the Group’s sensitivity to a 10% increase and decrease in the Australian dollar against the relevant
foreign currencies (arising from monetary assets and liabilities held at balance date in a currency different to the functional
currency of the respective entities holding the assets or liabilities), which represents management’s assessment of the possible
change in foreign exchange rates. The sensitivity analysis includes only outstanding foreign currency denominated monetary
items (including liabilities for goods in transit) and adjusts their translation at a period end for a 10% change in foreign currency
rates.
The following table details the Group's sensitivity to a 10% increase and decrease in the Australian dollar against the relevant
foreign currencies arising from translation of foreign operations. A positive number indicates an increase in other comprehensive
income where the Australian dollar weakens against the respective currency. For a strengthening of the Australian dollar against
the respective currency there would be an equal and opposite impact on the other comprehensive income and other equity, and
the balances below would be negative.
Other comprehensive income
The foreign exchange impact in the table is attributable to the exposure outstanding on USD receivables and borrowings and
EUR receivables at year end in the Group. In management’s opinion, the above sensitivity analysis is representative of the
inherent foreign exchange risk during the course of the year.
Profit or loss
The Group includes a New Zealand subsidiary whose functional currency is different to the Group’s presentation currency. As
stated in the Group’s Accounting Policies per Note 1(c), on consolidation the assets and liabilities of this entity are translated into
Australian dollars at exchange rates prevailing on the reporting date. The income and expenses of this entity are translated at the
average exchange rates for the period. Exchange differences arising are classified as equity and are transferred to a foreign
exchange translation reserve. The Group’s future reported other comprehensive income could therefore be impacted by changes
in rates of exchange between the Australian Dollar and the New Zealand Dollar.
The Group is exposed to interest rate risk as the parent entity borrows funds at floating interest rates. The Group does not hedge
this risk through derivatives such as interest rate swaps.
The Group's exposures to interest rates on financial assets and financial liabilities are detailed in the liquidity risk management
section of this note.
52

82 - NetComm Wireless - Annual Report 2012-2013NetComm Wireless Limited
Notes to the Financial Statements
For the Year Ended 30 June 2013
27 Financial Instruments (continued)
(f) Interest rate sensitivity analysis
(g) Credit risk management
(h) Liquidity risk management
The table below details the company’s and the Group’s drawn and undrawn facilities.
2013 2012
$ $
Letter of Credit & Trade Refinance 15,000,000 15,000,000
Used at balance date (note 13) 108,729 204,444
Used at balance date (note 14) 6,895,754 11,996,943
Unused at balance date 7,995,517 2,798,613
Trade Receivables Finance 2,000,000
Used at balance date (note 14) - -
Unused at balance date - 2,000,000
Floating Bill Facility - 2,000,000
Used at balance date (note 14) - -
Unused at balance date - 2,000,000
Ultimate responsibility for liquidity risk management rests with the Board of Directors, who have built an appropriate liquidity risk
management framework for the management of the Group’s short, medium and long term funding and liquidity management
requirements. The Group manages liquidity risk by maintaining adequate reserves, banking facilities and reserve borrowing
facilities by continuously monitoring forecast and actual cash flows and matching the maturity profiles of financial assets and
liabilities. The Group also uses a trade payables finance facility to manage its liquidity risk.
The sensitivity analysis below has been determined based on a 50 basis point change in interest rates taking place at the
beginning of the financial year and held constant throughout the reporting period, which represents management’s assessment
of the possible change in interest rates. At reporting date, if interest rates had been 50 basis points higher or lower and all other
variables were held constant, the Group’s net profit would increase/(decrease) by ($23,763) (2012: increase/(decrease) by
$16,455). This is mainly attributable to the Group's exposure to interest rates on its variable rate borrowings.
Credit risk refers to the risk that a counterparty will default on its contractual obligations resulting in financial loss to the Group.
The Group has adopted a policy of only dealing with creditworthy counterparties. The Group uses publicly available financial
information and its own trading record to rate its major customers. The Group’s exposure and the credit ratings of its
counterparties are continuously monitored and controlled by counterparty limits that are reviewed and approved by the CEO &
CFO. Trade receivables consist of a large number of customers, spread across diverse industries and geographical areas.
Ongoing credit evaluation is performed on the financial condition of accounts receivable.
The Group is exposed to the credit risk. The Group has a major customer (note 29(a)) who generated around 17% (FY12: 16%)
revenues to the Group. However, there is minimal credit risk arising from this customer based on the historial information and
previous trading experience.
Other than item noted above, the Group does not have any significant credit risk exposure to any single counterparty or any
group of counterparties having similar characteristics. The credit risk on liquid funds is limited because the counterparties are
banks with high credit-ratings assigned by international credit-rating agencies. The carrying amount of financial assets recorded
in the financial statements, net of any allowances for losses, represents the Group’s maximum exposure to credit risk. Refer
further detail in note 7.
Consolidated
53

Annual Report 2012-2013 - NetComm Wireless - 83NetComm Wireless Limited
Notes to the Financial Statements
For the Year Ended 30 June 2013
27 Financial Instruments (continued)
(h) Liquidity risk management (continued)
Liquidity and interest risk tables
Less than 1
month $
1-3 months $ 3 months-1
year $
1-5 years $ 5+ years $
2013
Non-interest bearing 3,198,731 785,069 - - -
Finance lease liability 25,875 51,751 78,929 104,316 -
- - 7,090,878 - -
3,224,606 836,820 7,169,807 104,316 -
2012
Non-interest bearing 2,965,675 2,205,520 - - -
Finance lease liability 27,102 54,203 275,877 119,723 -
81,778 6,956,836 5,335,553 - -
3,074,555 9,216,559 5,611,430 119,723 -
Less than 1
month $
1-3 months $ 3 months-1
year $
1-5 years $ 5+ years $
2013
Non-interest bearing 531,815 4,216,238 - - -
3,882,067 - 650,496 302,143 -
4,413,882 4,216,238 650,496 302,143 -
2012
Non-interest bearing 1,804,175 6,506,963 - - -
7,049,729 - 582,830 369,809 -
8,853,904 6,506,963 582,830 369,809 -
0.00%
8.58%
Weighted avg
effective interest
rate %
The following tables detail the Group’s expected maturity for its non-derivative financial assets. The tables have been drawn up
based on the undiscounted contractual maturities of the financial assets including interest that will be earned on those assets
except where the Group anticipates that the cash flow will occur in a different period based on the earliest date on which the
Group can expect to receive. The table includes both interest and principal cash flows.
Variable interest rate
instruments
Variable interest rate
instruments
4.07%
0.00%
8.77%
4.30%
Variable interest rate
instruments
0.00%
1.31%
0.00%
The following tables detail the Group’s remaining contractual maturity for its non-derivative financial liabilities. The tables have
been drawn up based on the undiscounted cash flows of financial liabilities based on the earliest date on which the Group can be
required to pay. The table includes both interest and principal cash flows.
Weighted avg
effective interest
rate %
Variable interest rate
instruments
1.66%
54

84 - NetComm Wireless - Annual Report 2012-2013NetComm Wireless Limited
Notes to the Financial Statements
For the Year Ended 30 June 2013
27 Financial Instruments (continued)
(i) Capital management policies and procedures
The Group's capital management objectives are:
to ensure the Group's ability to continue as a going concern; and
to provide an adequate return to shareholders
2013 2012
$ $
Borrowings 7,146,320 12,435,698
Cash and cash equivalents (3,882,067) (7,049,729)
Net Borrowings 3,264,253 5,385,969
Total equity 19,228,767 15,826,915
Net Borrowings to Equity ratio 0.17 0.34
(j) Fair Value of Financial Instruments
The fair value of financial assets and financial liabilities are determined as follows:
28 Events after the reporting date
29 Segment reporting
Restatement of prior year comparative information
The Group undertook an internal reorganisation of its business with effective from 1 July 2012. The comparative information has
been reclassified to achieve consistency in disclosure in current year amounts and other disclosures.
Information reported to the chief decision maker for the purposes of resource allocation and assessment of segment performance
focuses on:
• Base Business
• M2M Business
The Base business segment supplies communication devices, including but not limited to fixed wireless + ADSL internet gateways,
designed and manufactured for use primarily by consumer and small medium enterprises (SME). The M2M business segment
division specialises in the development of advanced industrial-grade and commercial 3G /4G wireless broadband products and
solutions for business continuity (disaster recovery), primary mobile broadband and remote M2M connectivity. NetComm Wireless'
M2M products, solutions and services are designed to support applications in areas such as transport, metering, security,
surveillance, banking, health and mining.
The fair value of other financial assets and financial liabilities are determined in accordance with generally accepted
pricing models based on discounted cash flow analysis using prices from observable current market transactions.
The Group monitors capital on the basis of the carrying amount of equity plus its borrowings, less cash and cash equivalents as
presented on the face of the statement of financial position.
The Group sets the amount of capital in proportion to its overall financing structure, i.e. equity and financial liabilities. The Group
manages the capital structure and makes adjustments to it in the light of changes in economic conditions and the risk
characteristics of the underlying assets. In order to maintain or adjust the capital structure, the Group may adjust the amount of
dividends paid to shareholders, return capital to shareholders, issue new shares, or sell assets to reduce debt.
Capital for the reporting periods under review is summarised as follows:
The company held an EGM on 15 July 2013 to approve the conditional placement of shares announced in June 2013. There was
overwhelming support for the conditional placement which resulted in the company obtaining additional capital in the amount of
$950,481, net of costs.
Other than for the item noted above, there has not arisen during the interval between the end of the reporting period and the date of
this report, any item, transaction or event of a material and unusual nature that has, in the opinion of the Directors of the Company,
significantly affected or may significantly affect the operations of the consolidated entity, the results of those operations or the state of
affairs of the consolidated entity in subsequent financial years.
The directors consider that the carrying amounts of financial assets and financial liabilities recorded at amortised cost in the
financial statements approximate their fair values.
The fair value of financial assets and financial liabilities with standard terms and conditions and trade on active liquid
markets are determined with reference to quoted market prices;
55

Annual Report 2012-2013 - NetComm Wireless - 85NetComm Wireless Limited
Notes to the Financial Statements
For the Year Ended 30 June 2013
29 Segment reporting (continued)
(a) Continuing and Discontinued Operations
30 June 30 June 30 June 30 June
2013 2012 2013 2012
$ $ $ $
Continuing Operations
Revenue generated from external customers
Base Business 36,515,595 52,856,825 630,949 4,906,377
M2M Business 6,264,395 6,329,295 94,462 (227,134)
Discontinued operations
Services - Australia - 134,524 - (827,118)
Intersegment Revenue
Base Business 1,233,395 3,572,820 - -
Intersegment Eliminations (1,233,395) (3,572,820) - -
Segment result 42,779,990 59,320,644 725,411 3,852,125
Other income 77,610 175,357
Depreciation and amortisation expense (2,902,008) (2,622,465)
Finance costs (582,108) (460,086)
Group Profit before tax (2,681,095) 944,931
Income tax (expense)/benefit 2,139,471 (104,420)
42,779,990 59,320,644 (541,624) 840,511
2013 2012
$ $
Customer A 7,210,005 9,724,480
Total Revenue 42,779,990 59,320,643
Customer Share of Total (%) 17% 16%
(b) Reconciliation of Group's operating segments to financial statements
30 June 30 June
2013 2012
$ $
Revenue and other income
Total reportable segment revenues 42,779,990 59,320,644
Other Segment income 77,610 175,357
Discontinued operations - (134,524)
Revenue & other income 42,857,600 59,361,477
Profit or Loss
Total reportable segment operating profit 725,411 3,852,125
Other segment profit 77,610 175,357
Operating loss of discontinued operations - 827,118
Operating profit from continuing operations 803,021 4,854,600
Depreciation and amortisation expense (2,902,008) (2,622,465)
Finance costs (582,108) (460,086)
Profit before tax (2,681,095) 1,772,049
Revenue
Revenue Segment Profit
The totals presented for the group's operating segments reconcile to the key figures as presented in its financial statements as
follows:
Segment profit represents the profit earned by each segment without allocation of other income, finance costs and depreciation
and amortisation.
The revenue reported above represents revenue generated from external customers. Intersegment revenues represent transfers
between segments which are eliminated on consolidation. Revenues from a single customer greater than 10% of total revenues
reside in the Base Business segment.
No segment assets and liabilities are disclosed because there is no measure of segment assets or liabilities regularly reported to
the chief decision maker.
During 2013, $5,151,694 or 12% (2012: $7,250,702 or 12%) of the Group's revenues were generated from New Zealand.
Consolidated revenue and profit
for the period
The following is an analysis of the Group’s revenue and results by reportable operating segment.
56

86 - NetComm Wireless - Annual Report 2012-2013
30 Parent entity disclosures
(a) Financial position
2013 2012
Assets $ $
Current assets 13,260,883 19,996,043
Non-current assets 18,020,644 14,094,970
Total assets 31,281,527 34,091,013
Liabilities
Current liabilities 21,299,701 24,824,037
Non-current liabilities 392,538 338,770
Total liabilities 21,692,239 25,162,807
Equity
Issued capital 14,331,926 9,877,120
Retained earnings (4,449,358) (1,344,722)
Reserves
General reserves 395,808 395,808
Foreign exchange hedging reserve (689,090) -
Total equity 9,589,286 8,928,206
(b) Financial performance
2013 2012
$ $
(Loss)/profit for the year (3,104,636) (2,200,238)
Other comprehensive income (689,098) -
Total comprehensive income (3,793,734) (2,200,238)
(c) Commitments for the acquisition of property, plant and equipment by the parent entity
2013 2012
Finance lease liabilities $ $
Not longer than 1 year 156,555 357,182
Longer than 1 year and not longer than 5 years 104,315 119,722
260,870 476,904
(d) Subsidiaries
Percentage Percentage
owned owned
2013 2012
Name of subsidiary Country of incorporation % %
NetComm Wireless (NZ) Limited, (formerly Dynalink Modems Ltd) New Zealand 100 100
Call Direct Cellular Solutions 2003 Pty Ltd Australia 100 100
C10 Communications Pty Ltd Australia 100 100
NetComm Wireless (Canada) Limited, (formerly Canada NetComm Limited) Canada 100 100
NetComm Wireless Limited
Notes to the Financial Statements
For the Year Ended 30 June 2013
Finance leases relate to plant and equipment. The Company has the option to purchase the plant and equipment at the conlusion of the
lease arrangements. The Company's obligations under finance leases are secured by the lessor's title to the leased assets.
57

Annual Report 2012-2013 - NetComm Wireless - 87
31 Discontinued Operations
(a) Income Statement
2013 2012
$ $
Revenue from the sale of goods - 134,524
Other income - -
Change in inventories - (905,525)
Raw materials consumed - -
Employee benefits - (26,015)
Administrative expenses - (30,102)
Other expenses - -
Earnings before interest, tax, depreciation and amortisation (EBITDA) - (827,118)
Depreciation and amortisation expense - -
Finance costs - -
Loss before income tax - (827,118)
Income tax (expense)/benefit - 97,450
Loss after income tax - (729,668)
Attributable to equity holders of the parent - (729,668)
Other comprehensive income
Exchange differences arising on translation of foreign operations - -
Income tax relating to components of other comprehensive income - -
Other comprehensive income for the period (net of tax) - -
Total comprehensive income for the period - (729,668)
Attributable to equity holders of the parent (729,668)
- (729,668)
(b) Financial position
2013 2012
$ $
Current assets
Trade and other receivables - 5,300
Total current assets - 5,300
(c) Cash Flows
2013 2012
$ $
Operating Activities - 78,406
Net Cash Flows from discontinued operations - 78,406
NetComm Wireless Limited
Notes to the Financial Statements
For the Year Ended 30 June 2013
58

88 - NetComm Wireless - Annual Report 2012-2013
32
The registered office and principal place of business of the company is:
NetComm Wireless Limited
Level 2
18-20 Orion Road
Lane Cove NSW 2066
NetComm Wireless Limited
Notes to the Financial Statements
For the Year Ended 30 June 2013
Company details
59

Annual Report 2012-2013 - NetComm Wireless - 89
In the opinion of the directors of NetComm Wireless Limited
(a)
(i) giving a true and fair view of its financial position as at 30 June 2013
(ii) and of its performance for the financial year ended on that date; and
(b)
(c)
(d)
Signed in accordance with a resolution of the directors
On behalf of the Directors
J Milne D P J Stewart
Director Director
27 September 2013 27 September 2013
NetComm Wireless LimitedDirectors' Declaration
the consolidated financial statements and notes of NetComm Wireless Limited are in accordance with
the Corporations Act 2001, including:
(iii) complying with Australian Accounting Standards (including the Australian Accounting
Interpretations) and the Corporations Regulations 2001;
Note 1 confirms that the consolidated financial statements also comply with International
Financial Reporting Standards.
there are reasonable grounds to believe that NetComm Wireless Ltd will be able to pay its debts as and
when they become due and payable.
The directors have been given the declarations required by Section 295A of the Corporations
Act 2001 from the Chief Executive Officer and Chief Financial Officer for the financial year ended
30 June 2013.
60

90 - NetComm Wireless - Annual Report 2012-2013
Grant Thornton Audit Pty Ltd ACN 130 913 594 Level 19, 2 Market Street Sydney NSW 2000 Locked Bag Q800 QVB Post Office Sydney NSW 1230 T +61 2 8297 2400 F +61 2 9299 4445 E [email protected] W www.grantthornton.com.au
61
‘Grant Thornton’ refers to the brand under which the Grant Thornton member firms provide assurance, tax and advisory services to their clients and/or refers to one or more member firms, as the context requires. Grant Thornton Australia Ltd is a member firm of Grant Thornton International Ltd (GTIL). GTIL and the member firms are not a worldwide partnership. GTIL and each member firm is a separate legal entity. Services are delivered by the member firms. GTIL does not provide services to clients. GTIL and its member firms are not agents of, and do not obligate one another and are not liable for one another’s acts or omissions. In the Australian context only, the use of the term ‘Grant Thornton’ may refer to Grant Thornton Australia Limited ABN 41 127 556 389 and its Australian subsidiaries and related entities. GTIL is not an Australian related entity to Grant Thornton Australia Limited. Liability limited by a scheme approved under Professional Standards Legislation. Liability is limited in those States where a current scheme applies.
Independent Auditor’s Report To the Members of NetComm Wireless Limited Report on the financial report We have audited the accompanying financial report of NetComm Wireless Limited (the “Company”), which comprises the consolidated statement of financial position as at 30 June 2013, the consolidated statement of profit or loss and other comprehensive income, consolidated statement of changes in equity and consolidated statement of cash flows for the year then ended, notes comprising a summary of significant accounting policies and other explanatory information and the directors’ declaration of the consolidated entity comprising the Company and the entities it controlled at the year’s end or from time to time during the financial year.
Directors’ responsibility for the financial report The Directors of the Company are responsible for the preparation of the financial report that gives a true and fair view in accordance with Australian Accounting Standards and the Corporations Act 2001. The Directors’ responsibility also includes such internal control as the Directors determine is necessary to enable the preparation of the financial report that gives a true and fair view and is free from material misstatement, whether due to fraud or error. The Directors also state, in the notes to the financial report, in accordance with Accounting Standard AASB 101 Presentation of Financial Statements, the financial statements comply with International Financial Reporting Standards.
Auditor’s responsibility Our responsibility is to express an opinion on the financial report based on our audit. We conducted our audit in accordance with Australian Auditing Standards. Those standards require us to comply with relevant ethical requirements relating to audit engagements and plan and perform the audit to obtain reasonable assurance whether the financial report is free from material misstatement.
An audit involves performing procedures to obtain audit evidence about the amounts and disclosures in the financial report. The procedures selected depend on the auditor’s judgement, including the assessment of the risks of material misstatement of the financial report, whether due to fraud or error.
62
In making those risk assessments, the auditor considers internal control relevant to the Company’s preparation of the financial report that gives a true and fair view in order to design audit procedures that are appropriate in the circumstances, but not for the purpose of expressing an opinion on the effectiveness of the Company’s internal control. An audit also includes evaluating the appropriateness of accounting policies used and the reasonableness of accounting estimates made by the Directors, as well as evaluating the overall presentation of the financial report.
We believe that the audit evidence we have obtained is sufficient and appropriate to provide a basis for our audit opinion.
Independence In conducting our audit, we have complied with the independence requirements of the Corporations Act 2001. Auditor’s opinion In our opinion:
a the financial report of NetComm Wireless Limited is in accordance with the Corporations Act 2001, including:
i giving a true and fair view of the consolidated entity’s financial position as at 30 June 2013 and of its performance for the year ended on that date; and
ii complying with Australian Accounting Standards and the Corporations Regulations 2001; and
b the financial report also complies with International Financial Reporting Standards as disclosed in the notes to the financial statements.
Report on the remuneration report We have audited the remuneration report included in pages 9 to 15 of the directors’ report for the year ended 30 June 2013. The Directors of the Company are responsible for the preparation and presentation of the remuneration report in accordance with section 300A of the Corporations Act 2001. Our responsibility is to express an opinion on the remuneration report, based on our audit conducted in accordance with Australian Auditing Standards. Auditor’s opinion on the remuneration report In our opinion, the remuneration report of NetComm Wireless Limited for the year ended 30 June 2013, complies with section 300A of the Corporations Act 2001.
GRANT THORNTON AUDIT PTY LTD Chartered Accountants
Simon Coulton Partner - Audit & Assurance Sydney, 27 September 2013

Annual Report 2012-2013 - NetComm Wireless - 91
62
In making those risk assessments, the auditor considers internal control relevant to the Company’s preparation of the financial report that gives a true and fair view in order to design audit procedures that are appropriate in the circumstances, but not for the purpose of expressing an opinion on the effectiveness of the Company’s internal control. An audit also includes evaluating the appropriateness of accounting policies used and the reasonableness of accounting estimates made by the Directors, as well as evaluating the overall presentation of the financial report.
We believe that the audit evidence we have obtained is sufficient and appropriate to provide a basis for our audit opinion.
Independence In conducting our audit, we have complied with the independence requirements of the Corporations Act 2001. Auditor’s opinion In our opinion:
a the financial report of NetComm Wireless Limited is in accordance with the Corporations Act 2001, including:
i giving a true and fair view of the consolidated entity’s financial position as at 30 June 2013 and of its performance for the year ended on that date; and
ii complying with Australian Accounting Standards and the Corporations Regulations 2001; and
b the financial report also complies with International Financial Reporting Standards as disclosed in the notes to the financial statements.
Report on the remuneration report We have audited the remuneration report included in pages 9 to 15 of the directors’ report for the year ended 30 June 2013. The Directors of the Company are responsible for the preparation and presentation of the remuneration report in accordance with section 300A of the Corporations Act 2001. Our responsibility is to express an opinion on the remuneration report, based on our audit conducted in accordance with Australian Auditing Standards. Auditor’s opinion on the remuneration report In our opinion, the remuneration report of NetComm Wireless Limited for the year ended 30 June 2013, complies with section 300A of the Corporations Act 2001.
GRANT THORNTON AUDIT PTY LTD Chartered Accountants
Simon Coulton Partner - Audit & Assurance Sydney, 27 September 2013

92 - NetComm Wireless - Annual Report 2012-2013
ASX Additional Information
The shareholder information set out below was applicable as at 25 September 2013.
1 Distribution of Shareholders
Analysis of number of shareholders by size of holding
Category of Holding Number Number of Shares
1 - 1,000 127 55,467
1,001 - 5,000 439 1,299,925
5,001 - 10,000 224 1,743,999
10,001 - 100,000 630 22,672,863
100,001 - share and over 171 102,927,636
Total 1,591 128,699,890
2 Twenty Largest Shareholders
The names of the twenty largest holders of quoted shares are:
Shareholder Number of Shares Percentage of total
sharesBrad Industries Pty Ltd 22,974,596 17.85%
UBS Nominees Pty Ltd 11,335,352 8.81%
NBT Pty Ltd 11,144,923 8.66%
Dr Colin Rose 3,490,223 2.71%
UBS Wealth Management Australia Nominees P/L 2,486,764 1.93%
Michael John Cornelius 2,486,170 1.93%
Askey Computer Corp 2,053,528 1.60%
Yarradale Investments Pty Ltd 1,782,158 1.38%
Mr Gary John Jackson & Ms Christine Gregg 1,593,534 1.24%
BNP Paribas Noms Pty Ltd 1,570,000 1.22%
Catch 88 Pty Ltd 1,368,759 1.06%
Gordon Denby Coad & Miss Shirley Pratt 1,211,176 0.94%
Mrs Cher Suey Cheah, Mr Seuk-Liong Chea & Miss
Sheryn Wei Lynn Cheah 1,200,000 0.93%
HSBC Custody Nominees (Australia) Limited 1,163,381 0.90%
Ms DG Leong / Mr RA Press 1,014,093 0.79%
Mr Darren Jacobus Jansen & Mrs Carolyn Jane
Jansen 982,300 0.76%
Coolah Holdings Pty Limited 884,831 0.69%
Carrier International Pty Limited 809,476 0.63%
Robert & Mary Waldie 767,311 0.60%
Mr Suthara Youhorn & Mrs Youhorn Chea 696,893 0.54%
Total 71,015,468 55.18%
3 Voting Rights
All ordinary shares (whether fully paid or not) carry one vote per share without restriction.
4 Substantial Shareholders
As at 25 September 2013 the substantial shareholders were as follows:
Shareholder Number of SharesPercentage of total
sharesBrad Industries Pty Ltd 22,974,596 17.85%
UBS Nominees Pty Ltd 11,335,352 8.81%
NBT Pty Ltd 11,144,923 8.66%
63

DIRECTORSJ Milne (Non Executive Director & Chairman)
K Boundy (Non Executive Director)
S Black AM (Non Executive Director)
D P J Stewart (CEO & Managing Director)
K J P Sheridan (CFO & Executive Director)
COMPANY SECRETARYK J P Sheridan
REGISTERED OFFICELevel 2, 18-20 Orion Rd
Lane Cove NSW 2066
Telephone: +61 (2) 9424-2000
Facsimile: +61 (2) 9427-9260
AUDITORGrant Thornton Audit Pty Limited.
Chartered Accountants
Level 19
2 Market Street, Sydney NSW 2000
SOLICITORSDLA Phillips Fox
201 Elizabeth Street, Sydney NSW 2000
Maddocks
Angel Place
123 Pitt St, Sydney NSW 2000
BANKERSNational Australia Bank
SHARE REGISTERLink Market Services
Level 12
680 George St
Sydney NSW 2000
Telephone: 8280 7552
WEB ADDRESSwww.netcommwireless.com
CorporateDirectory30 June 2013

Trademarks and registered trademarks are the property of NetComm Wireless Limited or their respective owners. Specifications are subject to change without notice. Images shown may vary slightly from the actual product.
NETCOMM WIRELESS LIMITED ABN 85 002 490 486
Head Office, 18-20 Orion RoadLane Cove, Sydney, NSW 2066, Australia
p: +61 2 9424 2000 f: +61 2 9424 2010e: [email protected]