a guide to understanding the arizona department of
TRANSCRIPT

Arizona Department of Transportation Research Center
A Guide to Understanding the Arizona Department of Transportation Pavement Management SystemSPR-692November 2020
18-386

A Guide to Understanding the Arizona Department of Transportation Pavement Management System
SPR-692 November 2020 Published by: Arizona Department of Transportation 206 South 17th Avenue Phoenix, AZ 85007 In cooperation with U.S. Department of Transportation Federal Highway Administration

This report was funded in part by the Federal Highway Administration, U.S. Department of Transportation. The contents of this report reflect the views of the authors, who are responsible for the facts and the accuracy of the data, and for the use or adaptation of previously published material, presented herein. The contents do not necessarily reflect the official views or policies of the Arizona Department of Transportation or the Federal Highway Administration, U.S. Department of Transportation. This report does not constitute a standard, specification, or regulation. Trade or manufacturers’ names that may appear herein are cited only because they are considered essential to the objectives of the report. The U.S. government and the State of Arizona do not endorse products or manufacturers. This report is subject to the provisions of 23 USC § 409. Any intentional or inadvertent release of this material, or any data derived from its use, does not constitute a waiver of privilege pursuant to 23 USC § 409, which reads as follows:
23 USC § 409 — Discovery and admission as evidence of certain reports and surveys Notwithstanding any other provision of law, reports, surveys, schedules, lists, or data compiled or collected for the purpose of identifying, evaluating, or planning the safety enhancement of potential accident sites, hazardous roadway conditions, or railway-highway crossings, pursuant to sections 130, 144, and 148 of this title or for the purpose of developing any highway safety construction improvement project which may be implemented utilizing Federal-aid highway funds shall not be subject to discovery or admitted into evidence in a Federal or State court proceeding or considered for other purposes in any action for damages arising from any occurrence at a location mentioned or addressed in such reports, surveys, schedules, lists, or data.
This study was conducted in accordance with Title VI of the Civil Rights Act of 1964 (78 Stat. 252.42 U.S.C. §2000d-4), Americans With Disabilities Act of 1990, and other nondiscrimination laws and authorities.

Technical Report Documentation Page 1. Report No.
FHWA-AZ-20-692 2. Government Accession No.
3. Recipient's Catalog No.
4. Title and Subtitle
A Guide to Understanding the Arizona Department of Transportation Pavement Management System
5. Report Date November 2020
6. Performing Organization Code
7. Author Jeff Zavitski, B.A., https://orcid.org/0000-0001-8906-4112 Robert Piane, P. E., https://orcid.org/0000-0002-9564-9704 Gary Ruck, P. E., https://orcid.org/0000-0002-9582-3047 Dr. Alfred Weninger-Vycudil https://orcid.org/0000-0002-3310-2631
8. Performing Organization Report No.
9. Performing Organization Name and Address Deighton Associates Limited 223 Brock Street North, Unit 7 Whitby, Ontario Canada
10. Work Unit No.
11. Contract or Grant No.
SPR 000-1(020) 692 12. Sponsoring Agency Name and Address
Arizona Department of Transportation 206 South 17th Avenue Phoenix, AZ 85007
13.Type of Report & Period Covered
14. Sponsoring Agency Code 15. Supplementary Notes
Prepared in cooperation with the U.S. Department of Transportation, Federal Highway Administration 16. Abstract This report documents the configuration, implementation, and use of the Arizona Department of Transportation (ADOT) Pavement Management System (PMS). The ADOT PMS is a commercial off-the-shelf, web-based application for managing infrastructure assets. The ADOT PMS complies with the federal reporting requirements for state departments of transportation (DOTs) under the U.S. highway investment program enacted by the Moving Ahead for Progress in the 21st Century Act (MAP-21), and also supports ADOT’s modernization effort for pavement management and maintenance operations.
17. Key Words Pavement Management, Asset Management, Risk Management, Performance Modeling, Performance Measures, MAP-21
18. Distribution Statement Document is available to the U.S. public through the National Technical Information Service, Springfield, Virginia 22161
23. Registrant's Seal
19. Security Classification Unclassified
20. Security Classification Unclassified
21. No. of Pages
61 22. Price

SI* (MODERN METRIC) CONVERSION FACTORS APPROXIMATE CONVERSIONS TO SI UNITS
Symbol When You Know Multiply By To Find Symbol LENGTH
in inches 25.4 millimeters mm ft feet 0.305 meters m yd yards 0.914 meters m mi miles 1.61 kilometers km
AREA in2 square inches 645.2 square millimeters mm2
ft2 square feet 0.093 square meters m2
yd2 square yard 0.836 square meters m2
ac acres 0.405 hectares ha mi2 square miles 2.59 square kilometers km2
VOLUME fl oz fluid ounces 29.57 milliliters mL gal gallons 3.785 liters L ft3 cubic feet 0.028 cubic meters m3
yd3 cubic yards 0.765 cubic meters m3
NOTE: volumes greater than 1000 L shall be shown in m3
MASS oz ounces 28.35 grams glb pounds 0.454 kilograms kgT short tons (2000 lb) 0.907 megagrams (or "metric ton") Mg (or "t")
TEMPERATURE (exact degrees) oF Fahrenheit 5 (F-32)/9 Celsius oC
or (F-32)/1.8 ILLUMINATION
fc foot-candles 10.76 lux lx fl foot-Lamberts 3.426 candela/m2 cd/m2
FORCE and PRESSURE or STRESS lbf poundforce 4.45 newtons N lbf/in2 poundforce per square inch 6.89 kilopascals kPa
APPROXIMATE CONVERSIONS FROM SI UNITS Symbol When You Know Multiply By To Find Symbol
LENGTHmm millimeters 0.039 inches in m meters 3.28 feet ft m meters 1.09 yards yd km kilometers 0.621 miles mi
AREA mm2 square millimeters 0.0016 square inches in2
m2 square meters 10.764 square feet ft2
m2 square meters 1.195 square yards yd2
ha hectares 2.47 acres ac km2 square kilometers 0.386 square miles mi2
VOLUME mL milliliters 0.034 fluid ounces fl oz L liters 0.264 gallons gal m3 cubic meters 35.314 cubic feet ft3
m3 cubic meters 1.307 cubic yards yd3
MASS g grams 0.035 ounces ozkg kilograms 2.202 pounds lbMg (or "t") megagrams (or "metric ton") 1.103 short tons (2000 lb) T
TEMPERATURE (exact degrees) oC Celsius 1.8C+32 Fahrenheit oF
ILLUMINATION lx lux 0.0929 foot-candles fc cd/m2 candela/m2 0.2919 foot-Lamberts fl
FORCE and PRESSURE or STRESS N newtons 0.225 poundforce lbf kPa kilopascals 0.145 poundforce per square inch lbf/in2
*SI is the symbol for th International System of Units. Appropriate rounding should be made to comply with Section 4 of ASTM E380. e(Revised March 2003)

CONTENTS Executive Summary ....................................................................................................................................... 1
Staff Training ............................................................................................................................................. 2 Documentation ......................................................................................................................................... 2 Maintenance ............................................................................................................................................. 2
Introduction .................................................................................................................................................. 3 ADOT PMS Project Components ............................................................................................................... 3 Report Overview ....................................................................................................................................... 4
Literature Overview ...................................................................................................................................... 5 Pavement Management Leading Practices ............................................................................................... 5 Using Automated Pavement Condition Data In Model Development ...................................................... 7
ADOT PMS Design ......................................................................................................................................... 9 DATA Flow/Data Integration ..................................................................................................................... 9 ADOT PMS Life Cycle Cost Analysis ......................................................................................................... 12 Performance Prediction Models ............................................................................................................. 14
The ADOT PMS Analysis .............................................................................................................................. 29 Analysis Workflow ................................................................................................................................... 29 Generate Analysis Segments ................................................................................................................... 29 Review the Performance Prediction Models .......................................................................................... 30 Review Treatments ................................................................................................................................. 34
Custom Reports........................................................................................................................................... 47 Custom Report: Budget Analysis Report–Condition Distribution Lane Miles ......................................... 47 Custom Report: Budget Analysis Report–Expenditure Report ............................................................... 48 Custom Report: Budget Analysis Report–Strategy Export ...................................................................... 48 Custom Report: Pavement Project Report ............................................................................................. 48 Custom Report: PECOS Maintenance Report ......................................................................................... 49 Custom Report: Pavement History Report ............................................................................................. 49 Custom Report: Traffic History Report ................................................................................................... 49 Custom Report: PaveME Comparison Report ......................................................................................... 50 Custom Report: PaveME Multiple project Comparison Report .............................................................. 50 Custom Report: Pavement Condition Summary Report ......................................................................... 50 Custom Report: Pavement Condition Detail Report ............................................................................... 50 Custom Report: ESAL Calculation Report ................................................................................................ 51 Custom Report: SODA Report ................................................................................................................. 51
References .................................................................................................................................................. 53

FIGURES Figure 1. ADOT PMS Alternative Strategies ................................................................................................ 12 Figure 2. Resulting Condition Distribution (% Length) ................................................................................ 13 Figure 3. Deterministic Deterioration Function for Rutting ........................................................................ 21 Figure 4. Deterministic Deterioration Function for IRI ............................................................................... 22 Figure 5. Deterministic Deterioration Function for HPMS Cracking ........................................................... 23 Figure 6. Deterministic Deterioration Function for ADOT Cracking ........................................................... 24 Figure 7. Deterministic Deterioration Function for Faulting ...................................................................... 25 Figure 8. Model Validation Result for Rutting ............................................................................................ 26 Figure 9. Model Validation Result for IRI .................................................................................................... 26 Figure 10. Model Validation for HPMS Cracking ......................................................................................... 27 Figure 11. Model Validation Result for PMS Cracking ................................................................................ 27 Figure 12. Model Validation for Faulting .................................................................................................... 28 Figure 13. ADOT PMS Analysis Workflow ................................................................................................... 29 Figure 14. ADOT Decision Tree ................................................................................................................... 36 Figure 15. Treatment Life Reset Methodology (Image provided by ADOT) .............................................. 39 Figure 16. Optimization Example ................................................................................................................ 43
TABLES Table 1. ADOT PMS tables loaded with data from ATIS ............................................................................. 10 Table 2. Tables Loaded from the ADOT Highway Database ....................................................................... 11 Table 3. ADOT Performance Prediction Families ........................................................................................ 15 Table 4. Climate Categories, Based on SVF, for the Definition of Homogeneous Performance Families .. 17 Table 5. ESALs20 Categories for the Definition of Homogeneous Performance Families ........................... 17 Table 6. Model Coefficients for Deterministic Deterioration Function for Rutting .................................... 20 Table 7. Model Coefficients for Deterministic Deterioration Function for IRI ........................................... 21 Table 8. Model Coefficients for Deterministic Deterioration Function for HPMS Cracking ....................... 22 Table 9. Model Coefficients for Deterministic Deterioration Function for ADOT Cracking ........................ 24 Table 10. Model Coefficients for Deterministic Deterioration Function for Faulting ................................. 25 Table 11. ADOT PMS Analysis Variables ..................................................................................................... 32 Table 12. Risk Reset by ADOT PMS Reconstruction Treatment .................................................................. 34 Table 13. ADOT PMS Treatments ................................................................................................................ 35 Table 14. Treatment Unit Costs .................................................................................................................. 37 Table 15. Treatment Resets ........................................................................................................................ 38 Table 16. Treatment Life Resets in Lookup Table ....................................................................................... 39 Table 17. LCCA_NETWORK Analysis Set Properties .................................................................................... 40 Table 18. Budget Scenarios ......................................................................................................................... 41 Table 19. Analysis Statistics ........................................................................................................................ 43

ACRONYMS
AADT Average annual daily traffic ADOT Arizona Department of Transportation AMS Asset Management System ATIS Arizona Transportation Information System COTS Commercial off-the-shelf DOT Department of transportation dTIMS Deighton’s Total Infrastructure Management System ESAL Equivalent single axle load FHWA Federal Highway Administration FWD Falling Weight Deflectometer GIS Geographic Information System HPMS Highway Performance Monitoring System IRI International Roughness Index JPCP Jointed Plain Concrete Pavement LCCA Life Cycle Cost Analysis LRS Linear Referencing System LTPP Long-Term Pavement Performance MAP-21 Moving Ahead for Progress in the 21st Century Act MPD Multimodal Planning Division NHS National Highway System NPMs National Performance Measures nPV Net present value OCI Overall Condition Index PECOS Performance Controlled System PMS Pavement Management System SODA Structural Overlay Design for Arizona SSRS SQL Server Reporting Services SVF Season variation factor

1
EXECUTIVE SUMMARY This report documents the implementation of the Arizona Department of Transportation’s (ADOT) Pavement Management System (PMS). The ADOT PMS is a commercial off-the-shelf (COTS), web-based application implemented within a robust and flexible software platform called dTIMS CT. This platform was developed by Deighton Associates Limited (Deighton) for managing infrastructure assets. The dTIMS platform is an enterprise asset management solution that encompasses strategic planning with maintenance operations and capital investment decision making. The project objectives were as follows:
• Conduct research on recent pavement and asset management leading practices. • Implement a modern, web-based PMS that meets the risk and performance management
requirements of the Federal Highway Administration as mandated by the Moving Ahead for Progress in the 21st Century Act (MAP-21).
• Build the ADOT PMS with automated workflows utilizing existing data sources. • Develop pavement performance prediction models specific to ADOT’s pavement network
conditions. • Design the ADOT PMS analytical function with the Life Cycle Cost Analysis (LCCA) method. • Develop custom reports supporting the ADOT Pavement Design team’s data needs.
The ADOT PMS provides advanced and sophisticated tools for managing ADOT’s pavement network. It allows ADOT staff to perform a variety of activities:
• Integrate Geographic Information System (GIS) data, including Linear Referencing System (LRS) data, with network and spatial data for mapping and plotting.
• Develop customized database schemas to store and manage all highway asset data in one centralized database and application. ADOT staff can update this schema at any time.
• Analyze alternative investment scenarios to develop performance targets and determine funding necessary to reach set targets.
• Analyze pavement segments to determine optimum preservation, rehabilitation, and reconstruction treatments using advanced performance models and complex decision trees to ensure the right treatment is recommended at the right time.
• Create sophisticated custom reports, pivot tables, and dashboards putting data and information in the hands of those who need it quickly and efficiently.
With a successful deployment of the ADOT PMS in mind, members of the Technical Advisory Committee were actively engaged in all phases of system planning, development, testing, and documentation:

2
STAFF TRAINING
Two in-person training sessions were conducted for ADOT staff. The first was a four-day session completed in October 2019. The second training was completed in November 2019. A separate presentation of the ADOT PMS was also provided to several ADOT staff members from work units including Pavement Design, the District offices, and the Transportation Systems Management and Operations Division.
In addition, several hands-on tutorials, in conjunction with lectures and presentations, were developed to train ADOT staff on the operation and analysis methodology of the ADOT PMS.
DOCUMENTATION
Several reports were developed during the project development phase, most notably:
• Automated Distress Data Research Report containing research findings from the review of literature
• ADOT PMS Performance Prediction Modeling containing details of model development • Technical Specifications for the Database and Analysis setup of the ADOT PMS • Technical Manuals containing the data loading, operations, and analysis guides for the ADOT
PMS
MAINTENANCE
The upkeep of the system is essential. To ensure the system stays relevant to changing conditions, methodologies, and economic factors, ADOT staff can perform the following:
• Review the configured analysis parameters • Review the pavement prediction models • Review the treatment definitions • Adjust the economic parameters • Make regular updates to PMS utilizing new releases of dTIMS • Use support services that provide access to the dTIMS user community to get hands-on training
and documentation, archived Web events, FAQs, and information about other general topics.

3
INTRODUCTION Arizona Department of Transportation (ADOT) is responsible for the operation and maintenance of the Arizona state highway system, or network as it is referred to in this report, which encompasses assets with historical values approaching $22 billion. The pavement asset, comprising more than 21,000 lane miles of pavement, represents a significant portion of the overall asset value (Anderson 2019). As early as 1980, ADOT began implementing an automated pavement management system with pavement deterioration models and treatment recommendations (Way and Eisenberg 1980). This early, hard-coded, mainframe system required code changes to enhance and maintain the system over time. Further enhancement was made in 2006 when ADOT invested in its first commercial off-the-shelf (COTS) pavement management system (Zaghloul et al. 2006) that included both pavement management and pavement maintenance operations. With the advent of certain federal reporting requirements for state departments of transportation (DOTs) under the Moving Ahead for Progress in the 21st Century Act (MAP-21), and alongside ADOT’s modernization effort, the need for a more advanced pavement management system was identified. In response, this project (henceforth referred to as the ADOT Pavement Management System or ADOT PMS) was awarded in 2016. ADOT PMS PROJECT COMPONENTS
Implementation of the ADOT PMS included several key project components designed to meet ADOT requirements. Each project component is briefly described in the following subsections. Research Component
Given the significant amount of time that had elapsed since the last pavement management system was put in place, a review of literature was conducted on the leading practices in pavement management system development and in the use of automated pavement condition data. Data Integration Component
Development of the ADOT PMS required the use of existing databases, whenever possible, to avoid the complex process of extensive data transformation. Different types of data, such as Geographic Information System (GIS) data, were integrated in the most efficient manner possible. Model Development Component
Predictive models are necessary to ensure that treatment recommendations in future years are appropriate for actual deterioration rates of the ADOT pavement network. The set of prediction models built were based on the pavement condition of the state highway network.

4
Pavement Management Analysis and Reporting Component
The ADOT PMS supports several planning functions within ADOT, which include Federal Highway Administration reporting requirements as mandated by the Moving Ahead for Progress in the 21st Century Act (MAP-21), scenario analysis for the Transportation Asset Management Plan, long-term funding needs analysis for strategic planning, and program recommendations for the highway pavement assets. The Life Cycle Cost Analysis (LCCA) method is used in the analysis of funding needs, network performance, and treatment recommendations. The analysis also conforms to all MAP-21 requirements and is certifiable by the Federal Highway Administration (FHWA), if required. Custom Reports Component
Several custom reports were developed to support pavement management and pavement design initiatives within ADOT. These custom reports would allow ADOT staff to easily retrieve data that are stored and analyzed within the ADOT PMS in pre-designed formats. The 11 custom reports that were developed are discussed in Chapter 5 of this report. Training Component
The ADOT PMS includes many sophisticated data manipulations, data analysis, data mapping, and data reporting functions to enable users to accomplish complex data analysis and sophisticated LCCA. ADOT staff were trained to ensure that enough internal capacity exists to allow for efficient operation and maintenance of the ADOT PMS. Documentation Component
The system structure, operations, and functions are fully documented in two sets of technical manuals. One pertains to the basic software, dTIMS, and the other to the customized ADOT PMS. REPORT OVERVIEW
Chapter 2 summarizes the review of literature and findings that were considered in the ADOT PMS design. Chapter 3 provides a comprehensive review of the ADOT PMS design approach, including its technical attributes and solutions. Chapter 4 gives a condensed overview of the ADOT PMS LCCA process and results. The report ends in Chapter 5, which discusses each of the 11 custom reports.

5
LITERATURE OVERVIEW Two literature reviews were undertaken. The first one reviews overarching research into the leading practices in pavement and asset management, and the second focuses on the use of automated (as opposed to manually collected) pavement condition data in developing performance prediction models. PAVEMENT MANAGEMENT LEADING PRACTICES
Within the last 10 years, many research and development projects on the national and international level have been carried out to improve the accuracy of pavement management analyses. It is a common understanding that the results and outputs generated by a pavement management system are directly related to a number of factors: the quality and quantity of underlying information and data, the models and algorithms used to assess the actual and future condition of the pavements, and the array of alternative treatments available for recommending appropriate maintenance treatments and technologies. A total of 75 relevant research studies were reviewed by the project team covering nine subject matter areas. These studies were further classified by level of relevance (low, medium, high) in the development of the ADOT PMS. Based on the overall review of literature, the project team determined that the following subject areas would have the most impact on the development of the ADOT PMS:
• Inclusion of advanced technical performance indicators for pavements and high-level key performance indicators for strategic maintenance planning
• New and advanced methods for calibrating performance prediction models • Integration of risk analysis into the LCCA process • Improved structural assessment of pavement constructions • Advanced performance monitoring
The discussions below outline insights from the literature review that were incorporated into the ADOT PMS. MAP-21 Performance Measures
The ADOT PMS is configured to analyze and report the National Performance Measures (NPMs) for MAP-21 reporting:
• MAP-21 measures for the International Roughness Index (IRI), rutting, cracking, and faulting are predicted during the LCCA.
• MAP-21 measures for IRI, rutting, cracking, and faulting are categorized into Good/Fair/Poor metrics based on MAP-21 guidelines.

6
• MAP-21 Good/Fair/Poor predictions for alternative budget scenarios are reported for each classification of Interstate pavements, ADOT-owned National Highway System (NHS) pavements, non-ADOT-owned NHS pavements, ADOT high-volume non-NHS pavements, and ADOT low-volume non-NHS pavements.
Global Performance Indicator
A general performance indicator that measures overall benefit was created and incorporated into the ADOT PMS. This indicator is used in budget optimization:
• A performance measure called Overall Condition Index (OCI) represents the overall condition of the pavement asset, incorporating the NPMs and the Risk Score for each pavement analysis segment.
• The OCI is currently calculated as an even percentage (25 percent) of IRI, cracking, rutting, and risk for asphalt pavements, and an even percentage (25 percent) of IRI, cracking, faulting, and risk for concrete pavement. The formula is provided in Chapter 4.
• The OCI is used as the benefit model within the LCCA and is maximized during the budget scenario optimization process.
Risk Performance Indicator
The level of risk assigned to a specific location is based on the likelihood and consequence of asset loss of service failure and is incorporated in the ADOT PMS, as follows:
• A risk table was configured within the ADOT PMS database for locations in the ADOT network with risks that could affect the transportation network. The risk table includes a likelihood of failure rating as well as a “consequence of failure” rating, which give a risk score when multiplied together.
• Performance variables for the probability of failure, the consequence of failure, and the risk score were created.
• The risk score performance variable was included in the OCI, which serves as basis for scenario optimization.
Pavement Construction Data
Both the pavement design and pavement construction data are included in the ADOT PMS and are used primarily in the production of custom reports. Data are loaded in the custom reports using automated data loading procedures such as follows:
• Pavement Design Data • Pavement Structural Data-Falling Weight Deflectometer (FWD) • Long-Term Pavement Performance

7
• A Structural Overlay Design for Arizona (SODA) custom report with specifications to calculate required overlay thickness, prescribed by the ADOT design staff
Pavement Condition Data
Extensive database structure and data preparation procedures were implemented for the maintenance and storage of the automated pavement condition data by the following steps:
• Pavement condition tables were configured within the ADOT PMS and data loading, and procedures were created to automate data loading.
• Pavement condition data were included in generating the pavement project segments for analysis.
• Pavement condition data were transformed into the analysis segments though dTIMS transformation objects and automated in a dTIMS workflow.
• Pavement condition data were used in several of the custom reports created for the ADOT PMS.
USING AUTOMATED PAVEMENT CONDITION DATA IN MODEL DEVELOPMENT
In July 2018, ADOT decided to use the automated (instead of the manually collected) pavement condition datum in developing the predictive models. To deliver a review of literature on the state of the practice, the authors reviewed over 23 research studies conducted by state DOTs and international agencies on the use of automated pavement condition data in developing predictive models. The following leading practices from the literature review were used to evaluate potential biases in the ADOT PMS data:
• Minimize, or eliminate, subjectivity in data collection by collecting raw measures instead of indexes based on subjective ranges: Availability of collected data in raw measurements is essential to enable a separation between objective recording and objective assessment. ADOT’s automated pavement condition data are collected using methods that do not present potential subjectivity in data measurement.
• Maintain comparability of data overtime: A shift in the data collection method from manual to automated (or vice-versa) may present bias in the data. Prior to model development, a correlation study was conducted on ADOT’s historical manually collected and automated pavement condition data. Because there was no correlation found between these two data sets (except for the IRI), ADOT decided to use the automated pavement condition data even though they include only two years of data measurements. Further enhancement of the deterioration models is expected as future measurements are added. It was also noted that future changes in the data collection method or vendor may also affect the data.
• Use of consistent measurement data: It is essential to adopt consistent measurement of data, either in the form of constant measurement sections or in the form of homogeneous sections. Data used in the ADOT PMS are delivered in consistent bins each year.

8
• Conduct visual comparison of condition data: The condition data from automated distress measurements are graphically reported on strip maps and maps for quality control. The ADOT PMS includes mapping and strip map diagrams to facilitate comparison of values across multiple sections and multiple years.

9
ADOT PMS DESIGN ADOT PMS uses a COTS product, developed by Deighton Associates Limited (Deighton), called dTIMS. dTIMS is an asset management solution that was configured to the specific needs and requirements of ADOT to effectively maintain and manage its pavement assets. This chapter discusses the basic elements of the ADOT PMS configuration. DATA FLOW/DATA INTEGRATION
There are two primary data sources for the ADOT PMS: the Arizona Transportation Information System (ATIS), managed by the Multimodal Planning Division (MPD) Geographic Information System staff, and the ADOT Highway Database, managed by the MPD Pavement Management staff. The dTIMS tables were configured to match the table structures of these two data sources. In other words, the nomenclature used in these databases was largely preserved in the ADOT PMS. ADOT GIS Data Source: The ATIS Route database uses the ARCGIS™ platform developed by Environmental Systems Research Institute (ESRI). The ATIS Route network serves as the authoritative Linear Referencing System (LRS) to extract the highway network definition used in ADOT PMS analysis and reporting. Table 1 lists the ADOT PMS tables that are sourced from the ATIS server.

10
Table 1. ADOT PMS tables loaded with data from ATIS
ADOT PMS Table Name Description GIS Feature Class Table GIS_BRIDGE Bridge Locations LRSE_STRUCTURES GIS_CONDITION_2017 Condition Table–2017 LRSE_HPMSBINDATA_CY2017 GIS_CONDITION_CURRENT Condition Table–2018 LRSE_HPMSBINDATA_CY2018 GIS_INVENTORY_CONSRUCTED Construction data LRSE_YEARLASTCONSTRUCTED GIS_INVENTORY_FACILITY_TYPE Facility type data LRSE_FACILITY GIS_INVENTORY_FUNC_CLASS Functional class data LRSE_FUNCTIONALCLASS GIS_INVENTORY_IMPROVED Improvement data LRSE_IMPROVEMENT GIS_INVENTORY_JURISDICTION Jurisdiction data LRSE_OWNERMAINT GIS_INVENTORY_LANES Lane data LRSE_THROUGHLANES GIS_INVENTORY_MEDIAN Median data LRSE_MEDIAN GIS_INVENTORY_NHS NHS data LRSE_NHS GIS_INVENTORY_SHOULDER_LEFT Left shoulder data LRSE_SHOULDERLEFT GIS_INVENTORY_SHOULDER_RIGHT Right shoulder data LRSE_SHOULDERRIGHT GIS_INVENTORY_SHOULDER_TYPE_L Left shoulder type data LRSE_SHOULDERSURFACETYPELEFT GIS_INVENTORY_SHOULDER_TYPE_R Right shoulder type data LRSE_SHOULDERSURFACETYPERIGHT GIS_INVENTORY_SPEED_LIMIT Speed limit data LRSE_SPEEDLIMIT GIS_INVENTORY_TERRAIN Terrain data LRSE_TERRAINTYPE GIS_INVENTORY_URBAN_CODE Urban code data LRSE_URBANCODE GIS_INVENTORY_WIDENING Widening data LRSE_WIDENING
Network Highway Network Definition ROUTE though export network
Network_MP Mile Post Locations LRSE_MILEPOST ADOT Highway Data Source: ADOT maintains a database, called the ADOT Highway Database, that stores current and historical pavement data. It is the only ADOT database that stores FWD test data and Friction test data, two data files used in the ADOT PMS. Table 2 lists the ADOT PMS tables that are sourced from the ADOT Highway database.

11
Table 2. Tables Loaded from the ADOT Highway Database
ADOT PMS dTIMS Table Name Description
PMS_ANALYSIS PMS Analysis segment table Lane = 1 refers to project length segments Lane = 2 refers to 1/10th mile segments
PMS_COMMITTED Committed treatment table PMS_CS Historic condition survey data PMS_CS_CRACKING Historical detailed cracking data from the condition surveys
PMS_FOUNDATION_ISSUES Segment locations identified by pavement management as having foundation / structure issues
PMS_FRICTION Historical friction test records. PMS_FWD Historical falling weight deflectometer test results PMS_IRI Historical roughness test results PMS_LTPP_ACCRACKING Historical Long-Term Pavement Performance (LTPP) asphalt cracking test data PMS_LTPP_IRI LTPP roughness test data PMS_LTPP_JPCPCRACKING LTPP Jointed Plain Concrete Pavement (JPCP) cracking test data PMS_LTPP_JPCPFAULTING LTPP JPCP faulting test data PMS_LTPP_RUTTING LTPP rutting test data PMS_LTPP_SITES LTPP test site data PMS_MEPDG_LAYER Layer data from the pavement design data PMS_MEPDG_PROJECTS Project data from the pavement design data PMS_MEPDG_RESULTS Predicted distress data from the pavement design data PMS_PAVEMENT Pavement type data PMS_PECOS Maintenance history data PMS_PROJECT_HISTORY Project history data PMS_PROJECTS Current and future projects data PMS_RISK Segment risk data PMS_RUT Historical rut test results PMS_SEASONAL_VARIATION Climate-related seasonal variation factors PMS_SOILS Soil classification data PMS_TRAFFIC Vehicle and truck traffic count information SODA_ESAL_LaneDistribution Pavement Design Manual Table A-2 SODA_ESAL_TruckLFClusters Pavement Design Manual Table A-4 SODA_ESAL_TruckLoadFactors Pavement Design Manual Tables A-5 & A-6 SODA_ESAL_TruckTrafficClass Pavement Design Manual Table A-1 SYS_LOOKUP_CRV_ADOT_CRACKING Analysis Lookup curves for ADOT Cracking Index SYS_LOOKUP_CRV_FAULTING Analysis Lookup curves for Faulting Index SYS_LOOKUP_CRV_HPMS_CRACKING Analysis Lookup curves for HPMS_CRACKING index SYS_LOOKUP_CRV_ROUGHNESS Analysis Lookup curves for Roughness index SYS_LOOKUP_CRV_RUTTING Analysis Lookup curves for Rutting Index SYS_LOOKUP_TREATMENTS Analysis Lookup table for treatments SYS_LOOKUP_TRT_COST Analysis Lookup table for treatment cost

12
ADOT PMS Data Processing: The ADOT PMS uses a series of automated data loading processes. Within the ADOT PMS, GIS integration objects (a function of the ADOT PMS) are used to load the data from ATIS into the ADOT PMS, and the workflow objects (a function of the ADOT PMS) are used to load the data from the ADOT Highway Database into the ADOT PMS (refer to the Data Loading Guide for details).The ADOT PMS has the following data storage features:
• Existing data in the ADOT PMS are deleted and refreshed with new data on a semi-annual or as-needed basis.
• A query is executed to return new data from the ADOT GIS using a published Representational State Transfer (REST) Service or from the ADOT Highway Database using a SQL Query.
• Data elements (rows) are imported into the respective ADOT PMS table. • Data values (columns of data) are imported into the respective ADOT PMS table. • Errors are reported. Typical errors include values outside of defined limits.
ADOT PMS LIFE CYCLE COST ANALYSIS
The ADOT PMS uses a Life Cycle Cost Analysis method to manage the pavement assets over their entire lifespan. The LCCA analyzes the best combination of preservation, rehabilitation, or reconstruction treatments for each pavement section. ADOT PMS generates multiple alternative strategies based on ADOT performance prediction models, treatments, and decision trees. Each strategy may consist of one or more preservation, rehabilitation, or reconstruction treatments. The benefits and the costs of each of these strategies are calculated, evaluated, and compared. Figure 1 shows two alternative strategies generated for a typical pavement section, along with the do-nothing strategy.
Figure 1. ADOT PMS Alternative Strategies
0
20
40
60
80
100
120
0 5 10 15 20 25 30 35
Asse
t Con
ditio
n
Asset Age
Aleternative Strategies
Do Nothing Strategy 1 Strategy 2

13
As a pavement asset ages, the pavement deteriorates, resulting in higher operating costs (i.e., increased pavement roughness due to vehicle wear and tear) and higher maintenance costs (e.g., increased pothole patching). By generating multiple strategies for different treatment combinations, the ADOT PMS compares strategies over the analysis timeframe. In this example, Strategy 1 consists of two minor treatments and Strategy 2 consists of one major treatment. For each strategy, the ADOT PMS calculates the benefits by measuring the impacts to the pavement condition over its life cycle, costs, and the benefit/cost ratio. Strategies are then optimized based on the Incremental Benefit Cost Optimization method (Shahin et al. 1985). Using the LCCA method, these alternative strategies are optimized for each funding scenario. Alternative funding scenarios indicate how much funding is available and how that funding is distributed in categories of preservation, rehabilitation, and reconstruction. The lower the amount of funding, the fewer the strategies that can be selected, leaving some pavement segments with only the “do-minimum” option. The higher the funding, the greater the pavement segments that will receive a recommended strategy. After the optimization process identifies the most beneficial strategy to take for each pavement segment under a given budgetary scenario, the resulting pavement network condition can be reported using the FHWA Good/Fair/Poor categorization. Figure 2 shows the resulting condition distribution of the pavement for a typical budget scenario from the ADOT PMS.
Figure 2. Resulting Condition Distribution (% Length)
0.00
10.00
20.00
30.00
40.00
50.00
60.00
70.00
80.00
90.00
100.00
Network Condition Based on Lane Miles
% Poor % Fair % Good

14
PERFORMANCE PREDICTION MODELS
During the LCCA process, the ADOT PMS uses models to predict the current highway network pavement conditions into the future. Accurate prediction models are necessary to ensure the ADOT PMS generates treatment recommendations for future years that represent accurate (or in close approximation of the actual) deterioration rates of the pavement network. The prediction models in the ADOT PMS reflect the varying conditions found within the agency’s network. Moreover, the models were built using the automated distress data as opposed to using the historical data collected with the manual method. Pavement Families
Modern pavement management systems typically subdivide the pavement assets into categories for performance prediction; these categories are referred to as pavement families. Pavement families group together pavement segments that share like characteristics and should perform similarly. Through discussions with ADOT, a set of pavement families was determined based upon four factors: pavement type, climate, traffic load or the Equivalent Single Axle Load (ESAL), and pavement foundation strength or quality. A total of 58 pavement families were determined using the analysis of variance to validate the pavement family classifications. The results confirmed that the pavement families adequately represent all pavement types. The families are outlined in Table 3.
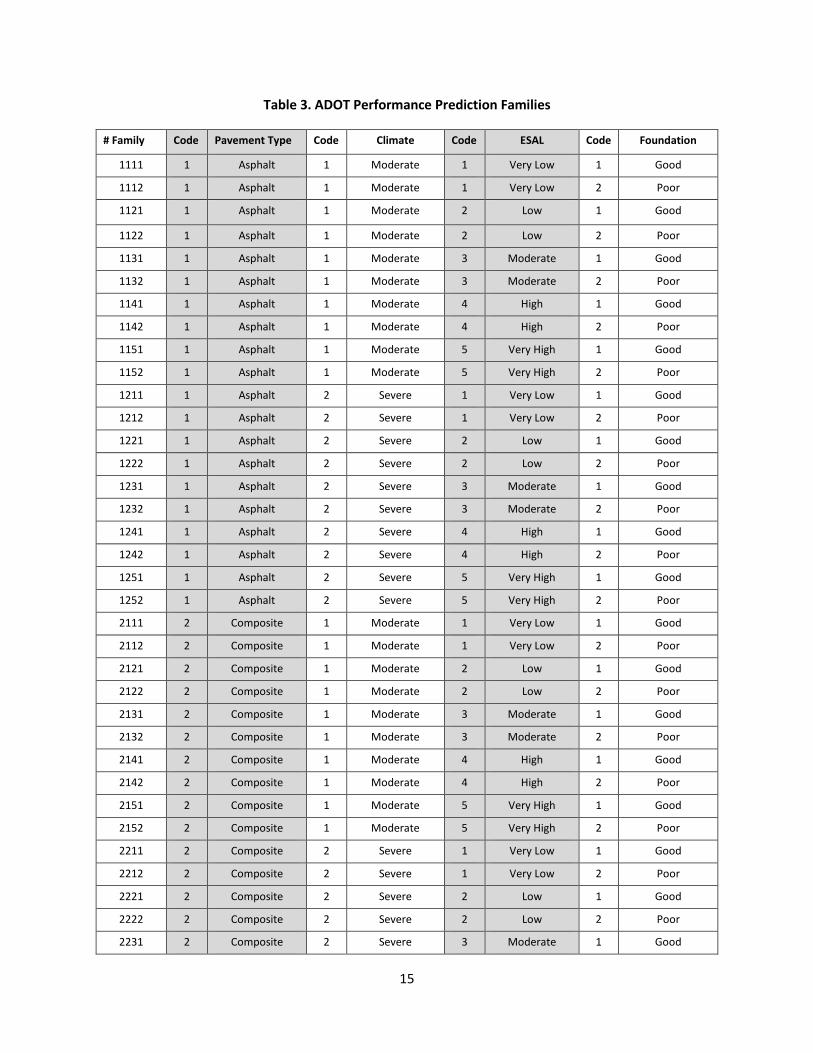
15
Table 3. ADOT Performance Prediction Families
# Family Code Pavement Type Code Climate Code ESAL Code Foundation
1111 1 Asphalt 1 Moderate 1 Very Low 1 Good
1112 1 Asphalt 1 Moderate 1 Very Low 2 Poor
1121 1 Asphalt 1 Moderate 2 Low 1 Good
1122 1 Asphalt 1 Moderate 2 Low 2 Poor
1131 1 Asphalt 1 Moderate 3 Moderate 1 Good
1132 1 Asphalt 1 Moderate 3 Moderate 2 Poor
1141 1 Asphalt 1 Moderate 4 High 1 Good
1142 1 Asphalt 1 Moderate 4 High 2 Poor
1151 1 Asphalt 1 Moderate 5 Very High 1 Good
1152 1 Asphalt 1 Moderate 5 Very High 2 Poor
1211 1 Asphalt 2 Severe 1 Very Low 1 Good
1212 1 Asphalt 2 Severe 1 Very Low 2 Poor
1221 1 Asphalt 2 Severe 2 Low 1 Good
1222 1 Asphalt 2 Severe 2 Low 2 Poor
1231 1 Asphalt 2 Severe 3 Moderate 1 Good
1232 1 Asphalt 2 Severe 3 Moderate 2 Poor
1241 1 Asphalt 2 Severe 4 High 1 Good
1242 1 Asphalt 2 Severe 4 High 2 Poor
1251 1 Asphalt 2 Severe 5 Very High 1 Good
1252 1 Asphalt 2 Severe 5 Very High 2 Poor
2111 2 Composite 1 Moderate 1 Very Low 1 Good
2112 2 Composite 1 Moderate 1 Very Low 2 Poor
2121 2 Composite 1 Moderate 2 Low 1 Good
2122 2 Composite 1 Moderate 2 Low 2 Poor
2131 2 Composite 1 Moderate 3 Moderate 1 Good
2132 2 Composite 1 Moderate 3 Moderate 2 Poor
2141 2 Composite 1 Moderate 4 High 1 Good
2142 2 Composite 1 Moderate 4 High 2 Poor
2151 2 Composite 1 Moderate 5 Very High 1 Good
2152 2 Composite 1 Moderate 5 Very High 2 Poor
2211 2 Composite 2 Severe 1 Very Low 1 Good
2212 2 Composite 2 Severe 1 Very Low 2 Poor
2221 2 Composite 2 Severe 2 Low 1 Good
2222 2 Composite 2 Severe 2 Low 2 Poor
2231 2 Composite 2 Severe 3 Moderate 1 Good

16
# Family Code Pavement Type Code Climate Code ESAL Code Foundation
2232 2 Composite 2 Severe 3 Moderate 2 Poor
2241 2 Composite 2 Severe 4 High 1 Good
2242 2 Composite 2 Severe 4 High 2 Poor
2251 2 Composite 2 Severe 5 Very High 1 Good
2252 2 Composite 2 Severe 5 Very High 2 Poor
3121 3 Concrete 1 Moderate 2 Low 1 Good
3122 3 Concrete 1 Moderate 2 Low 2 Poor
3131 3 Concrete 1 Moderate 3 Moderate 1 Good
3132 3 Concrete 1 Moderate 3 Moderate 2 Poor
3141 3 Concrete 1 Moderate 4 High 1 Good
3142 3 Concrete 1 Moderate 4 High 2 Poor
3151 3 Concrete 1 Moderate 5 Very High 1 Good
3152 3 Concrete 1 Moderate 5 Very High 2 Poor
3211 3 Concrete 2 Severe 1 Very Low 1 Good
3212 3 Concrete 2 Severe 1 Very Low 2 Poor
3221 3 Concrete 2 Severe 2 Low 1 Good
3222 3 Concrete 2 Severe 2 Low 2 Poor
3231 3 Concrete 2 Severe 3 Moderate 1 Good
3232 3 Concrete 2 Severe 3 Moderate 2 Poor
3241 3 Concrete 2 Severe 4 High 1 Good
3242 3 Concrete 2 Severe 4 High 2 Poor
3251 3 Concrete 2 Severe 5 Very High 1 Good
3252 3 Concrete 2 Severe 5 Very High 2 Poor
The elements considered in determining the pavement families for each of the four factors are given below:
• Factor: Pavement type
o Asphalt (flexible pavement)
o Composite (semi-flexible pavement)
o Concrete (rigid pavement)
• Factor: Climate, expressed by the season variation factor (SVF), see Table 4

17
Table 4. Climate Categories, Based on SVF, for the Definition of Homogeneous Performance Families
Category Lower Range Upper Range
Moderate 0.00 1.50
Severe 1.50 5.00
• Factor: Traffic load, expressed by equivalent single axle loads for a design period of 20 years (ESALs20), see Table 5
Table 5. ESALs20 Categories for the Definition of Homogeneous Performance Families
ESALs20 Categories Minimum ESALs20 Maximum ESALs20
Very Low - 300,000
Low 300,000 3,000,000
Moderate 3,000,000 10,000,000
High 10,000,000 30,000,000
Very High 30,000,000 -
• Factor: Pavement foundation strength or quality of foundation
o Good – no issues detected
o Poor – identified issues
Data Cleaning Process
Automated distress data often present challenges when compared across multiple years. This is partly due to slight variations in the location and travel paths of the automated measurement vehicle. Thus, it is important that before the model development process begins, the automated distress measurement data are cleaned. In developing the ADOT PMS, the following data cleaning process was applied to the 2017 and 2018 data, i.e., the only available measurements at the time:
• First, sections where one of the following conditions existed were excluded: a) where one or both condition measurements from the two road inspections were missing or b) where an allocation to a homogeneous performance family was not possible.
• Second, sections where a maintenance treatment was applied in either 2017 or 2018 were excluded to eliminate pavement sections that did not deteriorate untouched.
• Third, data showing better measurement values in 2017 than in 2018 were eliminated. Normally, pavements do not get better on their own, so segments showing no deterioration or improved condition relative to the previous year were removed from the study. Also, to exclude the

18
impact of non-plausible negative change (delta) values, the delta value exclusion criteria were set to greater than or equal to zero.
Equations
Equations were developed to predict the performance of MAP-21 technical parameters of interest. Linear equations were developed to predict IRI and rutting (asphalt only) performance, and non-linear equations were developed to predict percent cracking and faulting (concrete only) performance. Linear Models
Linear models (not necessarily represented as a straight-line graph) used for IRI and rutting calculations are shown below as equations 1 and 2, respectively.
TPrutting,t+1 = TPrutting,t + a ∙ Aget+1 + b ∙ ESALs2020000000
+ c ∙ SVF (Eq. 1)
where TPriutting,t+1 technical parameter rutting at time t+1 [inch] TPrutting,t technical parameter rutting at time t [inch] ESALs20 equivalent single axel loads for a design period of 20 years
(divided by 20,000,000 for modeling purposes) Aget+1 age of pavement construction at time t+1 SVF seasonal variation factor a, b, c model coefficients
TPIRI,t+1 = TPIRI,t + a ∙ Aget+1 + b ∙ ESALs2020000000
+ c ∙ SVF (Eq. 2)
where TPIRI,t+1 technical parameter IRI at time t+1 TPIRI,t technical parameter IRI at time t ESALs20 equivalent single axel loads for a design period of 20 years
(divided by 20,000,000 for modeling purposes) Aget+1 age of pavement construction at time t+1 SVF seasonal variation factor a, b, c model coefficients
Non-Linear Models
Non-linear model equations are used for calculating Highway Performance Monitoring System (HPMS) cracking, ADOT cracking, and faulting. ADOT cracking is calculated using structural cracking that covers

19
the full lane width, while HPMS cracking follows FHWA rules and is calculated by using the wheel paths only. HPMS cracking, ADOT cracking, and faulting are shown below in equations 3, 4, and 5, respectively.
TPHPMScrack,t+1 = TPHPMScrack,t ∙ max�1.002, �1 + a + b ∙ESALs20
20000000− c ∙ Aget+1��+ d ∙ SVF
(Eq. 3)
where TPHPMS_crack,t+1 technical parameter HPMS cracking at time t+1 [%] TPHPMS_crack,t technical parameter HPMS cracking at time t [%] ESALs20 equivalent single axel loads for a design period of 20 years
(divided by 20,000,000 for modeling purposes) Aget+1 age of pavement construction at time t+1 SVF seasonal variation factor a, b, c, d model coefficients
TPPMScrack,t+1 = TPPMScrack,t ∙ max�1.002, �1 + a + b ∙ESALs20
20000000− c ∙ Aget+1��+ d ∙ SVF
(Eq. 4)
where TPPMS_crack,t+1 technical parameter for ADOT cracking at time t+1 [%] TPPMS_crack,t technical parameter for ADOT cracking at time t [%] ESALs20 equivalent single axel loads for a design period of 20 years
(divided by 20,000,000 for modeling purposes) Aget+1 age of pavement construction at time t+1 SVF seasonal variation factor a, b, c, d model coefficients
TPHPMSFaulting ,t+1 = TPFaulting,t ∙ max �1.002, �1 + a + b ∙ ESALs2020000000
− c ∙ Aget+1�� + d ∙ SVF
(Eq. 5)
where TPFaulting,t+1 technical parameter faulting at time t+1 [inch] TPFaulting,t technical parameter faulting at time t [inch] ESALs20 equivalent single axel loads for a design period of 20 years
(divided by 20,000,000 for modeling purposes)

20
Aget+1 age of pavement construction at time t+1 SVF seasonal variation factor a, b, c, d model coefficients
Results
Each equation model was calculated using the 2017 and 2018 automated pavement condition data. The results are presented in both tabular and graphical format in the following sections. For each technical parameter, a statistical analysis was conducted to group pavement families with similar rates of deterioration into so-called performance groups. For each performance group, a regression analysis was conducted to determine the model parameters (a, b, and c) with the best fit. The coefficients were then used to plot the representative curves, showing deterioration of the variables starting at age zero.
Rutting
Using Equation 1 for rutting shown above, coefficients for the model parameters a, b, and c, were determined for each performance group. Table 6 shows the pavement families that fall within each performance group, the pavement type, and parameter coefficients. The coefficients were used to calculate the deterioration function for the variable rutting. Results are depicted in Figure 3 for each performance group.
Table 6. Model Coefficients for Deterministic Deterioration Function for Rutting
Performance Group
Pavement Type Pavement Families Model
Parameter a Model
Parameter b Model
Parameter c
A Asphalt 1111, 1121, 1131, 1151 0.0003 0.0014 0.004
B Asphalt 1112, 1122, 1132, 1142, 1152 0.0003 0.0014 0.004
C Asphalt 1141 0.0004 0.025 0
D, E Asphalt 1211, 1221, 1231, 1241, 1251, 121, 1222, 1232, 1242, 1252 0.0003 0.0009 0.0014
F Composite 2111, 2112, 2121, 2122, 2131, 2132, 2141, 2142, 2151, 2152 0.0006 0.0006 0
G Composite 2211, 2212, 2222, 2231, 2232, 2241, 2242, 2251, 2252 0.0006 0.005 0

21
Figure 3. Deterministic Deterioration Function for Rutting
International Roughness Index (IRI)
Using Equation 2 for IRI shown above, coefficients for model parameters a, b, and c, were determined for each performance group. Table 7 shows the pavement families that fall within each performance group, the pavement type, and parameter coefficients. The coefficients were used to calculate the deterioration function for the variable IRI. Results are depicted in Figure 4 for each performance group.
Table 7. Model Coefficients for Deterministic Deterioration Function for IRI
Performance Group
Pavement Type
Pavement Families Model
Parameter a Model
Parameter b Model
Parameter c
A Asphalt 1111, 1112, 1121, 1122, 1131, 1132, 1141, 1142, 1151, 1152 0.254 0 3.73
B Asphalt 1211, 1212, 1221, 1222, 1231, 1232, 1241, 1242, 1251, 1252 0.272 0 1.57
C Composite 2111, 2112, 2121, 2122, 2131, 2132, 2141, 2142, 2151, 2152 0 0.3 3.6
D Composite 2211, 2212, 2221, 2222, 2231, 2232, 2241, 2242, 2251, 2252 0 0.3 3.6
E Concrete 3111, 3112, 3211, 3212, 3121, 3122, 3131, 3132, 3141, 3142, 3151, 3152, 3221, 3222,
3231, 3232, 3241, 3242, 3251, 3252 0.061 2.35 2.77
0.000
0.100
0.200
0.300
0.400
0.500
0.600
0.700
0 2 4 6 8 10 12 14 16 18 20
AGE
Rutting (average) - ADOT
Rutting A Rutting B Rutting C Rutting D Rutting F Rutting G

22
Figure 4. Deterministic Deterioration Function for IRI
HPMS Cracking
Using Equation 3 for HPMS cracking shown above, coefficients for the model parameters a, b, c, and d were determined for each of the performance groups. Table 8 shows the pavement families that fall within each performance group, the pavement type, and parameter coefficients. The coefficients were used to calculate the deterioration function for the variable HPMS cracking. Results are depicted in Figure 5 for each performance group.
Table 8. Model Coefficients for Deterministic Deterioration Function for HPMS Cracking
Performance Group
Pavement Type Pavement Family Model
Parameter a Model
Parameter b Model
Parameter c Model
Parameter d
A, B Asphalt 1111, 1112, 1121, 1122, 1131, 1142, 1151, 1152 0.45 0.07 0.02 0.05
C Asphalt 1141 0.45 0.13 0.02 0.05
D, E Asphalt 1211, 1221, 1231, 1241, 1251 0.45 0.14 0.02 0.05
F Composite 2111, 2112, 2121, 2122, 2131, 2132, 2141, 2142, 2151, 2152 0.45 0.02 0.03 0.02
G Composite 2211, 2212, 2222, 2231, 2232, 2241, 2242, 2251, 2252 0.45 0.02 0.02 0.02
H Concrete
3111, 3112, 3211, 3212, 3121, 3122, 3131, 3132, 3141, 3142, 3151, 3152, 3221, 3222, 3231, 3232, 3241, 3242, 3251, 3252
0.45 0.04 0.02 0.04
0.0
50.0
100.0
150.0
200.0
250.0
300.0
0 2 4 6 8 10 12 14 16 18 20
IRI [
inch
/mi]
Age
IRI (average) - ADOT
IRI A IRI B IRI C IRI D IRI E

23
Figure 5. Deterministic Deterioration Function for HPMS Cracking
ADOT Cracking
Using Equation 4 for ADOT cracking shown above, coefficients for the model parameters a, b, c, and d were determined for each of the performance groups. Table 9 shows the pavement families that fall within each performance group, the pavement type, and parameter coefficients. The coefficients were used to calculate the deterioration function for the variable ADOT cracking. Results are depicted in Figure 6 for each performance group.
0.0
10.0
20.0
30.0
40.0
50.0
60.0
70.0
80.0
90.0
100.0
0 5 10 15 20 25 30
TP H
PMS
Crac
king
[%]
AGE
HPMS Cracking - ADOT
HPMS cracking A+B HPMS cracking C HPMS cracking D HPMS cracking E
HPMS cracking F HPMS cracking G PMS cracking H

24
Table 9. Model Coefficients for Deterministic Deterioration Function for ADOT Cracking
Performance Group
Pavement Type Pavement Family Model
Parameter a Model
Parameter b Model
Parameter c Model
Parameter d
A,B Asphalt 1111, 1112, 1121, 1122, 1131, 1142, 1151, 1152 0.4 0.07 0.02 0.05
C Asphalt 1141 0.4 0.13 0.02 0.05
D,E Asphalt 1211, 1221, 1231, 1241, 1251 0.4 0.14 0.02 0.05
F Composite 2111, 2112, 2121, 2122, 2131, 2132, 2141, 2142, 2151, 2152 0.4 0.02 0.03 0.02
G Composite 2211, 2212, 2222, 2231, 2232, 2241, 2242, 2251, 2252 0.4 0.02 0.02 0.02
H Concrete
3111, 3112, 3211, 3212, 3121, 3122, 3131, 3132, 3141, 3142, 3151, 3152, 3221, 3222, 3231, 3232, 3241, 3242, 3251, 3252
0.4 0.04 0.02 0.04
Figure 6. Deterministic Deterioration Function for ADOT Cracking
Faulting
Using Equation 5 for faulting shown above, coefficients for the model parameters a, b, c, and d were determined for the performance group. Table 10 shows the pavement families that fall within the
0.0
10.0
20.0
30.0
40.0
50.0
60.0
70.0
80.0
90.0
100.0
0 5 10 15 20 25 30
PMS
Crac
king
[%]
Age
PMS Cracking - ADOT
PMS cracking A+B PMS cracking C PMS cracking D PMS cracking E
PMS cracking F PMS cracking G PMS cracking H

25
performance group, the pavement type, and parameter coefficients. The coefficients were used to calculate the deterioration function for the variable faulting. Results are depicted in Figure 7.
Table 10. Model Coefficients for Deterministic Deterioration Function for Faulting
Performance Group
Pavement Type Pavement Family Model
Parameter a Model
Parameter b Model
Parameter c Model
Parameter d
H Concrete
3111, 3112, 3211, 3212, 3121, 3122, 3131, 3132, 3141, 3142, 3151, 3152, 3221, 3222, 3231, 3232, 3241, 3242, 3251, 3252
0.3 0.04 0.015 0.0003
Figure 7. Deterministic Deterioration Function for Faulting Model Validation
Model validation is a process to determine the accuracy of the statistical model for predicting future values of a variable of interest (technical parameters). Validation confirms that the output of the model is within an acceptable range of accuracy for its intended use (in this case, to estimate the value of pavement deterioration). To conduct model validation, the total dataset used for model development was split into 80 percent-20 percent, keeping 20 percent of the data for use in the validation process. For each technical parameter (i.e., IRI, rutting, HPMS cracking, ADOT cracking, and faulting), a model validation was performed by comparing the predicted values from the model to the actual deterioration values reported for measurement years 2017 and 2018. The performance of the model is measured by a statistic called coefficient of determination (R2), which for all tested parameters approached a value of 0.9. This indicates the strong ability of the model to explain and predict future values for these
0.0000
0.0200
0.0400
0.0600
0.0800
0.1000
0.1200
0.1400
0.1600
0.1800
0.2000
0 5 10 15 20 25 30
Faul
ting [
inch
]
Age
Faulting
Faulting H

26
parameters. Only one of the technical parameters, HPMS cracking, showed a low R2 value (0.598). It is anticipated that the model for HPMS cracking will be refined with time as more data are collected. The resulting model validation plots for each technical parameter for 2018 data are shown in Figures 8 through 12.
Figure 8. Model Validation Result for Rutting
Figure 9. Model Validation Result for IRI

27
Figure 10. Model Validation for HPMS Cracking
Figure 11. Model Validation Result for PMS Cracking
R² = 0.854
0
20
40
60
80
100
120
0 20 40 60 80 100 120
Mod
el d
ata
2018
Measurement data 2018
Model Validation for PMS Cracking

28
Figure 12. Model Validation for Faulting

29
THE ADOT PMS ANALYSIS This chapter details the ADOT PMS analysis function from start to finish. There are two parts in the ADOT PMS analysis: the project section analysis, which will inform ADOT’s network funding needs and programming, and the 1/10th mile analysis that will generate information to satisfy the MAP-21 pavement condition reporting requirements. ANALYSIS WORKFLOW
The analysis workflow starts with the ADOT PMS, fully loaded with the official network definition, and the related data tables populated with up-to-date data available in the ATIS and ADOT Highway databases. Figure 13 depicts the sequence of analytical steps, which are summarized in the succeeding paragraphs.
Figure 13. ADOT PMS Analysis Workflow GENERATE ANALYSIS SEGMENTS
The ADOT PMS data structure stores all relevant highway data from the source database tables (see the ADOT PMS Design chapter) using the same segmentation as the native data. The ADOT PMS analysis requires a set of segments that are homogeneous in nature and represent a logical construction of project segments. To achieve a homogeneous analysis segment, one should not mix different pavement types, significantly different pavement conditions, different functional classes, or and different districts in the same analysis segment. The risk of not using homogeneous segments may lead to potentially erroneous results. For example, functional class data are often consistent for the entire route, but condition data change every 1/10th of a mile. The segmentation to store both the functional class data and the condition data is

30
not advisable for a pavement management analysis because the segments would be either too long (as influenced by the functional class, i.e., entire route) or too short (as influenced by the condition segments, i.e., 1/10th of a mile). Thus, a homogeneous analysis segment would be impossible to achieve. Similarly, if the segments include different pavement types, like bituminous and concrete, the ADOT PMS may potentially make recommendations that would not fit either one of these pavement types. A set of rules, a stored procedure, and a series of ADOT PMS Workflow Objects were developed to execute the segmentation and populate those segments with data. The rules regarding the segmentation are summarized as follows:
• Committed project segments are used as is. A set of committed (programmed) ADOT projects are entered in the ADOT PMS, and these segments and treatments are used in the ADOT PMS analysis segmentation first (regardless of any other rules).
• Where no committed project segments exist, the ADOT project segments, which cover most of the mainline routes, are then used as is.
• Where no project sections exist, historical project sections are used. • Where no historical project sections exist, homogeneous segments are generated using a
minimum length of 5 miles and the following attributes to define homogeneity: o District number o Pavement type o Functional class o Last treatment and last year o ESAL category (very high, high, moderate, low, very low) o Condition category (good, fair, poor)
The analysis segments that result from the process just described are referred to as the project length segments. They are suitable for analyzing funding needs, and for preservation and rehabilitation prioritization. An analysis attribute called Lane is set within the ADOT PMS to indicate that these segments are for the project length segment analysis. Once the flag is set, the stored procedure goes on to generate the 1/10th mile segments for the MAP-21 condition projections only. The segments are then populated with data from the respective source tables using several dTIMS table transformation objects, all controlled through a dTIMS workflow object. Once completed, the analysis begins. REVIEW THE PERFORMANCE PREDICTION MODELS
It is good practice to review the performance prediction models and the underlying analysis variables prior to executing ADOT PMS analysis.

31
Analysis Variables
Analysis variables are the building blocks of the dTIMS Business Analytics, which serve as the foundation of the ADOT PMS LCCA discussed in the ADOT PMS Design chapter. Analysis variables can be calculated at different points: every year (annual), when treatments are done (dynamic), or at the very end of the strategy generation process to summarize the strategy (compilation).
• Annual analysis variables are calculated yearly and are used to keep track of items that change every year, such as condition variables and traffic values. They are set to an initial value at the start of the strategy generation process, either through values stored in the analysis segmentation or from a calculated expression, and then a series of models are used to determine how the values change year over year. There is no practical limit to the number of models used to calculate or predict the future values of an analysis variable.
• Dynamic analysis variables are set at the start of the strategy generation process and then
changed only when a treatment is triggered that influences the variable. For example, consider the pavement type that may start out as jointed concrete pavement but changes to a composite pavement once an overlay is triggered. In this case, a pavement type variable would start out as jointed concrete but would be reset to composite when the treatment is triggered in the analysis.
• Compilation analysis variables are calculated only at the end of the treatment strategy and are
used to summarize the strategy. Typically, these variables are used to calculate the present value cost and the present value benefit of the strategy, both of which are used in the optimization process.
Table 11 lists the PMS analysis variables by type.

32
Table 11. ADOT PMS Analysis Variables
dTIMS Analysis Variable Name Description Type bDAV_Preservation_Allowed Are preservation treatments allowed on the segment? Initialized based on
segment condition and rehabilitation history Dynamic
nAAV_AGE_ADOT_Cracking Age of the ADOT Cracking Index Annual nAAV_AGE_Faulting Age of the Faulting Index Annual nAAV_AGE_HPMS_cracking Age of the HPMS Cracking Index Annual nAAV_AGE_Roughness Age of the Roughness Index Annual nAAV_AGE_Rutting Age of the Rutting Index Annual nAAV_CND_ADOT_Cracking ADOT Cracking Index (PMS Cracking) Annual nAAV_CND_Faulting Faulting Condition (inches) Annual nAAV_CND_HPMS_Cracking HPMS Cracking Index Annual nAAV_CND_MAP21 MAP-21 Condition Category (good/fair/poor) Annual nAAV_CND_MAP21_CRK MAP-21 Cracking Category (good/fair/poor) Annual nAAV_CND_MAP21_FLT MAP-21 Faulting Category (good/fair/poor) Annual nAAV_CND_MAP21_IRI MAP-21 IRI Category (good/fair/poor) Annual nAAV_CND_MAP21_RUT MAP-21 Rut Category (good/fair/poor) Annual nAAV_CND_MAP21_SCORE Map-21 Score 25 for poor, 50 for fair, 75 for good Annual nAAV_CND_OCI Overall Condition Index Annual nAAV_CND_Roughness Roughness Condition (IRI) Annual nAAV_CND_Rutting Rutting Condition (inches) Annual nAAV_CST_Yearly_Cost Annual Treatment Cost Variable Annual nAAV_RISK Risk Analysis-Risk Factor Annual nAAV_RISK_COF Risk Analysis-Consequence of Failure Annual nAAV_RISK_POF Risk Analysis-Probability of Failure Annual nAAV_TRF_AADT Traffic AADT Annual nAAV_TRT_LIFE_CRACK_YEARS Years to return to previous condition for the cracking variable Annual nAAV_TRT_LIFE_CRACK_ZERO Treatment Life variable to hold cracking condition at 0 Annual nAAV_TRT_LIFE_RUT_YEARS Years to return to previous condition for the rutting variable Annual nAAV_TRT_LIFE_RUT_ZERO Treatment Life variable to hold rutting condition at 0 Annual nDAV_Foundation_Issues Foundation Issues classification for the pavement family Dynamic nDAV_Pavement_Family Pavement Family for Performance Prediction Dynamic nDAV_Pavement_Type Pavement Type for the pavement family Dynamic nDAV_Percent_Poor Maximum Percent Poor of the segment Dynamic nDAV_Rehab_Count Rehabilitation Treatment Count Dynamic nDAV_TRT_LIFE_ADOT_CRACKING_SLOPE Treatment Slope-ADOT Cracking Dynamic nDAV_TRT_LIFE_HPMS_CRACKING_SLOPE Treatment Slope-HPMS Cracking Dynamic nDAV_TRT_LIFE_RUT_SLOPE Treatment Slope-Rutting Dynamic nPV_Benefit Present Value Benefit of the Strategy Compilation nPV_Cost Present Value Cost of the Strategy Compilation
The performance prediction models for the condition variables of rutting, IRI, HPMS cracking, ADOT cracking, and faulting discussed in the ADOT PMS Design chapter may be updated (by ADOT), if needed, at any time. Similarly, the Risk and OCI variables may also be reviewed and updated periodically. Overall Condition Index Analysis Variable
A performance measure called Overall Condition Index was created by the project team to represent the overall condition of the pavement asset and incorporates the NPMs and the Risk Score for each pavement analysis segment.

33
The OCI is currently calculated as a percentage of rutting, IRI, cracking, faulting, and the risk score, as follows:
IF(nDAV_Pavement_Type <> 'JPCP' and nDAV_Pavement_Type <> 'CRCP', nAAV_CND_ADOT_Cracking / 4.0 * 0.4 + MIN(nAAV_CND_Roughness,200.0) / 8.0 * 0.25 + MIN(nAAV_CND_Rutting,1.0) * 25.0 * 0.1 + nAAV_RISK * 0.25 , nAAV_CND_HPMS_Cracking / 4.0 * 0.25 + MIN(nAAV_CND_Roughness,200.0) / 8.0 * 0.25 + MIN(nAAV_CND_Faulting,1.0) * 25.0 * 0.25 + nAAV_RISK * 0.25 ) (Eq. 6) Where nDAV_Pavement_Type is an analysis variable representing pavement type nAAV_CND_ADOT_Cracking is an analysis variable representing cracking condition nAAV_CND_Roughness is an analysis variable representing IRI nAAV_CND_Rutting is an analysis variable representing ADOT cracking nAAV_CND_HPMS_Cracking is an analysis variable representing HPMS cracking nAAV_CND_Faulting is an analysis variable representing faulting nAAV_RISK is an analysis variable representing the risk score
Simply put, the OCI equation takes 25 percent of the component, which is normalized to a value from 0 to 25. The OCI is used as the measure of benefits (i.e., benefit model) within the ADOT PMS LCCA and is maximized during the budget scenario optimization process discussed in the next chapter. When the ADOT PMS is calculating the benefit of a project, it compares the OCI before the treatment to the OCI after the treatment. It then uses the calculated difference as a measure of benefit to derive the benefit/cost ratio and the incremental benefit/cost ratio for optimizing strategies at a given funding level. Risk Analysis Variables
A risk table was included within the ADOT PMS database storing locations in the network with assigned risks that could affect the transportation network. The risk table includes a likelihood of failure rating (1 to 5, with 5 being high probability) as well as a consequence of failure rating (1 to 5, with 5 being high consequence) which, when multiplied together, gives a risk score (1 to 25, with 25 being extreme risk). During the PMS analysis, the risk variables are not predicted; they remain constant, and do not change. Only when a treatment is performed that mitigates the risk will the risk score change. The risks applied to the pavement network and those risks reset by treatments are outlined in Table 12.

34
Table 12. Risk Reset by ADOT PMS Reconstruction Treatment
Identified Risk Reset by ADOT PMS Reconstruction Treatment Earth Cracking No Embankment Failure/Rockfall No Expansive/Collapsing Soils Yes Fault No Flooding No Landslide No Landslide/Embankment Failure No Low Water Crossings No Slip/Fault and Erosion No Slope Instability No Soil Pumping No Unstable Subgrade Yes Unstable Subgrade and Wash Out Yes
REVIEW TREATMENTS
Treatments are used to correct the deterioration of an asset or to prolong its life. They form the basis of identifying alternative strategies (composed of one or more treatments) over the analysis period generated by ADOT PMS. To build alternative strategies, the configuration requires that a treatment is defined by how it is triggered, how much the treatment will cost, what budget category the treatment comes out of, what variables are affected by the treatment, and finally, what next treatments are most likely following the current treatment. Another important property for each treatment is the treatment interval, which indicates to the ADOT PMS how long after applying the treatment the ADOT PMS waits before checking for subsequent treatments. The treatments configured for the ADOT PMS are found in Table 13.

35
Table 13. ADOT PMS Treatments
Name Description Budget Category CPR Concrete Pavement Repair Preservation CRACKSEAL Crack Seal Preservation CRACKSEAL_AND_CHIPSEAL Crack Seal and Chip Seal Preservation DIAMOND_GRIND Diamond Grinding of Concrete Pavement Preservation FOG_COAT Fog Coat Preservation MAJOR_REHAB_OR_RECONSTRUCTION Major Rehab or Reconstruction Major_Projects MILL_FR_AND_MICRO_CAPE_SEAL Mill FR and Micro Cape Seal Preservation MS_1_PASS 1 Pass Micro Surface Preservation MS_2_PASS 2 Pass Micro Surface Preservation RECONSTRUCTION Reconstruction for Worst First Analysis only Reconstruction RR_0p5INCH_FR Remove and Replace 0.5-inch plus FR Preservation RR_1INCH_FR Remove and Replace 1-inch plus FR Preservation RR_2INCH_AC_FR Remove and Replace 2-inch AC + FR Major_Projects RR_2p5INCH_AC_FR Remove and Replace 2.5-inch AC + FR Major_Projects RR_3INCH_AC_FR Remove and Replace 3-inch AC + FR Major_Projects RR_4INCH_AC_FR Remove and Replace 4-inch AC + FR Major_Projects RR_5INCH_AC_FR Remove and Replace 5-inch AC + FR Major_Projects SR_3INCH_AC_MS Spot Repair 3-inch AC with Micro Surfacing Major_Projects
Treatment Decision Trees
ADOT has designed a decision tree to determine which preservation, rehabilitation, or reconstruction treatments apply to the pavement network. The decision tree is shown in Figure 14. The ADOT PMS uses Boolean expressions to trigger treatments during the analysis. Each treatment is assigned one Boolean treatment trigger expression. A Boolean treatment trigger expression could have multiple parts, depending on how many times that treatment appears in the decision tree. Each part of the expression corresponds to one of the branches in the decision tree that ends with that treatment. The decision tree and the treatment trigger expressions are to be reviewed for any necessary changes or enhancements prior to conducting the analysis.

36
Figure 14. ADOT Decision Tree

37
Treatment Costs
Each treatment has a cost associated with it that includes all costs to complete the treatment. ADOT’s set of costs are stored in the ADOT PMS as a lookup table called SYS_LOOKUP_TREATMENT_COST. Each treatment has a cost expression associated with it that looks up the lane mile unit cost in the lookup table, and then calculates the cost of the work based upon the length of the analysis section and the number of lanes. Treatment costs are inflated each year by an inflation factor, currently set in the analysis to a value of 1 percent. The current treatment lane mile unit rates are summarized in Table 14.
Table 14. Treatment Unit Costs
Treatment Name Treatment Cost (per Lane Mile)
CPR $5,000 CRAACKSEAL $8,000 CRACKSEAL_AND_CHIPSEAL $44,000 DIAMOND_GRIND $104,000 FOG_COAT $6,000 MILL_FR_AND_MICRO_CAPE_SEAL $100,000 MS_1_PASS $60,000 MS_2_PASS $70,000 RECONSTRUCTION $1,111,000 RR_0p5INCH_FR $125,000 RR_1INCH_FR $173,000 RR_2.5INCH_AC_FR $302,000 RR_2INCH_AC_FR $270,000 RR_3INCH_AC_FR $336,000 RR_4INCH_AC_FR $404,000 RR_5INCH_AC_FR $404,000 SR_3INCH_AC_MS $80,000
Treatment Resets
When a treatment is triggered in the ADOT PMS Analysis, the treatment resets the analysis variables to account for either improvements to the pavement condition or a change in the rate of deterioration of the pavement. Table 15 outlines the resets for each treatment on each of the primary distress variables.

38
Table 15. Treatment Resets
Treatment Roughness Rutting Cracking Faulting
CRACKSEAL N/A N/A
Reset to new and held constant for the next two years, then deteriorates back to previous predicted value during the next two years N/A
CRACKSEAL_AND_ CHIPSEAL
Increase 10% and then deteriorates as normal N/A
Reset to new and held constant for the next two years, then deteriorates back to previous predicted value during the next four years N/A
MILL_FR_AND_MICRO_ CAPE_SEAL N/A
Reset to new and held constant for the next one year, then deteriorates back to pre-existing condition during the next two years
Reset to new and held constant for the next three years, then deteriorates back to previous predicted value during the next five years N/A
MS_1_PASS N/A N/A
Reset to new and held constant for two years, then deteriorates back to previous predicted value during the next four years N/A
MS_2_PASS N/A
Reset to new, held constant for one year, then deteriorates back to pre-existing condition during the next two years
Reset to new and held constant for two years, then deteriorates back to previous predicted value during the next five years N/A
RECONSTRUCTION Reset to new Reset to new Reset to new Reset to new
RR_0.5INCH_FR
60% of existing and then deteriorates as normal
Reset to new, held constant for five years, then deteriorates back to pre-existing condition during the next five years
Reset to new and held constant for five years, then deteriorates back to previous predicted value during the next five years N/A
RR_2.5INCH_AC_FR Reset to new Reset to new Reset to new Reset to new
RR_3INCH_AC_FR Reset to new Reset to new Reset to new Reset to new
RR_4INCH_AC_FR Reset to new Reset to new Reset to new Reset to new
RR_5INCH_AC_FR Reset to new Reset to new Reset to new Reset to new
SR_3INCH_AC_MS Reset to new Reset to new Reset to new Reset to new
For each treatment, the expressions and logic in Table 15 reset the analysis variables as desired. The parameters that control the two periods affecting the treatment life, one being the number of years to wait at zero and the other being the number of years until the distress returns to the pre-treatment condition, are stored in the ADOT PMS lookup table called: SYS_LOOKUP_TREATMENT_COSTS and are summarized in Table 16. Treatments such as crack seal and chip seal, which increase the IRI, are handled though reset expressions.

39
Table 16. Treatment Life Resets in Lookup Table
Treatment
Years to Return to Pre-
Treatment Cracking
Years Cracking Remains at Zero
Years to Return to Pre-
Treatment Rutting
Years Rutting
Remains at Zero
CRACKSEAL_AND_CHIPSEAL 4 2 NULL NULL MILL_FR_AND_MICRO_CAPE_SEAL 5 3 2 1 MS_1_PASS 4 2 NULL NULL MS_2_PASS 5 2 2 1 RECONSTRUCTION NULL NULL NULL NULL RR_0p5INCH_FR 5 5 5 5 RR_2.5INCH_AC_FR NULL NULL NULL NULL RR_3INCH_AC_FR NULL NULL NULL NULL RR_4INCH_AC_FR NULL NULL NULL NULL RR_5INCH_AC_FR NULL NULL NULL NULL SR_3INCH_AC_MS NULL NULL NULL NULL Figure 15 illustrates the ADOT reset methodology when treatments increase the condition of the pavement and then deteriorate back to previously predicted values.
Figure 15. Treatment Life Reset Methodology
(Image provided by ADOT)

40
Review Economic Parameters
The analysis set object that controls the LCCA in the ADOT PMS includes the following: time periods of the analysis, discount rate, and inflation rate. These variables are to be reviewed and updated as necessary before conducting an analysis. One analysis set called LCC_NETWORK has been configured in the ADOT PMS as the project segment length analysis and is summarized in Table 17.
Table 17. LCCA_NETWORK Analysis Set Properties
Parameter Description Value Display Name Display name for analysis set LCC_NETWORK Name Name of analysis set LCC_NETWORK Description Description LCC Network Analysis Inventory Table Asset table being analyzed PMS_ANALYSIS Condition Variable Condition variable for default graphs nAAV_CND_Roughness Discount Rate Discount rate for present value 3 Start Year Starting year 2018 End Year End year for benefit calculation 2045 End Performance Plot Year End year for graphs 2039 End Treatment Application Year End year for treatments 2039 Generate Committed Only Generate committed strategies only? false Inflation Rate Rate for inflating treatment costs 1 Overwrite Overwrite all strategies? true Strategy Table Internal result table ZLCC_NETWORK Filter Target filter for assets to analyze abfOBJ_Analysis_Test Traffic Variable Traffic variable for default graphs nAAV_TRF_AADT Use Advanced Use advanced years? false
Review Budgets
Each desired alternative investment scenario is created as a budget scenario in the ADOT PMS. Budget scenarios dictate the levels of investment specified by treatment category (preservation, major projects, or reconstruction). Table 18 shows the budget scenarios that have been created in the ADOT PMS. Notice that some budget scenarios apply to the entire network, while others apply to specific systems. Additional scenarios may be defined by ADOT.

41
Table 18. Budget Scenarios
Budget Scenario Description
LCC_INTERSTATE_BASE LCC Interstate Base Funding
LCC_INTERSTATE_DNT LCC Interstate-Do Nothing
LCC_INTERSTATE_TARGET LCC Interstate-Target
LCC_INTERSTATE_UNLIMITED LCC Interstate-Unlimited
LCC_NETWORK_BASE LCC Network Base Budget
LCC_NETWORK_BASE_MINUS_25 LCC Network Base Minus 25
LCC_NETWORK_BASE_PLUS_25 LCC Network Base Plus 25
LCC_NETWORK_BASE_PRES_HEAVY LCC Network Base Budget-Preservation Heavy
LCC_NETWORK_BASE_RECON_HEAVY LCC Network Base Budget-Reconstruction Heavy-worst first
LCC_NETWORK_DNT LCC Network-Do Nothing
LCC_NETWORK_MAP_21 LCC Network MAP 21 Budget to use to set 1/10th mile strategies
LCC_NETWORK_TARGET LCC Network Target
LCC_NETWORK_UNLIMITED LCC Network Unlimited
LCC_NHS_NON_INT_ADOT_BASE LCC NHS Non-Interstate ADOT-owned Base Funding
LCC_NHS_NON_INT_ADOT_DNT LCC NHS Non-Interstate ADOT-owned Do Nothing
LCC_NHS_NON_INT_ADOT_TARGET LCC NHS Non-Interstate ADOT-owned Target
LCC_NHS_NON_INT_ADOT_UNLIMITED LCC NHS Non-Interstate ADOT-owned Unlimited
LCC_NHS_NON_INT_LOCAL_BASE LCC NHS Non-Interstate Local-owned Base Budget
LCC_NHS_NON_INT_LOCAL_DNT LCC NHS Non-Interstate Local-owned Do Nothing
LCC_NHS_NON_INT_LOCAL_TARGET LCC NHS Non-Interstate Local-owned Target
LCC_NHS_NON_INT_LOCAL_UNLIMITED LCC NHS Non-Interstate Local-owned Unlimited
Execute ‘Generate Strategies’
The ADOT PMS analysis is comprised of two processes: the first process generates the alternative treatment strategies and the second process optimizes those strategies to maximize benefit for the network using the budget scenarios configured for the analysis set.

42
The first process generates alternative strategies of feasible preservation, rehabilitation, and reconstruction for each project length segment. Depending on the condition of the project length segment, some elements may receive many strategies while others will only receive a few strategies. The process involves a complex algorithm explained using this sequence of steps:
• For each project length segment analysis: o All analysis variables are initialized at their starting values and predicted for the length
of the user-defined analysis period. They are saved as the Do Nothing strategy and written to the database. There are no benefits and costs with this strategy as it is the Do Nothing strategy.
o ADOT PMS then evaluates every treatment for every year of the analysis period and builds a matrix of treatments and years for which they can be applied. For every treatment that can be applied in each year, the ADOT PMS does the following: Applies the treatment in the year it is triggered, calculating all costs associated
with the treatment and then resets and predicts all analysis variables through the end of the analysis period. The strategy is then written to the ADOT PMS database as a level one strategy with one treatment only.
• ADOT PMS then builds another matrix of treatments that can apply to the element after the level one strategy with one treatment that was generated. For every treatment that is applied, ADOT PMS does the following:
o Applies the treatment in the year it is triggered, calculating all costs and resetting all analysis variables, and predicting them until the end of the analysis period. The strategy is then written to the database as a level two strategy with two treatments. ADOT PMS then builds another matrix of treatments
that can apply to the element following the second treatment based on the subsequent treatments of the second treatment. This process results in strategies with three treatments, and then the process repeats and continues until strategies are completed with four treatments, five treatments, etc.
When all third-level treatment strategies are generated, dTIMS returns to the second-level matrix.
When all second-level treatment strategies are generated, dTIMS returns to the first-level matrix.
o When all the first-level treatment strategies are generated, dTIMS completes the current project length section and moves onto the next project length section.
Depending on the number of treatments that can be applied to the project length segments and the number of overlapping treatments that could be applied under similar conditions, the number of

43
generated strategies can grow quite large. Table 19 shows an example of the statistics generated after performing an analysis.
Table 19. Analysis Statistics
Item Count
Project length segments in master table 2,382
Total number of strategies generated 1,924,892
Total number of treatments 5,342,499
Minimum Strategies for one segment 2
Maximum Strategies for one segment 10,216
Average Strategies per segment 1,695
Total number of variable records 1,890,204,664
Execute ‘Optimization’
In the optimization process, strategies that maximize benefits given the budgetary constraints are selected. An Incremental Benefit Cost Optimization (Shahin et al. 1985) technique is used. Strategies are selected based on the best benefit/cost ratio and then based upon the increase in the benefit/cost ratio from one strategy to the next. This process continues if funds are available. Consider Figure 16, which depicts the strategies (red triangles and blue squares) for one individual project length segment.
Figure 16. Optimization Example
3.31
2.25
4.5
6.25
5.084.76
4.5
6.8
00
1
2
3
4
5
6
7
8
$0.00 $2.00 $4.00 $6.00 $8.00 $10.00 $12.00
Pres
ent V
alue
Ben
efit
Present Value Cost
Optimization

44
The triangle strategies are more efficient for this project length segment than are the square strategies. The triangle strategies return the highest benefits relative to the cost and are the logical choice. For example, compare strategy with benefits =3 (triangle) to strategy with benefits = 2.25 (square). The triangle strategy will be selected over the square strategy because it gives a greater benefit at a lower cost. During optimization, the ADOT PMS would first pick the strategy with benefits of 3 (highest benefit/least cost) in the example above, and if funds are available, it would jump to the strategy with benefits of 4.5, then to 6.0, and then to 6.8. It would not consider any of the other square strategies. The only way it would ever pick a square strategy would be when funds are insufficient for the triangle strategies. One should consider that the strategies represent different treatments in different years. It is possible that funds may not be available in the years the triangle strategies represent but are available in the years the square strategies represent. In this case, one of the square strategies may be selected as they are all better than doing nothing (triangle strategy), which has 0 benefit and 0 cost. When dTIMS is optimizing the strategies, it uses mathematical programming based on the benefits and costs and includes all the strategies generated from the first step. There may be hundreds of thousands of strategies considered in the optimization process, and ADOT PMS uses a multi-pass optimization to ensure that the available budget is expended. When the optimization is complete, there is one selected strategy for each project length segment and this set of selected strategies can be examined to see the overall results of the budget scenario optimizations. Budgets Finalized–Reviewing the Results
Several reports can be generated from the ADOT PMS that record the results of the analysis for one budget scenario or multiple budget scenarios for a given analysis period. These reports include:
• Budget Chart – shows program costs, treatment costs, and condition distribution for a selected budget scenario
• Budget Comparison Chart – Compares the resulting average condition for any of the analysis variables
• Construction Program Report – Lists the recommended construction program for a selected budget scenario
• Review and Adjust Report – shows each project length segment to show all generated alternative strategies, the selected strategy for a budget scenario, along with all treatments and predicted analysis variables
These reports may be used to view the results of the analysis for any selected alternative investment scenario. Users can continue to adjust the investment scenarios until performance targets are reached and the budgets are finalized.

45
Execute MAP-21 Analysis
Once the project segment length analysis is complete, the MAP-21 analysis on the 1/10th mile segments can be executed. The LCC_NETWORK analysis and all budget scenarios have been configured to work on the project length segments (lane 1). When the project length analysis is completed, the budget scenario called LCC_NETWORK_MAP_21 is used to commit the analysis results from the project length segments onto the 1/10th mile segments. For example, if the selected strategy is a Reconstruction for a project length segment on a route from 3 miles to 11 miles, every 1/10th mile segment on that route between 3 miles and 11 miles would have Reconstruction as the committed treatment at the 1/10th mile level. All treatments are committed with a zero cost, because all budgeting is done at the project segment length analysis level. A dTIMS workflow object called 36_Commit_Tenth_Mile is used to commit the project length segment results onto the 1/10th mile segments. When both the MAP_21_TENTH_MILE analysis set and the MAP_21_TENTH_MILE budget scenario are executed, the ADOT PMS analyzes the 1/10th mile segments based on the commitments from the project length analysis. Only the committed treatments during the 1/10th mile analysis are generated; it does not generate alternative strategies. When the analysis is complete, a custom report called MAP_21_TENTH_MILE can be generated to show the projected 1/10th mile segment condition distribution. Review MAP-21 Results
After conducting a MAP-21 analysis, the ADOT PMS generates reports similar to those for a budget scenario analysis described in the preceding step called Budget Finalized. These reports are used to review the MAP-21 analysis results together with the MAP-21 custom reports described in the Custom Reports chapter. Report Results
When the analysis has been completed, reports can be generated for ADOT stakeholders. Both the custom reports discussed in the Custom Reports chapter and the reports generated from the ADOT PMS may be used to communicate funding needs, condition projections, and recommended pavement investment strategies.

46

47
CUSTOM REPORTS Custom reports support pavement management and pavement design initiatives within ADOT. They have fixed formats, and data fields were decided upon by ADOT staff. These reports allow ADOT staff to easily retrieve data stored in the ADOT PMS. Each of the custom reports developed during the project are described in this chapter. Reports for pavement management pull data from the ADOT PMS database and from the ADOT PMS analysis results. Reports for pavement design pull data from the ADOT PMS database and do not use any analysis results. The following reports were created specifically for pavement management:
• Budget Analysis Report: Condition Distribution • Budget Analysis Report: Expenditure Report • Budget Analysis Report: Strategy Export • Pavement Project Report
The following reports were created specifically for pavement design:
• PECOS Maintenance History Report • Pavement History Report • Traffic Report • PAVEME Comparison Report • PAVEME Multiple Comparison Report • Pavement Condition Aggregate Report • Pavement Condition Detail Report • ESAL Calculation Report • SODA Report
The custom reports were produced within Microsoft SQL Server Reporting Services (SSRS) and were designed using Microsoft’s Report Designer 3 software. The reports are accessed on-line through an SSRS server in the ADOT production environment. The reports can be downloaded by any ADOT PMS user and opened with the Report Designer 3 software to verify calculations, adjust formatting, and perform general maintenance. Some reports must be updated annually to account for new data that are added to the ADOT PMS. Yearly updates include modifying the report queries for new tables added to the system.
CUSTOM REPORT: BUDGET ANALYSIS REPORT–CONDITION DISTRIBUTION LANE MILES
The Condition Distribution Lane Miles report provides good, fair, and poor lane mile distribution from the ADOT PMS analysis. The good, fair, and poor categorization is based upon FHWA rules established

48
under MAP-21 using rutting, IRI, HPMS cracking, and faulting. The ADOT PMS uses the following tiers for reporting the condition distribution:
• Entire Network • Interstate Only • NHS–Non-Interstate (ADOT Owned) • NHS–Non-Interstate (Local) • Non-NHS High Volume • Non-NHS Low Volume
To run this report, the user must select a Budget Scenario from the report parameter drop-down list. The generated report can be exported in several formats such as Excel and PDF. There is no yearly maintenance requirement for this report. CUSTOM REPORT: BUDGET ANALYSIS REPORT–EXPENDITURE REPORT
The Expenditure Report shows the program costs for each system tier and each funding category for a selected ADOT PMS budget scenario. The report returns the yearly expenditure for each system tier summarized by the budget categories of Preservation, Rehabilitation, and Reconstruction. The ADOT PMS uses the following tiers for reporting:
• Entire Network • Interstate Only • NHS–Non-Interstate (ADOT Owned) • NHS–Non-Interstate (Local) • Non-NHS High Volume • Non-NHS Low Volume
To run this report, the user must select a Budget Scenario from the report parameter drop-down list. The generated report can be exported in several formats such as Excel and PDF. There is no yearly maintenance requirement for this report. CUSTOM REPORT: BUDGET ANALYSIS REPORT–STRATEGY EXPORT
The Strategy Export is a detailed export of the selected strategies for a user-selected budget scenario. To run this report, the user selects an ADOT PMS budget scenario. The generated report shows all recommended projects for the selected budget scenario. The report is not formatted for printing, but for export only. There is no yearly maintenance requirement for this report. CUSTOM REPORT: PAVEMENT PROJECT REPORT
The Pavement Project report presents details and cost estimates for planned pavement projects including inventory data, condition data, cost estimates, and historic project information. The user

49
selects a pavement project from a list of projects, and the report is displayed. There is no yearly maintenance requirement for this report. CUSTOM REPORT: PECOS MAINTENANCE REPORT
The Performance Controlled System Maintenance Report allows the user to report on maintenance activities for selected route and milepost locations. The user supplies the following:
• Highway Name • Highway Direction • From MP (starting mile post) • To MP (ending mile post)
The report shows all PECOS activities that have occurred on the requested route, including the location of the activity, the activity performed, the cost of the activity, and the date on which the activity was recorded. PECOS does not track costs by direction, so reported costs could be for one direction or for both directions. There is no yearly maintenance requirement for this report. CUSTOM REPORT: PAVEMENT HISTORY REPORT
The Pavement History Report allows the user to report on past pavement projects for selected routes. The report shows project history by lane and incudes project description information as well as the type and thickness of the layers included in the pavement project. The user supplies the following:
• Highway Name • Highway Direction • From MP (starting mile post) • To MP (ending mile post)
The report shows pavement projects that took place along the route entered by the user. There is no yearly maintenance requirement for this report. CUSTOM REPORT: TRAFFIC HISTORY REPORT
The Traffic History Report reports total traffic, truck traffic, and growth rates for a selected route and milepost locations. Up to three years of data can be displayed on the report. The user supplies the following:
• Highway Name • Highway Direction • From MP (starting mile post) • To MP (ending mile post) • Latest year of data required

50
There is no yearly maintenance requirement for this report. CUSTOM REPORT: PAVEME COMPARISON REPORT
The PAVEME Comparison Report is a multi-page and multi-section report detailing pavement design data for selected pavement design projects. The report includes a page of project details, a graph that compares actual versus predicted performance, and many pages showing distress predictions in tabular form. To run the report, the user selects the pavement design project from a list of projects. This report must be updated annually to include new condition data. CUSTOM REPORT: PAVEME MULTIPLE PROJECT COMPARISON REPORT
The PAVEME Multiple Project Comparison Report is a multi-page and multi-section report comparing predicted performance against actual performance for various pavement projects. To run the report, the user selects the type of project and then filters for specific projects. There is no yearly maintenance requirement for this report. CUSTOM REPORT: PAVEMENT CONDITION SUMMARY REPORT
The Pavement Condition Summary report provides detailed pavement condition data for up to four years and up to three selected pavement distresses both for on-system and off-system routes. The user selects the following data fields:
• ATIS Route ID • From MP (starting mile post) or From Measure for local routes • To MP (ending mile post) or To Measure for local routes • Pavement type • Distress types • Latest condition report year
This report must be updated annually to include new condition data. CUSTOM REPORT: PAVEMENT CONDITION DETAIL REPORT
The Pavement Condition Detail Report provides detailed pavement condition data for one year for a selected route and location. The user enters the following information:
• ATIS Route ID • From MP (starting mile post) or From Measure for local routes • To MP (ending mile post) or To Measure for local routes • Desired year
The report is a large table that shows all data fields reported by the data collection vendor. It is not formatted for printing, but for export only. This report must be updated annually to include new condition data.

51
CUSTOM REPORT: ESAL CALCULATION REPORT
The ESAL Calculation Report allows users to calculate equivalent single axel loads using the traffic and pavement design data for a given project location. The user enters the following parameters:
• Highway Name, Direction, From (Starting) Mile Post, To (Ending) Mile Post • Tracs Number, Project Number, Project Name, Pavement Type • Design Life, Directional Distribution Factor, Lane Distribution Factor, Functional Class • Year of Traffic, Average Annual Daily Traffic (AADT), Single Trucks, Combo Trucks, Build Year,
Truck Cluster Number, Traffic Growth Rate The report uses the input values to calculate the distribution of traffic volume and ESALs across 13 vehicle classes and calculates the total design ESALs for the project. There is no yearly maintenance requirement for this report. CUSTOM REPORT: SODA REPORT
The Structural Overlay Design for Arizona report calculates overlay thicknesses based on entered or calculated ESAL data and collected FWD data. The user enters the following information:
• Highway Name • Direction • From MP (starting mile post) • To MP (ending mile post) • ESALs • Directional Distribution Factor • Lane Distribution Factors • Build Year • Design Life • Depth of Milling
The report returns the calculated overlay thickness for each FWD location within the route boundaries entered by the user. There is no yearly maintenance requirement for this report.

52

53
REFERENCES Anderson, Thor. 2019. Transportation Asset Management Plan. Phoenix: Arizona Department of Transportation. Accessed on November 3, 2020: https://azdot.gov/sites/default/files/2019/08/Transportation-Asset-Management-Plan.pdf Shahin, M.Y., S.D. Kohn, R.L. Lytton, and W.F. McFarland. 1985. Pavement M&R Budget Optimization Using the Incremental Benefit-Cost Technique, Proceedings, 1st North American Pavement Management Conference, 18–21 March, 1985, Toronto, Ontario. Way, George B. and John Eisenberg. 1980. Verification of Performance Prediction Models and Development of Data Base Phase II Arizona Pavement Management System. FHWA/AZ-80/169. Phoenix: Arizona Department of Transportation. Zaghloul, Sameh, Khaled Helali, and Wael Bekheet. 2006. Development and Implementation of Arizona Department of Transportation ADOT Pavement Management System. FHWA/AZ-06-494. Phoenix: Arizona Department of Transportation.