a handbook for rapid appraisal of fisheries management systems
TRANSCRIPT

A Handbook for Rapid Appraisalof Fisheries Management Systems
(Version 1)
Michael D. PidoRobert S. Pomeroy
Melvin B. CarlosLen R. Garces
1996
INTERNATIONAL CENTER FOR LIVING AQUATIC RESOURCES MANAGEMENTMANILA, PHILIPPINES

A Handbook for Rapid Appraisalof Fisheries Management Systems(Version 1)
MD. PIDO
R.S. POMEROY
M.B. CARLOS
L.R. GARCES
1996
Printed in Manila, Philippines
Published by the International Center of Living Aquatic ResourcesManagement, MCPO Box 2631, 0718 Makati City, Philippines
Pido, MD., R.S. Pomeroy, M.B. Carlos and L.R. Garces. 1996. A handbookfor rapid appraisal of fisheries management systems (version 1). ICLARMEduc. Ser. 16, 85 p.
Cover design by Albert Contemprate.
ISSN 0116-5720ISBN 971-8709-80-0
ICLARM Contribution No. 1258

Contents
Foreword vi
List of Tables viii
List of Figures ix
List of Acronyms and Abbreviations x
Executive Summary xi
I. Introduction to Rapid Appraisal 1
Historical overview 2
Related methodologies 2
Summary of coastal RRA literature 3
II. Research/Survey Framework 5
Background to tropical fisheries management 6
Rationale for a rapid appraisal approach 6
RAFMS objectives and limitations 8
General survey/research design 10
Component I - Contextual variables 10
Component II - Research/survey steps 13
Component III - Expected output 14
Analytical framework 15
Data collection and analysis scheme 15
III. Procedures and Methodologies 21
Step 1. Preparatory activities 22
Site selection 22
Team organization 22
Collection and analysis of secondary data 25
Step 2. Reconnaissance survey 25
Field reconnaissance 25
Determination of survey instruments 26
Step 3. Field data collection 27
iii
General tools 27
Semistructured interviews 27
Group interviews 27
Participatory exercises 28
Reporting and brainstorming 29
Mapping 29
Transect-making 30
Timelines 32
Calendars 32
Historical transects 32
Process charts 32
Decision trees 33
Venn diagrams 33
Tools according to groups of attributes 34
Group I - Biological, physical and technical attributes 34
Group" - Market (supply and demand) attributes 37
Group III - Fisher, stakeholder and community attributes 42
Groups IV and V - Local and external institutional
arrangements 44
Group VI - Exogenous or external factors 48
Step 4. Preliminary analysis of data 51
Step 5. Initial organization of results 55
Step 6. Community validation 58
Step 7. Final report writing 58
Afterword 60
Acknowledgements 61
References 62
Appendices 65
Matrix 1. Biological, physical and technical attributes to be examined
and the tools/techniques for data collection and validation. 65
Matrix 2. Market attributes to be examined and the tools/techniques for
data collection and validation. 70
iv

Matrix 3. Fisher, stakeholder and community attributes to be examined
and the tools/techniques for data collection and validation. 74
Matrix 4. Local or community institutional arrangement attributes to be
examined and the tools/techniques for data collection and
validation. 79Matrix 5. External institutional arrangement attributes to be examined
and the tools/techniques for data collection and validation. 82Matrix 6. Exogenous attributes to be examined and the tools/techniques
for data collection and validation. 85
v

Foreword
Effective natural resource management ideally requires a comprehensive knowledge base on human and biophysical systems. The acquisition ofreliable information by conventional surveys, however, can often be both acostly and lengthy process. The challenge then to field practitioners is tofind less costly and faster methods to acquire information through the activeparticipation of target communities without sacrificing the scientific validity.These applied techniques in field data collection have become popularlyknown as rapid rural appraisal and/or participatory rural appraisal. Manyresearchers under the Consultative Group on International Agricultural Research (CGIAR) have developed research methodologies affiliated with RRAand sometimes PRA methods. Among these are the exploratory survey atthe International Center for the Improvement of Maize and Wheat (CIMMYT)in Mexico; informal agricultural survey at the International Potato Center(CIP) in Peru; diagnosis and design at the International Centre for Researchin Agroforestry (ICRAF) in Kenya; rapid assessment of minor irrigation systems at the International Irrigation Management Institute (IIMI) in Sri Lanka;and RRA field guides and training for rice at the International Rice ResearchInstitute (IRRI) in the Philippines. The RRNPRA approaches to agriculturalresearch and rural development planning have contributed valuable insightsfor the CGIAR's work on natural resource management, sustainability andinstitution building.
At ICLARM, a number of RRA/PRA - affiliated methodologies have been,and are being developed. Many of these techniques are either borrowed ormodified from RRAs/PRAs applied in agriculture and terrestrial resourcemanagement. We have the rapid appraisal of management parameters(RAMP), designed for the evaluation of management of coral reef systems;RESTORE, which is a participatory research tool for natural resource management, monitoring and evaluation with focus on farm households; rapidappraisal of coastal environments (RACE), which attempts to expedite theplanning and management processes for the coastal zone; and recently therapid appraisal of fisheries management systems (RAFMS).
RAFMS is a semistructured research tool designed to quickly documentand evaluate existing local-level fisheries management systems in a givencoastal community. The results of RAFMS will provide direction for undertaking more formal research or quantitative surveys to describe institutionalarrangements and performance. RAFMS is suited to the village level, or to acluster of villages within a defined marine unit such as a bay.
vi

RAFMS is technically a topical RRA since the emphasis is on theevaluation of the rights and rules system governing the use of the fisheriesresources at the local level. The approach is also participatory becauseit is designed for the joint use of RAFMS practitioners and local researchers in collaboration with local fishing communities. The mode of community participation, however, is consultative. RAFMS also has elements ofexploratory RRA because the process of data generation and analysiscan be used - or modified - to appraise any coastal fisheries or marineenvironment.
We publish this guide as Version 1 and welcome feedback for furtherrefinement. This version of the guide has been tested over the last twoyears in collaboration with ICLARM's research partners at the followingsites: Ulugan Bay and Binunsalian Bay in Palawan, Philippines, andNolloth Village at Saparua Island in Indonesia. Several NGOs and development projects are currently using a draft of this RAFMS handbookfor their coastal and fisheries surveys in Asia and Africa.
The ultimate challenge is the actual use of RAFMS in fisheries planningand management. The outputs or results of the RRAIPRA must be usablefor development interventions, further research and organizational strengthening. Hence, we encourage users to share their experiences in using thehandbook.
M.J. WilliamsDirector General
ICLARM
vii
G

List of Tables
1. Contextual variables and their attributes. 92. Data collection and analysis scheme. 173. An example of attributes to be examined and the tools/techniques for
data collection and validation. 194. Researchers required for the conduct of RAFMS. 235. Composition of the RAFMS team in Nolloth Village, Saparua Island.
Indonesia, 25-28 April 1995. 246. Guide to conducting SSls. 287. Guide to conducting FGDs and community dialogues. 298. Guide questions for land use. 369. Guide questions for capture fisheries assessment. 38
10. Estimates of fishing effort and season in Nolloth Village, SaparuaIsland, Indonesia, 1995. 39
11. Seasonality of species by gear type in Binunsalian Bay, Palawan.Philippines, 1995. 40
12. Guide questions for the market attributes. 4113. General price levels offish and marine products by channel and grade
in Binunsalian Bay, Palawan, Philippines, 1995. 4214. Guide questions for the characteristics of fishers and community
stakeholders. 4315. An example of comparative socioeconomic characteristics of fishersl
stakeholders in Manabore and Tarunayan, Ulugan Bay, Palawan,Philippines, 1995. 44
16. Timeline of Nolloth Village, Saparua Island, Indonesia,1 517 -1 995.45
17. Guide questions for the local institutional arrangements. 4618. Guide questions for the external institutional arrangements. 4619. Livelihood associations around Ulugan Bay, Palawan, Philippines.
4720. Nested organizational/institutional arrangements for Binunsalian Bay,
Philippines. 4921. Informal rights-and-rules system in the use of artisanal fishing gear in
Manabore, Palawan, Philippines. 5022. Guide questions for the exogenous attributes. 5123. Matrix of agricultural and fisheries problems, perceived solutions and
proposed projects for Malampaya Sound, Palawan, Philippines. 5724. Suggested contents page of a RAFMS report. 59
viii

List of Figures
1. Typical two-tiered components of fisheries management systems intropical developing countries. 7
2. Relationship among RAFMS practitioners, local researchers and fishing communities. 8
3. Data acquisition and verification scheme for RAFMS. 114. Systems description of the fisheries management system through
RAFMS process. 145. Framework of organizational levels, data coverage and attributes for
data collection and analysis in RAFMS. 166. Spot map of Chinnamedu Village, Tamil Nadu, South India, prepared
with the villagers. 307. Transect of Malampaya Sound, Palawan, Philippines. 318. Venn diagram of institutions on Kampai Island, North Sumatra, Indo
nesia. 349. Trend of the catch rate of some species in Nolloth Village, Saparua
Island, Indonesia. 3810. Conflict-resolution mechanisms in Tarunayan, Palawan, Philippines.
5011 . A research framework for institutional analysis. 5312. Decision pattern for fishing as an occupation in Malampaya Sound,
Palawan, Philippines. 56
ix

AEABFARBOPCADCBCRMCENROCIMMYTCIPCRMDARDECSDENRDOJFADFGDFSRGISlADICLARMICRAFIIMIIPPFIRDIRRIISFLGUMARONGANGOPAROPENROPOPRARACERAFMSRRASSI
List of Acronyms andAbbreviations
agroecosystem analysisBureau of Fisheries and Aquatic ResourcesBureau of Prisonscomputer-aided designcommunity-based coastal resources managementCommunity Environment and Natural Resources OfficeInternational Center for the Improvement of Maize and WheatInternational Potato Centercoastal resources managementDepartment of Agrarian ReformDepartment of Education, Culture and SportsDepartment of Environment and Natural ResourcesDepartment of Justicefish aggregating devicefocused group discussionfarming systems researchgeographic information systeminstitutional analysis and developmentInternational Center for Living Aquatic Resources ManagementInternational Centre for Research in AgroforestryInternational Irrigation Management InstituteIwahig Prison and Penal Farmintegrated rural developmentInternational Rice Research Instituteintegrated social forestrylocal government unitMunicipal Agrarian Reform Officenational government agencynongovernmental organizationProvincial Agrarian Reform OfficeProvincial Environment and Natural Resources Officepeople's organizationparticipatory rural appraisalrapid appraisal of coastal environmentsrapid appraisal of fisheries management systemsrapid rural appraisalsemistructured interview
x

Executive Summary
Rationale and objectives
The Rapid Appraisal of Fisheries Management Systems (RAFMS) is asemistructured research tool designed to quickly document and evaluatethe existing local-level fisheries management systems in a given fishing community. These fisheries management systems may be formal, informal/traditional or combinations. Undertaking a rapid appraisal approach is deemeduseful to provide a general description of basic physical and fisher/community characteristics and institutional arrangements. RAFMS then gives thedirection for undertaking more formal research or quantitative surveys. Thevillage or a cluster of villages within a defined fishing area, such as a bay ora lake, is RAFMS geographical focus.
As a composite methodology, RAFMS shall identify and document thecharacteristics of both the formal management regimes and the informalsystems of rules and rights. It shall describe how these institutional arrangements affect, positively or negatively, resource use patterns overtime. RAFMSshall examine the tentative relationships among the relevant biophysical,socioeconomic and institutional factors as well as the linkages between theformal and informal management systems. Although the focus is on fisheries, the evaluation is nested within the broader context of coastal resourcesmanagement (CRM). RAFMS attempts to synthesize the viewpoints of: (1)the RAFMS practitioners who are mainly outsider scientists, academiciansor development consultants; (2) the local researchers who are techniciansor specialists from the government agencies, the academe, nongovernmentalorganizations (NGOs) and people's organizations (POs) based in or nearthe study area; and (3) the fishing community of the actual fishers or othercoastal stakeholders engaged in various fishing activities.
RAFMS is among the RRA-affiliated methodologies being developed atthe International Center for Living Aquatic Resources Management(ICLARM), which is specific to fisheries.
Research/survey framework
RAFMS has adopted as its main theoretical foundation the institutionalanalysis and development (lAD) framework developed by researchers at
xi

the Workshop in Political Theory and Policy Analysis at Indiana University,USA. The lAD framework uses concepts from economics, political science,anthropology, biology and law, and relies on methods described by Kiserand Ostrom (1982), Ostrom (1986, 1990) and Oakerson (1992). Hence, thefocus of RAFMS is institutional arrangements, although it takes into accountthe relevant biophysical and socioeconomic variables. The lAD is complemented by agroecosystem analysis (AEA) (Conway 1985, 1987), particularly in its adoption of the four AEA patterns: space, time, flow and decision.RAFMS has also borrowed or modified many RRA tools and techniquescurrently used in both terrestrial and coastal settings.
RAFMS has three components: the variables or attributes to be examined, the research or survey steps, and the expected output. A total of 33variables to be examined are classified into six groups: (I) biological, physical and technical; (II) market (supply and demand); (III) characteristics offishers, stakeholders and community; (IV) fisher/community institutional andorganizational arrangements; (V) external institutional and organizationalarrangements; and (VI) exogenous factors. RAFMS focuses on the attributesfor group IV, which are at the village level for the processes of appropriation,provision, monitoring, law enforcement, policymaking and other management functions that directly affect fishing activity.
The second component pertains to the four research/survey steps. Alsocalled quadriangulation, these are: (1) secondary data analysis, (2) reconnaissance survey, (3) field data gathering and (4) community validation. Steps1 through 4 may be accomplished within one to two weeks (7 to 14 days).Another two to four weeks is needed for report writing.
The third component refers to the output, i.e, report, to be generated atthe end of the exercise. The report, which may be entitled The profile offisheries management systems, should specify the rights-and-rules systemsthat govern the utilization of fisheries resources. The report's three sectionsare: the basic profile of fisheries/coastal setting; the institutional analysis offisheries management systems; and the recommendations related to planning/policymaking, research and development. RAFMS sheds light on theplanning/policymaking agenda, which shall provide the direction towardsimproved institutional and organizational arrangements. The agenda includesthe clarification of legal rights and responsibilities, particularly the traditionalor customary use rights, and of organizational jurisdiction and responsibilities. The research recommendations pertain to the additional informationthat needs to be generated while the development recommendations relateto those that require project investments.
xii

Features of RAFMS
RAFMS has added new features to the conventional RRAs. One, thelocal researchers take on the role of active research partners rather thanfield guides or administrative coordinators. Two, RAFMS attempts to generate quantitative data, while most RRA data are qualitative in nature. MostRRA data are qualitative in nature or are mostly expressed in nominal scales.Three, RAFMS incorporates some scientific field methodologies particularlythose used in the "quick" biological assessment of coastal habitats. It likewise advocates the use of modern equipment/instruments (such as the global positioning system), as needed. Four, it attempts to integrate AEA andthe lAD framework to expand the evaluation of the fisheries managementsystem. Although the appraisal is focused on the household and village levels, the basic linkages among the local, regional and national levels aretaken into account. Five, it promotes "quadriangulation" as a self-checkingprocess of describing the management system.
RAFMS is not a panacea for improved fisheries research and management.As a tool, it is suited to the village or community level rather than larger geographic or political areas. Since its results are tentative or preliminary, thesemust be reinforced by more formal research or quantitative surveys. The success of RAFMS also depends on the experience of the researchers undertaking it and the active participation of the fishing community.
Note to the users
The survey procedures and methodologies described are meant tobe guides, not hard-and-fast rules. Since the users are specialists in theirdisciplines, they are expected to make innovations or modifications whenthe RAFMS techniques given do not work for one reason or another. Therule of thumb is that the users should, particularly when the survey getsrough, exercise their own best judgments.
About five to eight technical specialists in social and natural sciences arerequired to undertake RAFMS. Previous exposure to RRA-related surveysprovides certain advantages to the users. Those unfamiliar with RRA aredirected to read the publications of Chambers (1980, 1992); Honadle (1982);Conway (1985, 1987); McCracken et al. (1988); Sajise et al. (1990); Townsley(1992, 1993a, 1993b); Schonhuth and Kievelitz (1994); and Mikkelsen (1995).It is stressed that those who intend to use RAFMS must have a basicunderstanding of RRA/PRA methods and the characteristics of fisheries and
xiii

fishing communities. Further, they must be prepared to work for about aweek of intense field data gathering, brainstorming with professionalcolleagues and active interaction with the local communities.
The handbook is divided into six parts: (1) introduction to rapid appraisal;(2) research/survey framework; (3) procedures and methodologies; (4)afterword; (5) references; and (6) an appendix of six matrices. It has beentested at several sites in the Philippines (e.g., Ulugan Bay and BinunsalianBay in Palawan) and Indonesia (e.g., Saparua Island in the Central Maluku).It has been revised thrice since the first draft in November 1994.To the extent possible, the tables, figures and charts used were those obtained fromthe field application of RAFMS. Nonetheless, there is still room for refinement or simplification. The users are encouraged to write the authors abouttheir positive and negative experiences with RAFMS. These will be useful insubsequent editions of this handbook.
xiv

Part I • Introduction to Rapid Appraisal
This part provides background notes on the history,concepts and research/survey methodologies affiliated withrapid rural appraisal (RRA). It gives a summary ofemergingliterature on the use of RRA in coastal areas, mostly drawnfrom Asian experiences, particularly the Philippines'.
This section tackles both the usefulness and limitationsof using RRA in marine fisheries and other coastalenvironments.
1

INTRODUCTION TO RAPID APPRAISAL
Historical overview
Rapid rural appraisal (RRA) was formally introduced during a workshopof rural development practitioners at the University of Sussex, United Kingdom, on 26-27 October 1978. It was an offshoot of their realization that mostof the local communities were not actively involved in both development andresearch activities. Hence, many of the development interventions introducedin the rural areas were conceived by outside experts with little considerationfor the priorities and indigenous knowledge of the beneficiaries. As a result,project interventions and development needs were mismatched. Further,highly structured survey and research techniques used were inflexible andrequired much time and resources. The field practitioners then began looking for techniques of gathering information that could actively involve thetarget group or beneficiaries. These techniques were pulled together into amore systematic framework that became RRA (Townsley 1993b).
McCracken et al. (1988) described RRA as a "semi-structured activitycarried out in the field, by a multi-disciplinary team and designed to acquirenew information, and new hypotheses, about rural life." Chambers (1980)averred that RRA has emerged to fill in rural development's need for information that is timely, accurate and usable. Although conceived for the ruralsetting, RRA has since been used to denote a set of techniques or procedures for the quick study of almost any situation or type of environment. Butthis development has been muddled with semantics due in part to the manynouns and adjectives attached to the word rapid, e.g., rapid reconnaissancefor development administration (Honadle 1982) and rapid assessment techniques for coastal wetland evaluation (Howes 1987).
Related methodologies
RRA encompasses a wide range of approaches and shares strong conceptual and methodological similarities with the following research methods: sondeo (Hildebrand 1981); informal agricultural sUlVey(Rhoades 1982);informal methods and reconnaissance sUlVey (Shanner et al. 1982); exploratory sUlVey (Collinson 1981); agroecosystem analysis (AEA) (Conway1985, 1987); and participatory rural appraisal (PRA) (Mascarenhas et al.1991). Sondeo (Spanish for survey) was developed in Guatemala to assess
2

farmers' constraints and technology needs for agricultural research. Theinformal agricultural survey, which originated in Peru, aimed at providingbasic information for the design and execution of more formal surveys andin-depth investigations. The reconnaissance survey is an informal methodfor collecting primary data needed for decisions on research to be undertaken in farmers' fields. The exploratory survey pioneered in Mexico is usedfor diagnosing farming problems and opportunities. AEA provides amultidisciplinary research technique that focuses on patterns analysis. PRAemerged in the late 1980s mainly through the efforts of grassroots organizations striving to find better ways of helping rural villages solve their problems.
RRA evolved from and partly alongside the farming systems research(FSR) movement (McCracken et al. 1988) and integrated rural development(IRD). The systems orientation of RRA is partly influenced by IRD and AEAapproaches; hence, the current RRA typologies are largely combinationswith AEA, FSR and IRD. The majority of RRAs were conducted on landbased resource systems, primarily in agriculture, health and forestry. RRApioneer Robert Chambers admitted that there is no way one can track downthe extent to which RRA has spread. The common trend is to use PRNRRAinterchangeably.
Summary of coastal RRA literature
The RRA-related approaches specific to marine environment, particularly to fisheries, are just emerging. Majority of the experiences and concepts can be traced to the Asian region. McCracken (1990) conducted anRRA-type of survey in a fisherfolk community in Tamil Nadu, India. likewise, Townsley (1993a) developed rapid appraisal methods with applications in the coastal communities of India. In Malaysia, Howes (1987) assembled tech niques for the rapid appraisal of coastal wetlands. McArthur (1994)reviewed some RRA and client-based tools and methods for coastal zoneresource management.
The Philippines has probably the richest experiences, although theseare mostly in grey literature. Fox (1986) came up with a rapid appraisalguide for Philippine coastal fisheries. Coastal RRA or AEA exercises weredone in varying forms in several provinces, although in general, the procedures were either adopted or modified from terrestrial-based RRA or AEA.The basic steps are: (1) setting of RRA objectives, (2) preparatory activities,(3) reconnaissance survey, (4) field data gathering, (5) preliminary reportwriting, (6) community validation and (7) final report writing. On Malalison
3

Island, Antique, a combined exploratory and participatory RRA was conducted to identify the resources of the community and to undertake consultation (Bimbao and Dalsgaard 1991; Siar 1992). A topical RRA on GuiwanonIsland in Iloilo assessed the potential of agroforestry and included an analysis of the coastal and fisheries resources. A coastal RRA training was heldon Rapu-rapu Island, Albay, Bicol, to assess the site's problems and resource potentials (Diamante, pers. comm.). Another coastal RRA involvedseveral research institutions and a development NGO in a village in Arnedo,Pangasinan. Lamug (1994) developed a PRA guide for coastal communities that was pilot-tested in the town of Natipuan, Batangas. Other studieswere conducted by NGOs and project implementors.
Some coastal RRAs include the adjoining watershed as part of the planning area. These "integrated" RRAs were conducted in Honda Bay (Dygico1990) and Malampaya Sound (Pido et al. 1990; Pido 1995), both in theprovince of Palawan. Here, the full spectrum of resources systems and activities, from the top of the mountain down to the sea, was considered. Theseexperiences point to RRA's becoming a learning tool in "integrating agriculture, fisheries and forestry and the complications of managing common versus private resources" (Flora, pers. comm.).
Pido and Chua (1992) developed the notion of rapid appraisal ofcoastalenvironments (RACE) at ICLARM. RACE is a conceptual and methodological attempt to develop an RRA package relevant to coastal zone and fisheries. Pido and Chua (1992) argued that although most RRA techniques andprocedures in agricultural/terrestrial contexts are well-established, these havea limited applicability to coastal zone and fisheries planning. The RRA practitioners for terrestrial areas are already familiar with minimum secondarydata required, primary data sets generated and components of agroecosystems for analysis. This level of sophistication, however, is yet to beachieved in fisheries and coastal zone planning. The need for an RRA package for this was expressed by a number of regional and international institutions. In July 1992, a national workshop was held in Silliman University,Dumaguete City, Philippines, to come up with a primer on coastal RRA whichwould be useful in preparing coastal zone or fisheries profiles and plans.Several activities are underway to achieve this objective.
4

Part II - Research/Survey Framework
This provides the rationale and objectives for usingRAFMS to document and evaluate fisheries managementsystems in coastal areas. It also describes the generalsurvey design in terms of attributes or variables to beexamined, research steps and anticipated outputs. Theanalytic and spatial framework are discussed.
5

RESEARCH/SURVEY FRAMEWORK
Background to tropical fisheries management
In many tropical developing countries, the mode of fisheries management is often intertwined between formal and informal or traditional systems(Fig. 1). Making clear-cut definitions of formal and informal systems is difficult because of overlaps. For the purposes of this handbook, however, aformal system is one legally sanctioned by the existing government or stateauthority. In the Philippines, for instance, the formal management of fisheries resources is divided between the national government through the Bureau of Fisheries and Aquatic Resources (BFAR) and the local governmentunits (LGUs), principally through the municipal (equivalent to town or district) governments. BFAR manages commercial fisheries while LGUs manage municipal fishing operations or activities.
An informal fisheries management system is a rights-and-rules systemcollectively sanctioned by fishers or other coastal resource users. It mayhave been handed down through generations, by custom and tradition. Itmay involve co-ownership among fishers and stakeholders and exclusion tononmembers. It mayor may not be legally sanctioned by the government.An example of such a system is the sasi (closed) system in Indonesia.
Rationale for a rapid appraisal approach
In many fishing communities, a dualistic system of fisheries management exists. An informal management system, devised and implemented bya community of resource users, often coexists with a formal governmentmanagement system. Often, outsiders to the community are unaware ofinformal systems as these are not easily observed or understood. Some ofthese systems have worked well at meeting the management objectives ofthe community and at achieving ecological sustainability, social equity andeconomic efficiency. Some local-level systems are new while others aretime-tested. Their rights and rules may be complex or simple and easilyenforceable.
Although information on community-based marine resource managementsystems exists, especially in the Asia-Pacific region, it is often not currentbecause of rapid changes at the national and community levels due to modernization. If effective fisheries management efforts are to succeed, it is essential
6

Formalmanagement
system
Informalmanagement
system
Fig. 1. Typical two-tiered componentsof fisheries management systems intropical developing countries.
that resource managers and policymakers have up-to-date information aboutcommunity-based management systems and their socioeconomic, politicaland ecological contexts. Studies have to be contemporary, detailed andlocation-specific for a comprehensive knowledge base on the range of types,functions and status of fisheries management systems in a country.
In many locations, new management systems, such as the communitybased coastal resources management (CBCRM), are being imposed on topof existing local informal ones. The new systems often fail because fishersare unwilling to give up a system they themselves devised. A new management system that complements or builds on the existing informal systemsdefinitely has improved chances for success. Ostrom (1992b) stated that:
If a people has lived in close relationship withrelatively small common-pool resources over aperiod of time, they have probably evolved somesystem to limit and regulate use patterns....
Before one imposes new rules on local systems, inquiries should Qe made to determine ifsome rules and customs (:10 not already exist Ifcustoms and rules do exist, study these carefully in order to understand how they affect usepatterns over time.
With limited funds, time and personnel, it is not always possible to conductdetailed in-depth studies of community-based marine resource management
7

systems at a specific site or across a country. A rapid appraisal methodologycan be useful in determining the existence of such systems and in gatheringpreliminary information on their operation. Although not a substitute fordetailed studies, the method can provide cost-effective information anddirection for further research.
The rapid appraisal methodology is called rapid appraisal of fisheriesmanagement systems (RAFMS). A subset of the broader rapid appraisal ofcoastal environment (RACE) earlier developed at ICLARM, RAFMS is anoperational translation of RACE with emphasis on the fisheries sector. Whereappropriate, RAFMS takes into account the relevant elements of the entirecoastal zone system. It is technically classified as a topical RRA because itaims at discovering the existing fisheries management systems in a coastalcommunity. It has elements, however, of exploratory and participatory RRAs.It is exploratory because some of the tools and techniques are designed togenerate standard baseline information, and participatory because the involvement of the local researchers and members of fishing communities inthe process is imperative.
RAFMS objectives and limitations
Fig. 2. Relationship among RAFMS practitioners,local researchers and fishing communities.
Localresearchers
RAFMS practitioners
Fishingcommunities
The main objective of RAFMS is to quickly document and evaluate acoastal community's local-level fisheries management systems, both formaland informal. RAFMSidentifies their characteristics and describes howthey will affect, positivelyor negatively, resource usepatterns over time. It establishes the tentative relationships among contextual variables and their attributes (Table 1). Although the focus is on fisheries, evaluation is nestedwithin broader coastal resou rces management(CRM).
RAFMS analyzes existing systems from threeviewpoints (Fig. 2). One, its
8

Table 1. Contextual variables and their attributes.
Group I. Biological, physical and technical attributesPhysical attributes
o resource useo climatic datao physiographyo physical oceanographyo water quality
Biological and habitat attributeso seaweeds/seagrasseso mangroveso coral reefs
Technical attributeso gear/fishing technologyo species harvestedo level of exploitation
Group II. Market (supply-demand) attributeso supply of marine productso pricing scheme/systemo market functionso market ruleso stability of demando market structureD market orientation
Group III. Characteristics of fisher/community stakeholderso demographyo tenurial statuso economic statuso cultureo livelihood (occupational structure)[] attitudes and outlook of fisherso resource use/harvesting conflictso ecological knowledgeo community
Group IV. Fisher/community institutional and organizational arra!lgementso individual organizationso institutional arrangements
Group V. External institutional and organizational arrangementso individual organizationso institutional arrangements
Group VI. Exogenous factors[J natural calamitieso macroeconomic/political/sociocultural factors
9

practitioners, experts on RRAIPRA methods, lead the exercise. They maybe outside or local scientists, academicians or development specialists. Two,the local researchers, technicians/specialists based in or near the study area,come from nongovernmental organizations (NGOs), local government units(LGUs), academic institutions or government agencies. Three, there are theactual fishers or other coastal stakeholders.
The conduct of RAFMS, however, should not rely solely on outside experts. The long-term end is the more active partnership between local researchers and the fishing community, but they must be sufficiently trainedby outside experts on tools and techniques to enable them to conduct RAFMSon their own. As local researchers become technically capable, reliancefrom outside experts may be minimized.
Although RAFMS may be used to evaluate any fisheries-based setting, ithas several limitations. One, the variables and data sets to be examined areconcentrated on fisheries and touch only briefly on the other dominant sectors of the coastal areas, such as industry, tourism and agriculture. Two, it issuited to the village or community level rather than the larger geographic orpolitical area. Three, its results, which are tentative or preliminary, must bereinforced by more formal research or quantitative surveys. The success ofRAFMS also depends on the experience of the researchers and the activeparticipation of the fishing community.
General survey/research design
The three components of RAFMS are: (1) contextual variables and theirattributes to be examined; (2) research or survey steps; and (3) expectedoutput. Fig. 3 presents the data acquisition/verification scheme to appraiseexisting fisheries management systems.
COMPONENT I- CONTEXTUAL VARIABLES
In conducting studies on fisheries management systems, we are essentially interested in understanding how rules affect the behavior and outcomesof fishers using available resources. Providing the framework is institutionalanalysis and development (lAD), which focuses on institutional arrangements,the set of rights and rules by which a group of fishers and the governmentmanage the resource in action situations, such as fishing. (The lAD framework will be discussed in greater detail in Part Ill's section on preliminaryanalysis of data).
10

I. Variables/attributes to be examined II. Research/survey stepsI I I I
ill. Outputs1-- I
Research agenda
Developmentagenda
Planning!policymakingQ
~
~
Q[4]
Community~validation '-Y
[3]........ Field~ta ........'-Y gathenng '-Y
[2]~ Recon'-Y naissance
survey
[1]~ Secondary'-Y data
analysis
I - BiOlogical, physical, technical
IT - Market (supply and demand)
ill - Fisher. stakeholder andcommunity
IV-Fisher/coDUUunityinstitutional andorganizationalarrangements
V - External institutional andorganizational arrangements
VI - Exogenous
~
~
Fig. 3. Data acquisition and verification scheme for RAFMS.

The first RAFMS component identifies variables affecting the fishing actionsituation, i.e., the institutional, biophysical, technical, market, social, cultural,economic and political attributes and conditions of fishers and the fishery.These variables form the context within which fishers and other resourcestakeholders coordinate, cooperate and contribute to establish organizationsand institutions to manage the fishery.
The attributes under contextual variables include:• who are involved in a situation;• what their stakes and resources are;• the types of action they can take;• the costs of those actions;• what information is available to them;• how much control individuals can exercise;• how individuals and actions are linked to one another and to out
comes;• what outcomes can be expected in relation to what actions; and• how rewards and punishments are allocated to particular combina-
tions of actions and outcomes.Because the attributes are interrelated, a change in one may create a newstructure of incentives, which results in different outcomes. Based on thecontextual variables, one tries to explain or predict the patterns of relationships and the interactions and outcomes that are most likely to occur for anaction situation.
The attributes, numbering 33, fall readily into 6 sets of contextual variables (Table 1). RAFMS highlights the attributes for fisher/community institutional and organizational arrangements (Group IV). Institutional arrangements define the rights fishers possess in relation to fishery and the rulesthat delineate their action in utilizing it. In the final analysis, institutional arrangements are defined by authority relationships that specify who decideswhat in relation to whom.
The biophysical attributes (Group I), which pertain to both terrestrial andmarine environments, are important determinants of the biological productivity and sustainability of fisheries resources in a given area. These includethe status of the coastal habitats and the state of resource exploitation. Tohelp define the status of fish stocks, emphasis is given to species harvestedand fishing technology, particularly the gear.
The market attributes (Group II) focus on the supply-demand relationships,including price structure and stability, and those related to market operationsand functions and to fisher and fish trader relationships. The attributes ofstakeholders (Group III) refer to social, cultural and economic conditions and
12

characteristics that affect their incentives to cooperate with and contribute tomanagement. These attributes include religious beliefs and practices; traditionsand customs; sources of livelihood; the degree of social, cultural, economic andlocational heterogeneity or homogeneity; asset ownership; community mores;level of community integration into the economy; and polity. Stakeholders include fishers and their families or family members, fish traders, processors andmoney lenders.
Group V is composed of attributes for institutional and organizationalarrangements external to the community. These are variables at the national, regional, district or municipal levels for the processes of policymaking,legislation, governance, conflict resolution and law enforcement that authorize and support community-level institutional and organizational management. They may be nested, multiple layers of organizations, formal or informal, at different political and administrative levels.
Group VI are mainly external factors beyond the control of the local, andat times, the national levels. The variables are exogenous surprises or sudden shocks which change or affect their survival. They are recent (i.e., datedto within the last two years) but the management systems should be put intoan historical timeframe. They measure how resilient the management system is.
The 33 attributes, however, are not absolute requirements. Some maybe deleted and others not included may be added, as needed.
COMPONENT II - RESEARCH/SURVEY STEPS
The second component pertains to research/survey steps. These are:(1) secondary data analysis; (2) reconnaissance survey; (3) field data gathering; and (4) community validation. The four-step process, called"quadriangulation," may be accomplished within one to two weeks (7 to 14days). Another two to four weeks is allotted to report writing.
Quadriangulation becomes a series of generating and verifying data forthe given set of relevant attributes under examination. Fig. 4 provides asystems description of the fisheries management system through RAFMSprocess. As is common to many an RRA process, the "truth" is approachedthrough the rapid buildup of diverse information rather than statistical replication (McCracken et al. 1988). For instance, the literature listing the municipal fishing gear obtained from secondary data analysis (Step 1) could bechecked during reconnaissance survey (Step 2), generated through actualfield data gathering in Step 3, and reconfirmed or ascertained during thecommunity validation (Step 4).
13

Step 1Secondary data analysis
Step 2Reconnaissance survey
Systems description of the.......) fisheries management « .
system
Step 4Community validation
Step 3Field data gathering
Fig. 4. Systems description of the fisheries management system through RAFMSprocess.
COMPONENT III - EXPECTED OUTPUT
The third component refers to the outputs to be generated at the end ofthe exercise. Data gathered from the secondary data analysis throughcommunity validation will be integrated to produce a technical report orworking paper. The document, which may be entitled as "The profile offisheries management systems", should specify the rights-and-rules systemsthat govern the utilization of the fisheries resources at the local level andhow such systems relate to the broader institutional environment. The reporthas three sections: the basic profile offisheries/coastal setting; the institutionalanalysis of the fisheries management systems; and the recommendationsrelated to planning/policymaking, research and development. The essenceof RAFMS lies in the planning/policymaking agenda, which shall provide thedirection towards improved institutional and organizational arrangements.RAFMS describes the legal rights and responsibilities, particularly traditionaluse rights, and of organizational jurisdiction and responsibilities. Therecommendations for research will describe the subject or problem areaswhere further information needs to be generated. The developmentrecommendations will indicate investment areas that require detailed projectfeasibility studies.
14

Analytical framework
The three groups of factors to be considered when appraising the existing management systems in a coastal marine fisheries are the: (1) levels oforganizational hierarchy; (2) data coverage; and (3) clusters of attributes.Fig. 5 presents the framework of levels, boundaries and attributes for datacollection and analysis.
For the Philippine government administrative structure, the basic levelsare the central/national at the top and the village at the bottom. Such hierarchical elements, however, may be modified. For example, the municipalityin the Philippines is roughly equivalent to a district in Malaysia. Also, thePhilippine province roughly translates to a state in Indonesia.
The data coverage refers to the relative amount of information to begathered at each organizational level. The focus of analysis for RAF~S isthe village or community level. RAFMS is generally suited to analysis at amicro scale. Its reliability diminishes as its geographical coverage increases.Nonetheless, information at international or national levels at the top and athouseholds and individuals at the bottom are considered parts of the analysis.
The data coverage relates to the attributes to be examined, which aredivided into six groups. The attributes on external institutional and organizational arrangements (Group V) and exogenous factors (Group VI) are outside the scope of the local community. All the other variables (Groups I toIV) are centered at the community level. The arrows indicate the geographical overlaps among the attributes.
Data collection and analysis scheme
Table 2 shows a seven-column data collection and analysis matrix. Columns 1 through 3 specify the items to be examined while Columns 4 through7 outline the techniques of data collection and analysis. The scheme can belikened to completing a jigsaw puzzle with Column 1 as the reference point.The secondary data (Column 4) may be validated by the field observations(Column 5) during the reconnaissance survey. The primary data (Column 6)generated in the field may be ascertained during the community validation(Column 7). Thus, RAFMS is an interactive process of generating, analyzingand validating data for the attributes relevant to the study of existing fisheries management systems.
15

......m
Philippinesetting
Levels oforganizational hierarchy
InternationalI
Central/national
IRegional
IProvincial (state)
IMunicipal (town/dicstrict)
IVillage (barangay/barrio/sitio)
IHousehold
IIndividuals
Data coverage Attributes
V External institutional andorganizational arrangements
VI Exogenous factors
Biological, physical and technicalattributes
II Market attributes
III Fisher, stakeholder and communityattributes
IV Fisher/community institutional andorganizational arrangements
Fig. 5. Framework of organizational levels, data coverage and attributes for data collection and analysis in RAFMS.

Table 2. Data collection and analysis scheme.
Column 1 2 3 4 5 6 7
...\.
-...J
Attributes Indicators Unit/scale Sources of Field Field data Communityof measurement secondary data observations collection validation
techniques techniques
Research!Survey steps
Step 1Secondary data
analysis
2Reconnaissance
survey
3Field data gathering
4Communityvalidation
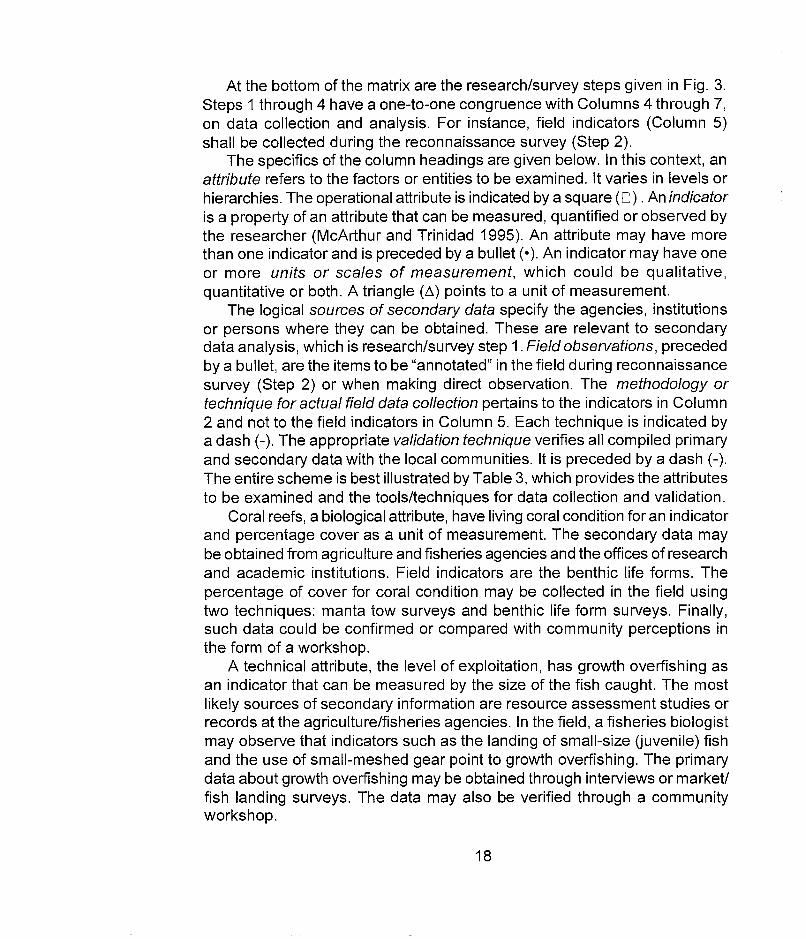
At the bottom of the matrix are the research/survey steps given in Fig. 3.Steps 1 through 4 have a one-to-one congruence with Columns 4 through 7,on data collection and analysis. For instance, field indicators (Column 5)shall be collected during the reconnaissance survey (Step 2).
The specifics of the column headings are given below. In this context, anattribute refers to the factors or entities to be examined. It varies in levels orhierarchies. The operational attribute is indicated by a square (0) . An indicatoris a property of an attribute that can be measured, quantified or observed bythe researcher (McArthur and Trinidad 1995). An attribute may have morethan one indicator and is preceded by a bullet (0). An indicator may have oneor more units or scales of measurement, which could be qualitative,quantitative or both. A triangle (L1) points to a unit of measurement.
The logical sources of secondary data specify the agencies, institutionsor persons where they can be obtained. These are relevant to secondarydata analysis, which is research/survey step 1. Field obselVations, precededby a bullet, are the items to be "annotated" in the field during reconnaissancesurvey (Step 2) or when making direct observation. The methodology ortechnique for actual field data collection pertains to the indicators in Column2 and not to the field indicators in Column 5. Each technique is indicated bya dash (-). The appropriate validation technique verifies all compiled primaryand secondary data with the local communities. It is preceded by a dash (-).The entire scheme is best illustrated by Table 3, which provides the attributesto be examined and the tools/techniques for data collection and validation.
Coral reefs, a biological attribute, have living coral condition for an indicatorand percentage cover as a unit of measurement. The secondary data maybe obtained from agriculture and fisheries agencies and the offices of researchand academic institutions. Field indicators are the benthic life forms. Thepercentage of cover for coral condition may be collected in the field usingtwo techniques: manta tow surveys and benthic life form surveys. Finally,such data could be confirmed or compared with community perceptions inthe form of a workshop.
A technical attribute, the level of exploitation, has growth overfishing asan indicator that can be measured by the size of the fish caught. The mostlikely sources of secondary information are resource assessment studies orrecords at the agriculture/fisheries agencies. In the field, a fisheries biologistmay observe that indicators such as the landing of small-size Uuvenile) fishand the use of small-meshed gear point to growth overfishing. The primarydata about growth overfishing may be obtained through interviews or market!fish landing surveys. The data may also be verified through a communityworkshop.
18

.......CD
Table 3. An example of attributes to be examined and the tools/techniques for data collection and validation.
Column 1 2 3 4 5 6 7
Attributes Indicators Unit/scale Sources of Field Field data Communityof measurement secondary data observations collection validation
techniques techniques
I. Biological, physicaland technicalattributes
Biological attributes
o coral reefs • living coral j. percentage cover - agriculture/ benthic life forms - manta tow surveys - workshopcondition fisheries agency
- research/academic - benthic life forminstitution surveys
------ 1------ ------ ------ -------r------- -----Technical attributes
o level of exploitation • growth L'> size of fish catch - agriculture/ landing of small- - interview - workshopoverfishing fisheries agency size fish - market/fish
· use of small- landing surveysmeshed gear
------ f------ ------ ------ f-------- ------ f------IV. Characteristics
of fishers/stakeholders
o demography • religion L'> form - local governments • churches/temples - interview - workshoprecords
• ethnicity L'> ethnolinguistic - census office • dialect spoken - workshopgroup/affiliation
Research/Survey steps
1Secondary data
analysis
2Reconnaissance
survey
3Field data gathering
4Communityvalidation

Demography, an attribute under the characteristics offishers/stakeholders(Group IV), has religion and ethnicity as indicators. The unit of measurementfor religion is its form while ethnicity has ethnolinguistic group or affiliation.The secondary information can be obtained from municipal records or thevillage profile. In the field, the form of religion can be observed by looking atthe religious structures, e.g., mosques and temples. The ethnolinguistic groupcan be known by listening to the dialects being spoken. The data for theseindicators can be obtained through interviews and validated throughcommunity workshops.
20

Part 111- Proc.edures and Methodologies
This part provides a general guide to RAFMS activitiesfrom start to finish. These include: (1) preparatory activities(e.g., site selection and team organization); (2)reconnaissance surve.y;(3) field data collection; (4)preliminary analysis ofdata; (5) organization ofinitial results;(6) community validation; and(l) final report writing.
Emphasis is given to field data collection. Each group ofattributes to be examined is presented in a seven-columnmatrix that summarizes data collection and validationtechniques. Sample tables, figures and charts are alsoshown.
21

PROCEDURES AND METHODOLOGIES
Step 1. Preparatory activities
Preparatory activities include site selection, team organization, andcollection and analysis of secondary data. They are done prior to field visitand are joint activities of RAFMS practitioners and local researchers.
SITE SELECTION
RAFMS can be used to evaluate fisheries management systems in anyfisheries village or community. There are considerations that must be met,though.
1. There must be a group of local researchers (from government, academe, private group or NGO) who are willing to collaborate. Withoutthis group, it is extremely difficult for outside RAFMS practitioners toenter into a community.
2. The local fishing community (and local government authorities) mustbe willing to cooperate and actively participate. There is no use conducting RAFMS in an area where the populace is hostile to the researchers.
3. Fishing must be an important economic activity.4. The size of the area must be manageable enough so that fieldwork,
in both land and sea, can be accomplished within four to seven days.Thus, focus is on the village or community rather than on the largergeographic or political area. If the area is large, like a bay or a gulf,two alternative approaches may be undertaken: subdivide the siteinto more manageable units and do a series of RAFMS or conductRAFMS only in representative sample sites.
5. The fishing village must be accessible.
TEAM ORGANIZATION
Personnel requirement is dictated by the 33 attributes to be examined(Table 4). Although the suggested ideal is eight and the minimum is fiveresearchers, this is not a hard-and-fast rule. Actual composition will be ultimately decided by factors such as expertise available, quality of secondarydata and other practical realities in the field.
Since RAFMS is multidisciplinary in approach, the more importantconsideration is balance of expertise coming from both natural and social
22

Table 4. Researchers required for the conduct of RAFMS.
Group I. Biological, physical and technicalattributes
Physical attributes[] resource use[J cI imatic data[] physiography[] physical oceanography[] water quality
Biological and habitat attributes[] seaweed/seagrasses[] mangroves[] coral reefs
]]
]
Ideal
Land use planner/forester
Water qualityanalyst
Marine biologist!ecologist
Minimum
Coastal habitatexpert
Technical attributes[] gear/fishing technology[] species harvested[] level of exploitation
Group II. Market (supply-demand) attributesLJ supply of marine products[J pricing scheme/system[J market functions[] market rulesU stability of demand[] market structure[] market orientation
] Fisheries biologist
Economist
] Fisheries/marinebiologist
Economist
Group III. Characteristics of fisher, stakeholdersand community
[] demography ] Sociologist![] tenurial status anthropologist[] economic status =:J Economist Sociologist/[] culture
]anthropologist
[] livelihood (occupational structure)[] attitudes and outlook of fishers Sociologist/[] resource use/harvesting conflicts anthropologistLJ ecological knowledge[] community
Group IV. Fisher/community institutional andorganizational arrangements
[] individual organizations ] Political scientist/[] institutional arrangements public policy analyst
Group V. External institutional and organizational Politicalarrangements scientist/
[] individual organizations ] Political scientist! public policy[] institutional arrangements public policy analyst analyst
Group VI. Exogenous factors[J natural calamities[] macroeconomic/political/sociocultural ] Resource planner
23

sciences, and ideally from integrative sciences such as environmentalresource planning or systems analysis. It may be feasible to have two RAFMSpractitioners complemented by four local researchers. For instance, RAFMSpractitioners could consist of a fisheries biologist and an economist whilethe local researchers may be a marine habitat expert, an anthropologist, apublic policy analyst and a resource planner. Given sufficient training inRAFMS, local researchers or NGO members may form a group and conductthe survey themselves. The long-term vision is for local scientists to be ableto undertake RAFMS on their own.
The position of the team leader is crucial because the success or failureof the exercise depends to a large extent on his/her handling of the situation. He/she may be appointed beforehand or the team members may collectively decide among themselves who the leader will be. He/she may haveno technical assignment or may be a leader of any subgroup acting in aconcurrent capacity. In a typical RRA, some team members have dual roles:as technical specialist and as support staff for administrative operations.
During preparatory and field activities, team members may be dividedinto three small groups: socioeconomic, institutional and biophysical. Eachgroup must be handled by a leader specializing in socioeconomics, publicpolicy/political science and marine/fisheries biology, respectively. Table 5presents the actual composition of the RAFMS team in Indonesia. Theremust be at least a pair in each group. Similar to sandea (Hildebrand 1981),members may be rotated during the conduct of the interviews. An expertfrom one discipline may join another group to provide an interdisciplinaryperspective. As a rule of thumb, however, at least one specialist must remain
Table 5. Composition of the RAFMS team in Nolloth Village, Saparua Island, Indonesia, 25-28April 1995.
Group/technicalexpertise
Biophysical group1. Marine biologist2. Fisheries biologist3. Resource economist
Socioeconomics group4. Resource economist5. Sociologist6. Agricultural economist
Institutional group7. Planner8. Resource economist9. Institutional economist
10. Resource economist
Institutional affiliation
RAFMS practitionerLocal research agencyLocal research agency
RAFMS practitionerLocal research agencyLocal research agency
RAFMS practitionerLocal research agencyRAFMS practitionerConsulting firm
24
Administrative role
Group leaderTreasurer
Group leader
Team leaderCo-team leader

in each group, e.g., one marine biologist must remain in the biophysicalgroup or an economist in the socioeconomic group.
COLLECTION AND ANALYSIS OF SECONDARY DATA
Secondary data analysis operationally defines data coverage of appraisaland covers both published and unpublished data. Of significance here arethe spatially related data, particularly thematic maps and aerial photographs.McCracken et al. (1988) emphasized that "time spent on quickly reviewingand summarizing secondary data in the form of simple tables, diagrams orbrief written notes can be of considerable value in setting the RRA task inthe context of previous work." This activity can be undertaken by means of ateam workshop.
The collection of hard copies of secondary literature is the responsibilityof the collaborative local research group. The analysis of secondary data,however, is the joint responsibility of RAFMS practitioners and the local research group. The available secondary literature shall be evaluated by eachconcerned group. By convention, the socioeconomic group shall take chargeof reviewing information relevant to social and economic characteristics(Groups II, III, VI and some aspects of I); the institutional group, to organizations, legal and institutional arrangements (Groups IV and V); and the biophysical group, to natural resources and general environmental setting (GroupI).
The guide questions for each group of attributes (see section on toolsand procedures according to group of attributes below) may help in the analysis of secondary data. This phase shall facilitate "scoping" of data to becollected in the field.
The scale of base or working map must be agreed upon. Overlay mapping will be facilitated at a later stage if all groups work with maps of thesame scale. Maps with larger than 1:50,000 scale are recommended.
Step 2. Reconnaissance survey
This stage is the first field activity and is Step 2 in the RAFMS fourstep process. It includes both field reconnaissance and final selection ofsurvey instruments. One to two days must be allotted for this purpose.
FIELD RECONNAISSANCE
The main purpose of field reconnaissance is for team members to usetheir "power of observation" to get a general "feel" of the fishing village and
25

to set activities for field data gathering (Step 3). This stage allows the members to familiarize themselves with important field features, such as terrain,natural resources and concentration of fishing activities and human settlement, and to know firsthand the feasibility of conducting surveys. Dangers(e.g., peace and order situation), may be evident at this stage.
As part of research, members shall annotate the checklist of field indicators provided in each of the six matrices (see Appendix). The base/workingmaps must be annotated. The initial transect map may be also constructedto include observations about key biophysical processes, social events andrelationships between people and their natural environment. Reconnaissancemakes possible the identification of various fishing zones and the noting ofdifferences between reported and real conditions. Such annotated noteswill be helpful in revising, as needed, guide questions for semistructuredinterviews (SSls). Instruments or equipment must also be checked if theyare working under field condition, e.g., a handheld global positioning system, camera, compass and water quality kit.
The team may also settle administrative arrangements such as briefinglocal government officials and community organizations on upcomingRAFMS, arranging accommodations of the team during the survey and listing key informants. Where applicable, respondents or key informants maybe also organized in fishing communities, according to ethnolinguistic originor groups, such as cooperatives. These teams shall be used when conducting focused group discussions (FGDs).
The selection of respondents and key informants must ideally representa cross-section of the target population. In this case, fishers that includemen and women, young and adult, are the target population. The respondents may be divided into groups, for example, according to income level,occupation, gear type. There is no rigid rule on the ideal number of respondents because the sample population is not subjected to a statistical analysis.
The key informants must have special knowledge of the site and candiscuss key issues or specific topics. They include but are not limited to thefollowing: local government officials, community leaders, elders, teachers,model citizens and religious leaders. Special attention should be given toelders because of their knowledge of informal fisheries management systems in the area, handed down to them through generations.
DETERMINATION OF SURVEY INSTRUMENTS
Based on the annotated checklist, decisions may have to be made interms of revising survey instruments, particularly SSls. Some RAFMS tools
26

initially considered, e.g., FGD, may have to be dropped or altered. Newtechniques may be also introduced.
Step 3. Field data collection
Field data collection, Step 3 of the RAFMS cycle, is divided into twoparts. The first describes generic or general RRA tools which may be usedfor RAFMS. The second describes detailed methodologies that include survey procedures, guide questions and the matrix of attributes and their datacollection techniques. Sample figures, tables and diagrams are also provided. The methodologies are classified according to six groups of attributes.
GENERAL TOOLS
A variety of techniques or tools can be used for collecting RAFMS primary data. Many of these are fairly standard tools for conducting rapid appraisal. They overlap with one another. McCracken et al. (1988); Sajise etal. (1990); Townsley (1992, 1993a, 1993b); Schonhuth and Kievelitz (1994);and Mikkelsen (1995) may be referred to for detailed descriptions of suchtools or techniques. Basic definitions follow.
Semistructured interviews (SSO
Probably the most powerful of RRA techniques (McCracken et al. 1988),the semistructured interview(SSI) is a field technique where the informant isguided by the researcher in session interview by means of a key, predetermined set of questions. Through an interview schedule, the construction ofkey questions must be prepared with care. Table 6 is a guide to conductingSSls.
This technique, however, is flexible because new lines of questioning orinquiry can be opened during the actual interview. The SSI is ideal for discussing specific topics or issues, building up case studies and collectinghistorical information. The information derived from SSls will be among themost vital acquired during field data gathering if one knows in essence whatto ask, how to ask and whom to ask (Sajise et al. 1990).
Group interviews
A variant of SSI, group interview is used in both field data gatheringand community validation. Among the popular versions are FGDs. During fieldwork, it is effective in identifying social norms and accepted views;
27

Table 6. Guide to conducting 551s (adapted from 5ajise et al. 1990).
1. Properly introduce yourself before starting the interview.2. Those who are conducting the interview should be familiar with the local dialect; if not,
bring an interpreter. (If an interpreter is used, it is important that he/she understands theobjectives and applications of RAFMS. If necessary, involve the interpreter in the researchers' discussions so meaning and style of interaction are not lost in the translation.)
3. Put the fisher or key informant at ease before starting the interview. Ask easy questionsfirst before difficult ones.
4. Do not ask leading questions. Open-ended questions should be used to generate moreinformation.
5. Do not write in front of fishers or carry tape recorders unless they give prior permission.6. Do not promise anything.7. Do not ask questions simultaneously.8. Use indirect questions for sensitive aspects, e.g., income, ownership, disability, age, marital
status, ed ucational attainment, etc.9. Blend in with the fishers' activities.
10. Be conscious about the time you conduct and spend during the interview.11. Do not abuse fishers' hospitality. Try to pay/compensate for products given in great quan
tities.12. Obtain information from other members of the family, e.g., wife, children.13. Do not interpret in front of fishers.
pinpointing special interest groups; and knowing collective views andfeelings. It may be used at the end of the fieldwork to cross-check information.
FGDs can be used to generate more information regarding specific topics.Separate sets of key questions or interview schedules may be prepared andadministered to an ethnolinguistic group, e.g., those who speak Cebuano in thePhilippines, or to a particular organization, e.g., a multipurpose cooperative.FGDs can also facilitate accumulation of diverse information, such as marketing structure, problems and priorities. Table 7 provides useful hints on conducting FGDs as well as community dialogues and meetings.
Participatory exercises
Among the popular modes of participatory exercise are: diagramming, ranking, and stories and portraits. Diagrams are simply models that convey information in easily understandable visual forms. They have the advantage of forcingparticipants to think through the dynamics while constructing the models. Diagrams are also a good medium for stimulating discussion with local people aswell as communicating ideas and findings. Following the AEA concept (Conway1985, 1987), diagrams may be expressed in terms of space, time, flow anddecision. Ranking is an analytical game used to find out the preferences orpriorities of an individual or a group. It takes various forms. A simple rankingmay only ask a series of simple questions while a more complex one uses aseries of two-way comparisons. Stories and portraits are short, colorful descriptions of situations encountered by the team or stories recounted by people in
28

Table 7. Guide to conducting FGDs and community dialogues (adapted from Sajise et a!. 1990).
1. Set the meeting at a date, time and place most convenient to the community.2. Assign someone to preside over the meeting, and request a local leader to introduce the group to
the community.3. State clearly the purpose of the visit.4. Maintain eye contact especially with the less active members of the community to encourage them
to participate in the discussion.5. Tactfully tone down community members who tend to monopolize the discussion.6. Do not leave issues hanging. Carefully synthesize the discussion and clearly phrase the conclu
sions for approval.
the field (McCracken et al. 1988). As such, they describe information not easilyconverted or transformed into diagrams. Local folk relate best to stories andportraits as a way of describing their way of life.
Reporting and brainstorming
These tools are done all throughout the field activities to cross-check findings and review the methods and techniques used. Both reponing and brainstorming may also be used to monitor progress of the appraisal.
Mapping
Spot mapping or sketch mapping is a simple procedure of laying down onpaper the important features of an area, which can be related in spatial terms orreferenced geographically. Among these features are settlements, infrastructure and water bodies. The spot map must corroborate the map prepared during the earlier secondary data analysis, and portray the top view or aerial perspective of the study area (Fig. 6).
The spot map is useful in locating all households or clusters of householdsin a community. It can be used to select a random sample if necessary. ForRAFMS, maps are especially important in locating marine resources, fishingareas and gear, water transportation routes and fish landing facilities. This mapcan also be used to segregate the community according to ethnic group, clan,family, wealth, length of residence, etc. The main points to remember are(Townsley 1993b):
1. Maps made during a rapid appraisal do not need to be exact, but theyhave to be clear since they will be mainly used to represent issues or particular aspects of the community.
2. If good maps are available, trace an outline of the main features ofthe area being investigated, fill in the details and reproduce for team members.
29

1° Channel
Water Tem Ietower r\
---=====9==-~ 00PondI Cl Well
o 0 0: ga~ Partly constructed
Colony -~-~_~_:. n f1';"...., AO~o~y houseshouses ~ 0 \0 I V~.:~.2,f'\ ~t.-, -- Traditional
0010 \ r fl'"l,., "'~/'V': ~/ housesa 0 1 0 1 I 'I r. t\ " 11 1 /) IiI I [11'" f'\ \ f\ '-~~_Q~
Trees I I I '\ QIi 1'\ Q Q. q 19 \¢J Q Q Q
~.~ ...
Sea
Fig. 6. Spot map of Chinnamedu Village, Tamil Nadu, South India, prepared with the villagers (Townsley 1993a).
3. Prepare sketch maps based on information provided by local people,or ask the local people to prepare the maps themselves.
4. Don't try to get too much information into one sketch map.
Transect-making
A transect is a general reference line cutting across a representative portionof the study area (Sajise et al. 1990). In effect, the transect line is the side viewor cross-section of the site. Transects are both a way of representinginformation and a technique for familiarizing with the different parts ofthe community and the agricultural and ecological zones that make upthe area (Townsley 1993b). Among the advantages of a transect is thesimple portrayal of the resources present and the associated economic,social and environmental issues in spatial terms (Fig. 7).
The four simple steps to transect-making are (Sajise et al. 1990) :1. Locate a line that will cut across the study site.2. Superimpose along the transect line the critical biophysical infor
mation, such as slope, type of soil, marine habitats, etc.3. Indicate the major resource uses, such as farming systems and
fishing practices.4. Plot out the problems encountered.
30

Slope
Soil
General problems
1. Lack of productionimplements
2. Trade monopoly
3. Siltation
4. Lack of postproductionfacilities
5. Lack of capital
6. Lack of appropriatetechnology
7. Inadequate drinkingwater facilities
8. Lack of transportation andcommunication facilities
9. Poor health and educationalfacilities and services
Fishery problems
1. Declining fishel)' production
2. Illegal fishing
3. Freshwater flooding
4. Deposition of agriculturalchemicals
Agricultural problems
Saltwater intrusion
2. Forest destruction
3. Vulnerability of soilto erosion
Low soil fertility
Flooding
6. Tenurial status
7. Pest and diseases
Brushland
n u aung to fO 1"9 8-18 (I
It oamtosltcay
Forest
troog YfO m9 to mountain(>18%)
an y cay oam to cay
Fig. 7. Transect of Malampaya Sound, Palawan, Philippines (Pido et al. 1990).
31

In the case of a large gulf or bay where there is great variation interms of natural resource endowment or fisheries issues, several transectlines may have to be drawn to account for such variations.
Timelines
Timelines give a clear idea of what events in the past are consideredimportant and how they occur in a sequence (Townsley 1993b). Theycan be used to represent data provided by informants.
Calendars
Calendars show data relevant to fishing patterns and of labor throughoutthe year and food availability from different sources. Townsley (1993b)recommended these procedures on making calendars:
1. Find out how local people divide up the year, i.e., months, seasons,etc. Mark these divisions along the top of the calendar.
2. Focus attention on one particular aspect, e.g., time of access to fishing ground.
3. Plot responses on your calendar, or explain it to informants and getthem to plot the topics themselves. The calendar can be drawn on the ground.
HistoricaL transects
Historical transects consist of a series of transects that illustrate how aparticular area has changed over time. They show changes in land use indifferent zones along a transect or modifications in fishing practices throughtime. Transects are prepared as follows (Townsley 1993b):
1. Together with an informant, draw a transect through the area of interest. This can be derived from a more complete transect already prepared totag the agroecological zones (fishing zones in the case of RAFMS) in thearea. This can also be done from scratch.
2. Get the informant to describe what current conditions are like in eachzone or in particular parts of the transect.
3. Ask what conditions were like 10 years ago, 20 years ago and so on.4. Redraw the transect and strive to represent these conditions
schematically.
Process charts
Helpful in breaking down and analyzing important activities (Townsley1993b), process charts specify the people involved in activities and alternative
32

ways of doing these activities. They get respondents to focus on and explainfeatures of activities they might otherwise take for granted and not reveal tooutsiders. The charts are particularly good for analyzing economic activities,and attendant inputs and outputs. They are prepared thus (Townsley 1993b):
1. Focus the informants' attention on a particular activity.2. Ask them to describe in detail how the activity is carried out.3. If informants try to rush through the description superficially, stop them
and get them to describe in greater detail.4. For each step in the activity, ask what inputs are involved, the quan
tities required, cost per unit of input and the resulting product or products, ifany.
5. Mark each step down as a box in a process, with the inputs or outputsnoted beside it.
6. Work through the activity from beginning to end to get a completepicture.
Decision trees
Valuable in grasping resource management strategies of users, decision trees also unearth reasons why users take up or give up particulartechnologies (McCracken et al. 1988). These trees analyze factors influencing the local people's important decisions, thus clarifying their priorities. Forfishers, the trees are useful in illustrating their decisions on resource allocation and alternative or supplemental economic activities. Townsley (1993b)proposed that decision trees be created in two ways:
1. Start from a particular resource or activity and establish what alternatives are available. For example, point out different ways of using the sameresource or activity. Find out why people decide on one alternative or theother. For each alternative, find out what further choices are available andwhy people might choose them.
2. Start from existing practices, find out what alternatives are availableand what influences choices of alternatives. Work backwards through thevarious alternatives until the "original" resource and the decisions on its useare reached.
Venn diagrams
Venn diagrams can be used to show the relationships between differentgroups and organizations within a community (Fig. 8). Particularly useful inidentifying potential conflicts between interest groups, Venn diagrams alsoclarify roles of individuals and institutions. They are prepared based on data
33

Fig. 8. Venn diagram of institutions on Kampai Island, NorthSumatra, Indonesia (Townsley 1993a).
provided by informants about groups and institutions. Townsley (1993b)recommended that team members should find out, with care, sensitive information about leadership, membership, activities, decisionmaking processesand interaction or conflicts.
TOOLS ACCORDING TO GROUPS OF ATTRIBUTES
The six groups of attributes have their own matrices (see Appendices)where the field data collection techniques are identified, among other aspects.
Group I - Biological, physical and technical attributes
Matrix 1 lays out Group I's attributes and techniques for data collectionand validation. Much of the data for physical attributes may be generatedthrough resource mapping. Key activities include demarcation of study area,establishment of base map and preparation of different thematic maps. Theseactivities determine both marine and terrestrial extents of the study area.Since the focus of RAFMS is on the village level, maps of at least 1:50,000in scale are required. The base and working maps should have the samescale.
34

A thematic map displays selected information relating to a specific theme,such as land use, coastal habitats, slope, elevation and soil. These may bequalitative (e.g., land use) or quantitative (e.g., population density). The threerequisite thematic maps are land use, coastal habitats and transectlcrosssection. All or some may be sourced from government agencies.
A land use map refers to the actual land cover or any form of man's useof land, including special uses, such as built-up (settlement) and commercial areas or marginal lands. If this map is not available, the team can dospot mapping. A spot map is a sketch map that describes the area in termsof important features, such as roads, rivers, benchmarks, and natural orcultural landmarks. The team can determine distances with a measuringtape and geographical directions, i.e., east, west, north or south, with acompass. A spot map should be comprehensive in terms of all the characteristics of the area but clear enough to be understood by the users.
Land use must be viewed from a historical perspective. The guide questions for generating the elements of a land use map are given in Table 8.
A coastal habitat map shows the location of mangroves, coral reefs, seaweed/seagrass beds and other soft-bottom communities. It can be derivedfrom a topographic map or generated through spot mapping. The land useand coastal habitat maps may be also merged. A transect map is producedby plotting alongside environmental resources the various problems andopportunities existing in the study area. (See earlier section on general tools,p. 30, for a review of transect-making.) The other maps, which are ideal tohave on hand but are not obligatory, are the soil map, slope map and climatic map.
For the water quality attribute, water transparency and pollution levelindicators can be evaluated qualitatively. For example, murky waters indicate high suspended solids or a high silt load. The presence of floating solidwaste indicates poor domestic or industrial waste management in the area.
There are field techniques for assessing biological and habitat attributes,particularly major coastal habitats. For coral reefs, a rapid visual survey using the manta tow reconnaissance technique is recommended as the basicminimum in assessing the quality of coral cover. This technique enablesvisual assessment of large reef areas within a short time and is highly recommended for selecting sites for more detailed transect studies (Dartnal!and Jones 1986; English et a!. 1994). It is conducted by towing a snorkelerholding a manta board following the contour of the reef slope. The tow lastsfor two minutes at a speed of 1 to 1.5 knots (0.77-1.03 m/s). This reconnaissance technique allows the snorkeler to observe the coral community anddescribe it semiquantitatively by making estimates of the percentage cover
35

Table 8. Guide questions for land use.
I. Profile of the respondentsName:Position: (i.e., village captain, elder, key informant)Address (i.e., village, town)
Age:
II. Data/information neededA. General land use
1. When did you arrive in the area (year)? What were the original land uses in the area? Approximately, what is the area in hectares?
2. Has there been a change in the use of the land through time (the first time you arrived comparedto the present)? What are the changes?
B. Settlement pattern1. Was there a settlement already? Approximately, what is the area?2. Approximately, what is the present area covered by settlement?3. How fast is the expansion of settlement? What is the direction (i.e., lateral or along the shore, or
towards inland)?4. What is the previous land use of the area covered by expanded settlement (i.e., agriculture,
grassland, forest, etc.)?5. If the direction of settlement expansion is inland, do you clear the area (cut trees or clear grass
land) for settlement?6. What is the extent of clearing (area)?
C. Mangrove area1. Was there a mangrove area when you first arrived in the area? Approximately, how large is the
area? Describe the type (in terms of density and size of the tree). Where is it located?2. Are the mangrove areas still there? Have they changed in area coverage and type?3. Is there mangrove harvesting in the area? For what purpose, and what is the extent of harvesting?4. Is there mangrove reforestation in the area? Who conducted the reforestation activity? Who is
managing the reforestation area? What is the people's perception of mangrove reforestation?What are the benefits that the people can derive from mangrove reforested areas?
O. Agriculture area1. Is there any agricultural cultivation in the area? Where is it located? What type of crops are grown
in the area? Approximately, what is the area of each crop?2. In the uplands, is there also any form of cultivation? For what crops? What is the extent of cultiva
tion (in terms of area coverage) for each type of crop?
of live, dead and soft corals using these categories: 1= 0-10%; 2 = 11-30%;3 =31-50%; 4 =51-75%; and 5 =76-100%.
If time, equipment (i.e., SCUBA) and expertise are available, the moredetailed study using line intercept method and fish visual census describedby English et al. (1994) may also be done. These techniques will providemore reliable information on the percentage cover of living corals and relative abundance or density of reef fishes, respectively.
The manta tow technique can be employed also to check the extent orrelative cover of seaweeds and seagrasses. If time permits and expertise isavailable, the modified transect-quadrat methoddescribed by Saito and Atobe(1970) and English et al. (1994) can be used to determine the species composition or relative density of cover of both communities.
For mangroves, the transect line plot method described by Dartnall andJones (1986) should only be conducted in the absence of secondary data in
36

the study area and only if there is enough time. The method determinesrelative frequency, density and species diversity of mangroves. For eachsite, transect lines are drawn from the seaward margin of the forest at rightangles to the edges of the mangrove forest. Plots are established at 10-mintervals along a transect through the mangrove forest in each of the mainforest type or zone. The method provides quantitative descriptions of thespecies composition, community structure and plant biomass of mangroveforests.
The technical attributes indicate what type of overfishing occurs and towhat extent the study area is overfished. Table 9 presents an 881 guidequestionnaire for capture fisheries assessment. Done properly, the 881 cangenerate data about the major species harvested, fishing grounds, the numberof gear or fishers, and conservation awareness. It can also estimate fishingeffort (Table 10), seasonality of species by gear type (Table 11) and catchr.ate changes over time (Fig. 9). The focus should be on gear composition oflocal versus migratory fishers. 8ite inspection shall be undertaken to determine the use of destructive fishing methods.
Group 11- Market (supply and demand) attributes
Matrix 2 presents the market (supply and demand) attributes of fisheriesand the tools/techniques for data collection and validation. Market information and orientation will be gathered mainly through these field data collection techniques: 881, FGD, market visit, and temporal diagramming or combinations thereof.
For 881, only some questions and topics are predetermined, so probingcan be extensive. Probing refers to follow-up questions aimed at clarifying aprevious answer to a question or pursuing a previous topic. Individual respondents, key informants or groups may be interviewed. Attention must begiven to the selection of respondents, time and location of interviews. Table12 is a checklist of guide questions for market attributes.
The FGD for homogenous groups can be conducted to gather information on specific topics and problems. Groups then will have the opportunityto answer specific questions and issues peculiar to their group or sector.Table 13 is a summary of relevant fish prices volunteered by fish tradersduring an actual FGD. 881s and FGDs can be conducted for different typesof persons involved in fish marketing, such as fishers, wives of fishers, fishtraders, fish consumers, fish processors, boat operators, market agents,transporters and other market participants.
The market visit is an ocular inspection of relevant fish products andbyproducts in the marketplace. It is also a way of checking prevailing prices
37

Table 9. Guide questions for capture fisheries assessment.
Name of respondent: _
Barangay/village: Municipality/province: _Age of respondent: No. of years as fisher: _Fishing gear used: _
No. of hours spent using gear type:Departure time: Arrival time:Is the catch increasing or decreasing? _
Previous catch rate (per day trip): Year:Current catch rate (per day trip): _Reasons for change in catch rate: _
Are there changes in catch composition? _
Previous species caught (major species):Current species caught (major species): _Fishing areas of major gear (use base map): _
Is there a shift in fishing areas?Reasons for shift in fishing areas: _
Previous fishing areas (use base map): _
80-0- 70.>::-•>- 60ca"Cin 50.::.:::--..s::::: 40 Tuna(,)-ca
30 Roundscads(,)
Flying fishQ)C)
20ca...Q)
~ 10
0 1980 1990 1995
Year
Fig. 9. Trend of the catch rate of some species in Nolloth Village,Saparua Island, Indonesia (Andamaki et al. 1995).
38

Table 10. Estimates of fishing effort and season in Nolloth Village, Saparua Island, Indonesia, 1995 (Andamaki et al. 1995).
Gear type No. of units Species caught Seasonality Volume of catch No. of fish(months) (per day trip) days/month
Drift gillnet for flying fish 350 Flying fish Year-round 25 kg 20-25Half-beaks Year-round 15 kg 20-25
Drift gillnet 75 Indian mackerel Sep-Dec 35 kg 20-25(150 ind.)* <t!
Squid jigger 350 Yellow tail squids Jan-Apr 25 kg 20-25Oct-Jan (200 ind.) 20-25
v.> Handline I 100 Trevallies Year-round 510 indo 20-25
CD Handline II 1,000 Scads Year-round 100 indo 20Handline III 5-10 Tuna Dec-Apr 25 kg 20-25
(2 ind.)Troll line 1,000 Skipjacks Sep-Apr 25 kg 20-25
(10 ind.)Pole and line 4 Skipjacks Jun-Aug 500 indo 15-20Mini purse seine 4 Sardine Jun-Aug 250 kg 15-20
Scads Jun-Aug 250 kg 15-20Beach seine 3 Anchovy Year-round 25 kg 20-25Cast net 7 Anchovy Year-round 20 kg 20-25
*Ind. - number of individuals.

Table 11. Seasonality of species by gear type in Binunsalian Bay, Palawan, Philippines, 1995 (Sta. Cruz et al. 1995).
:>------------ --------Gear type/species
Kawil (Hook and line)Bisugo (Threadfin bream)Salimburao (Mackerel)Lapulapu (Grouper)Salay-salay (Crevalla)
J F M A M J J A S o N o
~ XXXXXXXXXXXXXXXXXXXXXXXXXXXXXXXXXXXXXXXXXXXXXXXXXXXXXXXXXXXXXXXXXXXXXXXXXXX
:>------------------------------Sapsap (Slipmouth)Salmonete (Goatfish)Salimbarao (Mackerel)Salay-salay (Crevalla)Matang baka (Big-eyed scad)Talakitok (Long-finned cavalla)
Lambat (Gillnet)Bisugo (Threadfin bream)Isdang bato (Parrotfish)Dalagang bukid (Fusilier)Lapulapu (Grouper)Banak (Mullet)
~o
Danggit, Samaral (Rabbitfish)
Pana (Speargun)Isdang bato (Parrotfish)Lapulapu (Grouper)Maya-maya (Snapper)
~ XXXXXXXXXXXXXXXXXXXXXXXXXXXXXXXXXXXXXXXXXXXXXXXXXXXXXXXXXXXXXXX
Gear operation _
Species seasonalityPeakLean - - -No seasonality XXXXX

Table 12. Guide questions for the market attributes.
SupplyWhat types of fish are caught?When (what months) is fishing prevalent?Where are the different kinds of fish caught?What are the types of fish sold?Where are the different types of fish sold?
PricingHow much do different classes of fish cost at the time of harvest?How much do different types of fish cost in the market?How are fish products priced?What other factors influence fish prices?What are the types of fisher-buyer relationships in the village?Are the fish prices affected by changes in prices of substitutes, such as pork?
Market functionsHow is the fish catch handled?How is the fish catch packaged?How is the fish catch stored?How is the fish catch transported?Are fish graded/classified? How?Are fish processed? How?What are the marketing facilities, e.g., transportation/road networks, landing sites, port areas?
Market rulesAre there fees for landing the fish at the port?How much has to be paid for fish landing?What are other restrictions or rules in fish trading?
Stability of demandIs the demand for fish and other marine products changing?What are the reasons and patterns of change?Is there a change in dietary preferences?What is the rate of substitution?
Market structure and orientationWhat are the types of fishers, e.g., municipal, commercial?How many fishers are there in the village?How many of the fishers are residents of the village and how many are not (i.e., migrant fishers)?At the local market, what is the ratio of direct buyers (consumers) to traders?How many fish traders are there?How does the fish catch reach the market? How many channels do they pass?Where are the markets? (e.g., local, city, provincial/regional, national, international export, etc.)Where are the fish traders from?How is price information disseminated?Are there traditional marketing arrangements? Is there a credit-marketing relationship between fish and
fish trader?What are the problems in marketing of fresh fish?What are the constraints in marketing other fish products?
41

Table 13. General price levels of fish and marine products by channel and grade in Binunsalian Bay,Palawan, Philippines, 1995 (Sandalo et al. 1995).
Type/class of fish Price range per kilogram (in pesos)
Fisher to consumer Fisher to fisher trader
1st2nd3rdOthers: squid, octopus, cuttlefish
US$1.00:= P26.02 as of March 1996.
20-2515-2010-1520-25
4025-3015-25
40
of fish products, both wholesale and retail. This visit also helps analyze themarketing process as well as market structure and orientation.
Effective in gathering market information, temporal diagrams are graphicdepictions of data on various topics, issues and concerns along the temporal dimension.
Group 11/ - Fisher. stakeholder and community attributes
The attributes offishers and community stakeholders and tools/techniquesfor data collection and validation are plotted out in Matrix 3. Vital informationon these characteristics are gathered mainly through 881, FGD, house orhome visit, temporal diagramming, resource mapping, and walk-through andboat ride.
The 881 is used with individual and group respondents according to theprocedure already explained in the section on Group II attributes. A guidequestionnaire on the characteristics of fishers, stakeholders and the community is given in Table 14.
The FGD is used for gathering information from groups of persons whoare expected to share common knowledge on specific issues. A summary ofrelevant information, which can be obtained during an FGD, is shown inTable 15. 881s and FGDs will be conducted for different types of stakeholders,e.g., coral reef fishers, fisher-farmers, women, youth, elders, traders, migrant settlers, local government officials and others to determine, amongother things, ecological knowledge.
The house/home visitis an ocular inspection of the type of dwelling placeof local folk, their real properties and assets. This also gives the researchera good chance to observe the way of life, traditions, family activities andsocial structure prevailing in a given community. Usually, a visit can be combined with an 881.
42

Table 14. Guide questions for the characteristics of fishers and community stakeholders.
DemographyWho is the oldest resident of the village? When did he arrive there?Are the local folk original inhabitants of the place or not?If migrants, where did they come from? When did they arrive?Are there schools in the village?Do the children and youth go to school?What is the prevailing religion? What are the other sects?What is the average family size?
Tenurial statusDo people own real properties? How about their home lots?What are the eXisting tenurial arrangements?Are there property rights in fishing areas?Do local fishermen establish boundaries in their fishing areas?
Economic statusWhat types of dwelling places exist in the village?What other assets, i.e., furniture, appliances, are commonly owned by the residents?What fishing gear, i.e., boats, engines, nets, do residents own?
CultureWhat special occasions are observed by the local folk?What beliefs, superstitions, practices do the fishersllocal folk adopt in relation to fishing?What are the people's pastimes and recreational activities?
LivelihoodWhat is the main source of livelihood and income?What are other alternative or supplementary sources of income?How many families/households depend on fishing for their livelihood?What is the proportion of the population dependent on other types of livelihood?
Attitudes/outlookHow do the local folk perceive the future of fishery resources?How do the local folk perceive their livelihood in the future?How do the local folk value cooperative action and community projects?How do the local folk identify with the larger community, i.e., town, province?Are community members concerned about the sustainability of resource use?What are their attitudes towards risk?
Resource use/harvesting conflictsAre there conflicts in the fishing activity and use of other marine resources?What is the nature of these conflicts (gear, space, organization)?How are conflicts resolved? Are there informal ways of resolving conflicts?
Ecological knowledgeDo the resource users have indigenous or traditional ecological knowledge of the fisheries and coastal
resources?Is the traditional ecological knowledge passed through generations?Is this traditional ecological knowledge compatible with conventional science?How does ecological knowledge relate to the conservation of marine habitats?
CommunityWhat are the housing/settlement patterns?What are the services available in the community, e.g., health, physical infrastructure, communica
tions?What is the type and structure of formal political system? What are the linkages between formal and
informal governance?
43

Table 15. An example of comparative socioeconomic characteristics offishers/stakeholders in Manaboreand Tarunayan, Ulugan Bay, Palawan, Philippines, 1995 (Sibal et al. 1995a).
Attributes Indicators Manabore Tarunayan
LJ demography · age - new settlers; more of - more of old populationyoung population
experience experience carried over from - experience carried over fromin fishing previous place of residence previous place of residence
· length of - since 1987 - since 1957residencefamily size - 4-5 members - 7 members
· religion - Pentecostal, Oneness - United Church of Christ inwith Christ the Philippines, Evangelist,
Roman Catholicethnicity - Leyte, Cebu, Masbate - Bohol, Cebu, Samar, Iloilopopulation - with first-generation settlers - more dense (man-land ratio)
compared with Manabore
LJ tenurial status land claim - squatters in the area but they - unwritten land claimsare not threatened (withrelocation)
· fishery claim - fish cages/corrals; areas - fish cages/corrals do notbased on unwritten agreement exist in the areabetween operators
- they were not issued permits - hook-and-line fishers canby the city government for the fish anywhereprevious and current years
Temporal diagramming for Group III attributes is best illustrated by Table16, a timeline. A chronology of significant events in the history of a community, a timeline is constructed together or in consultation with the local folk. Itis ideally composed for specific events, such as migration patterns, population changes, livelihood changes, establishment of schools, social infrastructure, industries, political history of village, etc. Resource mapping can beused to determine resource use/harvesting conflicts.
The walk-through and the boat ride should be done in tandem to complement other activities of field data gathering. Going around the village andthe relevant fishing areas presents a broader perspective of the developments in the community, e.g., the social infrastructure present; the sociocultural, political and religious activities in the area; and the state of the naturalresource base. These techniques are also useful in observing the local folk'slivelihood activities, including fishing, which is important to the communityprofile.
Groups IV and V - Local and external institutional arrangements
Matrices 4 and 5 are outlines of the attributes of Group IV's local andGroup V's external institutional arrangements as well as of the tools for data
44

Table 16. Timeline of Nolloth Village, Saparua Island, Indonesia, 1517-1995 (Hiariey and Kinseng 1995).
Year
15171603165217691860
1950s
1960s
19641970s
1977
1980s
1985
1986
1987
1990s
19931994
Event
Move from Nolloth and Hatarena to Air Ratu.War against the Dutch colonials.Move to Hatawano Bay (the place of Nolloth Village now).Construction of the Traditional Assembly Hall.Building of the church.Modernization of fishing tools (outboard motor and monofilament [tasi]).Establishment of cooperative at village level (KUD).Start of Asphalt Nolloth-Saparua road construction.Introduction of public electricity.Start of operation of public transportation (cars).Division of State Primary School (SDN) into two (SDN 1 and SDN 2).More motor boats.Coming of two Chinese traders.Construction of a primary school.Building of more small shops (warung).Completion of Asphalt Nolloth-Saparua road.Construction of more houses made of cement.Building of village office.More televisions.Entry of more clove traders.More skipjack motor boats.Installation of electric posts along roads.Exclusion of the traditional leader (Kepala Soa) from the formal village organizationalstructure.Mechanization of sagu (palm) production.Abolition of sasi auction.Transmigration of Seram Island.Decline of clove prices.Impact of logging industry in Seram Island felt by fishers.Cancellation of church sasi.Conduct of land titling through Prona program.Two fishing boats owned by a Chinese businessman are operated by villagers.Building of canning factories near the village.Purchase of a fishing motor boat (an inboard) by the Village Cooperative Unit (KUD).
collection and validation. Tables 17 and 18 provide guide questions for GroupsIV and V's data generation.
Both groups generate data using the following steps, which are not necessarily sequential:
1. Identify all the existing "village-level" institutions and organizationswithin the study area for Group IV and all the institutions above the villagelevel for Group V.
2. Concentrate on institutions associated with fisheries or CRM. Forexample, Table 19 presents a list of livelihood associations around UluganBay in Palawan, Philippines. Offhand, it can be deduced that only threeorganizations are in one form or another involved in fisheries. Hence, datagathering can be focused on their members.
45

Table 17. Guide questions for the local institutional arrangements.
o Individual organizations
What village-level organizations exist in the area?Which are engaged in marine fisheries or CRM?Which are formal (legally recognized) groups, and which are informal?For formal groups, to which category do they belong: (1) LGUs, (2) NGOs,(3) POs, (4) private interest
groups and (5) others?What are the organization's mandates or objectives and administrative structure?How long has the organization been in existence, and what is its historical development?Is the membership increasing or decreasing?What are the organization's technical, manpower and financial resources?How is the organization affiliated with other organizations vertically and horizontally?What is the members' awareness of the conditions of the fisheries/marine resources?
o Local institutional arrangements
What are the property rights in terms of access, withdrawal, management, exclusion and transfer?What are the operational rules that pertain to boundary, allocation, authority and equity?What are the regulatory mechanisms (e.g., quota, closed season, etc.) and incentives (e.g., taxation,
licensing, etc.)?What are the collective choice rules, such as adjudication and enforcement?How is the rulemaking body formed in terms of leadership, membership and representation?What are the boundaries (i.e., political, gear type, traditional/customary, organizational, physical), their
size/clarity, ownership, geographical coverage and changes over time?
Table 18. Guide questions for the external institutional arrangements.
o Individual organizations
Which organizations existing in the area are above the village level?Which are engaged in marine fisheries or CRM?Which are formal (legally recognized) groups, and which are informal?For formal groups, to which category do they belong: (1) LGUs or other state-level bodies, (2) NGOs, (3)
POs, (4) private interest groups, and (5) NGAs and other regional agencies, (6) bilateral/regional bodies, (7) international agencies and (8) others?
What are the organization's mandates or objectives and administrative structure?At what level does the organization operate: (1) international, (2) regional, (3) national/central, (4) re-
gional, (5) province/state, or (6) district/municipal/town?How long has the organization been in existence, and what is its historical development?What are the organization's technical, manpower and financial resources?How is the organization affiliated with other organizations vertically and horizontally?What is the organization's awareness of the conditions of the fisheries/marine resources?
o External institutional arrangements
For the relevant organizations, what are the formal policies, programs, regulations, laws and legislationrelated to fisheries and CRM?
How do these national policies, programs, regulations, laws and legislation affect fisheries and CRM atthe local level?
How do the other national policies, programs, regulations, laws and legislation on economic developmentand general public administration affect fisheries and CRM?
How is each organization affiliated with other organizations vertically and horizontally, or arranged interms of nested layers with other formal or informal organizations?
46

Table 19. Livelihood associations around Ulugan Bay, Palawan, Philippines (Sibal et al. 1995b).
~-....I
Name of association
1. Umulagan Community Development Association2. Bahile Central Multi-purpose Association3. Dedicated Farmers Association4. Pag-asa Women's Association5. CEP Supporters' Association'6. Samahang Kababaihan ng Manabore7. Masaya Rice Trading Association8. Samahang Pangkabuhayan at Kaunlaran ng Bagong Sikat9. Baruang Livelihood Association10. Samahang Kapatiran ng Dacolanay11. Madahon Sari-sari Store Association12. Buenavista Centro Livelihood Association13. Tagabinet Valley Association14. Nasuduan Fishermen's Association'15. Makirawa Fishermen's Association'16. Nag-iisang Samahan sa Tagnipa
, With bearing on fisheries and CRM.
Project
Peanut productionPeanut productionPeanut productionRice tradingDrugstore and fishing supplyCommunity storeRice tradingCommunity storeCommunity storeGoat-raising and rice tradingCommunity storeRice tradingSugarcane millingFish corralSnack barAgricultural supply
No. of members
15131014236
2221
812171823111211
Barangay/village
BahileBahileBahileBahileBahileBahile
MacarascasMacarascasMacarascasBuenavistaBuenavistaBuenavistaTagabinetTagabinetTagabinet
Cabayugan

3. Classify the relevant organizations into clusters. For Group IV, theseare village-level government agencies; NGOs primarily involved in the delivery of projects; local people's organizations (POs), the primary beneficiariesor recipients of projects; private interest groups, which include middlemen,traders and money lenders; and other cultural/societal organizations, whichinclude the religious sects, sociocultural groups and other traditional organizations.
Group V's clusters are the LGUs or other state-level bodies; NGOs; POs;private interest groups; national government agencies (NGAs) and otherregional agencies; bilateral and regional bodies; international agencies andothers.
4. Identify the appropriate indicators from data gathered from organizations' records or from interviews with their officers or members.
5. Construct Venn diagrams to illustrate interaction and relationshipsamong various groups. If applicable, use plus and minus signs (+ and -) toindicate positive or negative relationships.
6. Construct a network chart of organizations at the village level for GroupIV and at the municipal level and above for Group V. In addition, connectGroup V organizations with Group IV's village-level ones. The nested organizational and institutional arrangements for Binunsalian Bay, Palawan,Philippines, are shown in Table 20.
7. For Group IV only, plot in maps relevant boundaries: political; geartype; individual or organization; traditional/customary; natural; as well asother social ownership-constructed boundaries. If possible, illustrate the trendover time.
8. Enumerate and qualify local-level systems of rights and rules, bothformal and informal, that govern resource use. Table 21 lists local-level systems related to the use of artisanal fishing gear in Manabore, Palawan, Philippines.
For Group V, detail the formal systems for resource use.9. Illustrate the conflict-resolution mechanisms at the local level for Group
IV and at higher levels for Group V. Fig. 10 shows the conflict-resolutionmechanisms in Tarunayan, Palawan, Philippines.
Group VI - Exogenous or external factors
Matrix 6 delineates the attributes that relate to external factors and thetools/techniques for data collection and validation. External factors are thosebrought about by natural occurrence or human intervention. Table 22 drawsup the guide questions for data generation.
48

~CO
Table 20. Nested organizationallinstitutional arrangements for Binunsalian Bay, Philippines (Cabrestante et al. 1995).
Administrative NGAs LGUs NGOs POslevel
National o DENR o DECS o DAR o DOJ (BOC) o National government - -
Provincial o PENRO o Division o PARO o IPPF o Provincial government - -
Municipal o CENRO o District o MARO o Sta. Lucia o City government - -subcolony (Bantay Puerto)
Village o Elementary! o Mangingisda o Ligaya ng o Christianhigh school Barangay Council Buhay Multipurpose
o Binunsalian Bay CooperativeFoundation, Inc. o Barangay
MangingisdaSenior Citizens'Association
o Charity Women'sAssociation
o SAMAMUCOo LUZMA
Purok - - - - o Subvillage (purok) - -council (7)
- Puting Buhangin- Rolling Hills- Pantalang Bato- Magsasaka- Bagong Silang- Paglaun- Magtulungan
BOPCENRODARDECSDOJPPF
Bureau of PrisonsCommunity Environment and Natural Resources OfficeDepartment of Agrarian ReformDepartment of Education, Culture and SportsDepartment of JusticeIwahig Prison and Penal Farm
LUZMAMAROPAROPENROSAMAMUCO
Luzviminda Mangingisda Ministerial FellowshipMunicipal Agrarian Reform OfficeProvincial Agrarian Reform OfficeProvincial Environment and Natural Resources OfficeSamahan ng Mangingisda at Magsasaka MUltipurposeCooperative

Table 21. Informal rights-and-rules system in the use of artisanal fishing gear in Manabore, Palawan,Philippines.
1. Fish corrala. Gillnetters must stay 10m away from the entrance of fish corrals.b. The number of fish corrals inside Manabore Bay should be limited to 13 units.c. Permission must first be secured from existing owners of fish corrals before a new one is constructed.
2. Gillneta. In case of gillnet crisscrossing, the fisher who owns the topmost net should be the first one to remove it.
The fishers should work down to the bottom net.
3. Hook and linea. No rights and rules exist. The open-access system is practised.
4. Fish aggregating devices (FADs)a. Hook-and-line fishers can fish near FADs provided previous permission is given by the owners.
Village captain tor chief
~,
r, ,
Village councilmember or
other respectedperson
Subvillage (purok) ,;~president ,;
,;
r~, , ,
Elder
Individual t ,;~,;
,;
.. = formal
--------~ = informal
Fig. 10. Conflictresolutionmechanisms inTarunayan,Palawan, Philippines (Sibal et al.1995b)
50

Table 22. Guide questions for the exogenous attributes.
U Natural calamitiesDo natural calamities, such as floods, droughts and earthquakes, occur in the area?
U Macroeconomic/political/sociocultural factorsIs there an ongoing war or an armed conflict?Has there lately been dramatic changes in the political leadership or agenda?Is there rapid growth in industrial or commercial development?Are there new technological innovations related to harvesting and processing of fish and other ma
rine products?What are the impacts or implications of international agreements on fisheries (e.g., the General
Agreement on Tariff and Trade on trading of fisheries products, disputes related to the ExclusiveEconomic Zone)?
Is the current inflation beneficial or harmful to the trading of fisheries products?
Step 4. Preliminary analysis of data
Preliminary analysis pertains to on-field data analysis. At the end of eachfield day, the team leader convenes the members. The chief objective is toevaluate the progress of field data collection activities and make the necessary adjustments in terms of data collection or other administrative arrangements. Team members report or present their findings orally, preferably withthe aid of tables, figures and charts, either individually or as a subgroup.
During this session, the primary data collected shall be used to validateinformation generated during the secondary data analysis (Step 1) and reconnaissance survey (Step 2). For instance, the kinds of artisanal gear being used, identified from secondary literature (Step 1) and annotated fromthe field checklist (Step 2), shall be verified. The three sources of data setsassembled at this stage are: (1) secondary literature, (2) direct observationand (3) interview. In effect, the process is triangulation "whereby one checksthe validity of data using at least three sources of information or methodologies" (Sajise et al. 1990).
This preliminary data analysis is a team exercise. In RAFMS, the datashall be analyzed mainly through combinations of lAD and AEA (Conway1985, 1987). The lAD framework focuses on institutional arrangements, setof rights and rules by which a group of fishers and government organizeresource management and use in collective action situations. This framework provides for a structured approach to documenting and evaluating theorigin, current status, operation, impact and performance of fisheries management institutions.
With the lAD framework, the essential elements of the action situationare identified and examined. Information on key attributes (Table 1) thatcharacterize the collective action situation is collected and organized. Thesecan be used to describe and analyze other situations, conduct a systematicand comparative analysis of diverse situations and identify relationships
51

among variables. Although it can be used to investigate causal relationships, the lAD framework is not a causal input-output model. Rather, it is amethod for arranging information logically, examining relationships amongattributes, and considering or describing outcomes. It can also be applied todifferent situations at varying levels of complexity and completeness(Oakerson 1992).
In this framework, contextual variables characterizing resource and userattributes are linked with the local fisheries management's institutionalarrangements. A causal relationship can be inferred among contextualvariables, institutional arrangements (around which the analysis is based)and the resulting transactional (action) situations (Fig. 11).
The local institutional arrangements, structured by contextual variables,shape the incentives and disincentives users face as they coordinate, cooperate and contribute to resource management and use. The incentives, inturn, shape the patterns of interaction that result when resource users selectand implement fishing strategies. These interactions give way to outcomesthat, in turn, affect other outcomes. Time is a critical element. All the contextual variables can change through time. This change causes variations ininstitutional arrangements which influence incentives, patterns of interaction and outcomes.
The users of fisheries resources often develop rules to establish howrights are to be exercised, e.g., harvesting rules. Rules give substance torights, structure a situation, define the behavior of group members and reduce conflict. They create different incentive structures that have bearing oncooperation or conflict among fishers. They structure human behavior intofour categories: compulsory, permitted, authorized and nonauthorized(Thomson 1992). The types of rules that are devised will depend on theseverity of the fishers' problem, the level of information they possess, theextent of the bundle of rights they hold, sociocultural traditions, the level ofopportunistic behavior, and the ease with which actions can be monitoredand enforced. Rules can provide stability of expectations, and efforts tochange rules can rapidly reduce their stability (Ostrom 1990). The institutional arrangements fishers develop and use may not always be the sameas formal laws and regulations. The fishers may develop arrangements thatmeet their needs but are not recognized and legitimized by government.These informal rights and rules may be equally or even more important andcredible to local fishers than formal fisheries laws and regulations.
In analyzing institutional arrangements, the basic strategy is to dissectthe parts of the action situation-contextual variables, incentives, pattern ofinteractions and outcomes; identify and collect data on the attributes and
52

(J1UJ
Exogenousattributes:
macroeconomic,political, social
and natural
L_
Fisher!community
level
Outsidefisher!
communitylevel
Group I
Biological, physical,technological
attributes
Group II
Market(Supply-demand)
attributes
Group III
Attributes of fishers,stakeholders,
community
Group IV
Group V
External institutionaland organizational
arrangements
Incentives tocoordinate,cooperate
andcontribute
-.--~-
-I
1
1
Patterns of~interactions
among Outcomesresource
~users -
Fig. 11. A research framework for institutional analysis (adapted from Oakerson 1992).

conditions of each part; and examine the relationships between and amongthe attributes and conditions of each part. Relationships between and amongparts are examined when the action situation is dissected. Each part of theframework has a causal or feedback relationship with other parts. Biophysical and technical attributes can have a direct effect on outcomes, for example, as high levels offishing effort can lead to overexploitation, regardless ofwhether or not institutional arrangements are in place. Institutional arrangements, on the other hand, have an indirect effect on outcomes as they leadto changes in human behavior and choice, which affect interactions andoutcomes (Oakerson 1992). Different combinations of these parts can beexamined depending on the situation. These relationships can be analyzedforward or backward depending on the use of the framework, i.e., as anevaluative, diagnostic or design tool. Explicit and implicit assumptions aboutthe relationships help structure and guide the analysis.
In the case of AEA, four patterns will be determined: space, time, flowand decision.
Patterns in space may be revealed through overlays and transects. Overlay mapping is done to discover patterns, problems or relationships of thearea in terms of physical characteristics. It may be done manually or byusing a computer. If you are doing manual overlay, maps of the same scaleshould be prepared (transparency for small maps and Mylar for big ones)either by reducing or enlarging them with a pantograph. Once the mapshave the same scale, a light table is needed to lay the different thematicmaps on top of each other. Areas with homogeneous characteristics will bedelineated and this is called land mapping unit. The delineation is necessaryin describing the area in terms of resources and other features. If you areusing the geographic information system (GIS), maps need not be on thesame scale because the digitizing step will take care of standardizing thescale. GIS refers to an automated computer-based information system thatuses geographically referenced information for decisionmaking. It is an integrated information system management that has the capability to store, edit,update, process, analyze and display spatial data for a particular set of purposes. What makes GIS different from other information systems and computer-aided design (CAD) is its ability to treat data together with its geographic position, topological description and attributes. Spatial data are commonly referenced to a location on the earth's surface through a syst~m ofcoordinates, i.e., the x and y values. These coordinates may be local, national or internationally accepted projections.
Patterns in time may be reported using timelines. As the term suggests,the reference is time or the temporal dimension. In the case of marine
54

fisheries, it is usually a graphical combination of climate, gear, species caughtand relevant socioeconomic variables (see Table 11).
Flow patterns may be used to illustrate the flow of the major productsharvested. They provide an idea on where the agricultural produce is goingand by how much. Among the questions that need to be answered for fisheries are: What are the economically important species being harvested?Where do these products go or where are they marketed? Who benefits,and what is the relative distribution?
Decision patterns depict the options or alternative courses of actionsthat the fishers can undertake. Among the key questions that must be askedare: What makes fishers engage in fishing as their primary occupation? Whatare their alternative livelihood options if fishing is no longer economicallyviable? The factors identified may be used to formulate strategies as development entry points to attain sustainable management of coastal fisheries(Fig. 12).
Venn diagrams may be used to illustrate the interaction and relationshipbetween groups, institutions and individuals in the community (Townsley1993b). The size of the circles may indicate their relative size, degree ofimportance or overlap. Venn diagrams are particularly essential when doinginstitutional analysis (see Fig. 8).
The various management issues or problems identified may be presentedin a matrix format. Table 23 is an array of problems, perceived solutions andproposed projects for Malampaya Sound in Palawan, Philippines. Solutionsperceived by the community are expressed as broad action strategies. Theaim of the matrix is to show possible solutions to various issues identified ina "problem-perceived solution-proposed project" format.
The proposed projects have research, development and policymakingimplications. As described earlier, RAFMS aims to furnish the "entry points"for appropriate institutional, development and research interventions. In thecase of fishery problems, the resource inventory of fishes and marine habitats is a research project. The acquisition of patrol boats is a developmentproject. The communal fishing ground management, however, requires institutional strengthening.
Step 5. Initial organization of results
The results of RAFMS must be organized in "synoptic formats," such astables, figures, charts and matrices. Constructed on a daily basis, theseshould be written prior to community validation to ensure that primary data
55

O'J(J)
Reasons
· illegal fishing
· natural calamity
· lack of capital
· spoilage
• declining catch due to increasedfishing pressure
· bad luck
· low prices
· lack of implements
· high operating cost
No I I • vices
• big family
Alternatives
• hired laborI I. farming (during bad weather)
• poultry/livestock• trade• gathering of minor forest products
Reasons
fast returnsno farmlandskillsneeds less capitalopportunity for high incomeaccessibilitygood fishing grounds
Is incomeenough?
Ababy purse seine
gillnetfish corral
crab pot
~ GM' I~::::::__Iiftnet
purse seine
Fig. 12. Decision pattern forfishing as an occupation in Malampaya Sound, Palawan, Philippines (Pidoet al. 1990).

Table 23. Matrix of agricultural and fisheries problems, perceived solutions and proposed projects forMalampaya Sound, Palawan, Philippines (Pido et al. 1990).
Fishery problemsDeclining fishery production - Conservation of resource base
Problems
Agricultural problemsSaltwater intrusion
Forest destruction
Vulnerability of soilto erosion
Low soil fertility
Flooding
Tenurial status
Pests/d iseases
Illegal fishing
Freshwater flooding/siltationDeposition of agriculturaleffluents
Perceived solutions
- Building of dikes- Conversion of ricelands into
fishpondsllivestock areas- Introduction of saltwater
resistant rice varieties- Forest protection
- Introduction of appropriate farming
- Enhancement of soil fertility
- Forest protection
- Land titling
- Introduction of appropriateagricultural technology
- Review and enforcementof existing fishery laws
- Forest protection
- Monitoring of chemical
Proposed projects
+ Feasibility study on dike construction+ Feasibility study on the economics
of converting ricelands intofishponds/livestock areas
+ Pilot-testing of varieties+ Upland stabilization project+ Hillside farming+ Integrated social forestry (ISF)+ Application of sloping agriculture
land technology+ ISF+ Introduction of organic farming+ Provision of fertilizer subsidy+ Riverbank protection+ Reforestation+ Land survey and titling+ Land stewardship contract+ Integrated pest management
+ Resource inventory of fishes andmarine habitats
+ Application of new fishing technologies for mariculture/aquaculture
+ Acquisition of patrol boats+ Environmental education+ Communal fishing ground manage-
ment+ Reforestation+ ISF+ Monitoring/evaluation of key chemi
cal parameters in selected sites
or field notes do not get lost, and that relevant field insights are still fresh inthe minds of the researchers.
The most important thing is to come up with a written outline of the itemsto be prepared. It shall serve as a guide for draft report writing and duringcommunity validation. As a rule, each diagram, figure, chart or matrix shouldbe accompanied by bullet statements or notes. This activity may have to beparceled out among the team members.
At this stage, the summaries and their accompanying bullet statementsare drafted mainly from the twin perspectives of RAFMS practitioners andlocal researchers. The viewpoint of the fishing community is yet to be integrated.
57

Step 6. Community validation
The results of RAFMS (from secondary data analysis through field datagathering) will have to be validated with the members of the target community to come up with a synthesis or a "triangulated" perspective, i.e., theRAFMS practitioners, the local community and the local researchers as earlier depicted in (Fig. 2). It must be stressed to the members of the community that they are co-owners of the results of the study, which they can usefor local-level planning and project development. The co-ownership of theresults becomes an incentive for them to participate in the process. Thecommunity's verification of the results is an essential condition of the finalreport writing. The elements to be validated include facts and interpretation.
The presentation of the results should be made simple and translatedinto layman's terms, whenever possible. Although achieving a consensus isideal, the more important thing is for the community members to be moreaware of their problems and opportunities as they relate to the managementof their fisheries resources. Consensus may not be desirable or even realistic at the whole community level. Among subgroups of the community, itmay be possible to gain consensus. It may be equally important to document differences among groups. At this juncture, these members can alsofill in some of the data gaps and give recommendations on the issues andproblems in their community.
There are two ways of validating the results. First, invite only the keyleaders and selected respondents of the community as was done in theconduct of RAFMS in the village of Nolloth, Saparua Island, Indonesia. Second, invite the whole community to one large forum as was done during theconduct of RAFMS in several coastal villages in the Philippines. The choiceof community validation option depends on the political and social climate ofthe community. Community validation may also follow Table 7's seven stepsto conducting FGDs.
Step 7. Final report writing
The final RRA report should be written immediately after the validation.The report should incorporate the necessary corrections and recommendations of the target community. Table 24 presents a suggested contents pagefor the RAFMS report.
The research team should promptly furnish copies of the report to thecommunity, other relevant local government agencies or users. The report
58

Table 24. Suggested contents page of a RAFMS report.
Executive Summary
PreliminariesList of TablesList of FiguresList of Acronyms and AbbreviationsList of Appendices
Background Situation/Area ProfilePhysical AttributesBiological AttributesTechnical Attributes of FisheriesMarket (Supply and Demand) AttributesCommunity AttributesLocal Institutional Arrangements
Cooperatives and other village-level organizationsRights-and-rules system
External Institutional ArrangementsOrganizations above village levelNational fisheries policyNational government management system
Exogenus Factors
Analysis and Diagnosis of the Study AreaInstitutional Analysis of Fisheries Management SystemsPattern Analysis
Patterns in spacePatterns in timeFlow patternsDecision patterns
RecommendationsPolicy/Planning AgendaResearch AgendaDevelopment Agenda
Acknowledgements
References
Appendices
may be transformed into other documents, such as policy papers, background papers for project development or references in preparing projectproposals.
59

Afterword
The RAFMS is among the pioneering attempts to develop a rapid appraisal guide that is specific to fisheries. Among its unique features is theadoption of lAD as the main analytical framework. The other innovations ofRAFMS are the: (1) active roles of the resident researchers and members ofthe local community; (2) attempts at generating quantitative data; and (3)use of quick biological assessment techniques.
The RAFMS has undergone field testings at various coastal sites in thePhilippines and Indonesia. Many of the cited tables, figures and charts wereextracted from these exercises. Nonetheless, there is still room for refinement or simplification. The users are encouraged to write the authors abouttheir RAFMS experiences, both positive and negative. These would be extremely helpful in revising future editions.
60

Acknowledgements
This handbook was prepared as part of the Fisheries Co-ManagementResearch Project funded by the Danish International Development Assistance (DANIDA).
The authors wish to acknowledge the invaluable help extended by theseindividuals and institutions in the preparation of this handbook:
Research collaborators in Palawan, Philippines, include Ms. Adel Sandalo,Mr. John Ponti lias, Mr. Madrono Cabrestante, Jr., Mr. Bob Tubac and Ms.Rosanna Felizarte of the Palawan Council for Sustainable Development Staff;Ms. Divine Sibal, Mr. Mansueto Sibal, Ms. Doris Labrador, Mr. Ruben Padonand Mr. Bryan McCullough of the Ulugan Bay Foundation, Inc.; Mr. ErnestoSta. Cruz, Mr. Lemuel del Valle, Mr. James Viernes and Mr. Ariel de la Torreof the Binunsalian Bay Foundation, Inc.
Research collaborators in Jakarta and Ambon, Indonesia, include Dr.Victor Nikijuluw, Ms. Retno Andamaki and Mr. Bambang Irianto of the Research Institute for Marine Fisheries; Mr. Johanis Hiariey of Patimura University and Mr. Rilus Kinseng of Institut Pertanian Bogor.
The experts in rapid appraisal techniques or participatory research methods who reviewed the various drafts and provided useful insights are Dr.Philip Townsley of Italy; Dr. Richard Pollnac of the University of Rhode Island, USA; Dr. Cora Lamug of the University of the Philippines at Los Banos,Philippines; Ms. Britha Mikkelsen of COWlconsult, Denmark; and Dr. HalMcArthur of the University of Hawaii, USA.
Our research colleagues and friends, Mr. Renato Agbayani of the Southeast Asian Fisheries Development Center and Ms. Cristi Marie Nozawa ofthe Haribon Foundation for the Conservation of Natural Resources, alsoprovided helpful comments.
At ICLARM, our colleagues Mr. Gerry Silvestre and Ms. Abbie Trinidadreviewed the drafts and participated in internal discussions. Ms. Zaida Alojadoand Mr. Quintin Sia III assisted us in the initial field testing in Palawan. Ms.Josel Mayordomo provided technical assistance at various phases of RAFMS.Ms. Maricel Gamo and Ms. Chingkel Trinidad typed the drafts. Mr. AlbertContemprate and Mr. Christopher Bunao did the artwork. Mr. Ariel Aquisapdid the layouting. Ms. Pamela del Rosario-Castrillo did initial copyediting ofthe manuscript and Ms. Marie Sol M. Sadorra did final copyediting.
The authors claim sole responsibility for any error or inconsistency in thehandbook.
61
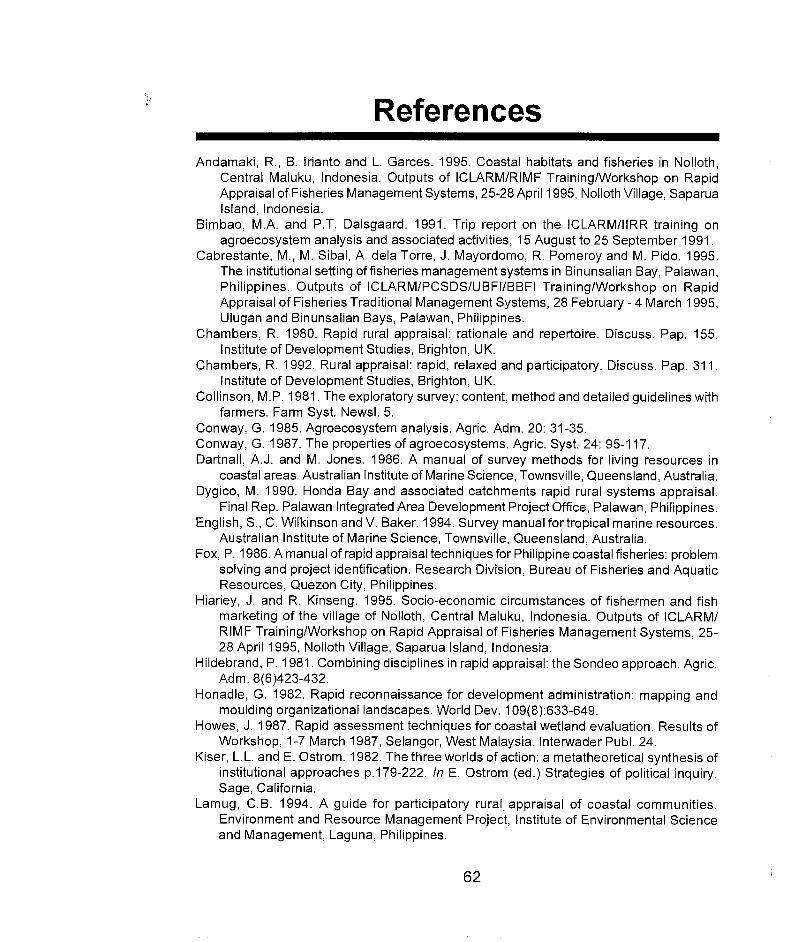
References
Andamaki, R., B. Irianto and L. Garces. 1995. Coastal habitats and fisheries in Nolloth,Central Maluku, Indonesia. Outputs of ICLARM/RIMF Training/Workshop on RapidAppraisal of Fisheries Management Systems, 25-28 April 1995, Nolloth Village, SaparuaIsland, Indonesia.
Bimbao, M.A. and P.T. Dalsgaard. 1991. Trip report on the ICLARM/IIRR training onagroecosystem analysis and associated activities, 15 August to 25 September 1991.
Cabrestante, M., M. Sibal, A. dela Torre, J. Mayordomo, R. Pomeroy and M. Pido. 1995.The institutional setting of fisheries management systems in Binunsalian Bay, Palawan,Philippines. Outputs of ICLARM/PCSDS/UBFI/BBFI Training/Workshop on RapidAppraisal of Fisheries Traditional Management Systems, 28 February - 4 March 1995,Ulugan and Binunsalian Bays, Palawan, Philippines.
Chambers, R. 1980. Rapid rural appraisal: rationale and repertoire. Discuss. Pap. 155.Institute of Development Studies, Brighton, UK.
Chambers, R. 1992. Rural appraisal: rapid, relaxed and participatory. Discuss. Pap. 311.Institute of Development Studies, Brighton, UK.
Collinson, M.P. 1981. The exploratory survey: content, method and detailed gUidelines withfarmers. Farm Syst. Newsl. 5.
Conway, G. 1985. Agroecosystem analysis. Agric. Adm. 20: 31-35.Conway, G. 1987. The properties of agroecosystems. Agric. Syst. 24: 95-117.Dartnall, A.J. and M. Jones. 1986. A manual of survey methods for living resources in
coastal areas. Australian Institute of Marine Science, Townsville, Queensland, Australia.Dygico, M. 1990. Honda Bay and associated catchments rapid rural systems appraisal.
Final Rep. Palawan Integrated Area Development Project Office, Palawan, Philippines.English, S., C. Wilkinson and V. Baker. 1994. Survey manual for tropical marine resources.
Australian Institute of Marine Science, Townsville, Queensland, Australia.Fox, P. 1986. A manual of rapid appraisal techniques for Philippine coastal fisheries: problem
solving and project identification. Research Division, Bureau of Fisheries and AquaticResources, Quezon City, Philippines.
Hiariey, J. and R. Kinseng. 1995. Socio-economic circumstances of fishermen and fishmarketing of the village of Nolloth, Central Maluku, Indonesia. Outputs of ICLARM/RIMF Training/Workshop on Rapid Appraisal of Fisheries Management Systems, 2528 April 1995, Nolloth Village, Saparua Island, Indonesia.
Hildebrand, P. 1981. Combining disciplines in rapid appraisal: the Sondeo approach. Agric.Adm. 8(6)423-432.
Honadle, G. 1982. Rapid reconnaissance for development administration: mapping andmoulding organizational landscapes. World Dev. 109(8):633-649.
Howes, J. 1987. Rapid assessment techniques for coastal wetland evaluation. Results ofWorkshop, 1-7 March 1987, Selangor, West Malaysia. Interwader Publ. 24.
Kiser, L. L. and E. Ostrom. 1982. The three worlds of action: a metatheoretical synthesis ofinstitutional approaches p.179-222. In E. Ostrom (ed.) Strategies of political inquiry.Sage, California.
Lamug, C.B. 1994. A guide for participatory rural. appraisal of coastal communities.Environment and Resource Management Project, Institute of Environmental Scienceand Management, Laguna, Philippines.
62

Mascarenhas, J., P. Shah, S. Joseph, R Jayakaran, J. Devavaram, V. Ramachandran, AFernandez, R Chambers and J. Pretty. 1991. Participatory rural appraisal. RRA Notes13. International Institute for Environment and Development, London.
McArthur, H.J. 1994. Creating dialogue and generating information, p. 124-144. In RS.Pomeroy (ed.) Community management and common property of coastal fisheries inAsia and the Pacific: concepts, methods and experiences. ICLARM Conf. Proc. 45,189 p.
McArthur, H.J. and AC. Trinidad. 1995. A framework for coastal transect analysis andapplication.
McCracken, J. 1990. Rapid rural appraisal for fisheries development: testing the approachin a fisherfolk community, Tamil Nadu, India. Report of a consultancy for the Bay ofBengal Fisheries Development Programme. 37 p.
McCracken, J., J. Pretty and G. Conway. 1988. An introduction to rapid rural appraisal foragricultural development. Sustainable Agriculture Program, International Institute forEnvironment and Development, London, UK.
Mikkelsen, B. 1995. Methods for development work and research: a guide for practitioners.Sage Publications, London.
Oakerson, RJ. 1992. Analyzing the commons: a framework, p. 41-59. In D.W. Bromley(ed.) Making the commons work: theory, practice and policy. Institute for ContemporaryStudies, San Francisco.
Ostrom, E. 1986. A method of institutional analysis, p. 459-475. In F.-X. Kaufmann, G.Majone and V. Ostrom (eds.) Guidance, control and evaluation in the public sector. deGruyter, New York.
Ostrom, E. 1990. Governing the commons: the evolution of institutions for collective action.Cambridge University Press, Cambridge.
Ostrom, E. 1992a. Crafting institutions for self-governing irrigation systems. Institute forContemporary Studies, San Francisco.
Ostrom, E. 1992b. The rudiments of a theory of the origins, survival and performance ofcommon-property institutions, p. 293- 318.ln D.W. Bromley (ed.) Making the commonswork: theory, practice and policy. Institute for Contemporary Studies, San Francisco.
Pido, M. D. 1995. The application of rapid rural appraisal techniques in coastal resourcesplanning: experience in Malampaya Sound, Philippines. Ocean Coast. Manage. 26(1 ):5772.
Pido, M.D. and T.-E. Chua. 1992. A framework for rapid appraisal of coastal environments,p. 133-148. In T.-E. Chua and L.F. Scura (eds.) Integrative framework and methods forcoastal area management. ICLARM Conf. Proc. 37, 167 p.
Pido, M.D., R Racuya, A Deogracias, J. Pontillas, B. Delmo and J. Juanillo. 1990. Rapidrural systems appraisal of Malampaya Sound, Taytay, Palawan. Final Rep. PalawanIntegrated Area Development Project Office, Palawan, Philippines.
Rhoades, RE. 1982. The art of the informal agricultural survey. Train. Doc. 1982-2. SocialScience Department, International Potato Center, Lima, Peru.
Saito, Y. and S. Atobe. 1970. Phytosociological study of intertidal marine algae. I. UsujiriBenten-Jima, Hokkaido. Bull. Fac. Fish. Hokkaido Univ. 21 (2):37-69.
Sajise, P., M. Espaldon, L. Florece and C. Medina. 1990. Rapid rural systems appraisal(RRSA): diagnostic and design tool for upland development projects. Rainfed ResourcesDevelopment Project, Department of Environment and Natural Resources, and Instituteof Environmental Science and Management, Philippines.
63

Sandalo, A., D. Sibal, G.J. Viernes, R. Felizarte and M. Carlos. 1995. The socio-economicsetting of fisheries management systems in Binunsalian Bay, Palawan, Philippines.Outputs of ICLARM/PCSDS/UBFI/BBFI Training/Workshop on Rapid Appraisal ofFisheries Traditional Management Systems, 28 February - 4 March 1995, Ulugan andBinunsalian Bays, Palawan, Philippines.
Schonhuth, M. and U. Kievelitz. 1994. Participatory learning approaches: rapid ruralappraisal, participatory rural appraisal. Schriften. GTZ 248. Robdorf.
Shanner, W.W., P.F. Philipp and W.R. Schmehl. 1982. Farming systems research anddevelopment: guidelines for developing countries. Westview Press, Boulder, Colorado.
Siar, S. 1992. Research studies being undertaken in Malalison Island. Paper presented atthe Workshop on Developing Rapid Rural Appraisal Procedures for Coastal Zone, 2024 July 1992, Silliman University, Dumaguete City.
Sibal, D., A. Sandalo, G.J. Viernes, R. Felizarte and M. Carlos. 1995a. The socio-economicsetting offisheries management systems in Ulugan Bay, Palawan, Philippines. Outputsof ICLARM/PCSDS/UBFI/BBFI TraininglWorkshop on Rapid Appraisal of FisheriesTraditional Management Systems, 28 February - 4 March 1995, Ulugan and BinunsalianBays, Palawan, Philippines.
Sibal, M., M. Cabrestante, A. dela Torre, J. Mayordomo, R. Pomeroy and M. Pido. 1995b.The institutional setting of fisheries management systems in Ulugan Bay, Palawan,Philippines. Outputs of ICLARM/PCSDS/UBFI/BBFI Training/Workshop on RapidAppraisal of Fisheries Traditional Management Systems, 28 February - 4 March 1995,Ulugan and Binunsalian Bays, Palawan, Philippines.
Sta. Cruz, E., R. Padon, B. McCullough, J.F. Pontillas, Q. Sia III and L. Garces. 1995. Thebiological setting of fisheries management systems in Binunsalian Bay, Palawan,Philippines. Outputs of ICLARM/PCSDS/UBFI/BBFI Training/Workshop on RapidAppraisal of Fisheries Traditional Management Systems, 28 February - 4 March 1995,Ulugan and Binunsalian Bays, Palawan, Philippines.
Thomson, J.T. 1992. A framework for analyzing institutional incentives in community forestry.FAO Community For. Note 10.
Townsley, P. 1992. Rapid appraisal for small water bodies. ALCOM Rep. 11. FAO, Harare,Zimbabwe.
Townsley, P. 1993a. A manual on rapid appraisal methods for coastal communities. Bay ofBengal Programme, Madras, India.
Townsley, P. 1993b. Training of rapid appraisal teams: notes for trainers. FAO Fish. Circ.868.
64

(J)CJ1
Appendices
Matrix 1. Biological, physical and technical attributes to be examined and the tools/techniques for data collection and validation.
Attributes Indicators Unit/scale of Sources of Field Field data Communitymeasurement secondary data observations collection techniques validation techniques
Physical attributes
o resou rce use terrestrial use Ii hectare; percentage - agriculture/fisheries natural vegetation types
by classification agency types of built-up areas
into natural vegetation; - environment/natural . agricultural crops
bUilt-up areas; resources agency
agricultural; other - research/academic
land uses institutions
marine use Ii hectare; percentage fishing spots/grounds
by classification . tourism/outdoor - resource - workshop
recreation sites mapping
o climatic data monsoon Ii annual/seasonal - weather bureau wind direction
pattern. rainfall Ii millimeters/year humidity
o physiography slope classes Ii percentage - agriculture/fisheries terrain, steepness
(0-8%; 8-18%; agency
18-30%; >30%) - environment/natural
elevation Ii height in meters resources agency
(0-5,5-10, 10-15, - mapping agency
15-100)
soil Ii class/type texture
(sandy, clayey,
loamy, silty)
Research/survey steps 1Secondary
data analysis
2Reconnaissance
survey
3Field data
gathering
4Community
validation
continued...

(J)(J)
Matrix 1. (continued)
Attributes Indicators Unit/scale of Sources of Field Field data Community
measurement secondary data observations collection techniques validation techniques
LJ physical current ~ circulation patterns agriculture/fisheries -ocular- -
oceanography agency inspection
tides ~ tidal patterns - research/academic tidal height
institutions - mapping
bathymetry ~ depth in fathoms/ depthmeters
substrate ~ hectare; percentage - marine office bottom characteristics
by classification (e.g., sand, mud, corals) -- -
[J water quality transparency ~ meters - environment/natural
resources agency
level of pollution ~ types of waste - pollution control sewage disposal system - ocular - workshopmaterials office agricultural fertilizers/ inspection
pesticides
factories/industrial
establishments - -
Research/survey steps 1
Secondary
data analysis
2
Reconnaissance
survey
3
Field data
gathering
4
Community
validation
continued.

m-..I
Matrix 1. (continued)
Attributes Indicators Unit/scale of Sources of Field Field data Community
measurement secondary data observations collection techniques validation techniques
Biological and
habitat attributes
c seaweeds/ area/location Ii. hectare-
resource mapping-
-seagrasses and interviews
species com- Ii. percentage abundance species composition - transect-quadrat
position/density Ii. percentage cover presence of seagrass/ technique/manta
algal beds tow survey
harvested/utilized Ii. amount (kilogram) harvested species
species
lJ mangroves area/location Ii. hectare - agriculturelfisheries - resource mapping - workshop
agency
species, Ii. percentage, - environment/natural species composition - transect-plot
composition/ abundance resources agency method
density - research/academic
conversion into Ii. hectare institutions fishponds; charcoal
other uses chimneys; cut poles;
cutting activities
C coral reefs area/location Ii. hectare - resource mapping
living coral .!1 percentage cover benthic life forms (e.g., - manta tow survey/condition live corals, dead corals) benthic life form
survey
reef fish Ii. fish count/biomass species composition - fish visual census
abundance .!1 reef fish percentage and abundance- -
Research/survey steps
Secondary
data analysis
2Reconnaissance
survey
3
Field data
gathering
4Community
validation
continued...

(j)CO
Matrix 1. (continued)
Attributes Indicators Unit/scale of Sources of Field Field data Community
measurement secondary data observations collection techniques validation techniques
Technical attributes
of fisheries - -o gear/fishing
technology artisanal gear ~ types and number gear types used - interviews
· commercial gear ~ types and number boats (motorized or
nonmotorized)
level of fishing /:; numberor
technology percentage
· seasonality of ~ seasonality (months) - agriculture/fisheries - workshop
fishing operations agency
destructive ~ types - research/academic presence of dynamite - site inspectionfishing methods institutions blasts
blasted reef
o species major types of ~ relative abundance catch composition - interviews
harvested species
· changes in spe-
cies compositionof catch
changes in size of
fish caught
catch rate ~ kilogram/trip fish catch
changes in catch
rate - -Research/survey steps 1
Secondary
data analysis
2
Reconnaissance
survey
3Field data
gathering
4Community
validation
continued...

(J)<0
Matrix 1. (continued)
Attributes Indicators Unit/scale of Sources of Field Field data Community
measurement secondary data observations coiiection techniques validation techniques
LJ level of ecosystem/ L\. relative abundance-
agriculture/fisheries change in species interviews-
- workshop- -exploitation recruitment of fish catch agency composition
overfishing /\. species composition - research/academic types of fish caught
growth over- /\. size of fish institutions landing of small-size fish - market/fish
fishing use of small-meshed landing surveys
size gear for growth
overfishing
excess fishing /\. fishing effort number of fishers
effort expressed in the number of boats
number of fishers/ catch
coastline length and
number of boats/
coastline iength
/\. total catch
/\. exploitation ratio - -
Research/survey stepsSecondary
data analysis
2
Reconnaissance
survey
3
Field data
gathering
4
Community
validation
continued...

-.Io
Matrix 2. Market attributes to be examined and the tools/techniques for data collection and validation.
Attributes Indicators Unit/scale of Sources of Field Field data Community
measurement secondary data observations collection techniques validation techniques
o supply of type-quantity D. species - fish landed in ports - - ocular inspection -marine products
availability/ D. month/seasonal . fish traded in the market - SSI
seasonality occurrence other fish and fish-based - FGD
products in the market - market visit
o pricing scheme/ wholesale, D. pesos/kilogram or - agriculture/fisheries - workshop
system retail values tonne agency
information D. degree of - trade/industry office - - walk-through/access/ dissemination boat ride
availability D. average cost. criteria D. markup (marketing)
D. international price - -
Research/survey stepsSecondary
data analysis
2
Reconnaissance
survey
3
Field data
gathering
4Community
validation
continued...

-..I......
Matrix 2. (continued)
Attributes Indicators Unit/scale of Sources of Field Field data Communitymeasurement secondary data observations collection techniques validation techniques
o market functions · processing Ll types of products I- · number of fish-based - - ocular inspection i-
products - SSI
· packaging Ll types of materials · variety of materials - market visit
for packaging
· grading Ll criteria/standards · fish classes/grades
· transporting Ll mode of transport for · sources of fish soldfish
· storage Ll facilities for storage
· distribution Ll distribution route dates of fish catch/ - workshop
scheme landings-
o market rules · fees Ll types - agriculture/fisheries payment -and licenses Ll values/amount agency - SSI
- trade/industry office - market visit
· restrictions Ll type of quality control · trading practices
(e.g., cyanide testing)
· entry/exit Ll barriers · average capitalconditions investment
1- - 1-
Research/survey steps 1
Secondary
data analysis
2Reconnaissance
survey
3Field data
gathering
4Community
validation
continued..

-...IN
Matrix 2. ( continued)
Attributes Indicators Unit/scale of Sources of Field Field data Community
measurement secondary data observations collection techniques validation techniques
[1 stability of population Ll migration (in-out) - - local government- - SSI
-
demand change records - market visit
popUlation Ll population pattern - census office average family size
growth
changes in Ll preference for
tastes and substitute
preferences
price changes Ll rate of substitution
of other
substitute
commodities- -
o market structure buyer Ll population economic-
number of households~
- ocular inspection.concentration units - SSI - workshop
Ll ratio of primary buyers average family size - FGD
to fishers - market visit
Ll number of primarybuyers per total
number of landings
seller Ll economic units number of stalls
concentration number of fishers
channels Ll number of - agriculture/fisheries number of middlemen - diagramming
intermediaries agency type of middlemen
- tradelindustry office
- - -
Research/survey steps 1
Secondary
data analysis
2
Reconnaissance
survey
3Field data
gathering
4Community
validation
continued.

-...IW
Matrix 2. (continued)
Attributes Indicators Unit/scale of Sources of Field Field data Community
measurement secondary data observations collection techniques validation techniques
- -IJ market structure location 11 geographic scale and distance from - mapping
position residence/fishing
degree of 11 residence or "home grounds
competition base" of primary · geographic location/among sellers/ buyers concentrations
buyers 11 credit relationships - agriculturelfisheries · ratio of fishers to traders
between primary agency
buyers and fishers - trade/industry office11 type of buyers (e.g., · defined marketing
number of and tie-ups
percentage of direct - workshop
consumers and
traders)
11 type of sellers (e.g.,-
number and
percentage of
direct sellers andtraders)
[] market type of market 11 subsistence market · number of middlemen - interview
orientation 11 local · mode of transport
11 regional
11 national
11 international -
Research/survey steps
Secondary
data analysis
2Reconnaissance
survey
3
Field data
gathering
4
Community
validation

-...I~
Matrix 3. Fisher, stakeholder and community attributes to be examined and the tools/techniques for data collection and validation.
Attributes Indicators Unit/scale of Sources of Field Field data Community
measurement secondary data observations collection techniques validation techniques
r: demography · LI. years physical appearance- -
age
experience in LI. years
fishing
· education LI. degree (levels)
· gender LI. equality of
relations opportunities/control - agriculturelfisheries
and access of resources agency
between men and women
length of LI. number of years - local government training levels
residence records
training LI. number of years
LI. types
family size LI. number - census office number of children/ - ocular inspection
nutrition/health LI. malnutrition rate - health department household - SSI
status LI. mortality rate; life - FGD - workshopexpectancy - market visit
religion LI. form types of existing - walk-through/
LI. number of religious com- temples/churches boat ridemunities and organizations
ethnicity LI. tribal group/ethno- dialect spoken
linguistic group
population LI. density (man-land ratio) household size
LI. growth rate proportion of adults per
LI. distribution family
LI. number of fishers
LI. number of households
Research/survey steps 1
Secondary
data analysis
2
Reconnaissance
survey
3
Field data
gathering
4
Community
validation
continued ..

......01
Matrix 3. (continued)
Attributes Indicators Unit/scale of Sources of Field Field data Community
measurement secondary data observations collection techniques validation techniques
I~ tenurial status land claim L), location of residence-
- agriculture/ fisheries- 1-
agency
L), proprietary rights - local government
(owner-operated; records
tenant-operated; - taxation/internal
leased; stewardship revenue bureau
contract)
fishery claim L), location of claim physical boundariesL), proprietary right - ocular inspection
- - SSI
I' economic status wealth ranking L), economic class (upper assets owned - FGD - workshop
class; middle class; type of house - walk-through/lower class) boat ride
assets; fishing L), boats (number and-
- agriculture/fisheries
specifications) agency
L), engine (number and - taxation/internalspecifications) revenue bureau
L), gear (number and
specifications)
assets: others L), house appliances
L), vehicles
L), furniture and fixtures- 1- -
Research/survey steps
Secondary
data analysis
2Reconnaissance
survey
3Field data
gathering
4Community
validation
continued.

.......m
Matrix 3. (continued)
Attributes IndicatorsJ Unit/scale of Sources of Field Field data Community
measurement secondary data observations collection techniques validation techniques
-o culture special ~ dates - tourism bureau festivals/feasts
occasions ~ types
customs/ ~ years - local government beliefs/taboos about
traditions ~ types records fishing
recreation ~ types sports and games - ocular inspection
- SSI
o livelihood occupation ~ types of employment - taxation/internal practices/prevailing - FGD - workshop
(occupational income level ~ values and amounts revenue bureau activities - market visit
structure) - trade/industry office
duration/ ~ monthly/weekly/daily-
frequency of
livelihood
activities
Research/survey steps 1Secondary
data analysis
2
Reconnaissance
survey
3
Field data
gathering
4Community
validation
continued ..

-...I-...I
Matrix 3. (continued)
Attributes Indicators Unit/scale of Sources of Field Field data Community
measurement secondary data observations collection techniques validation techniques
I. altitudes and risk and Ii. risk behavior (risk
outlook of uncertainty averse; risk neutral;
fishers risk loving)
social change Ii. conservative! general physical
traditional vs. adaptive landscape and way of
life
future Ii. positive vs. negative
community
development
prospects
values for Ii. strong, weak, - research!academic existence of POs!
collective indifferent institutions NGOs - ocular inspection - workshop
action - local government - SSI
intergeneratio- Ii. strong, weak, records knowledge about past - FGD
nal informa- nonexistent or not in heritage - walk-through!
tion transfer use boat ride
concerns for Ii. strong, weak, extent of resource
resource indifferent exploitation
sustainability
integration Ii. strong, weak, flow of goods and
into bigger indifferent services
economy!
political
system -
Research!survey steps
Secondary
data analysis
2Reconnaissance
survey
3
Field data
gathering
4
Community
validation
continued.

-...Iex>
Matrix 3. (continued)
Attributes Indicators Unit/scale of Sources of Field Field data Community
measurement secondary data observations collection techniques validation techniques
I i resource use/ " types agriculture/fisheries fishing spots/areas per-
resource use - - resource
harvesting conflicts agency gear type mapping
conflicts - research/academic
institutions
C ecological awareness/ " level of awareness fishing conservation
knowledge overall concern billboards/slogans
about fishing
problems- workshop
u community settlement " patterns - local government types of houses. services " health records existing facilities - interviews
" infrastructure
" communications
" marketstate " structuregovernance " linkages - -
Research/survey steps
Secondary
data analysis
2
Reconnaissance
survey
3Field data
gathering
4
Community
validation

-.JCO
Matrix 4. Local or community institutional arrangement attributes to be examined and the tools/techniques for data collection and validation.
Attributes Indicators Unit/scale of Sources of Field Field data Communitymeasurement secondary data observations collection techniques validation techniques
o individual • administrative L\. formal/informal organization signs-.
organizations level L\. govemment/NGOs/POs/private/others - organization records fisheries/CRM-related
- research/academic activities• mandate L\. objectives/mission institution
statements - local governmentL\. plans recordsL\. spatial jurisdictionL\. legal authorityL\. functions/responsibilitiesL\. services offered
• organizational L\. organogram/functional - interview - workshopstructure chart
L\. ieadership• period of existence L\. number of years/months
L\. historical developmentL\. stability
• membership L\. number (actual and trend)L\. type/graduationsL\. eligibilityL\. requirementsL\. rights
• resources L\. technical/technologicalL\. manpowerL\. financial
• relationship/ L\. horizontal linkagesaffiliation with other L\. vertical linkagesorganizations/institutions
• awareness of L\. perceptionsresource condition L\. legitimacy
L\. respectabilityL\. traditionsL\. support
Research/survey steps 1Secondary
data analysis
2Reconnaissance
survey
3Field datagathering
4Communityvalidation
continued ..

<XIo
Matrix 4. (continued)
Attributes Indicators Unit/scale of Sources of Field Field data Community
measurement secondary data observations collection techniques validation techniques
[J local institutional-
man-made boundariesI- I-. property rights '" access
arrangements '" withdrawal
'" managementIi exclusion
'" transferrules: '" boundary - research/academic - interview - workshop
operational '" allocation institution
Ii authority - local government
'" scope records
'" information
'" aggregationIi penalty
'" payoff
'" input'" level of rule, compliance
and violation
'" overall support
'" procedures formonitoring of behavior
'" procedures to sanctionnonconformist or
opportunistic behavior
'" role changes over time
'" perceptions of benefitsand costs of rules
'" degree of equity'" availability of information
on condition of resources,
their benefits and costs- - -
Research/survey steps 1
Secondary
data analysis
2Reconnaissance
survey
3
Field data
gathering
4Community
validation
continued...

ex>......
Matrix 4. (continued)
Attributes Indicators Unit/scale of Sources of Field Field data Community
measurement secondary data observations collection techniques validation techniques
regulatory t. regulations (quotas,
mechanisms gear and size
restrictions, closed
season, closed area)
t. incentives (taxation,
licensing, individual
transferable quota)
collective t. adjudication, - research/academic interview - workshopchoice rules enforcement, institution
formulation and - local government
modification of records
operational rules
t. detection and sanction
against rule violationt. accountability
rulemaking t. leadership
body t. membership
t. representation
boundaries t. political
t. gear type
t. traditional/customary
t. fishing spot
t. organization
t. physical/natural
t. size and clarity of
boundary
t. change over time
Research/survey steps
Secondary
data analysis
2Reconnaissance
survey
3Field data
gathering
4
Community
validation
continued ..

00N
Matrix 5. External institutional arrangement attributes to be examined and the tools/techniques for data collection and validation.
Attributes Indicators Unit/scale of Sources of Field Field data Communitymeasurement secondary data observations collection techniques validation techniques
-o individual · political/ t>. international, regional/ organization signs
organizations administrative bilateral, national/level central, regional,
province/state, district/municipal/town
· mandate t>. objectives/mission - organization records fisheries/CRM-related - interviews - workshopstatements - national government activities
t>. plans recordst>. spatial jurisdictiont>. legal authorityt>. functions/
responsibilitiest>. services offered
organizational t>. organogram/functionalstructure flowchart
· period of t>. number of years/existence months
t>. historical developmentt>. stability
· membership t>. number (actual andtrend)
t>. type/graduationst>. eligibilityt>. requirementst>. rights
· resources t>. technical/technologicalt>. manpowert>. financial -
Research/survey steps 1Secondary
data analysis
2Reconnaissance
survey
3Field datagathering
4Communityvalidation
continued...

enU>
Matrix 5. (continued)
Attributes Indicators Unit/scale of Sources of Field Field data Communitymeasurement secondary data observations collection techniques validation techniques
relationship/ c, horizontal linkages - - -affiliation with c, ve~allinkageS
other organi- C, shar d responsibilityzations/ insti-tutions. awareness of c, perceptionsresource c, legitimacycondition c, respectability
c, traditionsc, support -
o institutional formal c, responsible -- national governmentarrangements fisheries and administrative agency records - interviews - workshop
CRM policies/ c, objective - research/academicprograms c, scope of application institutions
C, provisionsc, responsibilitiesc, regUlationsc, powers, dutiesc, functions
formaldevelopmentand publicadministrationlegislation/regUlationsaffectingfisheries andCRM - - -
Research/survey steps 1Secondary
data analysis
2Reconnaissance
survey
3Field datagathering
4Communityvalidation
continued...

00.l::>.
Matrix 5. (continued)
Attributes Indicators Unit/scale ot Sources of Field Field data Community
measurement secondary data observations collection techniques validation techniques
- - .-policies Do right to organizeprograms Do right to makelegislation at management rulesnational, Do amount of authorityregional, and responsibilitymunicipal/ granteddistrict levels Do degree of generalityin support of and flexibilitylocal CBCRM Do exclusivity, certainty,
sustainability of fishing
rightsDo coordination for
activitiesnested layers Do linkages - national governmentof organizational Do overlap recordsand institutional Do coordination - research/academic - interviews workshoparrangements Do power structure institutions(formal and relationshipinformal) '- '-
Research/survey steps 1Secondary
data analysis
2Reconnaissance
survey
3
Field datagathering
4Communityvalidation

00(Jl
Matrix 6. Exogenous attributes to be examined and the tools/techniques for data collection and validation.
Attributes Indicators Unit/scale of Sources of Fieid Field data Communitymeasurement secondary data observations collection techniques validation techniques
o natural • typhoon - - destroyed crops and - -calamities properties
• floods waterlogging• droughts barren soils• seismic waves destroyed properties• earthquakes gullies/soil erosion
o macroeconomic/ • war 1'1 type, number and - national government military checkpoints/ - interviews - workshoppolitical/ • insurgency frequency records operationssociocultural • political - research/academic
changes/ institutionsagendas
• development:industrial,commercial,residential
• technology new fishing gearinnovation
• factoravailability
• communication/transportation/infrastructure
• social• cultural• inflation/econo-
mic growth/com-modification
• internationalagreements(boundaries,resources,trade)
- - - -
Research/survey steps 1Secondary
data analysis
2Reconnaissance
survey
3Field datagathering
4Communityvalidation