a hierarchical model for object- oriented design quality...
TRANSCRIPT

A Hierarchical Model for Object-Oriented Design Quality Assessment
ⓒ KAIST SE LAB 2013
IEEE Transactions on Software Engineering(2002)
Jagdish Bansiya and Carl G. Davis
2013-08-22Yoo Jin Lim

Contents
IntroductionBackgroundOverall ApproachModel DevelopmentModel Validation and ResultsConclusionDiscussion
2/24ⓒ KAIST SE LAB 2013

Introduction (1/4) Software Quality
Garvin’s work(1984)
3/24ⓒ KAIST SE LAB 2013
UserProduct
Value-based
Focus on the software production processEx) Built right without rework?
Focus on meeting user’s needsEx) Easy to use,
Available?QualityViews
Quality has become more important with our increasing dependence on software
Focus on the software productitself, its internal characteristicsEx) Well-structured code,
Flexible designs?

Introduction (2/4) Software Quality Model
Assess software quality by measuring its attributes Use metrics to obtain objective measurements in numbers
• Product-View assumes: Internal attributes influence external attributes
4/24ⓒ KAIST SE LAB 2013
Reliability?Usability?Flexibility?
…
SizeAbstractionComplexity
…
SoftwareQuality Model
METRICS
Ext
erna
lIn
tern
al

Previous Work on Quality Models and Metrics Software Quality Model – ISO 9126
• A hierarchical model, lacking specifics in lower-level details
Metrics for object oriented software – C.K. Metrics• Complete measurements only possible after a product is complete
Introduction (3/4)
5/24ⓒ KAIST SE LAB 2013
Too late to improve quality
1. Functionality2. Reliability3. Usability4. Efficiency5. Maintainability6. Portability
SuitabilityAccuracy…
AdaptabilityConformance…
…
Little guidance to developers trying to improve quality

Introduction (4/4)
Motivation Current models and metrics for object-oriented (OO)
design contain ambiguous details that limit applicability
Goal To develop an improved hierarchical model for OO
design quality assessment with• Lower-level metrics well-defined in terms of design
characteristics only
6/24ⓒ KAIST SE LAB 2013
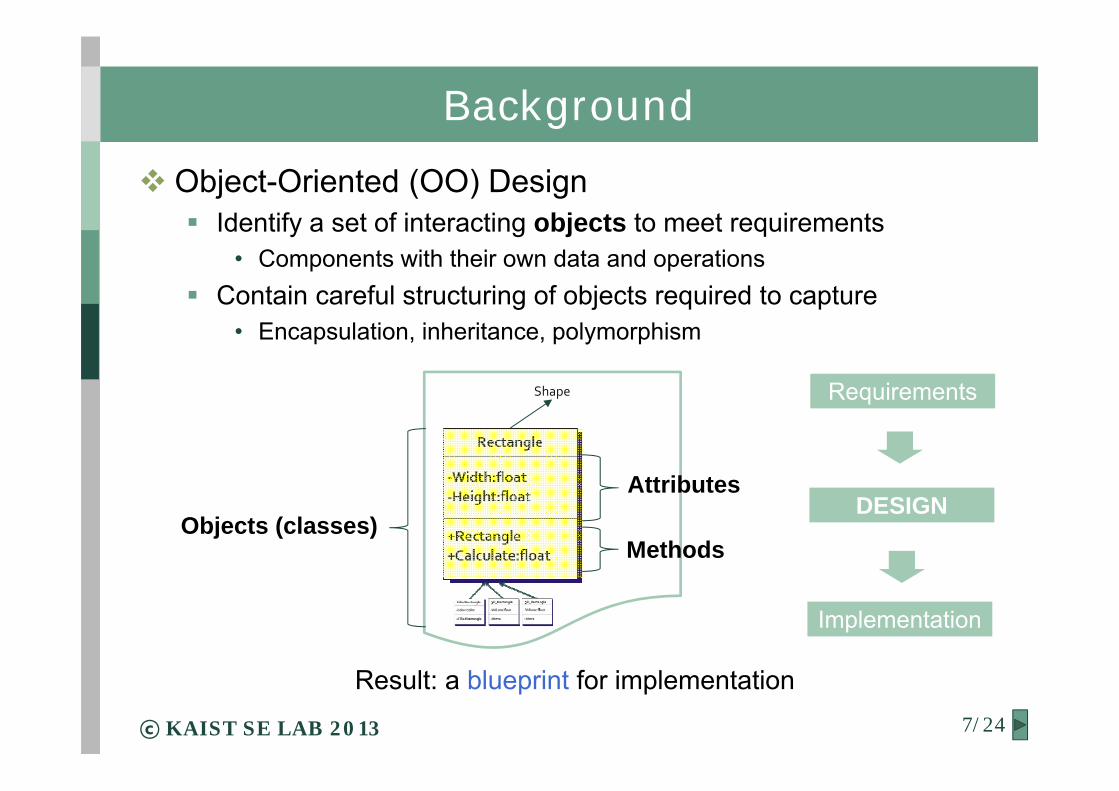
Background Object-Oriented (OO) Design
Identify a set of interacting objects to meet requirements• Components with their own data and operations
Contain careful structuring of objects required to capture• Encapsulation, inheritance, polymorphism
7/24ⓒ KAIST SE LAB 2013
Shape
Attributes
MethodsObjects (classes)
Result: a blueprint for implementation
Requirements
DESIGN
Implementation

Quality Model for Object-Oriented Design (QMOOD)
Overall Approach
8/24ⓒ KAIST SE LAB 2013
Design Quality Attributes
OO Design Properties
OO Design Metrics
First Level (L1)
Second Level (L2)
Third Level (L3)
Fourth Level (L4)
L12
L23
L34
Abstract
ConcreteOO Design components
Quality= Total Quality Index

Classes that satisfy needs
Identifying Design Quality Attributes (L1) Abstract concepts that describe desirable characteristics of design
Model Development (1/8)
9/24ⓒ KAIST SE LAB 2013
Design Quality Attributes
OO Design Properties
OO Design Metrics
OO Design components
Functions that satisfy needs
Probability of failure
Performance and resource
Effort needed to use
Effort to make modifications
Can be transferred
Functionality
Efficiency
Portability
Maintainability
Usability
ReliabilityCan be reapplied to new problem
Design achieves desired functionality
Can be adapted to new problem
Ease of learning
Can incorporate new requirements
Effectiveness
Extendibility
Understandability
Flexibility
Reusability
ISO 9126 QMOODFunctionality

Identifying Object-Oriented Design Properties (L2) Tangible concepts that are directly observable in design
• Describe the internal and external structure of classes
Model Development (2/8)
10/24ⓒ KAIST SE LAB 2013
Abstraction Encapsulation Coupling Cohesion Complexity Design size Messaging Composition Inheritance Polymorphism Class hierarchies
New design properties introduced by OO approach
Design Quality Attributes
OO Design Properties
OO Design Metrics
OO Design components
Shape

Identifying Object-Oriented Design Metrics (L3) Measurement system for assessing design properties
• States exactly what to count in class definitions and relationships
Model Development (3/8)
11/24ⓒ KAIST SE LAB 2013
Design Quality Attributes
OO Design PropertiesOO Design Properties
OO Design Metrics
OO Design components
Design Size in Classes Number of Hierarchies Average Number of Ancestors Number of Polymorphic Methods Class Interface Size Number of Methods Direct Class Coupling Cohesion Among Methods Data Access Metric Measure of Aggregation Measure Functional Abstraction
DSC = 6 … ANA = 2.75 …
Shape
New metrics introduced by OO paradigm

Object-Oriented Design Components (L4) Entities that make up the architecture of an OO design
• Contain properties that influence object’s quality• Help analyze an OO design
Model Development (4/8)
12/24ⓒ KAIST SE LAB 2013
Design Quality Attributes
OO Design Properties
OO Design Metrics
OO Design Components
Rectangle
‐Width:float‐Height:float
+Rectangle+Calculate:float
Attributes
Methods
Class hierarchies
NameEncapsulationSizeType…
NameEncapsulationParametersType…
Objects (classes)
Name (self-descriptive?)Encapsulation (private or public?)Inheritance (base or derived?)…

Mapping OOD Components to OOD Metrics (L34) Identify component properties that are needed by metrics
Model Development (5/8)
13/24ⓒ KAIST SE LAB 2013
Design Quality Attributes
OO Design Properties
OO Design Metrics
OO Design Components
Rectangle
‐Width:float‐Height:float
+Rectangle+Calculate:float
Objects (classes)
Name (self-descriptive?)Encapsulation (private or public?)Inheritance (base or derived?)…
Data Access Metric = number of private attributes to the total number of attributes
Design Size in Classes Number of Hierarchies Average Number of Ancestors Number of Polymorphic Methods Class Interface Size Number of Methods Direct Class Coupling Cohesion Among Methods Data Access Metric Measure of Aggregation Measure Functional Abstraction

Assigning OOD Metrics to OOD Properties (L23) Determine which metric contains information about design property
Model Development (6/8)
14/24ⓒ KAIST SE LAB 2013
Design Quality Attributes
OO Design Properties
OO Design Metrics
OO Design components
→ Design size→ Hierarchies→ Abstraction→ Polymorphism→ Messaging→ Complexity→ Coupling→ Cohesion→ Composition→ Inheritance→ Encapsulation
Number of Classes Number of Hierarchies Average Number of Ancestors Number of Polymorphic Methods Class Interface Size Number of Methods Direct Class Coupling Cohesion Among Methods Measure of Aggregation Measure Functional Abstraction Data Access Metric
Number of private attributes in the total number of attributes
Property of preventing access to attributes by defining them to be private, thus protecting the object

Reusability Flexibility Understandability Functionality Extendibility Effectiveness
Design Size
Hierarchies
Abstraction
Encapsulation
Coupling
Cohesion
Composition
Inheritance
Polymorphism
Messaging
Complexity
Model Development (7/8) Linking OOD Properties to Quality Attributes (L12)
Identify properties’ positive and negative influence on attributes
15/24ⓒ KAIST SE LAB 2013
Weighting the linkages
Design Quality Attributes
OO Design Properties
OO Design Metrics
OO Design components
Qual Attribute Index Computation EquationReusability -0.25*Coupling+0.25*Cohesion+0.5*Messaging+0.5*Design Size
Flexibility 0.25*Encapsulation-0.25*Coupling+0.5*Composition+0.5*Polymorphism
Understandability -0.33*Abs+0.33*Enc-0.33*Cou+0.33*Coh-0.33*Pol-0.33*Com-0.33*Des
Functionality 0.12*Cohesion+0.22*Polymorphism+0.22*Messaging+0.22*Design Size+0.22*Hierarchies
Extendibility 0.5*Abstraction-0.5*Coupling+0.5*Inheritance+0.5*Polymorphism
Effectiveness 0.2*Abstraction+0.2*Encapsulation+0.2*Composition+0.2*Inheritance+0.2*Polymorphism
Weights can be experimented with to best reflect organizational objectives.

QMOOD++ Collects metrics data from components of C++ design Automatically carries out the process of measurement in flexible
and nonintrusive manner
Model Development (8/8)
16/24ⓒ KAIST SE LAB 2013
Design Quality Attributes
OO Design Properties
OO Design Metrics
OO Design Components

Model Validation and Results (1/5) QMOOD Individual Attribute Validation
Goal• Verify quality attribute values are in valid ranges
Method• Use QMOOD++ to compute quality attribute values• Compare to expected results
– All quality attributes except for understandability should increase in value (improve) from version to version
17/24ⓒ KAIST SE LAB 2013
Ver 1.0 Ver 2.0 Ver 3.0 Ver 4.0 Ver 5.0
Qualities:• Functionality• Effectiveness• …
Understandability:
Microsoft Foundation Classes (MFC)And 4 versions of Borland Object Windows Library (OWL)
Quality= Total Quality Index

Model Validation and Results (2/5)
QMOOD Individual Attribute Validation Results
• Normalized Metric Values for MFC and OWL Frameworks
• Computed Quality Attribute Indices for MFC and OWL
18/24ⓒ KAIST SE LAB 2013
Metric MFC 1.0 MFC 2.0 MFC 3.0 MFC 4.0 MFC 5.0 OWL 4.0 OWL 4.5 OWL 5.0 OWL 5.2Design Size 1.00 1.28 1.83 2.86 3.24 1.00 1.73 4.35 4.34 Hierarchies 1.00 1.00 1.00 5.00 6.00 1.00 1.33 2.42 2.25 Abstraction 1.00 1.26 1.46 1.39 1.37 1.00 0.97 1.56 1.55 Encapsulation 1.00 0.79 0.88 0.92 0.94 1.00 0.94 0.88 0.89 Modularity 1.00 1.13 1.15 1.21 1.28 1.00 1.01 1.04 1.04 Coupling 1.00 1.26 1.50 1.55 1.48 1.00 1.21 2.53 2.52 Cohesion 1.00 0.74 0.81 0.79 0.83 1.00 1.00 1.00 1.00 Aggregation 1.00 3.46 5.27 5.23 5.49 1.00 1.90 3.85 3.72 Inheritance 1.00 5.39 6.55 7.61 7.57 1.00 0.92 1.06 1.06 Polymorphism 1.00 2.66 2.83 4.14 4.19 1.00 1.66 3.71 3.59 Messaging 1.00 1.81 2.23 2.65 2.55 1.00 0.95 1.83 1.80 Complexity 1.00 1.70 2.13 2.56 2.44 1.00 0.87 1.34 1.33
Reusability = -0.25*Coupling +0.25*Cohesion +0.5*Messaging +0.5*Design Size
Quality Index MFC 1.0 MFC 2.0 MFC 3.0 MFC 4.0 MFC 5.0 OWL 4.0 OWL 4.5 OWL 5.0 OWL 5.2
Reusability 1.00 1.41 1.86 2.57 2.73 1.00 1.29 2.71 2.69
Flexibility 1.00 2.94 3.89 4.53 4.71 1.00 1.72 3.37 3.24
Understandability -0.99 -2.18 -2.66 -3.56 -3.61 -0.99 -1.48 -3.83 -3.77
Functionality 1.00 1.57 1.83 3.32 3.61 1.00 1.37 2.83 2.76
Extendibility 1.00 4.03 4.67 5.80 5.82 1.00 1.17 1.90 1.84
Effectiveness 1.00 2.71 3.40 3.86 3.91 1.00 1.28 2.21 2.16
Index Computation Equation

Model Validation and Results (3/5) QMOOD Individual Attribute Validation
Plots
19/24ⓒ KAIST SE LAB 2013
Agreement with the expected results• All quality attribute values increased with new versions,
except for Understandability.• Understandability decreases significantly and levels off

QMOOD Validation Goal:
• See how well QMOOD predicts the “overall quality” of an OO software design
Method
Model Validation and Results (4/5)
20/24ⓒ KAIST SE LAB 2013
#1 #2 #13
QMOOD Human evaluators
A suite of 14 C++ projects developed for the same set of requirements by different people
…
…
…Perform correlation analysis
Rankings

Model Validation and Results (5/5) QMOOD Validation
Results
Results Comparison: Spearman’s rank coefficient
21/24ⓒ KAIST SE LAB 2013
QMOOD had statistically significant correlations with 11 of 13 evaluators
Close agreement between the assessments done by the evaluators
16∑
1
0.55 means significant
Project QMOOD E1 E2 E3 E4 E5 E6 E7 E8 E9 E10 E11 E12 E131 13 12 9 11 11 13 12 12 13 13 13 11 8 92 9 13 12 12 12 12 6 13 6 10 12 12 12 103 3 2 6 2 1 7 1 4 1 2 7 4 2 44 12 9 7 9 10 2 9 10 9 6 11 10 5 65 1 1 1 1 2 1 7 1 2 1 2 2 3 26 5 8 11 10 7 9 11 6 12 11 9 3 11 127 11 4 13 13 13 8 13 11 8 12 4 1 13 88 8 3 8 9 8 11 10 9 10 8 3 7 6 119 7 5 10 7 9 10 3 5 4 5 6 6 7 710 2 6 2 3 3 4 5 2 3 3 1 5 1 511 4 11 3 5 6 5 8 3 11 9 8 8 10 1312 6 7 5 6 4 3 2 8 5 7 5 9 9 313 10 10 4 4 5 6 4 7 7 4 10 13 4 414 14 14 14 14 14 14 14 14 14 14 14 14 14 14
Evaluator 1 2 3 4 5 6 7 8 9 10 11 12 13r_s 0.60 0.68 0.80 0.85 0.56 0.57 0.91 0.66 0.69 0.70 0.63 0.53 0.43
r_s > 0.55 Y Y Y Y Y Y Y Y Y Y Y N N

Conclusion Presented and empirically validated a hierarchical model
for assessing quality of object-oriented designs based on well-defined lower-level design metrics.
Offered a tool, QMOOD++, that is nonintrusive, flexible, and applicable to real-world projects
22/24ⓒ KAIST SE LAB 2013

Discussion
Pros Empirical validation using human assessment Model supported by an automated tool
Cons Unclear mapping from the components to the metrics Lack of explanation in index computation equations Limited set of projects for model validation
23/24ⓒ KAIST SE LAB 2013

ⓒ KAIST SE LAB 2013

Appendix
ISO 9126
25/24ⓒ KAIST SE LAB 2013
Quality subcharacteristic
Suitability
Accuracy
Interoperability
Security
Maturity
Fault tolerance
Recoverability
Reliability
Usability
Understandability
Learnability
Operability
EfficiencyTime behavior
Resource behavior
Maintainability
Portability
Analyzability
Changeability
Stability
Testability
Adaptability
Installability
Conformance
Replaceability
Functionality
Quality characteristic
(©[1996] IEEE)
Existence of functions that satisfy stated needs.
Maintain performance level under stated condition and time
Performance and resource usage
Effort needed to use
Effort needed to make modifications
Ability to be transferred to another environment

Appendix
OO Principles
26/24ⓒ KAIST SE LAB 2013
Definition Benefits
Encapsulation hides the implementation details
reduces complexity easier maintenance
Inheritance allows child classes inherits the characteristics of existing parent class
Extensibility ReusabilityProvides abstractionEliminates redundant code
Polymorphism ability to take more than one form (objects have more than one type)
Extensibility ReusabilityProvides abstractionEliminates redundant code

Appendix
Design Property Definitions
27/24ⓒ KAIST SE LAB 2013

Appendix
Design Metrics Descriptions
28/24ⓒ KAIST SE LAB 2013

Appendix
Case Study 2
29/24ⓒ KAIST SE LAB 2013

Appendix
Spearman’s coefficient table Given 14 pairs, and a value of 0.55, there is about 2%
probability that it had occurred by chance.
30/24ⓒ KAIST SE LAB 2013

Appendix QMOOD Validation
Results
Results Comparison
31/24ⓒ KAIST SE LAB 2013
Proj. Eval.1 QMOOD d d2
1 12 13 1 1
2 13 9 4 16
3 2 3 1 1
4 9 12 3 9
5 1 1 0 0
6 8 5 3 9
7 4 11 7 49
8 3 8 5 25
9 5 7 2 4
10 6 2 4 16
11 11 4 7 49
12 7 6 1 1
13 10 10 0 0
14 14 14 0 0
16∑
1
0.55 means significant
Correlation analysis