a human capital concern - ets home human capital concern: the literacy profi ciency of u.s....
TRANSCRIPT

Policy Information Report
A Human Capital Concern: The Literacy Profi ciency of U.S. Immigrants
Research & Development
Policy Information Center
Center for Global Assessment
This report was written by:
Andrew SumCenter for Labor Market StudiesNortheastern University
Irwin KirschCenter for Global AssessmentEducational Testing Service
Kentaro YamamotoCenter for Global AssessmentEducational Testing Service
The views expressed in this report are those of the authors and do not necessarily refl ect the views of the officers and trustees of Educational Testing Service.
Additional copies of this report can be ordered for $15 (prepaid) from:
Policy Information CenterMail Stop 19-RETSRosedale RoadPrinceton, NJ 08541-0001(609) [email protected]
Copies can be downloaded from:www.ets.org/research/pic
Copyright © 2004 by Educational Test ing Serv ice. Al l r ights reserved. Educational Testing Service is an Affi rmative Action/Equal Opportunity Employer. Educational Testing Service, ETS, and the ETS logo are registered trademarks of Educational Testing Service.
March 2004
Center for Global AssessmentPolicy Information CenterResearch and DevelopmentEducational Testing Service
Preface. . . . . . . . . . . . . . . . . . . . . . . . . . . . . . . . . . . . . . . . . . . . . . . . . . . . . . . . . . . . . . . 1
Acknowledgments. . . . . . . . . . . . . . . . . . . . . . . . . . . . . . . . . . . . . . . . . . . . . . . . . . . . . . 2
Executive Summary. . . . . . . . . . . . . . . . . . . . . . . . . . . . . . . . . . . . . . . . . . . . . . . . . . . . . 3
Introduction . . . . . . . . . . . . . . . . . . . . . . . . . . . . . . . . . . . . . . . . . . . . . . . . . . . . . . . . . . . 4
Overview of the Contents of the Monograph. . . . . . . . . . . . . . . . . . . . . . . . . . . . . . . . . 6
The Impacts of Foreign Immigration on Population and Labor Force Growth in the U.S. . . . . . . . . . . . . . . . . . . . . . . . . . . . . . . . . . . . . . . . . . . . . . . . . . . . . . . . . . . . . 7
The National Adult Literacy Survey and the International Adult Literacy Survey . . . . 9
The Literacy Profi ciencies of Immigrants in the U.S.. . . . . . . . . . . . . . . . . . . . . . . . . . 11
The Literacy Profi ciencies of Immigrants by Years of Schooling Completed, Length of Stay in the U.S., and Years Spent Learning English . . . . . . . . . . . . . . . . . . 14
A Multivariate Statistical Analysis of the Composite Profi ciencies of Immigrants. . . . . . . . . . . . . . . . . . . . . . . . . . . . . . . . . . . . . . . . . . . . . . . . . . . . . . . . . 18
Comparisons of the Literacy Profi ciencies of Immigrants in the U.S. With Their Peers in High-Income Countries. . . . . . . . . . . . . . . . . . . . . . . . . . . . . . . . . 21
The Literacy Profi ciencies of Immigrants and Their Labor Force Behavior . . . . . . . . 25
Types of Jobs Held by Employed Immigrants . . . . . . . . . . . . . . . . . . . . . . . . . . . . . . . 30
The Weekly and Annual Earnings of Employed Immigrants by Their Literacy Profi ciency Levels . . . . . . . . . . . . . . . . . . . . . . . . . . . . . . . . . . . . . . . . . . . . . . . . . . . . . 32
The Annual Earnings of Immigrants in 1999 . . . . . . . . . . . . . . . . . . . . . . . . . . . . . . . . 36
Immigrant Workers’ Perceptions of Their Job-Related Reading, Writing, and Arithmetic Skills . . . . . . . . . . . . . . . . . . . . . . . . . . . . . . . . . . . . . . . . . . . . . . . . . . . 38
The Literacy Profi ciencies of Immigrants and their Poverty Status . . . . . . . . . . . . . . 41
The Receipt of Government Cash Transfers by Immigrants and the Native Born . . . . . . . . . . . . . . . . . . . . . . . . . . . . . . . . . . . . . . . . . . . . . . . . . . . 42
Schooling, English-Speaking Profi ciency, and the Citizenship Status of Immigrants. . . . . . . . . . . . . . . . . . . . . . . . . . . . . . . . . . . . . . . . . . . . . . . . . . . . . . . . . 44
Immigrants’ Participation in Selected Educational, Literacy, and Civic Activities . . . . . . . . . . . . . . . . . . . . . . . . . . . . . . . . . . . . . . . . . . . . . . . . . . . . . . . . 46
Immigrants’ Ratings of Their Current Reading, Writing, and Arithmetic Skills Needed for Daily Life . . . . . . . . . . . . . . . . . . . . . . . . . . . . . . . . . . . . . 48
Summary of Key Research Findings and Their Public Policy Implications . . . . . . . . 50
Summary of Key Findings . . . . . . . . . . . . . . . . . . . . . . . . . . . . . . . . . . . . . . . . . . . . 50
Implications for Public Policy . . . . . . . . . . . . . . . . . . . . . . . . . . . . . . . . . . . . . . . . . 51
Appendix A: The Mean Profi ciencies of the Native Born and Immigrants in the U.S. by Years of Schooling Completed: Findings from the NALS Survey . . . . 55
Appendix B: Multiple Regression Analysis of the Prose Profi ciencies of U.S. Immigrants: Findings from the IALS Survey . . . . . . . . . . . . . . . . . . . . . . . . . . . . . . . . 56
Appendix C: The Selection of the 19 Other High-Income Countries for Inclusion in the IALS Comparative Analysis of Immigrants’ Literacy Profi ciencies. . . . . . . . . . 58
Appendix D: The Average Weekly Earnings of Full-Time Employed Immigrants in the U.S.: Findings from the NALS Survey. . . . . . . . . . . . . . . . . . . . . . . . . . . . . . . . . 59
Appendix E: The 1999 Mean Annual Earnings of Employed Male and Female Immigrants in the U.S. by Years of Schooling and English-Speaking Profi ciency:Findings from the 2000 Census . . . . . . . . . . . . . . . . . . . . . . . . . . . . . . . . . . . . . . . . . . 60

1
Preface
This monograph is the second in a series designed to take the vast amount of background and assessment information that has been collected from the National Adult Literacy Survey (NALS) and the International Adult Literacy Survey (IALS) and produce a set of papers that deal with topics of interest and importance to a range of constituencies. The fi rst report, The Twin Challenges of Mediocrity and Inequality: Literacy in the U.S. from an International Perspective, focused on the literacy performance of U.S. adults in comparison to adults in other high-income countries. The report underscored the fact that our overall performance is mediocre at best and that as a nation we are among the world’s leaders in the degree of inequality between our best and poorest performers.1
This second report helps us to understand these performance patterns in greater depth by focusing on the literacy profi ciencies of the nation’s immigrant population. The authors characterize the literacy profi ciencies of our nation’s foreign born and compare their performance not only with adults born in the U.S. but with their foreign-born counterparts in other high-income countries around the world. This infor-mation comes at an important time in our nation’s history. New immigration reached historically high levels during the decade of the 1990s, with between 13 and 14 million new immigrants arriving on our shores. These individuals accounted for more than 40% of our nation’s population growth over this most recent decade. High levels of immigration are projected for the current decade as well.
The rising share of our nation’s population that is foreign born and their increasing diversity in terms of their national origins, their native languages, and their educational experiences challenge us to better under-stand their English-language profi ciencies so that we can better serve them and our nation in the future. Among the fi ndings reported here are the following:
� A majority of our nation’s 16-65 year old foreign born demonstrate profi ciencies in the lowest lit-eracy level (Level 1) on each of the NALS and IALS literacy scales while fewer than 10% performed in Levels 4 or 5, the highest two literacy levels.
� The average literacy profi ciency of the nation’s immigrant population is considerably below that of their native born peers in the U.S. and their for-eign born counterparts in most other high-income countries that participated in the IALS assessment. And, although literacy of the nation’s foreign born is positively associated with educational attain-ment, language fi rst learned as a child, and years spent learning English, the gaps between the profi ciencies of the native and foreign born exist at every educational level.
� The literacy profi ciency of the nation’s immigrant populations is strongly associated with their labor market behaviors and outcomes. More literate immigrant adults are more likely to be actively participating in the labor force, to fi nd work when they do enter the labor market, to gain access to more highly skilled jobs, and to earn far more per week and per year than their less literate counter-parts in the U.S. More years of formal education, stronger English-speaking skills, and more profi -cient literacy skills signifi cantly raise the earnings of immigrant adults.
� In terms of lifelong learning, we see that the more literate immigrant adults are also more likely to be enrolled in education and training programs, to visit public libraries, to participate in civic and community affairs, and to keep abreast of public affairs.
Throughout our history, we have seen both intense debates about immigration policies and practices, as well as the indisputable impact that immigration has had on the course of our country’s development. These debates are likely to continue as the current wave of immigration brings both a large group of individuals with low literacy skills and limited employment poten-tial at the same time other segments of the immigrant population are fi lling our most selective and highly skilled employment fi elds. Going forward, we need to consider how immigration policies relate to high school graduation rates, overall literacy rates, quality improvements in our labor force, and reductions in wage and income inequalities.
1 Andrew Sum, Irwin Kirsch, and Robert Taggart, The Twin Challenges of Mediocrity and Inequality: Literacy in the U.S. from an International Perspective, Policy Information Center, Center for Global Assessment, Educational Testing Service, 2002. (www.ets.org/research/pic/twinchall.pdf)
2
This report provides valuable information that should help inform such deliberations. However, this study raises signifi cant questions that need to be explored in the future. For example, the impact of immigration must be considered over time. What are the literacy patterns of the children and grandchildren of immigrants in succeeding generations? Also, im-migrants and their entering literacy skills are widely disparate. How should we disaggregate immigration data to best inform policy decisions?
What is clear is that the majority of the immigrant population is lacking literacy skills suffi cient to be successful in this society. A spirited national debate is needed about how best to boost the human capital skills of existing immigrant populations as well as about some of our current immigration policies. As a nation, we need to invest more in those individuals we allow to immigrate into the U.S. so that they are better assimilated into our schools, labor markets, and social institutions.
Drew GitomerSenior Vice PresidentResearch and Development
Acknowledgments
The authors appreciate the thoughtful feedback and suggestions on the report made by Paul Barton, Richard Coley, and Julie Eastland of ETS; John Com-ings of the National Center for the Study of Adult Learning and Literacy; and Scott Murray of Statistics Canada. Thanks are also owed to Ishwar Khatiwada of the Center for Labor Market Studies, Northeast-ern University and to Minwhei Wang of ETS for their
research assistance in preparing this monograph, and to Sheila Palma of the Center for Labor Market Studies, Northeastern University for word process-ing of numerous drafts of this report. Lynn Jenkins was the editor; Loretta Casalaina of ETS provided desktop publishing services, and Joe Kolodey of ETS designed the cover. Errors of fact or interpretation are those of the authors.

3
Executive Summary
Findings from two national literacy assessments — the National Adult Literacy Survey and the International Adult Literacy Survey — have been used to produce comprehensive profi les of the literacy profi ciencies of the U.S. and international adult populations. Reports have also been published on selected subgroups in the U.S., including the older population, the federal and state inmate population, and the labor force.
During the 1990s, a record number of new foreign immigrants (13.7 million) came to the U.S., generat-ing more than 40% of the nation’s resident population growth over the decade. As the foreign-born share of the population rises, knowledge of the literacy profi -ciencies of this population group becomes indispens-able for interpreting the overall literacy performance of the nation’s adults, trends in the literacy profi cien-cies of the U.S. population over time, and the potential need for public policies to address existing English literacy and educational defi cits among this group.
This report profi les the prose, document, quantita-tive, and composite literacy profi ciencies of the na-tion’s immigrant adults in the 1990s and describes the labor market and social consequences of the results. A brief summary of the major fi ndings is presented here. A more complete summary of the fi ndings and an assessment of their implications for public policy are provided at the end of the report.
� The average literacy profi ciency of the nation’s adult immigrants is low, falling well below the averages for all U.S. adults. A majority of the immigrant population falls into the lowest profi ciency level.
� The average literacy profi ciency of immigrants increases with level of education, number of years learning English, and length of stay in the U.S.
� U.S. immigrants had lower average profi ciency than immigrants in other higher-income countries even when the level of education is considered.
� Immigrants with higher literacy profi ciencies had better labor market outcomes and wages and were less likely to be poor and need government support.
� Immigrants with higher literacy profi ciencies were more likely to be involved civically and politically, and more likely to be enrolled in education programs.

4
Introduction
During the past decade, an increasing number of em-pirical studies by economists, educational researchers, and other social scientists have documented the criti-cal importance of human capital for the economic and social success of individual workers, their families, regional economies, and nations.2 As Gary Becker, a Nobel Prize winner in economics and a pioneer in the development of human capital theory recently noted: “This is the ‘age of human capital’ in the sense that human capital is by far the most important form of capital in modern economies.”3
There are a variety of human capital investments that make up the human capital stock of society, in-cluding the literacy and numeracy profi ciencies of its population, formal and informal schooling, vocational/technical/professional training, health, work attitudes, and work experience. The literacy skills of individuals infl uence a wide variety of outcomes, including edu-cational attainment, employability, earnings, health, and civic behavior.4 Given their importance, during the 1990s, two major national assessments of the literacy profi ciencies of a representative sample of the
U.S. adult population were undertaken.5 The fi rst of these was the National Adult Literacy Survey (NALS), which was conducted during 1992 by Educational Testing Service for the U.S. Department of Education. The second was the International Adult Literacy Sur-vey (IALS), which was administered in 23 countries around the world, including the U.S., over the 1994-98 period.
Findings of these two national literacy assessments have been used to produce comprehensive profi les of the literacy profi ciencies of the U.S. adult popula-tion and selected demographic and socioeconomic subgroups, including comparisons with the literacy skills of adults in other countries.6 Separate reports also were prepared on the literacy profi ciencies of the nation’s older population (65 and older) and the fed-eral and state inmate population.7 Other monographs have analyzed the literacy profi ciencies of the nation’s labor force and the links between the literacy skills of workers and their employability, weeks and hours of employment, occupational attachment, and weekly and annual earnings.8
2 See: (i) Robert J. Barro, “Education as a Determinant of Economic Growth,” in Education in the Twenty-First Century, Hoover Institution Press, Stanford University, 2002, pp. 9-24; (ii) Eric A. Hanushek, “The Importance of School Quality,” in Our Schools and Our Future: Are We Still at Risk? (Editor: Paul E. Peterson), Hoover Institution Press, Stanford University, 2003, pp. 141-176; (iii) Richard J. Murnane and Frank Levy, Teaching the New Basic Skills, The Free Press, New York, 1996; (iv) Susan Mayer and Paul E. Peterson (Editors), Earning and Learning: How Schools Matter, The Brookings Institution, Washington, D.C., 1999; (v) Organisation for Economic Cooperation and Development, The Well-Being of Nations: The Role of Human and Social Capital, Paris, 2001.
3 See: Gary S. Becker, “The Age of Human Capital,” in Education in the Twenty-First Century (Editor: Edward P. Lazear), Hoover Institu-tion Press, Stanford University, 2002, p. 3.
4 For a review of links between literacy and health outcomes, See: Rima Rudd, B.A. Moeykens and T.C. Colton, “Health and Literacy: A Review of the Medical and Public Health Literature,” in The Annual Review of Adult Learning and Literacy (Editor: John P. Comings et al.), Jossey-Bass Publishers, San Francisco, 1999.
5 For an interpretation of the literacy scales and performance on the NALS assessment, See: Paul E. Barton, Becoming Literate About Literacy, Policy Information Center, Educational Testing Service, Princeton, 1994.
6 See: (i) Irwin S. Kirsch, Ann Jungeblut, Lynn Jenkins, and Andrew Kolstad, Adult Literacy in America, U.S. Department of Education, Washington, D.C., 1993; (ii) Andrew Sum, Irwin Kirsch, and Robert Taggart, The Twin Challenges of Mediocrity and Inequality: Literacy in the U.S. from an International Perspective, Policy Information Center, Center for Global Assessment, Educational Testing Service, Princ-eton, 2002. Comparisons of the literacy proficiencies of the U.S. adult population with those of the other 22 countries participating in the IALS assessment are presented in the following two volumes: (i) Organisation for Economic Cooperation and Development and Statistics Canada, Literacy in the Information Age: Final Report of the International Adult Literacy Survey, Ottawa, Canada, 2000; (ii) Albert Tuijn-man, Benchmarking Adult Literacy in America: An International Comparative Study, Division of Adult Education and Literacy, Office of Vocational and Adult Education, U.S. Department of Education, Washington, D.C., September 2000.
7 See: (i) Helen Brown, Robert Prisuta, Bella Jacobs, and Anne Campbell, Literacy of Older Adults in America, National Center for Educa-tion Statistics, Washington, D.C., 1995; (ii) Karl O. Haigler, Caroline Harlow, Patricia O’Connor, and Anne Campbell, Literacy Behind Prison Walls: Profiles of the Prison Population for the National Adult Literacy Survey, National Center for Education Statistics, U.S. De-partment of Education, Washington, D.C., 1994.
8 See: (i) Andrew Sum, Literacy in the Labor Force, National Center for Education Statistics, Washington, D.C., 1999; (ii) Andrew Sum, Neeta Fogg, and Garth Mangum, Confronting the Youth Demographic Challenge: The Labor Market Prospects of Out-of-School Young Adults, Sar Levitan Center for Social Policy Studies, Johns Hopkins University, Baltimore, 2000.

5
One demographic group in the U.S. whose literacy skills deserve special consideration is the nation’s for-eign-born population. Over the past few decades, there has been a substantial infl ux of new foreign immi-grants into the U.S. During the 1990s, a record num-ber of new foreign immigrants (13.7 million) came to the U.S., generating more than 40% of the nation’s resident population growth over the decade.9 As the foreign-born share of the population has risen and is projected to do so over the coming decade, knowledge of the literacy profi ciencies of this population group becomes indispensable for interpreting the overall literacy performance of the nation’s adults, trends in the literacy profi ciencies of the U.S. population over time, and the potential need for public policies to ad-dress existing English literacy and educational defi cits among this group. This monograph is devoted to a description and analysis of the literacy profi ciencies of the nation’s immigrant adults in the 1990s based on
the fi ndings of the 1992 National Adult Literacy Survey and the 1994 International Adult Literacy Survey.
For both the NALS and IALS surveys, nation-ally representative samples of adults in the U.S. were asked to complete a background questionnaire and perform a variety of literacy tasks designed to assess their prose, document, and quantitative profi ciencies. (Further details about the surveys are provided later in this report.) One of the background questions asked respondents whether they were born in the U.S. or an-other country. In the IALS survey, about 13% of adults 16-65 years of age who answered this question (repre-senting approximately 19,871,000 adults nationwide) reported that they were born outside the U.S. or one of its territories while 87% of the respondents (represent-ing about 136,922,000 adults nationwide) were native born. The remainder (representing about 3.5 million adults) did not answer this question.
9 The foreign immigrant estimates include persons who migrated to the U.S. from Puerto Rico, the U.S. Virgin Islands, and other outlying territories of the U.S., See: Andrew Sum, Ishwar Khatiwada, Nathan Pond, and Jacqui Motroni, The New Great Wave: Foreign Immigra-tion in the U.S. and Massachusetts During the Decade of the 1990s, Paper Prepared by the Center for Labor Market Studies, Northeastern University, for the Teresa and H. John Heinz III Foundation, Washington, D.C., 2002.

6
Overview of the Contents of the Monograph
This monograph provides a comprehensive descrip-tion and analysis of the literacy profi ciencies of the adult immigrant population (16-65 years old) in the U.S. in recent years and assesses their implications for the labor force behavior, employment, earnings, incomes, and civic behavior of the immigrant popula-tion. The fi rst section will present a brief overview of the unprecedented increase in the nation’s immigrant population over the past decade and its impact on the growth of the nation’s resident population and civil-ian labor force. Some of the educational and Eng-lish-speaking defi cits of these new immigrants will be briefl y reviewed.
The second section will describe and assess the literacy performance of the nation’s immigrant popula-tion on each of the four literacy scales, compare their performance to that of the nation’s native-born popu-lation, and review variations in the literacy perfor-mance of the immigrant population across educational subgroups, years spent studying English, and length of stay in the U.S.
The third section will compare the literacy profi -ciencies of immigrants in the U.S. with those of their counterparts in 19 other high-income countries across the world and identify the percentile rankings of the test scores of the U.S. immigrant population along the literacy skills distribution for all adults in 20 high-in-come countries around the world.
The fourth section of the monograph will examine the labor force status of immigrants across profi ciency levels along each of the four scales at the time of the IALS survey and compare the mean literacy profi cien-cies of immigrants who were employed, unemployed, and not active in the labor force. The mean profi cien-cies of immigrants in each labor force activity category will be compared to those of native-born adults in the U.S. and immigrants in the other 19 high-income countries participating in the IALS surveys.
The fi fth section of the monograph will examine variations in full-time employment, annual weeks of employment, supervisory responsibilities of jobs, occupational characteristics of jobs, and the weekly and annual earnings of employed immigrants in each profi ciency level along selected literacy scales. Both IALS and NALS survey data will be used in conducting this labor market analysis.
The sixth section of the monograph will review fi ndings of the IALS survey with respect to immi-grants’ own ratings of their reading, writing, and arithmetic skills in their current jobs and in their daily lives.
The seventh section will examine relationships be-tween the literacy and civic practices and the citizen-ship status of immigrants and their profi ciencies on the composite literacy scale.
The fi nal section will summarize main fi ndings of our research and assess their implications for future educational, labor market, training, citizenship, and immigration policies in the U.S.

7
The Impacts of Foreign Immigration on Population and Labor Force Growth in the U.S.
10 See: (i) Andrew Sum et al., The New Great Wave, 2002. (ii) Andrew Sum, Neeta Fogg, Paul Harrington, et al., Immigrant Workers and the Great American Job Machine: The Contributions of New Foreign Immigration to National and Regional Labor Force Growth in the 1990s, Report Prepared for the Business Roundtable, Washington, D.C., August 2002.
11 The immigrant estimates include persons born in Puerto Rico or one of the outlying territories of the U.S. The estimates are based on the recently released 1-100 PUMS sample from the 2000 Census.
12 Andrew Sum et al., The New Great Wave, 2002. 13 This latter region consists of the states of Alabama, Kentucky, Mississippi, and Tennessee.14 These estimates are based on an analysis of the 2000 Census PUMS files for the U.S. by Andrew Sum and Ishwar Khatiwada at the Center
for Labor Market Studies of Northeastern University in Boston. Persons holding a GED certificate are treated as the equivalent of a regu-lar high school graduate by the U.S. Census Bureau.
15 Nationally, of those immigrants still living in the U.S. at the time of the 2000 Census but who arrived prior to 1970, nearly 40% were from Europe and 8% from Canada.
16 Those persons stating they could not speak English or could not speak it well are categorized as limited English-speaking.
New foreign immigration has played a critical though infrequently recognized role in generating population growth in the U.S. over the past two decades.10 During the 1990s, 13.56 million net new immigrants arrived in the U.S., accounting for 41.4% of the net increase in the resident population of the nation over the decade.11 The absolute level of immigration and its share of the net increase in the resident population of the nation over the decade were the highest in the past 100 years, exceeding the impacts of new immigration during the Great Wave of immigration over the 1890-1910 period.12 The contributions of foreign immigration to population growth, however, varied considerably by geographic region and state. In the Middle Atlan-tic region (New Jersey, New York, and Pennsylvania), new immigration accounted for all of the region’s population growth, and it generated 86% and 65% of the growth in the resident population of New England and the Pacifi c region, respectively. At the other end of the distribution, new immigration was responsible for slightly under one-fi fth of the population growth in the Rocky Mountain region and only 11% of the growth in the East South Central region.13
The educational backgrounds, English-speak-ing profi ciencies, and national origins of the nation’s
newest immigrants raise serious questions about their English literacy profi ciencies. Of all 18-64 year old foreign-born persons who arrived in the U.S. during the decade of the 1990s, nearly 40% still lacked a high school diploma or a GED certifi cate, a ratio nearly four times as high as that among the native born.14 At the same time, it should be noted that 23% of these new adult immigrants held a bachelor’s or higher aca-demic degree at the time of the 2000 Census, only one percentage point below the share of the native born with bachelor’s or higher degrees (24%).
The national origins of these new immigrants in recent decades also differ considerably from those who arrived prior to 1970.15 Among those who arrived in the 1990s, 45% were from Mexico, Central America, or South America and 26% were from Asia. Only 2% came from Canada, and fewer than 2% came from English-speaking countries in Western Europe. At the time of the 2000 Census, nearly 33 million adults ages 18-64 reported that they spoke a language other than English, a gain of more than 11 million over the decade. Of this group of 33 million immigrants, 15.5 million, or nearly half, reported to the Census Bureau that they had limited to modest English-speaking abilities.16

8
New foreign immigration played an even larger role in generating growth in the civilian labor force of the nation over the 1990s decade.17 An above aver-age proportion of the nation’s new immigrants were of working age, and many were in the 20-39 year old age group which has high rates of labor force partici-pation. Over the decade, nearly 6.8 million new im-migrants joined the labor force of the nation, account-ing for nearly 50% of the growth in the nation’s labor force. Among males, new immigrants accounted for more than 70% of labor force growth. Their contribu-
tion to labor force growth during the past decade was the highest in the post-World War II era.18 From 1990-2000, the impact of new immigration on labor force growth varied considerably by geographic region, ranging from a low of 12% of labor force growth in the East South Central region to a high of 372% in the Middle Atlantic region, according to U.S. Census data. All of the growth in the resident civilian labor force of the Pacifi c, New England, and Middle Atlantic regions took place as a consequence of new foreign immigra-tion over the decade.
17 The civilian labor force consists of the working-age members (16+) of the civilian, non-institutional population who were employed or unemployed.
18 See: (i) Andrew Sum, et al., Immigrant Workers and the Great American Job Machine, 2002. (ii) Andrew Sum, Mykhaylo Trubs’kyy, et al., Immigrant Workers in the New England Labor Market: Implications for Workforce Development Policy, Report Prepared for the U.S. Department of Labor, Employment and Training Administration, New England Regional Office, Boston, October 2002.

9
The National Adult Literacy Survey and the International Adult Literacy Survey
19 For a review of the purposes, design features and findings of the National Adult Literacy Survey (NALS), See: (i)Irwin S. Kirsch et al, Adult Literacy in America, 1993. (ii) Karl O. Haigler, et al., Literacy Behind Prison Walls, 1994. (iii) Andrew M. Sum, Literacy in the Labor Force; 1999. (iv) Helen Brown, et al., Literacy of Older Adults in America, 1995.
20 See: (i) Irwin S. Kirsch and Ann Jungeblut, Literacy Profiles of America’s Young Adults, Educational Testing Service, Princeton, New Jer-sey, 1986; (ii) Richard L. Venezky, Carl F. Kaestle, and Andrew M. Sum, The Subtle Danger: Reflections on the Literacy Ability of America’s Young Adults, NAEP Rep. 16-CAEP-01, Princeton, NJ: Educational Testing Service, 1987; (iii) Irwin S. Kirsch, Ann Jungeblut and Anne Campbell, Beyond the School Doors: The Literacy Needs of Job Seekers Served by the U.S. Department of Labor, Educational Testing Ser-vice, Princeton, New Jersey, 1992.
21 For further information on the sample size and design of the NALS survey, See: Irwin S. Kirsch et al., Adult Literacy in America, pp. 5-7.22 For a review of the purposes, design features, sample design, timing, and findings of the International Adult Literacy Surveys, See: (i)
Organisation for Economic Cooperation and Development and Statistics Canada, Literacy, Economy, and Society; (ii) Organisation for Economic Cooperation and Development and Statistics Canada, Literacy in the Information Age. Key findings of the Canadian survey are presented in Statistics Canada, Reading the Future: A Portrait of Literacy in Canada, Statistics Canada, 1996. For another comparison of the literacy proficiency of Americans with that of other populations, See: Albert Tuijnman, Benchmarking Adult Literacy in America, 2000.
23 In a few countries, persons under 16 and older than 65 were included in the survey. For example, Australia surveyed individuals from age 15 to age 74. However, the findings presented in this report are restricted to the 16-65 population.
24 For a review of sample design issues, See: Organisation for Economic Cooperation and Development and Statistics Canada, Literacy in the Information Age, 2000, pp. 107-121.
Over the past decade, two key national literacy assess-ments took place in the U.S., allowing estimates to be made of the literacy profi ciencies of a representative sample of the entire adult population (ages 16 and older). In 1992, the National Adult Literacy Survey (NALS) was undertaken in the U.S. by Educational Testing Service (ETS) for the U.S. Department of Education.19 The NALS survey was the largest and most comprehensive assessment ever undertaken of the literacy profi ciencies of the nation’s entire adult population (16 and older). Many of the literacy con-cepts and measures underlying the NALS assess-ment were originally developed by ETS in two earlier national assessments of the nation’s young adult population (21-25 years old) and of unemployed and economically disadvantaged adults served by unem-ployment insurance and employment and training programs funded by the U.S. Department of Labor.20 The NALS assessment provided information on the literacy profi ciencies of a sample of 26,091 adults 16 and older, including a sample of 1,147 adults in federal and state prisons as well as supplemental samples from 12 states yielding state representative samples.21 In addition to assessing participants’ literacy skills, the NALS gathered extensive background information on their demographic and socioeconomic characteristics (e.g., their age, gender, nativity status, schooling, labor force status, and household income) as well as on their literacy practices.
Following upon the NALS, a pioneering effort was undertaken to develop and conduct the fi rst-ever com-parative, international assessment of adult literacy.
This assessment effort became known as the Interna-tional Adult Literacy Survey (IALS) and involved the joint efforts of participating national governments, their statistical agencies and research bureaus, and the Organisation for Economic Co-operation and Develop-ment (OECD), with technical support from Statistics Canada, Educational Testing Service, and the National Center for Education Statistics in the U.S. Department of Education.22 As with the NALS, a comprehensive background questionnaire in the IALS assessment cap-tured information on respondents’ demographic and socioeconomic characteristics, their labor market and schooling behavior, and their literacy practices.
The international assessments took place in three stages, beginning in 1994 and continuing through 1998. A total of 23 nations took part in the IALS project; most were in North America and Western Europe, but other countries included Australia, Chile, and a variety of Eastern European nations (Hungary, Slovakia, Poland). Our analysis of the IALS data in this study is confi ned to the U.S. and 19 other high-income countries (including multiple linguistic groups in several of these countries). In most countries, the universe consisted of adults in the 16-65 age group who were neither living in institutions (jails, prisons, nursing homes) nor homeless.23 The number of 16-65 year old sample respondents in these 23 countries ranged from a low of 1,239 in Portugal to a high of 8,204 in Australia.24 After reviewing several approaches to measuring literacy, the original partici-pating countries decided to adopt the defi nition and framework for measuring literacy that was used in the NALS survey. This defi nition was the following:

10
Table 1:Range of Scale Scores Corresponding to Each Literacy Level
Level Score Range
1 0 – 225
2 226 – 275
3 276 – 325
4 326 – 375
5 376 – 500
25 The authors felt that a composite scale would be useful in summarizing and presenting some of the results. We also felt it was justified given the similarities in means and standard deviations across the literacy scales.
26 See: John Comings, Andrew Sum, Johan Uvin, et al, New Skills for A New Economy: Adult Education’s Role in Sustaining Economic Growth and Expanding Opportunity, Massachusetts Institute for a New Commonwealth, Boston, 2000.
Using printed and written information to func-tion in society, to achieve one’s goals, and to develop one’s knowledge and potential.
In operationalizing this defi nition, the NALS and IALS assessments measured respondents’ profi cien-cies along three literacy scales: prose, document, and quantitative. Each scale was constructed to range from 0 to 500. A brief description of the tasks and skills un-derlying each of the three literacy scales is presented below.
Prose literacy – the knowledge and skills needed to understand and use information from texts that include editorials, news stories, poems, and fi ction; for example, fi nding a piece of informa-tion in a newspaper article, interpreting instruc-tions from a warranty, inferring a theme from a poem, or contrasting views expressed in an editorial.
Document literacy – the knowledge and skills required to locate and use information con-tained in materials that include job applica-tions, payroll forms, transportation schedules, maps, tables, and graphs; for example, locating a particular intersection on a street map, using a schedule to choose the appropriate bus, or enter-ing information on an application form.
Quantitative literacy – the knowledge and skills required to apply arithmetic operations, either alone or sequentially, using numbers embedded in printed materials; for example, balancing a checkbook, fi guring out a tip, completing an or-der form, or determining the amount of interest from a loan advertisement.
The estimated profi ciencies of respondents on the three literacy scales were also combined to produce a composite profi ciency score. A simple average of the estimated prose, document, and quantitative scores was used to represent the composite performance of each respondent.25
Scores on each of the three literacy scales were characterized in terms of fi ve levels (Table 1), with Level 1 representing the lowest level of profi ciency and Level 5 the highest. Respondents scoring in Level 1 or 2 can best be characterized as possessing very limited to limited literacy profi ciencies. While few of the adults in Levels 1 or 2 would be considered “illiter-ate” in the historical meaning of that term (an inabil-ity to write one’s own name or to read a very simple passage), few have the skills believed to be needed to succeed in today’s more technologically sophisti-cated economy, to gain access to high-wage jobs, or to actively participate in civic and political life. For example, adults who scored in the Level 1 to Level 2 range are performing below the average profi ciencies of adults who terminated their education after gradu-ating from high school or earning their GED. In fact, those in Level 1 are performing below the average score of adults who dropped out of high school and never earned a diploma or its equivalency.Here T1
As a result, a number of national and state organiza-tions in the U.S., including the National Governor’s Asso-ciation, have identifi ed Level 3 profi ciency as the mini-mum standard for success in today’s labor markets.26

11
The Literacy Profi ciencies of Immigrants in the U.S.
27 Performance on each of the three scales – prose, document, and quantitative – was given a weight of one-third in determining the score on the composite scale.
Table 2:Comparisons of the Mean Profi ciency Scores of the Native Born and Immigrants in the U.S. by Profi ciency Scale
Profi ciency Scale Native Born Immigrants Native-Immigrants
Sig. Level of Difference
between Means
Prose 285.7 209.6 76.1 0.01
Document 279.9 204.0 75.9 0.01
Quantitative 286.0 217.4 68.6 0.01
Composite 283.9 210.3 73.6 0.01
Source: IALS survey, 1994.
Table 3:Size of Profi ciency Score Differences Between the Native Born and Immigrants in the U.S. in Standard Deviation Units
Profi ciency Scale Difference S.D. Diff/S.D.
Prose 76.1 68.6 1.10
Document 75.9 71.4 1.06
Quantitative 68.6 67.7 1.01
Composite 73.6 67.9 1.08
Note: Standard deviations are those for all U.S. adults on each scale.Source: IALS survey, 1994.
Estimates of the mean profi ciency scores of the foreign born on each of the four scales are displayed in Table 2, together with estimates of the mean scores for the native born. 27 The mean scores of immigrant adults in the U.S. on each of the four scales were quite low. The mean scores ranged from a low of 204 on the document scale to a high of 217 on the quantitative scale. The mean score on the composite scale was only 210. As expected, there were very substantial gaps in mean test score performance between the native born and foreign born on each of the four scales. The size of these gaps ranged from just under 69 points on the
quantitative scale to 76 points on the prose and docu-ment scales. Each of these differences in mean test score performance was statistically signifi cant at the .01 level. To place these fi ndings on mean test score gaps in comparative perspective, we also calculated their size in standard deviation units (Table 3). On each of the four scales, the differences in mean test score performance between the native and foreign born were equal to 1.0 to 1.1 standard deviations. From both a statistical perspective and an educational policymaking standpoint, these are extraordinarily large differences.Here T2&3

12
The profi ciency scores of immigrants also can be used to assign them to one of the fi ve levels of literacy performance. Given the small numbers of persons overall who achieved a Level 5 profi ciency, we com-
bined the number of respondents who achieved a Level 4-5 performance on each scale. The percentage distri-butions of the foreign born across profi ciency levels on each of the four scales are displayed in Table 4.Here T4
Table 4:Percentage Distribution of Immigrants and Native Born Adults in the U.S. by Level on Each Profi ciency Scale
Foreign Born
Profi ciency Scale Level 1 Level 2 Level 3 Levels 4-5
Prose 54.6 18.6 19.1 7.6
Document 54.1 19.6 19.2 7.0
Quantitative 52.7 16.9 19.4 11.0
Composite 52.8 18.4 21.0 7.8
Native Born
Profi ciency Scale Level 1 Level 2 Level 3 Levels 4-5
Prose 13.9 27.1 35.1 23.9
Document 17.5 27.6 33.6 21.3
Quantitative 14.9 26.8 33.3 25.0
Composite 15.0 27.0 35.8 22.2
Source: IALS survey, 1994.
On each of the four literacy scales, a substantial majority of the foreign born fell into Levels 1 or 2, indicating the existence of highly defi cient (Level 1) to quite limited (Level 2) profi ciencies. For example, on the prose scale, 73% of the foreign born achieved only a Level 1 or 2 performance, while nearly 70% of them did so on the quantitative scale and 71% on the com-posite profi ciency scale.
While nearly 53% of the foreign born demonstrat-ed a Level 1 composite profi ciency, only 15% of the native born did so, and slightly over 71% of the foreign born fell into the two lowest levels on the composite profi ciency scale in comparison to 42% of the native born. Relatively few of the foreign born were able to achieve a Level 4 or 5 performance on each scale. Only 8% obtained a Level 4 or 5 performance on the composite literacy scale in comparison to 22% of the native born.
Rather than examine the mean profi ciencies of the foreign born on each literacy scale, we analyze their median profi ciencies and identify the percentile rankings associated with the median scores of both the foreign and native born. The median test score is that score which divides the distribution of the literacy pro-fi ciencies of all U.S. adults into two equals parts. The median score is equivalent to the 50th percentile. Due to the existence of some very low scores on the lower tail of the literacy distribution for the foreign born, their median test scores tend to be slightly higher than their mean scores.28
The median profi ciency scores of the foreign born were quite low, ranging from a low of 207 on the docu-ment scale to highs of 215 on the quantitative and composite scales (Table 5). The median scores of the foreign born on these four scales were 73 to 76 points below the median scores of the native born. The per-
28 The distribution of proficiency scores for the foreign born, except for the quantitative scale, tends to be modestly skewed to the left. The same is true for the distribution of proficiency scores for the native born, with medians exceeding means.

13
centile rankings along the U.S. literacy scale distribu-tion associated with the median scores of the foreign born ranged from 16th on the prose scale to 19th on the document scale. Typically, 40% of the foreign born had literacy profi ciencies that fell into the bottom 10% of the distribution for all U.S. adults, and a slight majority of all of the foreign born fell into the bottom quintile (20%) of the profi ciency distribution (Table 6). Across the scales, approximately three fourths of the foreign born had profi ciency scores in the bottom half of the distribution, and only about 5 to 7 percent of them were able to achieve a profi ciency score high
enough to reach the top quintile (i.e., top 20%) of the test score distribution for all adults in the nation.
Given the existing educational backgrounds and language skills of the nation’s immigrants, including many of those who arrived in the 1990s, their surging numbers have tended to reduce the average level of literacy in the U.S. and made it more diffi cult for the nation to achieve a number of its key national educa-tional goals. There is an inherent set of tensions be-tween the nation’s existing immigration policies and a number of its educational goals, including high school completion rates and adult literacy profi ciencies.Here T5&6
Table 6:Percent Distribution of Immigrants in the U.S. by Their Scores at Various Points Along the Profi ciency Score Distributions
Percentile of Score Prose Document Quantitative Composite
In the bottom tenth 41 40 38 41
In the bottom fi fth 55 51 53 52
In the bottom half 76 74 70 75
In the top fi fth 5 5 7 4
Source: IALS survey, 1994.
Table 5:Median Scores and Percentile Rankings of Median Scores of the Native Born and Immigrants in the U.S. on Each Profi ciency Scale: (U.S. Test Distribution)
Profi ciency ScaleMedian Score Native
BornMedian Score Immigrants
Percentile Rank Native Born
Percentile Rank Immigrants
Prose 288.4 211.9 55th 16th
Document 282.7 207.5 55th 19th
Quantitative 287.9 215.1 53rd 18th
Composite 289.5 215.1 55th 17th
Source: IALS survey, 1994.

14
The Literacy Profi ciencies of Immigrants by Years of Schooling Completed, Length of Stay in the U.S., and Years Spent Learning English
29 The standard deviation of the composite proficiency scores for the foreign-born adult population in the U.S. was more than 80 points.30 For empirical evidence on this issue, See: (i) Susan Mayer and Paul E. Peterson (Editors), Earning and Learning: How Schools Matter,
1999; (ii) Andrew Sum, Literacy in the Labor Force, 1999.
Table 7:Mean Profi ciency Scores of Immigrants in the U.S. by Years of Schooling Completed
Years of Schooling Prose Document Quantitative Composite
0 126.4 101.5 130.7 119.5
1-8 145.6 133.5 148.4 142.5
9-11 years, no diploma or GED 185.4 194.8 198.7 193.0
12 Years or GED, no post secondary schooling 208.7 204.5 216.9 210.0
13-15 years including associates degree 243.0 235.1 253.4 243.8
Bachelor’s degree 245.2 240.4 258.8 248.1
Master’s or higher 314.5 284.9 308.6 302.7
Source: IALS survey, 1994.
The average performance of the nation’s foreign-born population on the IALS literacy assessment was found to be quite limited, but there was a high degree of dispersion in estimates of individual profi ciency around the mean.29 Knowledge of the sources of this variation would be useful for future educational and immigration policymaking. To identify how the aver-age profi ciency scores of the foreign born varied by their human capital traits and their length of stay in the U.S., we estimated mean profi ciency scores for the foreign born in selected subgroups representing their schooling experiences, length of stay in the U.S., and length of time spent learning English.
The mean prose, document, quantitative, and com-posite profi ciency scores of the foreign born in seven
educational groups are displayed in Table 7. These edu-cational groups range from those with no years of for-mal schooling to those possessing a master’s or higher degree. On each of the four scales, the mean scores of the foreign born rise steadily and strongly with the number of years of schooling they had completed. For example, on the prose scale, the mean scores of the foreign born ranged from a low of 126 for those with no formal schooling to 209 for those with a high school diploma/GED to a high of 315 for those with a master’s or more advanced academic degree. Similarly, on the composite scale, the mean scores ranged from only 120 for those with no formal schooling to 210 for those with a high school diploma to a high of 303 for those with a master’s or more advanced degree.Here T7
The increases in the mean profi ciency scores of the foreign born as they completed more years of school-ing were quite substantial. The differences between the mean scores of high school graduates and those with only a primary school education ranged from 63 to 71 points across the scales. These differences in mean test scores are equivalent to .8 to .9 standard deviations. The gaps between the mean profi ciency scores of mas-ter’s and other advanced degree holders and those with only a high school education varied from 80 to 106 points on each of the four scales, with these differences
being equivalent to 1.0 to 1.3 standard deviations. Schooling completion and the literacy performance of the foreign born were closely linked, but the relation-ships between these two variables are mutually rein-forcing. Those young adults who have higher literacy and academic achievement test scores are signifi cantly more likely to complete additional years of formal schooling.30 Future public policy efforts to strengthen the literacy profi ciencies and educational attainment of the nation’s foreign born will have to go hand in hand.
15
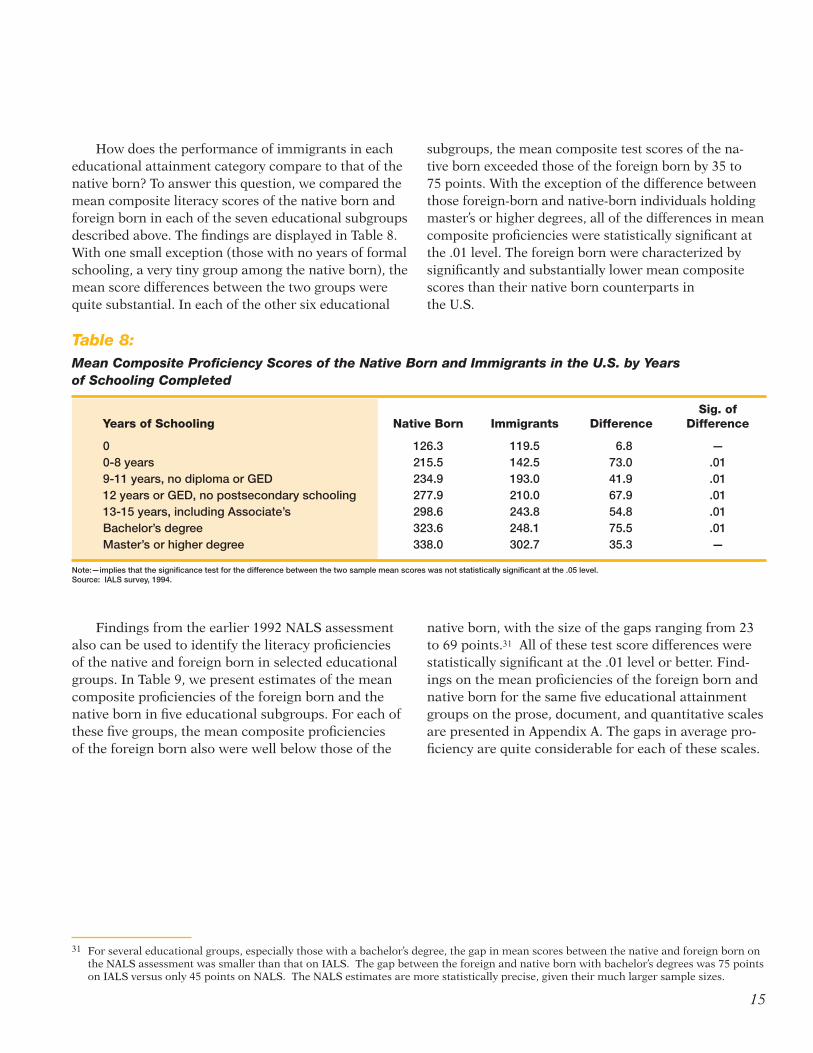
How does the performance of immigrants in each educational attainment category compare to that of the native born? To answer this question, we compared the mean composite literacy scores of the native born and foreign born in each of the seven educational subgroups described above. The fi ndings are displayed in Table 8. With one small exception (those with no years of formal schooling, a very tiny group among the native born), the mean score differences between the two groups were quite substantial. In each of the other six educational
subgroups, the mean composite test scores of the na-tive born exceeded those of the foreign born by 35 to 75 points. With the exception of the difference between those foreign-born and native-born individuals holding master’s or higher degrees, all of the differences in mean composite profi ciencies were statistically signifi cant at the .01 level. The foreign born were characterized by signifi cantly and substantially lower mean composite scores than their native born counterparts in the U.S.Here T8
31 For several educational groups, especially those with a bachelor’s degree, the gap in mean scores between the native and foreign born on the NALS assessment was smaller than that on IALS. The gap between the foreign and native born with bachelor’s degrees was 75 points on IALS versus only 45 points on NALS. The NALS estimates are more statistically precise, given their much larger sample sizes.
Table 8:Mean Composite Profi ciency Scores of the Native Born and Immigrants in the U.S. by Years of Schooling Completed
Years of Schooling Native Born Immigrants DifferenceSig. of
Difference
0 126.3 119.5 6.8 —0-8 years 215.5 142.5 73.0 .019-11 years, no diploma or GED 234.9 193.0 41.9 .0112 years or GED, no postsecondary schooling 277.9 210.0 67.9 .0113-15 years, including Associate’s 298.6 243.8 54.8 .01Bachelor’s degree 323.6 248.1 75.5 .01Master’s or higher degree 338.0 302.7 35.3 —
Note:—implies that the signifi cance test for the difference between the two sample mean scores was not statistically signifi cant at the .05 level.Source: IALS survey, 1994.
Findings from the earlier 1992 NALS assessment also can be used to identify the literacy profi ciencies of the native and foreign born in selected educational groups. In Table 9, we present estimates of the mean composite profi ciencies of the foreign born and the native born in fi ve educational subgroups. For each of these fi ve groups, the mean composite profi ciencies of the foreign born also were well below those of the
native born, with the size of the gaps ranging from 23 to 69 points.31 All of these test score differences were statistically signifi cant at the .01 level or better. Find-ings on the mean profi ciencies of the foreign born and native born for the same fi ve educational attainment groups on the prose, document, and quantitative scales are presented in Appendix A. The gaps in average pro-fi ciency are quite considerable for each of these scales. Here T9

16
Table 9: Comparisons of the Mean Composite Profi ciency Scores of the Native Born and Immigrants in the U.S. by Level of Schooling Completed
Level of Schooling Native Born Immigrants DifferenceSig. of
Difference
Less than High School 225 156 69 0.01High School Diploma/GED 271 223 48 0.011-3 Years College 298 254 44 0.01Bachelor’s Degree 324 279 45 0.01Post Bachelor’s Degree 334 311 23 0.01
Source: NALS survey, 1992, tabulations by ETS.
Table 10:Mean Profi ciency Scores of Immigrants in the U.S. by Length of Time They Had Lived in Country
Length of time in the U.S. Prose Document Quantitative Composite
Less than 5 years 185.2** 177.5** 192.3*** 185.1**
5-10 years 178.0*** 179.6*** 184.1*** 180.6***
More than 10 years 219.9 211.5 228.7 220.0
Note: ***implies signifi cantly lower than more than 10 years at 0.01 level. ** implies signifi cantly lower than more than 10 years at 0.05 level.Source: IALS survey, 1994.
One might well expect that the English literacy profi ciencies of the foreign born would be infl uenced by the length of time that they had lived in the U.S., especially for those individuals for whom English was not the fi rst language learned. The longer individuals remain in the U.S., the more time they have to acquire and practice English-speaking, reading, and writing skills. Thus, their average profi ciencies would be ex-pected to rise along with their length of stay in the U.S.
The mean profi ciency scores of the foreign born on each of the four literacy scales are displayed for the following three subgroups based on the number of years that they had lived in the U.S.: less than 5 years, 5-10 years, and more than 10 years (Table 10).
On each of the scales, immigrants who had lived in the U.S. for more than 10 years achieved signifi cantly higher profi ciency scores than their peers with less than 10 years of tenure.32 The size of these differ-ences in mean profi ciency scores are typically quite large. Immigrants with more than 10 years of tenure in the U.S. obtained mean scores on each of the four scales that were 34 to 45 points higher than those who had been in the U.S. for less than 5 years. All of these differences were statistically signifi cant at either the .05 or .01 levels. Still, it should be noted that the mean profi ciency scores of those immigrants who had lived in the U.S. for more than 10 years were still 57 to 66 points below those of their native-born counterparts.Here T10
32 Somewhat surprisingly, those immigrants who had lived in the U.S. for 5-10 years did not achieve significantly higher scores than their counterparts with less than 5 years tenure. In fact, their mean scores were slightly lower on three of the scales, but the differences are not statistically significant. Some of the newer arrivals were recruited under the H1-B visa program for skilled immigrants and likely raised the average proficiency scores for the new arrivals.

17
The gaps between the mean composite profi ciencies of those foreign-born persons who fi rst studied English more than 20 years ago and their other peers were statistically signifi cant at the .01 level.Here T11
The IALS background questionnaire also collected data from respondents on the age at which they fi rst started to learn English. Responses to this question were combined with data on the actual ages of the foreign born at the time of the survey to estimate the number of years since they fi rst started to learn Eng-lish. We classifi ed all respondents into three groups based on the maximum number of years that they could have been learning English:33 0-9 years, 10-19 years, and 20 years or more (Table 11).
Findings of our analysis of these data reveal that the mean composite profi ciencies of the foreign born increased with the number of years since they fi rst started learning English, rising from 163 for those with fewer than 10 years to a high of 243 for those who fi rst started learning English more than 20 years ago, a difference of 80 points or one full standard deviation between the top and bottom performers.
Table 11:Mean Composite Profi ciency Scores of Immigrants in the U.S. by Years of Learning English
Number of Years Mean Score
0 – 9 163.5***
10 – 19 187.4***
20 or More 243.1
Note: ***indicates signifi cantly different from the mean scores of those with 20 or more years since fi rst started to learn English.Source: IALS survey, 1994.
33 The variable is admittedly a crude one since we cannot identify the amount of time or effort that these individuals devoted to learning English within each time period.

18
A Multivariate Statistical Analysis of the Composite Profi ciencies of Immigrants
Table 12:Defi nitions of the Predictor Variables Appearing in the Multiple Regression Models of the Literacy Profi ciencies of Immigrants in the U.S.
Variable Defi nition
EDCOMP Years of schooling completed at the time of the IALS survey
ENG1 A dummy variable representing someone whose fi rst language was English
= 1 if yes
= 0 if no
ENG2 A dummy variable representing someone who fi rst began starting to learn English between 1 and 6 years old
= 1 if yes
= 0 if no
ENG3 A dummy variable representing someone who fi rst began starting to learn English between 7 and 13 years old
= 1 if yes
= 0 if no
ENG4 A dummy variable representing someone who fi rst began starting to learn English between 14 and 21 years old
= 1 if yes
= 0 if no
ENG5 A dummy variable representing someone who fi rst began starting to learn English at age 22 or after
= 1 if yes
= 0 if no
YRSENG Number of years spent learning English up to the time of the IALS interview. Value of this variable equals current age minus the age at which fi rst began to study English
The above fi ndings have revealed that the English-based literacy profi ciencies of immigrants in the U.S. were positively associated with their educational at-tainment and the number of years that they had spent learning English. To test the independent effects of formal schooling, the language fi rst learned as a child, and years spent learning English on the composite profi ciencies of immigrants, we constructed and esti-mated a multiple regression model of their composite literacy profi ciencies. The regression model was based on the IALS data for the U.S. assessment. The set of seven predictor variables in these regression models of the composite profi ciencies of immigrants fall into the following three categories:
� Years of schooling completed (EDCOMP).
� The age at which the respondent fi rst began learn-ing English, including those whose fi rst language was English. These variables are represented by ENG1 to ENG5. This is a set of fi ve dummy variables that indicate the age group at which an immigrant fi rst began to learn English.
� The number of years spent learning English. This variable is measured by the difference between a respondent’s current age and the year during which he/she began fi rst learning English. Those who said they did not speak English were assigned a value of zero for this variable.
The defi nitions of each of these seven variables are presented in Table 12 below.Here T12

19
The regression model of the composite profi cien-cies of immigrants fi t the data fairly well, and six of the seven variables in the regression model are statisti-cally signifi cant (see Table 13). The regression model explained nearly 58% of the overall variation in com-posite profi ciency scores, a fairly good statistical fi t for a small cross-sectional sample. The key fi ndings of the model are the following:
� Each year of schooling completed by an immi-grant adds 6.2 points to the predicted composite profi ciency score
� The earlier one began studying English, the higher his/her predicted profi ciency score
� Those immigrants whose fi rst language was Eng-lish scored 124 points higher than those in the base group (i.e., did not speak English at all at the time of the IALS survey). Those who began speak-ing English before they were six years old scored nearly 80 points higher than the base group, while the additions to the expected profi ciency scores were 60 points for those who fi rst studied English between the ages of 7 to 13, and 26 points if they started learning English between the ages of 14 and 21. The estimated effect is 0 for those who did not begin studying English until age 22 or after.
� For each year spent studying English (an admit-tedly crude variable that does not capture the in-tensity of one’s English instruction), the predicted composite score rises by slightly less than 1 point.Here T13
Table 13:Findings of the Multiple Regression Analysis of the Composite Profi ciencies of Immigrants in the U.S.
Variable Coeffi cientStandard
Error t-statistic
Constant 74.8 7.89 9.48***
EDCOMP 6.2 .56 11.06***
ENG1 124.4 8.94 13.92***
ENG2 80.3 11.79 6.82***
ENG3 59.5 10.16 5.86***
ENG4 26.2 9.65 2.72***
ENG5 7.6 8.7 .87
YRSENG .86 .24 3.61***
R2 = .578Adj. R2 = .572Degrees of Freedom = 7,554F Statistic = 108.18Sig. F = .01Notes: *** sig. at .01 levelSource: IALS Survey, 1994.

20
The fi ndings of the composite profi ciency regres-sion model were then used to predict the expected composite profi ciency scores of three individual im-migrants with quite different schooling and English-language characteristics.
� The fi rst individual is an immigrant who did not speak English at the time of the IALS survey and who had completed only 10 years of schooling. The expected composite profi ciency score of this individual was only 137, a low Level 1 profi ciency.
� Our second hypothetical individual is an im-migrant who started learning English at age 10, graduated from high school, and was 30 years old at the time of the IALS survey. The predicted com-posite profi ciency score of this individual was 226 points, a low Level 2 profi ciency.
� Our third individual is an immigrant whose fi rst language was English, who obtained a bachelor’s degree, and who was 30 years old at the time of the IALS survey. The predicted composite profi -ciency score of this individual was 322 points, a near Level 3 performance.
These results reveal very substantial differences in the predicted composite profi ciencies of immi-grants based on their schooling, the language they fi rst learned as a child, the age at which they fi rst started
learning English, and the number of years they have been learning English. As shown in Appendix B, these same patterns are found with respect to immigrants’ prose profi ciencies. Clearly, the relationship between schooling and English language speaking is an in-teractive one. Immigrants with stronger literacy and English-speaking skills are more likely to complete additional years of schooling; and the more years of schooling they complete, the stronger their literacy and English-speaking abilities will be. The earlier an immigrant begins learning English, the higher will be their English-speaking and literacy skills. Other fi ndings in the recent literature clearly reveal that, the later immigrant children arrive in the U.S., the weaker will be their English-speaking skills as adults, and the lower their ultimate educational attainment.34
With NALS and 1990 and 2000 Census data, we fi nd that the higher the educational attainment and English-speaking abilities of immigrants or the higher their educational attainment and literacy profi ciencies, the greater is their likelihood of employment and of year-round full-time attachment to the labor market, and the higher are their annual earnings. The assimila-tion of immigrants into U.S. civic life and into career labor markets is critically dependent upon improve-ments in their English-reading, speaking, and writing profi ciencies, and their educational attainment.
34 See: Hoyt Bleakley and Aimee Chin, Language Skills and Earnings: Evidence from Childhood Immigrants, Department of Economics, MIT and University of Houston, February 2001.
21
Comparisons of the Literacy Profi ciencies of Immigrants in the U.S. With Their Peers in High-Income Countries
Table 14:Mean Composite Profi ciency Scores of Immigrants in 20 High-Income Countries/Language Groups Ranked from Highest to Lowest
Country Mean Score
Ireland 273.6
Denmark 273.2
Norway 269.9
Northern Ireland 267.0
New Zealand 265.7
Canada, English 265.6
Finland 264.2
Sweden 262.4
Germany 256.8
Netherlands 251.4
Italy 250.3
Australia 249.7
Switzerland, French 242.5
Switzerland, Italian 236.0
Belgium (Flanders) 235.3
England 231.9
Switzerland, German 208.2
United States 205.2
Canada, French 202.4
France 194.4
U.S. Rank 18th
Source: IALS survey, 1994.
35 The differences between the mean composite literacy scores of immigrants in the U.S. and those in German Switzerland and French Canada were not significantly different even at the .10 level.
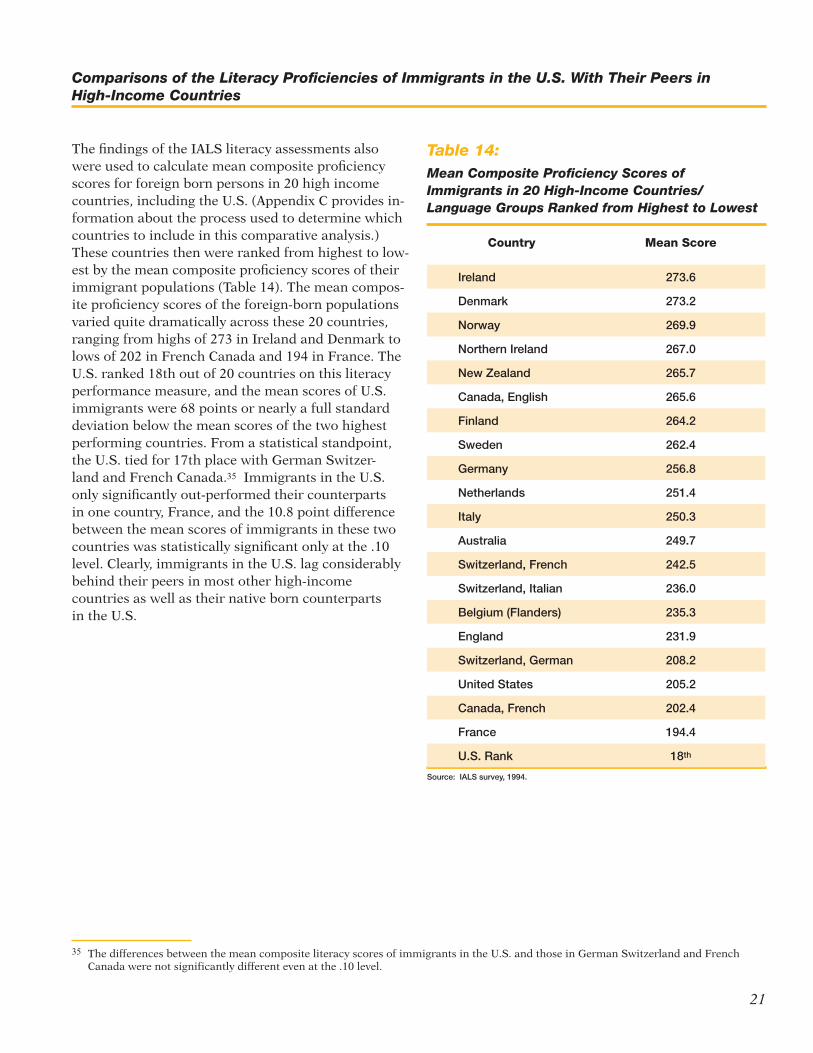
The fi ndings of the IALS literacy assessments also were used to calculate mean composite profi ciency scores for foreign born persons in 20 high income countries, including the U.S. (Appendix C provides in-formation about the process used to determine which countries to include in this comparative analysis.) These countries then were ranked from highest to low-est by the mean composite profi ciency scores of their immigrant populations (Table 14). The mean compos-ite profi ciency scores of the foreign-born populations varied quite dramatically across these 20 countries, ranging from highs of 273 in Ireland and Denmark to lows of 202 in French Canada and 194 in France. The U.S. ranked 18th out of 20 countries on this literacy performance measure, and the mean scores of U.S. immigrants were 68 points or nearly a full standard deviation below the mean scores of the two highest performing countries. From a statistical standpoint, the U.S. tied for 17th place with German Switzer-land and French Canada.35 Immigrants in the U.S. only signifi cantly out-performed their counterparts in one country, France, and the 10.8 point difference between the mean scores of immigrants in these two countries was statistically signifi cant only at the .10 level. Clearly, immigrants in the U.S. lag considerably behind their peers in most other high-income countries as well as their native born counterparts in the U.S.Here T14

22
One might argue that perhaps part of the gap between the literacy performance of U.S. immigrants and their counterparts in the other 19 high-income countries is partly attributable to a weaker educational attainment of U.S. immigrants. To test this hypothesis, we compared the educational distribution of immi-grants in the U.S. with those of their peers in the 19 other high-income countries. Each group was assigned to one of four educational attainment groups, ranging from less than a full high school education to a bach-elor’s or higher degree. The results show that immi-grants in the U.S. are better educated than their coun-
Thus, all of the literacy profi ciency gaps between immigrants in the U.S. and their counterparts else-where were attributable to differences in mean com-posite profi ciency scores within each educational attainment subgroup (Table 16). The gaps between the mean composite scores of immigrants in the U.S. and the other 19 high-income countries were very large in each educational attainment group, ranging from 37 to 50 points across the four subgroups. These mean scale
Table 15:The Percentage Distribution of Immigrants in the U.S. and the Other 19 High-Income Countries by Their Educational Attainment at the Time of the IALS Survey
Educational Attainment U.S.
19 OtherHigh Income
CountriesU.S. – 19 Other
Countries
Less than 12 years 33.9 44.5 -10.6
12 years, no college 31.8 29.8 +2.0
13 – 15 years 11.9 8.8 +3.1
Bachelor’s or higher degree 22.3 16.8 +5.5
Source: IALS survey, 1994.
terparts in the other high-income countries (Table 15). While nearly 34% of U.S. immigrants lacked a regular high school diploma (or GED certifi cate), 45% of their counterparts in the other 19 high-income countries did so. Approximately 74% of the immigrants in these other countries failed to complete any years of formal schooling beyond high school, versus only 66% of their peers in the U.S. Furthermore, U.S. immigrants were more likely than their peers elsewhere to have ob-tained a bachelor’s or more advanced academic degree (22% vs. 17%). Here T15
score differences were equivalent to .62 to .70 standard deviations, very sizable gaps.36 The comparatively weak literacy/quantitative performance of U.S. immi-grants vis-à-vis their counterparts in the same educa-tional groups in other high-income countries needs to be better understood by educational policymakers and researchers if the gaps between immigrant and native-born adults are to be reduced in the near future.Here T16
36 These test score gaps are measured relative to the standard deviations for immigrants from the other 19 high-income countries in each of the four educational attainment subgroups.

23
Table 16:Comparisons of the Mean Composite Profi ciency Scores of Immigrants in the U.S. and 19 Other High-Income Countries, All and by Educational Attainment
Educational Attainment U.S.
19 High Income
Countries
U.S. – 19 High Income
CountriesSig. of
Difference
All 209.7 240.4 -30.7 .01
Less than 12 years 148.8 198.9 -50.1 .01
12 years, no college 210.0 255.7 -45.7 .01
13 – 15 years 243.8 280.4 -36.6 .01
Bachelor’s or higher degree 265.4 304.2 -38.8 .05
Source: IALS survey, 1994.
As noted earlier, the literacy profi ciencies of the foreign born in the U.S. are characterized by a very high degree of dispersion, considerably higher than among the native born. To determine whether this situation was unique to the U.S., we also estimated the standard deviations of the composite scores for the foreign born in the other 19 high-income countries (Table 17). In all countries except Ireland and North-ern Ireland, the degree of dispersion in the composite scores of the foreign born was greater than that of the native born. The U.S., with its standard deviation of 80.9 for its foreign born, was characterized by the fi fth highest standard deviation among these 20 high income countries. In fact, there was no signifi cant difference between the standard deviations of the test scores of the foreign born in the U.S. and the other four highest ranked nations on this measure (English Canada, French Canada, France, and England). From a statistical standpoint, the dispersion of composite profi ciency scores among the foreign born in the U.S. was as high as that of any of the other 19 high-income countries. The degree of inequality in the composite test scores of both the native born and foreign born in the U.S. are among the highest in the industrialized world and contribute to the heightened degree of in-equality in earnings and income in our nation. 37Here T17
Table 17:Standard Deviations of Composite Test Scores of Foreign Born Adults for the Twenty High-Income Countries/Language Groups Included in the International Adult Literacy Analysis
County Foreign Born
Australia 80.8
Belgium (Flanders) 75.1
Canada, English 84.1
Canada, French 91.3
Denmark 48.2
Finland 77.4
France 81.4
England 92.1
Germany 52.3
Ireland 54.4
Italy 54.8
Netherlands 61.5
Northern Ireland 58.3
Norway Bokmal 72.8
New Zealand 63.6
Sweden 69.2
Switzerland, French 73.6
Switzerland, Germany 79.5
Switzerland, Italian 60.2
United States 80.9
U.S. Rank 5th highest
37 While the standard deviation of the composite test scores among the native-born in the U.S is lower than that of the foreign-born population, the U.S. ranking is still fourth highest among the 20 high-income countries.

24
The mean composite profi ciency scores of the foreign born in four educational subgroups were estimated, and the percentile rankings associated with these scores along the world skills distribution were identifi ed. Findings in Table 19 reveal that the mean composite score for those foreign-born persons in the U.S. who were lacking a high school diploma was equivalent to only the 5th percentile, the mean score for high school graduates was equivalent to the 15th percentile, and those with a bachelor’s or higher degree achieved a mean composite score that was equivalent to the 41st percentile. In other words, a substantial majority of the nation’s foreign born with no post secondary schooling possessed literacy skills that would have fallen in the lower fi fth of the world skills distribution.Here T19
The comparative performance of the foreign born in the U.S. also can be examined via use of the world skills distribution.38 For adults in the 20 high-income countries combined, a distribution of scores was generated for each of the four scales. The scores at each percentile of the distribution can be identifi ed. The median scores of the native and foreign born in the U.S. can be assigned their percentile ranking along each of these distributions. For the native born in the U.S., the median scores fell at the 55th percentile for the document and quantitative scales, the 57th percen-tile for the composite scale, and the 61st percentile for the prose scale (Table 18). For the foreign born, how-ever, the median scores were equivalent to only the 17th percentile for each of the four scales. On average, foreign-born adults in the U.S. had prose, document, quantitative, and composite profi ciency scores that would have ranked in the bottom fi fth of the world skills distribution for high-income countries.Here T18
Table 18:Percentile Ranking of Median Profi ciency Scores of the Native Born and Immigrants in the U.S. Along the World Skills Distribution
Profi ciency Score Native Born Foreign Born
Prose 61 17
Document 55 17
Quantitative 55 17
Composite 57 17
Source: IALS survey, 1994, tabulations of the authors.
Table 19:Percentile Rankings Along the World Skills Distribution of the Mean Composite Profi ciency Scores of Immigrants in the U.S. by Level of Schooling Completed
Level of Schooling Percentile Ranking
Less than 12 years of school 5th
12 years, no college 15th
13 – 15 years 29th
Bachelor’s or higher degree 41st
Source: IALS survey, 1994, tabulations of the authors.
38 For a review of the construction of the world skills distribution and the test scores at various percentiles along the distribution, See: Andrew Sum, et al., The Twin Challenges of Mediocrity and Inequality, 2002.
Given their growing share of the U.S. population, failure to substantially improve the literacy profi cien-cies of the nation’s foreign born will make it more dif-fi cult for the U.S. to improve its literacy performance ranking among the world’s high-income countries. As revealed in our earlier monograph, The Twin Challeng-es of Mediocrity and Inequality, the U.S. is not cur-rently a world leader on any of the four literacy scales.

25
The Literacy Profi ciencies of Immigrants and Their Labor Force Behavior
39 See: (i) Andrew Sum, Literacy in the Labor Force, 1999; (ii) Organisation for Economic Cooperation and Development and Statistics Canada, Literacy in the Information Age, 2000.
40 Unlike the Current Population Survey, frequently referred to as the CPS household survey, the IALS survey did not attempt to identify those persons who were employed but temporarily absent from their jobs for such reasons as vacations, temporary illnesses, or weather conditions. Such individuals are classified as employed in the monthly CPS household survey.
41 The employment/population ratio is determined by the product of the labor force participation rate and the unemployment rate: Let E/P = L/P · E/L, Where E/P = employment/population ratio L/P = the labor force participation rate E/L = the percent of the labor force that is employed Where E/L = 1 – U/L where U/L equals the unemployment rate
Previous analyses of the NALS and IALS survey data have found positive statistical associations between the literacy profi ciencies of adults in the U.S. and other countries and their labor force activity.39 Those adults with stronger literacy profi ciencies were more likely to be active participants in the labor market and to be employed when they did look for work. The IALS background questionnaire contained a labor force sec-tion that collected information from all respondents on their labor force and employment activities at the time of the survey and during the previous 12 months. Responses to the questions on current employment status were used to assign each immigrant to one of the three following labor force statuses:
� The employed are those who were working at the time of the IALS survey.40
� The unemployed are those who reported that they were unemployed or looking for work at the time of the survey. The IALS survey did not ask these individuals how they were looking for work, or the most recent time period during which they looked for work, or their availability for work. In the Current Population Survey (CPS), to be counted as unemployed, most unemployed persons must have actively looked for a job in the past four weeks and been available to take a job last week.
� Those persons out of the labor force. This group includes all individuals who were classifi ed as neither employed nor unemployed. They include students not looking for work, retirees, persons keeping house, the disabled, and those who did not wish to work at the present time for other reasons.
The data on the current labor force status of immi-grants then were used by the authors to estimate values for the following three labor force activity measures:
� The labor force participation rate, which repre-sents the ratio of the total number of employed and unemployed 16-65 year old immigrants to the number of 16-65 year olds in the civilian non-insti-tutional population.
� The unemployment rate, which represents the ratio of the unemployed to the number of persons in the civilian labor force, i.e., the sum of the em-ployed and the unemployed.
� The employment/population ratio, which repre-sents the ratio of the number of employed to the number of immigrants in the population.41
Estimates of the values for each labor force activity measure were generated for all immigrants combined and by their profi ciency level on the composite skills distribution. At the time of the survey, three of every four immigrants were actively participating in the civil-ian labor force (Table 20). This rate of participation was only two percentage points below that of native born adults in the U.S. (Table 21). The labor force participa-tion rates of immigrants increased steadily and strongly as their composite profi ciency levels improved, rising from 67.6% for those in profi ciency Level 1 to a high of 95% for those in profi ciency Levels 4 and 5. Similar relationships prevailed among the native born (Table 21). In each profi ciency level, however, immigrants were somewhat more likely than the native born to be active participants in the labor force.Here T20&21

26
The overall unemployment rate among all im-migrant workers at the time of the survey was esti-mated to be 7.1%, about 50% higher than the 4.6% unemployment rate among the native born. All of the unemployment among immigrants, however, was con-centrated among those workers with Level 1 or Level 2 profi ciency (Table 20). The unemployment rate among immigrant workers in Level 1 was 13%; it fell slightly below 5% for those in Level 2, and was 0% for workers in Levels 3, 4, and 5. The absence of unemployment among immigrants with very strong profi ciencies is due in part to the operations of H1-B visa programs that bring into the country immigrants with higher level skills to fi ll jobs in shortage occupations and to the over-representation of well-educated immigrants in occupational fi elds that have low unemployment rates nationally (scientifi c, engineering, physical science
Table 20:The Labor Force Participation Rates, Unemployment Rates, and Employment/Population Ratios of Immigrants in the U.S. by their Level on the Composite Profi ciency Scale (in %)
Labor Force Variable Level 1 Level 2 Level 3 Levels 4-5 Overall
Labor force participation rate 67.6 79.1 83.6 95.3 75.0
Unemployment rate 12.8 4.9 0.0 0.0 7.1
Employment/population ratio 59.0 75.2 83.6 95.3 69.7
Source: IALS survey, 1994.
42 The E/P ratio of immigrants in Levels 4 and 5 of the composite proficiency scale was significantly higher than that of their counterparts in the three lower proficiency levels at the .01 or .05 levels.
occupations). Unemployment rates among the native born also were uniformly lower among those workers with stronger composite profi ciencies.
As a consequence of their higher rates of labor force attachment and their sharply lower unemploy-ment rates, immigrants with stronger composite profi ciencies were much more likely than their less literate counterparts to be employed at the time of the IALS survey. The employment/population ratios of im-migrant adults ranged from a low of 59% for those in Level 1 on the composite profi ciency scale to a high of 95% for those in Levels 4 and 5, a 36 percentage point difference from top to bottom (Table 20).42 Among the native born, the gap in employment rates between those in Levels 4 and 5 and those in Level 1 was also a very substantial 30 percentage points (Table 21).
Table 21:The Labor Force Participation Rates, Unemployment Rates, and Employment/Population Ratios of Native-Born Adults in the U.S. by their Level on the Composite Profi ciency Scale (in %)
Labor Force Variable Level 1 Level 2 Level 3 Levels 4-5 Overall
Labor force participation rate 62.2 74.6 77.4 89.4 77.0
Unemployment rate 8.3 5.1 4.4 2.5 4.6
Employment/population ratio 57.0 70.8 74.0 87.1 73.5
Source: IALS survey, 1994.

27
For each labor force subgroup of immigrants, we estimated their mean literacy profi ciencies on each of the four scales. Findings are displayed in Table 22. The mean profi ciency scores of the employed exceeded those of the unemployed by 65 to 77 points on each of the four scales. All of these differences were statisti-cally signifi cant at the .01 level. The gaps between the mean literacy profi ciencies of the employed and those immigrants not active in the labor force at the time of
Table 22:The Mean Profi ciency Scores of Immigrants in the U.S. by their Labor Force Status
Profi ciency Scale Employed Unemployed
Not in Labor Force
Employed-Unemployed
Employed-Not in Labor Force
Prose 222.7 157.3 182.7 65.4*** 40.0***
Document 218.1 148.2 172.8 69.9*** 45.3***
Quantitative 233.0 156.0 185.8 77.0*** 47.2***
Composite 224.6 153.8 180.4 70.8*** 44.2***
Notes: *** sig. at .01 levelSource: IALS survey, 1994.
Table 23:Mean Profi ciency Scores of Employed Native-Born and Immigrant Workers in the U.S.
Profi ciency Scale Native Born Immigrant
Native-Immigrant
Sig. of Difference
Prose 292.2 222.7 69.5 0.01Document 287.3 218.1 69.2 0.01Quantitative 293.5 233.0 60.5 0.01Composite 291.0 224.6 66.4 0.01
Source: IALS survey.
the IALS survey also were quite large, ranging from 40 points on the prose scale to 47 points on the quantita-tive scale. Each of these differences was statistically signifi cant at the .01 level. Future efforts to strengthen the labor force attachment and employability of these jobless immigrants will likely require substantive in-vestments in efforts aimed at raising their literacy and quantitative profi ciencies.Here T22
The literacy profi ciencies of employed immigrants also were compared to those of the native born on each of the four scales. The mean profi ciency scores of the employed native born were considerably higher than those of immigrants on each of the four scales (Table 23), with the size of these differences rang-ing from 60 points on the quantitative scale to 69-70 points on the document and prose scales. Each of
these differences was statistically signifi cant at the .01 level. When measured in terms of standard deviation units (i.e., using the standard deviations for the em-ployed native born), these differences in mean scores are quite substantial. Each difference exceeds one standard deviation, with a range from 1.05 standard deviations on the quantitative scale to 1.26 standard deviations on the prose scale (Table 24).Here T23&24

28
How well did the literacy profi ciencies of the immigrant labor force in the U.S. compare to those of their counterparts in the other 19 high-income countries participating in the IALS assessment? To answer this important question, we compared the mean composite profi ciencies of U.S. immigrants in each labor force subgroup to those of their peers in the other 19 high-income countries. For each of the three labor force subgroups, the mean profi ciencies of U.S. immigrants fell signifi cantly below those of their counterparts in the other 19 high-income coun-tries combined, but the size of these gaps varied quite widely across the three labor force groups (Table 25).
For the employed, the gap between the mean scores of U.S. immigrants and their counterparts elsewhere was 33 points, which was statistically signifi cant at the .01 level. For the unemployed, however, the gap between the mean composite profi ciencies of the two groups was nearly 60 points, and it was a sizable 48 points for those persons neither working nor actively looking for work at the time of the survey. A very substantial share of the unemployed and other jobless immigrant popu-lations in the U.S. had composite profi ciencies in Level 1, and many of these individuals fell in the lower end of Level 1, indicating the existence of very substantial literacy defi cits.Here T25
Table 24:Gap Between the Mean Profi ciency Scores of Employed Native-Born and Immigrant Workers in the U.S., Standard Deviation Units, by Profi ciency Scale
Scale Size of Mean Gaps Standard DeviationDifference in SD
Units
Prose 69.5 55.0 1.26Document 69.2 58.4 1.18Quantitative 60.5 57.8 1.05Composite 66.4 54.8 1.21
Note: Standard deviations are those for employed native born workers.Source: IALS survey, 1994.
Table 25:Comparisons of the Mean Composite Profi ciency Scores of Immigrants in the U.S. and 19 Other High-Income Countries by their Labor Force Status
Labor Force Status U.S.
19 Other High-Income
Countries
U.S.– 19 Other Countries
Sig. of Difference
Employed 224.6 257.1 -32.5 .01
Unemployed 153.8 213.3 -59.5 .01
Out of the Labor Force 180.4 228.5 -48.1 .01
Source: IALS survey, 1994.

29
Those individuals who were employed at the time of the survey were asked to report whether they were employed full-time (35 or more hours per week) or part-time.43 The percentage distributions of employed immigrants by full-time/part-time status in each composite profi ciency category are displayed in Table 26. Full-time employment rates varied over a fairly
small interval from 79% for those in Levels 4 and 5 to nearly 86% for those in Level 1. None of these differ-ences were large enough, however, to be classifi ed as statistically signifi cant. Employed immigrants with the lowest composite profi ciencies were just as likely to be working full-time as their more literate counterparts in the U.S.Here T26
Table 26:Distribution of Employed Immigrants by their Full-Time/Part-Time Employment Status by Level on the Composite Profi ciency Scale
Employment Status Level 1 Level 2 Level 3 Levels 4-5
Full-time 85.8 83.2 79.7 78.8
Part-time 14.2 16.8 20.3 21.2
Source: IALS survey, 1994.
Table 27:Distribution of Employed Immigrants by Weeks Worked in the Prior Calendar Year by Level on the Composite Profi ciency Scale
Weeks Worked Level 1 Level 2 Level 3 Levels 4-5
1 – 13 6.3 7.3 3.0 .5
14 –26 6.6 5.7 2.8 2.9
27 – 39 3.1 3.0 3.7 .0
40+ 84.0 84.0 90.5 96.6
Source: IALS survey, 1994.
43 Hours worked on all jobs held at the time of the survey were used to identify the full-time status of employed respondents.
The IALS survey also collected information on the employment experiences of respondents in the twelve-month period prior to the interview. For those who were employed at some time over the previous year, information was collected on the number of weeks that they were employed. The employment experiences of respondents were assigned to one of the following four categories: 1-13 weeks, 14-26 weeks, 27-39 weeks, and 40 plus weeks. The percentage distributions of these employed immigrants by weeks worked in each com-posite profi ciency category are displayed in Table 27. The overwhelming majority of these immigrant work-
ers (86 percent) were employed for 40 or more weeks during the previous year. Those employed immigrants with mid- to high-level profi ciencies were more likely to work for 40 or more weeks. While 84% of those in Levels 1 and 2 were employed for 40 or more weeks, slightly over 90% of those in Level 3 and 97% of those in Levels 4 and 5 were employed for 40 or more weeks. Year-round, full-time work was more common among the nation’s employed immigrants with stronger lit-eracy profi ciencies. The greater weeks of work add to both current annual earnings and future earnings from employment via enhanced cumulative work experience.Here T27

30
Types of Jobs Held by Employed Immigrants
Table 28:Distribution of Employed Immigrants in the U.S. by Type of Job Held and Level on the Composite Profi ciency Scale (in %)
Type of Job Level 1 Level 2 Level 3 Levels 4-5
Wage and salary job, no supervisory responsibilities 79.7 53.4 53.5 48.8
Wage and salary job, some supervisory responsibilities 10.2 16.7 29.0 25.0
Wage and salary job, major supervisory responsibilities 4.2 17.6 8.6 19.2
Self-employed 5.8 12.2 8.8 6.9
Source: IALS survey, 1994.
Employed respondents also were asked to provide a description of the types of job duties they performed at work and an occupational title for their jobs. This information was used by each country’s research team to assign an occupational code to each job, using the International Standard Classifi cation of Occupations (ISCO).45 The percentage distributions of employed immigrants by major occupational category and by composite profi ciency level are presented in Table 29. As expected, there were substantial differences in the occupational distribution of employed immigrants across profi ciency levels. Overall, slightly more than 28% of all employed immigrants held professional,
44 The IALS survey also noted whether any of these jobs were unpaid jobs in family-owned enterprises. Fewer than .1% of the employed im-migrants classified themselves as unpaid family workers; thus, we do not report them separately in this table.
45 For further details on the occupational and industry coding procedures used in the IALS survey, See: OECD and Statistics Canada, Literacy in the Information Age, 2000, pp. 116-117.
para-professional, managerial, or technical positions. The percent of the employed holding such positions, however, varied quite considerably by composite pro-fi ciency level, ranging from only 7% of those in profi -ciency Level 1 to 33% of those in profi ciency Level 2 to a high of 73% of those in Levels 4 and 5 combined. The share of jobs in clerical/administrative support occupations also rose with the level of composite profi ciency until the top two profi ciency levels were reached. Only 5% of immigrant workers with a Level 1 profi ciency managed to obtain a clerical/offi ce position versus 19% of those in Level 2 and 26% of those in Level 3.Here T29
For all those persons who were employed in the prior year, information was collected on the characteristics of their jobs, including supervisory responsibilities and occupational duties and titles. Distinctions also were made between wage and salary jobs and self-employ-ment positions.44 In Table 28, the jobs held by immi-grants were placed into one of four categories based on the supervisory responsibilities of wage and salary positions and whether the job involved self-employ-ment. Not surprisingly, immigrants with only Level 1 composite profi ciencies were the most likely to report themselves as holding wage and salary positions with no supervisory responsibilities. Eighty percent of the jobs held by such immigrants were wage and salary jobs with no supervisory responsibility versus only 53%
of the jobs held by persons with a Level 2 or 3 profi -ciency and slightly under 50% of the jobs held by the employed with the strongest composite profi ciencies (Level 4 or 5). Wage and salary jobs with supervisory responsibilities were held by only 14% of the employed with a Level 1 profi ciency versus 34% of those with a Level 2 profi ciency, nearly 38% of those with a Level 3 profi ciency, and 44 % of those with a Level 4 or 5 pro-fi ciency. Overall, fewer than 10 % of the employed im-migrants reported themselves as self-employed. While those with the lowest composite profi ciencies were least likely to be self-employed, there was no consistent relationship between self-employment and the profi -ciency levels of the other groups of immigrants.Here T28

31
Immigrant workers with a Level 1 profi ciency were overwhelmingly concentrated in service/low level sales positions (36%) and in blue-collar occupations, both skilled and semi-skilled (50%). The share of the immi-grant workforce holding either service-related or blue-collar occupations declined steadily as their composite profi ciency levels increased. For example, while nearly one-half of all employed immigrants with a Level 1 profi ciency held a blue collar position, only 20% of those with a Level 2 profi ciency did so versus 8% of those in profi ciency Level 3 and only 4% of those in
Table 29:Percent of Immigrant Workers Employed in Selected Major Occupational Groups by Level on the Com-posite Profi ciency Scale
Occupational Group Level 1 Level 2 Level 3Levels
4-5 Total
Professional and Management 6.1 30.4 40.8 56.2 24.1
Technical/para-professional 1.3 2.6 6.6 16.7 4.3
Clerical/administrative support 4.9 18.8 26.1 10.4 13.1
Laborer or helper in agriculture, forestry 1.5 3.1 1.1 0.0 1.6
Service workers/low level sales 36.5 25.5 17.0 12.4 27.2
Craft workers 21.0 11.0 .8 2.0 12.6
Assemblers, fabricators, operatives, general laborers 28.6 8.6 7.5 2.3 17.1
Source: IALS survey, 1994.
the two highest profi ciency levels. Immigrant workers have been over-represented in the nation’s manufactur-ing industries in recent years, and the bulk of them hold positions as front-line production workers.46 In Literacy in the Labor Force (based on the NALS survey), it was shown that there were very large gaps between the average literacy profi ciencies of front-line workers in manufacturing and other goods-producing industries and those of professionals and managers, a situation creating potential barriers to the develop-ment of high-performance work organizations.47
46 See: Andrew Sum, et al., Immigrant Workers and the Great American Job Machine, 2002.47 See: Andrew Sum, Literacy in the Labor Force, 1999, especially Chapter 4.

32
The Weekly and Annual Earnings of Employed Immigrants by Their Literacy Profi ciency Levels
Table 30:Mean Weekly Earnings of Full-Time Employed Immigrant Workers by Level on Each Profi ciency Scale
Profi ciency Scale Level 1 Level 2 Level 3 Levels 4-5
Prose $ 333 $ 481 $ 644 $ 1,070
Document 345 487 655 1,087
Quantitative 307 471 660 1,018
Composite 318 520 632 1,108
Source: NALS Survey, 1992.
48 The IALS survey unfortunately captured far less information on weekly or annual earnings than the NALS survey, and the available infor-mation was coded by earnings quintiles rather than as continuous variables. They are, thus, of far less value for analyzing the earnings of U.S. workers. Besides, the number of sample observations on immigrant workers is far lower for IALS than for NALS.
Among the most important labor market outcomes for immigrant and native-born workers are their weekly wages and their annual earnings from paid employ-ment. The annual earnings of a worker are infl uenced by his/her cumulative weeks of employment during the year, average hours of work per week of employment, and average hourly earnings. The living standard of the average, non-elderly family in the U.S. is primar-ily determined by the earnings secured from the labor market.
The background questionnaire that was used in conducting the NALS survey collected information on the weekly earnings of persons who were employed at the time of the survey, their weekly hours of work, their total weeks of employment in the prior 52-week period, and their average weekly earnings from em-ployment over that period.48 These data were used to construct estimates of three earnings variables: weekly earnings of full-time workers at the time of the assess-ment, annual earnings from full-time employment over the previous 52 weeks, and average weekly earn-ings from full-time employment in the prior 52-week period. Findings of our analyses of the fi rst two earn-
ings variables for immigrant and native-born workers are presented below. The results for the analyses of average weekly earnings on jobs held by the immigrant employed in the prior 52-week period are displayed in Appendix D.
The estimated mean weekly earnings of im-migrants from full-time jobs held at the time of the NALS survey are displayed in Table 30. These earnings fi gures were computed for full-time workers by their profi ciency level on each of the four literacy scales. On each scale, the mean weekly earnings of full-time im-migrant workers rise steadily and strongly with their profi ciency level. On the composite scale, these mean weekly earnings for immigrant workers ranged from a low of $318 for those with a Level 1 profi ciency, to $520 for those in Level 2, to $632 for those in Level 3, and to a high of $1,108 for those immigrant workers with a Level 4 or 5 profi ciency. All of the differences in mean weekly earnings across each profi ciency level were statistically signifi cant at the .01 level. Similar patterns in weekly earnings prevailed for each of the other three literacy scales.Here T30

33
Table 31:Mean Weekly Earnings of Full-Time Employed Native-Born Workers by Level on Each Profi ciency Scale
Profi ciency Scale Level 1 Level 2 Level 3 Levels 4-5
Prose $ 364 $ 438 $ 547 $ 764
Document 388 464 573 767
Quantitative 349 466 534 776
Composite 364 448 552 792
Source: NALS survey, 1992.
49 Other research on immigrant workers shows that, among the college educated, immigrants are over-represented in higher paying scien-tific, engineering, and technical occupations. See: Andrew Sum, et al., Immigrant Workers in the New England Labor Market: Implications for Workforce Development Policy, 2002.
50 See: Andrew Sum, Literacy in the Labor Force, 1999, especially Chapter 7, p.250.
Findings on the mean weekly earnings of full-time, native-born workers by profi ciency level are displayed in Table 31. Here again, we fi nd steady and strong gains in the median weekly earnings of full-time, na-tive-born workers as their profi ciency levels increase. On each of the four scales, the mean weekly earn-ings of those native-born workers with a Level 4 or 5 profi ciency were twice as high as those of their peers with only a Level 1 profi ciency. For example, on the composite scale, the mean weekly earnings of full-time workers in Levels 4 and 5 were $792 versus only $364 for those with a Level 1 composite profi ciency.
An interesting fi nding, however, is that, with the exception of those immigrant workers with a Level 1 profi ciency, the mean weekly earnings of immigrants in every other profi ciency level exceeded those of na-tive-born workers. For example, on the composite pro-fi ciency scale, the mean weekly earnings of immigrant
workers in Level 3 were $632 versus only $552 among the native born, and the mean weekly earnings of im-migrant workers in Levels 4 and 5 were $1,108 versus $792 for the native born (Tables 30 and 31). There ap-pear to be several factors underlying the higher mean earnings of immigrants within these profi ciency levels. For the higher profi ciency levels, the average immi-grant worker has somewhat more years of schooling than the native born, and a higher fraction of immi-grant workers are male.49 Findings of multiple regres-sion analyses of the determinants of the weekly wages of the full-time employed also reveal that, controlling for a wide array of human capital, demographic, and geographic variables, immigrants who lived in the U.S. for six years or more obtained signifi cantly higher (9-10 percent) weekly earnings than their native-born counterparts.50 Here T31

34
Table 32:Average Annual Earnings of Full-Time Employed Immigrant Workers by Level on Each Profi ciency Scale
Profi ciency Scale Level 1 Level 2 Level 3 Levels 4-5
Prose $ 14,847 $ 23,238 $ 31,176 $ 49,746
Document 15,754 24,190 31,829 49,391
Quantitative 13,746 23,742 31,179 48,826
Composite 14,228 25,194 31,770 51,105
Source: NALS survey, 1992.
The data on total weeks of paid employment in the 52-week period prior to the NALS survey were combined with the data on average weekly wages over this time period to compute annual earnings for each employed respondent. These earnings data are gross earnings from wage and salary employment and self-employment before taxes or any other form of payroll
deductions. Estimates of the mean annual earnings of immigrant workers who were employed full-time over the previous 12 months are displayed in Table 32. Annual earnings estimates are provided for workers in each profi ciency level for each of the four literacy scales. Here T32
51 See: (i) Andrew Sum, Literacy in the Labor Force, 1999, Chapter 7; (ii) Julia Kroshko, The Impact of Human Capital Investments on the Earnings of Immigrant and Native Born Women in the Northeast, M.A. Workshop Paper, Department of Economics, Northeastern Univer-sity, Boston, Spring 2001; (iii) Kamen Madjarov, The Determinants of Immigrant Worker Earnings in the Northeast Region of the U.S., M.A. Workshop paper, Department of Economics, Northeastern University, Boston, Summer 2003.
On each of the four scales, the mean annual earnings of employed immigrants rose uniformly and very strongly with increases in their profi ciency levels. On the prose scale, the mean annual earnings of employed immigrants increased from slightly under $15,000 for those in Level 1 to over $31,000 for those in profi ciency Level 3 to a high of nearly $50,000 for those in Levels 4 and 5. The mean annual earnings of those immigrants with the strongest prose profi cien-cies were nearly 3.5 times as high as those with the most limited prose profi ciencies. Very similar fi ndings prevailed for each of the other three scales. The most profi cient immigrants obtained mean annual earn-ings that were three to four times as high as those of their least profi cient counterparts on each of the other three scales. These sharply higher annual earnings of the most profi cient immigrants refl ect a combination of substantially higher weekly earnings and modestly higher weeks of employment during the year (see Ap-pendix D for fi ndings on the average weekly earnings of employed immigrants). While most of the immi-grants in the highest profi ciency categories are well educated, their higher earnings are not simply a func-
tion of greater years of educational attainment. Among immigrant workers, particularly those with 10 or more years of tenure in the U.S., there are strong returns to composite profi ciencies and English-speaking skills independent of their years of formal schooling.51
Findings on the relationships between the mean annual earnings of the native born and their profi -ciency levels on each of the four literacy scales are presented in Table 33. On each scale, the mean annual earnings of the native born rise uniformly and con-siderably with their profi ciency level. For example, on the composite scale, the mean annual earnings of the native born rose from approximately $17,400 for those with a Level 1 profi ciency to $26,000 for those in Level 3 to a high of $37,256 for those in Levels 4 and 5. All of the differences in mean annual earnings across profi -ciency levels are statistically signifi cant at the .01 level. On each scale, native-born workers in the two highest profi ciency levels obtained mean annual earnings that were approximately twice as high as those of their counterparts in profi ciency Level 1.Here T33

35
Again, however, it is interesting to note that, with the exception of those immigrant workers with a Level 1 profi ciency, the mean annual earnings of immigrant workers with a Level 2 or higher profi ciency were greater than those of their native-born counterparts in the same profi ciency level. Results of earlier multi-variate statistical analyses of the NALS earning data revealed that, after controlling for a host of human capital, demographic, and geographic variables, the
annual earnings of immigrant workers with more than fi ve years of stay in the U.S. were 14 to 15% higher than those of their native born counterparts.52 The personal economic and educational benefi ts from stronger literacy profi ciencies among immigrants are quite substantial.53 The problem is not a low return to such profi ciencies, but rather the low average profi -ciencies of immigrant adults.
52 See: Andrew Sum, Literacy in the Labor Force, 1999, Chapter 7, pp. 250-251.53 For a review of earlier studies estimating the impact of English-speaking proficiencies on the wages and annual earnings of immigrants
in the U.S., See: (i) Hoyt Bleakley and Aimee Chin, Language Skills and Earnings: Evidence from Childhood Immigrants, 2002; (ii) Bernt Bratsberg and James F. Ragan, Jr., “The Impacts of Host-Country Schooling on Earnings: A Study of Male Immigrants in the U.S.,” The Journal of Human Resources, Winter 2002: Vol. 37, Issue 1, pp. 63-105; (iii) Barry R. Chiswick and Paul W. Miller, “English Language Flu-ency Among Immigrants in the U.S.,” Research in Labor Economics, Volume 17, 1998; (iv) Alberto Darvila and Marie T. Mora, “English Fluency of Recent Hispanic Immigrants to the U.S. in 1980 and 1990,””Economic Development and Cultural Change, 2000, pp. 369-389; (v) Gregory De Frietas, Inequality at Work: Hispanics in the U.S. Labor Force, Oxford University Press, New York, 1991; (vi) Stephen J. Treju, “Why Do Mexican Americans Earn Low Wages?,” Journal of Political Economy, 1997, Vol. 105, No. 6, pp. 1235-1267.
Table 33:Average Annual Earnings of Full-Time Employed Native-Born Workers by Level on Each Profi ciency Scale
Literacy Scale Level 1 Level 2 Level 3 Levels 4-5
Prose $ 17,568 $ 20,668 $ 26,318 $ 36,464
Document 18,555 21,948 26,950 35,803
Quantitative 16,837 21,386 25,126 36,772
Composite 17,396 21,037 25,928 37,256
Source: National Adult Literacy Survey.

36
The Annual Earnings of Immigrants in 1999
The recently released public use micro-data fi les from the 2000 Census allow us to examine the annual earnings of employed immigrants in the U.S. during calendar year 1999.54 Our sample of immigrant work-ers is restricted to those persons 20 and older who worked at some time during calendar year 1999 and who reported annual earnings of at least $2,000. These immigrant workers were classifi ed into 30 categories based on their educational attainment at the time of the Census and their self-reported English-speaking skills. The six educational categories range from those lacking a regular high school diploma or GED cer-tifi cate to those holding a master’s or more advanced academic degree. The fi ve English-speaking categories range from those who do not speak English at all to those who only speak English.
Table 34:Mean Annual Earnings of Employed Immigrants (20 and Older) in the U.S. by Years of Schooling and English-Speaking Profi ciency; 1999
English-Speaking Profi ciency
Years of SchoolingOnly
EnglishVeryWell Well Not Well Not at All All
Less than 12 or 12 but no diploma $ 22,884 $ 23,648 $ 22,803 $ 18,690 $ 15,504 $ 20,360
H.S. diploma or GED 29,916 27,185 24,610 20,387 17,194 25,358
1-3 years of college, no degree 36,475 30,549 28,047 22,769 19,280 30,526
Associate’s degree 37,988 34,045 29,732 24,779 24,371 33,342
Bachelor’s degree 56,167 46,824 40,801 33,162 27,016 46,963
Master’s or higher degree 78,554 71,089 50,343 33,606 31,983 67,675
All 43,651 40,741 29,448 20,595 16,345 33,806
Note: Sample was restricted to those individuals with at least $2,000 in annual earnings during calendar year 1999.Source: U.S. Census, PUMS fi les, 1999.
Annual earnings of immigrant workers during 1999 varied considerably by their level of schooling and their self-reported English profi ciency. For all workers, mean annual earnings were $33,806. These mean annual earnings ranged from a low of $20,360 for those lacking a high school diploma to a high of $67,675 for those holding a master’s or higher degree (Table 34). Mean annual earnings also were strongly associated with the English-speaking profi ciencies of these workers. Mean earnings were only $16,345 for those who reported that they could not speak English, rose to $29,448 for those who reported that they could speak English “well,” and peaked at $43,651 for those who only spoke English.Here T34
54 The so-called Public Use Micro Data Samples (PUMS) contain data from the long-form questionnaires for a representative sample of 1-100 households in each state.

37
Chart 1:Mean Annual Earnings of Selected Educational/English-Speaking Subgroups Of Employed Immigrants (20 and Older) in the U.S., 1999
Source: U.S. Census PUMS fi les, 1999.
$ 90,000
80,000
70,000
60,000
50,000
40,000
30,000
10,000
0
20,000
Mea
n an
nual
ear
ning
s
$78,554
$34,045
$27,185$22,803
$15,504
<12 Does not
speak English
<12 speaks English
well
12 speaks English
very well
Associate degree,
speaks English very well
Bachelor's, speaks English
very well
Master's, only
speaks English
$46,824
The joint combination of formal schooling and English-speaking profi ciency was strongly linked to the earnings of these immigrant workers.55 For exam-ple, an immigrant worker who lacked a high school di-ploma and could not speak English had mean earnings of only $15,504. These workers’ mean earnings would rise to $22,803 if they could speak English well and would increase to $27,185 if they had a high school diploma and could speak English “very well.” (See bar Chart 1.) Combining a bachelor’s degree with profi -cient English-speaking skills (“very well”) yields mean earnings of $46,824, and a master’s or higher degree together with “only English” provided mean earnings
of $78,554, which was fi ve times as high as that of the mean earnings level of workers with the least school-ing and most limited English-speaking profi ciency. These strong relationships between earnings, years of schooling, and English-speaking profi ciency are found among men and women alike (see Appendix E).
Clearly, human capital investments in formal schooling and English-speaking skills have large per-sonal economic payoffs in the form of higher annual earnings from employment.56 These same human capi-tal skills also increase the likelihood of being employed and the amount of labor hours that will be provided during the year.Here Chart 1
55 Findings of multiple regression analyses of the annual earnings of these immigrant workers revealed that both formal schooling and Eng-lish-speaking proficiency had large independent effects on their earnings. For example, among 20-64 year old employed immigrant males in the U.S. in 1999, the inability to speak English well reduced expected earnings by 20 percent, ceteris paribus. See: Kamen Madjarov, The Determinants of Immigrant Worker Earnings, 2003.
56 Earlier analyses of the NALS survey data by one of the authors at the Center for Labor Market Studies revealed that, once the composite proficiencies of an immigrant are entered into the regression model, self-reported speaking and reading ability have no significant impact on earnings. These latter two variables serve as rough proxies for the prose, document, and quantitative proficiencies of immigrants.

38
Table 35:Employed Immigrants’ Ratings of their English Reading Skills for their Current Jobs by Level on the Prose Profi ciency Scale
Rating Level 1 Level 2 Level 3 Levels 4-5 Overall
Excellent 16.8 45.4 71.9 80.1 40.7
Good 21.1 42.5 26.8 14.6 26.0
Moderate 20.3 11.7 1.2 5.3 13.1
Poor 41.8 0.4 .0 .0 20.3
Note: Those persons citing no opinion were excluded from the analysis.Source: IALS survey, 1994.
Immigrant Workers’ Perceptions of Their Job-Related Reading, Writing, and Arithmetic Skills
For all persons (native born and foreign born) who were employed in the previous twelve months, the IALS survey collected information on their personal ratings of their existing English reading, English writ-ing, and arithmetic skills on their main jobs.57 Each respondent was asked to rate their skills in one of the following four categories: excellent, good, moderate, or poor.58 These ratings were then cross-tabulated against the profi ciency levels of the employed on selected literacy scales. Findings of our analyses are displayed in Tables 35, 36, and 37.
A majority of the employed immigrants rated their English reading skills as excellent or good. Two-thirds of the responses on this question fell into the excellent or good category, while 13% rated their skills as mod-erate, and 20% rated their reading skills as poor (Table 35). As expected, the pattern of responses to this ques-tion varied widely by prose profi ciency level. Nearly 99% of the employed with Level 3 prose profi ciencies
and 95% of those with Level 4 or 5 profi ciencies rated their English reading skills as excellent or good. In contrast, only 38% of those with Level 1 profi ciencies rated their English reading skills as good or excellent. Nearly 42% of those with Level 1 profi ciencies rated their English reading skills as “poor.” They were the only group of employed immigrants to regard their existing reading skills as poor. This might seem some-what surprising given the low prose profi ciencies of many of those immigrants in Level 2; however, since these questions focused on their main jobs and not for various other types of work, the respondents may well have felt that the jobs they held were not very demand-ing in terms of literacy skills. As will be noted below, a higher number of those employed immigrants with Level 2 profi ciencies did feel that their reading and writing skills were limiting opportunities for advance-ment at the work site.Here T35
Responses to a question focusing on the adequa-cy of existing English writing skills for current job performance followed a similar pattern to those for English speaking skills. Overall, however, fewer of the employed immigrants (59%) rated their writing skills as excellent or good (Table 36). The overwhelming majority (95 to 97%) of those in Level 3, 4, or 5 on the
composite profi ciency scale rated their writing skills as excellent or good. In contrast, nearly 3 of every 4 employed immigrants with Level 1 skills and 30% of those with Level 2 skills rated their writing skills as poor or moderate. Among those in Level 1, a majority (53%) considered their writing skills to be poor.Here T36
57 The main job was the job that accounted for the greatest number of hours worked during the past 12 months.58 Persons not providing a response to the questions were excluded from the analysis.

39
Table 37:Employed Immigrants’ Ratings of Their Arithmetic Skills on Their Current Jobs by Level on the Quantitative Profi ciency Scale
Rating Level 1 Level 2 Level 3 Levels 4-5 Overall
Excellent 13.9 49.4 58.8 81.7 39.1
Good 41.9 41.1 34.9 18.3 37.2
Moderate 19.5 9.5 5.2 .0 11.9
Poor 24.7 .0 1.1 .0 11.7
Note: Those persons citing no opinion were excluded from the analysis.Source: IALS Survey, 1994.
Responses to the question on the adequacy of arithmetic skills for current job performance were overwhelmingly positive for all groups of immigrant workers, except those in Level 1 (Table 37). Seventy-six percent of all foreign-born respondents rated their arithmetic skills as excellent or good, and 90 to 100% of those in Levels 2, 3, 4, or 5 on the quantitative scale
rated their arithmetic skills as good or excellent. In comparison, only 56% of those in Level 1 on the quan-titative literacy scale rated their existing arithmetic skills as good or excellent. Nearly one-fourth of em-ployed immigrants in Level 1 regarded their arithmetic skills as poor, compared with 1% or less in each of the other literacy levels.Here T37
Employed immigrants also were asked to consider whether their existing reading, writing, and arithmetic skills were limiting their job opportunities, including overall occupational mobility and advancement in their fi rms. Allowable responses were “greatly limit-ing,” “somewhat limiting,” or “not at all limiting.” Findings of our analyses of their responses to these three questions by profi ciency level of the employed are presented in Tables 38 through 40. Some 37% of
employed immigrant respondents claimed that their existing English reading skills were either greatly or somewhat limiting their job opportunities (Table 38). Nearly 65% of those workers with Level 1 prose pro-fi ciencies and 18% of those with Level 2 profi ciencies felt that their reading skills were constraining their future job opportunities. Fewer than 5% of those with Level 3 prose profi ciencies felt this way.Here T38
Table 36:Employed Immigrants’ Ratings of their English Writing Skills for Their Current Jobs by Level on the Composite Profi ciency Scale
Rating Level 1 Level 2 Level 3 Levels 4-5 Overall
Excellent 6.6 33.7 56.6 70.7 30.9
Good 19.0 36.4 39.0 25.9 28.0
Moderate 21.7 26.7 4.4 3.4 16.4
Poor 52.6 3.3 .0 .0 24.6
Note: Those persons citing no opinion were excluded from the analysis.Source: IALS survey, 1994.

40
Table 38:Employed Immigrants’ Perceptions of the Degree to Which Their English Reading Skills Limit Job Opportunities by Level on the Prose Profi ciency Scale
Perceived Limits Level 1 Level 2 Level 3 Levels 4-5 Overall
Greatly Limiting 32.1 3.8 .0 9.7 17.4
Somewhat Limiting 32.4 13.9 4.5 3.0 19.8
Not at all Limiting 35.5 82.3 95.5 87.3 62.8
Source: IALS Survey, 1994.
A somewhat higher fraction of employed immi-grants believed that their current writing skills were reducing their future job opportunities (Table 39). Forty percent of the respondents indicated that their writing skills were either greatly or somewhat limiting
Table 39:Employed Immigrants’ Perceptions of the Degree to Which Their English Writing Skills Limit Job Opportunities by Profi ciency Level on the Composite Scale
Perceived Limits Level 1 Level 2 Level 3 Levels 4-5 Overall
Greatly Limiting 42.2 3.7 .9 8.4 21.3
Somewhat Limiting 24.8 23.9 7.7 6.0 18.5
Not at all Limiting 33.0 72.4 91.4 85.5 60.2
Source: IALS Survey, 1994.
their advancement opportunities. Again, it was those workers in Level 1 (67%) and in Level 2 (28%) who were most likely to feel constrained by their current writing skills.Here T39
Far fewer immigrant workers regarded their exist-ing arithmetic skills as limiting their future career prospects (Table 40). Only one-fourth of the respon-dents considered their existing arithmetic skills to be “greatly” or “somewhat limiting” their job opportuni-ties. Practically all of those citing such limitations were in Level 1 or 2 on the quantitative scale, with 45% of those in Level l feeling constrained by their ex-
isting arithmetic skills. Overall, very high fractions of the immigrant employed with Level 1 profi ciencies re-garded their existing reading, writing, and math skills as moderate to poor, and a high share of them (45 to 67%) also believed that their future job prospects were being constrained by their existing profi ciencies. Only a modest share of those in Level 2 felt this way.Here T40
Table 40:Employed Immigrants’ Perceptions of the Degree to Which Their Arithmetic Skills Limit Job Opportunities by Level on the Quantitative Profi ciency Scale
Perceived Limits Level 1 Level 2 Level 3 Levels 4-5 Overall
Greatly limiting 19.7 2.4 1.1 .0 9.9
Somewhat limiting 25.4 14.8 3.3 .0 15.0
Not at all limiting 55.0 82.8 95.6 100.0 75.1
Source: IALS Survey, 1994.

41
The Literacy Profi ciencies of Immigrants and their Poverty Status
Table 41: Percent of Immigrants in the U.S. Who Were Poor/Near Poor by Their Level on the Composite Profi ciency Scale in the U.S.
Profi ciency Level Percent Poor or Near Poor
All 30.4
Level 1 48.4
Level 2 21.9
Level 3 12.7
Level 4-5 9.2
Source: NALS survey, 1992.
Table 42: Mean Prose, Document, Quantitative, and Composite Profi ciency Scores of Poor/Near Poor and Non-Poor Immigrants in the U.S.
Not Poor or Near Poor Poor/Near Poor
Difference
Sig. of Difference
Prose 245 182 63 .01
Document 245 179 66 .01
Quantitative 252 181 71 .01
Composite 247 181 66 .01
Source: NALS survey, 1992.
The background questionnaire that was used in conducting the NALS assessment collected informa-tion from each respondent on their household’s total monetary income in the previous 12 months as well as the number of persons residing in the household at the time of the survey. The information on house-hold income and the number of household residents was used to estimate the poverty/near poverty status of the household of each respondent.59 The poor are those with household incomes below the federal government’s offi cial poverty income thresholds, while the near poor are defi ned as those persons living in households with incomes between 100% and 125% of the poverty lines of the federal government that are ad-justed for family size.60
Estimates of the percentages of the foreign-born population that were poor or near poor at the time of the NALS survey by level on the composite profi ciency scale are displayed in Table 41. Overall, 30 % of the foreign-born population were categorized as poor or near poor at the time of the NALS survey. The inci-dence of such income inadequacy problems, however, varied considerably by their level on the composite profi ciency scale. Nearly one-half of those foreign-born individuals with Level l skills were living in poor/near poor households. The incidence of such income in-adequacy problems fell to 22% for those with Level 2 skills, to 13% for those with Level 3 skills, and to only
9% for those with Level 4 or 5 profi ciencies. Nearly 70% of all poor/near poor immigrants fell in Level 1 and 87% were in Levels 1 or 2.Here T41
On each literacy scale, including the composite profi ciency scale, those immigrants who were neither poor nor near poor obtained considerably higher mean scores than their poor counterparts (Table 42). The sizes of the differences between the mean profi ciency scores of these two groups of immigrants ranged from 63 to 71 points (.8 to .9 standard deviations), and each was statistically signifi cant at the .01 level. The aver-age poor/near poor immigrant obtained a composite profi ciency score in the middle portion of Level 1, an extraordinarily weak performance.Here T42
59 Our measures of poverty/near poverty differ somewhat from those of the U.S. Census Bureau since we treat the household as the frame of reference rather than the family. The U.S. Census Bureau treats each member of a non-family household as a household of one in determining their poverty status. Their procedures will likely yield a slightly higher incidence of poverty/near poverty problems.
60 For a more comprehensive multivariate statistical analysis of the links between the literacy proficiencies of adults and their poverty/near poverty status, See: Andrew Sum, Literacy in the Labor Force, Chapter 7.

42
The Receipt of Government Cash Transfers by Immigrants and the Native Born
61 Previous analyses of the NALS survey data have revealed that those adults with limited literacy and quantitative proficiencies were more likely to be recipients of cash public assistance income and that a high proportion of the nation’s welfare recipients had only Level 1 or Level 2 proficiencies. See: (ii) Paul E. Barton and Lynn Jenkins, Literacy and Dependency: The Literacy Skills of Welfare Recipients in the U.S., Educational Testing Service, Princeton, New Jersey, 1995; (ii) Andrew Sum, Literacy in the Labor Force, 1999.
62 These cash transfers could have been received by the respondent or another member of the family over the previous 12-month period.63 The absolute size of the gap was equal to more than .8 standard deviations for the composite proficiency distribution for all foreign-born
persons in the U.S.
Given the limited employability and weekly earnings prospects of adults with weak literacy skills, one might well expect that they would be more dependent than their more literate peers on government cash transfers to support themselves and their families.61 The back-ground questionnaire that was used in conducting the IALS survey captured information on the respondents’ receipt of various forms of income during the previ-ous 12-month period.62 Among these income sources were cash transfers from the federal, state, or local government, including unemployment benefi ts, AFDC welfare benefi ts, general relief, or Supplemental Secu-rity Income payments for the Aged and the Disabled. The mean composite profi ciency scores of individuals receiving and not receiving such cash transfers were estimated for all respondents and for the native and foreign born separately.
For the entire sample, the mean composite pro-fi ciency score for those respondents receiving cash income transfers from the government was 259 versus 292 for those not receiving such transfers, a statisti-cally signifi cant difference of 34 points or more than one-half of a standard deviation (Table 43). Among the foreign born, the gap between the mean composite
profi ciency scores of those receiving and not receiving cash public transfers was a more substantial 66 points, which also was statistically signifi cant at the .01 level.63 Two-thirds of the nation’s immigrants receiv-ing cash public assistance income had Level 1 profi -ciencies, and 84% of them had composite profi ciencies in Levels 1 or 2. The relative odds of an immigrant with a Level 1 or 2 profi ciency receiving some cash income transfers was 2.2 times higher than his peer with a Level 3 or high profi ciency. Among the native born, the gap between the mean profi ciency scores of those receiving and not receiving cash transfers was a more modest 28 points, but the difference also was highly signifi cant. One-half of the native-born recipi-ents of cash income transfers had composite skills in Levels 1 or 2. Combined with our previous fi ndings on the prose, document, and quantitative profi ciencies of poor immigrants, it is quite evident that poverty and economic dependency problems among the foreign born were strongly linked to their literacy profi cien-cies. An overwhelming majority of the poor and depen-dent immigrants had very weak literacy and quantita-tive profi ciencies.Heghre T43

43
Table 43:Mean Composite Profi ciency Scores of Immigrants and the Native-Born in the U.S. by Their Receipt of Government Cash Public Transfers, Excluding Pensions
GroupReceived Cash
TransfersDid Not Receive Cash Transfers
Difference in Mean Scores
Sig. of Difference
All 258.6 292.4 33.8 .01
Foreign born 184.3 249.8 65.6 .01
Native born 268.7 296.7 28.0 .01
Distribution of Immigrant and Native-Born Recipients of Cash Public Transfers by Selected Levels on the Composite Profi ciency Scale
Nativity Status Level 1 Level 2 Level 1 and 2Level 3 or
Higher
Immigrants 65 19 84 16
Native born 23 27 50 50
Source: IALS survey, 1994, tabulations by authors.

44
Schooling, English-Speaking Profi ciency, and the Citizenship Status of Immigrants
64 See: Michael P. McDonald and Samuel Popkin, “The Myth of the Vanishing Voter,” Presented to the American Political Science Confer-ence, August – September 2000, Washington, D.C.
65 For a review of the questions on the citizenship test and the procedures used to administer the test to applicants for citizenship, See: (i) John J. Miller, The Unmaking of Americans, The Free Press, New York, 1998; (ii) “Pressed by a Backlog of Applicants, the U.S. is Rethink-ing Its Test for Citizenship,” The New York Times, July 5, 1999, pp. A-1, A-19.
66 For earlier studies of the links between the formal schooling/English-speaking proficiencies and citizenship status of immigrants in the U.S. and Massachusetts, See: (i) John Comings, et al., New Skills for a New Economy, 2000; (ii) Philip Q. Yang, “Explaining Immigrant Naturalization,” International Migration Review, 28 (3), Fall 1994, pp. 449-477.
67 For recent estimates of the size of the undocumented immigrant population in the U.S., See: (i) Kevin Deardoff, “Evaluating Compo-nents of International Migration Estimates of the Foreign Born Population by Migrant Status in 2000,” U.S. Census Bureau, Washington, D.C., December 2001; (ii) Jeffrey Passel, “New Estimates of the Undocumented Population in the U.S.,” Migration Information Source, May 22, 2002, pp. 1-3.
One of the goals of our nation’s immigration policy should be to encourage more legal immigrants to become citizens and participate fully in American po-litical life, including voting in local, state, and national elections. The right to vote is dependent upon being a U.S. citizen. Part of the decline in the overall voting rate in national elections in recent years has been at-tributable to the rise in the number of immigrants who have not become naturalized citizens.64
To be eligible to become a citizen, an applicant must be a legal resident of the U.S., be at least 18 years old, have lived in the U.S. for at least fi ve years, and pass both a criminal background check and a citizen-ship test which requires the ability to at least speak, read, and write simple sentences in English.65 The citizenship test is not a rigorous test of one’s English literacy profi ciencies, but past research at the national and state level has shown that individuals with more formal schooling, higher level occupational skills, and higher self-reported English speaking profi ciencies are more likely to become citizens.66
The IALS background questionnaire unfortunately did not include questions to capture information on the visa or citizenship status of foreign-born respon-dents; however, the recently released public use micro-records from the long-form questionnaires used in conducting the 2000 Census (the PUMS fi les) do allow
us to analyze the citizenship status of immigrants. We selected all immigrants 20 years and older who had lived in the U.S. for at least fi ve years to conduct this analysis. Citizenship rates were calculated for 30 sub-groups of immigrants classifi ed by their level of formal schooling and their self-reported English-speaking ability at the time of the 2000 Census. It should be not-ed that a fairly large number of these immigrants were undocumented and, thus, not eligible for citizenship. Estimates by demographers at the U.S. Census Bureau and The Urban Institute indicate that there were likely 8 to 9 million undocumented immigrants in the U.S. in 2000.67
Overall, 51% of the immigrants who met our initial selection criteria reported that they were U.S. citizens at the time of the 2000 Census (Table 44). Citizenship rates varied quite widely by both years of formal schooling and English-speaking ability. Citizen-ship rates ranged from a low of 38% for those lacking a high school diploma/GED certifi cate to highs of 64 to 65% for those with an associate’s or bachelor’s degree. Only 20% of those immigrants who reported that they could not speak English were citizens, versus 54% of those who claimed that they could speak English well, and a high of 61% of those who claimed that they spoke only English or spoke it very well.Here T44

45
When the educational traits and English-speak-ing profi ciencies of immigrants are combined, the citizenship rates are found to vary from a low of 19% for those immigrants who both lacked a diploma and could not speak English to highs of 68% for those im-migrants who spoke English very well and possessed an associate’s or bachelor’s degree. While part of the explanation for the very low rates of citizenship among those immigrants with limited schooling and English-
speaking profi ciencies is attributable to their undocu-mented status, increased investments in the education and English speaking, reading, and writing abilities of immigrants would likely payoff in terms of higher rates of citizenship. These higher citizenship rates in turn could help increase both future voting rates and political participation among immigrants and contrib-ute to a healthier and more vibrant democracy in the U.S.
Table 44:Percent of Immigrants (20 Years and Older) Who Arrived in the U.S. Before 1995 Who Were Naturalized Citizens, by Educational Attainment and English-speaking Ability, 2000
English Only Very Well Well Not Well Not At All Total
Less than 12 or 12, No Diploma 50.2 49.0 48.7 33.4 19.4 38.5
High School Graduate, GED holder 63.0 57.7 52.3 37.9 22.0 52.4
Some College 64.6 63.4 59.3 42.8 22.4 60.3
Associate Degree 65.3 68.1 63.8 43.1 27.6 64.2
Bachelor’s Degree 66.8 68.1 62.3 43.2 30.4 64.8
Master’s or Higher 67.6 62.1 54.6 44.0 35.3 61.1
Total 61.5 60.7 53.8 35.7 20.1 51.2
Source: U.S. Census Bureau, PUMS (1% Sample), 2000 Census of Population and Housing, tabulations by Center for Labor Market Studies.

46
Table 45:Percent of Immigrants in the U.S. Taking an Education or Training Course in Past 12 Months by Level on the Composite Profi ciency Scale
Profi ciency LevelPercent Taking At Least
One CourseOf Those with a Course, Percent
with Two or More Courses
1 18.0 17.3
2 31.1 49.9
3 54.0 60.5
4-5 59.0 65.1
All 31.2 45.6
Source: IALS survey, 1994.
Immigrants’ Participation in Selected Educational, Literacy, and Civic Activities
The background questionnaire that was used in conducting the IALS survey collected information on respondents’ participation in a diverse array of educa-tion, training, literacy, and civic/community activities. To determine how the frequency of participation in such activities was associated with the literacy profi -ciencies of the foreign born, we analyzed variations in participation rates in such activities across levels on the composite literacy scale. Four such activities are analyzed in this section of the monograph: enrollment in education or training courses, use of public librar-ies, participation in civic/community organizations, and keeping up with current public affairs.
During the interview, respondents were asked whether they had enrolled in an education or train-ing course over the past 12 months. If they had done so, they were asked to describe the number and types
of courses in which they had enrolled. Approximately one-third of the foreign born had enrolled in at least one such course over the previous 12 months (Table 45). The percent doing so, however, varied quite con-siderably by their composite profi ciency level, rang-ing from only 18% for those with a level 1 composite profi ciency to 31% among those with a Level 2 profi -ciency and to a high of nearly 60% among those with a Level 4 or 5 profi ciency. Of those who had enrolled in at least one such course, the fraction taking two or more courses also increased with their composite pro-fi ciency level, ranging from a low of 17% among those in Level 1 to a high of 65% for those in Levels 4 and 5. Clearly, those foreign born persons with the strongest composite profi ciencies were the most likely to be ac-quiring additional human capital through investments in education and training. Here T45
Respondents also were asked to report on their frequency of use of public libraries, with allowable responses ranging from daily to never during the past year. Those foreign-born individuals with the most limited composite profi ciencies were by far the most likely to report never using the public library. Nearly 71% of those with a Level 1 profi ciency claimed that
they never used a public library, versus only 21% of those in Level 3 and only 15% of those in Levels 4 and 5 (Table 46). Use of the public library at least once per month was reported by only 13% of the foreign born with Level 1 profi ciencies, versus 24% of those in Level 2 and 40% of those in Level 3.Here T46

47
Frequency of participation in voluntary or com-munity organizations also was associated with the strength of the composite profi ciencies of the foreign born. Nearly 80% of those in Level 1 reported that they never participated in such organizations, versus only 50% of those in Level 2, and 42 to 44% of those in Levels 3 through 5. Participation in such organizations on a monthly or more frequent basis was cited by only 13% of the foreign born in Level 1, versus 30% of those in Level 2, and 41% in Level 3 before declining back to 31% of those in Levels 4 and 5.
When asked how frequently they followed cur-rent events or public affairs, 22% of those in Level 1 reported “hardly at all,” versus only 6% of those in
Levels 2 and 3, and none of those in Levels 4 and 5. The share of the foreign born claiming to follow such events “most of the time” ranged from a low of 27% for those in Level 1 to 52% for those in Level 2 to highs of 72 to 73% for those in Levels 3 to 5. In summary, engagement in educational, training, literacy, and civic activities was consistently weakest among those immi-grants with the most limited composite profi ciencies. Their far more limited participation in human-capital building activities will reduce their future employabil-ity and earnings prospects while their sharply reduced civic engagement will weaken American democracy. An uneducated and ill-informed immigrant population is unlikely to contribute to the future strengthening of democratic institutions in America.
Table 46:Frequency of Immigrants’ Participation in Various Literacy and Civic Activities by Level on the Composite Profi ciency Scale (in %)
Activity Level 1 Level 2 Level 3 Level 4-5
Use a Public Library
• Daily .3 4.7 2.0 8.8
• Weekly or every month 12.9 18.9 38.0 22.8
• Several times per year 15.9 29.3 38.5 53.8
• Never 70.9 47.0 21.4 14.6
Participate in Voluntary or Community Organizations
• Daily .9 1.1 2.9 1.0
• Weekly or every month 12.4 28.8 38.0 30.4
• Several times per year 7.5 19.9 17.4 24.1
• Never 79.2 50.2 41.6 44.4
Frequency of Following Current Events or Public Affairs
• Most of the time 26.9 51.7 71.8 72.7
• Some of the time or now and then 51.6 42.2 21.8 27.3
• Hardly at all 21.5 6.0 6.4 0.0
Source: IALS survey, 1994.

48
Table 47:Immigrants’ Ratings of Their English Reading and Writing Skills and the Arithmetic Skills Needed in Daily Life by Their Level on the Composite Profi ciency Scale (in %)
Activity Level 1 Level 2 Level 3Level 4-5
Reading Skills
• Excellent 5.0 39.5 67.9 90.5
• Good to Moderate 41.3 56.0 32.1 9.4
• Poor 53.7 4.5 .0 .0
Writing Skills
• Excellent 5.1 39.6 68.0 90.6
• Good to Moderate 41.2 56.0 31.3 9.4
• Poor 53.7 4.5 .5 .0
Arithmetic Skills
• Excellent 5.0 39.9 68.9 90.5
• Good to Moderate 41.1 55.5 30.6 9.4
• Poor 53.9 4.6 .5 .0
Satisfaction With Reading and Writing Skills in English
• Very satisfi ed 60.6 69.3 83.8 97.2
• Somewhat satisfi ed 39.4 30.7 16.2 2.8
• Somewhat or very dissatisfi ed .0 .0 .0 .0
Source: IALS survey, 1994.
Immigrants’ Ratings of Their Current Reading, Writing, and Arithmetic Skills Needed for Daily Life
Respondents to the IALS survey also were asked to rate their current English reading and writing skills and their arithmetic skills needed to cope with daily life. Their responses were assigned to one of four cat-egories: excellent, good, moderate, and poor. For pur-
poses of analysis, we combined the ”good” and “mod-erate” responses into one category. The distributions of the responses to this set of questions by the composite profi ciency levels of the foreign born are presented in Table 47.Here T47
On average, across all three questions, those foreign-born individuals who had Level 1 composite profi ciencies were far more likely than their more liter-ate peers to report that their English reading, English writing, and arithmetic skills were poor, while those with Level 4 and 5 profi ciencies were overwhelmingly likely to report that their English reading, English writing, and arithmetic skills were excellent. For exam-ple, nearly 54% of the foreign-born adults with a Level 1 composite profi ciency reported their English reading skills as poor while only 5% of their peers in Level 2 did so, and none of those in Levels 3, 4, or 5 did so. At
the same time, slightly over 90% of the foreign born with Level 4 or 5 composite profi ciencies rated their English reading skills as excellent versus 68% of those with Level 3 skills, 40% of those with Level 2 skills, and only 5% of those with Level 1 skills. A nearly iden-tical pattern of results prevailed with respect to the self-ratings of English writing and arithmetic skills.
When asked to assess their degree of satisfaction with their existing reading and writing skills, a major-ity of the respondents in each profi ciency level re-ported that they were “very satisfi ed.” The proportion doing so varied with their composite profi ciency level,

49
however, with the shares of respondents providing such ratings ranging from 61% for those with a Level 1 profi ciency to a high of 97 % for those with a Level 4 or 5 profi ciency. What is rather surprising, however, is that not one foreign-born respondent reported that they were “somewhat dissatisfi ed” or “very dissatis-fi ed” with their existing English reading and writing skills, despite the fact that a slight majority of those with only a Level 1 profi ciency rated their reading, writing, and arithmetic skills as “poor.” These fi ndings
raise a number of important questions as to whether these individuals would be willing to devote the time and effort needed to improve their literacy skills and what types of incentives might be needed to get them to do so. To be effective, literacy instruction for im-migrants may have to be devoted to assisting them in achieving specifi c skills that would help them be more effi cient in carrying out daily tasks and in acquiring skills needed for occupational advancement at the workplace.

50
Summary of Key Research Findings and Their Public Policy Implications
68 See: Andrew Sum, et al., The Twin Challenges of Mediocrity and Inequality, 2002.
This research monograph was designed to provide both an objective description and a critical assessment of the literacy profi ciencies of the adult immigrant population in the U.S. based on two unique national literacy assessments: the International Adult Literacy Survey of 1994 (IALS) and the National Adult Literacy Survey of 1992 (NALS). A summary of key research fi ndings and a discussion of their public policy impli-cations in a variety of arenas is presented below.
Summary of Key Findings
(i) Findings of the IALS assessment revealed that the mean profi ciencies of the nation’s adult immi-grants (16-65 years old) on each literacy and quantita-tive scale were quite low, falling well below the aver-ages for all U.S. adults, which themselves are mediocre at best.68 A majority of the nation’s immigrants (53 to 55%) fell into the lowest profi ciency level on each of the four scales, and typically three-fourths of them performed in the two lowest profi ciency levels, indi-cating the existence of very limited English literacy profi ciencies.
(ii) The mean profi ciency scores of the nation’s immigrant population on each of the four scales were substantially below those of their native-born counter-parts. The size of these mean profi ciency score differ-ences ranged from 68 to 76 points, equaling or exceed-ing one standard deviation. On each of the four scales, the typical immigrant (median performer) achieved a profi ciency score that would have ranked at the 16th to 19th percentile of the test score distribution for all U.S. adults. The mean profi ciency scores of the foreign born increased with their years of formal schooling, the number of years since they fi rst started learning English, and the length of their stay in the U.S.
(iii) The mean composite profi ciencies of the for-eign born in the U.S. were considerably below those of their counterparts in the other 19 high-income coun-tries participating in the IALS survey. These fi ndings held true for each major educational subgroup of im-migrants, with the size of the gaps in mean composite scores ranging from 37 to 50 points. Immigrants in
the U.S. achieved mean test scores that were only at the 15th percentile for the world skills distribution on each of the four scales. On the world composite skills distribution, immigrants in the U.S. who lacked a high school diploma had a mean score that was equivalent to the 5th percentile versus a 15th percentile rank for high school graduates and a 41st percentile rank for those holding a bachelor’s or higher academic degree. There is a need for further research on the sources of the comparatively weak literacy performance of U.S. immigrants relative to those of other nations. To what extent are the weaker profi ciencies of U.S. immigrants attributable to our greater reliance on immigrants from non-English speaking countries, their lower ex-posure to English-speaking skills in their home coun-try, and to lower investments in the literacy profi cien-cies of immigrants here relative to those received by immigrants in other countries?
(iv) The labor force behavior of immigrants in the U.S. was strongly associated with their literacy perfor-mance. Immigrants with stronger composite profi cien-cies were much more likely to be active participants in the labor force and less likely to be unemployed when they did seek work. Employment rates of adult immi-grants ranged from a low of 59% for those with a Level 1 composite profi ciency to a high of 95% for those with a Level 4-5 profi ciency. The mean composite profi ciency score of the employed exceeded that of the unemployed by 71 points, or nearly one full standard deviation, and of those not active in the labor force by 44 points.
(v) The mean literacy scores of the employed immigrant population in the U.S. fell considerably below those of their native-born counterparts on each of the four scales. The size of these differences in mean test score performance exceeded one standard deviation on each of the four scales. The mean com-posite test scores of the employed foreign born in the U.S. also were 30 or more points below those of their counterparts in the other 19 high-income countries, with even larger mean test score gaps prevailing for the unemployed.

51
(vi) When employed, there were no discernible differences in full-time employment rates among im-migrants by profi ciency level at the time of the IALS survey; however, the employed with composite profi -ciency levels of 4 or 5 were more likely to work 40 or more weeks in the prior year than their less profi cient peers. Employed immigrants with stronger literacy profi ciencies also were more likely to obtain jobs with supervisory responsibilities, and they were consider-ably more likely to become employed in professional, para-professional managerial, and technical occupa-tions with higher literacy and schooling qualifi cations. Employed immigrants with only a Level 1 profi ciency on the composite scale were substantially over-repre-sented in service and semi-skilled blue collar occupa-tions.69
(vii) The mean weekly wages of full-time employed immigrants rose steadily and strongly with their per-formance on each of the four literacy scales.70 Those immigrants with a Level 4 or 5 profi ciency obtained mean weekly earnings that were three or more times as high as those of their peers with only a Level 1 profi ciency. There were similar strong associations between the annual earnings of employed immigrants and their literacy profi ciencies, with the mean an-nual earnings of employed immigrants with a Level 4 or 5 profi ciency exceeding the mean annual earnings of their counterparts with a Level 1 profi ciency by multiples of three to four. In each profi ciency level on the composite scale, except Level 1, however, the mean weekly and annual earnings of employed immigrants exceeded those of their native-born counterparts.
(viii) Immigrants with stronger literacy profi cien-cies were considerably less likely to be members of poor/near poor families or to be dependent on cash public transfers from federal, state, or local govern-ment to support themselves or their families. While 48% of immigrants with a Level 1 profi ciency were members of poor/near poor families, only 13% of
those with a Level 3 profi ciency were, and only 9% of those with a Level 4 or 5 profi ciency experienced such income inadequacy problems.
(ix) On average, immigrants with strong composite profi ciencies were more likely to be actively engaged in literacy-related activities (visiting libraries), to be participating in civic and community organizations in their communities, and to be following political and public affairs on a more frequent basis. Immigrants with stronger composite profi ciencies also were much more likely to have attended an education or training course over the 12 months prior to the IALS survey and to have enrolled in multiple courses when they did so. Those immigrants with stronger literacy profi cien-cies were acquiring more human capital, both on and off the job, which will have positive consequences for their future employability and earnings.
Implications for Public Policy
(i) A national need to address English-language and literacy profi ciency defi cits of the immigrant pop-ulation has increased over the past decade as a large new wave of immigrants reached our shores, many with limited formal schooling in their own countries and weak English-speaking skills. Nearly 40% of all 18 to 64 year old immigrants who arrived in the U.S. in the 1990s lacked a high school diploma or a GED. Be-tween 1990 and 2000, the number of 18 to 64 year olds who reported to the Census that they spoke a language other than English increased from 21.7 to 32.8 mil-lion, a gain of 11.1 million or 51% over the decade.71 The number of these immigrants who reported that they either did not speak English at all or not well rose even more sharply, increasing to just under 8.3 million by 2000, a gain of 71%. They were joined by another 7.2 million individuals who reported that they spoke English “well.” This group has been found by previous researchers to be signifi cantly less likely to work than their immigrant peers who speak English “very well,”
69 A relatively high fraction of immigrants with low proficiencies were also employed in skilled blue collar occupations.70 All of the weekly and annual earnings estimates are based on the NALS survey data.71 These estimates are based on the findings of the 1990 and 2000 Census and were published by the U.S. Census Bureau on its website.
See: www.census.gov.

52
to earn signifi cantly less when they do work, and to be less likely to become U.S. citizens. Many members of this group would likely benefi t from English-as-a-sec-ond language or adult basic education services.
(ii) There is a critical need to improve our in-formation base on the performance of key federally funded education, employment, and training programs in serving the immigrant population and improving their literacy, educational, and labor market outcomes. A number of major nationally-funded employment and training programs of the U.S. Department of Labor, in-cluding those funded under the Workforce Investment Act of 1998, do not capture any information on the nativity status, visa status, or citizenship status of pro-gram enrollees and provide very limited information on their reading and math profi ciencies at entry or exit.72 The national information base on state-operat-ed adult basic education programs funded by the U.S. Department of Education does capture information on selected demographic characteristics of program par-ticipants, enrollments in English-as-a-second language programs and adult basic education programs, and a number of key educational outcomes, but it does not identify the specifi c numbers of immigrants enrolled in these programs, their national origins, their citizen-ship or visa status, or their English-reading, writing, and math skills gains during their course of participa-tion.73 Immigrants clearly accounted for a high share of all enrollees in these adult education programs during the 2000-2001 program year, since enrollments in English as a Second Language (ESL) programs alone represented 42% of all enrollments in these pro-grams.74 It would be highly desirable to track the true extent of immigrant enrollments in these programs, their English-reading and writing profi ciencies at entry and exit, and their educational, employment, and citi-zenship outcomes.75 There is a critical need for more comprehensive impact evaluations of the effectiveness
of adult basic education programs for the nation’s im-migrants, including experimental design evaluations using randomly assigned treatment and control groups with multiple intervention strategies.
(iii) As revealed earlier in this paper, only slightly more than one-half of all immigrants 20 and older with a least fi ve years of tenure in the U.S. in 2000 were naturalized citizens. The citizenship rates of these immigrants were found to vary systematically with their years of formal schooling and their Eng-lish-speaking profi ciencies. Better-educated and more English-profi cient immigrants were substantially more likely to be citizens than their less educated and less literate counterparts. Very similar citizenship patterns held true for Mexican immigrants, who had a sharply lower overall citizenship rate in 2000 (30%).76
There are diverse forces at work underlying the low rates of citizenship among the nation’s immi-grants, including the existence of a large pool of un-documented immigrants (8 to 9 million) who are not eligible for citizenship. Among those eligible, however, limited formal schooling and weak English-speaking and English-reading profi ciencies serve as effective barriers to becoming U.S. citizens. A more concerted campaign should be undertaken in conjunction with state and local adult basic education agencies, com-munity-based literacy organizations, churches, and community colleges to bolster the literacy, English-speaking, reading, and writing skills of immigrants, and to enable more of them to become citizens and active participants in the political lives of their com-munities. Increasing citizenship rates among existing immigrants could help improve voter turnout in future national and state elections in the U.S. and strengthen citizen participation in national, state, and local poli-tics. A more literate and politically involved immigrant population could help strengthen American democracy in the near future.
72 The national management information system for this program is known as the Workforce Investment Act Standard Record Data (WI-ASRD). The Wagner-Peyser labor exchange programs run by states with national DOL funding also fail to capture such data on immi-grant characteristics. Some states do capture this information on the MIS systems for their One Stop Career Centers.
73 See: U.S. Department of Education, Office of Vocational and Adult Education, Adult Education and Family Literacy, Program Year 2000-2001, Report to Congress on State Performance, Washington, D.C., 2003.
74 Ibid, p. 13.75 The individual student records on the MIS systems of individual states can be used to conduct this analysis at the state level, but separate
identifiers for immigrant status, citizenship status, and the national origins of immigrants are needed. For an example of the types of analyses that can be conducted, See: John Comings, et al., New Skills for A New Economy, 2000.
76 For example, at the time of the 2000 Census, citizenship rates among Mexican immigrants in the U.S. varied from lows of 11 to 13 per-cent among those with 12 or fewer years of schooling and who could not speak English to highs of 60 percent among those with Associ-ate or Bachelor degrees who could speak English very well.

53
(iv) The NALS and IALS assessments were de-signed to estimate the literacy and quantitative pro-fi ciencies of the adult population (16 and older) of the nation. There are also a variety of national as-sessments of the literacy performance of school-age children in the U.S. including the National Assess-ment of Educational Progress (NAEP), which provides on-going assessments of the reading, writing, math, and science profi ciencies of U.S. students ages 9, 13, and 17. Unfortunately, only a few of the NAEP assess-ments (e.g., reading in 1992) appear to have captured information on the nativity status of the student test takers. The 1992 assessments in reading revealed that foreign-born students, on average, scored signifi cantly below their native-born counterparts.77 For example, eighth grade students who were born abroad had a mean scale score in reading that was 19 points or .5 standard deviations below that of their native-born counterparts. The mean reading score of foreign-born twelfth graders was 14 points or .4 standard deviations below that of their native-born counterparts.78
More recent NAEP assessments have provided information on the test scores of students classifi ed as limited English-profi cient (LEP). Results from recent reading and writing assessments reveal that students characterized by their schools as limited English-profi -cient score quite poorly on these tests.79 For example, the results of the 1998 and 2002 reading assessments for the nation’s eighth graders revealed that these LEP students obtained mean reading scale scores that were 1.3 standard deviations below those of their peers who were not classifi ed as LEP students. On the NAEP writing assessments for eighth graders in 1998 and 2002, the mean scale scores of LEP students were 1.3 and 1.1 standard deviations, respectively, below those of their other classmates.
The weak academic achievement among limited English-speaking students is likely to prove to be a key factor in their dropping out of high school before graduation. Our analysis of the school enrollment/educational attainment of 16-19 year old immigrants in the U.S. in 2000 revealed that those youth with limited English-speaking profi ciencies (i.e., those who do not speak English or do not speak it well) were considerably more likely than were their English-profi -cient counterparts to have dropped out of high school before receiving a diploma. Fifty-seven percent of the limited English speaking versus only 11% of those teens who reported speaking English well or English only had dropped out of high school by the time of the 2000 Census.80 Additional and more effi cient educa-tional and English-as-a-second language investments in immigrant children and the native-born sons/daughters of immigrants are likely to be needed to boost their English literacy profi ciencies and ultimate educational attainment.
(v) The fi ndings of the 1992 NALS survey, the 1994 IALS survey, and the 2000 Census of Population and Housing regarding the literacy profi ciencies and educa-tional attainment of the nation’s immigrant population reveal the existence of a number of serious tensions be-tween current national immigration policy, educational policy, and the achievement of labor market goals for the native-born population. Immigrants, especially well-educated legal immigrants, have made important contributions to the nation’s economy, its skilled work force, and its social life over the past decade. Even at the low skill end of the labor market, immigrants have contributed in important ways to labor force growth in many regions and states and to the prevention of skill shortages and accompanying wage pressures during the economic boom of the mid to late 1990s.
77 See: U.S. Department of Education, National Center for Education Statistics, “The 1992 NAEP Reading Report Card: NAEP Data,” web-site. (http://nces.ed.gov/nationsreportcard/)
78 Both of these differences in mean reading test scores were statistically significant at the .01 level.79 See: U.S. Department of Education, National Center for Education Statistics, “NAEP Data for Reading and Writing Grade 8, 1998 and
2002,” website. (http://nces.ed.gov/nationsreportcard/naepdata/)80 Previous research has shown that the younger the age of an immigrant child coming to the U.S., the greater is their English-speaking
abilities later in life and the greater the likelihood that he/she will complete more years of schooling and achieve superior labor market outcomes. See: Hoyt Bleakley and Aimee Chin, Language Skills and Earnings, 2001.

54
The very weak literacy profi ciencies of many im-migrants and the limited formal schooling of many recent immigrants do, however, confl ict in a very direct manner with a number of the nation’s educa-tional goals. Among the educational goals established by the nation’s governors at the 1989 Education Sum-mit in Charlottesville, Virginia were the attainment of a high school graduation rate of at least 90% by the year 2000 (Goal 2) and that “by the year 2000, every adult American will be literate and will possess the knowledge and skills necessary to compete in a global economy” (Goal 6).81
The fi ndings of the NALS and IALS assessments have revealed that the absolute and comparatively weak literacy performance of many immigrant adults seriously complicates the task of achieving Goal 6, and the IALS and 2000 Census fi ndings indicate quite starkly that very high fractions of recent immigrants, including adults and teens, lack the high school diplo-mas needed to achieve Goal 2. The confl ict between the achievement of national educational goals and current immigration policy is particularly severe for undocumented immigrants, who often have both lim-ited schooling and literacy skills. National policymak-ers need to openly address these important tradeoffs between educational goals and existing immigration policies.
Similar tensions exist between current immigra-tion policy and desirable national labor market goals. The U.S. currently lacks a specifi c set of labor market goals to guide national economic policy. Empirical research, however, has revealed that the increased sup-ply of poorly educated immigrant workers has placed added pressures on the wages and annual earnings of native-born dropouts and on high school graduates, thereby depressing their real wages and living stan-dards and contributing to an increase in the working poor.82 An immigration policy supportive of economic growth and reduced wage inequality would curtail the importation of less educated and less skilled workers, especially among the undocumented immigrant popu-lation which has grown substantially over the past decade due in large part to a lack of adequate enforce-ment policies by the U.S. Immigration and Naturaliza-tion Service (INS) and other federal/state agencies.83 Our nation’s human capital would clearly benefi t from an objective and sustained national policy debate on the benefi ts and costs of immigration and the need for immigration reforms to make national educational, labor market, and immigration policies more compat-ible with each other.
81 See: National Education Goals Panel, The National Education Goals Report: Building A Nation of Learners, U.S. Government Printing Office, Washington, D.C., 1994.
82 See: (i) George J. Borjas, Heaven’s Door: Immigration Policy and the American Economy, Princeton University Press, Princeton, New Jersey, 1999; (ii) Andrew M. Sum and W. Neal Fogg, The Changing Workforce: Immigrants and the New Economy in Massachusetts, Massachusetts Institute for A New Commonwealth, Boston, 1998; (iii) Steven A. Camorata, The Wages of Immigration: The Effect on the Low-Skilled Labor Market, Center for Immigration Studies, Washington, D.C., 1998; (iv) David Jaeger, Skills Differences and the Effect of Immigration on the Wages of Natives, U.S. Department of Labor, Bureau of Labor Statistics, Washington, D.C., 1998.
83 See: Vernon Briggs, Mass Immigration and the National Interest, M.E. Sharpe, Inc., Armonk, New York, 1996.

55
APPENDIX AThe Mean Profi ciencies of the Native Born and Immigrants in the U.S. by Years of Schooling Completed: Findings from the NALS Survey
In the main body of the monograph, fi ndings of the NALS survey on the mean composite profi ciencies of native- and foreign-born adults by years of schooling completed were presented. In this appendix, we pres-ent fi ndings from the NALS survey on the mean pro-fi ciency scores of the native and foreign born on the prose, document, and quantitative scales. On all three scales, the mean scores of the native born exceeded
those of the foreign born in each schooling group, and all of these differences were statistically signifi cant at the .01 level. The absolute size of the mean profi ciency gaps were largest for those adults lacking a regular high school diploma or GED certifi cate and smallest for those adults holding a master’s or more advanced academic degree. Table A-1 presents the fi ndings for the prose, document, and quantitative scales.
Table A-1:Comparisons of the Profi ciency Scores of Native-Born and Immigrant Adults in the U.S. by Level of Schooling Completed
Prose Scale
Level of Schooling Native Born Immigrants DifferenceSig. of
Difference
Less than high school 229 157 72 0.01
High school diploma/GED 273 222 51 0.01
1-3 years college 300 262 38 0.01
Bachelor’s degree 327 276 51 0.01
Post bachelor's degree 339 311 28 0.01
Document Scale
Level of Schooling Native Born Immigrants DifferenceSig. of
Difference
Less than high school 224 157 67 0.01
High school diploma/GED 267 222 45 0.01
1-3 years college 294 263 31 0.01
Bachelor’s degree 319 275 44 0.01
Post bachelor’s degree 328 305 23 0.01
Quantitative Scale
Level of Schooling Native Born Immigrants DifferenceSig. of
Difference
Less than high school 224 155 69 0.01
High school diploma/GED 273 226 47 0.01
1-3 years college 300 258 42 0.01
Bachelor’s degree 326 286 40 0.01
Post bachelor’s degree 336 318 18 0.01
Source: NALS survey, 1992.

56
In the text of this monograph, we described the fi nd-ings of a multivariate statistical analysis of the com-posite profi ciencies of U.S. immigrants. The same set of seven predictor variables also were used to predict
APPENDIX BMultiple Regression Analysis of the Prose Profi ciencies of U.S. Immigrants: Findings from the IALS Survey
Table B-1:Findings of the Multiple Regression Analysis of the Prose Profi ciencies of Immigrants (Age 16-65) in the U.S., 1994
Variable Coeffi cient Standard Error t-statistic
Constant 80.0 8.15 9.81***
EDCOMP 5.8 .58 10.05***
ENG1 122.9 9.23 13.30***
ENG2 68.8 12.18 5.65***
ENG3 50.7 10.49 4.83***
ENG4 16.1 9.96 1.62*
ENG5 .6 9.02 .06
YRSENG 1.2 .25 4.79***
Notes: *** sig. at .01 level * sig. at .10 levelR2 = .558Adj. R2 = .553Degrees of Freedom = 7,554F = 100.1Sig. F = .001Source: IALS survey, 1994.
the prose profi ciencies of U.S. immigrants. The results of the multiple regression analysis are displayed in Table B-1.
Five of the seven predictor variables, including years of schooling and years spent studying English, were statistically signifi cant at the .01 level, and the variable ENG4 representing an immigrant who fi rst began studying English between ages 14 and 21 was statistically signifi cant at the .10 level. Each year of schooling would raise the expected prose profi ciency score of immigrants by nearly 6 points. An immigrant whose fi rst language was English would be expected to score 123 points higher than an immigrant who could not speak English at the time of the IALS survey. Each
year that has passed since one fi rst began studying English would raise the expected prose score by ap-proximately 1.2 points. The regression model was able to explain between 55 and 56% of the variation in the prose profi ciencies of U.S. immigrants. The fi ndings of the multiple regression model were used to predict the prose profi ciency scores of three hypothetical immi-grants. The characteristics of these three immigrants and their predicted prose profi ciencies are displayed in Table B-2.

57
Individual A is an immigrant who did not speak English at all at the time of the IALS assessment and completed only 10 years of schooling in his home country. This individual’s predicted prose profi ciency score was only 138 (at the low end of Level 1). Indi-vidual B is an immigrant who is 30 years old, began studying English at age 10, and obtained a regular high school diploma. The predicted prose profi ciency score of this individual was 242, which is in the middle of Level 2. The third hypothetical immigrant is an
individual whose fi rst language was English, obtained a bachelor’s degree, and was 30 years old at the time of the IALS assessment. This individual has a predicted prose profi ciency of 331, which is at the low end of Level 4. These fi ndings clearly reveal the large joint im-pacts of schooling, age at which one fi rst learned the English language, and years spent studying English on the literacy profi ciencies of U.S. immigrants in the mid-1990s.
Table B-2:Predicted Prose Profi ciency Scores for Three Hypothetical Immigrants
Predicted Score
Individual A: Does not speak English, completed 10 years of school 138
Individual B: Began speaking English at age 10, is now 30 years old., H.S. graduate 242
Individual C: Began speaking English as a fi rst language, 30 years old, holds a B.A. degree 331
Source: IALS survey, 1994, tabulations of the authors.

58
The International Adult Literacy Survey (IALS) was conducted in 23 countries over the 1994-98 period. In two of these countries, Canada and Switzerland, separate assessments were undertaken for language groups. In Canada, there were separate assessments in French and English. In Switzerland, there were separate literacy assessments in French, German, and Italian. Altogether, IALS assessment data were avail-able for 26 nations/language groups, including the U.S.
Six of the nations participating in the IALS assess-ment, however, had relatively low per capita outputs
as measured by their Gross Domestic Product. Each of these six countries (Chile, Czech Republic, Hungary, Slovenia, Poland, and Portugal) had a GDP per capita in U.S. dollars of $10,690 or less in 1998 while each of the other higher income countries had per capita GDPs ranging from $18,340 (Ireland) to $40,080 (Swit-zerland).84 Our comparisons of the literacy perfor-mance of U.S. immigrants with those of their peers in other high-income countries are confi ned to these 19 other high-income countries/language groups. A listing of the 19 countries is presented in Table C-1 below.
APPENDIX CThe Selection of the 19 Other High-Income Countries for Inclusion in the IALS Comparative Analysis of Immigrants’ Literacy Profi ciencies
Table C-1:List of the Other 19 High-Income IALS Countries/Language Groups Included in the Prose, Document, Quantitative, and Composite Score Analyses
Australia Germany Norway
Belgium (Flanders) Great Britain Sweden
Canada (English) Ireland Switzerland (French)
Canada (French) Italy Switzerland (German)
Denmark Netherlands Switzerland (Italian)
Finland New Zealand
France Northern Ireland
84 See: The World Bank, Entering the 21st Century: World Development Report, 1999/2000, Oxford University Press, New York, 2000.

59
The NALS survey collected data on a variety of weekly earnings measures from employed respondents. Week-ly earnings data were collected for jobs held at the time of the survey, and persons employed in the prior 52 weeks were asked to estimate their average weekly earnings over the 52-week period. Data also were made available on average weekly hours of employ-ment in the prior calendar year. We, thus, can estimate average weekly earnings on full-time jobs held in the prior year.
Our estimates of the average weekly earnings of employed immigrants who usually worked full-time during the prior year (1991-92) are displayed in Table D-1 below. Findings are provided for workers in each profi ciency level on the prose, document, quantitative,
APPENDIX DThe Average Weekly Earnings of Full-Time Employed Immigrants in the U.S.: Findings from the NALS Survey
Table D-1:Average Weekly Earnings on Full-Time Jobs Held by Immigrant Workers During the Prior 12-Month Period, by Level on Each Profi ciency Scale
Profi ciency Scale Level 1 Level 2 Level 3 Levels 4-5
Prose $ 278* $ 427* $ 618* $ 981*
Document 294* 439* 576* 915*
Quantitative 259* 433* 560* 902*
Composite 268* 459* 567* 964*
*All differences between each pair of weekly earnings in a given row are statistically signifi cant at the .01 level. Source: NALS survey, 1992.
and composite scales. On each of the four scales, the mean weekly earnings of full-time employed immi-grants increased uniformly and strongly with their profi ciency level. For example, along the composite scale, mean weekly earnings ranged from a low of $268 for those in profi ciency Level 1, to $459 for those in profi ciency Level 2, to $567 for those in profi ciency Level 3, to a high of $964 for those in the two highest profi ciency levels (4 and 5). Similar patterns prevailed along each of the other three scales. All of the differ-ences between each pair of earnings were statistically signifi cant at the .01 level. Immigrant workers in the U.S. during the early 1990s with strong literacy and quantitative skills substantially outearned their peers with more limited profi ciencies.

60
In the text of the monograph, estimates of the 1999 an-nual earnings of employed foreign-born persons in the U.S. were presented. These earnings estimates, based on the fi ndings of the 2000 Census of Population and Housing, were provided for employed immigrants 20 years of age or older in 30 educational/ English-speak-ing profi ciency subgroups. Each employed immigrant was assigned to one of six educational attainment categories and one of fi ve English-speaking profi ciency categories, ranging from those who could not speak English at all to those who only spoke English. The ratings of English-speaking profi ciency were based on self-reports of household members, not on any objec-tive assessment of their speaking abilities.
In the tables below, we provide similar 1999 annual earnings estimates for immigrant men and women separately. The estimates are restricted to those employed immigrants 20 and older who earned at least $2,000 during the calendar year. An analysis of the fi ndings reveals that, for both immigrant men and women, annual earnings are strongly associated with their educational attainment and English-speaking profi ciency. The absolute and relative size of the mean earnings gaps between those immigrants with the most schooling (master’s degree or higher) and highest English-speaking profi ciencies and those with the least schooling (high school dropouts) and most limited English-speaking abilities are extraordinarily large. The top earnings groups among both men and women obtain mean annual earnings fi ve to six times as high as those of the bottom earnings group.
APPENDIX EThe 1999 Mean Annual Earnings of Employed Male and Female Immigrants in the U.S. by Years of Schooling and English-Speaking Profi ciency: Findings from the 2000 Census
Note: Sample was restricted to those individuals with at least $2,000 in annual earnings during calendar year 1999.Source: U.S. Census Bureau, Decennial Census of Population and Housing (PUMS 1% Sample), 2000.
Table E-1:Mean Annual Earnings of Immigrant Men and Women (20 and Older) in the U.S. by Years of Schooling and English-Speaking Profi ciency: 1999
English-Speaking Profi ciency
Years of Schooling, by genderEnglish
Only Very Well Well Not Well Not at all Total
Men
Less than 12 or 12 but no diploma $ 24,208 $ 25,063 $ 24,055 $ 18,993 $ 14,501 $ 20,850
HS diploma or GED 35,597 29,906 26,723 21,124 16,040 27,510
1-3 years of college, no degree 43,608 34,707 30,630 23,758 17,580 34,156
Associate’s degree 44,933 38,228 33,391 26,923 26,719 37,769
Bachelor’s degree 66,452 52,736 45,014 35,067 26,397 53,056
Master's or higher degree 92,139 80,061 55,442 36,022 33,870 76,406
Total 51,958 45,986 31,660 21,102 15,317 36,670
English Only Very Well Well Not Well Not at all Total
Women
Less than 12 or 12 but no diploma $ 15,941 $ 15,895 $ 16,216 $ 13,790 $ 10,508 $ 14,275
HS diploma or GED 20,744 20,045 18,016 14,928 11,092 18,453
1-3 years of college, no degree 26,803 23,028 20,689 16,745 13,958 22,877
Associate’s degree 29,067 27,658 22,917 18,982 12,759 26,254
Bachelor’s degree 40,009 36,404 30,779 22,784 17,217 35,342
Master's or higher degree 50,403 49,631 35,217 19,278 17,236 46,072
Total 29,553 29,460 21,764 15,118 10,976 24,541


Listening. Learning. Leading.
Visit us on the Web at www.ets.org/research
88503-035425 • 34E6 • Printed in U.S.A.
I.N.724462