a hybrid method for process fault detection and...
TRANSCRIPT
A Hybrid Method for Process FaultDetection and Diagnosis
Md Raihan Mallick ∗ Syed A. Imtiaz ∗∗
∗ Faculty of Engineering and Applied Science, Memorial University ofNewfoundland, NL, Canada (e-mail: [email protected]).
∗∗ Faculty of Engineering and Applied Science, Memorial University ofNewfoundland, NL, Canada (e-mail: [email protected])
Abstract: For process fault detection and diagnosis, a real time hybrid method based onPrinciple component analysis (PCA) and Bayesian belief network (BBN) is described. Uponsuccessful identification of fault from PCA residual plot and Q statistics, information from thePCA contribution of each variable is passed to the BBN for root cause analysis. Pearl‘s messagepassing algorithm is used for belief updating. Early detection of fault, makes the methodologymore reliable and robust during the process fault occurrence. The aim of this monitoring toolis to incorporate prior process knowledge along with the present observed evidence to comeup with most plausible explanation of how the process is behaving. The effectiveness of theproposed method is demonstrated for a Dissolution tank model for different simulated scenariosby detecting and diagnosing the fault accurately.
Keywords: Fault Detection and Diagnosis (FDI), Principle component analysis (PCA),Bayesian belief network (BBN), Hybrid model, Prior probability, Posterior probability,Contribution plot, Residual, Q-statistics.
1. INTRODUCTION
According to Himmelblau (1978), the term fault in pro-cess, is generally defined as a departure of an observedvariable or a calculated parameter from an acceptablerange. The underlying cause of this abnormality is calledthe basic event or the root cause. In the recent years signif-icant research has been done on process monitoring. Thisanalysis includes qualitative, quantitative and multivariatestatistical approaches, excellent review of these methodscan be found in Venkatasubramanian et al. (2003c,a,b).Although, these methods are very effective for detectingthe fault early but they are not as effective for pinpointingthe root cause of the fault.
Modern processes are complex with large number of vari-ables and it needs complex analysis for the operators todetect the root cause of a process fault. According tothe industrial statistics, human error is the main reasonfor about 70% of the industrial accidents which havesignificant economic, safety and environmental impact.Therefore, an automated fault diagnosis method is desiredduring the process fault condition to aid the human oper-ators to steer the process to a safe operating condition.
In this work, a PCA-BBN based automated hybrid faultdetection and diagnosis method is described. PCA is veryefficient for fault detection however not as efficient indiagnosing the fault and cannot provide the root causeof the fault. In a process once a fault is detected by amonitoring scheme, in addition to the diagnosis reportan operator uses the process knowledge to pinpoint theroot cause. Process knowledge is introduced into BBN toperform this diagnosis task by mimicking exactly what an
operator does during the process fault to find the rootcause.
The paper is structured as follows: background and moti-vation of research is in section 2, Next in section 3, a briefdescription of the PCA-BBN based hybrid algorithm, thensimulation case study Dissolution tank model in section4, After that, performance and efficiency of the proposedmethod is shown with simulated result in the section 5followed by conclusion in the section 6.
2. BACKGROUND AND MOTIVATION
The motivation for designing hybrid diagnostic systemsarises due to the fact that there is no single method thatmeets all the requirements of a good diagnostic system,Mylaraswamy and Venkatasubramanian (1997). Qualita-tive diagnosis models such as signed directed graph (SDG)based methods tend to be good for root cause analysisrather than being early detectors. SDG models are lesssensitive to the process parameter change or noise but theyare not efficient for large processes. For large scale or non-linear process, building a SDG based diagnosis model istedious, Yang et al. (2010). On the other hand, quantita-tive model-based methods, often referred to as analyticalmodels or observer-based or parity-based approaches, arevery efficient and sensitive to process fault. They are builtwith deep process knowledge, however requires significantcomputational effort. Computational cost associated withdeveloping statistical classifiers and neural networks arevery low. They are relatively robust to noise and othermodel uncertainties present in the process. However, theycannot provide adequate explanations about the diagnos-tic reasoning. For example, PCA/PLS based FDI scheme
Preprints of the 10th IFAC International Symposium on Dynamics and Control of Process SystemsThe International Federation of Automatic ControlDecember 18-20, 2013. Mumbai, India
Copyright © 2013 IFAC 827
are efficient and quick at fault detection but from thecontribution plot it requires a complex analysis to find outthe root cause. Sometimes more than one variable is shownas faulty due to the smearing effect in the PCA leads toan ambiguity in root cause analysis, Yoon and MacGregor(2000); Liu (2012).
It is evident from the above discussion that one singlemethod is not enough to develop an efficient FDI scheme.To combine the positive features of various methods hybridmethods have been proposed. Becraft et al. (1991) haveproposed an integrated methodology for fault diagnosiswith a neural network and an expert system. To diagnosethe most commonly encountered faults in chemical processplants, a neural network is used. Once the faults are de-tected within a particular process by the neural network, adeep knowledge expert system analyse the result and sug-gests mitigating action. A DKit based hybrid model pro-posed by Mylaraswamy and Venkatasubramanian (1997)for process fault detection and diagnosis. The inability ofSDG for timely fault detection is overcome by the strengthof early detection abilities of neural networks and the in-ability of neural networks to provide insights for diagnosiswas compensated by the SDG’s accurate diagnostic power.Vedam and Venkatasubramanian (1999) proposed a PCA-SDG based hybrid methodology for fault detection anddiagnosis. In order to perform diagnosis using SDGs alone,each measured variable need to be compared against thehigh and low thresholds to identify its deviation which isvery difficult for a large process. PCA plays a vital rolein dimension reduction of the analysis. A hybrid systemwith signed directed graphs (SDG) and fuzzy logic haveproposed by Enrique E. Tarifa (2003). The SDG modelof the process is used to perform qualitative simulationto predict possible process behaviour for various faults.Those predictions are used to generate if-else rules that areevaluated by an expert system using information about theactual process state. Sun et al. (2012) used a first-principlemodel combined with a data-driven artificial neural net-work model for process fault detection and diagnosis. Itdemonstrates good performance both in process monitor-ing and fault diagnosis.
Introduction of process knowledge into an expert modelto perform diagnosis has been recent interest of research.Leung and Romagnoli (2000) developed an process knowl-edge based diagnosis method (PCEG) for fault diagnosis.In this context, BBN brings value as it quantifies theuncertainty in the diagnosis and it can incorporate processknowledge. More recently BBN has been used to com-bine various fault detection and diagnosis methods. Huang(2008) used BBN to unite diagnostic information fromvarious diagnostic tools to calculate the overall controlloop performance. S. Dey (2005) showed that pearl’s directmessage passing algorithm can find root cause of processfault successfully in which posterior probability of eachnode is updated from evidence.
In this work a PCA-BBN based hybrid fault detection anddiagnosis method is described where BBN takes detectionand diagnosis results of PCA and further refines it basedon process knowledge to accurately pinpoint the root causeof fault.
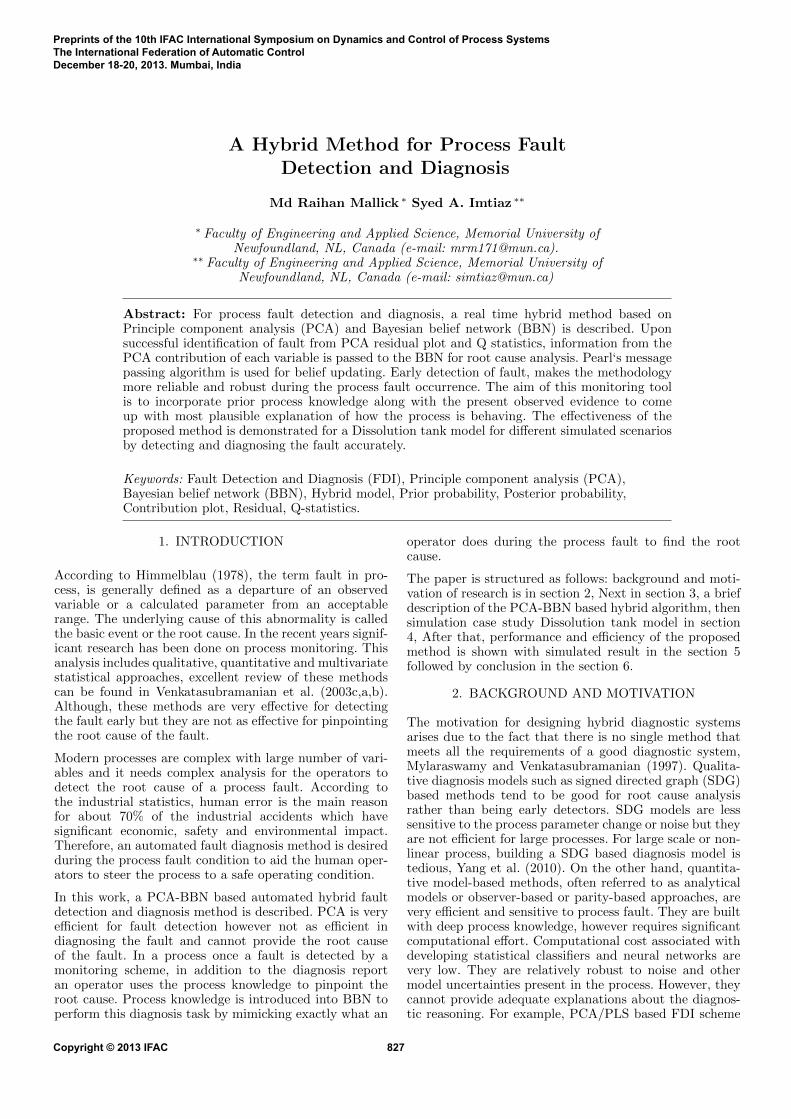
Fig. 1. FDD algorithm
3. PCA-BBN HYBRID METHOD
Detail algorithm for this hybrid FDI model is shown inFig. 1. This algorithm has two essential parts. They areonline fault detection using PCA, fault diagnosis usingBBN and process knowledge incorporation into BBN forfault diagnosis.
3.1 Fault Detection using PCA
For online fault detection, PCA model is built from thenormal operating condition data. The PCA model (theloading vectors) is used for process monitoring by project-ing the on-line data onto the model.
For a given data matrix of dimension XεRN×m where Nis the number of sample data and m is the number of thecorrelated variables in the data set. From SVD analysisof covariance matrix, the original variables decomposes asfollows:
cov(X) = PΛPT + P̃ Λ̃P̃T (1)
where Λ is a diagonal matrix with significant eigenvaluesand P contains the respective eigenvectors also known asloading vector. The Λ̃ and P̃ are the residual eigenvaluesand eigenvectors respectively.
Then the PCs can be expressed by the following equation
ti = XPi (2)
Here, i = 1, 2, 3......m and PiεRm×1
X̂ is the underlying noise free signal given by,
X̂ =
r∑i=1
tiPi (3)
Where r is the number of principle component r ≤m. Then the residual, between the projected data andmodel predictions, is estimated. Residual R, is calculatedaccording to the following formula,
R = (X − X̂)T (X − X̂)
= XT P̃ P̃TX(4)
Whenever the residual exceeds its threshold limit, thefault is detected. Upon successful detection of fault, PCAcontribution of each variable is analysed and passed to the
IFAC DYCOPS 2013December 18-20, 2013. Mumbai, India
828
BBN for fault diagnosis known as evidence. Contributionof i th variable to the Q-statistic can be calculated as
Ci = (XT P̃ P̃Tβi)2 (5)
Here β is a column vector i th element is one and the othersare zero. From the contribution plot it requires a complexanalysis to find out the root cause. Sometimes more thanone variable is shown as faulty due to the smearing effect inthe PCA leads to an ambiguity in root cause analysis. Thecontributions of the each variable is calculated by a matrixmultiplication. The effect of faulty variables may smearout over the other non-faulty variables. This will mislead adiagnosis of the correct root causes of the faults. Therefore,to mitigate this smearing effect, process knowledge alongwith contribution of each variable is used as evidence forthe BBN for fault diagnosis.
3.2 Fault Diagnosis using BBN
BBN can be built from the process dynamics or differ-ential equation of the process variables or cause effectrelationship among the process variables. Analysing thehistorical data of the process, both prior probability andconditional probability can be calculated. One can relyon expert judgement if historical data is not reliable.BBN is a graphical representation of the cause and effectrelationship among the process variables. Parent nodes arecasual or root nodes where child nodes are the effect nodes.For example a network with two nodes X and Y , whereX is the parents node and Y is the child node can beexpressed as
BEL(X) = αP (X)λ(X) (6)
where BEL(X) = P (X|Y ), α = [P (e)]−1 and λ(X) =P (e|X) = P (Y |X) is the likelihood vector or the condi-tional probability of the corresponding nodes.
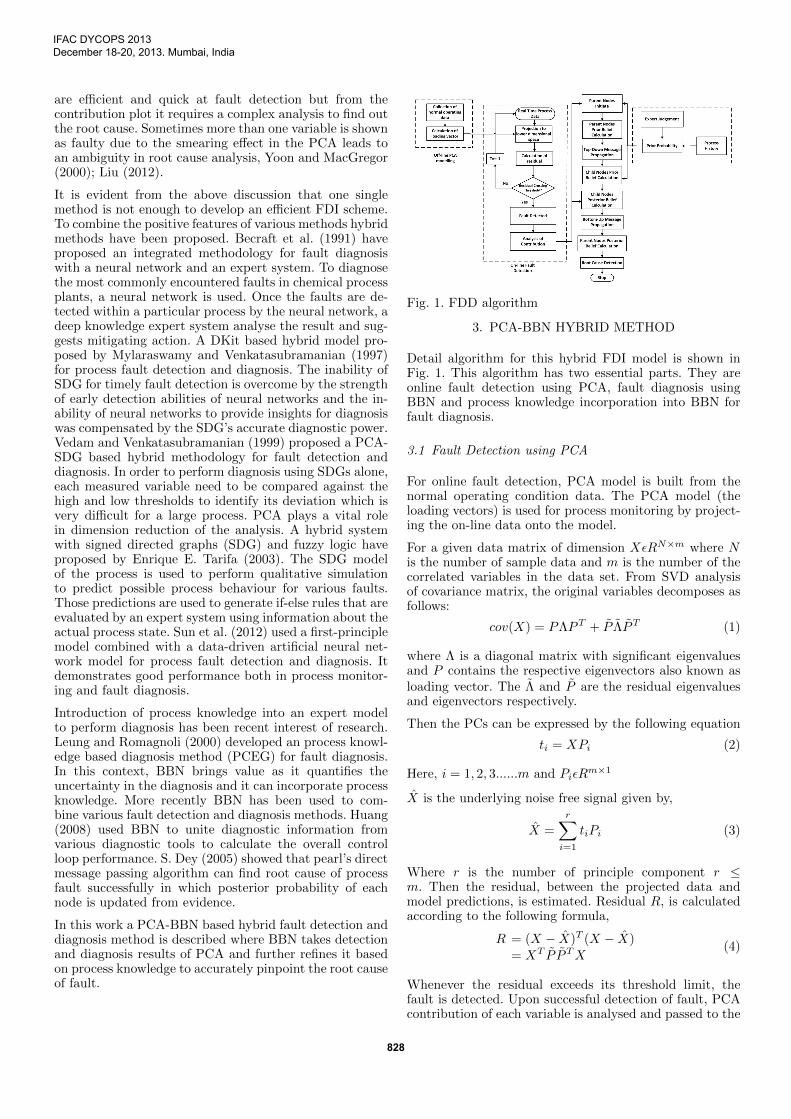
For our proposed method PCA contribution of each vari-able is used as evidence for the BBN for fault diagnosis.Depending upon this on-line evidence, BBN updates itsbelief of each node. If evidence is introduced from thehead and tail of a BBN shown in Fig. 2 BEL(X) canbe calculated as a function of the incoming evidences e+
and e−. Here, e+ and e− represents evidence coming intoBBN, to node X, from its parent node and child noderespectively.
BEL(X) = P (x|e+, e−)= αP (e−|x, e+)P (x|e+)= αP (e−|x)P (x|e+)= αλ(X)π(X)
(7)
here
π(X) = P (x|e+)
=∑u
P (x|u, e+)P (u|e+) (8)
since node U separates node X from e+
π(X) =∑u
P (x|u)π(u)
= π(u) ∗Mx|u
(9)
Fig. 2. Introduction of evidence in BBN
hereMx|u is a matrix defining conditional probability tablefor P (X|U). Similarly λ(X) can be calculated as
λ(X) =∑y
P (y|x)λ(Y )
= λ(Y ) ∗My|x
(10)
Now each node of the network can compute its own π andλ based on the evidence it receives.
Belief propagation between the parent nodes and childnodes follows Peral‘s message passing algorithm shown inFig. 3 can be found in Pearl (1988). Each parent node isinitiated by prior probability. Prior belief of parent nodesare calculated by evidence from the PCA and initiallycalculated prior probability. By top-down propagationparent nodes prior belief are passed to the child nodes.Then child nodes calculate the prior belief with the helpof the conditional probability table and the prior beliefof the parent nodes. Each child node updates its priorbelief to posterior belief based on the evidence comingfrom PCA. Posterior belief of the child node is sent tothe parent node by bottom up belief propagation. Theneach parent node updates its prior belief to posterior beliefbased on the posterior belief of the child nodes. Thisupdating process continues until each node is updated tothe posterior belief. At next time instant each node receivenew evidence from the PCA and posterior belief of theprevious time instant becomes prior belief for next timeinstant. Belief propagation start again until the networkis converged.
Prior belief of every node is rectified by both PCA evidenceand process knowledge. Initially some non-faulty variablesmay show up as faulty in the PCA contribution plot.But when they are updated based on the evidence andcurrent process knowledge in the BBN, their posteriorbelief reflects the real condition of the variable and removesthe ambiguity of diagnosis. Belief propagation can besummarized as below
Step 1 - Belief Updating When a node X is activatedto update its parameters, it simultaneously inspects themessage from its parent nodes π(X) and the messages fromits child nodes λ(X). Using these inputs, a initiated nodeupdates its belief
BEL(X) = αλ(X)π(X) (11)
where
λ(X) =∏j
λyj(X) (12)
π(X) =∑u
P (X|u)πx(u) (13)
and α is a normalizing constant and for all states of X∑x
BEL(X) = 1 (14)
IFAC DYCOPS 2013December 18-20, 2013. Mumbai, India
829
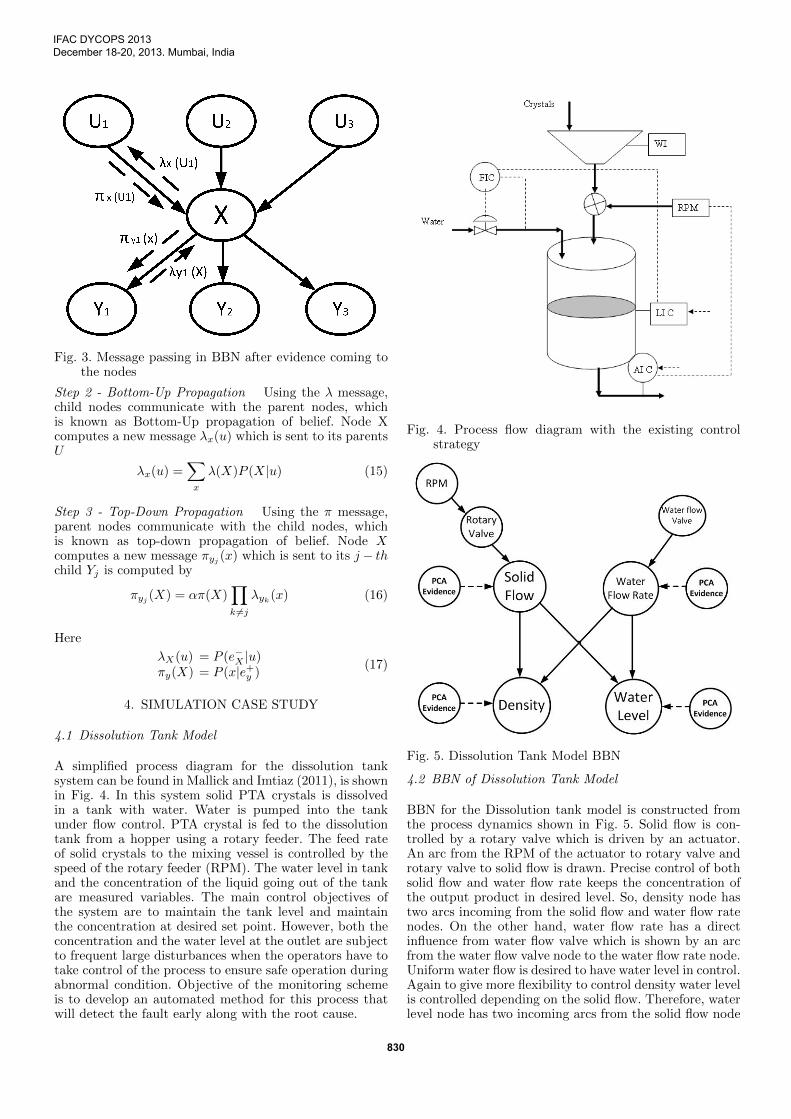
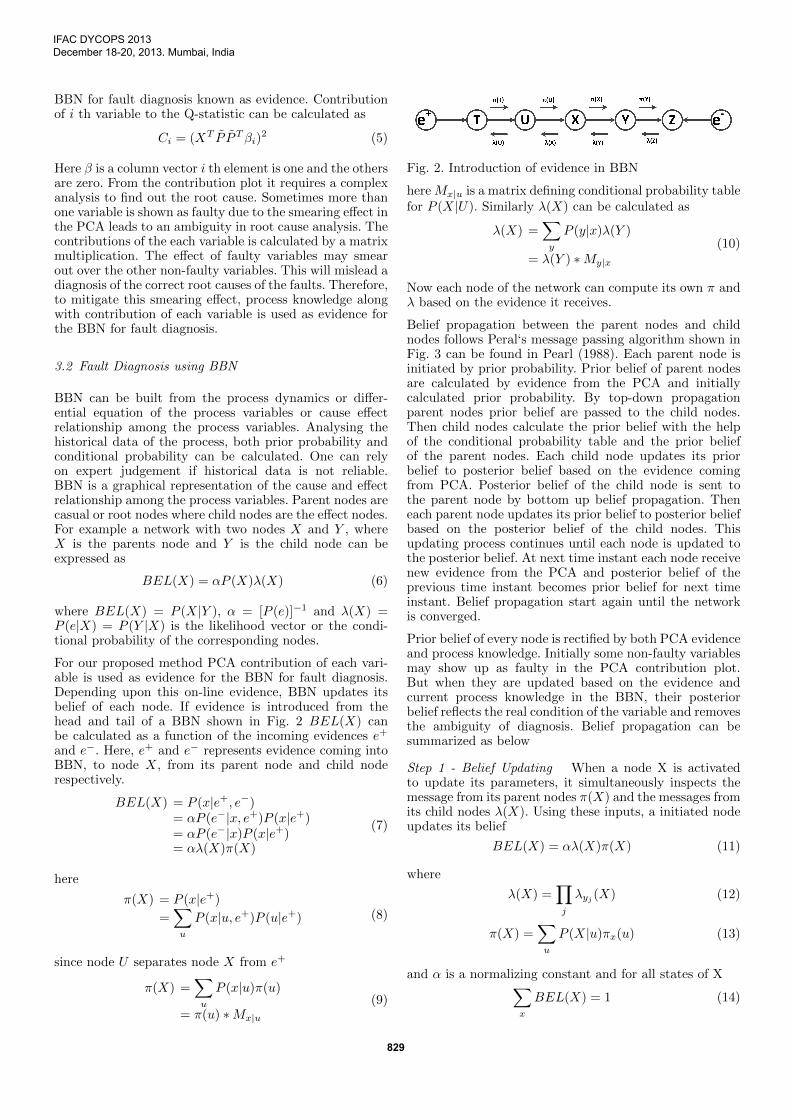
Fig. 3. Message passing in BBN after evidence coming tothe nodes
Step 2 - Bottom-Up Propagation Using the λ message,child nodes communicate with the parent nodes, whichis known as Bottom-Up propagation of belief. Node Xcomputes a new message λx(u) which is sent to its parentsU
λx(u) =∑x
λ(X)P (X|u) (15)
Step 3 - Top-Down Propagation Using the π message,parent nodes communicate with the child nodes, whichis known as top-down propagation of belief. Node Xcomputes a new message πyj
(x) which is sent to its j − thchild Yj is computed by
πyj (X) = απ(X)∏k 6=j
λyk(x) (16)
Here
λX(u) = P (e−X |u)πy(X) = P (x|e+y )
(17)
4. SIMULATION CASE STUDY
4.1 Dissolution Tank Model
A simplified process diagram for the dissolution tanksystem can be found in Mallick and Imtiaz (2011), is shownin Fig. 4. In this system solid PTA crystals is dissolvedin a tank with water. Water is pumped into the tankunder flow control. PTA crystal is fed to the dissolutiontank from a hopper using a rotary feeder. The feed rateof solid crystals to the mixing vessel is controlled by thespeed of the rotary feeder (RPM). The water level in tankand the concentration of the liquid going out of the tankare measured variables. The main control objectives ofthe system are to maintain the tank level and maintainthe concentration at desired set point. However, both theconcentration and the water level at the outlet are subjectto frequent large disturbances when the operators have totake control of the process to ensure safe operation duringabnormal condition. Objective of the monitoring schemeis to develop an automated method for this process thatwill detect the fault early along with the root cause.
Fig. 4. Process flow diagram with the existing controlstrategy
Fig. 5. Dissolution Tank Model BBN
4.2 BBN of Dissolution Tank Model
BBN for the Dissolution tank model is constructed fromthe process dynamics shown in Fig. 5. Solid flow is con-trolled by a rotary valve which is driven by an actuator.An arc from the RPM of the actuator to rotary valve androtary valve to solid flow is drawn. Precise control of bothsolid flow and water flow rate keeps the concentration ofthe output product in desired level. So, density node hastwo arcs incoming from the solid flow and water flow ratenodes. On the other hand, water flow rate has a directinfluence from water flow valve which is shown by an arcfrom the water flow valve node to the water flow rate node.Uniform water flow is desired to have water level in control.Again to give more flexibility to control density water levelis controlled depending on the solid flow. Therefore, waterlevel node has two incoming arcs from the solid flow node
IFAC DYCOPS 2013December 18-20, 2013. Mumbai, India
830
and water flow node. PCA contribution for each variableis used as evidence to the corresponding nodes shown bybroken arcs. Process dynamics is introduced to the BBN byprior probability and conditional probability. Both priorprobability and conditional probability table filled up foreach node based on expert judgement.
The BBN is initiated with prior probability calculatedfrom the expert judgement. When ever new evidence cometo solid flow node, the node update its own belief andpropagates its belief according to the propagation methoddescribed in the Section 3.2 to the density node and thewater level node. Evidence coming to the density nodeupdates the prior belief of density to the posterior beliefand propagates its belief to the both water flow node andsolid flow node. Solid flow node then updates its beliefbased on the information it gets from the density node.With the similar process belief is propagated betweenwater flow, water level and solid flow node. When beliefof all node is updated network stabilizes and wait for thenext evidence. This cycle repeats at each time instant untilall nodes update its belief to the posterior belief.
Two faulty scenarios are created and hybrid method isapplied. PCA detected the fault early but diagnosis wasnot precise since PCA contribution plot showed morethan one variables to be faulty since the contributions aretransformed from the process variables through a matrixmultiplication, the faulty variables may smear out overthe other variables, which will mislead a diagnosis of thecorrect root causes of the faults. BBN resolve this diagnosisproblem. Here, PCA evidence and process knowledge playsa vital role. Successful diagnosis is shown in the resultsection.
5. RESULT
The hybrid method was successfully implemented on thedissolution tank model. In case study 1 a fault is intro-duced in solid flow and in case study 2 a fault is introducedin water flow rate. In both cases fault was detected anddiagnose correctly.
5.1 Case Study 1
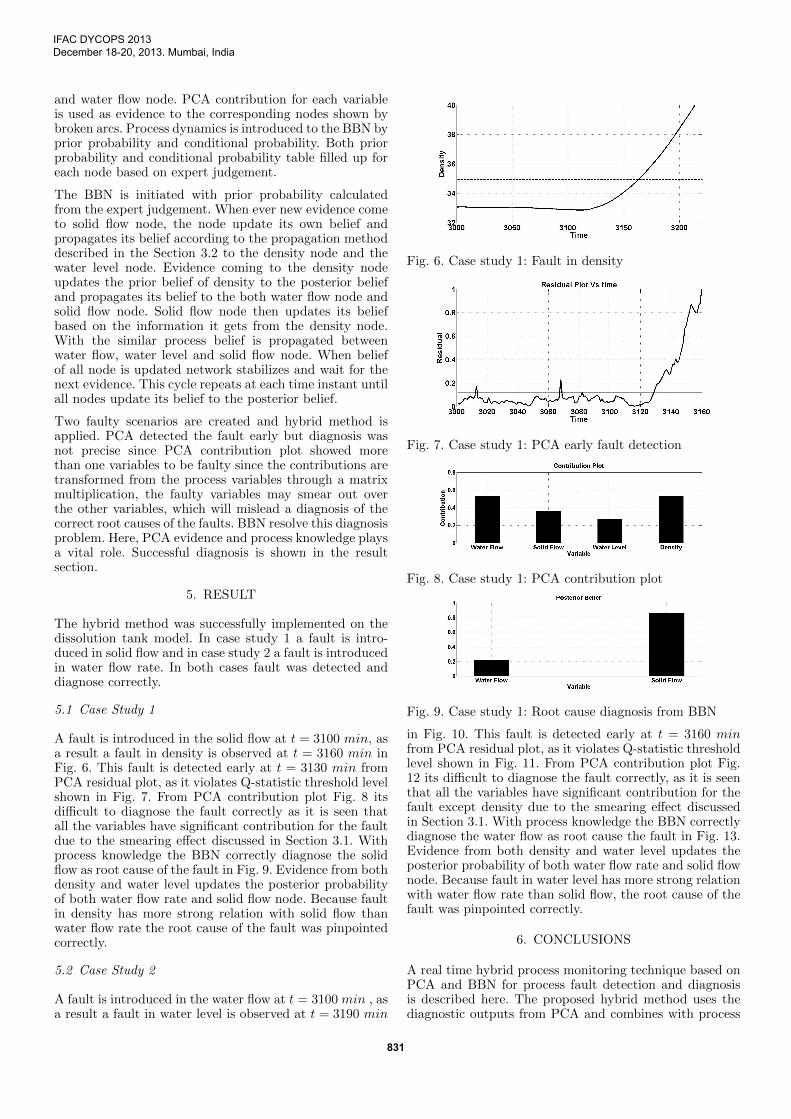
A fault is introduced in the solid flow at t = 3100 min, asa result a fault in density is observed at t = 3160 min inFig. 6. This fault is detected early at t = 3130 min fromPCA residual plot, as it violates Q-statistic threshold levelshown in Fig. 7. From PCA contribution plot Fig. 8 itsdifficult to diagnose the fault correctly as it is seen thatall the variables have significant contribution for the faultdue to the smearing effect discussed in Section 3.1. Withprocess knowledge the BBN correctly diagnose the solidflow as root cause of the fault in Fig. 9. Evidence from bothdensity and water level updates the posterior probabilityof both water flow rate and solid flow node. Because faultin density has more strong relation with solid flow thanwater flow rate the root cause of the fault was pinpointedcorrectly.
5.2 Case Study 2
A fault is introduced in the water flow at t = 3100 min , asa result a fault in water level is observed at t = 3190 min
Fig. 6. Case study 1: Fault in density
Fig. 7. Case study 1: PCA early fault detection
Fig. 8. Case study 1: PCA contribution plot
Fig. 9. Case study 1: Root cause diagnosis from BBN
in Fig. 10. This fault is detected early at t = 3160 minfrom PCA residual plot, as it violates Q-statistic thresholdlevel shown in Fig. 11. From PCA contribution plot Fig.12 its difficult to diagnose the fault correctly, as it is seenthat all the variables have significant contribution for thefault except density due to the smearing effect discussedin Section 3.1. With process knowledge the BBN correctlydiagnose the water flow as root cause the fault in Fig. 13.Evidence from both density and water level updates theposterior probability of both water flow rate and solid flownode. Because fault in water level has more strong relationwith water flow rate than solid flow, the root cause of thefault was pinpointed correctly.
6. CONCLUSIONS
A real time hybrid process monitoring technique based onPCA and BBN for process fault detection and diagnosisis described here. The proposed hybrid method uses thediagnostic outputs from PCA and combines with process
IFAC DYCOPS 2013December 18-20, 2013. Mumbai, India
831
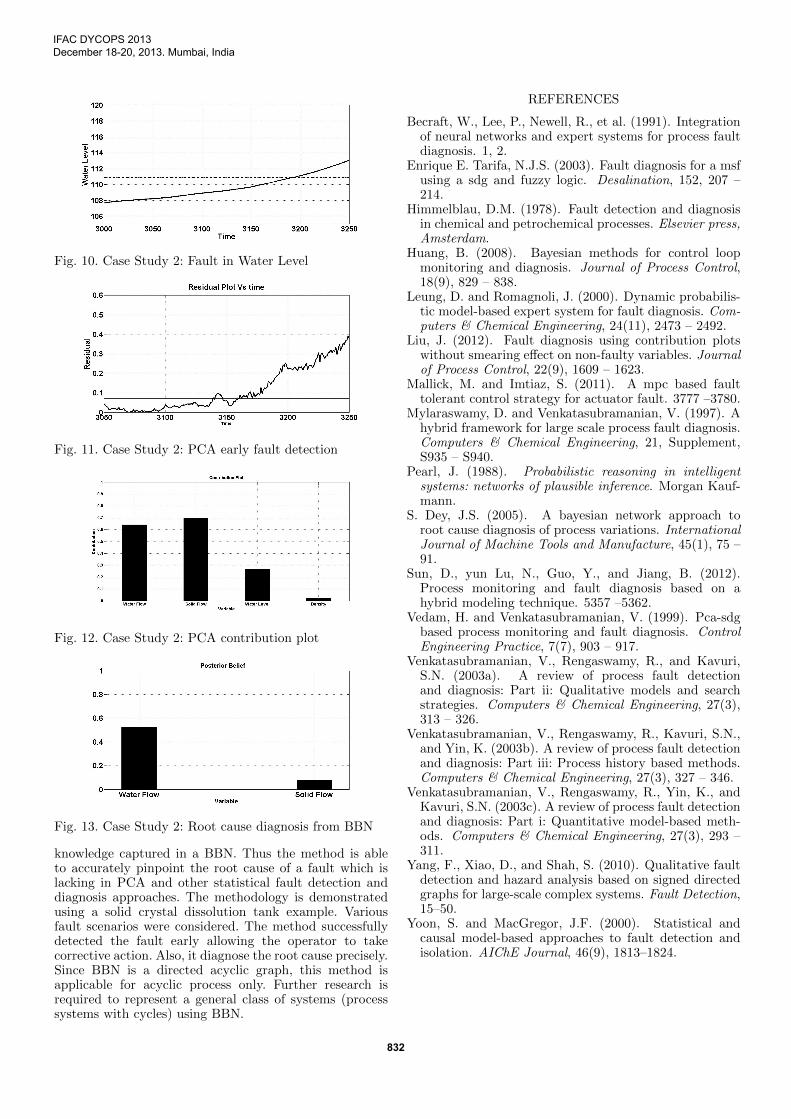
Fig. 10. Case Study 2: Fault in Water Level
Fig. 11. Case Study 2: PCA early fault detection
Fig. 12. Case Study 2: PCA contribution plot
Fig. 13. Case Study 2: Root cause diagnosis from BBN
knowledge captured in a BBN. Thus the method is ableto accurately pinpoint the root cause of a fault which islacking in PCA and other statistical fault detection anddiagnosis approaches. The methodology is demonstratedusing a solid crystal dissolution tank example. Variousfault scenarios were considered. The method successfullydetected the fault early allowing the operator to takecorrective action. Also, it diagnose the root cause precisely.Since BBN is a directed acyclic graph, this method isapplicable for acyclic process only. Further research isrequired to represent a general class of systems (processsystems with cycles) using BBN.
REFERENCES
Becraft, W., Lee, P., Newell, R., et al. (1991). Integrationof neural networks and expert systems for process faultdiagnosis. 1, 2.
Enrique E. Tarifa, N.J.S. (2003). Fault diagnosis for a msfusing a sdg and fuzzy logic. Desalination, 152, 207 –214.
Himmelblau, D.M. (1978). Fault detection and diagnosisin chemical and petrochemical processes. Elsevier press,Amsterdam.
Huang, B. (2008). Bayesian methods for control loopmonitoring and diagnosis. Journal of Process Control,18(9), 829 – 838.
Leung, D. and Romagnoli, J. (2000). Dynamic probabilis-tic model-based expert system for fault diagnosis. Com-puters & Chemical Engineering, 24(11), 2473 – 2492.
Liu, J. (2012). Fault diagnosis using contribution plotswithout smearing effect on non-faulty variables. Journalof Process Control, 22(9), 1609 – 1623.
Mallick, M. and Imtiaz, S. (2011). A mpc based faulttolerant control strategy for actuator fault. 3777 –3780.
Mylaraswamy, D. and Venkatasubramanian, V. (1997). Ahybrid framework for large scale process fault diagnosis.Computers & Chemical Engineering, 21, Supplement,S935 – S940.
Pearl, J. (1988). Probabilistic reasoning in intelligentsystems: networks of plausible inference. Morgan Kauf-mann.
S. Dey, J.S. (2005). A bayesian network approach toroot cause diagnosis of process variations. InternationalJournal of Machine Tools and Manufacture, 45(1), 75 –91.
Sun, D., yun Lu, N., Guo, Y., and Jiang, B. (2012).Process monitoring and fault diagnosis based on ahybrid modeling technique. 5357 –5362.
Vedam, H. and Venkatasubramanian, V. (1999). Pca-sdgbased process monitoring and fault diagnosis. ControlEngineering Practice, 7(7), 903 – 917.
Venkatasubramanian, V., Rengaswamy, R., and Kavuri,S.N. (2003a). A review of process fault detectionand diagnosis: Part ii: Qualitative models and searchstrategies. Computers & Chemical Engineering, 27(3),313 – 326.
Venkatasubramanian, V., Rengaswamy, R., Kavuri, S.N.,and Yin, K. (2003b). A review of process fault detectionand diagnosis: Part iii: Process history based methods.Computers & Chemical Engineering, 27(3), 327 – 346.
Venkatasubramanian, V., Rengaswamy, R., Yin, K., andKavuri, S.N. (2003c). A review of process fault detectionand diagnosis: Part i: Quantitative model-based meth-ods. Computers & Chemical Engineering, 27(3), 293 –311.
Yang, F., Xiao, D., and Shah, S. (2010). Qualitative faultdetection and hazard analysis based on signed directedgraphs for large-scale complex systems. Fault Detection,15–50.
Yoon, S. and MacGregor, J.F. (2000). Statistical andcausal model-based approaches to fault detection andisolation. AIChE Journal, 46(9), 1813–1824.
IFAC DYCOPS 2013December 18-20, 2013. Mumbai, India
832