a k-means based model towards ebola virus prorogation ... · 2. forecasting of ebola crisis ebola...
TRANSCRIPT

International Journal of Science and Engineering Applications
Volume 4 Issue 3, 2015, ISSN-2319-7560 (Online)
www.ijsea.com 95
A K-Means based Model towards Ebola Virus
Prorogation Prediction
Baohua LIU
Department of Computer
Science, Shandong University
of Science and Technology,
Qingdao 266590, China
Xudong Wang
Department of Information
System, Shanghai University,
Shanghai 201800, China
Cong LIU
Department of Computer
Science, Shandong University
of Science and Technology,
Qingdao 266590, China
Qi Gao
Department of Mathematics,
Shandong Normal University,
Jinan 250002 China.
Abstract: Ebola hemorrhagic fever is a disease caused by one of five different Ebola viruses. Four of the strains can cause severe illness
in humans and animals. Humans can be infected by other humans if they come in contact with body fluids from an infected person or
contaminated objects from infected persons. Humans can also be exposed to the virus, for example, by butchering infected animals.
Deadly human Ebola outbreaks have been confirmed in the following countries: Democratic Republic of the Congo (DRC), Gabon,
South Sudan, Ivory Coast, Uganda, and Republic of the Congo (ROC), Guinea and Liberia. In this sense, it is of vital importance to
analysis the history data and predicts its propagation. More specifically, a model based k-means algorithm to determine the optimal
locations of virus delivery is constructed and tested Using Mab-lab programming. By experiment, we find that our model can work well
and lead to a relatively accurate prediction, which can help the government forecast the epidemic spread more efficiently.
Keywords: Date Mining; K-Means Technique; Algorithm Complexity; Ebola Infect Prediction; Mat-lab Simulate
1. INTRODUCTION Ebola also known Ebola virus, which is a very rare virus in
southern Sudan in 1976 and Izard Ebola River discovery of its
existence, hence the name[1]. According to the World Health
Organization's message, since December 2013, the outbreak of
the Ebola virus outbreak in West Africa continued, in Guinea,
Sierra Leone and Liberia infected at least 567 people, including
350 deaths[2]. The disease has a high risk of death, killing
between 25 and 90 percent of those infected with an average of
about 50 percent and has caused immense sorrow especially for
the African people[3].If there is no effective drug control
measures and the epidemic will continue to spread it, and
spread to the whole world.
Based on the data from World Health Organization, Ebola virus
does not spread through the air, and no evidence has proved
that the virus undergo the variation. Mode of transmission of
Ebola virus is close direct contact with body fluids of patients,
including the patient's blood, excrement, vomit which serve the
strongest infection. Virus can also be found in saliva and tears.
We build a model to simulate the spreading of the disease, a
model based k-means algorithm to determine the optimal
locations of delivery. By the experiment, we find our model can
work well, they can help government forecast the epidemic
spread, and can save a lot of resource.
2. FORECASTING OF EBOLA CRISIS Ebola outbreak in Guinea after a steady period of time and,
more recently was "looked up" trend. 2014, ravaged West
African country of Guinea, Liberia, Sierra Leone, the Ebola
virus spreading at an alarming rate. By February 6, 2015[4], the
World Health Organization had reported 22,525 confirmed,
probable and suspected cases in West Africa, with 2988 in
Guinea, 8745 in Liberia and 10792 in Sierra Leone. What is
worth, it has caused 9004 deaths.
Ebola outbreak in Guinea after a steady period of time and,
more recently was "looked up" trend. We care about the few
infected person can infect assigned to the crowd, with the
passage of time, whether the disease will spread, causing many
people are infected. It cannot wait to predict the ratio of Ebola
virus spreads.
As it is shown in table 1, we have found some data from the site
of WHO (World Health Organization). By these data, we can
discover the tread of Ebola virus spreads.
Table 1. number of infection in Guinea, Liberia, Sierra Leone
Guinea Liberia Sierra Leone
2014-11-24 2753
2014-11-25 1892 5595
2014-11-28 1921 2801 5831
2014-11-29 2805
2014-11-30 1929 5978
2014-12-1 6039
2014-12-2 1949 2824 6201
2014-12-3 1956 2830
2014-12-6 2035 6317
2014-12-7 2051 2869 6375
2014-12-9 2081 2946 6457
2014-12-10 2096 6497
2014-12-13 2115 6638
2014-12-14 2127 3021 6702
2014-12-16 2164
2014-12-17 6856
2014-12-18 3085
International Journal of Science and Engineering Applications
Volume 4 Issue 3, 2015, ISSN-2319-7560 (Online)
www.ijsea.com 96
2014-12-20 2259 3085 6975
2014-12-21 2284 7017
2014-12-24 2342 3108 7160
2014-12-27 2384 7326
2014-12-28 2397 3110 7354
2014-12-31 2435 3116 7476
2015-1-2 3118
2015-1-3 2465 3118 7570
2015-1-4 2471 7602
2015-1-5 2477
2015-1-6 3123 7759
2015-1-7 2493 3123
2015-1-10 2508 7766
2015-1-11 2514 3127 7786
2015-1-12 2522 3127 7802
2015-1-13 2525 7825
2015-1-15 3131
2015-1-17 2539 7883
2015-1-18 2539 3135 7903
2015-1-19 2542 7909
2015-1-20 2545 3136 7921
2015-1-24 2559 7963
2015-1-25 2569 3138 7968
2015-1-26 2571 3138 7977
2015-1-27 2575 7989
2015-1-28 3138
2015-1-31 2593 3143 8042
2015-2-1 2608 3143 8059
2015-2-2 2621 8063
2015-2-3 2628 8084
2.1 Ebola virus infection forecast model
without drug To make it easier to understand the model, we first list the
symbols used in the following table.
Table 2. Symbols used in the model
i(t)
s(t)
N
k
the number of infected
individuals in the t day
the number of susceptible
individuals in the t day
total people in the country
infection coefficient
Assumption
(1) s(t) represents the number of susceptible people in the t day,
and i(t) represents the number of infection people in the t day.
(2) Each day it increase k0 infection, and k¬0 can be calculated
by the following equation:K0=k*s(t).
(3) People will not die in the country, that is to say, s(t)+i(t)=N.
By the three assumptions, we can obtain the following
differential equation[7-9]:
(1)
Solve the differential equation, we achieve
(2)
Figure 1 shows the trend of i(t) with the increasing of t.
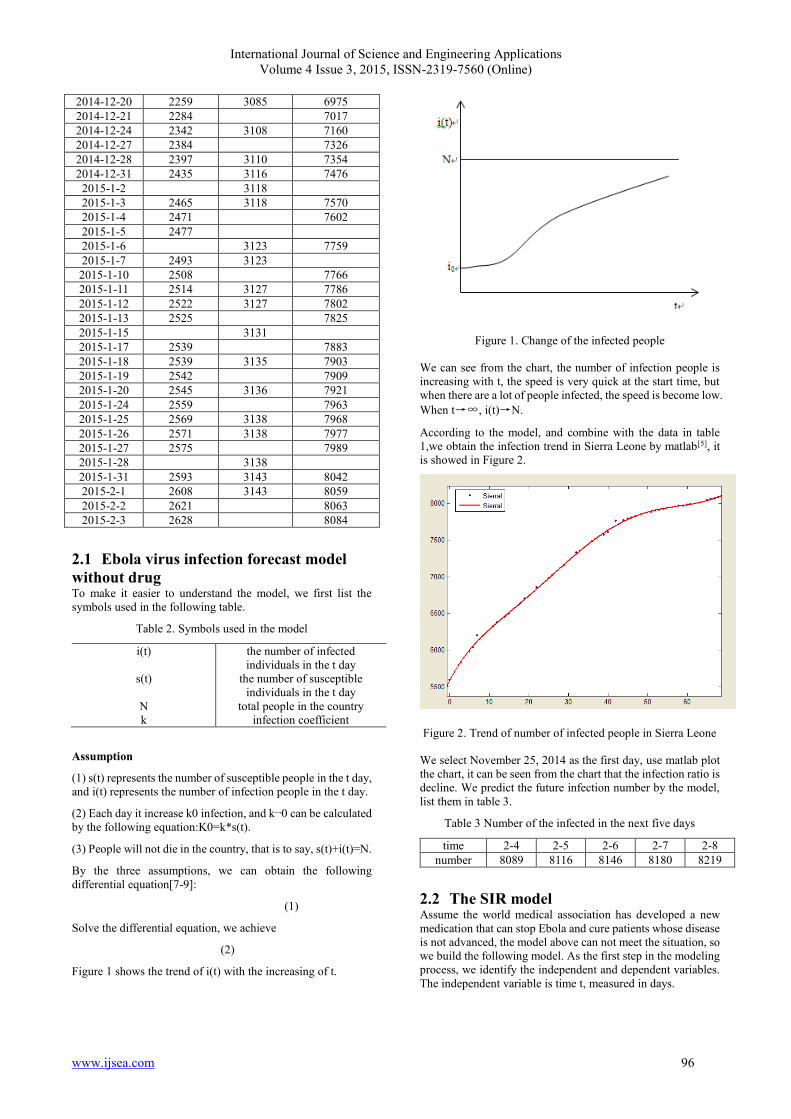
Figure 1. Change of the infected people
We can see from the chart, the number of infection people is
increasing with t, the speed is very quick at the start time, but
when there are a lot of people infected, the speed is become low.
When t→∞, i(t)→N.
According to the model, and combine with the data in table
1,we obtain the infection trend in Sierra Leone by matlab[5], it
is showed in Figure 2.
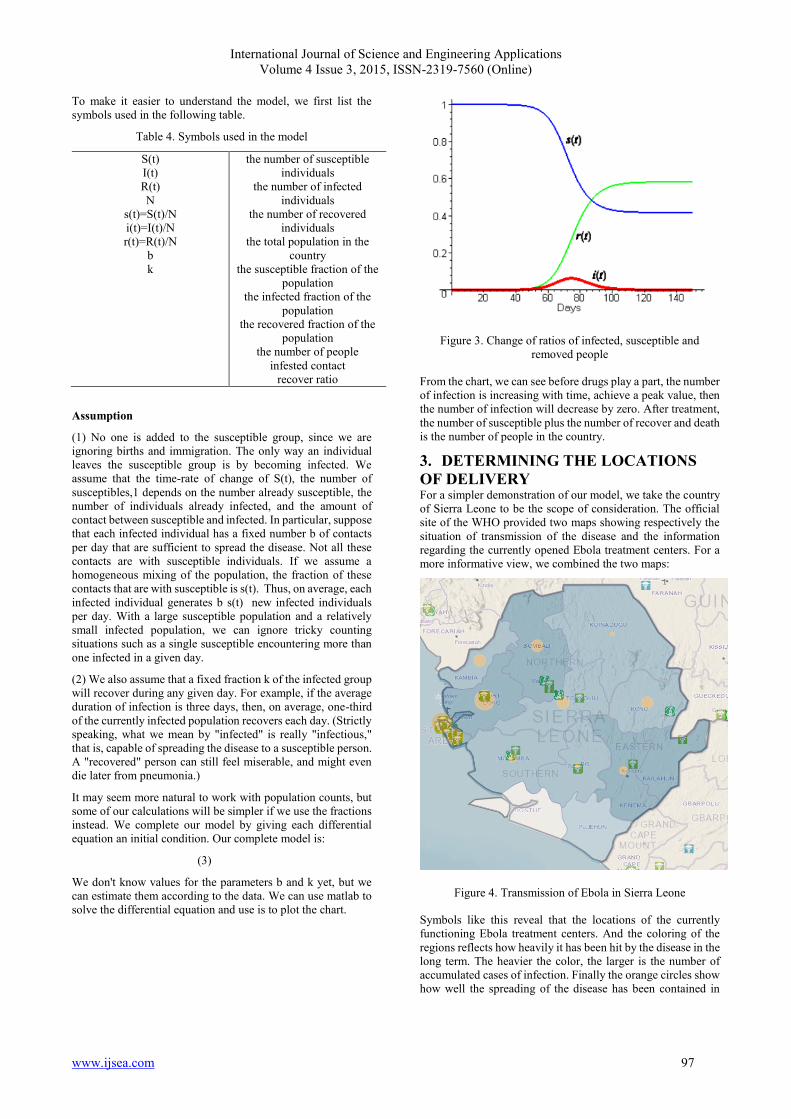
Figure 2. Trend of number of infected people in Sierra Leone
We select November 25, 2014 as the first day, use matlab plot
the chart, it can be seen from the chart that the infection ratio is
decline. We predict the future infection number by the model,
list them in table 3.
Table 3 Number of the infected in the next five days
time 2-4 2-5 2-6 2-7 2-8
number 8089 8116 8146 8180 8219
2.2 The SIR model Assume the world medical association has developed a new
medication that can stop Ebola and cure patients whose disease
is not advanced, the model above can not meet the situation, so
we build the following model. As the first step in the modeling
process, we identify the independent and dependent variables.
The independent variable is time t, measured in days.
International Journal of Science and Engineering Applications
Volume 4 Issue 3, 2015, ISSN-2319-7560 (Online)
www.ijsea.com 97
To make it easier to understand the model, we first list the
symbols used in the following table.
Table 4. Symbols used in the model
S(t)
I(t)
R(t)
N
s(t)=S(t)/N
i(t)=I(t)/N
r(t)=R(t)/N
b
k
the number of susceptible
individuals
the number of infected
individuals
the number of recovered
individuals
the total population in the
country
the susceptible fraction of the
population
the infected fraction of the
population
the recovered fraction of the
population
the number of people
infested contact
recover ratio
Assumption
(1) No one is added to the susceptible group, since we are
ignoring births and immigration. The only way an individual
leaves the susceptible group is by becoming infected. We
assume that the time-rate of change of S(t), the number of
susceptibles,1 depends on the number already susceptible, the
number of individuals already infected, and the amount of
contact between susceptible and infected. In particular, suppose
that each infected individual has a fixed number b of contacts
per day that are sufficient to spread the disease. Not all these
contacts are with susceptible individuals. If we assume a
homogeneous mixing of the population, the fraction of these
contacts that are with susceptible is s(t). Thus, on average, each
infected individual generates b s(t) new infected individuals
per day. With a large susceptible population and a relatively
small infected population, we can ignore tricky counting
situations such as a single susceptible encountering more than
one infected in a given day.
(2) We also assume that a fixed fraction k of the infected group
will recover during any given day. For example, if the average
duration of infection is three days, then, on average, one-third
of the currently infected population recovers each day. (Strictly
speaking, what we mean by "infected" is really "infectious,"
that is, capable of spreading the disease to a susceptible person.
A "recovered" person can still feel miserable, and might even
die later from pneumonia.)
It may seem more natural to work with population counts, but
some of our calculations will be simpler if we use the fractions
instead. We complete our model by giving each differential
equation an initial condition. Our complete model is:
(3)
We don't know values for the parameters b and k yet, but we
can estimate them according to the data. We can use matlab to
solve the differential equation and use is to plot the chart.
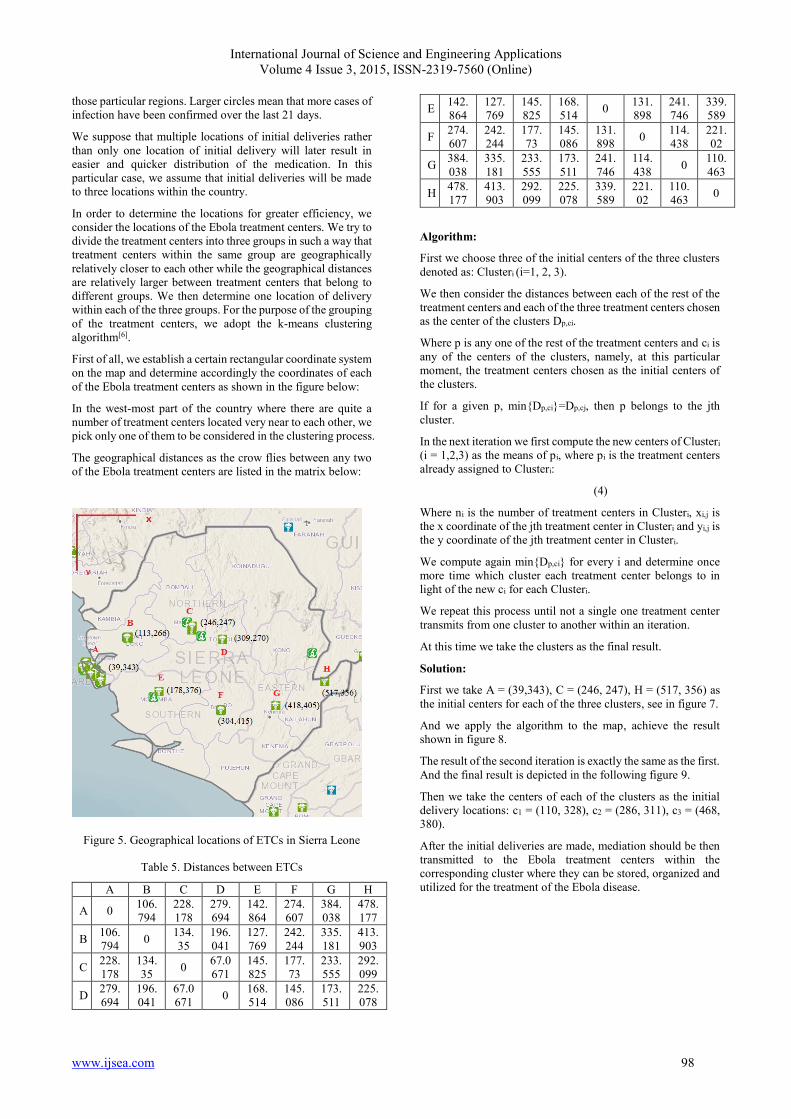
Figure 3. Change of ratios of infected, susceptible and
removed people
From the chart, we can see before drugs play a part, the number
of infection is increasing with time, achieve a peak value, then
the number of infection will decrease by zero. After treatment,
the number of susceptible plus the number of recover and death
is the number of people in the country.
3. DETERMINING THE LOCATIONS
OF DELIVERY For a simpler demonstration of our model, we take the country
of Sierra Leone to be the scope of consideration. The official
site of the WHO provided two maps showing respectively the
situation of transmission of the disease and the information
regarding the currently opened Ebola treatment centers. For a
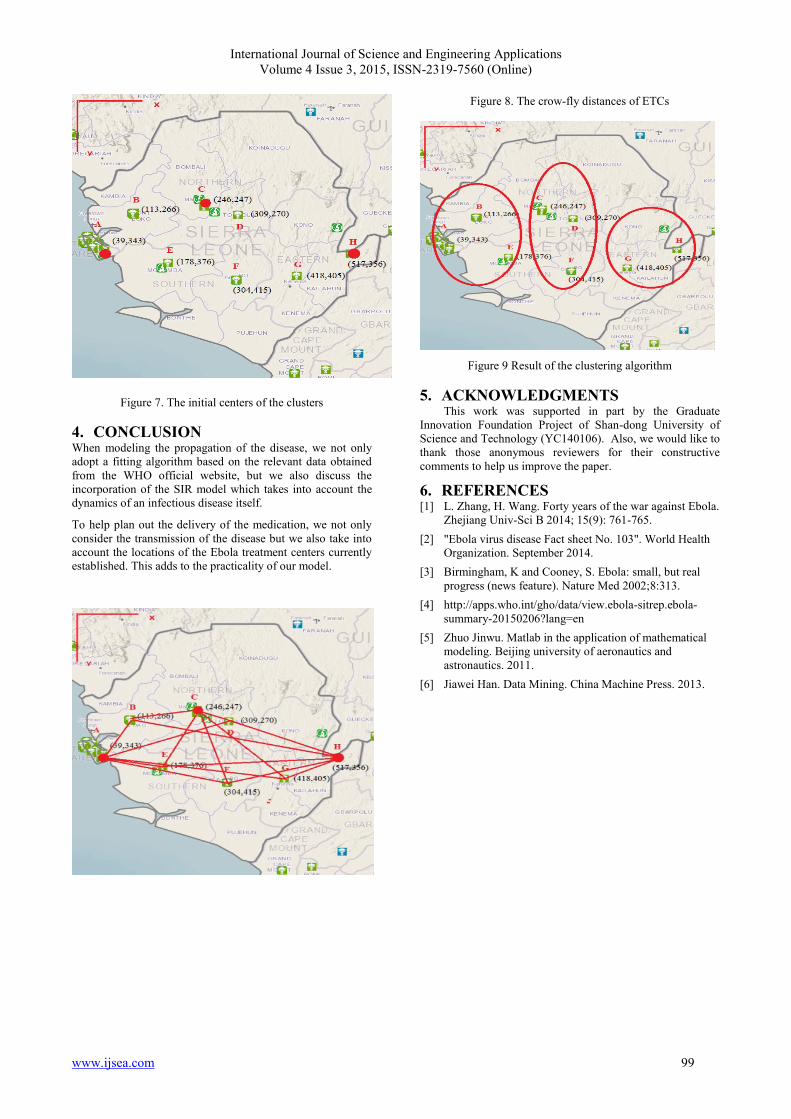
more informative view, we combined the two maps:
Figure 4. Transmission of Ebola in Sierra Leone
Symbols like this reveal that the locations of the currently
functioning Ebola treatment centers. And the coloring of the
regions reflects how heavily it has been hit by the disease in the
long term. The heavier the color, the larger is the number of
accumulated cases of infection. Finally the orange circles show
how well the spreading of the disease has been contained in
International Journal of Science and Engineering Applications
Volume 4 Issue 3, 2015, ISSN-2319-7560 (Online)
www.ijsea.com 98
those particular regions. Larger circles mean that more cases of
infection have been confirmed over the last 21 days.
We suppose that multiple locations of initial deliveries rather
than only one location of initial delivery will later result in
easier and quicker distribution of the medication. In this
particular case, we assume that initial deliveries will be made
to three locations within the country.
In order to determine the locations for greater efficiency, we
consider the locations of the Ebola treatment centers. We try to
divide the treatment centers into three groups in such a way that
treatment centers within the same group are geographically
relatively closer to each other while the geographical distances
are relatively larger between treatment centers that belong to
different groups. We then determine one location of delivery
within each of the three groups. For the purpose of the grouping
of the treatment centers, we adopt the k-means clustering
algorithm[6].
First of all, we establish a certain rectangular coordinate system
on the map and determine accordingly the coordinates of each
of the Ebola treatment centers as shown in the figure below:
In the west-most part of the country where there are quite a
number of treatment centers located very near to each other, we
pick only one of them to be considered in the clustering process.
The geographical distances as the crow flies between any two
of the Ebola treatment centers are listed in the matrix below:
Figure 5. Geographical locations of ETCs in Sierra Leone
Table 5. Distances between ETCs
A B C D E F G H
A 0 106.
794
228.
178
279.
694
142.
864
274.
607
384.
038
478.
177
B 106.
794 0
134.
35
196.
041
127.
769
242.
244
335.
181
413.
903
C 228.
178
134.
35 0
67.0
671
145.
825
177.
73
233.
555
292.
099
D 279.
694
196.
041
67.0
671 0
168.
514
145.
086
173.
511
225.
078
E 142.
864
127.
769
145.
825
168.
514 0
131.
898
241.
746
339.
589
F 274.
607
242.
244
177.
73
145.
086
131.
898 0
114.
438
221.
02
G 384.
038
335.
181
233.
555
173.
511
241.
746
114.
438 0
110.
463
H 478.
177
413.
903
292.
099
225.
078
339.
589
221.
02
110.
463 0
Algorithm:
First we choose three of the initial centers of the three clusters
denoted as: Clusteri (i=1, 2, 3).
We then consider the distances between each of the rest of the
treatment centers and each of the three treatment centers chosen
as the center of the clusters Dp,ci.
Where p is any one of the rest of the treatment centers and ci is
any of the centers of the clusters, namely, at this particular
moment, the treatment centers chosen as the initial centers of
the clusters.
If for a given p, min{Dp,ci}=Dp,cj, then p belongs to the jth
cluster.
In the next iteration we first compute the new centers of Clusteri
(i = 1,2,3) as the means of pi, where pi is the treatment centers
already assigned to Clusteri:
(4)
Where ni is the number of treatment centers in Clusteri, xi,j is
the x coordinate of the jth treatment center in Clusteri and yi,j is
the y coordinate of the jth treatment center in Clusteri.
We compute again min{Dp,ci} for every i and determine once
more time which cluster each treatment center belongs to in
light of the new ci for each Clusteri.
We repeat this process until not a single one treatment center
transmits from one cluster to another within an iteration.
At this time we take the clusters as the final result.
Solution:
First we take A = (39,343), C = (246, 247), H = (517, 356) as
the initial centers for each of the three clusters, see in figure 7.
And we apply the algorithm to the map, achieve the result
shown in figure 8.
The result of the second iteration is exactly the same as the first.
And the final result is depicted in the following figure 9.
Then we take the centers of each of the clusters as the initial
delivery locations: c1 = (110, 328), c2 = (286, 311), c3 = (468,
380).
After the initial deliveries are made, mediation should be then
transmitted to the Ebola treatment centers within the
corresponding cluster where they can be stored, organized and
utilized for the treatment of the Ebola disease.
International Journal of Science and Engineering Applications
Volume 4 Issue 3, 2015, ISSN-2319-7560 (Online)
www.ijsea.com 99
Figure 7. The initial centers of the clusters
4. CONCLUSION When modeling the propagation of the disease, we not only
adopt a fitting algorithm based on the relevant data obtained
from the WHO official website, but we also discuss the
incorporation of the SIR model which takes into account the
dynamics of an infectious disease itself.
To help plan out the delivery of the medication, we not only
consider the transmission of the disease but we also take into
account the locations of the Ebola treatment centers currently
established. This adds to the practicality of our model.
Figure 8. The crow-fly distances of ETCs
Figure 9 Result of the clustering algorithm
5. ACKNOWLEDGMENTS This work was supported in part by the Graduate
Innovation Foundation Project of Shan-dong University of
Science and Technology (YC140106). Also, we would like to
thank those anonymous reviewers for their constructive
comments to help us improve the paper.
6. REFERENCES [1] L. Zhang, H. Wang. Forty years of the war against Ebola.
Zhejiang Univ-Sci B 2014; 15(9): 761-765.
[2] "Ebola virus disease Fact sheet No. 103". World Health
Organization. September 2014.
[3] Birmingham, K and Cooney, S. Ebola: small, but real
progress (news feature). Nature Med 2002;8:313.
[4] http://apps.who.int/gho/data/view.ebola-sitrep.ebola-
summary-20150206?lang=en
[5] Zhuo Jinwu. Matlab in the application of mathematical
modeling. Beijing university of aeronautics and
astronautics. 2011.
[6] Jiawei Han. Data Mining. China Machine Press. 2013.