a. kurt - middle east technical university
TRANSCRIPT

iii
COLEOPTERA-SPECIFIC (CRY3Aa) DELTA-ENDOTOXIN BIOSYNTHESIS BY A LOCAL ISOLATE OF BT SUBSP. TENEBRIONIS,
GENE CLONING AND CHARACTERIZATION
ASLIHAN KURT
JANUARY 2005
A. K
UR
T M
ET
U 2005

iv
COLEOPTERA-SPECIFIC (CRY3Aa) DELTA-ENDOTOXIN BIOSYNTHESIS BY A LOCAL ISOLATE OF BT SUBSP. TENEBRIONIS,
GENE CLONING AND CHARACTERIZATION
A THESIS SUBMITTED TO THE GRADUATE SCHOOL OF NATURAL AND APPLIED SCIENCES
OF MIDDLE EAST TECHNICAL UNIVERSITY
BY
ASLIHAN KURT
IN PARTIAL FULFILLMENT OF THE REQUIREMENTS FOR
THE DEGREE OF MASTER OF SCIENCE IN
BIOLOGY
JANUARY 2005

v
Approval of the Graduate School of Natural and Applied Sciences
Prof Dr. Canan Özgen Director
I certify that this thesis satisfies all the requirements as a thesis for the degree of Master of Science.
Prof. Dr. Semra Kocabıyık Head of Department
This is to certify that we have read this thesis and that in our opinion it is fully adequate, in scope and quality, as a thesis for the degree of Master of Science. Assist. Prof. Dr. Melek Özkan Prof. Dr. Gülay Özcengiz
Co-Supervisor Supervisor
Examining Committee Members Prof. Dr. Gürdal Alaeddino�lu (METU, BIO)
Prof. Dr. Gülay Özcengiz (METU, BIO)
Prof. Dr. �nci Togan (METU, BIO)
Prof. Dr. Cihan Öner (Hacettepe Ünv., BIO)
Dr. A. Elif Erson (METU, BIO)

iii
PLAGIARISM
I hereby declare that all information in this document has been obtained and presented in accordance with academic rules and ethical conduct. I also declare that, as required by these rules and conduct, I have fully cited and referenced all material and results that are not original to this work. Name, Last name : Aslıhan Kurt
Signature :

iv
ABSTRACT
COLEOPTERA-SPECIFIC (CRY3Aa) DELTA-ENDOTOXIN
BIOSYNTHESIS BY A LOCAL ISOLATE OF BT SUBSP. TENEBRIONIS,
GENE CLONING AND CHARACTERIZATION
Kurt, Aslıhan
M. Sc., Department of Biology
Supervisor: Prof. Dr. Gülay Özcengiz
Co-Supervisor: Assist. Prof. Dr. Melek Özkan
January 2005, 126 pages
Cry3Aa is a 73 kDa protoxin toxic to insect larvae of Coleoptera order. It is
processed to form a stable 65 kDa δ-endotoxin by endogenous proteases. The first
part of this study involved the determination of the patterns of biosynthesis of
Coleoptera-specific δ-endotoxin by a local isolate of Bacillus thuringiensis subsp.
tenebrionis (Btt) in relation to its growth and sporulation. Among four different
media compared (DSM, GYS, HCT and C2) Cry3Aa production was the highest in
DSM, especially at 72nd h and 120th h of incubation.

v
For improvement of Cry3Aa production, the effects of different carbon and nitrogen
sources, inorganic phosphate and other mineral elements were tested. Increasing
concentrations (5-10 g.L-1) of glucose or sucrose decreased the toxin yield probably
by suppressing sporulation. Inorganic phosphate was found to have the most striking
effect on toxin biosynthesis. 200 mM inorganic phosphate concentration resulted in 5
fold increase in Cry3Aa yield. Cry3Aa production was greatly reduced when various
combinations of organic and inorganic nitrogen sources, especially ammonium
sulphate and Casamino acids were replaced with Nutrient broth in DSM. The highest
Cry3Aa production was obtained in the media containing 10-5-10-7 M MnCl2, 10-5 M
FeSO4 and 5.10-4 M MgSO4, corresponding to their original concentrations in DSM.
Decrease of iron concentration or its omission from the medium decreased the toxin
yield.
Toxin production capacity of our local isolate was compared with those of 30
different anti-Coleopteran Bt strains. Most of the strains producing this protein gave
general protein banding patterns quite similar to that of our local isolate.
Lastly, the cry3Aa gene of the Btt local isolate was PCR-amplified and cloned into
the E. coli/Bacillus shuttle vector pNW33N. The recombinant plasmid was amplified
in E. coli and the sequence of the cry3Aa was determined. Amino acid sequence
deduced was found to be 97.4 %-99.2 % identical to the cry3Aa sequences
(GenBank) of 10 different quaternary ranks. In this respect, the gene has to represent
the 11th quaternary rank of the cry3Aa ones. The recombinant plasmid carrying
cry3Aa gene was next used to transform Bs 168 as an intermediate host and low
level of expression was seen.
Keywords: Bacillus thuringiensis subsp. tenebrionis; Cry3Aa δ-endotoxin
biosynthesis; regulation; cry3Aa gene, gene cloning.

vi
ÖZ
BT SUBSP. TENEBRIONIS ’ �N YEREL B�R �ZOLATINDA
KINKANATLILARA KAR�I AKT�F (CRY3Aa) DELTA-ENDOTOKS�N
B�YOSENTEZ�, GEN KLONLANMASI VE KARAKTER�ZASYONU
Kurt, Aslıhan
Yüksek Lisans, Biyoloji Bölümü
Tez Yöneticisi: Prof. Dr. Gülay Özcengiz
Ortak Tez Yöneticisi: Y. Doç. Dr. Melek Özkan
Ocak 2005, 126 sayfa
Cry3Aa Kınkanatlılar takımından böcek larvalarına karsı öldürücü etkiye sahip 73
kDa’lık bir protoksindir. Proteazlar tarafından daha kararlı bir form olan 65 kDa’lık
δ-endotoksine dönü�türülür. Bu çalı�manın ilk bölümü, Bacillus thuringiensis subsp.
tenebrionis’in (Btt) yerli bir izolatı tarafından Kınkanatlılara özgü δ-endotoksin
biyosentezinin ve bunun organizmanın üremesi ve sporulasyonu ile olan ili�kisinin
belirlenmesini içermi�tir. Kar�ıla�tırılan dört farklı besiyeri içinden (HCT, GYS,
DSM ve C2) DSM besiyerinin di�er besiyerlerine kıyasla toksin üretimini daha iyi
destekledi�i, bu besiyerinde üretilen hücrelerde toksin üretiminin 72. ve 120.
saatlerde en yüksek oldu�u görülmü�tür.

vii
Toksin üretiminin artırılmasına yönelik çalı�malarda farklı karbon ve nitrojen
kaynaklarının, inorganik fosfatın ve di�er minerallerin etkileri test edilmi�tir. 5 g.L -1
ile 10 g.L-1 aralı�ında artan glukoz ve sükroz konsantrasyonları muhtemelen
sporlanmayı baskılamak suretiyle toksin veriminin dü�mesine neden olmu�lardır.
�norganik fosfatın toksin biyosentezi üzerinde en dikkat çekici etkiye sahip oldu�u
bulunmu�tur. 200 mM’lık inorganik fosfat konsantrasyonun toksin üretimini 5 misli
artırdı�ı görülmü�tür. DSM’nin “Nutrient broth” içeri�inin organik ve inorganik azot
kaynaklarının farklı kombinasyonlarıyla özellikle amonyum sülfat ve Kasamino
asitler ile de�i�tirilmesi Cry3Aa sentezini inhibe etmi�tir. MnCl2, FeSO4 ve
MgSO4’ın kontrol besiyerinde kullanılan konsantrasyonlarının (sırasıyla 10-5-10-7 M,
10-6 M ve 5.10-4 M) denenen di�er konsantrasyonlara kıyasla daha yüksek toksin
üretimini sa�ladı�ı bulunmu�tur. FeSO4’ın konsantrasyonunun dü�ürülmesi ya da
besiyerine hiç ilave edilmemesi Cry3Aa biyosentezinde dü�ü�e neden olmu�tur.
Yerli izolatın toksin üretim kapasitesi, Kınkanatlılar takımına mensup böceklere
kar�ı aktif toksin üreten 30 farklı Bt su�unun toksin üretim kapasiteleri ile
kıyaslanmı�tır. Kar�ıla�tırılan su�ların ço�u, yerli izolata çok benzer protein profilleri
vermi�tir.
Çalı�manın son a�amasında, Btt izolatına ait cry3Aa geni PCR ile amplifiye edilmi�
ve bir E. coli/Bacillus vektörü olan pNW33N vektörüne klonlanmı�tır. Rekombinant
plazmid E. coli’de ço�altılmı� ve cry3Aa geninin nükleotid dizisi analiz edilmi�tir.
Buna göre elde edilen amino asit dizilimi cry3Aa’nın bugüne dek bilinen 10 farklı
kuaterner sınıfını temsil eden GenBank’da mevcut dizileri ile kar�ıla�tırılmı�tır. Yerli
izolatın üretti�i Cry3Aa proteinin bu proteinlere 97.4 %- 99.2 % oranında özde�
oldu�u bulunmu�tur. Bu sonuca göre gen, cry3Aa geninin 11. kuaterner sınıfını
temsil edecektir. cry3Aa genini içeren rekombinant plazmid daha sonra Bs 168’i
transforme etmekte kullanılmı� ve ara konakçı olan bu organizmada genin orijinal
üreticiye göre dü�ük seviyede ifade edildi�i görülmü�tür.
Anahtar kelimeler: Bacillus thuringiensis subsp. tenebrionis; Cry3Aa δ-endotoksin
biyosentezi; regülasyon; cry3Aa geni, gen klonlanması.

viii
To My Parents
DEDICATION

ix
ACKNOWLEDMENTS
I would like to express my deepest gratitude and sincerest appreciation to my
supervisor Prof. Dr. Gülay Özcengiz for her guidance, continuous advice, invaluable
help and insight throughout the research. I am grateful to my co-supervisor Assist.
Prof. Dr. Melek Özkan for her invaluable help, continuous encouragement and
constructive critisim.
I would like to extent my gratitude to Prof. Dr. Gürdal Alaeddino�lu for providing
his laboratory facility in some of the experiments. I would like to thank posdoc
researcher Ebru �nce Yılmaz for her invaluable help throughout the study.
I would like to thank my lab mates Bilgin Ta�kın, Çi�dem Ya�cıo�lu, Levent Kaya,
Ay�e Koca, Araz Zeyniyev and Erkam Gündo�du for their friendship and
cooperation. Special thanks to Volkan Yıldırım for his great friendship and help
whenever I needed.
My special thanks also go to Sezer Okay for his understanding, endless help,
encouragement and great friendship that made easier for me to overcome diffuculties
in all hard times.
I am grateful to Hayriye Özçelik, Gülsüm Kalemta�, Çi�dem Akın and �lknur Dursun
for their friendship and making my social life so enjoyable.
I would like to express my heartful gratitude to my mother Saime Kurt, my father
Mustafa Kurt, my sister Türkan Kurt and my brother Refik Alper Kurt for their
endless love, support, patience and understanding.
x
TABLE OF CONTENTS
PLAGIARISM .........................................................................................................iii
ABSTRACT............................................................................................................. iv
ÖZ ........................................................................................................................vi
DEDICATION .......................................................................................................viii
ACKNOWLEDMENTS ........................................................................................... ix
TABLE OF CONTENTS...........................................................................................x
LIST OF TABLES .................................................................................................xiii
LIST OF FIGURES................................................................................................xiv
LIST OF ABBREVIATIONS................................................................................xvii
CHAPTER
1. INTRODUCTION .............................................................................................1
1.1. Bacillus thuringiensis: The Best Known Biological Control Agent..................1
1.2. Insecticidal Crystal Proteins (ICPs) of Bt ........................................................4
1.2.1. Classes of Insecticidal Crystal Proteins....................................................9
1.2.1.1. Lepidoptera–Specific Cry Proteins....................................................9
1.2.1.2. Diptera–Specific Cry Proteins...........................................................9
1.2.1.3. Coleoptera–Specific Cry Proteins ...................................................10
1.2.1.4. Nematoda–Specific Cry Proteins ....................................................12
1.2.1.5. Hymenoptera–Specific Cry Proteins ...............................................12
1.2.2. Structural and Sequential Similarities Among Cry Toxins .....................13
1.2.3. Mechanism of Action ............................................................................15
1.3. The Bt Genome and Plasmids........................................................................17
1.4. cry Gene Expression .....................................................................................18
1.5.1. Optimization of Nutritional and Cultural Conditions .............................21
1.5.2. Molecular Approaches...........................................................................23

xi
1.6. Transgenic Organisms, Insect Resistance to Bt Toxins and Resistance
Management, Bt Formulations and Field Applications.................................25
1.7. Present Study ................................................................................................29
2. MATERIALS AND METHODS .....................................................................30
2.1. Bacterial Strains and Plasmids ......................................................................30
2.2. Culture Media ...............................................................................................33
2.3. Buffers and Solutions....................................................................................33
2.4. Chemicals and Enzymes................................................................................33
2.5. Growth Curves..............................................................................................33
2.6. Determination of Sporulation Frequency.......................................................34
2.7. Protein Extraction .........................................................................................34
2.8. Determination of Protein Concentration ........................................................35
2.9. SDS-Polyacrylamide Gel Electrophoresis......................................................35
2.10. Staining of the SDS-Polyacrylamide Gel.....................................................36
2.10.1. Coomassie Blue R-250 Staining ..........................................................36
2.10.2. Silver Staining Method........................................................................37
2.11. Protein Quantification .................................................................................37
2.12. DNA Techniques and Manipulations...........................................................38
2.12.1. Total DNA Isolation ............................................................................38
2.12.2. Plasmid Isolation from Bacillus spp.....................................................38
2.12.3. Plasmid Isolation from E. coli..............................................................39
2.12.4. Primer Design .....................................................................................40
2.12.5. Polymerase Chain Reaction (PCR) ......................................................43
2.12.6. Agarose Gel Electrophoresis................................................................43
2.12.7. Restriction Endonuclease Digestion.....................................................43
2.12.8. Extraction of Digested DNA Fragments/PCR Products from Agarose
Gels.......................................................................................................44
2.12.9. Ligation Reaction ................................................................................44
2.13. Transformation............................................................................................44
2.13.1 Preparation of E. coli Competent Cells .................................................44
2.13.2. Transformation of E. coli Competent Cells ..........................................45
2.13.3. Preparation of B. subtilis Competent Cells and Transformation ...........45

xii
2.14. Sequencing Reactions .................................................................................45
3. RESULTS AND DISCUSSION.......................................................................47
3.1. Growth, Sporulation and Toxin Yield of the Local Isolate of Bacillus
thuringiensis subsp. tenebrionis in C2 medium ...........................................47
3.2. Selection of the Most Appropriate Growth Medium ......................................49
3.3. Optimization Studies.....................................................................................53
3.3.1. Effects of Carbon Sources .....................................................................54
3.3.2. Effects of Inorganic Phosphate and Different Nitrogen Sources.............58
3.3.3. Effects of Different Concentrations of Mineral Elements.......................62
3.3.4. Verification of Inorganic Phosphate Effect and Quantitive Assessment of
Productivity...........................................................................................66
3.4. Comparison of the Local Isolate to Various Anti-Coleopteran Bt Strains in
Terms of Its Total Protein Profile and Biosynthetic Capacity ......................67
3.5. Cloning of cry3Aa Gene into pNW33N and Expression in Bacillus subtilis ..74
3.5.1. Cloning of cry3Aa Gene into pNW33N.................................................74
3.5.2. Expression of the cry3Aa Gene in Bacillus subtilis 168 .........................77
3.5.3. cry3Aa Gene Sequence of the Local Isolate...........................................80
4. CONCLUSION ...................................................................................................89
REFERENCES........................................................................................................93
APPENDICES
A. Composition and Preparation of Culture Media................................................. 115
B. Solutions and Buffers ........................................................................................ 119
C. Chemicals and Their Suppliers .......................................................................... 123

xiii
LIST OF TABLES
TABLES
1.1. Known cry and cyt gene sequences with revised nomenclature assignments........5
1.2. Types of crystal proteins and the insects and their orders to which they are active
...........................................................................................................................8
2.1 A list of bacterial strains and plamids used in the present study..........................32
2.2. Primers used for PCR amplification and sequencing of cry3Aa gene of the Btt
local isolate........................................................................................................41
3.1. Comparison of cell masses (wet weights) from the 48th and 72nd h cultures of
different Cry3A producers .................................................................................71
3.2 a Percent similarity and divergence of anti-Coleopteran Cry3Aa δ-endotoxin of
Btt local isolate from other Coleoptera-specific Cry3Aa producer Bt strains.......87
3.2 b Amino acid (aa) replacements in Cry proteins of Bt strains..............................88

xiv
LIST OF FIGURES
FIGURES
1.1. Phylogram demonstrating amino acid sequence identity among Cry and Cyt
proteins...............................................................................................................7
1.2. Five conserved sequences of insecticidal crystal proteins ..................................14
1.3. Model for the cry3A gene expression................................................................19
2.1. Structure of the plasmid vectors: (a) pGEM-T and (b) pNW33N.......................31
2.2. Nucleotide sequence of cry3Aa6 gene of Btt NB176 .........................................42
3.1. Growth of the Btt local isolate in C2 medium....................................................47
3.2. Silver-stained SDS-PAGE showing the protein profile of the isolate when grown
in C2 medium for three days .............................................................................48
3.3. Cry3A production by the Btt isolate when grown in different media .................49
3.4 a Growth of the Btt isolate in DSM and C2 media..............................................51
3.4 b Viable cell count of the Btt isolate in DSM and C2 media. Cry3A production by
the Btt isolate when grown in different media .................................................51
3.4. c Spore count of the Btt isolate in DSM and C2 media onserved sequences of
insecticidal crystal proteins ...............................................................................52
3.4 d Sporulation frequency of the Btt isolate in DSM and C2 media ......................52
3.5. Another comparison between Cry3Aa levels as the function of time in DSM and
C2 media ........................................................................................................53
3.6 a Growth of the isolate on different glucose and sucrose concentrations.............55
3.6 b Viable cell count when grown on different glucose and sucrose
concentrations.................................................................................................55
3.6 c Effects of different glucose and sucrose concentrations on spore counts ..........56
3.6 d Sporulation frequency of the isolate when grown on different concentrations of
glucose and sucrose. .......................................................................................56
xv
3.6 e Coomassie-stained SDS–PAGE showing the effect of different concentrations
of glucose and sucrose on Cry3Aa biosynthesis. ...............................................57
3.7. Growth of the Btt isolate in DSM with different inorganic phosphate
concentrations...................................................................................................58
3.8. Growth of Btt strain with different combinations of inorganic nitrogen sources
.........................................................................................................................59
3.9. The effects of nitrogen sources and inorganic phosphate on sporulation ............60
3.10. Cry3Aa biosynthesis on different nitrogen sources and different concentrations
of inorganic phosphate. .....................................................................................61
3.11. Growth of the Btt isolate in DSM with different MnCl2 concentrations of 10-4
M, 10-5 M [control], 10-6 M and 10-7 M. ............................................................62
3.12. Growth of the Btt isolate in DSM with different MgSO4 concentrations of 5.10-
2 M, 5.10-3 M, 5.10-4 M [control] and 5.10-5 M. .................................................63
3.13. Growth of the Btt isolate in DSM with different FeSO4 concentrations of 0 M,
10-5 M [control], 10-6 M and 10-7 M ..................................................................64
3.14. Effects of different concentrations of mineral elements on sporulation ............65
3.15. Effects of mineral ions on Cry3Aa biosynthesis at 72nd h of incubation. ..........65
3.16. Cry3Aa biosynthesis in the modified DSM and the iron effect on product yield.
. ........................................................................................................................67
3.17. Protein profiles of different Bt strains at 48th h of incubation..........................68
3.18. Protein profiles of different Bt strains at 72nd h of incubation ..........................69
3.19. Comparison of protein profiles of the Btt isolate with that of the strain BI256-
82 (31) ............................................................................................................70
3.20. Comparison of plasmid profiles of strains having protein profiles similar to that
of the local isolate of Btt .................................................................................73
3.21. Cry3Aa production by Bt 3123 and Bt 1925 strains in different combinations of
modified DSM. ...............................................................................................74
3.22. PCR product obtained with primers c3AKF and c3AKR designed for cry3Aa
gene and its promoter......................................................................................75
3.23. Putative recombinant pGEM-T plasmids carrying total cry3Aa gene...............75
3.24 a) Double-digested recombinant pGEM-T plasmid carrying 2589 bp PCR
product. b) PCR product using recombinant pGEM-T as a template. ...............76

xvi
3.25. pNW33N carrying the cry3Aa gene ................................................................77
3.26. Verification of cloning of the cry3Aa gene into pNW33N by double digestion
with SacI and KpnI restriction enzymes and PCR amplification ......................77
3.27. PCR product using recombinant B. subtilis carrying pNW33N as a template…78
3.28. Cry3Aa biosynthesis by recombinant B. subtilis 168 in DSM after 72 h of
incubation .......................................................................................................79
3.29. Nucleotide and deduced amino acid sequence of cry3Aa gene of the local
isolate .............................................................................................................81
3.30. Alignment of Cry3Aa δ-endotoxin sequence with those of other Coleoptera-
active Bt isolates .............................................................................................84

xvii
LIST OF ABBREVIATIONS
Bt : Bacillus thuringiensis
Btt : Bacillus thuringiensis subspecies tenebrionis
Bti : Bacillus thuringiensis subspecies israelensis
Btk : Bacillus thuringiensis subspecies kurstaki
Bc : Bacillus cereus
Bs : Bacillus subtilis
Btg : Bacillus thuringiensis subpecies galleriae
ICP : Insecticidal Crystal Protein
kDa : Kilodalton
mDa : MegaDalton
DSM : Difco’s Sporulation Medium
SDS-PAGE : Sodium Dodecyl Sulphate-Polyacrylamide Gel Electrophoresis
U : Unit
aa(s) : Amino acid(s)
bp : Base pairs
kb : Kilobase
IUPAC : International Union of Pure and Applied Chemistry
BGSC : Bacillus Genetic Stock Center
NCBI : National Center for Biotechnology Information

1
CHAPTER 1
INTRODUCTION
1.1. Bacillus thuringiensis: The Best Known Biological Control Agent
Phytophagous insects give rise to considerable amount of agricultural yield loss
which constitutes 20-30% of the total production. The use of synthetic chemical
insecticides has played a key role not only in the increase of agricultural productivity
and protection of crops and forests, but also in the control of insect vectors of human
diseases. Nevertheless, frequent and prolonged use of the chemical insecticides have
resulted in contamination of water and food sources, poisoning of non-target fauna
and flora, concentration in the food chain and selection of insect pest populations
resistant to the chemical insecticides. Therefore, increased public concern of the
potential adverse environmental effects about the extensive use of chemical
pesticides, together with the rising cost of discovering new molecules, has stimulated
interest in the development of environmentally safe and cheap biopesticides.
The method alternative to insect pest control by the use of chemicals is the use of
microbial insecticides. Such insecticides consist of microorganisms or their by-
products. Microbial insecticides are target-specific, thus, safe for human, non-target
plants and animals as well as environmentally friendly for being biodegradable.
Microbial insecticides are also known as biological pathogens and biological control
agents. The most widely used microbial control agent is the bacterium Bacillus
thuringiensis (Bt). The other entomopathogenic microorganisms used for microbial
control include baculoviruses, protozoa, fungi, nematodes and some bacteria such as

2
Bacillus popilliae, Brevibacillus laterosporus, Clostridium bifermentans,
Penibacillus spp. (Barloy et al., 1998; Park et al., 2000; Charles and Nielsen-
LeRoux, 2000; De Maagd, et al., 2001; Lacey et al., 2001).
Bt was started to be used for insect pest control in the late 1920s and in the early
1930s, it was used against Ostrinia nubulis, the European corn borer. Bt became
available as a commercial insecticide in France as spore based formulations called
Sporeine to kill flour moths in 1938 (Weiser, 1986) and in the 1950s entered
commercial use in the United States (Faust, 1974). Commercial production and
worldwide use of Bt was well established by the early 1980s. In 1961, Bt subsp.
kurstaki (Btk) was used as a biopesticide and Btk-based products for the control of
susceptible lepidopteran pests in agriculture and forestry became predominant in
markets (Lüthy et al., 1982). New markets were opened by the 1976 discovery of the
israelensis subspecies, which is toxic to larval mosquitoes and black flies (Goldberg
and Margalit, 1977) and the discovery of Bt subsp. tenebrionis which is toxic to
several beetle species (Krieg et al., 1983).
Bt is a gram-positive, rod shaped, spore-forming soil bacterium. The most striking
characteristic of Bt is the production of large, proteinaceous, crystalline inclusions
(crystals) made of δ-endotoxins or crystal (Cry) proteins during sporulation (Tamez-
Guerra et al., 2004). The high specificity of δ-endotoxins could limit the widespread
utilization of Bt bioinsecticides to control large varieties of agricultural pests (Zourai
et al., 2002). On the other hand, these ‘crystal shaped proteins’ can target not only
the specific groups of insects (Lepidoptera, Diptera, Coleoptera, Hymenoptera,
Homoptera, Phthiraptera or Mallophaga and Acari), but also have a lethal effect on
other organisms such as Nemathelminthes, Plathyhelminthes and Sarcomastigophora
(Feitelson, 1993).
In addition to sporulation-linked expression of insecticidal toxins, some strains of Bt
produce insecticidal proteins, unrelated to the Cry proteins, in the vegetative phase of
growth which are termed as vegetative insecticidal proteins, VIP (Estruch et al.,
1996). These VIPs do not form parasporal crystal proteins and are secreted from

3
the cell into the growth medium (Arora et al., 2003). In addition to VIPs, Bt also
produces �-exotoxins, �-exotoxins, hemolysins, enterotoxins, chitinases and
phospholipases (Hansen and Salamitou, 2000). Observations indicate that β-
exotoxins interfere with mitotic cells. As they are deactivated only to some extent in
the gut, predators feeding on insects containing toxin are adversely affected. There is
a strict regulation in many countries to use β-exotoxin in controlling insect pests
owing to the risk to non-target organisms and mammals (Glare and O-Callaghan,
2000). However, Tsuchiya et al. (2002) proposed to consider the possibility of
practical application of β-exotoxin in suppressing difficult-to-control Coleopteran
pests, including the cigarette beetle and the Colorado potato beetle, Leptinotarsa
decemlineata.
Bt seems to be indigenous to many environments. Bt was first isolated by the
Japanese bacteriologist S. Ishiwata from diseased silkworm Bombyx mori (L.) larvae
in 1901. In 1911, E. Berliner (Germany) isolated a similar organism from diseased
larvae of Mediteranean flour moth, Anagasta küehniella, and named it as Bacillus
thuringiensis. In 1916, Aoki and Chigasaki found that its activity was due to a toxin
present in sporulated cultures, but not in young cultures of vegetative cells (Beegle
and Yamamoto, 1992). Many other strains have been isolated worldwide from
different habitats, including different types of soil (Bernhard et al., 1997; Hossain et
al., 1997; Bravo et al., 1998), phylloplane of different plants (Daamgard et al., 1998;
Hansen et al., 1998), insects and their habitats (Chilcot and Wigley, 1993; Apoloyo
et al., 1995) and stored products (Meadows et al., 1992; Kaelin et al., 1994).
The characterization of new isolates relies on the basis of crystal serotype
(Krywienxczyk, 1977), Southern blot hybridization to test new strains with known
genes (Kronstad and Whiteley, 1986) or reactivity with various monoclonal
antibodies (Hofte et al., 1988). The diversity in flagellar H-antigen agglutination
reactions is one indication of the enormous genetic diversity among Bt isolates.
Besides these methods, the use of PCR is an alternative procedure for rapid
determination of the presence and absence of target DNA sequence and
advantageous for small amount of DNA requirement for analysis, being highly

4
sensitive and allowing large numbers of samples to be processed in a relatively short
time. The electrophoretic products of PCR are used for prediction of insecticidal
activity of known and novel isolates (Carozzi et al., 1991; Ben-Dov et al., 1997).
Several PCR and hybridization-based strategies have been used to screen cry genes
having minor amino acid substitutions (Porcar and Juara-Perez, 2003).
1.2. Insecticidal Crystal Proteins (ICPs) of Bt
As mentioned earlier, the insecticidal activity of Bt is attributed to its ability to
produce parasporal crystals (δ-endotoxins) which fall into two categories, Cry toxins
and cytolysins (Cyt). In 1989, Hofte and Whiteley reviewed systematic nomenclature
and classified crystal proteins into five major groups according to their insecticidal
and molecular relationships (CryI, CryII, CryIII, CryIV and CryV, Cyt). The
discovery of new strains having an activity spectrum that spans two or three insect
orders (such as those producing CryIB protein that shows insecticidal activity against
both Lepidoptera and Coleoptera) led the scientist to establish a new classification
system based on amino acid sequence homology (Schnepf et al., 1998). Revised gene
names used in this new classification system are listed in Table 1.1. New
nomenclature have defined four hierarchical ranks. Romen numerals, which comes
after the Cry or Cyt words, have been exchanged for Arabic numerals in the primary
rank, it is followed by other three hierarchical rank consisting of numbers, capital
letters, lower case letters and numbers (e.g. Cry23Aa1), depending on its place in a
phylogenetic tree (Figure 1.1). Proteins with the same primary rank often affect the
same order of insect; those with different secondary and tertiary ranks may have
altered potency and targeting within an order. The quaternary rank was established to
group “alleles” of genes coding for known toxins that differ only slightly, either
because of a few mutational changes or an imprecision in sequencing. The proteins
less than 45 % sequence identity differ in primary rank (Cry1, Cry2, etc.) and 78 %
and 95 % identity constitute the borders for secondary and tertiary rank, respectively
(Crickmore et al., 1998).

5
Table 1.1. Known cry and cyt gene sequences with revised nomenclature assignments (Crickmore et al., 1998).
Revised Original gene/protein name
gene name
Revised Original gene/protein name
gene name

6
Table 1.1. (continued)
Revised Original gene/protein name
gene name
Revised Original gene/protein name
gene name

7
Figure 1.1. Phylogram demonstrating amino acid sequence identity among Cry and Cyt proteins. This phylogenetic tree is modified from a TREEVIEW visualization of NEIGHBOR treatment of a CLUSTAL W multiple alignment and distance matrix of the full-length toxin sequences. The gray vertical bars demarcate the four levels of nomenclature ranks. Based on the low percentage of identical residues and the absence of any conserved sequence blocks inmultiple-sequence alignments, the lower four lineages are not treated as part of the main toxin family, and their nodes have been replaced with dashed horizontal lines (Crickmore et al., 1998)

8
More than 3000 insect species within 16 orders were demonstrated to be susceptible
to different ICPs. The search for new genes is an on-going effort worldwide. So far,
the δ-endotoxins from the members of Bt comprise a group of 292 Cry and 22 Cyt
proteins and are classified into Cry1 to Cry44 and Cyt1 to Cyt2 according to the
degree of amino acid sequence homology (Stobdan et al., 2004; Huang et al., 2004)
(Table 1.2).
Table 1.2. Types of crystal proteins and the insects and their orders to which they are
active
Activity spectrum
Order Target Insect Species
Crystal Protein
Coleoptera
Leptinotarsa decemlineata
Diabrotica undecimpunctata
Melolontha melolontha
Agelastica alni
Pyrrhalta luteola
Lasioderma serricorne
Anomola cuprea
Cry3, Cry7, Cry8, Cry14, Cry 34, Cry 35, Cry 36,
Cry 38
Diptera
Psychoda alternata
Dixa spp. Tipula paludosa
Chironomus plumosus
Cry4, Cry10, Cry 11, Cry 16,
Cry 19, Cry 20, Cry 24,
Cry 25, Cry 27, Cry 29,
Cry 30, Cry 39, Cry 40
Lepidoptera
Plutella xylostella Spodoptera exigua
Malocosoma disstria
Bombyx mori
Cry1, Cry9, Cry15
Lepidoptera and Diptera
Heliothis virescens
Trichoplusia ni
Manduca sexta
Cry2
Hymenoptera
Monomorium pharaonis Cry22
Nematoda
Caenorhabtidtis elegans
Cry5, Cry6, Cry12, Cry13, Cry21

9
cyt and cry genes do not share significant sequence homology; however, both types
of toxins seem to work through pore formation that leads to cell lysis and irreversible
damage of the insect midgut (Knowles et al., 1987; Knowles et al., 1989). While Cry
toxins act via specific receptor recognition and binding (Gill et al., 1992), no specific
receptors have been described for Cyt toxins, although they show specificity of
action in vivo (Koni and Ella, 1994).
1.2.1. Classes of Insecticidal Crystal Proteins
1.2.1.1. Lepidoptera–Specific Cry Proteins
Lepidopteran-specific δ-endotoxins are produced by different Bt subspecies such as
Bt subsp. kurstaki, berliner, entomoicius 6.01, aizawai 7.29, thompsoni, sotto,
fukuokaensis, canadensis, and galleriae strains. The first characterized
antilepidopteran δ-endotoxin was Cry1 produced by Btk HD1 (Dulmage, 1970). In
2003, Huang and Guan isolated a novel Bt strain named as WB9 which is highly
toxic to Lepidopteran Plutella xylostella and Spodoptera exigua species, contains
cry1A, cry1B, cry1Cb, cry1Fa, cry1Ga genes and a vip3A gene. Beside Cry1 type of
toxins Cry2, Cry9 and Cry15 families are also toxic to Lepidoptera (Bravo, 1997).
For examle, Cry15Aa1 and Cry9Da2 were isolated from Bt thompsoni and Bt
japonensis, respectively (Brown and Whiteley, 1992; Wasano and Ohba, 1998). The
encoded protoxins are 130-140 kDa molecular weight and are accumulated in the
bipyramidal crystalline inclusions. However, Cry15 is found in crystals with a
second apparently unrelated protein having a molecular weight of 40 kDa (De-
Maagd et al., 2003).
1.2.1.2. Diptera–Specific Cry Proteins
Antidipteran Bt strains commonly feature the presence of Cyt proteins with cytolytic
and hemolytic activities (Guerchicoff et al., 2001). The discovery of antidipteran Bt
israelensis (Bti) in 1975 inagurated a new chapter in vector control (Goldberg and
Margalit, 1977). The search for native strains with activity against dipteran

10
species could have an impact on the control of mosquitoes worldwide. Spherical
shaped parasporal body of Bti comprises three types of Cry toxins; Cry4A (125 kDa),
Cry4B (134 kDa) and Cry11A (67 kDa) and two types of Cyt toxins; Cyt1Aa (27
kDa) and Cyt2Ba (27-28 kDa) (Delecluse et al., 2000). Tests on single, solubilized
and purified proteins showed that each of the crystal proteins are toxic to
mosquitocidal larvae, but each one was not as toxic as the intact form alone (Becker
and Margalit, 1993). Ibarra et al. (2003) characterized certain Bt isolates LBIT315,
LBIT320, LBIT348, IB604 and 147-8906 from Latin America based on their
insecticidal activities, scanning electron microscopy (SEM), sodium dodecyl sulfate-
polyacrylamide gel electrophoresis (SDS-PAGE) and plasmid profiles as well as
PCR analysis using novel general and specific primers for cry and cyt genes and they
observed higher mosquitocidal activity than that of Bti. Cry11Ba1, Cry10Aa2,
Cry20Aa1 ,Cry19Ba1, Cry25Aa1, Cry27Aa1, Cry29Aa1, Cry39Aa1 and Cry40Aa1,
Cry30Ba1 and Cry24Ba1 were the proteins found from Btk HD1, Bt jegathesan 367,
Bti ONR-60A, Bt fukuokaensis, Bt higo, Bt jegathesan, Bt higo, Bt medellin, Bt
aizawai, Bt sotto, Bt entomocidus, respectively (GenBank Accession numbers:
X86902, E00614, U82518, D88381, U88189, AB023293, AJ251977, BAB722016,
BAD00052 and BAD32657)
1.2.1.3. Coleoptera–Specific Cry Proteins
Bt BI256-82, the first identified strain as having activity against the larvae of
Coleoptera order, was isolated from a dead pupa larvae of the yellow meal worm
Tenebrio molitor by Huger in 1982 and the organism was described as Bt subsp.
tenebrionis (Btt) by Krieg in 1983. The Coleopteran activity of Btt is related with the
production of a flat, wafer shaped-rhomboidal crystal. To date, several other anti-
Coleopteran Bt strains have been isolated and their toxicities have been evaluated.
Hernstadt et al (1986) identified Bt san diego which was later found to be identical to
Btt. EG2158 was isolated and characterized by Donovan et al (1988) to produce 73
kDa crystal protein toxic to Coleoptera larvae. EG2838 (Bt subsp. tolworthi) and
EG4961 (Bt subsp. kumamotoensis) were isolated and characterized by Rupar et al.
(1991). They produce a 74 kDa polypeptide of CryIIIB (Cry3B) and

11
Cry IIIB2 (Cry3Ba1), having a 94% sequence identity to each other (Donovan et al.,
1992). 73 kDa protein of CryIIID (Cry7Aa) is produced by Btk strain BT109P and
active against larvae of Coleoptera (Lambert et al., 1992). Cry7Aa has an amino acid
identity of 74 %, 61 % and 33 % with Cry3A, Cry3B and Cry3C, respectively. Bt
LM63 and LM79 strains were isolated from soil samples by Chaufaux et al
(unpublished data) and identified as Coleoptera-active strains (Lecadet et al., 1992).
Kaelin et al. (1994), analysed 88 samples which were mostly consisting of dried leaf
Lasioderma serricorne (F.) from different countries. 59% of the isolates produced
rhomboidal crystals and gave 65 kDa protein bands which were similar to those
residues, processed tobacco or finished product and dead tobacco beetles produced
by Coleoptera-specific Btt. Cry3A is highly toxic to Leptinotarsa decemlineata, one
of the most important pest in the Coleoptera. This insect causes extensive damages
on potato, tomatoes and eggplants. Other insect species belonging to Coleoptera
order such as Melolontha melolontha, Agelastica alni, Pyrrhalta luteola,
Lasioderma serricorne are also susceptible to anti-Coleopteran Bt species.
Ellis et al. (2002) found new families of insecticidal crystal proteins with molecular
masses of ca. 14 and 44 kDa. produced by Bt isolates PS80JJ1, PS149B1, and
PS167H2 that have cotton rootworm (genus Diabrotica) insecticidal activity. These
binary Cry proteins designated as Cry34Aa1, Cry34Ab1 and Cry34Ac1 (the 14-kDa
polypeptide components) and Cry35Aa1, Cry35Ab1 and Cry35Ac1 (the 44- kDa
polypeptide components) were required for insecticidal activity.
A new Bt galleriae strain containing novel cry8 gene was discovered and shown to
be highly toxic against scarab beetles such as Anomola cuprea (Asano et al., 2003).
Anti-Coleopteran Cry7Ab2 and Cry14Aa1 proteins were also isolated from Bt
kumamotoensis 867 and Bt sotto PS80JJ1, respectively (GenBank Accession
numbers: U04368 and U13955).
The cry3A gene specifies the synthesis of the 73 kDa protoxin in Btt (Hernstadt et
al., 1986; Hofte et al., 1987; Sekar et al., 1987). During sporulation, the 73 kDa
protoxin of Btt is processed to 64-68 kDa polypeptide which predominate in the

12
released crystal protein. This process is performed by the removal of 55-57 amino
acids from N-terminus by endogenous proteases (McPherson et al., 1988; Carroll et
al., 1989). Cry3 proteins lack the large nontoxic C-terminus of Cry1 toxins. Thus,
64-68 kDa form is the stable form of Cry3A, lacks S-S bonds and obviates the
requirement for reducing agents in solubilization (Slaney et al., 1992; Koller et al.,
1992). Trypsin and some insect midgut extracts have also been shown to proteolyze
soluble Cry3A producing a stable 55 kDa polypeptide.(Carroll et al., 1989). While
the pH of larval midgut is alkaline in both Lepidoptera and Diptera, the larvae of
beetle family Crysomelidae have a midgut pH range of 4.5-6.6 (Koller et al., 1992).
1.2.1.4. Nematoda–Specific Cry Proteins
The phylum Nematoda contains free-living species and parasitic species in addition
to beneficial ones. Certain Bt crystal proteins have potential in controlling nematode
pests that infect animals and plants (Wei et al., 2003; Huffman et al., 2004). Using Bt
lysates, Cry5B, Cry6A, Cry14A and Cry21A were shown to be nematicidal towards
Caenorhabtidtis elegans which is a model system to study host-pathogen interactions
(Marroquin et al., 2000). Cry12Aa1, Cry13Aa1 and Cry5Aa1 were isolated from Bt
PS33F2, Bt PS63B and Bt darmstadiensis PS17, respectively (GenBank Accession
numbers: L07027, L07023 and L07025).
1.2.1.5. Hymenoptera–Specific Cry Proteins
Cry22 proteins were initially identified in Bt strains as active on ants (Order:
Hymenoptera). The proteins have molecular weights of 75 to 86 kDa and Cry5 toxins
were also reported to be active against the ant Monomorium pharaonis that belongs
to the Hymenoptera (Payne et al., 1997). Cry5A toxin from Bt strain PS86Q3 was
active against at least one hymenopteran species, Diprion pini. Strain PS86Q3
contains a long bipyramidal crystal composed of five proteins of 155, 135, 116, 97
and 58 kDa., respectively. The 155 kDa protein was proven to be Cry5B toxin by N-
terminal sequencing, whereas the other proteins were Cry5A toxins. It is

13
possible that the 135, 116, 97 and 58 kDa proteins represent proteolytic fragments of
the same protein, since PCR analysis demonstrated that this strain harbors only
cry5Ac and cry5Ba genes. The treatment with proteases present in D. pini or
Cephalcia abietis midgut content produced a single 75 kDa protein (Garcia-Robles et
al., 2001).
1.2.2. Structural and Sequential Similarities Among Cry Toxins
When the structural and sequential similarities are considered, conserved amino acid
sequences drew attention among most Cry toxins (Hofte and Whiteley, 1989).
Alignment of the Cry toxins reveals the presence of five conserved sequence blocks
common to a large majority of proteins as shown in Figure 1.2. The amino acid
sequence which starts by the end of the conserved block 5 and continues down to C-
terminal region is the cleavage part by the proteases during crystal protein activation.
The function of block 5 is largely structural, rather than related to activity. Blocks 1-
4 are involved in ion channel function or toxin stability.
Within different classes of toxins the number of common blocks can also differ. The
group consisting of Cry1, Cry3, Cry4, Cry7 to Cry10, Cry16, Cry17, Cry19, and
Cry20 contains all five of the core blocks. A second group consisting of Cry5, Cry12
to Cry14, and Cry21 contains blocks 1, 2, 4, and 5. Hovewer, Cyt1, Cyt2, Cry6,
Cry15, and Cry22 have no recognizable homologs to the conserved blocks (Schnepf,
1995; Schnepf et al.,1998; De-Maagd et al., 2001).

14
Figure 1.2. Five conserved sequences of insecticidal crystal proteins.
Cry3A and Cry1Aa, in contrast to Cyt2A, both possess three domains, as shown in
Figure 1.2. Domain I consists of a cluster of seven antiparallel α-helices in which
helix 5 is encircled by the remaining ones (Schnepf et al., 1998). Domain II consists
of three antiparallel β-sheets joined in a typical “Greek key” topology, arranged in a
so-called β-prism fold (Sankaranarayanan et al., 1996; Shimizu and Morikawa,
1996). Domain III consists of two twisted, antiparallel β-sheets forming a β-
sandwich with a “jelly roll” topology (Li et al., 1991).
Domain I starts from the N-terminal region and has a crucial role in membrane
insertion and pore formation. Domain I has long, hydrophobic and amphipathic
seven α helices and this structure bears many striking similarities to the pore-

15
forming or membrane-translocating domains of several other bacterial protein toxins,
such as colicin A and diphtheria toxin (Parker and Pattus, 1993).
The surface-exposed loops at the apices of the three β-sheets of domain II show
similarities to immunoglobin antigen-binding sites and are involved in receptor
binding and specificity determination. This is further supported by the reports that
domain II shared the same structural fold with three carbohydrate binding proteins:
the vitelline membrane outer layer protein I from hen's eggs, the plant lectin jacalin
and the Maclura pomifera agglutinin. (Knowles et al., 1984; Schnepf et al., 1998;
Jenkins and Dean, 2000; De-Maagd et al., 2003).
The β-sandwich structure of domain III could play a number of key roles in the
biochemistry of the toxin molecule. Li et al. (1996) suggested that domain III
functions in maintaining the structural integrity of the toxin molecule, by protecting it
from proteolysis within the gut of the target organism, and also in receptor binding
and in ion channel activity.
1.2.3. Mechanism of Action
The toxicity as well as specificity of Bt Cry toxins correlates directly with the
binding of toxins to high-affinity receptors on the epithelial cells that line the midgut
of the susceptible insects (Loseva et al., 2002). The mechanism of action of the Bt
Cry proteins involves solubilization of the crystal in the insect midgut, proteolytic
processing of the protoxin by midgut proteases, binding of the Cry toxin to midgut
receptors and insertion of the toxin into the apical membrane to create ion channels
or pores. The specific pH and proteases in the insect midgut favour solubilization and
proteolytic cleavage of the inclusions (Rausell et al., 2004).
As mentioned earlier, crystals are comprised of protoxins. For the protoxins to
become active, a susceptible insect must eat them (Schnepf et al., 1998).
Solubilization of protoxins with an extended C-terminus depends on the highly
alkaline gut pH of Lepidoptera and Diptera. Some of the toxins with potential

16
activity against Coleoptera are only toxic after in vitro solubilization which may be
due to the property of the protoxins to be insoluble at the neutral to weakly acidic gut
pH of Coleoptera; for example, Cry1Ba for some species (Bradely et al., 1995) and
Cry7Aa (which additionally also requires in vitro activation) (Lambert et al., 1992).
Differences in the extent of solubilization sometimes explain differences in the
degree of toxicity among Cry proteins (Aronson et al., 1991; Du et al., 1994). The
main digestive proteases of Lepidoptera and Diptera are serine proteases, whereas
those of Coleoptera are mainly cysteine and aspartic proteases (Lambert et al., 1992;
Terra and Ferreira, 1994).
The activated toxin binds to receptor in the midgut. In the midgut epithelium of
certain insects, such as Manduca sexta and Bombyx mori, the Cry receptors are
identified as specific cell adhesion molecules, cadherins. Cadherins represent a large
familiy of calcium-dependent, transmembrane glycoproteins and are responsible for
maintaining the integrity of cell to cell contacts in multicellular organisms (Nollet et
al., 2000; Angst et al., 2001). In addition to cadherin receptors for Cry toxins, several
120-170 kDa Cry toxin-binding proteins, aminopeptidase N (APN), have also been
identified in some lepidopteran insects. (Knight et al., 1994; Sangadala et al., 1994;
Valaitis et al., 1995; Gill et al., 1992; Oltean et al., 1999). Binding of crystal toxin to
the brush border membrane vesicules (BBMV) of insect larvae occurs in two stages
involving reversible binding and irreversible binding (Baum and Malvar, 1995). In
reversible binding, domain II binds tightly to the receptor and is necessary for further
activity of toxin. Irreversible binding is exclusively associated with membrane
insertion and occurs via the insertion of domain I. It was suggested that toxicity
correlates with irreversible binding (Liang et al., 1995). Binding of δ-endotoxin to
cadherine-like receptors in the midgut causes stress, consequently, disrupts the apical
brush border membrane microvillae of midgut epithelium and destroys the entire
midgut tissue. Nonspecific ion channels form, causing midgut cells to lose their
membrane potential. If the rate of damage to the midgut exceeds the rate of repair,
lesions form, bacteria invade the hemocoele and death results from septicemia (Wu
et al., 2000).

17
1.3. The Bt Genome and Plasmids
Bt, B. cereus (Bc) and B. antrachis (Ba) are genetically very closely related members
of the genus Bacillus. Ba and Bt are readily distinguished from Bc by the presence of
plasmid-borne specific toxins (Ba and Bt) and capsule (Ba) (Helgason et al., 2000;
Ivanova et al., 2003). However, the transfer of ICP encoding plasmids from Bt to Bc
makes Bc indistinguishable from Bt and vice versa (González et al., 1981; González
et al., 1982). Bt strains have a genome size of 2.4 to 5.7 million bp and also physical
maps have been constructed for two Bt strains (Carlson and Kolsto, 1993; Carlson et
al., 1994; Carlson et al., 1996). Bt konkukian (Bt 97-27) is a human pathogen,
therefore, pathogenic property is unlike most Bt isolates. It was shown by amplified
fragment length polymorphism (AFLP) analysis that Bt konkukian was to be very
closely related to Ba (Radnedge et al., 2003). The complete genome sequence of Bt
97-27 was submitted to NCBI and EBI-Proteome database; Data-search: NC005957,
AE017355. Bt 97-27 has a genome size of 5.237 Mb with a 64.6 % A+T rich
sequence and comprises 5.083 genes.ongoing Bt genome projects, on the other hand,
include those of Bt, Bt NBT97 and Bti ATCC 35646
(http://www.genomesonline.org).
Most Bt isolates have several extrachromosomal elements, some of them are circular
and others linear (Carlson et al., 1994). Most cry genes are found on large plasmids
with low copy number, ranging form 35 to 200 mDa and most probably the genes
encoding the crystal proteins are often clustered on transmissible plasmids with
flanking transposable elements. Regarding the role of the transposable elements in
Bt, it is postulated that they are involved in the amplification of cry genes in the
bacterial cell (Schnepf et al., 1998; Kaur, 2000).
The genes for the four dipteran-active protoxins and a cytolytic factor in Bti are all
on a 72 mDa plasmid (Aronson, 1993). The cry4A gene of the israelensis subspecies
is flanked by two repeated sequences in opposite orientations designated IS240
(Bourgouin et al., 1988). Insertion sequences have been found upstream of the
cry1Ca gene (Smith et al., 1994) and downstream of a cryptic cry2Ab gene
18
(Hodgman et al., 1993). Btk HD1 contains 12 size classes of ‘non-nuclear’ DNA
(Carlton and Gonzales, 1985) including a linear element and a transducing phage
(Walter and Aronson, 1991). Unlike the kurstaki HD1 strain, which contains three
related but significantly different crystal protein genes (Kronstad et al., 1983), subsp.
tenebrionis contains only a single crystal protein gene. Btt was found to have at least
5 different plasmids with sizes of 105, 90, 58, 56, and 9.5 mDa (Sekar et al., 1987).
The crystal protein gene of this organism was located on the 90 mDa one (Aronson et
al., 1995).
1.4. cry Gene Expression
A common characteristic of the cry genes is their expression during the stationary
phase. Their products generally accumulate in the mother cell compartment to form a
crystal inclusion that can account for 20 to 30% of the dry weight of the sporulated
cells (Sanchis et al., 1996). The very high level of crystal protein synthesis in Bt and
its coordination with the stationary phase are controlled by a variety of mechanisms
occurring at the transcriptional, posttranscriptional and posttranslational levels. The
accumulation of protoxins begins at about Stage III of sporulation and continues
through Stage V (Aronson, 1993). cry1Aa, the first cloned and sequenced cry gene,
is expressed during sporulation of the producer Bt strain from two overlapping
promoters known as BtI and BtII (Wong et al., 1983). The transcription from BtI is
initiated by a form of RNA polymerase containing σ35 that shows 88% identitiy with
a sporulation-specific σE of Bacillus subtilis. Later transcription is from an upstream
promoter, BtII, which is dependent upon an RNA polymerase containing a sigma
subunit, σ28 with 85% identity to other sporulation-specific σK of B. subtilis (Adams
et al., 1991). BtI is active between about T2 and T6 of sporulation and BtII is active
from about T5 onwards (where Tn is n hours after the end of the exponential phase).
In addition to cry1Aa, both the cry1Ba and cry2Aa genes contain either BtI alone or
BtI with BtII (Brown and Whiteley, 1988). Beside this, the transcription of many
other cry genes (e.g., cry4Aa, cry4Ba, cry11Aa, cry15Aa, etc.) is likely to be σE- or
σK -dependent (Schnepf et al., 1998).

19
The cry3Aa gene, isolated from the Coleopteran-active Btt, was found to be
expressed during vegetative growth at a lesser extent than during the stationary phase
(Sekar, 1988; De Souza et al., 1993; Malvar et al., 1994). Activation of cry3A
expression was independent of the key genes involved in the initiation of sporulation
(key regulators or sigma factors). It differs in this respect from other cry genes The
promoter that directs the transcription of anti-Coleopteran cry3A gene resembles σA
vegetative stage promoters (Agaisse and Lereclus, 1994 a,b).
Figure 1.3. Model for the cry3A gene expression (Agaisse and Lereclus, 1994 a,b).
DNA sequences required for the full expression of cry3A gene are at the upstream
region extending from nucleotides -635 to -553 involved in a transcriptional event,
and the downstream region extending from nucleotides -367 to +18 involved in a
post-transcriptional event. Transcription of cry3A is initiated at nucleotide position -
558, giving the transcript T-558. This transcript is thought to be subsequently
processed a stable form (T-129), which accumulates in the cells appearing as the
major cry3A mRNA (Figure 1.3). The internal region between nucleotide position -
558 and -129 harbours no potential protein-coding sequence and therefore not coding
for a gene product involved in cry3A regulation. This indicates that this region may
involve a specific sequence that have a role in negative regulation of cry3A
expression, by acting as a binding site for a repressor at transcriptional level or as a
secondary structure determinant at post-transcriptional level (Agaisse and Lereclus,

20
1994 b). The high level of crystal protein production may result partly from the
stability of the corresponding RNA. Glatron and Rapoport (1972) showed that the
crystal protein mRNAs have an average half-time of 10 min in Bt during sporulation
versus 2-6 min for many spore-specific mRNAs. The 3′ terminal fragment of the
cry1Aa gene from Btk strain HD1 is a positive regulator (Wong and Chang, 1986).
The stability of the mRNA is enhanced by the formation of a stemloop structure
during termination of transcription. This protects the mRNA from the activity of
exonucleases present in the cell from degradation. The fusion of a DNA fragment
carrying this terminator with the 3′ end of heterologous genes increases the half-life
of their transcripts two to threefold, by increasing the expression level as well as
maintaining the mRNA stability (Agaisse and Lereclus, 1996).
mRNA of Bt cry3Aa gene have a 5′ stabilizer that is not involved in the translation
initiation. The stability is due to the presence of a consensus Shine-Dalgarno
sequence (GAAAGGAGG) mapping at a position between -125 and -117 at 5′ UTR
of the gene, which is designated as STAB-SD. The interaction with the 16S rRNA of
the 30S subunit of the ribosome confers stability to the mRNA. The upstream of the
cry3Ba, cry3Bb, and cry3Ca genes also have this sequence in similar positions
(Donovan et al., 1992; Lambert et al., 1992).
At the posttranslational level, larvacidal proteins form crystalline inclusions in the
mother cell compartment. Depending on the protoxin composition, the crystals have
various forms. The ability to crystallize helps in protecting the protein itself from
premature proteolytic degradation (Schnepf et al., 1998).
21
1.5. Strategies to Improve Bt and Toxin Yields
1.5.1. Optimization of Nutritional and Cultural Conditions
Bt is the most inexpensive of all microbial insecticides in terms of production costs.
Still, high protein yields for optimization of Bt fermentations are required to make its
production cost-competitive with synthetic insecticides. Systematic studies on the
physiological and nutritional requirements of Bt especially those required for
maximum yield of ICPs are still limited (Sachidanandham et al., 1997). Fermentation
and media optimization for each strain put into commercial production is needed as
different strains may have different responses to nutritional and cultural conditions
(Kaur, 2000). The culture conditions of Bt are optimized to achieve not only high cell
densities, but also high crystal protein concentration and high toxicity (Dulmage et
al., 1990). Previously, it was believed to be important to end up with high spore
counts however, Rossa and Mignone (1993) reported that a good spore count did not
lead to high larvacidal potency in Bti. It was later shown that bacterial spore counts
do not necessarily reflect the insecticidal activity of a Bt strain or Bt product because
the number and amount of crystal protein per bacterial cell can vary (Enviromental
Health Criteria, 1999; Paramatha, 2000). In some countries like Japan, products of Bt
biopesticides with viable Bt spores are not authorized. Dissemination and persistence
of Bt spores in locations where sericulture is an economic activity is a matter of
concern due to toxicity to economically important insect, such as the toxicity of
cry1Aa gene carrying spores to silk worms. Thus, from a commercial perspective, Bt
strains which produce crystals but not spores and thereby are nonpersisting in nature
are desirable (Kaur, 2000).
For the fermentation of Bt, carbon source is very important. The presence of a carbon
source in the growth medium can repress expression of certain genes and operons
indirectly related with toxin formation (Brückner and Titgemeyer, 2002). The
excessive glucose concentration may prolong the vegetative growth and also
minimize the toxin yield. For example, Bhatnagar (1998) showed that Cry4A toxin
of Bti was not synthesized when the medium contained >0.4 % glucose. In

22
the study of �çgen et al. (2002 b), it was found that the carbon sources such as
sucrose, lactose and inulin supported the production of Lepidoptera-specific Cry1
and Cry2 toxins by Bt 81. Especially, the replacement of glucose with sucrose greatly
increased the yields of Cry4Ba and Cry11A toxins (Özkan et al., 2003).
It was suggested that the depletion of nitrogen sources triggers sporulation and toxin
expression. Inorganic nitrogen compounds, such as ammonium sulphate are not
usually sufficient to support the growth of Bt and organic nitrogen sources such as
meat peptone, fish meal and soybean flour are required for rapid growth (Yang and
Wang, 2000). Among different organic and inorganic nitrogen compounds tested,
peptone was found to be best source supporting the optimum Cry1 and Cry2 δ-
endotoxin formation (Içgen et al., 2002 b).
Another important component for the production of crystal protein is potassium.
Wakisaka et al (1982) detected an increased crystal protein production in the
presence of potassium salts. However, when potassium salts were replaced with the
same salts of sodium, the same effect was not seen. Besides this, Bhatnagar (1999)
reported a corresponding increase in the Cry4A specific mRNA in the presence of
inorganic phosphate which stimulated 135 kDa protoxin synthesis by Bti cells.
Phosphate is considered to be essential for not only protein expression, but is also
critical for cell growth and its concentration varies during the toxin-formation phase
(Yang and Wang, 2000). In the studies of �çgen et al. (2002 b) and Özkan et al.
(2003), high yields of antilepidopteran and antidipteran δ-endotoxins were obtained
with 50-100 mM inorganic phosphate among the concentrations tested.
Bacterial toxins possess many attributes of secondary metabolites and their yield is
known to be greatly affected by trace metals (Rose, 1979). Mn is the most important
key metal co-regulating secondary metabolism and differentiation in bacilli
(Weinberg, 1977). Sikdar et al. (1991) reported on the mineral requirements of Bti
for production of the mosquidocidal δ-endotoxin and found that Fe, Mn and Cu were
required for the production of crystal protein while Mo had an inhibitory effect. They
also obtained no direct relationship between cell growth and toxin production by
comparing optimum levels of metals for both. In the study of �çgen et al.

23
(2002 a), the toxin yield was almost zero when Mg was omitted from the medium
indicating that Mg was the most critical trace element for antilepidopteran Cry
protein synthesis by Bt 81. The stimulatory effect of Cu was seen between the range
of 10-6 to 10-7 M. Ca and Zn had no effect on toxin production. However, Ca favored
and Zn, Fe and Cu negatively influenced the synthesis of antidipteran toxin
production by Bti HD500 (Özkan et al., 2003).
Sachidanandham et al. (1997) identified the amino acid requirements for a stable and
enhanced production of crystal proteins by Bt subsp. galleriae. In the study, several
amino acids resulted in a better carbon utilization as well as improving the stability
and volumetric productivity of biomass for Btg biomass.
Several studies were conducted to decrease the cost of fermentation by employing
low-cost media components. For example, Vora and Snetha (1999) reported
enhanced growth, sporulation and toxin yields by Btk in a medium containing
defatted soybean and groundnut seed meal extracts with the supplementation of
cysteine. Gruel and fish media were investigated for the growth of both Diptera- and
their use to cultivate antidipteran species led to decreased toxin biosynthesis (Zourai
et al., 2002). In other studies, such as those of Lachhab et al. (2001) and Vidyarthi et
al. (2002), wastewater sludge as a raw material for Bt fermentation was evaluated.
1.5.2. Molecular Approaches
Several techniques, such as genetic recombination and construction of engineered Bt
strains have been used to improve the insecticidal properties of Bt strains (Sanchis et
al., 1996; Kaur, 2000).
Expression of cry genes can be enhanced by altering the elements regulating
transcription and translation. Cry3Aa protein production was enhanced 2.5 fold in an
asporogenous Bt strain suggesting sporulation-independent transcription of cry3Aa
(Malvar et al., 1994). Cry3A production is not only sporulation-independent but it
can also be elevated in spo- backgrounds. The expression of cry3Aa was increased in
sporulation-negative spoA B. subtilis mutants (Agaisse and Lerecluse, 1994 a).
Sanchis et al. (1996) reported the accumulation of Cry1C toxin in

24
large amounts by a spo0A mutant expressing the cry1C coding sequence from the
sporulation-independent cry3A promoter.
20 kDa helper proteins encoded by the cry2A and cry11A operons enhanced
synthesis and stability of cry2A by acting as molecular chaperons (Ge et al., 1998).
Transcipt stability is another important factor for Cry synthesis. As substantial
increase in 65 kDa Cry1 was obtained using the STAB-SD sequence of the cry3A
gene (Agassie and Lereclus, 1996). The use of dual cyt1Aa promoter along with
STAB-SD sequence resulted in several-fold increase in the expression of cry3Aa
gene. Besides, it was shown that cyt1 promoters in combination with the cry3A
STAB-SD enhanced Cry2A and Cry11A yields almost 5 and 1.3 folds, respectively
(Park et al., 1998).
An increase in irreversible binding to receptors was correlated with increase in
toxicity as well. Amino acid residues involved in receptor recognition, membrane
insertion and toxicity can be substituted through in vitro mutagenesis (Smedley and
Ellar, 1996). A combination of mutations in the a α8 loop and loop 2 in domain II of
Cry1Ab resulted in a 32-fold increase in toxicity to gypsy moth (Lymantaria dispar)
over the wild type protein (Rajamohan et al., 1996). Wu et al. (2000) used site-
directed mutagenesis to modify Bt cry3A gene in amino acid residues 350-354 and
showed a significantly improved toxicity against Tenebrio molitor.
Insecticidal activity of Bt strains can be further improved by elimination of activities
that reduce Cry production. During sporulation, Bt synthesizes proteolytic enzymes
for processing of non-toxic protoxins to smaller insect-active toxins. However, they
may also process and degrade crystal protein resulting in yield reduction (Kaur,
2000; Tan and Donovan, 2000). Donovan et al. (1997) by using a gene deletion
strategy, showed that neutral protease A, a sporulation-specific protease, contributed
to degradation of crystal proteins.

25
1.6. Transgenic Organisms, Insect Resistance to Bt Toxins and Resistance
Management, Bt Formulations and Field Applications
Insect-resistant transgenic plants are constructed by introducing toxin genes. The
genetic code of plants differs slightly from that of bacteria. The relatively AT-rich
Bacillus DNA contains a number of sequences that could provide signals deleterious
to gene expression in plants, such as splice sites, poly(A) addition sites, ATTTA
sequences, mRNA degradation signals, and transcription termination sites besides a
codon usage different from that of plants. Thus, it is necessary to use synthetic genes
whose nucleotide sequence is altered in such a way that it still encodes the desired
bacterial amino acid sequence. Truncation of the unmodified genes to synthesize
only the toxic portion of the protein typically results in much improved, but still
comparatively low expression (Sanchis and Ellar, 1993; Tappeser et al., 1998).
However, several cry genes have been introduced into plants, starting with tobacco
(Barton et al., 1987; Vaeck et al., 1987) and now including many major crop species
such as rice, potato, soybean, Brassica spp, tomato, chickpea, peanut, conifer,
legume, corn, maize, cotton. Alfalfa was protected from the Coleopteran pest, clover
root cuculio (Sitona hispidulus) and pea leaf weevil (Sitona lineatus) upon transfer of
the cry3Aa gene from Btt to Rhizobium melloti and R. leguminosarum (Bezdicek et
al., 1994). Giddings et al. (1997) reported a better nodule occupency by R.
leguminosarum carrying the cry3Aa gene. In 1996, varieties of potato, cotton, corn
and other plants containing modified cry genes were sold to growers and provided
higher yields (Schnepf et al., 1998; Groot and Dicke, 2002). For example, the higher
yields of rice have been obtained in Asia by the use of transgenic rice (Toenniessen
et al., 2003).
Insecticide resistance develops due to genetic variation in large insect populations.
When the insecticide is applied, unaffected individuals survive and pass their genes
onto following generations. Over time, a large number of resistant insect populations
become dominant in environment. Prolonged use of insecticides also increases the
risk of resistance. Several insects gained resistance to certain Bt toxins in the
laboratory and field. The first case of field-selected resistance to Bt was the
populations of diamondback moth (Plutella xylostella) which showed

26
different levels of susceptibility to a formulated Bt product (Dipel) (Schnepf et al.,
1998). On the other hand, a statistically significant resistance to Bti has been reported
in mosquitoes Culex quinquefaciatus and Aedes aegypti (Georghiou et al., 1983;
Goldman et al., 1986). At least one strain of Colorado potato beetle Leptinotarsa
decemlineata has been selected for resistance to a Coleoptera-active strain of Btt
(Miller et al., 1990). The species including Plodia interpunctella, Cadra cautella,
Leptinotarsa decemlineata, Chrysomela scripta, Tricholplusia ni, Spodoptera
littoralis, Spodoptera exigua, Heliothis virescens and Ostrinia nubilalis (Schnepf et
al., 1998) gained resistance one of either Btk, Bti, Btt or other Bt subsp.
Although little is known about the mechanism(s) of resistance to Cry proteins, the
possible mechanisms can be categorized as a decrease in toxin binding to insect
midgut (Van Rie et al., 1990; Fere et al., 1995; Sayyed et al., 2000) and proteases
that interact with toxin in insect midgut (Keller et al., 1996; Oppert et al., 1997;
Loseva et al., 2002). Plodia interpunctella appears to have a 50-fold decrease in
Cry1A binding associated with a 100-fold decrease in toxicity (Van Rie et al., 1990).
There did not seem to be fewer binding sites developing in P. interpunctella, but
simply less binding affinity (Van Rie et al., 1992). In addition to decreased affinity,
resistance in P. interpunctella was linked with the absence of a major gut proteinase.
Presumably this proteinase is associated with the proteolytic cleavage and activation
of Bt protoxins (Oppert et al., 1997). Forcada et al. (1996) reported that proteases
from a strain of tobacco mudworm Heliothis virescens resistant to Bt kurstaki HD-73
degraded the toxin faster than proteases from the susceptible strain. Resistance to the
Cry1Ac toxin by H. virescens was linked to retrotransposon-mediated disruption of a
specific cadherin gene (Gahan et al., 2001). On the other hand, resistance of
Colorado potato beetlte (CPB) to Cry3A toxin correlates with the presence of
different forms of digestive ptoteases in the resistant strain as well as with a
decreased binding affinity. Thus, changes in the activity or composition of gut
proteases are involved in altering the susceptibility by insects to crystal toxins
(Loseva et al., 2002).
Resistance management strategies try to prevent or diminish the selection of the rare
individuals carrying resistance genes and to keep the frequency of resistance

27
genes sufficiently low for insect control (Schnepf et al., 1998). In transgenic plants,
selection pressure could be reduced by restricting the expression of crystal protein
genes to certain tissues of crop so that remaining parts of the plant are fully
protected. It has been proposed that cotton lines in which cry gene expression is
limited to the young bolls may not suffer dramatic yield loss from Heliothis larvae
feeding on other plant structures (Gould, 1988). However, tissue-specific expression
would not be a viable option for some pests which target nearly the entire plant, such
as the European corn borer (Monsanto, 2000).
Another management option is the rotation of plants or sprays of particular Bt toxin
with those having another toxin type binding to a different receptor. The second
strategy has a potential value when is a fitness cost is associated with resistance.
Such fitness cost has been reported in P. xylostella lines, in which resistant males
have lower mating success than their non-resistant competitors (Groeters, 1993). The
use of a patchwork of Bt and non-Bt aeras (mosaics) in resistant management is
another strategy, but mosaics and rotations cannot be successful if the cross- resistant
(resistance to one of them cannot be positively correlated with or helpful in
developing resistance to the other) is present between insecticides (Tabashnik, 1994).
The larvae of western corn rootworm (WCR), Diabrotica virgifera virgifera LeConte
(Coleoptera: Chrysomelidae), and related Diabrotica species are major coleopteran
pests of corn. Crop rotation with soybeans is the most common pest management
practice for corn rootworm control and is used in 80% of north central United States
area (Drees et al., 1999; Ellis et al., 2002). Babu et al. (2002) compared the growth
inhibition and mortality patterns of Helicoverpa armigera (H) treated with Cry1Ac
and Cry2Aa proteins and found that deploying Cry1Ac and Cry2Aa in rotation
would be a rational strategy for managing resistance development in cotton
bollworm.
Other attractive management tactics include the combination of two or more
insecticides on the same field, such as a Bt and non-Bt toxin and combinations of two
or more different Bt Cry toxins, or a Bt Cry and a Bt Cyt toxin. A 1997 study
investigated the toxic effects of a combination of Bt and the parasitoid

28
Cotesia plutella on P. xylostella. The interaction of the two did not significantly
affect mortality of P. xylostella populations resistant to Bt, though Bt-susceptible
populations were affected by the combination more than by either the parasitoid or Bt
used alone (Chilcutt and Tabashnik, 1997). In comparison to Btk strains, there is a
limited Bti insect resistance development in mosquitoes, mainly because of the
presence of the multiple protein toxin genes (Becker and Margalit, 1993). Sublethal
doses of CytA toxins, when combined with Cry4 toxins, appear to suppress and/or
reduce up to 1000-fold resistance in Cry4-resistant populations of Culex
quinquefasciatus (Wirth et al., 1997). Similarly, the use of Bt Cyt1Aa helped to
overcome 5000-fold resistance to Bt Cry3Aa toxins in Chrysomela scripta (Frutos et
al., 1999).
Natural enemies, instead of other toxins, can be used in combination with low doses
of Bt. This strategy cannot be used with most insecticides, as they have broad-range
effects and will kill natural enemies as well as pests (Chilcutt and Tabashnik, 1997).
Besides this, the high dose strategy hopes to delay resistance by using a high enough
dosage of toxin to kill heterozygous insects (with alleles for both resistance and
susceptibility). In this strategy, the control of dose carefully is the key factor (Neppl,
2000).
The largest share of the bio-pesticide market currently goes to Bt. Estimates range
from $75 million to $125 million for recent annual sales worldwide. The strain most
commonly used against insects is Btk (Jerry, 2004). Bt-based products represent
about the 95 % of biopesticides and 2% of the total global insecticide market (Kaur,
2000). As of early 1998, there were nearly 200 registered B. thuringiensis products in
the United States. Although commercial applications of Bt have been directed mainly
against Lepidopteran pests of agricultural and forest crops, strains active against
Coleopteran pests have also been marketed in recent years. Strains of Bti active
against dipteran vectors of parasitic disease organisms have been used in public
health programmes as well.
Most commercial Bt-based products contain ICP and viable Bt spores, but the spores
are inactivated in some Bti products. Commercial Bt formulations include

29
wettable powders, suspension concentrates, water dispersible granules, oil miscible
suspensions, capsule suspensions and granules (Tomlin, 1997) and are applied after
the application of a Bt subspecies to an ecosystem, the vegetative cells and
insecticides to foliage, soil, water environments or food storage facilities. spores may
persist at gradually decreasing concentrations for weeks, months or years as a
component of the natural microflora. A drawback of spore-crystal formulations is
their limited foliar persistence in the environment due to inactivation by ultraviolet
light, heat, leaf exudates and pH (Kaur, 2000). Quality standards for Bt fermentation
products have been accepted by International Union of Pure and Applied Chemistry
(IUPAC) (Quinlan, 1990). The standards include limits on the concentration of
microbial contaminants and metabolites.
1.7. Present Study
The present study focused on anti-Coleopteran delta-endotoxin production by a local
isolate of Btt which we found to produce high yields of Cry3Aa toxin. Toxin levels
and sporulation were next monitored in four different media with the aim of selecting
an efficient starting medium. Toxin levels at various stages of fermentation of this
isolate were next compared to those of 30 different Cry3Aa producer strains. This
comparison gave the idea about the high performance of our isolate regarding
Cry3Aa production. The effects of varying the concentrations of sugar, inorganic
phosphate and minerals on toxin biosynthesis were determined and compared to their
effects on growth and sporulation of the organism.
The second part of the work involved cloning in E. coli and characterization of
cry3Aa gene that the isolate harbours and revealed its identity to those reported so
far. cry3Aa gene of the isolate was next cloned in B. subtilis as an intermediate host
and expressed at a low level in this organism from its own promoter.

30
CHAPTER 2
MATERIALS AND METHODS
2.1. Bacterial Strains and Plasmids
The bacterial strains and plasmids used in this study and their sources are listed in
Table 2.1. The strains were streaked onto LB agar (Appendix A), subcultured
monthly and stored at + 4 oC. For long term maintenance of Bacillus strains, stock
solutions were stored at - 80 oC in Luria broth covered with 20 % glycerol. Stock
solutions of E. coli DH5� was also prepared in LB containing 15% glycerol and
stored at – 80 ˚C.
Seed culture of Btt local isolate was prepared according to the procedure adopted
from Stahly et al (1992). The Btt strain was grown to mid-log phase (ABS600= 0.5).
A 100 µL aliquot from this culture was transferred into a 100 mL DSM medium and
left to grown until OD600 becomes 0.5. Then 100 µL of the culture was diluted 50
folds by adding 4.9 mL of 50 % glycerol (v/v). The diluted culture was divided in
Eppendorf tubes as 100 µL aliquots and stored at – 80 °C.
The plasmids, PGEM-T (cloning vector for PCR products) and pNW33N (E.
coli/Bacillus shuttle vector), are shown in Figure 2.1.

31
a)
b)
Figure 2.1. Structure of the plasmid vectors: (a) pGEM-T and (b) pNW33N.

32
Table 2.1. A list of bacterial strains and plamids used in the present study
No. Strain Bt serovar Source and Reference
1 3273 ND* 2 6003 neoleonensis
3 5993 neoleonensis
4 3123 morrisoni 5 3283 morrisoni 6 5903 neoleonensis 7 3203 morrisoni
8 3904 morrisoni
9 3973 morrisoni
10 3213 morrisoni
11 7703 morrisoni
12 2983 morrisoni
13 3063 morrisoni
14 3043 morrisoni
15 3023 morrisoni
16 1915 morrisoni
17 1935 morrisoni
18 1925 morrisoni
19 3103 neoleonensis 21 1401 morrisoni 22 3003 morrisoni
Prof. Feruccio Gadani, Philip Morris Europe S.A., Neuchatel, Switzerland; Kaelin et al. (1994)
23 4AA1 tenebrionis Dr. Daniel Zeigler, Bacillus Genetic Stock Center (BGSC); McPherson, et al. (1989)
24 4AB1 san diego Dr. Daniel Zeigler, BGSC; Hernstadt et al. (1987)
25 4L1 tolworthi
Dr. Daniel Zeigler, BGSC; Burges HD, unpublished
26 4L2 tolworthi
Dr. Daniel Zeigler, BGSC; Burges HD, unpublished
27 4L3 tolworthi
Dr. Daniel Zeigler, BGSC; deBarjac H, unpublished
28 4W1 kumamtoensis Dr. Daniel Zeigler, BGSC; Ohba et
al. (1981) 29 4AT1 japonensis Dr. Daniel Zeigler, BGSC; Ohba
M., Aizaawa K. (1986).
30 4AU1 higo Dr. Daniel Zeigler, BGSC; Ohba M., unpublished
31 Btt
BI256-82
tenebrionis Prof. Klaus Geider, Max Planck Institute, Germany; Rhim et al. (1990)

33
Btt local isolate Local isolate, Prof. Dr. Zihni Demirba�, Department of Biology, KTÜ.
E. coli DH5α F’φdlacZ∆(lacZYA-argF)U169 supE44λ-
thi-1 gyrA recA1 relA1 endA1
hsdR17
American Type Culture Collection; Hanahan (1983)
Bacillus subtilis
168; standard strain
trpC2, thyA1, thyB1
Dr. Daniel Zeigler; BGSC
Plasmids pGEM-T Ampr
lacZ’ Promega
pNW33N Cmr BGSC (E. coli strain ECE136)
*ND: Not Determined
2.2. Culture Media The composition and the preparation of the culture media are given in Appendix A.
2.3. Buffers and Solutions Buffers, solutions, their composition and preparation are listed in Appendix B.
2.4. Chemicals and Enzymes The chemicals and the enzymes used and their suppliers are listed in Appendix C.
2.5. Growth Curves
0,5 mL of overnight culture was used to inoculate 50 mL of Difco’s sporulating
medium in a 250 mL Erlenmayer flask. The culture was incubated at 30 °C by
shaking for 72 h at 200 rpm. Inoculation time was considered as time zero. Samples
were taken from the culture at two hour intervals and used for quantitative
determination of growth which was measured spectrophotometrically as absorbance
600 nm. Viable counts were also made and cell concentrations were determined

34
as ‘Colony Forming Units/mL’ (CFU/mL).
2.6. Determination of Sporulation Frequency
The samples were taken from the bacterial cultures grown in DSM by shaking at 30
°C. 1 mL aliquots of the cultures were serially diluted in tubes containing
physiological saline solution. Colony forming units were determined after overnight
incubation of inoculated Nutrient agar plates with prescribed volume of the diluted
tubes at 30 °C. For spore count, the tubes were heated at 75 °C for 15 min in a
waterbath, were cooled, dilutions were placed onto Nutrient agar plates and
incubated at 30 °C for 16 h. Sporulation frequency was expressed in terms of the
ratio of the numbers of heat-resistant spores per mL to the ratio of the number of
viable cells per mL (Özcengiz and Alaeddino�lu, 1991).
2.7. Protein Extraction
A slightly modified procedure of Armelle (1991) was used for protein extraction.
5-10 mL of 72 h cultures were centrifuged at 4 000 rpm for 20 min. The pellet
was resuspended in 500 µL of 1M NaCl. This mixture was transferred into an
Eppendorf tube and centrifuged at 7 000 rpm for 7 min. The pellet was
resuspended in 250 µL of TE buffer (Appendix B) and centrifuged at 7 000 rpm
for 7 min. The last step was repeated after which the pellet was resuspended in a
250 µL dH2O to obtain a homogenous suspension. 150 µL of 10 mg.mL-1
lysozyme solution in TE buffer was added and the suspension was incubated at 37
°C for 30 min. 25 µL of 10% SDS solution was added into the suspension and
then the tube was vortexed for 30 sec. It was centrifuged at 6 000 rpm for 10 min
and 100 µL of 0.2 % SDS solution was added to the pellet. For denaturation, 40
µL of the protein sample was mixed in an Eppendorf tube with 10 µL gel loading
buffer (Appendix B). This sample was incubated at 90 °C for 7 min. for three
times and placed onto ice until it cools. The final native and denatured samples

35
were stored at – 20 °C.
2.8. Determination of Protein Concentration
Protein concentrations were measured by the Bradford quantification method
(1976). The assay is based on the observation that the absorbance maximum for an
acidic solution of Coomassie Brilliant Blue G-250 at 595 nm when binding to
protein occurs. Assay reagent was made by dissolving 100 mg of Coomassie Blue
G250 in 50 mL of 95 % ethanol. The solution was then mixed with 100 mL of
85% phosphoric acid and made up to 1 L with distilled water. The reagent was
filtered through Watman No. 1 filter paper. Bovine serum albumin (BSA) was
used as the standard for preparation of protein calibration curve. Volumes of 10,
15, 20, 30 and 50 µL of 1 mg.mL-1 standard protein, BSA were added to tubes and
volumes were adjusted to 500 µL with water. 500 µL of distilled water was added
into a tube as reagent blank. 4.5 mL of assay reagent was added to each tube and
mixed gently, but thoroughly. A standard curve of absorbance versus micrograms
protein was prepared and the amounts of proteins were determined from the curve.
2.9. SDS-Polyacrylamide Gel Electrophoresis
Proteins were separated by using a vertical polyacrylamide gel apparatus.
Electrophresis was run at 20 mA at the beginning until the samples reached to the
separating gel, then the current was increased to 40 mA and the electrophoresis
was continued until the loading dye reached to the end of the gel.

36
The SDS-polyacrylamide gels were prepared as described below (Laemmli, 1970):
Stacking Gel
0.125 M Tris,
pH 6.8
Separating Gel
0.375 M Tris,
pH 8.8
Monomer concentration 4.5% 12%
Acrylamide/bis
dH2O
1.5 M Tris-HCl, pH 8.8
0.5 M Tris-HCl, pH 6.8
10% (w/v) SDS
10% Ammonium persulphate (fresh)
TEMED
1.3 mL
6.1 mL
-
2.5 mL
100 µL
50 µL
10 µL
4mL
3.35 mL
2.5mL
-
100 µL
50 µL
5 µL
TOTAL MONOMER 10 mL 10 mL
2.10. Staining of the SDS-Polyacrylamide Gel
2.10.1. Coomassie Blue R-250 Staining
Proteins were visualized by Coomassie Blue R-250 staining of the gels. After
electrophoresis, the gel was soaked in 200 mL of freshly prepared Coomassie blue
stain (Appendix B) for 1 h at room temperature. The gel was then destained by
keeping it in destaining solution (Appendix B) for at least 24 h.

37
2.10.2. Silver Staining Method
Silver staining was performed as described below (Blum et al., 1987):
Step Solution Time of Treatment
Fixation 50 % Methanol
12 % Acetic Acid
0.05 % Formaldehyde
1 h
Washing 50 % Ethanol 3X 20 min
Pre-treatment 0.29 g.L-1 Na2S2O3 1 min
Rinsing dH2O 2X 20 sec
Impregnation 2 g.L-1AgNO3
0.75 mL Formaldehyde
20 min
Rinsing dH2O 2X 20 sec
Development 60 g.L-1 Na2CO3
0.5 mL Formaldehyde
4 mg.L-1 Na2S2O3
1- 10 min
Rinsing dH2O 2X 20 sec
Stop 50 % Methanol
12 % Acetic Acid
10 min
Storage 50 % Methanol -
2.11. Protein Quantification
Gels were photographed by Vilber Lourmat Gel Imaging System and amount of
the proteins were detected by Bio-Profile Image Analysis Software (Vilber
Lourmat).

38
2.12. DNA Techniques and Manipulations
2.12.1. Total DNA Isolation
Procedure of Cutting and Horn (1990) was used for total DNA isolation. 1.5 mL
of an overnight culture was centrifuged at 13 000 rpm for 5 min, the pellet was
resuspended in 567 µL TE buffer by pipetting. 30 µL of proteinase K (20 mg.mL-
1), 6 µL of RNase (10 mg.mL-1), 24 µL of lysozyme (100 mg.mL-1) and 30 µL of
10 % SDS were added and this mixture was incubated at 37 °C for 1 h. 100 µL of
5 M NaCl was added and the tube contents were mixed throughly. Then 800 µL of
CTAB/NaCl solution was added and the mixture was incubated at 65 °C for 10
min. The sample was extracted with the same volume of
phenol/chloroform/isoamylalcohol (25/24/1) and centrifuged at 13 000 rpm for 10
min. The upper phase was transferred to a new Eppendorf tube to which 0.7
volume of isopropanol was added, mixed and centrifuged for 15 min. The
resulting pellet was washed with 1 mL of 70 % ethanol by centrifugation for 5
min. Then it was dried at 37 ° C for 1 h and dissolved in 20 µL of TE buffer.
2.12.2. Plasmid Isolation from Bacillus spp.
Plasmid DNA was isolated by using the method which was described by Birnboim
and Doly (1979). Bacterial strains were grown in Luria broth at 30° C by shaking for
16 h. 1 mL of such an overnight culture was added to 20 mL LB and incubated by
shaking at 30° C until OD600 becomes 1.0. 5 mL portions of the resulting culture are
centrifuged at 4 000 rpm for 10 min. Supernatant is removed and 200 µL of solution
I (TGE buffer, pH 8, lysozyme 10 mg.mL-1, RNase 10 mg.mL-1) was added to the
pellet which was kept at room temperature for 30 min. For E. coli V517, final
lysozyme concentration was 2 mg.mL-1 in Solution I. The mixture was transferred to
an Eppendorf tube after which 200 µL of Solution II (0.1 N NaOH + 1 % SDS) was
added. The tube was kept on ice for 7 min followed by the addition of 155 µL of
Solution III (K-acetate pH 4.8-5). After incubation for 20 min on ice, the mixture

39
was centrifuged at 13 000 rpm for 15 min and the supernatant was transferred into a
new Eppendorf tube. 400 µL of phenol/chloroform/isoamylalcohol (in a ratio of
25/24/1, respectively) was added, mixed gently and the tube contents were
centrifuged at 13 000 rpm for 12 min. The upper phase was collected and
phenol/chloroform/ isoamylalcohol extraction was repeated. 2 volumes of 99 %
ethanol and 1/ 10 volume of K-acetate added to the resulting aqueous phase which
was then mixed gently for a min and incubated at -20 °C for an hour. After
centrifuging at 13 000 rpm for 30 min, the supernatant was discarded and 1 mL of 80
% ethanol was added to the pellet and the solution was centrifuged at 13 000 rpm for
30 min. The pellet was allowed to dry in a laminar hood and the pellet was dissolved
in 20 µL TE buffer. 12 µL of dH2O and 4 µL of loading buffer were added before
agarose gel electrophoresis. When plasmid DNA of more than one strains are to be
isolated, the same concentration of DNA were applied to the gel. DNA
concentrations of different samples were equalized before applying to the gel. The
following formula was used to determine DNA concentration:
A260 � Dilution Factor � 50 = DNA concentration (µg.mL-1)
2.12.3. Plasmid Isolation from E. coli
Qiagen Plasmid Purification Mini and Midi Kits (Qiagen Inc., Valencia, CA) were
used for isolation of E. coli plasmid DNA as specified by the manufacturers. E. coli
plasmid DNA was also prepared by the plasmid miniprep method described by
Hopwood et al. (1985). Each strain was grown as a patch on selective medium, LB
agar containing 100 �g.mL-1 ampicillin. About 1 square cm of cell mass was scraped
with a sterile toothpick and put into Eppendorf tube containing 100 �L cold STE
solution containing 2 mg.mL-1 lysozyme (Appendix B). Each tube was mixed by
vortexing to disperse the cells and the toothpick was discarded. Then, the tubes were
incubated on ice for 20 minutes. 3/5 volume of lysis solution (Appendix B) was
added to each tube and vortexed immediately. The mixture was incubated at room
temperature for 10 minutes to lyse the cells and then at 70 ˚C for 10 minutes to
denature DNA. Then, tubes were cooled rapidly in cold water. An equal amount of
phenol-chloroform (water saturated, Appendix B) was added, vortexed hard until

40
homogeneous and milky white mixture was obtained. Finally, the samples were
spinned for 5 minutes at 13 000 rpm to separate phases. 10 �L of supernatant was
loaded directly on an agarose gel for electrophoresis.
2.12.4. Primer Design
For amplification of cry3Aa gene of the Btt local isolate, the primers were
designed according to the nucleotide sequence of cry3Aa gene of Btt strain NB176
and Bt LM79 (the Gene Bank acsession numbers U10985 and L03393,
respectively).
The primer design was made to include the promoter region for further expression of
the gene. The regions for which the primers were designed are shown in Figure 2.2.
The nucleotide sequences of the primers are shown in Table 2.2. Restriction enzyme
sites, SacI and KpnI, for c3AKF and c3AKR respectively, were included in the 5′
region of the primers for cloning into pNW33N (underlined bases in Table 2.2). The
primers were synthesized by the Iontek Company (�stanbul, Turkey).
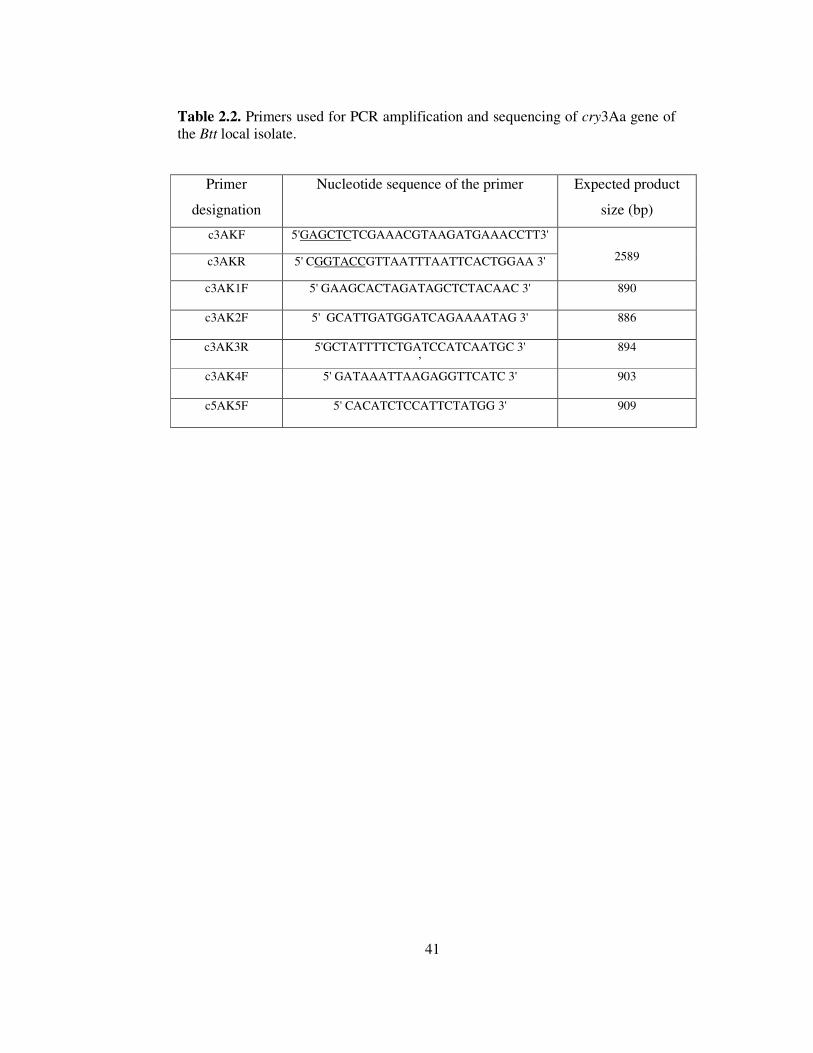
41
Table 2.2. Primers used for PCR amplification and sequencing of cry3Aa gene of the Btt local isolate.
Primer
designation
Nucleotide sequence of the primer Expected product
size (bp)
c3AKF 5'GAGCTCTCGAAACGTAAGATGAAACCTT3'
c3AKR 5' CGGTACCGTTAATTTAATTCACTGGAA 3'
2589
c3AK1F 5' GAAGCACTAGATAGCTCTACAAC 3'
890
c3AK2F 5' GCATTGATGGATCAGAAAATAG 3'
886
c3AK3R 5'GCTATTTTCTGATCCATCAATGC 3' ’
894
c3AK4F 5' GATAAATTAAGAGGTTCATC 3'
903
c5AK5F 5' CACATCTCCATTCTATGG 3'
909

42
c3AKF
5’…tcgaaac gtaagatgaa accttagata aaagtgcttt ttttgttgca attgaagaat tattaatgtt
aagcttaatt aaagataata tctttgaatt gtaacgcccc tcaaaagtaa gaactacaaa aaaagaatac
gttatataga aatatgtttg aaccttcttc agattacaaa tatattcgga cggactctac ctcaaatgct
tatctaacta tagaatgaca tacaagcaca accttgaaaa tttgaaaata taactaccaa tgaacttgtt
catgtgaatt atcgctgtat ttaattttct caattcaata tataatatgc caatacattg ttacaagtag
aaattaagac acccttgata gccttactat acctaacatg atgtagtatt aaatgaatat gtaaatatat
ttatgataag aagcgactta tttataatca ttacatattt ttctattgga atgattaaga ttccaataga
atagtgtata aattatttat cttgaaagga gggatgccta aaaacgaaga acattaaaaa catatatttg
caccgtctaa tggatttatg aaaaatcatt ttatcagttt gaaaattatg tattatgata agaaagggag
gaagaaaaat gaatccgaac aatcgaagtg aacatgatac aataaaaact actgaaaata atgaggtgcc
aactaaccat gttcaatatc ctttagcgga aactccaaat ccaacactag aagatttaaa ttataaagag
tttttaagaa tgactgcaga taataatacg gaagcactag atagctctac aacaaaagat gtcattcaaa
aaggcatttc cgtagtaggt gatctcctag gcgtagtagg tttcccgttt ggtggagcgc ttgtttcgtt
ttatacaaac tttttaaata ctatttggcc aagtgaagac ccgtggaagg cttttatgga acaagtagaa
gcattgatgg atcagaaaat agctgattat gcaaaaaata aagctcttgc agagttacag ggccttcaaa
ataatgtcga agattatgtg agtgcattga gttcatggca aaaaaatcct gtgagttcac gaaatccaca
tagccagggg cggataagag agctgttttc tcaagcagaa agtcattttc gtaattcaat gccttcgttt
gcaatttctg gatacgaggt tctatttcta acaacatatg cacaagctgc caacacacat ttatttttac
taaaagacgc tcaaatttat ggagaagaat ggggatacga aaaagaagat attgctgaat tttataaaag
acaactaaaa cttacgcaag aatatactga ccattgtgtc aaatggtata atgttggatt agataaatta
agaggttcat cttatgaatc ttgggtaaac tttaaccgtt atcgcagaga gatgacatta acagtattag
atttaattgc actatttcca ttgtatgatg ttcggctata cccaaaagaa gttaaaaccg aattaacaag
agacgtttta acagatccaa ttgtcggagt caacaacctt aggggctatg gaacaacctt ctctaatata
gaaaattata ttcgaaaacc acatctattt gactatctgc atagaattca atttcacacg cggttccaac
caggatatta tggaaatgac tctttcaatt attggtccgg taattatgtt tcaactagac caagcatagg
atcaaatgat ataatcacat ctccattcta tggaaataaa tccagtgaac ctgtacaaaa tttagaattt
aatggagaaa aagtctatag agccgtagca aatacaaatc ttgcggtctg gccgtccgct gtatattcag
gtgttacaaa agtggaattt agccaatata atgatcaaac agatgaagca agtacacaaa cgtacgactc
aaaaagaaat gttggcgcgg tcagctggga ttctatcgat caattgcctc cagaaacaac agatgaacct
ctagaaaagg gatatagcca tcaactcaat tatgtaatgt gctttttaat gcagggtagt agaggaacaa
tcccagtgtt aacttggaca cataaaagtg tagacttttt taacatgatt gattcgaaaa aaattacaca
acttccgtta gtaaaggcat ataagttaca atctggtgct tccgttgtcg caggtcctag gtttacagga
ggagatatca ttcaatgcac agaaaatgga agtgcggcaa ctatttacgt tacaccggat gtgtcgtact
ctcaaaaata tcgagctaga attcattatg cttctacatc tcagataaca tttacactca gtttagacgg
ggcaccattt aatcaatact atttcgataa aacgataaat aaaggagaca cattaacgta taattcattt
aatttagcaa gtttcagcac accattcgaa ttatcaggga ataacttaca aataggcgtc acaggattaa
gtgctggaga taaagtttat atagacaaaa ttgaatttat tccagtgaat taaattaact…3’
c3AKR
Figure 2.2. Nucleotide sequence of cry3Aa6 gene of Btt NB176. Arrows show the regions where the primers bind and the bold letters show start and stop codons. The 67 bases in box corresponds to the promoter of Bt LM79 and was included to ensure gene expression.

43
2.12.5. Polymerase Chain Reaction (PCR)
PCR reaction mixtures contained 28 µL of dH2O, 5 µL 10 x PCR Mg 2+ buffer, 50
pmols of each primers, 5 µL of 2 mM dNTP, 0.5 µg genomic DNA and 3 unit
(1µL) Taq polymerase. PCR for the amplification of cry3Aa gene was carried out
in 35 cycles: 1 min at 94 °C, 1 min at 63 °C and 3 min at 72 °C. The initial
denaturation was carried out at 94 ° C for 10 minutes. The final extension was
performed as 10 min at 72 °C.
Reaction mixtures were run in a 0.8 % agarose gel. PCR products were extracted
from the gel as mentioned in Section 2.12.8.
2.12.6. Agarose Gel Electrophoresis
A horizontal apparatus was used for agarose gel electrophoresis. Agarose gels were
prepared at concentrations of 0.6-1 % in 1X TAE buffer. The gels containing
ethidium bromide at a final concentration of 0.5 µg.mL-1 were run for 1-2 h at 90
Volt. The DNA bands were visualized on a UV transilluminator (UVP) and
photographed by using Vilber Lourmat Gel Imaging System. PstI digested/� DNA
marker (Appendix C) was used to determine the molecular weights of DNA bands.
Molecular weights of the plasmids were determined by using the plasmids of E. coli
V517 as the standards.
2.12.7. Restriction Endonuclease Digestion
Restriction enzymes (SacI and KpnI) were added in a suitable buffer to the DNA
samples to introduce 1 Unit of each enzyme per µg of DNA. The mixture was
incubated at 37 °C for 4-5 h.

44
2.12.8. Extraction of Digested DNA Fragments/PCR Products from Agarose
Gels
After separation of DNA fragments/PCR products usually in agarose gels, the
desired fragments were extracted from the gel by using a Qiaquick Gel Extraction kit
(Qiagen Inc., Valencia, CA). The gel slice containing the DNA band was excised
from the gel and weighed. DNA in such gel slices was recovered according to the
Qiagen’s instructions. After recovery, an aliquot was run on an agarose gel to assess
the yield.
2.12.9. Ligation Reaction
Ligation of PCR products with pGEM-T vector was performed as follows: 5 µL 2�
ligase buffer, 0.5 µL (50 ng/µL) pGEM-T vector, 400 ng insert DNA, 1 µL T4 DNA
Ligase (3 unit/µL) were mixed. Sterile dH2O was added to the mixture to complete
total volume up to 10 µL. Before the addition of t4DNA ligase, the ligase buffer,
ligase vector and insert DNA mixture were incubated at 45 ˚C for 10 min in a
waterbath followed by incubation on ice for 5 min. Lastly, the mixture was incubated
overnight at 16 ˚C. for ligation. The same ligation reaction procedure was used for
ligation of cry3Aa gene to pNW33N by using an appropriate vector insert ratio.
2.13. Transformation
2.13.1 Preparation of E. coli Competent Cells
E. coli competent cells were prepared according to the protocol described by
Sambrook et al. (1989) with slight modifications. In a 250 mL flask, 5- 50 mL of LB
broth (Appendix A) was inoculated with E. coli from a fresh LB agar plate and
incubated overnight with shaking at 37 ° C to obtain a stationary phase culture. 300
µL from this seed culture was inoculated into a fresh flask containing 50 mL LB
broth. The culture was incubated for 2- 2.5 h at 37 ° C with vigorous shaking (300
rpm) in an orbital shaker to obtain an exponentially growing culture. Then the culture
was split into two sterile pre-chilled 40 mL screwcap centrifuge tubes asepticaly and

45
stored on ice for 10 minutes. After centrifuging at 4000 rpm for 10 minutes at 4 °C,
supernatants were decanted and each pellet was resuspended in 5 mL of ice-cold 10
mM CaCl2 by vortexing. The cells were spun down at 3000 rpm for 10 minutes at 4
°C. Finally, supernatants were decanted and each pellet was resuspended gently in 1
mL ice-cold 75 mM CaCl2. The competent cells were stored at – 80 °C.
2.13.2. Transformation of E. coli Competent Cells
A slightly modified procedure of Sambrook et al. (1989) was used for transformation
of E.coli competent cells. 200 µL aliquots of E. coli competent cells were taken from
-80 °C and kept on ice for 15 min. 100 µL of this was transferred to a prechilled
Eppendorf tube. Appropriate amount of DNA (1- 50 ng) in a maximum volume of 10
µL was added and mixed gently by pipetting. The tubes were left on ice for 30
minutes. Then, the tubes were placed in a 42 °C waterbath and heatpulsed for 90
seconds. Next, the tubes were immediately put on ice for 5 minutes. 900 µL of LB
broth was added to each tube and the cultures were incubated for 80 min at 37 °C
with gentle shaking (180-200 rpm). The incubated cultures were microfuged at 4
000-5 000 rpm for 10 min to collect the cells. Supernatant was decanted and the
pellet was resuspended 100 µL of sterile LB. Finally, the suspension containing 100
µL of transformed competent cells were spread onto selective LB agar plate and
incubated at 37 °C for overnight.
2.13.3. Preparation of B. subtilis Competent Cells and Transformation
Transformation of B. subtilis competent cells were performed as described
previously (Klein et al.,1992). 3 mL of overnight culture was prepared in HS
medium (Appendix A) by incubation at 37 �C and shaking at 350 rpm. 0.5 mL of it
was then transferred into 20 mL of LS medium (Appendix A) and incubated at 30
°C with shaking at 100 rpm until OD600 becomes 0.55. Next, 1 mL of competent cells
was transferred into 2 mL of Eppendorf tube and 1 µg of DNA was added. Cells
were then incubated at 37 °C for 2 h with shaking at 350 rpm and were collected by
centrifugation. Cells were resuspended in 100 µL of sterile saline solution and plated
out onto selective LB agar plates and incubated at 37 °C for 16 h.

46
2.14. Sequencing Reactions
DNA sequencing was carried out at �ontek Company (�stanbul, Turkey) by using the
chain termination method with dye-labelled dideoxy terminators of Thermo
Sequenase II Dye Terminator Cycle Sequencing Kit (Amersham).
Forward and reverse primers that were designed for sequencing of cry3Aa gene of
the Btt local isolate were listed in Table 2.2. Deduced nucleotide and amino acid
sequence data were compared with the National Center for Biotechnology
Information (NCBI) database using the BLAST search at the web site
(http://www.ncbi.nlm.nih.gov/BLAST).

47
CHAPTER 3
RESULTS AND DISCUSSION
3.1. Growth, Sporulation and Toxin Yield of the Local Isolate of Bacillus
thuringiensis subsp. tenebrionis in C2 medium
As a preliminary study, the growth curve of the Btt local isolate was obtained by
incubating the cells (30 °C, 200 rpm) for three days. C2 medium which was used for
cultivation of Btt in most of the previous studies, (Donovan et al., 1988; Slaney et
al., 1992; Malvar et al., 1994; Von Tersch et al., 1994; Carroll et al., 1997) was
preferred for the cultivation of the organism in our preliminary experiments.
Figure 3.1. Growth of the Btt local isolate in C2 medium.
0
0,4
0,8
1,2
1,6
2
0 4 8 12 16 20 24 28 32 36 40 44 48 52 56
Time (h)
AB
S 60
0

48
As shown in Figure 3.1, the culture of the isolate entered stationary phase after 8 h of
exponential growth, indicating that the t0 of the sporulation corresponds to the 8th h
of incubation. Cry3Aa is 64-68 kDa polypeptide formed after proteolytic cleavage of
55-57 amino acids from N-terminus of 73 kDa protoxin by endogenous proteases
during sporulation (Hernstadt et al., 1986; McPherson et al., 1988). Time-dependent
protein profile of the isolate on an SDS-PAGE gel is shown in Figure 3.2. It was
observed that the amount of a 65 kDa protein corresponding to Cry3Aa increased
with time, reaching to its highest level at 72nd h of incubation.
M 1 2 3
Figure 3.2. Silver-stained SDS-PAGE showing the protein profile of the isolate when grown in C2 medium for three days. Lane 1: Cry3Aa production at 24th h of incubation, Lane 2: Cry3Aa production at 48th h of incubation, Lane 3: Cry3Aa production at 72nd h of incubation.
← Cry3Aa
116 kDa → 66.2 kDa →
45 kDa →
35 kDa →
25 kDa → 18.4 kDa → 14.4 kDa →

49
3.2. Selection of the Most Appropriate Growth Medium
Choosing a standard growth medium that favors toxin biosynthesis by the Btt isolate
was necessary for playing with medium ingredients for a better production. For this
purpose, the organism was grown in four different standard media, namely C2, DSM,
GYS and HCT for five days and samples were taken from each culture at 24 h
intervals. Proteins were extracted and protein profiles were determined by SDS-
PAGE analysis. Prescribed incubation times were 48 h for HCT (Lecadet et al.,
1980; Arantes and Lereclus, 1991), approximately five days for DSM and GYS
(Donovan et al., 1992; Park et al., 1998) and three to four days for C2 (Donovan et
al., 1988; Von Tersch et al., 1994), respectively. Yet, the incubation time was kept as
five days (120 h) for all types of media. It was found that both the time of appearance
of Cry3Aa protein and its production level greatly varied in these media (Figure 3.3).
M 1 2 3 4 5 6 7 8 9 10 11 12 13 14 15 16 17 18 19
Figure 3.3. Cry3A production by the Btt isolate when grown in different media. Lane M: Protein molecular weight marker, Lanes 1, 4, 8, 12, 16: HCT medium. Lanes 5, 9, 13, 17: GYS medium, Lanes 2, 6, 10, 14, 18: DSM, Lanes 3, 11, 15, 19: C2 medium.
←←←← Cry3Aa
24 h 48 h 72 h 96 h 120 h
66.2 kDa →→→→
50
HCT and GYS media were not suitable at all for Cry3Aa production. GYS medium
is the poorest one in its nutrient content, containing only 0.1% glucose and 0.2%
yeast extract+0.02% ammonium sulphate as the carbon and nitrogen sources and it
even did not permit any growth within 24 h. In this medium, Cry3Aa protein
appeared as a very thin band only at the end of 120 h fermentation. With its 0.7%
casein hydrolysate and 0.3% glucose content, HCT medium supported growth much
better than GYS medium, yet toxin protein could not be detected during 120 h
incubation in this medium. DSM appeared to be the best one for an early onset of
Cry3Aa biosynthesis as well as its high yields. The organism produced some toxin in
this medium even at 24th h of incubation, its biosythetic capacity increased with time
and lasted throughout the course of incubation. When grown in C2 medium, toxin
yields were much lower than that in DSM except for 120th h when the amounts of
toxins produced in two media appeared almost equal.
When we compare the ingredients of DSM and C2, the latter contains at least 2 times
more nutrients which might have accounted for less toxin yields by causing some
kind of repression. The growth and sporulation patterns in these two media were next
compared. Growth was monitored both by performing viable cell count and OD
measurements at 600 nm (Figure 3.4 a,b). While the rate and extent of growth of the
organism in these media did not much differ, it sporulated more effectively in DSM
especially between 12 to 48 h (Figure 3.4 c,d). Cry3Aa levels as a function of time in
these media were compared in another set of experiment to test the reproducibilty of
the results shown in Figure 3.3. The results confirmed that DSM supports toxin
synthesis much better (Figure 3.5). Therefore, for the rest of the study, DSM and 72
h were chosen as the standard medium and incubation time, respectively.

51
Figure 3.4 a Growth of the Btt isolate in DSM and C2 media.
Figure 3.4 b Viable cell count of the Btt isolate in DSM and C2 media.
0
2,4
4,8
7,2
9,6
12
0 12 24 36 48 60 72 84 96 108 120
Time (h)
Lo
g C
FU
/mL
(♦) DSM
(�) C2
(♦) DSM
(�) C2

52
Figure 3.4 c Spore count of the Btt isolate in DSM and C2 media.
Figure 3.4 d Sporulation frequency of the Btt isolate in DSM and C2 media.
(♦) DSM
(�) C2
0
0,1
0,2
0,3
0,4
0,5
0,6
0,7
0,8
0,9
1
12 24 33 48 58 72 83 96 120
Time (h)
Spo
rula
tion
fre
quen
cy
(S/V
)
DSM
C2
0
2,4
4,8
7,2
9,6
12
0 12 24 36 48 60 72 84 96 108 120
Time (h)
Log
spo
res/
mL

53
M C/24 C/48 C/72 C/96 C/120 D/24 D/48 D/72 D/96 D/120
Figure 3.5. Another comparison between Cry3Aa levels as the function of time in DSM and C2 media C: C2 medium D: DSM. The numbers refer to incubation time in h.
3.3. Optimization Studies
Environmental factors play a critical role in modulating differentiation pattern and
synthesis of toxins which form a distinct group of secondary metabolites and thus
their synthesis has considerably narrower tolerances for concentrations of specific
trace metals and inorganic phosphate (Weingberg, 1974; Bhatnagar, 1999). Also, the
generality of repression or inhibition of secondary metabolism by catabolism of
rapidly utilized carbon sources, especially glucose (carbon catabolite regulation) and
nitrogen sources, especially ammonium, (nitrogen catabolite regulation) is well
illustrated (Demain, 1995). In general, conditions for the culture of Bt are optimized
to achieve both high cell densities and high sporulation rates. In this attempt, a
careful balance of substrates must be provided to avoid high cell densities with little
or no sporulation (Bernhard and Utz, 1993). Nevertheless, it has also been reported
← Cry3Aa 66.2 kDa→

54
that a high spore count is not sufficient to ensure good toxicity (Rossa and Mignone,
1993).
In striking contrast with commercial and scientific interest focused on anti-
Coleopteran subspecies of Bt is the lack of adequate information on various aspects
of Cry3Aa toxin production by the organism in the published literature. It was this
focal point that led us to investigate the most crucial cultural parameters for a typical
Btt batch fermentation to achieve high toxin titers.
3.3.1. Effects of Carbon Sources
DSM, the selected standard medium for optimization studies, contains glucose as its
sugar complement. In our previous studies, the replacement of glucose with sucrose
better supported the formation of Cry1, Cry4Ba and Cry11Aa toxins (�çgen et al.,
2002b; Özkan et al., 2003). To reveal if sucrose had a positive effect also on Cry3Aa
synthesis, the local Btt isolate was grown in DSM media containing different
concentrations of glucose and sucrose (5 g.L-1; 7.5 g.L-1; 10 g.L-1). As expected,
increased concentrations of both sugars increased growth (Figure 3.6 a,b) and
decreased sporulation (Figure 3.6 c,d).
Nevertheless, at the end of the 60 h incubation, the spore counts were almost
equalized in all cultures. Another observation was that the cultivation on 5 g.L-1
concentrations of either glucose or sucrose yielded more spores and a higher
sporulation frequency was obtained in sucrose containing medium especially at 24th h
of incubation.

55
Figure 3.6 a Growth of the isolate on different glucose and sucrose concentrations. (∗) Glucose, 5 g.L-1. (�) Glucose, 7.5 g.L-1 (�) Glucose, 10 g.L-1
(�) Sucrose, 5 g.L-1 (•) Sucrose 7.5 g.L-1 (�) Sucrose 10 g.L-1 .
Figure 3.6 b Viable cell count when grown on different glucose and sucrose concentrations. (�) Glucose, 5 g.L-1 (�) Glucose, 7.5 g.L-1
(�) Glucose, 10 g.L-1 (∗)
Sucrose, 5 g.L-1 (∗) Sucrose 7.5 g.L-1 (•) Sucrose 10 g.L-1.

56
Figure 3.6 c Effects of different glucose and sucrose concentrations on spore counts. (∗) Glucose, 5 g.L-1 (�) Glucose, 7.5 g.L-1 (�) Glucose, 10 g.L-1 (�) Sucrose, 5 g.L-1
(•) Sucrose, 7.5 g.L-1 (�) Sucrose, 10 g.L-1.
0
0,1
0,2
0,3
0,4
0,5
0,6
0,7
0,8
0,9
1
24 48 58 72 96
Time (h)
Spo
rula
tion
fre
quen
cy (
S/V
)
Figure 3.6 d Sporulation frequency of the isolate when grown on different concentrations of glucose and sucrose. (�) 5 g.L-1 glucose, (�) 7.5 g.L-1 glucose, (�)
10 g.L-1 glucose, (�) 5 g.L-1 sucrose, (�) 7.5 g.L-1 sucrose, (�) 10 g.L-1 sucrose.
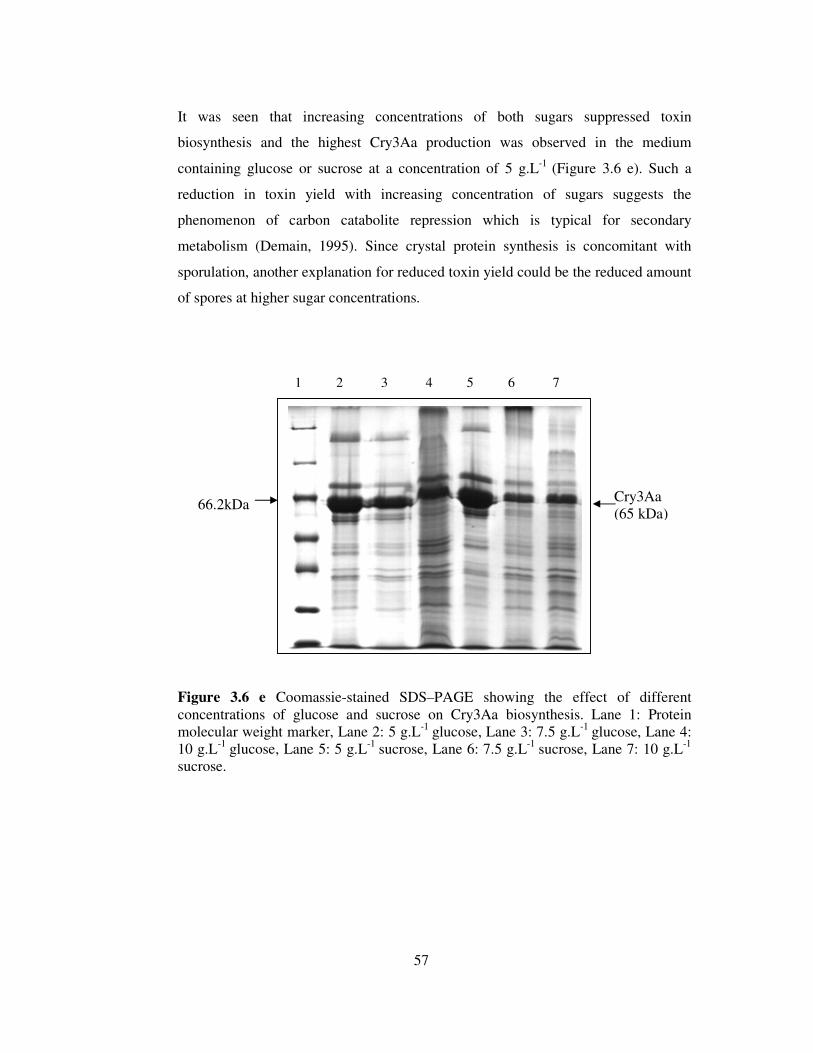
57
It was seen that increasing concentrations of both sugars suppressed toxin
biosynthesis and the highest Cry3Aa production was observed in the medium
containing glucose or sucrose at a concentration of 5 g.L-1 (Figure 3.6 e). Such a
reduction in toxin yield with increasing concentration of sugars suggests the
phenomenon of carbon catabolite repression which is typical for secondary
metabolism (Demain, 1995). Since crystal protein synthesis is concomitant with
sporulation, another explanation for reduced toxin yield could be the reduced amount
of spores at higher sugar concentrations.
Figure 3.6 e Coomassie-stained SDS–PAGE showing the effect of different concentrations of glucose and sucrose on Cry3Aa biosynthesis. Lane 1: Protein molecular weight marker, Lane 2: 5 g.L-1 glucose, Lane 3: 7.5 g.L-1 glucose, Lane 4: 10 g.L-1 glucose, Lane 5: 5 g.L-1 sucrose, Lane 6: 7.5 g.L-1 sucrose, Lane 7: 10 g.L-1
sucrose.
1 2 3 4 5 6 7
Cry3Aa (65 kDa)
66.2kDa

58
3.3.2. Effects of Inorganic Phosphate and Different Nitrogen Sources
Phosphate is considered to be essential for protein expression and also critical for cell
growth, thus its concentration varies during the toxin-formation phase (Yang and
Wang, 2000). Inorganic nitrogen compounds, such as ammonium sulphate are not
usually sufficient to support the growth of Bt (Bulla et al., 1980; Arcas et al., 1984)
and organic nitrogen sources such as meat peptone, fish meal and soybean flour are
required for rapid growth (Yang and Wang, 2000). Besides this, the depletion of
nitrogen sources induces the formation of δ-endotoxins (Yang and Wang, 1998).
Zourai et al. (2002) investigated the production of δ- endotoxins of several Bt strains
in gruel-based media and found that the toxin production varied a lot depending on
the Bt strains, however a general increase was seen in toxin production.
Figure 3.7. Growth of the Btt isolate in DSM with different inorganic phosphate concentrations. (�) 5 mM, (�) 20 mM, (∗) 50 mM [control], (�) 100 mM, (•) 200 mM.
To screen the effects of inorganic phosphate on growth, sporulation and Cry3Aa
biosynthesis, our Btt isolate was grown in DSM containing different concentrations

59
of inorganic phosphate ranging from 5 mM to 200 mM. As shown in Figure 3.7,
growth was the best at 20 mM and slightly decreased at a high inorganic phosphate
concentration of 200 mM.
Nutrient broth in DSM (0.4 g.L-1) was replaced with urea plus soybean flour, urea
plus casamino acids, ammonium sulphate plus soybean flour and ammonium sulphate
plus casamino acids (each 0.2 g.L-1) to determine the effects of different inorganic
and organic nitrogen sources on growth, sporulation and Cry3Aa production.
However, except for ammonium sulphate plus casamino acids combination, each
combination of nitrogen sources resulted in a poorer growth as compared with the
growth in control medium (Figure 3.8).
Figure 3.8. Growth of Btt strain with different combinations of inorganic nitrogen sources. (∗) Nutrient Broth in DSM [Control], (•) Urea + Casamino acids, (�) Urea + Soybean flour, (�)Ammonium sulphate + Casamino acids, (�) Ammonium sulphate + Soybean flour.
Our results showed that Cry3Aa production significantly increased with increasing
concentrations of inorganic phosphate. As can be seen in Figures 3.9 and 3.10, the

60
toxin yield and the sporulation frequency were the highest at 200 mM (100 mM
K2HPO4+100 mM KH2PO4) inorganic phosphate concentrations. In this respect,
sporulation and toxin formation behaved quite consistently. SDS-PAGE analysis
indicated that inorganic phosphate was a crucial nutrient affecting anti-Coleopteran
Cry3Aa production. The positive effect of high inorganic phosphate concentrations
on crystal protein production was also documented for other subspecies of Bt in our
previous reports. Nonetheless, optimum production was generally obtained with 50-
100 mM inorganic phosphate for anti-Lepidopteran and anti-Dipteran δ-endotoxins
(�çgen et al., 2002 b; Özkan et al., 2003) and was never as high as 200 mM.
Figure 3.9. The effects of nitrogen sources and inorganic phosphate on sporulation. NB: Nutrient Broth in DSM [Control], AS: Ammonium sulphate, CA: Casamino acids, SF: Soybean flour, U: Urea, P: Inorganic phosphate.
Cry3Aa production was greatly reduced when different combinations of nitrogen
sources were replaced Nutrient broth in DSM. The most negative effect was exerted
by ammonium sulphate plus Casamino acids combination (Figure 3.10). Indeed, both

61
of the components were responsible for the negative effect seen since caused an
adverse effect when combined with eachother. On the other hand, sporulation was
better when the cells were grown in the modified media containing ammonium
sulphate (Figure 3.9).
Thus, there was no consistency between the levels of sporulation and toxin formation
for the nitrogen sources tested. For example, one of the most efficient sporulation
was achieved in the medium containing ammonium sulphate plus soybean flour as
nitrogen sources, however this did not lead to a good Cry3Aa protein production.
This finding provides further support to the claim of Rossa and Mignone (1993) and
Paramatha (2000) in that a high spore count is not always sufficient to ensure good
toxicity.
1 2 3 4 5 6 7 8 9 10
Figure 3.10. Cry3Aa biosynthesis on different nitrogen sources and different concentrations of inorganic phosphate. Lane 1: Protein molecular weight marker, Lane 2: 50 mM inorganic phosphate in DSM/Nutrient Broth in DSM [Control], Lane 3: 5 mM inorganic phosphate, Lane 4: 20 mM inorganic phosphate, Lane 5: 100 mM Inorganic phosphate, Lane 6: 200 mM inorganic phosphate, Lane 7: Urea + Casamino acids, Lane 8: Urea + Soybean flour, Lane 9: Ammonium sulphate + Casamino acids, Lane 10: Ammonium sulphate + Soybean flour.
66.2 kDa Cry3Aa

62
3.3.3. Effects of Different Concentrations of Mineral Elements
Faloci et al (1986) found that an adequate formulation of media was mainly related
with the content of Mn, Mg and Ca which were essential for obtaining high yields of
spore plus crystal production by Bacillus thuringiensis HD-1 strain. It is known that
the yields of δ-endotoxins are greatly influenced by trace metals and other minerals,
and in most cases it is not known whether the effect is a direct one or simply a
manifestation of sporulation (Özkan et al., 2003). The effects of three mineral
elements (FeSO4, MgSO4 and MnCl2) on growth, sporulation and Cry3Aa production
were next examined by varying their concentrations in the medium.
Figure 3.11. Growth of the Btt isolate in DSM with different MnCl2 concentrations of (�) 10-4 M, (∗) 10-5 M [control], (�) 10-6 M and (•) 10-7 M.
Varying MnCl2 concentration in DSM medium between 10-4 and 10-7 M did not
affect the growth of the cells remarkably (Figure 3.11). Toxin yield decreased
noticeably in the presence of 10-4 M MnCl2 and the highest Cry3Aa production was
observed with 10-5 to 10-7 M MnCl2 (Figure 3.15). In our previous study, 10-6 M
MnCl2 specifically favored Cry4Ba production by Bti (Özkan et al., 2003). This
concentration was also favorable for Cry3Aa production, but the effect was not as

63
remarkable as was found for Cry4Ba. It was previously reported that Mn is the most
important key metal co-regulating secondary metabolism and differentiation in
bacilli (Weinberg, 1977). The highest sporulation frequency was obtained with 10-5
M MnCl2, the concentration which is originally contained in DSM (Figure 3.14).
0
0,4
0,8
1,2
1,6
2
0 2 4 6 8 10 12 14 16
Time (h)
AB
S 6
00
Figure 3.12. Growth of the Btt isolate in DSM with different MgSO4 concentrations of (•) 5.10-2 M, (�) 5.10-3 M, (∗) 5.10-4 M [control] and (�) 5.10-5 M.
Our results showed that Cry3Aa production slightly decreased with increasing
concentrations of MgSO4. The highest toxin production was detected with 5�10-4 M
MgSO4, the amount originally found in DSM, and increasing or decreasing
concentrations adversely affected the production (Figure 3.15). The growth was
adversely affected by 10-2 M MgSO4 and sporulation frequency was also found to
decrease with increasing MgSO4 concentrations (Figures 3.12 and 3.15). In the study
of �çgen et al. (2002 a), high concentrations of MgSO4 decreased Lepidoptera-
specific Cry1 and Cry2 toxin productions by Bt 81. In contrast, increasing MgSO4
concentrations caused an increase in Cry 4Ba and Cry 11Aa production by Bt
israelensis (Özkan et al., 2003). It thus appears that, high MgSO4 levels affect toxin
production in a different way, depending on the subspecies and hence the type of
delta-endotoxin.

64
The onset of growth of our Btt isolate was delayed in a medium containing no FeSO4
(Figure 3.13). In such a condition, the cells must have used up only the iron provided
by the Nutrient broth complement of the medium. The concentration in the control
medium (10-5) was the optimal for sporulation and Cry3Aa biosynthesis (Figure 3.14
and 3.15) and as this concentration decreased or iron was omitted from the medium,
the levels of toxin also decreased.
Figure 3.13. Growth of the Btt isolate in DSM with different FeSO4 concentrations of (�) 0 M, (∗) 10-5 M [control], (•) 10-6 M and (�) 10-7 M.

65
00,10,20,30,40,50,60,70,80,9
1
MnC
l2 (1
.10-
7 M
)
MnC
l2 (1
.10-
6 M
)
MnC
l2 (1
.10-
5 M) [
cont
rol]
MnC
l2 (1
.10-
4 M
)
MgS
O4 (5.
10-5
M)
MgS
O4 (5.
10-4
M) [
cont
rol]
MgS
O4 (5.
10-3
M)
MgS
O4 (5.
10-2
M)
FeSO4 (
0 M)
FeSO4 (
1.10-
7 M)
FeSO4 (
1.10-
6 M)
FeSO4 (
1.10
-5 M
) [co
ntro
l]
Spo
rula
tion
fre
quen
cy(S
/V)
Figur 3.14. Effects of different concentrations of mineral elements on sporulation.
1 2 3 4 5 6 7 8 9 10
Figure 3.15. Effects of mineral ions on Cry3Aa biosynthesis at 72nd h of incubation. Lane 1: 1.10-4 M MnCl2, Lane 2: 10-6 M MnCl2, Lane 3: 10-7 M MnCl2, Lane 4: 10-
FeSO4, Lane 5: 10-7 M FeSO4, Lane 6: 0 M FeSO4, Lane 7: 5.10-2 M MgSO4, Lane 8: 5.10-3 M MgSO4, Lane 9: 5.10-5 M MgSO4, Lane 10: Control (5.10-4 M MgSO4, 10-5
M FeSO4, 10-5 M MnCl2.
Cry3Aa
66
According to our results, there was no direct correlation between toxin production
and efficiency of sporulation. High toxin yield paralleled high sporulation
frequency for Mg, Fe, sugar and inorganic phosphate levels, but not for Mn levels
and the sources of nitrogen. The results were similar to those obtained in previous
studies (Yang and Wang, 1998; Yang and Wang, 2000; Içgen et al., 2002 a,b;
Zouari et al., 2002; Özkan et al., 2003) in that the high toxin yield is not always
accompanied by high sporulation frequency.
3.3.4. Verification of Inorganic Phosphate Effect and Quantitive Assessment of
Productivity
In view of our findings, the DSM was modified to contain 200 mM inorganic
phosphate. A culture grown in iron-omitted DSM and another culture grown in DSM
containing a lowered amount of inorganic phosphate (100 mM) were also included in
this set of experiment in order to be able to cross check and verify the reproducibility
of our findings about the crucial effect of inorganic phosphate. In modified DSM
with 200 mM inorganic phosphate, Cry3Aa toxin production increased from 3
µg.mL-1 to 15.6 µg.mL-1, corresponding to a 5 fold increase in productivity as
compared to the control culture (Figure 3.16). When FeSO4 was omitted from the
medium, toxin production decreased from 15.6 µg.mL-1 to 8.99 µg.mL-1 (a 1.7 fold
decrease). When inorganic phosphate concentration was lowered to 100 mM in the
presence of iron, the toxin level decreased to 5 µg mL-1 which corresponded to a 3
fold decrease. Taken together, the beneficial effect of inorganic phosphate in a
concentration range of 100 to 200 mM appeared to be much greater than that of iron
inclusion in Btt fermentation.

67
Figure 3.16. Cry3Aa biosynthesis in the modified DSM and the iron effect on product yield. Lane 1: Protein molecular weight marker, Lane 2: Control (50 mM inorganic phosphate), Lane 3: Modified DSM (200 mM inorganic phosphate), Lane 4: Modified DSM without FeSO4, Lane 5: Modified DSM containing 100 mM inorganic phosphate instead of 200 mM.
3.4. Comparison of the Local Isolate to Various Anti-Coleopteran Bt Strains in
Terms of Its Total Protein Profile and Biosynthetic Capacity
For this part of the study, we collected 30 different Bt strains reported to produce
Coleoptera-specific δ-endotoxin (Table 2.1). The 21 of these strains have been
mentioned in Kaelin et al. (1994) as being the isolates producing 65 kDa anti-
Coleopteran toxin and having immunological homology with Btt. The strains
including our local isolate were compared in terms of toxin production levels after
they were grown in DSM for three days. Coomassie-stained SDS-PAGE gels showed
that all the strains except Bt 5993, Bt 3973 and Bt 7703 produced the 65 kDa protein.
Most of the strains producing this protein gave general banding patterns quite similar
to that of our local isolate (for example Bt 3123, Bt 3203, Bt 3213, Bt 3023, Bt 1925,
Bt 3103, Bt 1401 and 1935 at 48th h); however protein profiles of certain strains such
as Bt 3063, Bt 3043, 4AA1, 4L1 were quite different (Figures 3.17, 3.18 and 3.19).
1 2 3 4 5
66.2 kDa
Cry3Aa
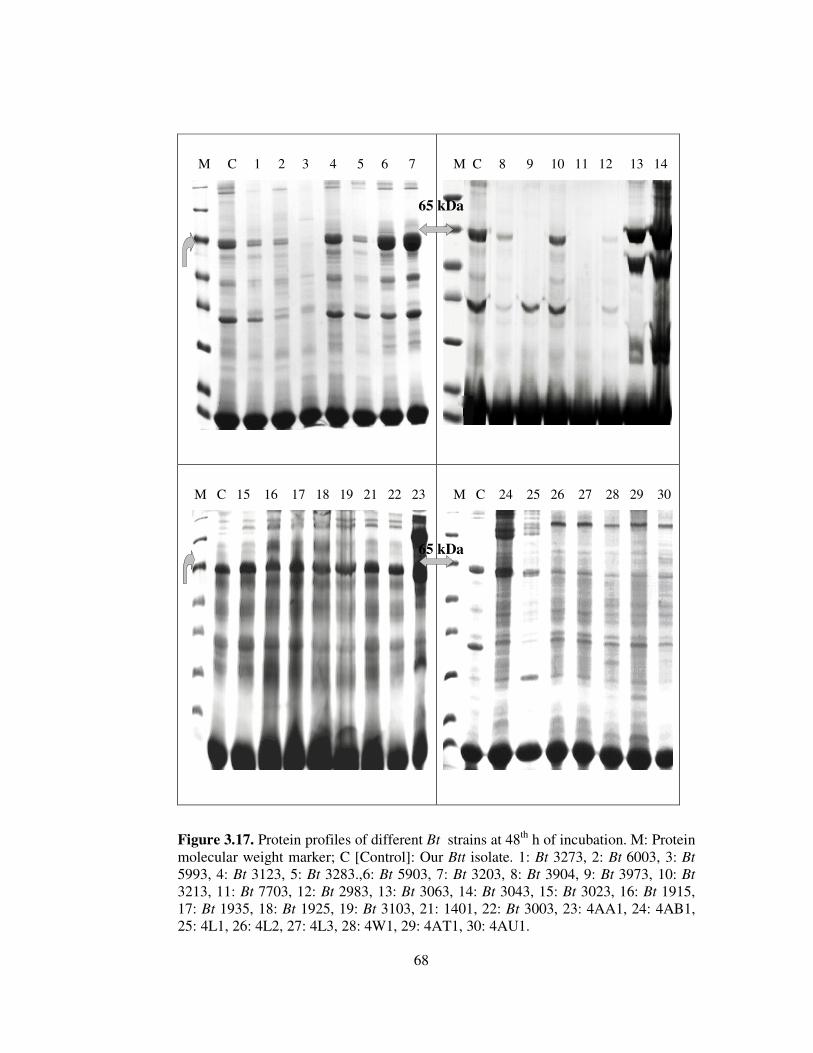
68
Figure 3.17. Protein profiles of different Bt strains at 48th h of incubation. M: Protein molecular weight marker; C [Control]: Our Btt isolate. 1: Bt 3273, 2: Bt 6003, 3: Bt
5993, 4: Bt 3123, 5: Bt 3283.,6: Bt 5903, 7: Bt 3203, 8: Bt 3904, 9: Bt 3973, 10: Bt
3213, 11: Bt 7703, 12: Bt 2983, 13: Bt 3063, 14: Bt 3043, 15: Bt 3023, 16: Bt 1915, 17: Bt 1935, 18: Bt 1925, 19: Bt 3103, 21: 1401, 22: Bt 3003, 23: 4AA1, 24: 4AB1, 25: 4L1, 26: 4L2, 27: 4L3, 28: 4W1, 29: 4AT1, 30: 4AU1.
M C 1 2 3 4 5 6 7
M C 8 9 10 11 12 13 14
M C 15 16 17 18 19 21 22 23
M C 24 25 26 27 28 29 30
65 kDa
65 kDa

69
M C 1 2 3 4 5 6 7
M C 8 9 10 11 12 13 14
M C 15 16 17 18 19 21 22 23
M C 24 25 26 27 28 29 30
Figure 3.18. Protein profiles of different Bt strains at 72nd h of incubation. M: Protein molecular weight marker; C [Control]: Our Btt isolate, 1: Bt 3273, 2: Bt 6003, 3: Bt
5993, 4: Bt 3123, 5: Bt 3283, 6: Bt 5903, 7: Bt 3203, 8: Bt 3904, 9: Bt 3973, 10: Bt
3213, 11: Bt 7703, 12: Bt 2983, 13: Bt 3063, 14: Bt 3043, 15: Bt 3023, 16: Bt 1915, 17: Bt 1935, 18: Bt 1925, 19: Bt 3103, 21: Bt 1401, 22: Bt 3003, 23: 4AA1, 24: 4AB1, 25: 4L1, 26: 4L2, 27: 4L3, 28: 4W1, 29: 4AT1, 30: 4AU1.
65 kDa
65 kDa

70
48 h 72 h
Figure 3.19. Comparison of protein profiles of the Btt isolate with that of the strain BI256-82 (31). C (Control): Our Btt isolate and Btt BI256-82 (31) at 48th and 72nd h of cultivation, respectively.
At 48th h, the strains Bt 5903, Bt 3203, Bt 3043, Bt 3063, 4AB1 and Btt BI256-82
and at 72nd h, the same strains plus Bt 3273, Bt 3123, Bt 3283, Bt 3213, Bt 2983, Bt
3003, Bt 1401, 4AA1 and 4L1 produced more Cry3Aa toxin than our Btt local
isolate. These results suggested that 15 of the 30 isolates compared to the local
isolate performed much better by producing the same toxin much earlier and at
higher levels. The rest of the strains produced either comparable or much lesser
amounts of toxin. The cell pellets were weighed in order to see if there was any
relation between the toxin yields and the cell masses of the strains (Table 3.1). We
could not find a direct correlation between these two parameters. For example, at 48th
h, the highest cell masses of 77, 69 and 70 mg.mL-1 were obtained for the strains Bt
3123, 4L1 and Bt 6003 producing relatively less amounts of toxin, respectively.
Similarly, the strains 3063 and 1935 producing higher amounts of toxin had lowest
amounts of cells masses of 0.5 and 2.4 mg.mL-1, respectively.
M C 31 C 31
Cry3Aa 66.2 kDa
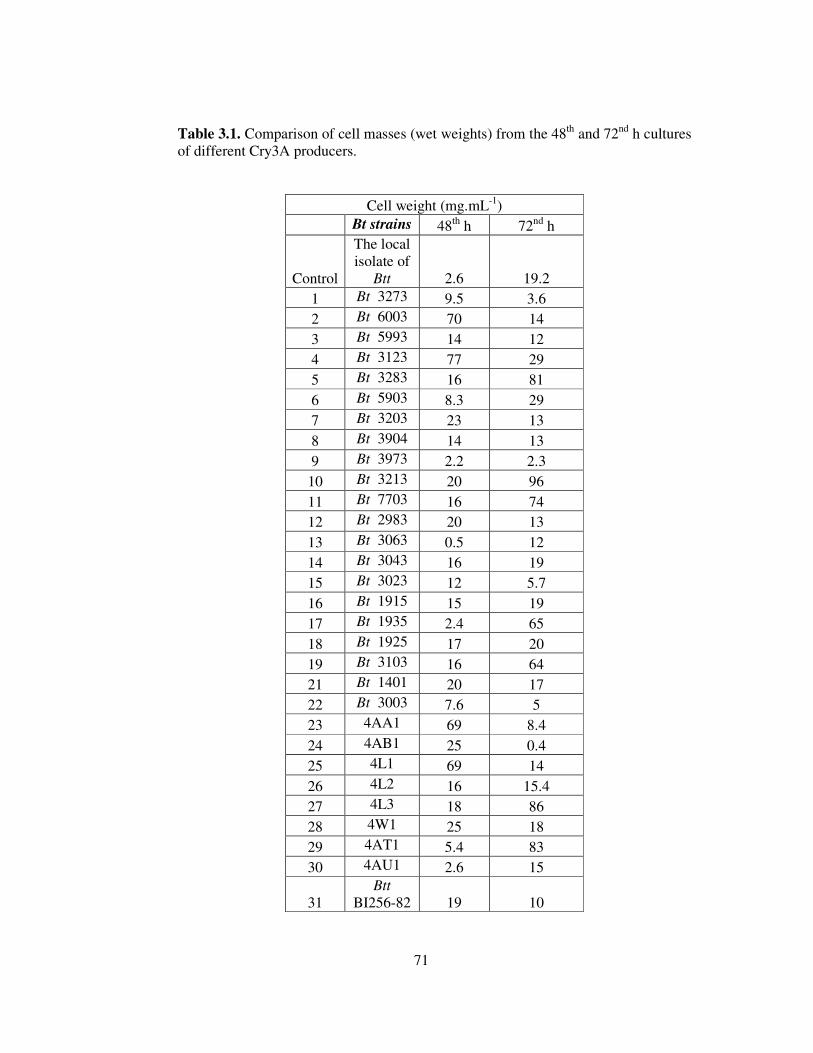
71
Table 3.1. Comparison of cell masses (wet weights) from the 48th and 72nd h cultures of different Cry3A producers.
Cell weight (mg.mL-1)
Bt strains 48th h 72nd h
Control
The local isolate of
Btt 2.6 19.2
1 Bt 3273 9.5 3.6
2 Bt 6003 70 14
3 Bt 5993 14 12
4 Bt 3123 77 29
5 Bt 3283 16 81
6 Bt 5903 8.3 29
7 Bt 3203 23 13
8 Bt 3904 14 13
9 Bt 3973 2.2 2.3
10 Bt 3213 20 96
11 Bt 7703 16 74
12 Bt 2983 20 13
13 Bt 3063 0.5 12
14 Bt 3043 16 19
15 Bt 3023 12 5.7
16 Bt 1915 15 19
17 Bt 1935 2.4 65
18 Bt 1925 17 20
19 Bt 3103 16 64
21 Bt 1401 20 17
22 Bt 3003 7.6 5
23 4AA1 69 8.4
24 4AB1 25 0.4
25 4L1 69 14
26 4L2 16 15.4
27 4L3 18 86
28 4W1 25 18
29 4AT1 5.4 83
30 4AU1 2.6 15
31 Btt
BI256-82 19 10

72
With the aim of obtaining a clue about the relatedness/identity of Cry3A producing
strains having similar protein profiles (the local isolate of Btt, Bt 3123, Bt 3203, Bt
3213, Bt 3023, Bt 1935, Bt 1925, Bt 3103 and Bt 1401), their plasmid patterns were
also compared. As can be seen in Figure 3.20, Btt local isolate had two large
plasmids of 135 and 61 kb and two small plasmids of 1.8 and 1.5 kb. Except for Bt
3023 which appeared plasmidless, all the strains harbored one large (135 kb) and
both of the small plasmids. Four strains, namely Bt 1935, Bt 1925, Bt 3103 and Bt
1401 displayed the same plasmid profile by harboring an additinal large plasmid of
34 kb. Our local isolate and Bt 3123 had the same plasmid complements as they
harboured another different large plasmid of 61 kb. The identity of these two strains
remains to be determined via futher molecular studies such as RFLP analyses with
total DNA.
Although there may be some cry genes that are found on chromosomal DNA
(Aronson et al., 1986), crystal proteins are mostly encoded by the genes on large
plasmids (Gonzales et al., 1981). The largest plasmid with a molecular size of 135 kb
might be the one on which the cry3Aa gene of Btt local isolate is located though the
possibility of a chromosomal location must not be disregarded. The low copy number
of this plasmid did not allow us to excise it from the gel for being used as a template
in PCR. Instead, Southern blot hybridization will be taken as the approach to
investigate a possible plasmid location of cry3Aa gene(s) in the isolate.

73
1 2 3 4 5 6 7 8 9 10
Figure 3.20. Comparison of plasmid profiles of strains having protein profiles similar to that of the local isolate of Btt. Lane 1: E. coli V517 plasmids as size markers, Lane 2: The Btt isolate. Lane 3: Bt 3123, Lane 4: Bt 3203, Lane 5: Bt 3213. Lane 6: Bt 3023, Lane 7: Bt 1935, Lane 8: Bt 1925, Lane 9: Bt 3103, Lane 10: Bt 1401.
In order to check the generality of inorganic phosphate effect together with iron
effect on Cry3Aa production, two anti-Coleopteran Bt species, Bt 1925 and Bt 3123,
were grown in modified DSM with and without FeSO4 and their toxin production
capacities were compared with that of the control. As shown in Figure 3.21, both Bt
strains produced significantly increased amounts of Cry3Aa in modified DSM
containing 200 mM phosphate. However, unlike our local isolate, they were not
affected by the removal of FeSO4 from the medium (Figure 3.20). This finding
suggested that iron effect is rather unique to our isolate whereas inorganic phosphate
effect can be common for the biosynthesis of Cry3Aa-type toxin.
Chromosomal
DNA
92 kb
54 kb
Chromosome
7.2 kb 5.6 kb 5.1 kb 3.9 kb 3 kb 2.7 kb 2.1 kb

74
1 2 3 4 5 6 7 8
Figure 3.21. Cry3Aa production by Bt 3123 and Bt 1925 strains in different combinations of modified DSM. Lane 1, 5: Protein molecular weight marker, Lane 2: Bt 3123 in DSM [Control], Lane 3: Bt 3123 in modified DSM, Lane 4: Bt 3123 in modified DSM without FeSO4, Lane 6: Bt 1925 in DSM [Control], Lane 7: Bt 1925 in modified DSM, Lane 8: Bt 1925 in modified DSM without FeSO4.
3.5. Cloning of cry3Aa Gene into pNW33N and Expression in Bacillus subtilis
3.5.1. Cloning of cry3Aa Gene into pNW33N
For the cloning of cry3Aa gene into the E. coli-Bacillus shuttle vector, the gene was
first amplified from the total DNA of the Btt local isolate by using the primers,
c3AKF and c3AKR (Table 2.2). c3AKF and c3AKR contained SacI and KpnI
restriction enzyme sites for cloning, respectively. 2589 bp of PCR product with an
expected size was obtained from PCR (Figure 3.22). It was purified from the gel and
ligated to pGEM-T vector. After transformation of E. coli DH5α cells with the
ligation product, white colonies containing recombinant pGEM-T were selected on
X-gal plus ampicillin-containing agar plates. pGEM-T carrying 2576 bp insert were
isolated from four recombinant colonies (Figure 3.23) and digested with SacI and
KpnI to release the insert DNA (Figure 3.24 a). Cloning to pGEM-T vector was also
Cry3Aa 66.2 kDa

75
verified by PCR amplification of the gene using putative recombinant plasmids as
the template (Figure 3.24 b).
1 2 3
Figure 3.22. PCR product obtained with primers c3AKF and c3AKR designed for cry3Aa gene and its promoter. Lane 1: Lambda DNA/PstI size marker (Appendix C), Lane 2: Negative control (no template DNA), Lane 3: cry3Aa gene with its promoter (2589 bp).
1 2 3 4 5 6
Figure 3.23. Putative recombinant pGEM-T plasmids carrying total cry3Aa gene. Lane 1: Marker (E. coli V517), Lane 2: Negative control (pGEM-T vector), Lane 3-6: Recombinant pGEM-T plasmids.
5.1 kb
5.5 kb
2556 bp 2589 bp
3.9 kb 3 kb

76
a) 1 2 3 b) 1 2 3
Figure 3.24 a) Double-digested recombinant pGEM-T plasmid carrying 2589 bp PCR product. Lane 1: Marker (Lambda DNA/PstI), Lane 2: Control (pGEM-T vector), Lane 3: Recombinant pGEM-T digested with SacI and KpnI restriction endonucleases, b) PCR product using recombinant pGEM-T as a template. Lane 1: Marker (Lambda DNA/PstI), Lane 2: Negative control (no template), Lane 3: 2589 bp PCR product of cry3Aa gene.
Recombinant pGEM-T and pNW33N were isolated from E. coli cells for cloning of
cry3Aa into the shuttle vector pNW33N. Both were digested with SacI and KpnI
restriction endonucleases and the digests were run in agarose gel. Linearized
pNW33N and cry3Aa released from pGEM-T vector were extracted from the gel and
the ligation was carried out. The ligation product was used to transform E. coli
DH5α cells and putative recombinant colonies were selected on 25 µg.mL-1
chloramphenicol-containing agar plates. The recombinant plasmid of an expected
size (6.4 kb) was isolated from one of the transformant colonies (Figure 3. 25). The
expected 2576 bp insert was obtained after double digestion of the plasmid with SacI
and KpnI (Figure 3.26). Cloning was also verified by PCR amplification (Figure
3.28).
pGEM-T insert
2570 bp 2556 bp

77
1 2 3
Figure 3.25. pNW33N carrying the cry3Aa gene. Lane 1: pNW33N vector, Lane 2: Recombinant pNW33N carrying cry3Aa gene, Lane 3: A 4.7 kb closed ccc plasmid for size control.
1 2 3 4
Figure 3.26. Verification of cloning of the cry3Aa gene into pNW33N by double digestion with SacI and KpnI restriction enzymes and PCR amplification. Lane 1: Digestion products, Lane 2: Marker (Lambda DNA/PstI), Lane 3: Negative control (no template), Lane 4: 2589 bp PCR product.
3.5.2. Expression of the cry3Aa Gene in Bacillus subtilis 168
To date, different cry genes encoding the insecticidal crystal proteins have been
cloned and expressed in various hosts such as E. coli (Jahn et al., 1989; Gomez et al.,
2000), Bt (Lereclus et al., 1989), Pseudomonas cerea (Stock et al., 1990),
pNW33N 2570 bp insert 2838 bp
cry3Aa gene
3.8 kb 4.7 kb 6.4 kb
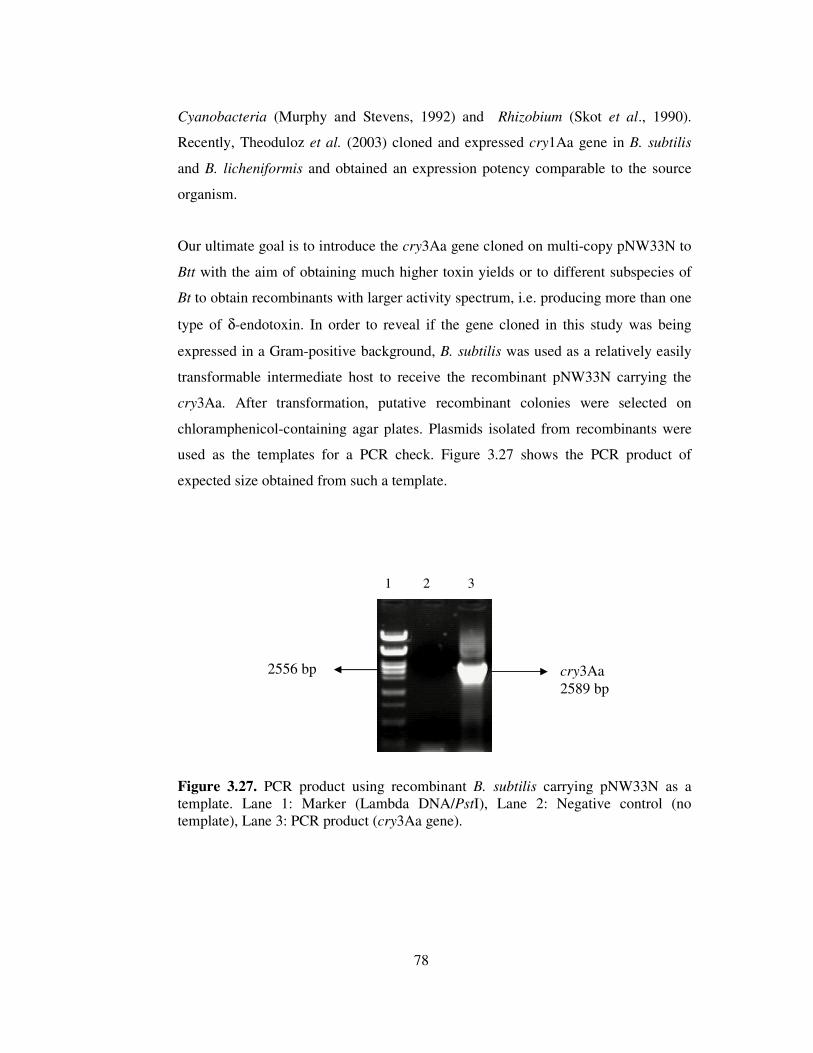
78
Cyanobacteria (Murphy and Stevens, 1992) and Rhizobium (Skot et al., 1990).
Recently, Theoduloz et al. (2003) cloned and expressed cry1Aa gene in B. subtilis
and B. licheniformis and obtained an expression potency comparable to the source
organism.
Our ultimate goal is to introduce the cry3Aa gene cloned on multi-copy pNW33N to
Btt with the aim of obtaining much higher toxin yields or to different subspecies of
Bt to obtain recombinants with larger activity spectrum, i.e. producing more than one
type of δ-endotoxin. In order to reveal if the gene cloned in this study was being
expressed in a Gram-positive background, B. subtilis was used as a relatively easily
transformable intermediate host to receive the recombinant pNW33N carrying the
cry3Aa. After transformation, putative recombinant colonies were selected on
chloramphenicol-containing agar plates. Plasmids isolated from recombinants were
used as the templates for a PCR check. Figure 3.27 shows the PCR product of
expected size obtained from such a template.
1 2 3
Figure 3.27. PCR product using recombinant B. subtilis carrying pNW33N as a template. Lane 1: Marker (Lambda DNA/PstI), Lane 2: Negative control (no template), Lane 3: PCR product (cry3Aa gene).
cry3Aa 2589 bp
2556 bp

79
Recombinant and non-recombinant B. subtilis 168 and Btt local isolate were grown
in the modified DSM for three days at 30 °C and 200 rpm. Protein profile of the cells
are shown in Figure 3.28. Although the expression level was not as high as that
present in the original organism, expression at some degree of cry3Aa gene in B.
subtilis 168 cells seemed to be achieved. Still, heterologous expression of the gene in
B. subtilis remains to be proven by Northern or Western blots via further
experiments. The lower expression level might suggest a less efficient recognition of
cry3Aa gene promoter in a different Bacillus species, but it has to be noted that
neither recombinant, nor non-recombinant B. subtilis could exhibit a good growth in
DSM. Problems in recombinant expression were reported by Ogunjimi et al. (2002),
with particular emphasis on transient expression, poor functionality and insolubility
in heterologous hosts. The very first step in our trouble-shooting will involve a test of
alterations of the culture medium for the propagation of the recombinant.
Figure 3.28. Cry3Aa biosynthesis by recombinant B. subtilis 168 in DSM after 72 h of incubation. Lane 1: Protein molecular weight marker, Lane 2: Cry3Aa production by the Btt local isolate, Lane 3: B. subtilis (Bs) 168 without cloned cry3Aa gene, Lane 4: Recombinant Bs 168.
1 2 3 4
66.2 kDa Cry3Aa

80
3.5.3. cry3Aa Gene Sequence of the Local Isolate
DNA sequence analysis of cry3Aa of the local isolate was next performed (Figure
3.29) and the resulting sequence was compared to other Coleoptera-specific cry gene
sequences in BLAST. The gene starts with ‘atg’ codon and terminates at position
1935 with a ‘taa’ stop codon (Figure 3.29). Computer-aided analysis indicated that
cry3Aa gene product is a 645 residue protein with a calculated molecular mass of
73.125 kDa. The mean A+T content of the gene is 64.24 % which is quite close to
the value 64.6% for ORFs recently reported for Bt 97-27 genome (GenBank,
unpublished).
DNA sequence of the cry3Aa gene of Btt local isolate was compared with the cry3Aa
sequences of 10 different quaternary ranks known so far and obtained from Bt YM-
03, Bt UD-001, Bt 22, Bt 886, Bt var. tenebrionis, Bt san diego(BGSC No. 4AB1),
Btt (BGSC No. 4AA1), Btt NB176, Bt morrisoni EG2158 and and an undesignated
Bt strain, respectively. Its identity to these sequences was found as 99.6 %, 98.7 %,
99.7 %, 99.4 %, 99.7 %, 99.7 %, 99.7 %, 99.7 %, 99.7 % and 99.7 %, respectively.
An alignment of our Cry3Aa δ-endotoxin sequence with the sequences of these
Cry3Aa proteins is shown in Figure 3.30. Amino acid sequence of Cry3Aa of the
local isolate showed 99.1 %, 97.4 %, 99.2 %, 98.6 %, 99.2 %, 99.2 %, 99.1 %, 99.2
%, 99.2 % and 99.2 % identity to the proteins encoded by these genes, respectively
(Table 3.2 a). Alignment of Cry3Aa protein of the Btt local isolate revealed that the
differences in amino acid sequence did not correspond to the five conserved blocks
found in Cry3A protein (Figure 3.29). Of the strains used in comparison, Btt (BGSC
No. 4AA1) and Bt san diego (BGSC No. 4AB1) were among the strains compared
for their protein profiles to the local isolate (Section 3.4). The total protein profile of
this strain was not quite similar to that of our isolate in spite of 99.1 % and 99.2 %
identities found in the structure of Cry3Aa from these organisms (Figure 3.20). Table
3.2. b shows amino acids differed in Cry3A protein of the Btt local isolate and their
positions.
As mentioned earlier (Chapter 1), in choosing locations for rank boundaries for cry
genes, Crickmore et al. (1998) attempted to construct a nomenclature reflecting

81
ATGAATCCGAACAATCGAAGTGAACATGATACAATAAAAACTACTGAAAATAATGAGGTGCCAACTAACCATGTTCAATATCCT
M N P N N R S E H D T I K T T E N N E V P T N H V Q Y P
TTAGCGGAAACTCCAAATCCAACACTAGAAGATTTAAATTATAAAGAGTTTTTAAGAATGACTGCAGATAATAATACGGAAGCA
L A E T P N P T L E D L N Y K E F L R M T A D N N T E A
CTAGATAGCTCTACAACAAAAGATGTCATTCAAAAAGGCATTTCCGTAGTAGGTGATCTCCTAGGCGTAGTAGGTTTCCCGTTT
L D S S T T K D V I Q K G I S V V G D L L G V V G F P F
GGTGGAGCGCTTGTTTCGTTTTATACAAACTTTTTAAATACTAGTTGGCCAAGTGAAGACCCGTGGAAGGCTTTTATGGAACAA
G G A L V S F Y T N F L N T S W P S E D P W K A F M E Q
GTAGAAGCATTGATGGATCAGAAAATAGCTGATTATGCAAAAAATAAAGCTCTTGCAGAGTTACAGGGCCTTCAAAATAATGTC
V E A L M D Q K I A D Y A K N K A L A E L Q G L Q N N V
GAAGATTATGTGAGTGCATTGAGTTCATGGCAAAAAAATCCTGTGAGTTCACGAAATCCACATAGCCAGGGGCGGATAAGAGAG
E D Y V S A L S S W Q K N P V S S R N P H S Q G R I R E
CTGTTTTCTCAAGCAGAAAGTTATTTTCGTAATTCAATGCCTTCGTTTGCAATTTCTGGATACGAGGTTCTATTTCTAACAACA
L F S Q A E S Y F R N S M P S T A I S G Y E V L F L T T
TATGCACAAGCTGCCAACACACATTTATTTTTACTAAAAGACGCTCAAATTTATGGAGAAGAATGGGGATACGAAAAAGAAGAT
Y A Q A A N T H L F L L K D A Q I Y G E E W G Y E K E D
ATTGCTGAATTTTATAAAAGACAACTAAAACTTACGCAAGAATATACTGACCATTGTGTCAAATGGTATAATGTTGGGTTAGAT
I A E F Y K R Q L K L T Q E Y T D H C V K W Y N V G L D
AAATTAAGAGGTTCATCTTATGAATCTTGGGTAAACTTTAACCGTTATCGCAGAGAGATGACATTAACAGTATTAGATTTAATT
K L R G S S Y E S W V N F N R Y R R E M T L T V L D L I
GCACTATTTCCATTGTATGATGTTCGGCTATACCCAAAAGAAGTTAAAACCGAATTAACAAGAGACGTTTTAACAGATCCAATT
A L F P L Y D V R L Y P K E V K T E L T R D V L T D P I
GTCGGAGTCAACAACCTTAGGGGCTATGGAACAACCTTCTCTAATATAGAAAATTATATTCGAAAACCACATCTATTTAACTAT
V G V N N L R G Y G T T F S N I E N Y I R K P H L F N Y
CTGCGTAGAATTCAATTTCACACGCGGTTCCAACCAGGATATTATGGAAATGACTCTTTCAATTATTGGTCCGGTAATTATGTT
L R R I Q F H T R F Q P G Y Y G N D S F N Y W S G N Y V
TCAACTAGACCAAGCATAGGATCAAATGATATAATCACATCTCCATTCTATGGAAATAAATCCAGTGAACCTGTACAAAATTTA
S T R P S I G S N D I I T S P F Y G N K S S E P V Q N L
GAATTTAATGGAGAAAAAGTCTATAGAGCCGTAGCAAATACAAATCTTGCGGTCTGGCCGTCCGCTGTATATTCAGGTGTTACA
E F N G E K V Y R A V A N T N L A V W P S A V Y S G V T
AAAGTGGAATTTAGCCAATATAATGATCAAACAGATGAAGCAAGTACACAAACGTACGACTCAAAAAGAAATGTTGGCGCGGTC
K V E F S Q Y N D Q T D E A S T Q T Y D S K R N V G A V
AGCTGGGATTCTATCGATCAATTGCCTCCAGAAACAACAGATGAACCTCTAGAAAAGGGATATAGCCATCAACTCAATTATGTA
S W D S I D Q L P P E T T D E P L E K G Y S H Q L N Y V
ATGTGCTTTTTAATGCAGGGTAGTAGAGGAACAATCCCAGTGTTAACTTGGACACATAAAAGTGTAGACTTTTTTAACATGATT
M C F L M Q G S R G T I P V L T W T H K S V D F F N M I
GATTCGAAAAAAATTACACAACTTCCGTTAGTAAAGGCATATAAGTTACAATCTGGTGCTTCCGTTGTCGCAGGTCCTAGGTTT
D S K K I T Q L P L V K A Y K L Q S G A S V V A G P R F
ACAGGAGGAGATATCATTCAATGCACAGAAAATGGAAGTGCGGCAACTATTTACGTTACACCGGATGTGTCGTACTCTCAAAAA
T G G D I I Q C T E N G S A A T I Y V T P D V S Y S Q K
TATCGAGCTAGAATTCATTATGCTTCTACATCTCAGATAACATTTACACTCAGTTTAGACGGGGCACCATTTAATCAATACTAT
Y R A R I H Y A S T S Q I T F T L S L D G A P F N Q Y Y
TTCGATAAAACGATAAATAAAGGAGACACATTAACGTATAATTCATTTAATTTAGCAAGTTTCAGCACACCATTCGAATTATCA
F D K T I N K G D T L T Y N S F N L A S F S T P F E L S
GGGAATAACTTACAAATAGGCGTCACAGGATTAAGTGCTGGAGATAAAGTTTATATAGACAAAATTGAATTTATTCCAGTGAAT
G N N L Q I G V T G L S A G D K V Y I D K I E F I P V N
TAA
.
Figure 3.29. Nucleotide and deduced amino acid sequence of cry3Aa gene of the local isolate. Start and stop codons are in bold face. onserved blocks are underlined.

82
significant evolutionary relationships while at the same time minimizing changes
from the gene names assigned under the old system. In the resulting system, proteins
with a common primary rank are similar enough that the percent identity can be
defined with some confidence. Proteins with the same primary rank often affect the
same order of insect; those with different secondary and tertiary ranks may have
altered potency and targeting within an order. At the tertiary rank, differences can be
due to the accumulation of dispersed point mutations, but often they appear to have
resulted from ancestral recombination events between genes differing at a lower rank
level. The quaternary rank was established to group "alleles" of genes coding for
known toxins that differ only slightly, either because of a few mutational changes or
an imprecision in sequencing. Any cry gene specified with a quaternary rank is a
natural isolate. No assumption about functionality is implied by the presence of this
rank number in the gene name. In contrast, an allele number would be assumed,
unless parenthetical or subscripted information indicated otherwise, to denote a
nonfunctional mutant form of a wild-type gene found at a discrete genetic locus.
Currently the boundaries represent approximately 95, 78, and 45% sequence identity.
A B. thuringiensis Pesticidal Crystal Protein Nomenclature Committee, consisting of
the authors of above-mentioned paper, has been the standing committee of the
Bacillus Genetic Stock Center (BGSC) to assist workers in the field of
B. thuringiensis genetics in assigning names to new Cry and Cyt toxins. The
corresponding gene or protein sequences are first deposited into a publicly accessible
database (GenBank, EMBL, or PIR) and released by the repository for electronic
publication in the database so that the scientific community may conduct an
independent analysis. Researchers should submit new sequences directly to the
BGSC director (D. R. Zeigler) who will analyze the amino acid sequence and suggest
the appropriate name, subject to the approval of the committee. The committee
periodically review the literature of the Cry and Cyt toxins and publish a
comprehensive list. This list, alongside other relevant information, will also be
available via the Internet at the following URL:
http://www.biols.susx.ac.uk/Home/Neil_Crickmore/Bt/. The quaternary ranks are

83
assigned in the order that the gene sequences were discovered in the literature or
submitted to the committee. Genes assigned the quaternary rank 1 represent holotype
sequences.
Accordingly, as a new toxin, the sequence of Cry3Aa of our local isolate was
submitted to both GenBank (Accession number AY882576) and BGSC by our
laboratory. The protein will take its exact designation after an appropriate quaternary
rank will be approved by the committee.

84
Figure 3.30. Alignment of Cry3Aa δ-endotoxin sequence with those of other Coleoptera-active Bt isolates.

85
Figure 3.30. (continued)

86
Figure 3.30. (continued)
87
Table 3.2 a Percent similarity and divergence of anti-Coleopteran Cry3Aa δ-endotoxin of Btt local isolate from other Coleoptera-specific Cry3Aa producer Bt
strains, 1. L. isolate: The local isolate of Btt, Cry3Aa producer. 2. AAS79487: Bt
YM-03, Cry3Aa8 producer. 3. AAW05659: Bt UD-001, Cry3Aa9 producer. 4. AJ237900: Bt 22, Cry3Aa7 producer. 5. AY728479: Bt 886, Cry3Aa10 producer. 6. J02978: Bt var. tenebrionis, Cry3Aa2 producer. 7. M22472: Bt san diego (BGSC No. 4AB1), Cry3Aa1 producer. 8. M30503: Btt (BGSC No. 4AA1), Cry3Aa4 producer. 9. M37207: Bt morrisoni EG2158, Cry3Aa5 producer. 10. U10985: Btt NB176, Cry3A6 producer. 11. Y00420: Bt, Cry3Aa3 producer. b Amino acid (aa) replacements in Cry proteins of Bt strains
a)

88
b) Amino acid (aa) replacements in Cry proteins of Bt strains.
Aa position (Local isolate → Bt YM-3)
Aa position (Local isolate → Bt UD-001)
Aa position (Local isolate → Bt 22)
Aa position (Local isolate → Bt 886
Aa position (Local isolate → Bt
var. tenebrionis)
2 (-→I) 3 (-→R) 4 (-→K) 5 (-→G) 6 (-→G) 7 (-→R) 8 (-→K) 9 (-→M)
107 (S→I) 184 (Y→H) 343 (N→D) 346 (R→H) 353 (R→Q)
107 (S→I) 184 (Y→H) 229 (E→K) 237 (Y→L) 251 (C→F) 253 (K→Q) 256 (N→Y) 262 (L→I) 266 (S→F) 343 (N→D) 346 (R→H) 401 (E→G) 424 (Y→N) 431 (E→K) 447 (Y→S) 468 (T→A)
2 (-→I) 3 (-→R) 4 (-→K) 5 (-→G) 6 (-→G) 7 (-→R) 8 (-→K) 9 (-→M)
107 (S→I) 184 (Y→H)
2 (-→I) 3 (-→R) 4 (-→K) 5 (-→G) 6 (-→G) 7 (-→R) 8 (-→K) 9 (-→M)
107 (S→I) 184 (Y→H) 211 (T→I) 343 (N→D) 346 (R→H) 355 (Q→R) 473 (L→P) 569 (Y→H)
107 (S→I) 184 (Y→H) 343 (N→D) 346 (R→H)
Aa position (Local isolate → Bt san
diego)
Aa position (Local isolate → Btt, BGSC No.4AA1)
Aa position (Local isolate → Bt
morrisoni
EG2158
Aa position (Local isolate → Bt
tenebrionis
NB176)
Aa position (Local isolate → Bt)
2 (-→I) 3 (-→R) 4 (-→K) 5 (-→G) 6 (-→G) 7 (-→R) 8 (-→K) 9 (-→M)
107 (S→I) 184 (Y→H) 343 (N→D) 346 (R→H)
107 (S→I) 184 (Y→H) 343 (N→D) 346 (R→H) 552 (G→A)
107 (S→I) 184 (Y→H) 343 (N→D) 346 (R→H)
107 (S→I) 184 (Y→H) 343 (N→D) 346 (R→H)
107 (S→I) 184 (Y→H) 343 (N→D) 346 (R→H)

89
CHAPTER 4
CONCLUSION
• Both the time of appearance of Cry3Aa protein and its production level
greatly varied in different media. HCT and GYS media were not suitable at
all for Cry3Aa production. C2 medium was fairly good and DSM appeared to
be the best one for an early onset of Cry3Aa biosynthesis as well as its high
yields. The organism produced some toxin in this medium even at 24th h of
incubation, its biosythetic capacity increased with time and lasted throughout
the course of incubation. When grown in C2 medium, toxin yields were much
lower than that in DSM except for 120th h when the amounts of toxins
produced in two media appeared almost equal. For the rest of the study, DSM
and 72 h were chosen as the standard medium and incubation time,
respectively.
• When tested at 5 g.L-1; 7.5 g.L-1; 10 g.L-1 concentrations, increased
concentrations of both sugars increased growth and decreased sporulation.
The increasing concentrations of both sugars suppressed toxin biosynthesis
and the highest Cry3Aa production and also high sporulation frequency were
observed in the medium containing glucose or sucrose at a concentration of 5
g.L-1 .
• Inorganic phosphate was the most crucial nutrient affecting anti-Coleopteran
Cry3Aa production. When grown in DSM containing different concentrations
of inorganic phosphate ranging from 5 mM to 200 mM, growth was the best
at 20 mM and slightly decreased at a high inorganic phosphate concentration
of 200 mM. Both sporulation and Cry3Aa production significantly increased

90
with this highest concentration of inorganic phosphate.
• Except for ammonium sulphate plus Casamino acids combination, each
combination of nitrogen sources used to replace nutrient broth contained in
DSM resulted in a poorer growth. Cry3Aa production, on the other hand, was
greatly reduced with all different combinations. There was no consistency
between the levels of sporulation and toxin formation for the nitrogen sources
tested.
• Varying MnCl2 concentration in the medium between 10-4 and 10-7 M did not
affect the growth of the cells remarkably. On the other hand, toxin yield
decreased noticeably in the presence of 10-4 M MnCl2 and the highest
Cry3Aa production was observed with 10-5 to 10-7 M MnCl2. The highest
sporulation frequency was obtained with 10-5 M MnCl2, the concentration
originally contained in growth medium.
• Cry3Aa production slightly decreased with increasing concentrations of
MgSO4. The highest toxin production was detected with 5�10-4 M MgSO4,
the amount originally found in DSM, and increasing or decreasing
concentrations adversely affected the production. Growth was adversely
affected by a high concentration of 10-2 M MgSO4 and sporulation frequency
was also found to decrease with increasing MgSO4 concentrations.
• The onset of growth of our Btt isolate was delayed in a medium containing no
FeSO4. The concentration in the control medium (10-5) was the optimal for
sporulation and Cry3Aa biosynthesis and as this concentration decreased or
iron was omitted from the medium, the levels of toxin also decreased.
• As revealed by optimization studies, there was no direct correlation between
toxin production and efficiency of sporulation. High toxin yield paralleled
high sporulation frequency for Mg, Fe, sugar and inorganic phosphate levels,

91
but not for Mn levels and the sources of nitrogen.
• In modified DSM containing 200 mM inorganic phosphate, Cry3Aa toxin
production increased from 3 µg.mL-1 to 15.6 µg.mL-1, corresponding to a 5
fold increase in productivity as compared to the control culture. When FeSO4
was omitted from the medium, toxin production decreased from 15.6 µg.mL-1
to 8.99 µg.mL-1 (a 1.7 fold decrease). When inorganic phosphate
concentration was lowered to 100 mM in the presence of iron, the toxin level
decreased to 5 µg mL-1 which corresponded to a 3 fold decrease, further
confirming the significant role of inorganic phosphate.
• 15 of the strains performed much better than our Btt local isolate when 31
different Coleoptera-toxic strains were compared in terms of Cry3Aa toxin
production. Most of the strains producing this protein gave protein banding
patterns quite similar to that of our local isolate, however protein profiles of
certain strains were quite different. There was no relation between the toxin
yields and the cell masses of the strains examined.
• The Btt local isolate have two large plasmids of 135 and 61 kb and two small
plasmids of 1.8 and 1.5 kb. However, an additional large plasmid of 34 kb is
harbored by some of the other anti-Coleopteran Bt strains that had similar
protein profiles.
• Two other Coleoptera-toxic strains gave the same kind of responses to
inorganic phosphate, but not to the omission of iron, suggesting that iron
effect is rather unique to our isolate whereas inorganic phosphate effect can
be common to the biosynthesis of Cry3Aa type toxin.
• Cloning, sequencing and computer-aided analysis of cry3Aa gene indicated
that its product is a 645 residue protein with a calculated molecular mass of
73.125 kDa. The mean A+T content of the gene is 64.24 % which is quite
close to the value 64.6 % for ORFs recently reported for Bt 97-27 genome.

92
DNA sequence of the cry3Aa gene of Btt local isolate was compared with the
cry3Aa sequences of 10 different quaternary ranks known so far and obtained
from Bt YM-03, Bt UD-001, Bt 22, Bt 886, Bt var. tenebrionis, Bt san
diego(BGSC No. 4AB1), Btt (BGSC No. 4AA1), Btt NB176, Bt morrisoni
EG2158 and and an undesignated Bt strain, respectively. Its identity to these
sequences was found as 99.6 %, 98.7 %, 99.7 %, 99.4 %, 99.7 %, 99.7 %,
99.7 %, 99.7 %, 99.7 % and 99.7 %, respectively. In the toxin by our local
isolate, the amino acid variation ranged between 4 to 16.
• The extent of amino acid variation present in the toxin of the isolate is
sufficient to put it into a new quaternary rank. As a new toxin, we submitted
the sequence of Cry3Aa of our local isolate to both GenBank (Accession
number AY882576) and BGSC. The protein will take its exact designation
after an appropriate quaternary rank will be approved by the “B. thuringiensis
Pesticidal Crystal Protein Nomenclature Committee”.
• The cloned cry3Aa gene can be used with the aim of toxin overproduction or
to obtain recombinants with larger activity spectrum, after its expression at a
high level is achieved in bacilli.

93
REFERENCES
Adams L.F., Brown, K.L. and Whiteley, H.R. (1991). Molecular cloning and characterization of two genes encoding sigma factors that direct transcription from a Bacillus thuringiensis crystal protein gene promoter. J Bacteriol 173: 3846–3854.
Adams, L.F., Mathewes, S., O’Hara, P., Petersen, A. and Gürtler, H. (1994). Elucidation of the mechanism of CryIIIA overproduction in a mutagenized strain of Bacillus thuringiensis var. tenebrionis. Mol Microbiol 14 (2): 381-389.
Adams, T.T., Eiteman, M.A. and Adang M.J. (1999). Bacillus thuringiensis subsp, kurstaki spore production in batch culture using broiler litter extracts as complex media. Short communication. Bioresource Technol 67: 83-87.
Agaisse, H. and Lereclus, D. (1994 a). Expression in Bacillus subtilis of the Bacillus thuringiensis cryIIIA toxin gene is not dependent on a sporulation specific sigma factor and is increased in a spo0A mutant. J Bacteriol 176: 4734–4741.
Agaisse, H. and Lereclus, D. (1994 b). Structural and functional analysis of the promoter region involved in full expression of the cryIIIA toxin gene of Bacillus
thuringiensis. Mol Microbiol 13: 97–107.
Agaisse, H. and Lereclus, D. (1996). STAB-SD: a Shine-Dalgarno sequence in the 59 untranslated region is a determinant of mRNA stability. Mol Microbiol 20: 633–643.
Angst, B.D., Marcozzi, C., Magee, A.I. (2001). The cadherin superfamily. J. Cell
Sci. 114: 625–626. Apoloyo, C., Drif, l., Vassal, M., DeBarjac, H., Bossy, J., Leclant, F., Frutos, R., (1995). Isolation of multiple subspecies of Bacillus thuringiensis from a population of the European sunflower moth, Homoeosoma nebulella. Appl Environ Microbiol 61 (12): 4343– 4347.
Arantes, O. and Lereclus, D. (1991). Construction of cloning vectors for Bacillus
thuringiensis. Gene 108: 115-119

94
Arcas , J. (1984). Biotechnol Lett 6 (8): 495-500. Armelle, D. (1991). Detection by in vivo recombination shows that the 28-kilo dalton cytolytic polipeptide from Bacillus thuringiensis subsp. israelensis, is not essential to mosquidal activity. J Bacteriol 21: 3374-3381.
Aranson, I., Beckman, W. and Dunn, P. (1986). Bacillus thuringiensis and related insect pathogens. Microbiol Rev 50: 1-24.
Aronson, A.I., Han, E.-S. McGaughey, W. and Johnson, D. (1991). The solubility of inclusion proteins from Bacillus thuringiensis is dependent upon protoxin composition and is a factor in toxicity to insects. Appl Environ Microbiol 57: 981–986.
Aronson, I. (1993). The two faces of Bacillus thuringiensis: insecticidal proteins and post-exponential survival. Microreview. Mol Microbiol 7(4): 489-496.
Aronson, A.I., Wu, D. and Zhang, C. (1995). Mutagenesis of specificity and toxicity regions of a Bacillus thuringiensis protoxin gene. J Bacteriol 177: 4059–4065.
Arora, N., Selvapandiyan, A., Agrawal, N. and Bhatnagar, R.K. (2003). Relocating expression of vegetative insecticidal protein into mother cell of Bacillus
thuringiensis. Biochem Bioph Res Com 310: 158–162.
Asano, S-I., Yamashita, C., Iizuka, T., Takeuchi, K., Yamanaka, S., Cerf, D. and Yamamotoc, T. (2003). A strain of Bacillus thuringiensis subsp. galleriae
containing a novel cry8 gene highly toxic to Anomala cuprea (Coleoptera: Scarabaeidae). Biol Control 28: 191–196.
Babu, B.G., Udayasuriyana, V., Mariama M. A., Sivakumara, N.C., Bharathia, M. Balasubramanian, G. (2002). Comparative toxicity of Cry1Ac and Cry2Aa d-endotoxins of Bacillus thuringiensis against Helicoverpa armigera (H.). Crop Prot 21: 817–822.
Barloy, F., Lecadet, M.M., Delecluse, A. (1998). Distribution of clostridial cry-like genes among Bacillus thuringiensis and Clostridium strains. Curr Microbiol 36: 232–37.
Barton, K.A., Whiteley, H.R. and Yang, N.-S. (1987). Bacillus thuringiensis d-endotoxin expressed in transgenic Nicotiana tabacum provides resistance to lepidopteran insects. Plant Physiol 85: 1103–1109.

95
Baum, J.A., and Malvar, T. (1995). Regulation of insecticidal crystal protein production in Bacillus thuringiensis. Mol Microbiol 18: 1–12. Becker, N. and Margalit, J. (1993). Use of Bacillus thuringiensis israelensis against mosquitoes and blackflies, in: Entwistle, P. F., Cory, J. S., Bailey, M. J., Higgs, S. (Eds.), Bacillus thuringiensis, An Environmental Biopesticide: Theory and Practise, John Wiley and Sons Ltd., Chichester, pp. 146-170.
Beegle, C.C. and Yamamoto, T. (1992). Invitation paper (C.P. Alexander Fund): History of Bacillus thuringiensis Berliner research and development. Can Entomol 124: 587-616.
Ben-Dov, E., Zaritsky, A., Dahan, E., Barak, Z., Sinai, R., Manasherob, R., Khamraev, A., Troitskaya, E., Dubitsky, A., Berezino, N. & Margalith, Y. (1997). Extended screening by PCR for seven cry group genes from field collected strains of Bacillus thuringiensis. Appl Environ Microbiol 63: 2997-3002.
Berliner, E. (1911). Uo ber die Schlalsucht der Mehlmottenraupe. Z. Gesamte Getreidewes. (Berlin) 3: 63-70.
Bernhard, K. and Utz, R., (1993) Production of Bacillus thuringiensis insecticides for experimental and commercial uses, in: Entwistle, P. F., Cory, J. S., Bailey, M. J., Higgs, S. (Eds.), Bacillus thuringiensis, An Environmental Biopesticide: Theory and Practise, John Wiley and Sons Ltd., Chichester, pp. 255-267.
Bernhard, K., Jarret, P., Meadows, M., Butt, J., Ellis, D.J., Roberts, G.M., Pauli, S., Rodgers, P., Burges, H.D. (1997). Natural isolates of Bacillus
thuringiensis: Worldwide distribution, characterization, and activity against insect pests. J Invertebr Pathol 70: 59–68.
Berry, C., O'Neil, S., Ben-Dov, E., Jones, A.F., Murphy, L., Quail, M.A., Holden, M.T., Harris, D., Zaritsky, A. and Parkhill, J. (2002). Complete sequence and organization of pBtoxis, the toxin-coding plasmid of Bacillus
thuringiensis subsp. israelensis. Appl Environ Microbiol 68 (10): 5082-5095.
Bezdicek, D.F., Quinn, M.A., Forse, L., Heron, D. and Kahn, M.L. (1994). Insecticidal activity and competitiveness of Rhizobium spp. containing the Bacillus
thuringiensis subsp. tenebrionis endotoxin gene (cryIII) in legume nodules. Soil Biol
Biochem 26: 1637-1646.
Bhatnagar, N. (1998). Modulation of CryIVA toxin protein expression by glucose in
Bacillus thuringiensis subsp. israelensis. Biochem Bioph Res Co 252: 402-406.

96
Bhatnagar, N. (1999). Inorganic phosphate regulates Cry4A protoxin expression in
Bacillus thuringiensis subsp. israelensis. Biochem. Bioph. Res Co 262:359-364.
Blum, H., Bier, H. and Gress, H.J. (1987). Improved silver staining of plant proteins, RNA and DNA in polyacrylamide gels. Electrophoresis 8: 93-99.
Birnboim, H.C. and Doly, J. (1979). A rapid alkaline extraction procedure for screening recombinant plasmid DNA. Nucleic Acids Res (7): 1513-1523.
Bourgouin, C., Dele´cluse, A. Ribier, J., Klier, A. and Rapoport, G. (1988). A
Bacillus thuringiensis subsp. israelensis gene encoding a 125-kilodalton larvicidal polypeptide is associated with inverted repeat sequences. J Bacteriol 170: 3575–3583.
Bradford, M.M. (1976). A rapid and sensitive method for the quantitation of microgram quantities of protein utilizing the principle of protein-dye binding. Anal
Biochem 72: 248–254.
Bradley, D., Harkey, M.A., Kim, M.K., Biever, K.D. and Bauer, L.S. (1995). The insectidal CryIB crystal protein of Bacillus thuringiensis ssp. thuringiensis has dual specificity to Coleopteran and Lepidopteran larvae. J Invertebr Pathol 65: 162–173.
Bravo, A. (1997). Phylogenetic relationships of Bacillus thuringiensis δ-endotoxin family proteins and their functional domains. J Bacteriol 2793-2801.
Bravo, A., Sarabia, S., Lopez, L., Ontiveros, H., Abarca, C., Ortiz, A., Ortiz, M., Lina, L., Villalobos, F., Pena, G., Nunes, M., Soberon, M. and Quintero, R. (1998). Characterization of cry genes in a Mexican Bacillus thuringiensis strain collection. Appl Environ Microbiol 64 (12): 4965–4972.
Brettin,T.S., Bruce, D., Challacombe,J.F., Gilna,P., Han,C., Hill, K., Hitchcock, P., Jackson, P., Keim, P., Longmire, J., Lucas, S., Okinaka, R., Richardson, P., Rubin, E. and Tice, H. (unpublished). Complete genome sequence of Bacillus
thuringiensis 97-27 (GenBank Accession number: NC_005957)
Brown, K.L. and Whiteley, H.R. (1988). Isolation of a Bacillus thuringiensis RNA polymerase capable of transcribing crystal protein genes. Proc Natl Acad Sci USA 85:4166–4170.
Brown, K.L. and Whiteley, H.R. (1992). Molecular characterization of two novel crystal protein genes from Bacillus thuringiensis subsp. thompsoni. J Bacteriol 174: 549–57.

97
Bruckner R. and Titgemeyer, F. (2002). Carbon catabolite repression in bacteria: choice of the carbon source and autoregulatory limitation of sugar utilization (Minireview). FEMS Microbiol Lett 209: 141-148. Bulla Jr., Bechtel, D.B., Kramer, K.J., Snetha, Y.I, Aronson, A.I. and Fitz-James, P.C. (1980). CRC Crit Rev Microbiol 8:147-195.
Carlson, C.R. and Kolstø A.-B. (1993). A complete physical map of a Bacillus
thuringiensis chromosome. J Bacteriol 175:1053–1060.
Carlson, C.R., Caugant, D.A. and Kolstr, A.B. (1994). Genotypic diversity among Bacillus cereus and Bacillus thuringiensis strains. Appl Environ Microbiol 60: 1719–1725.
Carlson, C.R., Johansen, T., Lecadet, M.M. and Kolstø, A.B. (1996). Genomic organization of the entomopathogenic bacterium Bacillus thuringiensis subsp. berliner 1715. Microbiology 142: 1625–1634.
Carozzi, N.B., Kramer, V.C., Warren, G.W., Evola, S. and Koziel, M.G. (1991). Prediction of insecticidal activity of Bacillus thuringiensis strains by polymerase chain reaction product profiles. Appl Environ Microbiol 57: 3057–3061.
Carroll, J., Li, J. and Ellar, D.J. (1989). Proteolytic processing of a coleopteran-specific delta-endotoxin produced by Bacillus thuringiensis var. tenebrionis.
Biochem J 261: 99-105.
Carroll, J., Converts, D., Van Damme, J., Boets, A., Van Rie, J. and Ellar, D.J. (1997). Intramolecular proteolytic cleavage of Bacillus thuringiensis Cry3A δ-endotoxin may facilitate its coleopteran toxicity. J Invertbr Pathol 70: 41-49.
Carlton, B.C. and Gonzales, J.M. (1985). In the molecular biology of Bacilli, Vol.II, Dubnau, D.A. (ed.). New York: Academic Pres. pp. 181-190.
Charles, J-F. and Nielsen-LeRoux, C. (2000). Mosquitocidal bacterial toxins: diversity, mode of action and resistance phenomena. Mem Inst Oswaldo Cruz 95 (Suppl. 1): 201–6
Chilcot, C.N. and Wigley, P.J. (1993). Isolation and toxicity of Bacillus
thuringiensis from soil and insect habitats in New Zealand. J Invertebr Pathol. 61: 244–247.
Chilcutt, C.F. and Tabashnik, B.E. (1997). Independent and combined effects of Bacillus thuringiensis and the parasitoid Cotesia plutellae (Hymenoptera:

98
Braconidae) on susceptible and resistant diamondback moth (Lepidoptera: Plutellidae). J Econ Entomol 90: 397-403.
Crickmore, N., Zeigler, D.R., Feitelson, J., Schnepf, E., Van Rie, J., Lereclus, D., Baum, J. and Dean, D.H. (1998). Revision of the nomenclature for the Bacillus
thuringiensis pesticidal crystal proteins, Microbio Mol Biol Rev 62: 807–813. Cutting, S.M. and Horn V.P.B., (1990). Genetic analysis in molecular biological methods for Bacillus. (eds: Colin R. Harwdwood and Simon M. Cutting) A Willey-Interscience Publication. John Wiley and Sons, Chiester. New York. Daamgard, P.H., Abdel-Hameed, A., Eilenberg, J. and Smits, P.H., (1998). Natural ocurrence of Bacillus thuringiensis on grass foliage. W J Microbiol Biotech 14: 239–242.
Dele´cluse, A.V., Jua´rez-Pe´rez V. and Berry, C. (2000). Vector-active toxins: structure and diversity, p. 101–125. in J.-F. Charles, A. Dele´cluse, and X. Nielsen-Le Roux (ed.), Entomopathogenic bacteria: from laboratory to field. application.
Kluwer Academic Publishers, Dordrecht, The Netherlands.
Delucca, A.J., Simonson, J.G. and Larson, A.D. (1981). Bacillus thuringiensis
distribution in soils of the United States. Can J Microbiol 27: 865–870.
De-Maagd, D.R.A., Bravo, A. and Crickmore, N. (2001). How Bacillus
thuringiensis has evolved specific toxins to colonize the insect world. Trends Genet 4: 193–199.
De-Maagd, D.R.A., Bravo, A., Berry, C., Crickmore, N. and Schnepf, H.E. (2003). Structure, diversity, and evolution of protein toxins from spore-forming entomopathogenic bacteria. Annu Rev Genet 37: 409–433.
Demain, A.L. (1995). Microbial secondary metabolism: The new frontier, in: Kuhn, W. and Fiedler, H. P., (Eds.), Sekundär Metabolismus bei Microorganismen, Atlempo Verlag, Tübingen. pp. 11-35.
De Souza, M.T., Lecadet, M.M. and Lereclus, D. (1993). Full expression of the cryIIIA toxin gene of Bacillus thuringiensis requires a distant upstream DNA sequence affecting transcription. J Bacteriol 175: 2952–2960.
Donovan, W.P., Gonzales, J.M., Gilbert, M.P. and Dankocsik, C. (1988). Isolation nanmd characterization of EG2158, a new strain of Bacillus thuringiensis toxic to coleopteran larvae, and nucleotide sequence of the toxin gene. Mol Gen
Genet 214: 365-372.

99
Donovan, W.P., Rupar, M.J., Slaney, K.A.C., Malvar, T., Gowran-Burke, M.C. and Johnson, T.B.C. (1992). Characterization of two genes encoding Bacillus
thuringiensis insecticidal crystal proteins toxic to coleopteran species. Appl Environ
Microbiol 58: 3921–3927. Donovan, W.P., Tan, Y. and Slaney, A.C. (1997). Cloning of the nprA gene for neutral protease A of Bacillus thuringiensis and effect of in vivo deletion of nprA on insecticidal crystal protein. Appl Environ Microbiol 63: 2311-2317.
Drees, B.M., Levine, E., Stewart, J.W., Sutter, G.R. and Tollefson, J.J. (1999). Injury and management of corn rootworms, p. 65–68. In K. L. Steffey, M. E. Rice, J. All, D. A. Andow, M. E. Gray, and J. W. Van Duyn (ed.), Handbook of corn insects. Entomological Society of America, Lanham, Md. Du, C., Martin, P.A.W. and Nickerson, K.W. (1994). Comparison of disulfide contents and solubility at alkaline pH of insecticidal and noninsecticidal Bacillus
thuringiensis protein crystals. Appl Environ Microbiol 60:3847–3853.
Dulmage, H.T. (1970). Insecticidal activity of HD-1 a new isolate of Bacillus
thuringiensis. J Invertebr Pathol 15: 232-239.
Dulmage, H.T., Yousten, A.A. and Singer, S.L.L.A. (1990). Guidelines forn production of Bacillus thuringiensis israelensis through standardization and fermentation development, in. H. de Barjac and D.J. Sutherland (Eds.), Bacterial
Control of Mosquitoes and blackflies, Rutgers University Pres, new Bru. 110-113.
Ellis, R.T., Stockhoff, B.A., Stamp, L., Schnepf, H.E., Schwab, G.E. Knuth, M., Russell, J., Cardineau, G.A. and Narva, K.E. (2002). Novel Bacillus thuringiensis
binary insecticidal crystal proteins active on western corn rootworm, Diabrotica
virgifera virgifera LeConte. .Appl Environ Microbiol 1137–1145.
Environmental Health Criteria 217. (1999). Microbial Pest Control Agent, Bacillus thuringiensis. World Health Organization, Geneva.
Estruch, J., Warren, G.W., Mullins, M.A., Nye, G.J., Craig, J.A. Koziel, H.G. (1996). Vip3A, a novel Bacillus thuringiensis vegetative insecticidal protein with a wide spectrum of activities against lepidopteran insects. Proc Natl Acad Sci USA 93: 5389–5394.
Estruch, J.J., Carozzi, N.B., Desai, N., Duck, N.B., Warren, G.W. and Koizel., M.G. (1997). Transgenic plants: An emerging approach to pest control. Nat
Biotechnology 15: 137-141.

100
Faloci M.M., Arcas J.A. and Yantorno O.M. (1986). Influence of various ions in sporulation and the formation of delta-endotoxin in Bacillus thuringiensis cultures Rev Argent Microbiol 18 (2): 53-62.
Farrera, R.R., Perez-Guerra, F., de la Torre, M. (1998). Carbon: nitrogen ratio interacts with initial concentration of total solids on insecticidal crystral protein and spore production in Bacillus thuringiensis HD-73. Appl Microbiol Biotechnol 49: 758-765.
Faust, R.M. (1974). Bacterial diseases. In: Insect Diseases (Edited by G.E. Cantwell). Marcel Dekker, New York. 87-183. Feitelson, J.S. (1993). The Bacillus thuringiensis family tree, In L. Kim (ed.), Advanced engineered pesticides. Marcel Dekker, Inc., New York, N.Y. 63–71. Ferre, J., Escriche, B., Bel, Y. and Van Rie, J. (1995). Biochemistry and genetics of insect resistance to Bacillus thuringiensis insecticidal crystal proteins. FEMS
Microbiol Let. 132: 1–7.
Forcada, C., Alcacer, E., Garcera, M. D. and Martinez, R. (1996). Differences in the midgut proteolytic activity of two Heliothis virescens strains, one susceptible and one resistant to Bacillus thuringiensis toxins. Arch Insect Biochem Physiol 31: 257–272..
Frutos, R., Rang, C., and Royer, M. (1999). Managing insect resistance to plants producing Bacillus thuringiensis toxins. Critic Rev Biotech 19: 227-276.
Gahan, L.J., Gould, F., Heckel, D.G. (2001). Identification of a gene associated with Bt resistance in Heliothis virescens. Science 293: 857-860.
Garcia-Robles, I., Sanchez, J., Gruppe, A., Martinez-Ramirez, A.C., Rausell, C., Real, M.D. and Bravo, A. (2001). Mode of action of Bacillus thuringiensis PS86Q3 strain in hymenopteran forest pests. Insect Biochem Mol Biol 31: 849–856.
Ge, B., Bidesh, D., Moas, W.J. and Federici, B.A. (1998). Diferential efects of helper proteins encoded by the Cry2A and Cry11A operons on the formations of Cry2A inclusions in Bacillus thuringiensis. FEMS Microbiol Lett 165: 35-41.
Georghiou, G.P., Barker, J., Al-Khatib, Z., Mellon, R., Murray, C., Tran, H., Vasquez, M., Pelsue, F. and Hazelrigg, J. (1983). Insecticide resistance in mosquitoes: research on new chemical and techniques for management. In: Mosquito control research annual report. University of California, Riverside. 86-91.
Giddings, G., Mytton, L., Griffiths, M., McCarthy, A., Morgan, C., Skot, L. (1997). A secondary effect of transformastion in Rhizobium leguminosarum

101
transgenic for Bacillus thuringiensis subsp. tenebrionis delta-endotoxin (CryIIIA) genes. Theor Appl Genet 45: 1062-1068.
Gill, S.S., Cowles, E.A. and Pietrantonio, P.P. (1992). The mode of action of Bacillus thuringiensis endotoxins. Annu Rev Entomol 37: 615–636.
Glare, T.R. and O-Callaghan, M. (2000). Bacillus thuringiensis: Biology, Ecology and Safety. Wiley, Chichester.
Glatron, M.F. and Rapoport, G. (1972). Biosynthesis of the parasporal inclusion of Bacillus thuringiensis: half-life of its corresponding Messenger RNA. Biochimie 54: 1291–1301.
Groeters, F.R., Tabashnik, B.E., Finson, N. and Johnson, M.W. (1993). Resistance to Bacillus thuringiensis affects mating success of the diamondback moth (Lepidoptera: Plutellidae). J Econ Entomol. 86:1 035–1039.
Gould, F. (1988). Evolutionary biology and genetically engineered crops. BioScience 38: 26-33.
Goldberg, L.J. and Margalit, J. (1977). A bacterial spore demonstrating rapid larvicidal activity against Anopheles serengetii, Uranotaenia unguiculata, Culex
univittatus, Aedes aegypti and Culex pipiens. Mosq. News 37: 355-358.
Goldman, I.F., Arnold, J. and Carlton, B.C. (1986). Selection for resistance to Bacillus thuringiensis subspecis israelensis in field and laboratory populations of the mosquitoe Aedes aegypti. J Invertebr Pathol 47: 317-324.
Gomez, S., Mateus, A.C., Hernandez, J. and Zimmermann, B.H. (2000). Recombinat Cry3Aa has insecticidal activity against the Andean potato weevil, Premnotrypes vorax. Biochem Biophy Res Co 279: 653-656.
González, J.M., Jr, Dulmage, H.T. and Carlton, B.C. (1981). Correlation between specific plasmids and δ-endotoxin production in Bacillus thuringiensis. Plasmid 5: 351–365.
González, J.M., Jr Brown, B.J. and Carlton, B.C. (1982). Transfer of Bacillus
thuringiensis plasmids coding for δ-endotoxin among strains of B. thuringiensis and B. cereus. Proc Natl Acad Sci (USA) 79: 6951–6955.
Groeters, F.R., Tabashnik, B.E., Finson, N. and Johnson, M.W. (1993). Resistance to Bacillus thuringiensis affects mating success of the diamondback moth (Lepidoptera: Plutellidae). J Econ Entomol 86: 1035–1039.

102
Groot, A.T. and Dicke, M. (2002). Insect-resistant transgenic plants in a multi-trophic context. The Plant Journal 31(4): 387-406
Guerchicoff, A., Dele´cluse, A. and Rubinstein, C.P. (2001). The Bacillus
thuringiensis cyt genes for hemolytic endotoxins constitute a gene family. Appl Env
Microbiol 67(3): 1090–1096.
Hanahan, D. (1983). Studies on transformation of Escherichia coli with plasmids. J Mol Biol 166: 557-580.
Hansen, B.M., Damgaard, P.H., Eilenberg, J. and Pedersen, J.C. (1998). Molecular and phenotypic characterization of Bacillus thuringiensis isolated from leaves and insects. J Invertebr Pathol 71: 106–114.
Hansen, B.M. and Salamitou, S. (2000). Virulence of Bacillus thuringiensis. In Entomopathogenic Bacteria: From Laboratory to Field Application (Charles, J. et
al., eds), Kluwer Academic Publishers. 41–64.
He, J., Luo, X., Chen, S., Cao, L., Sun, M. and Yu, Z. (2003). Determination of spore concentration in Bacillus thuringiensis through the analysis of dipicolinate by capillary zone electrophoresis. J Chromatogr A 994: 207–212.
Helgason, E., Økstad, O.A., Caugant, D.A., Johansen, H.A., Fouet, A., Mock, M.´L., Hegna, I. and Kolstø, A.B. (2000). Bacillus anthracis, Bacillus cereus, and Bacillus thuringiensis- one species on the basis of genetic evidence. Appl Env
Microbiol 2627–2630.
Hernstadt, C., Soares G.C., Wilcox, E.R. and Edwards, D.L. (1986). A new strain of Bacillus thuringiensis with activity against coleopteran insects. Bio/Technology, 4: 305– 308.
Hernstadt, C., Gilroy, T.E., Solesk, D.A., Bennet, B.D. and Gautner, F.H. (1987). Nucleotide sequence and deduced amino acid sequence of a coleopteran active delta-endotoxin gene from Bacillus thuringiensis subsp. san Diego. Gene 57: 81–116.
Hintermann, G., Crameri, R., Kieser, T. and Hutter, R. (1981). Restriction analysis of the Streptomyces glaucescens genome by agarose gel electrophoresis. Arch Microbiol 130: 218-222.
Hodgman, T.C., Ziniu, Y., Shen, J. and Ellar, D.J. (1993). Identification of a cryptic gene associated with an insertion sequence not previously identified in

103
Bacillus thuringiensis. FEMS Microbiol Lett 114: 23–29.
Hofte, H., Seurick, J., Van Houtven, A. and Vaeck, M. (1987). Nucleotide sequence of a gene encoding an insecticidal protein of Bacillus thuringiensis.
Microbiol Rev 53: 242-255.
Hofte, H., Van Rie, J., Jansens, S., Van Hounten, A., Vanderbruggen, H. and Vaeck, M. (1988). Monoclonal antibody analysis and insecticidal spectrum of three types of lepidopteran-specific insecticidal crystal proteins of Bacillus thuringiensis. Appl Env Microbiol 54: 2010-2017.
Hofte, H. and Whiteley, H.R. (1989). Insecticidal crystal proteins of Bacillus
thuringiensis. Microbiol Rev 53: 242–255.
Hopwood, D.A., Bibb, M.J., Chater, K.F., Keiser, T., Bruton, C.J., Kieser, H.M., Lydiate, D.J., Smith, C.P., Ward, J.M. and Scrempf, H. (1985). Genetic Manipulation of Streptomyces: a Laboratory Manual. Norwich: John Innes Foundation. Hossain, M.A., Ahmed, S. and Hoque, S. (1997). Abundance and distribution of Bacillus thuringiensis in the agricultural soil of Bangladesh. J Invertebr Pathol 70: 221–225.
Huang , Z., Guan C. and Guan, X. (2004). Cloning, characterization and expression of a new cry1Ab gene from Bacillus thuringiensis WB9. Biotechnol Letts 26: 1557–1561.
Huffman, D.L., Bischof, L.J., Griffitts, J.S. and Aroian, R.V. (2004). Pore worms: Using Caenorhabditis elegans to study how bacterial toxins interact with their target host. Int J Med Microbiol. 293: 599 -607.
Hwang, S.H., Saitoh, H., Mizuki, E., Higuchi, K. and Ohba, M. (1998). A novel class of mosquitocidal delta-endotoxin, Cry19B, encoded by a Bacillus thuringiensis serovar higo gene. Syst Appl Microbiol 21 (2): 179-184
Ibarra, J.E., del Rinc�n C., Ordúz, S., Noriega, D., Benintende, G., Monnerat, R., Regis, L., de Oliveira, C.M.F., Lanz, H., Rodriguez, M.H., Sánchez, J., Pe�a, G. and Bravo, A. (2003). Diversity of Bacillus thuringiensis strains from Latin America with insecticidal activity against different mosquito species. Appl Env
Microbiol 69 (9) 5269–5274.
Içgen, Y., Içgen, B., Özcengiz, G. (2002 a). Regulation of crystal protein biosynthesis by Bacillus thuringiensis: I. Effects of mineral elements and pH. Res
Microbiol 153: 599–604.
104
Içgen, Y., Içgen, B., Özcengiz, G. (2002 b). Regulation of crystal protein biosynthesis by Bacillus thuringiensis: II. Effects of carbon and nitrogen sources. Res
Microbiol 153: 605–609.
Ishiwata, S. (1901). On a kind of severe flacherie (sotto disease). Dainihon Sanshi
Kaiho. 114: 1 -5.
Ivanova, N., Sorokin, A., Anderson, I., Galleron, N., Candelon, B., Kapatral, V., Bhattacharyya, A., Reznik, G., Mikhailova, N., Lapidus, A., Chu, L., Mazur, M., Goltsman, E., Larsen, N., D’Souza, M., Walunas, T., Grechkin, Y., Pusch, G., Haselkorn, Fonstein, R.M., Ehrlich, S.D., Overbeek, R. and Kyrpides, N. (2003). Genome sequence of Bacillus cereus and comparative analysis with Bacillus
anthracis. Nature 423: 87-91.
Jahn, N., Schnetter, W. and Geider, K. (1987). Cloning of an insecticidal toxin gene of Bacillus thuringiensis subsp. tenebrionis and its expression in Escherichia
coli cells. FEMS Microbiol Lett 48: 311-315.
Jenkins J.L. and Dean D.H. (2000). Exploring the mechanism of action of insecticidal proteins by genetic engineering methods. Genet Eng 22: 33–54 Jerry, R. (2004). Biological insect control.(Chemical Corner) (http://static.highbeam.com/l/landscapeampirrigation/may012004/biologicalinsectcontrolchemicalcorner/index.html) Kaelin, P., Morel, P. and Gadani, F. (1994). Isolation of Bacillus thuringiensis from stored tobacco and Lasioderma serricorne (F.). Appl Environ Microbiol 19-25.
Kaur, S. (2000). Molecular approaches towards development of novel Bacillus
thuringiensis biopesticides. World J Microb Biot 6: 781-793.
Keller M, Sneh B, Strizhov N, PrudovskyE, RegevA, Koncz, C., Schell, J. and Zilberstein, A. (1996). Digestion of delta-endotoxin by gut proteases may explain reduced sensitivity of advanced instar larvae of Spodoptera littoralis to Cry1C. Insect Biochem Mol Biol 26: 365–736.
Klein, C., Kaletta, C., Schnell, N. and Entian, K.-D. (1992). Analysis of genes involved in biosynthesis of the lantibiotic subtilin. Appl Environ Microbiol 58: 132-142.
Knight, P.J.K., Crickmore, N. and Ellar, D.J. (1994). The receptor for Bacillus
thuringiensis CryIA(c) delta-endotoxin in the brush border membrane of the lepidopteran Manduca sexta is aminopeptidase, N Mol Microbiol 11: 429–436.

105
Knowles, B.H., Thomas, W.E. and Ellar, D.J. (1984). Lectin-like binding of Bacillus thuringiensis var. kurstaki lipidopteran-specific toxin is an initial step in insecticidal action. FEBS Lett. 168: 197–202.
Knowles, B. H. and Ellar, D. J. (1987). Colloid-osmotic lysis is a general feature of the mechanism of action of Bacillus thuringiensis d-endotoxins with different specificity. Biochim Biophys Acta 924: 509–518.
Knowles, B.H., Blatt, M.R., Tester, M., Horsnell J.M., Carroll, J., Menestrina, G. and Ellar, D.J. (1989). A cytolytic δ-endotoxin from Bacillus thuringiensis var. israelensis forms cation-selective channels in planar lipid bilayers. FEBS Lett 244: 259–262.
Koller, C.N., Bauer, L.S. and Hollingworth, R.M. (1992). Characterization of the pH-mediated solubility of Bacillus thuringiensis var. sandiego native δ-endotoxin crystals, Biochem Biophy Res Co 184 (2): 692-699.
Koni, P.A. and Ella, D.J. (1994). Biochemical characterization of Bacillus
thuringiensis cytolytic delta-endotoxins. Microbiology 140: 1869–1880.
Krieg, A., Huger, A.M., Langenbruch, G.A. and Schnetter, W. (1983). Bacillus
thuringiensis var. tenebrionis, a new pathotype effective against larvae of Coleoptera. Z Angew Entomol 96(5): 500–508.
Kronstad, J.W., Schneph, H.E. and Whiteley, H.R. (1983). Diversiry of locations for Bacillus thuringiensis crystal protein genes. J Bacteriol 134: 419-428. Kronstad, J.W. and Whiteley, H.R. (1986). Three classes of homologous Bacillus
thuringiensis crystal-protein genes. Gene 43: 29–40. 197.
Krywienzcyk, J. (1977). Antigenic composition of b-endotoxin as an aid in identification of Bacillus thuringiensis varieties. Publication IP-X-16. Insect Pathology Research Institute, Canadian Forest Service, Sault Sainte Marie, Ontario, Canada.
Kumar, S. and Udayasuriyan, V. (2004). Cloning of cry2Aa and cry2Ab genes from new isolates of Bacillus thuringiensis and their expression in recombinant Bacillus thuringiensis and Escherichia coli strains. World J Microb Biot 20: 11–17.
Lacey, L.A., Frutos, R., Kaya, H.K. and Vail, P. (2001). Insect pathogens as biological control agents: Do they have a future? Bio Control 21: 230-248.

106
Lachhab, K., Tyagi, R.D. and Vale´ro, J.R. (2001). Production of Bacillus
thuringiensis biopesticides using wastewater sludge as a raw material: effect of inoculum and sludge solids concentration. Process Biochem 37: 197–208.
Laemmli, U. K. (1970). Cleavage of structural proteins during the assembly of the head of bacteriophage T4. Nature 227, 680–685.
Lambert, B., Hofte, H., Annys, T. K., Jansens, S., Soetaert, P. and Peferoen, M. (1992). Novel Bacillus thuringiensis insecticidal crystal protein with a silent activity against Coleopteran larvae, Appl. Environ. Microbiol., p. 2536-2542.
Lecadet, M.M., Blondel, M.O. and Ribier, J. (1980). Generalized transduction in Bacillus thuringiensis var. berliner 1715 using bacteriophage CP-54Ber J Gen Biol 121: 203-212.
Lecadet, M.M, Chaufaux, J., Ribier, J. and Lereclus, D. (1992). Construction of novel Bacillus thuringiensis strains with different insecticidal activities by transduction and transformation. Appl Environ Microbiol 840-849. Lee, H.K. and Gill, S.S. (1997). Molecular cloning and characterization of a novel mosquitocidal protein gene from Bacillus thuringiensis subsp. fukuokaensis. Appl
Environ Microbiol 63 (12): 4664-4670.
Lereclus, D. Arantes, O., Chaufaux, J. and Lecadet, M.M. (1989). Transformation and Expression of a cloned δ-endotoxin gene in Bacillus
thuringiensis. FEMS Microbiol Lett 60: 211-218.
Lereclus, D., Vallade, M., Chaufaux, J., Arantes, O. and Rambaud, S. (1992). Expansion of the insecticidal host range of Bacillus thuringiensis by in vivo genetic recombination. Bio/Technology 10: 418–421. Li, J., Carroll, J. and Ellar, D.J. (1991). Crystal structure of insecticidal δ-endotoxin from Bacillus thuringiensis at 2.5 resolution. Nature 353: 815-821.
Li, J., Koni P.A. and Ellar, D.J. (1996). Structure of the mosquitocidal δ-endotoxin CytB from Bacillus thuringiensis sp. kyushuensis and implications for membrane pore formation. J Mol Biol 257: 129–152.
Liang, Y., Patel, S.S. and Dean, D.H. (1995). Irreversible binding kinetics of Bacillus thuringiensis CryIA δ-endotoxins to gypsy moth brush border membrane vesicles is directly correlated to toxicity. J Biol Chem 270:24719–24724.
Loseva O., Ibrahim, M., Candas, M., Koller, C.N., Bauer, L.S. and Bulla Jr., L.A. (2002). Changes in protease activity and Cry3Aa toxin binding in the Colorado

107
potato beetle: implications for insect resistance to Bacillus thuringiensis toxins, Insect Biochem Molec Bio 32: 567–577.
Lüthy, P.,Cordier, J.L. and Fischer, H.M. (1982). Bacillus thuringiensis delta endotoxin as a bacterial insecticide: basic considerations and application, In
Microbial and Viral Pesticides (Ed. E. Kurtsak), pp.35-74. Marcel Dekker, New York.
Malvar, T., Gawron-Burke, C. and Baum, J.A. (1994). Overexpression of Bacillus thuringiensis HknA, a histidine protein kinase homology, bypasses early Spo- mutations that result in CryIIIA overproduction. J Bacteriol 4742-4749.
Marroquin, L.D. Elyassnia, D., Griffitts, J.S., Feitelson, J.S. and Aroian, R.V. (2000). Bacillus thuringiensis (Bt) toxin susceptibility and isolation of resistance mutants in the nematode Caenorhabditis elegans. Genetics 155: 1693–1699.
McPherson, S.A., Perlak, F.J., Fuch, R.L., Marrone, P.g., Lavrik, P.B. and Fischhoff, D.A. (1988). Characterization of the coleopteran-specific protein gene of Bacillus thuringiensis var. tenebrionis. Bio/Technology.6: 61-66. Meadows, M.P., Ellis, D.J., Butt, J., Jarret, P. and Burges, H.D., (1992). Distribution, frecuency, and diversity of Bacillus thuringiensis an animal feed mill. Appl Environ Microbiol 58: 1344–1350.
Miller, D.L., Rahardja, U. and Whalon, M.E. (1990). Development of a strain of Colorado potato beetle resistance to different strains and mixtures of Bacillus
thuringiensis. Pest Resistance Manag. 2(2): 25.
Monsanto (2000). The whole plant. The whole season. Available at: http://www.monsanto.com/monsanto/agriculture/current_products/yieldgard_ipcorn/whole_plant_season.html.
Murphy, R.C. and Stevens, S.E. (1992). Cloning and expression of the cryIVD gene of Bacillus thuringiensis subsp. israelensis in the cyanobacterium Agmenellum
quadruplicatum PR-6 and its resulting larvicidal activity. Appl Environ Microbiol 58: 1650–1655.
Neppl, C.C. (2000). Management of resistance to Bacillus thuringiensis toxins: The Environmental Studies Program, The University of Chicago.
Nollet, F., Kools, P. and Van Roy, F., (2000). Phylogenetic analysis of the cadherin superfamily allows identification of six major subfamilies besides several solitary members. J Mol Biol 299: 551–572.

108
Ogunjimi, A.A., Chandler, J.M., Gbenle, G.O., Olukoya, D.K.. and Akinrimisi, E.O. (2002). Heterologous expression of cry2 gene from a local strain of Bacillus
thuringiensis isolated in Nigeria, Biotechnol App. Bio. 36: 241–246 (Printed in Great Britain).
Oltean, D.I., Pullikuth, A.K., Lee, H.K. and Gill, S.S. (1999). Partial purification and characterization of Bacillus thuringiensis Cry1A toxin receptor A from Heliothis
virescens and cloning of the corresponding cDNA. Appl Environ Microbiol 65: 4760–4766.
Oppert, B., Kramer, K. J., Beeman, R. W., Johnson, D. and McGaughey, W. H. (1997). Proteinase-mediated insect resistance to Bacillus thuringiensis toxins. J Biol
Chem 272: 23473-23476.
Özcengiz G. and Alaeddino�lu, N.G. (1991). Bacilisin production and sporulation in Bacillus subtilis. Curr Microbiol 23: 61-64.
Özkan, M., Dilek F.B.,Özcengiz, G. (2003). Nutritional and cultural parameters influencing antidipteran delta-endotoxin production. Res Microbiol 154: 49–53. Paramatha, R.B. (2000). Hyper-production of insecticidal crystal protein (delta-endotoxin) by Bacillus thuringiensis var. israelensis is not related to soprulation-specific biochemical functions. Curr Microbiol 41: 187-191.
Park, H.W., Ge, B., Bauer, L.S. and Federici, B.A. (1998). Optimization of Cry3A yields in Bacillus thuringiensis by use of sporulation-dependent promoters in combination with the STAB-SD mRNA sequence. Appl Environ Microbiol 3932-3938.
Park, H.W., Bideshi, D.K. and Federici, B.A. (2000). Molecular genetic manipulation of truncated Cry1C protein synthesis in Bacillus thuringiensis to improve stability and yield. Appl Environ Microbiol 66: 4449– 55.
Parker, M.W. and Pattus, F. (1993). Rendering a membrane protein soluble in water: a common packing motif in bacterial protein toxins. Trends Biochem Sci 18: 391–395. Payne, J.M., Kennedy, M.K., Randall, J.B., Meier, H., Uick, H.J., Foncerrada,L., Schnepf, H.E., Schwab,G.E. and Fu, J. (1997). U.S. Patent No.
559607.
Porcar, M. and Juarez-Perez, V. (2003). PCR-based identification of Bacillus
thuringiensis pesticidal crystal genes. FEMS Microbiol Rev 26: 419-432.

109
Radnedge, L., Agron, P.G., Hill, K.K., Jackson, P.J., Ticknor, L.O., Keim, P. and Andersen, G.L. (2003). Genome differences that distinguish Bacillus anthracis
from Bacillus cereus and Bacillus thuringiensis. Appl Environ Microbiol 69(5) 2755–2764.
Rajamohan, F., Hussain, S.-R.A., Cotrill, J.A., Gould, F. and Dean, D.H. (1996). Mutations in domain II, loop 3 of Bacillus thuringiensis CryIAa and CryIAb d-endotoxins suggest loop 3 is involved in initial binding to lepidopteran midguts. J
Biol Chem 271: 25220–25226.
Rausell, C., Garcia-Robles, J., Sanchez, I., Munoz-Garay, C., Martinez-Ramirez, A.C., Real, M.D. and Bravo, A. (2004). Role of toxin activation on binding and pore formation activity of the Bacillus thuringiensis Cry3 toxins in membranes of Leptinotarsa decemlineata (Say). BBA 1660: 99– 105. Rhim S.L., Jahn N., Schnetter W. and Geider K. (1990) Heterologous expression of a mutated toxin gene from Bacillus thuringiensis subsp. tenebrionis”
FEMS Microbiol Lett 66: 95-100.
Rose, A.H. (1979). Production and industrial importance of secondary products of metabolism, In: Economic Microbiol , Vol. 3, Academic Press, London, pp.2-34.
Rossa, A.C. and Mignone, C. (1993). δ-endotoxin activity and spore production in batch and fed-batch cultures of Bacillus thuringiensis. Biotechnol Lett 15 (3): 295–300.
Rupar, M.J., Donovan, W.P., Groat, R.G., Slaney, A.C., Mattison, J.W., Johnson, T.B., Charles, J.-F., Dumanoir, V.C. and De Barjac, H. (1991). Two novel strains of Bacillus thuringiensis toxic to coleopterans. Appl Environ Microbiol
57: 3337-3344.
Quinlan, R.J. (1990). Registration requirements and safety considerations for microbial pest control agents in the European Economic Community. In: Laird M, Lacey LA, & Davidson EW ed. Safety of microbial pesticides. Boca Raton, Florida, CRC Press, pp 11–18. Sachidanadham, R., Jenny, K., Fiechter, A. and Jayaraman, K. (1997). Stabilizatiom and increased production of insecticidal crystal proteins of Bacillus
thuringiensis subsp. galleriae in steady- and transient-state continuous cultures. Appl
Environ Microbiol 47:12-17.
Sambrook, J., Fritsch, E.F. and Maniatis, T. (1989). Molecular Cloning: a Laboratory Manual, 2nd edn. Cold Spring Harbor, NY: Cold Spring Harbor Laboratory.

110
Sanchis, V. and Ellar, D.J. (1993). Identification and partial purification of a Bacillus thuringiensis CryIC δ-endotoxin binding protein from Spodoptera littoralis
gut membranes. FEBS Lett 316: 264–268.
Sanchis, V., Agaisse, H., Chaufaux, J. and Lereclus, D. (1996). Construction of new insecticidal Bacillus thuringiensis recombinant strains by using the sporulation non-dependent expression system of the cryIIIA and a site specific recombinant vector. J Biothechnol 48: 81-96.
Sangadala, S., Walters, F.S., English, L.H. and Adang, M.J., (1994). A mixture of Manduca sexta aminopeptidase and phosphatase enhances Bacillus thuringiensis
insecticidal CryIA(c) toxin binding and 86Rb(+)-K+ efflux in vitro. J Bio Chem 269: 10088–10092.
Sankaranarayanan, R., Sekar, K., Banerjee, R., Sharma, V., Surolia, A. and Vijayan, M. (1996). A novel mode of carbohydrate recognition in jacalin, a Moraceae plant lectin with a β-prism fold. Na Struct Biol 3: 596–603.
Sayyed, A.H., Haward, R., Herrero, S., Ferré, J. and Wright, D.J. (2000). Genetic and biochemical approach for characterization of resistance to Bacillus
thuringiensis toxin Cry1Ac in a field population of the diamondback moth, Plutella
xylostella. Appl Environ. Microbiol 66:1509-1516.
Schnepf, H.E., (1995). Bacillus thuringiensis toxins: regulation, activities and structural diversity, Curr Opin Biotech 6: 305-312. Schnepf, E., Crickmore, N., Van Rie, J., Lereclus, D., Baum, J., Feitelson, J., Zeigler, D.R. and Dean, D.H. (1998). Bacillus thuringiensis and its pesticidal crystal proteins. Microbiol Mol Biol Rev 62: 775–806.
Sekar, V., Thompson, D.V., Maroney, M.J., Bookland, R.G. and Adang, M.J. (1987). Molecular cloning and characterization of the insecticidal gene of Bacillus
thuringiensis var. tenebrionis. Proc Natl Acad Sci USA 84: 7036-7040.
Sekar, V. (1988). The insecticidal crystal protein gene is expressed in vegetative cells of Bacillus thuringiensis var. tenebrionis. Curr. Microbiol. 17:347– 349.
Shimizu, T. and Morikawa, K. (1996). The β-prism: a new folding motif. Trends
Biochem Sci 21: 3–6.
Sick, A., Gaerter, F. and Wong, A. (1990). Nucleotide sequence of a coleopteran active toxin gene from a new isolate of Bacillus thuringiensis subsp. tolworthi. Nucleic Acids Res 18: 1305.

111
Sikdar, D.P. and Majumdar, S.K. (1991). Effect of minerals on the production of the delta-endotoxin by Bacillus thuringiensis subsp. israelensis. Biotec Lett 13:.511-514.
Skot, L.S., Harrison, P., Nath, A., Mytton, R. and Clifford, B.C. (1990). Expression of insecticidal activity in Rhizobium containning the δ-endotoxin gene cloned from Bacillus tenebrionis subsp. tenebrionis. Plant Soil 127: 285–295.
Slaney, A.C., Robbins, H.L. and English, L. (1992). Mode of action of Bacillus
thuringiensis toxin CryIIIA: An analysis of toxicity in Leptinotarsa decemlineata (Say) and Diabrotica undecimpunctata howardi Barber. Insect Bichem Molec Biol 22 (1): 9-18.
Smedley, D.P. and Ellar, D.J. (1996). Mutagenesis of three surface-exposed loops of a Bacillus thuringiensis insecticidal toxin reveals residues important for toxicity, receptor recognition and possibly membrane insertion. Microbiology 142: 1617–1624.
Smith, G.P., Ellar D.J., Keeler, S.J. and Seip, C.E. (1994). Nucleotide sequence and analysis of an insertion sequence from Bacillus thuringiensis related to IS150. Plasmid 32: 10–18.
Stobdan, T., Kaur, S. and Singh, A. (2004). Cloning and nucleotide sequence of a novel cry gene from Bacillus thuringiensis. Biotechnol Lett 26: 1153–1156.
Stock, C.A., McLoughlin, T.J., Klein, J.A. and Adang, M.J. (1990). Expression of a Bacillus thuringiensis crystal proteins gene in Pseudomonas cepacia 526. Can J
Microb 36: 879–884.
Tabashnik, B.E. (1994). Evolution of resistance to Bacillus thuringiensis. Annu Rev
Entomol 39: 47-79.
Tamez-Guerra P, Iracheta M.M., Pereyra-Alférez B., Gal�n-Wong, L.J., Gomez-Flores R., Tamez-Guerra, R.S. and Rodr�guez-Padilla, C. (2004). Characterization of Mexican Bacillus thuringiensis strains toxic for lepidopteran and coleopteran larvae. J Invertebr Path 86: 7–18.
Tan, Y. and Donovan, W.P. (2000). Deletion of aprA and nprA genes for alkaline protease A and neutral protease A from Bacillus thuringiensis: effect on insecticidal crystal proteins, Short Communication. J Bacteriol 84: 67-72.

112
Tappeser, B., Jager, M. and Eckelkamp, C. (1998) “Survival, Persistence, Transfer – An Update on Current Knowledge on GMOs and the Fate of Recombinant DNA,” Institute for Applied Ecology, Germany. Terra W.R. and Ferreira C. (1994). Insect digestive enzymes: properties, compartmentalization and function. Comp Biochem Physiol 109B:1–62.
Theoduloz, C., Vega, A., Salazar, M., Gonza´lez E. and Meza-Basso L. (2003). Expression of a Bacillus thuringiensis δ-endotoxin cry1Ab gene in Bacillus subtilis and Bacillus licheniformis strains that naturally colonize the phylloplane of tomato plants (Lycopersicon esculentum, Mills). J Appl Microb 94: 375–381.
Toenniesen, G.H., O’Toole, J.C. and DeVries, J. (2003). Advances in plant biotechnology and its adoption in developing countries. Curr Opin Plant Biol 6: 1-8.
Tomlin, C.D.S. (1997). The pesticide manual, 11th ed. Farnham, Surrey, British Crop Protection Council. pp.1606
Tsuchiya, S., Kasaishi, Y., Harada, H., Ichimatsu, T., Saitoh, H., Mizuki, E. and Ohbac M. (2002). Assessment of the efficacy of Japanese Bacillus thuringiensis
isolates against the cigarette beetle, Lasioderma serricorne (Coleoptera: Anobiidae). J Invertebr Path 81: 122–126.
Vaeck, M., Reynaerts, A., Ho¨fte, H., Jansens, S., De Beukeleer, M., Dean, C., Zabeau M., Van Montagu, M. and Leemans, J. (1987). Transgenic plants protected from insect attack. Nature 328: 33–37.
Valaitis, A.P., Lee, M.K., Rajamohan, F. and Dean, D.H., (1995). Brush border membrane aminopeptidase-N in the midgut of the gypsy moth serves as the receptor for the CryIA(c) -endotoxin of Bacillus thuringiensis. Insect Biochem Mol Biol 25: 1143–1151.
Van Rie, J., McGaughey, W.H., Johnson, D.E., Barnett, B.D., and Van Mellaert, H. (1990). Mechanism of insect resistance to the microbial insecticide Bacillus
thuringiensis. Science 247: 72-74.
Van Rie, J., Van Mellaert, H. and Peferoen, M. (1992). Mechanism of insect resistance to Bacillus thuringiensis in Plodia interpunctella and Plutella xylostella. In: Molecular mechanisms of insecticide resistance: diversity among insects, Mullin, C. A. and Scott, J. G., Eds., American Chemical Society, Washington, DC.
Vidyarthi, A.S., Tyagi, R.D., Valero, J.R. and Surampalli, R.Y. (2002). Studies on the production of B. thuringiensis based biopesticides using waste water sludge as a raw material. Water Res 36: 4850-4860.

113
Von-Tersch, M.A., Slatin, S.L., Kulesza C.A. and English, L.H. (1994). Membrane-permeabilizing activities of Bacillus thuringiensis coleopteran-active toxin CryIIIB2 and CryIIIB2 domain I peptide. Appl Environ Microbiol 3711-3717.
Vora, D. and Snetha, Y.I. (1999). Enhanced growth, sporulation and toxin production by Bacillus thuringiensis subsp. kurstaki in soil seed meal extract media containing cyctine. World J Microb Biot 15: 747-749.
Walter, T.M. and Aranson, I. (1991). Appl Environ Microbiol 57: 1000-1005.
Wasano, N. and Ohba, M. (1998). Assignment of delta-endotoxin genes of the four lepidoptera-specific Bacillus thuringiensis strains that produce spherical parasporal inclusions, Curr. Microbiol., 37 (6): 408-411.
Wei, J-Z., Hale, K., Carta, L., Platzeri, E., Wong, C., Fang, S-C. and Aroian, R.V. (2003). Bacillus thuringiensis crystal proteins that target nematodes, Microbiol., 100 (5): 2760-2765.
Weinberg, E.D. (1974). Iron and susceptibility to infectious disease. Devel Ind
Microbiol 15-70.
Weinberg, E.D., (1977). Mineral element control of Microbial secondary metabolism, in: E.D. Weinberg (Ed.), Microorganisms and Minerals, Dekker, New York, pp.289-316.
Weiser, J. (1986). Impact of Bacillus thuringiensis on applied entomology in easatern Europe and in the Soviet Union, In Mitteilungen aus der Biologischen
Bundesanstalt für land- und Fostwirtschaft Berlin-dahem (Eds. Krieg, A. and Huger, A.M.) Herft. 233: 37-50, Paul Parey, Berlin.
Wirth, M.C., Georghiou, G.P. and Federici, B.A. (1997). CytA enables CryIV endotoxins of Bacillus thuringiensis to overcome high levels of CryIV resistance in the mosquito, Culex quinquefasciatus. Proc Natl Acad Sci USA 94: 10536-40.
Wong, H.C., Schnepf, H.E. and Whiteley, H.R. (1983). Transcriptional and translational start sites for the Bacillus thuringiensis crystal protein gene. J Biol
Chem 258:1960–1967.
Wong, H.C. and Chang, S. (1986). Identification of a positive retroregulator that stabilizes mRNAs in bacteria. Proc Natl Acad Sci USA 83: 233– 3237.

114
Wu, S.-J. Koller, C.N., Milter, D.L., Bauer, L.S. and Dean, D.H. (2000). Enhanced toxicity of Bacillus thuringiensis Cry3A 8-endotoxin in coleopterans by mutagenesis in a receptor binding loop.EBS Lett 473: 227-232.
Yang, X.M. and Wang, S.S. (1998). Development of Bacillus thuringiensis fermentation and process control from a practical perspective. (Minireview). Biotechnol Appl Biochem 28: 95-98 (Printed in Great Britain).
Yang, X.M. and Wang, S.S. (2000). Phase-specific optimization of multiple endotoxins-protein production with genetically engineered Bacillus thuringiensis. Biotechnol Appl Biochem 31: 71-76 (Printed in Great Britain).
Zouari, N., Ali S.B.S. and Jaoua, S. (2002). Production of delta-endotoxins by Bacillus thuringiensis strains exhibiting various insecticidal activities towards lepidoptera and diptera in gruel and fish meal media. Enzyme Microb Tech 31: 411–418.

115
APPENDIX A
APPENDICES
COMPOSITION AND PREPARATION OF CULTURE MEDIA
C2 Medium
g.L-1
Glucose 10
Peptone 2
NZ amine (a casein hydrolysate) 5
Yeast extract 2
(NH4)2SO4 1.98 (15 mM)
KH2PO4 3.13 (23 mM)
K2HPO4 3.48 (27 mM)
MgSO4.7H2O 0.25 (1 mM)
CaCl2 0.088 (600 µM)
MnCl2 0.0404 (250 µM)
ZnSO4.7H2O 0.00489 (17 µM)
CuSO4.5H2O 0.00425 (17 µM)
FeSO4.7H2O 0.00056 (2 µM)
The pH was adjusted to 7.2 and the medium was sterilized at 121 ° C for 15 minutes. DSM g.L-1
Nutrient Broth 4
Glucose 5

116
K2HPO4 4.3545 (25 mM)
KH2PO4 3.4045 (25 mM)
Ca(NO3)2 0.118 (0.5 mM)
MgSO4 0.0602 (0.5 mM)
FeSO4 0.00278 (10 µM)
MnCl2 0.00162 (10 µM)
The pH was adjusted to 7.2 and the medium was sterilized at 121 °C for 15 minutes.
GYS Medium
g.L-1 Glucose 1
Yeast extract 2
K2HPO4 0.05
(NH4)2SO4 0.2
MgSO4 0.02
MnSO4 0.05
CaCl2 0.08
The pH was adjusted to 7.2 and the medium was sterilized at 121 °C for 15 minutes. HCT Medium
g.L-1
Casein hydrolysate (vitamin free) 7
Glucose 3
KH2PO4 6,8
MgSO4.7H2O 0,12
MnSO4.7H2O 0,0022
ZnSO4.7H2O 0,014
Fe2(SO4)3 0,02
CaCl2.4H2O 0,18

117
The pH was adjusted to 7.2 and the medium was sterilized at 121 °C for 15 minutes.
10X-S-Base (NH4)2.SO4 20 g
K2HPO4.3H2O 140 g
KH2PO4 60 g
Na3citrate, 2H2O 10 g
dH2O 1 L
They were autoclaved together and allowed to cool to 50 °C and then supplemented
with 1 mL of sterile 1 M MgSO4.
HS-Medium 10X-S-Base 10 mL
Glucose, 50 % (w/v) 1 mL
Yeast extract, 10 % (w/v) 1 mL
Casamino acid, 2 % (w/v) 1 mL
Arginine 8 % (w/v) + Histidine 0.4 % (w/v) 10 mL
Tryptophane 0.5 % (w/v) 1 mL
Phenylalanine 0.3 % (w/v) 1.5 mL
Total volume was completed to 100 mL with sterile water.
LS-Medium 10X-S-Base 2 mL
Glucose, 50 % (w/v) 0.2 mL
Tryptophane, 0.5 % (w/v) 20µL
Phenylalanine, 0.3 % (w/v) 30 µL
Casamino acid, 2 % (w/v) 0.1 mL
Yeast exract, 10 % (w/v) 0.2 mL
50 mM Spermidine 0.2 mL

118
1 M MgCl2, 50 µL
Total volume was made up to 20 mL with sterile water.
Luria Broth
g.L-1
Luria Broth 25
Sterilized at 121 °C for 15 minutes
Nutrient Agar
g.L-1
Nutrient Broth 8
Agar 10
Sterilized at 121 ° C for 15 minutes
Luria Broth Agar
g.L-1
Luria Broth 25
Agar 15
Sterilized at 121 ° C for 15 minutes
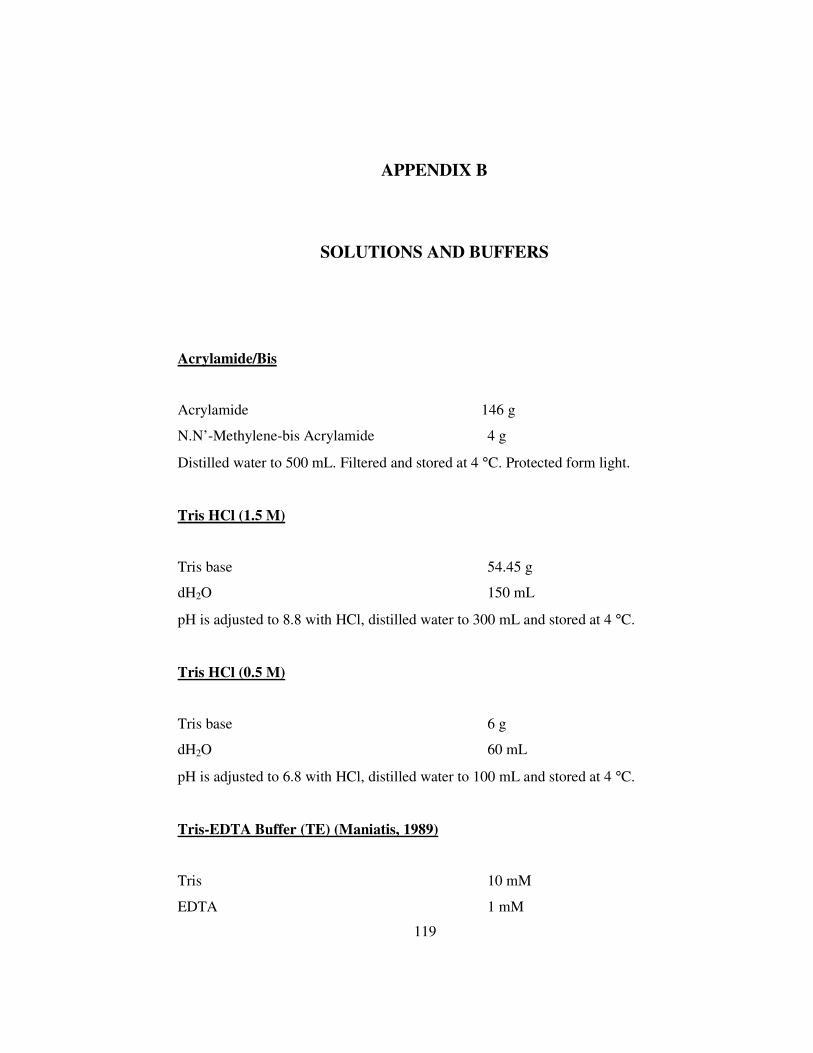
119
APPENDIX B
SOLUTIONS AND BUFFERS
Acrylamide/Bis
Acrylamide 146 g
N.N’-Methylene-bis Acrylamide 4 g
Distilled water to 500 mL. Filtered and stored at 4 °C. Protected form light.
Tris HCl (1.5 M)
Tris base 54.45 g
dH2O 150 mL
pH is adjusted to 8.8 with HCl, distilled water to 300 mL and stored at 4 °C.
Tris HCl (0.5 M)
Tris base 6 g
dH2O 60 mL
pH is adjusted to 6.8 with HCl, distilled water to 100 mL and stored at 4 °C.
Tris-EDTA Buffer (TE) (Maniatis, 1989)
Tris 10 mM
EDTA 1 mM

120
pH is adjusted to 8.0 with HCl.
Sample Buffer dH2O 3 mL
Tris HCl (0.5 M) 1 mL
Glycerol 1.6 mL
SDS (10%) 0.4 mL
β- mercaptoethanol 0.4 mL
Bromophenol blue (0.5%, w/v) (in water) 0.4 mL
Running Buffer (5X)
Tris base 15 g
Glycine 72 g
SDS 5 g
Distilled water to 1 L. Stored at 4 °C.
Phenol-Chloroform Solution (water-saturated, Hintermann, 1981)
Phenol 500 g
Chloroform 500 mL
Distilled water 400 mL
The solution was stored at room temperature, protected from light. Tris-Acetate-EDTA Buffer (TAE) (50 X)
Tris Base 242 g
Glacial Acetic Acid 57.1 mL
EDTA (0.4 M, pH 8.0) 125 mL
Distilled water added to 100 mL

121
Tris-EDTA Buffer (TE)
Tris-HCl (1 M, pH 8.0) 10 mL
EDTA (0.4 M, pH 8.0) 5 mL
Distilled water added to 1000 mL
TBE Buffer (Maniatis, 1989)
Tris base 0.089 M
Boric acid 0.89 M
EDTA 2 mM
pH 8.0-8.3
Total DNA Isolation Solution I TGE buffer, pH 8.0
Lysozyme 10 mg.mL-1
RNase 10 mg.mL-1
Solution II
NaOH 1 N
SDS 1 %
Solution III
Potassium acetate 5 M
pH 4.55
CTAB/NaCl Solution (10 % CTAB/ 0.7 M NaCl) 4.1 g of NaCl was dissolved in 80 mL of dH2O. Then, 10 g of CTAB
(hexadecyltrimethyl ammonium bromide) was added and dissolved with vigorously
shaking and gentle heating up to 65 ° C. Final volume was made up to 100 mL with
dH2O.

122
X-Gal (5-bromo-4-chloro-3-indolyl-B-D-galactoside) X-Gal 20 mg
Dimethylformamide 1 mL
The solution was stored at –20 ° C protected from light.
IPTG (Isopropyl-�-D-thiogalactoside) IPTG 100 mg
Distilled water 1 mL
The solution was filter sterilized and stored at –20 ° C.
Coomassie Blue R-250 Staining Coomassie blue R-250 0.25 g
Methanol 125 mL
Glacial Acetic acid 25 mL
dH2O 100 mL
Destaining Solution Methanol 100 mL
Glacial Acetic acid 100 mL
dH2O 800 mL

123
APPENDIX C
CHEMICALS AND THEIR SUPPLIERS
Chemicals
Acrylamide Merck
Agarose Prona
AgNO3 Merck
Ammonium persulphate AppliChem
Ampicillin Sigma
Bovine Serum Albumin Sigma
Bromophenol blue Sigma
CaCl2.2H2O Merck
Ca(NO3)2.4 H2O Merck
Casamino acid AppliChem
Casein hydrolysate (vitamin free) Fluka
Chloramphenicol Sigma
Chloroform Merck
Coomassie Brillant Blue G-250 Merck
Coomassie Brillant Blue R-250 Sigma
CTAB Sigma
Dimethylformamide Merck
EDTA AppliChem
Ethanol Botafarma
Ethidium bromide Sigma

124
FeSO4.7H2O Sigma
Fe2(SO4)3 Sigma
Formaldehyde Merck
Glacial Acetic acid Merck
Glucose Merck
Glycerol Merck
Glycine Merck
HCl Merck
IPTG Sigma
Isoamyl alocohol Merck
Isopropanol Merck
K-Acetate Merck
KH2PO4 Merck
K2HPO4 Merck
L-amino acids Sigma
Luria Broth Q-Biogene
Mercaptoethanol Sigma
Methanol Merck
MgSO4 Sigma
MgSO4.7H2O Merck
MnSO4.7H2O Carlo Erba
MnCl2.2 H2O Merck
NaCl Merck
NaOH Merck
Na2CO3 Merck
Na3citrate, 2H2O Merck
N, N’-Methylene bis-acrylamide Sigma
Nutrient broth Merck
Nutrient Agar Merck
Peptone Sigma
Phenol-chloroform-isoamylalcohol Sigma

125
Phenol Merck
Spermidine Sigma
Sodium thiosulphate Carlo Erba
Sucrose Merck
SDS Merck
TEMED Sigma
Tris Base Merck
Tris-HCl Merck
X-Gal Sigma
Yeast extract Difco
ZnSO4.7H2O Sigma
Enzymes KpnI MIB Fermantas
L buffer Roche
Lysozyme Q-Biogene
Proteinase K Sigma
RNase A Sigma
SacI MIB Fermantas
Taq DNA polymerase MIB Fermentas
Size Markers PstI digested /Lambda DNA MBI Fermentas
The DNA Marker yields the following 29 discrete fragments (in base pairs):
11501, 5077, 4749, 4507, 2838, 2556, 2459, 2443, 2140, 1986, 1700, 1159, 1093,
805, 514, 468, 448, 339, 264, 247, 216, 211, 200, 164, 150, 94, 87, 82, 15.
Protein molecular weight marker MIB Fermentas
β-galactosidase (116.2 kDa), bovine serum albumin (66.2kDa), ovalbumin (45
kDa), lactate dehydrogenase (35kDa), restriction endonuclease Bsp981 (25 kDa),

126
β-lactoglobulin (18.4 kDa) and lysozyme (14.4 kDa) were used as the size
markers.
Kits DNA Extraction Kit Qiagen
Plasmid Isolation Kit Qiagen
p-GEM T Vector Promega