a large single-aperture telescope for submillimeter astronomy · a large single-aperture telescope...
TRANSCRIPT

A large single-aperture telescope for submillimeter astronomy
Wayne Holland,
a Rob Ivison,
a William Dent,
a Eli Atad,
a Ian Robson,
a Andy Longmore,
a
Tim Hawarden,a Jane Greaves,
b James Dunlop,
c Derek Ward-Thompson,
d
Wolfgang Wilde
a UK Astronomy Technology Centre, Royal Observatory,
Blackford Hill, Edinburgh EH9 3HJ, UK b School of Physics & Astronomy, University of St Andrews,
North Haugh, St Andrews KY16 9SS, UK c Institute for Astronomy, Royal Observatory, Blackford Hill, Edinburgh EH9 3HJ, UK
d Department of Physics and Astronomy, 5 The Parade,
Cardiff University, Cardiff CF24 3YB, UK e SRON Netherland Institute for Space Research,
PO Box 800, 9700 AV Groningen, the Netherlands
Copyright 2006 Society of Photo-Optical Instrumentation Engineers.
This paper was published in Ground-based and Airborne Telescopes, Proc. SPIE 6267,
2E, and is made available as an electronic reprint with permission of SPIE. One print or
electronic copy may be made for personal use only. Systematic or multiple reproduction,
distribution to multiple locations via electronic or other means, duplication of any
material in this paper for a fee or for commercial purposes, or modification of the content
of the paper are prohibited

A large single-aperture telescope for submillimeter astronomy
Wayne Hollanda*, Rob Ivisona, William Denta, Eli Atada, Ian Robsona, Andy Longmorea, Tim Hawardena, Jane Greavesb, James Dunlopc, Derek Ward-Thompsond, Wolfgang Wilde
aUK Astronomy Technology Centre, Royal Observatory, Blackford Hill, Edinburgh EH9 3HJ, UK
bSchool of Physics & Astronomy, University of St Andrews, North Haugh, St Andrews KY16 9SS, UK
cInstitute for Astronomy, Royal Observatory, Blackford Hill, Edinburgh EH9 3HJ, UK dDepartment of Physics and Astronomy, 5 The Parade, Cardiff University, Cardiff CF24 3YB, UK
eSRON Netherland Institute for Space Research, PO Box 800, 9700 AV Groningen, the Netherlands
ABSTRACT The large submillimeter telescope (LST) is a proposed wide-field, 30m-class telescope operating from a ground-based site in the relatively unexplored 0.2 – 1mm waveband. The telescope will be equipped with imaging and spectroscopic instrumentation to allow astronomers to probe the earliest evolutionary stages of galaxies, stars and planets. It is intended to operate the telescope in the 200µm atmospheric window, giving access to unique science; probing the peak emission from the cosmic far-IR/submm background and proto-stellar cores. The wide field-of-view and superb image fidelity will be perfect for large-scale surveys of the sky, such as entire giant molecular clouds and of fields of dusty ga1laxies at early epochs. It will therefore be an ideal complement to new generation interferometers (such as ALMA). In this paper we present an update on the science case and outline initial designs for both the telescope and instrumentation. Keywords: Submillimeter astronomy: Large submillimeter telescope, large-format imaging and spectroscopic arrays
1. INTRODUCTION The submillimeter (0.2 – 1mm) is a critical waveband for studying the very cold material associated with the earliest stages of galaxies, stars and planets. For example, the blackbody emission of a 10K source (or a 40K source at redshift ~3) will peak around 300µm. Observations trace molecular (H2) gas using either spectral lines from molecules or thermal emission from dust grains. The continuum emission is invariably optically thin, so observations can probe to the heart of the most crucial processes with the consequence that masses/geometries are determined in a less model-dependent way than in the optical/IR. On larger scales, the vast majority of UV/optical light emitted from stars within young galaxies is trapped within enshrouding dust clouds and re-emitted in the submm. Only by observing at the longer wavelengths can the total energy budgets be determined. The quantity of dust in young galaxies gives a measure of the numbers of stars formed, allowing us to determine whether stars have been produced steadily or formed mainly in the early Universe1. Undertaking submm observations from ground-based observatories is a challenge since atmospheric transparency is often poor and the high background power and sky emission variability limit the observing sensitivity2. Nevertheless, single-dish telescopes (of 10 – 15m class) are now routinely operating with high efficiency and have led to enormous advances in our understanding of the formation of galaxies, stars and planets. For example, in cosmology it has been shown that the far-IR/submm background is composed of high-z ultraluminous dusty galaxies, allowing the study of galaxy formation and evolution in the early Universe3. In our own Galaxy the first images of dusty belts of comets around nearby stars4 have provided a vital window on planet formation. Despite the pioneering breakthroughs, the angular resolution, sensitivity and field-of-view available from current telescopes (and instrumentation) are severely restricted. The angular resolution (at best 8 − 15 arcsecs) makes source confusion a major issue at only moderate depths. Imaging to any great depth is painfully slow – requiring many tens of hours to reach the extragalactic confusion limit at 850µm. Finally, current imaging arrays have only a modest number of pixels (typically ~100 to a few hundred) and so surveying large areas is largely prohibitive. New large-format cameras are under development for both ground-based and space-borne observatories, but the angular resolution and confusion
*email address: [email protected]

limits will remain restricted by modest apertures. This paper outlines the case for a 30m, wide-field telescope working at wavelengths of 0.2 – 1mm. Highlights from the science case are presented as well as preliminary design considerations for the telescope and instrumentation.
2. SCIENTIFIC CASE FOR A LARGE SUBMILLIMETER TELESCOPE The unique advantages of a wide-field 30m aperture telescope are that simultaneous large-area imaging and good angular resolution are potentially available from the same instrument. This section outlines areas where LST could contribute unique science.
2.1 Extragalactic science case 2.1.1 Cold dust in nearby galaxies Infrared studies may have missed the bulk of star formation activity in nearby spiral galaxies since most of the dust mass resides in cold, extended, low-surface brightness disks, often far from the galactic nucleus5. The limited studies so far have revealed that 90% of the total dust mass is located within galactic disks which were undetectable by IRAS6. Dust temperatures are around 10 – 20K and so radiate strongly in the submm7 (see example in Figure 1). A submm equivalent of the Schmidt survey would give a resolution of ~5kpc at a distance of 500Mpc (z ~ 0.1) – achievable with 2 arcsecs resolution at 200µm with LST. Furthermore, the imaging power and resolution achievable with LST would allow the study of individual giant molecular clouds far from the galactic nucleus in more nearby galaxies. This would address issues such as whether molecular cloud-cloud shielding or high HI optical depth can result in substantial underestimates of the gas surface density, and hence seriously compromising optical studies of star formation efficiency.
Figure 1 (left): 450µm image of the nearby spiral galaxy NGC 4631. The horizontal scale is approximately 14 arcmin (52 kpc) and so a large field-of-view is needed to map entire galaxies, (right): spectral energy distribution of the total measured galaxy flux highlighting a substantial cold dust component radiating at ~15K.
Key science drivers: • How is the cold dust distributed in nearby galaxies, and does it extend well beyond the stellar disk? • How much of this cold material contributes to the total mass at large radii and how does it affect the rotation curve?
Key requirements for LST: A large-field of view (ideally, >25 sq-arcmins) to image entire galaxies, combined with angular resolution of order 2 – 4 arcsecs which would allow individual molecular clouds to be studied.
2.1.2 Intergalactic medium Galaxy Clusters with massive central ellipticals have a hot extended X-ray halo, often many tens of arcmin across in the closer objects. These haloes were originally thought to be cooling flows, possibly linked to dark-matter haloes. In many cases this emission is thought to have a significant and possibly extended cold component; CO has been observed in some of the brightest objects7. However the masses are extremely uncertain, and in most cases the dust is somewhat under-abundant and therefore too weak to detect let alone map with existing instrumentation. However, it is not clear whether this cold material is linked to possible mergers rather than the cooling flow. Key science drivers: • How significant is the mass of this cold component? Is it primordial? • What is its distribution compared with the X-ray observations?

Key requirements for LST: Deep extended mapping over fields of tens of arcmins; angular resolution must be sufficient to separate out the galaxies themselves, leaving only extended dust (2 – 4 arcsecs).
2.1.3 Galaxy formation The discovery by COBE of the submm background8 led to the suggestion that the epoch of galaxy formation was associated with dust enshrouded star formation at 3 < z < 10. Subsequent observations by arrays such as SCUBA have allowed individual objects to be resolved – the result being the discovery of a new population of distant ultraluminous FIR galaxies with space density approximately three orders of magnitude higher than that of their local analogues9,10. Their high redshifts (median z ~ 2.4)11, prodigious star formation rates (>1000 Msun/yr) and high CO masses12 are consistent with them evolving to become the population of luminous elliptical galaxies found in the local universe. Although these surveys have revolutionised our view of galaxy formation they have three major drawbacks. First, the relatively long submm/mm observing wavelengths (850 – 1200µm) are far removed from that at which the background light peaks (~200µm). Second the poor angular resolution (11 – 15 arcsec) of the surveys means that it is often difficult to unambiguously identify the galaxy counterpart at optical, IR or even radio wavelengths, as demonstrated by the example shown in Figure 2 (from the SHADES survey13,14). Third, this same poor angular resolution means that the surveys become confusion limited before 50% of the background can be resolved15,16. A prime extragalactic science driver for LST is thus to resolve the submm extragalactic background light at a wavelength close to its peak.
Figure 2: An illustration of the problems currently faced when attempting to unambiguously identify the galaxy counterpart of a SCUBA source at other wavelengths. (left): A VLA 1.4 GHz contour image centred on the position of the 850µm source SXDF850.6 from the SHADES survey13,14. The circle is the size of the JCMT beam at 850µm (~15 arcsec) and it can be seen that there are three alternative radio identifications within the beam. (right): The same field, but this time with the radio contours (in green) overlaid on a true-colour optical image of the field taken with SuprimeCam on Subaru. Again, there are clearly several alternative optical counterparts, and it is of course possible that the true submm galaxy is none of these. To resolve this situation one currently needs to obtain a mm/sub-mm interferometric image with IRAM or the SMA, but this is clearly not practical for a very large sample of sources. A 30m LST, operating at wavelengths as short as 200µm would provide imaging with sufficient resolution to decide which of the alternative identifications is the correct one, without recourse to interferometric follow-up.
SCUBA and MAMBO data have been used to predict the number counts expected from surveys conducted at 200µm (Figure 3). These predictions are based on the model of Jameson17 and extrapolated to 200µm by assuming that the dust emission has a greybody form with temperature 37K, emissivity index 1.5 and critical frequency 2000GHz. The confusion limit is defined to be 1 source per 30 beams, which results in a confusion limited flux density of ~ 0.1 mJy at 200µm for a 30m aperture – 10 times deeper than with SCUBA. The right-hand panel of Figure 3 shows that at this limiting flux density the entire submm background can be resolved with LST. With redshift information the evolution of the luminosity function of the entire dust-enshrouded galaxy population can be determined. Key science drivers:
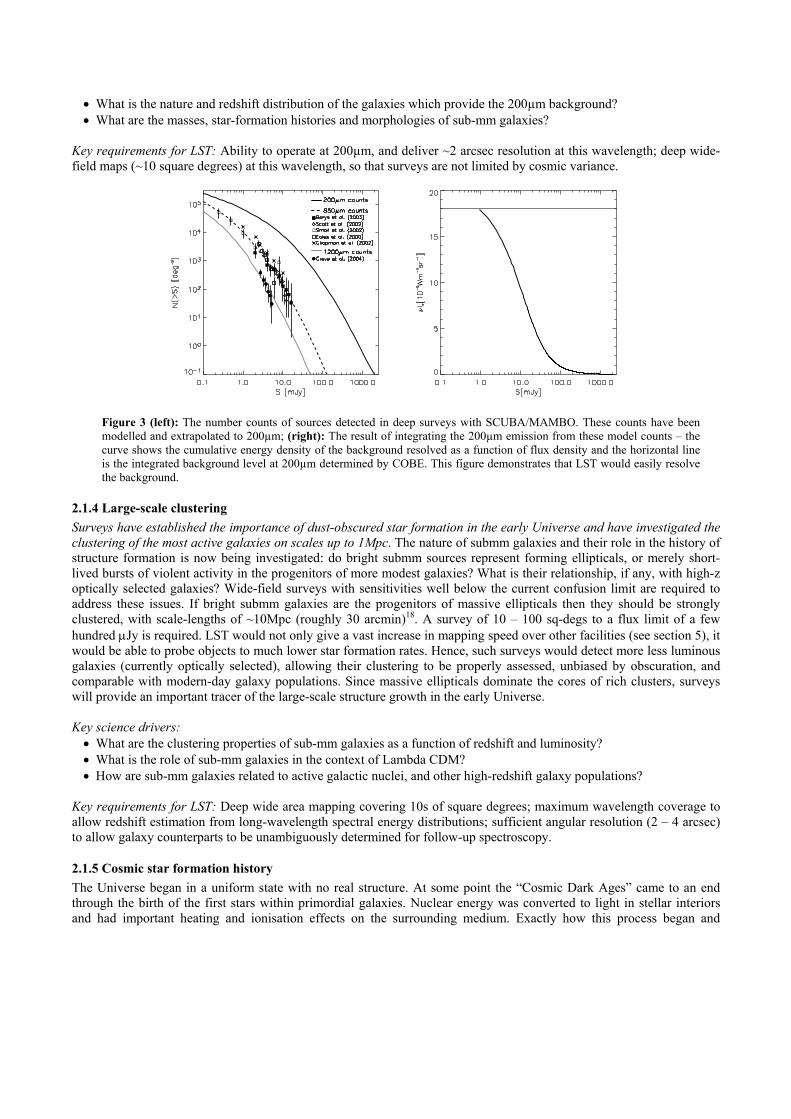
• What is the nature and redshift distribution of the galaxies which provide the 200µm background? • What are the masses, star-formation histories and morphologies of sub-mm galaxies?
Key requirements for LST: Ability to operate at 200µm, and deliver ~2 arcsec resolution at this wavelength; deep wide-field maps (~10 square degrees) at this wavelength, so that surveys are not limited by cosmic variance.
Figure 3 (left): The number counts of sources detected in deep surveys with SCUBA/MAMBO. These counts have been modelled and extrapolated to 200µm; (right): The result of integrating the 200µm emission from these model counts – the curve shows the cumulative energy density of the background resolved as a function of flux density and the horizontal line is the integrated background level at 200µm determined by COBE. This figure demonstrates that LST would easily resolve the background.
2.1.4 Large-scale clustering Surveys have established the importance of dust-obscured star formation in the early Universe and have investigated the clustering of the most active galaxies on scales up to 1Mpc. The nature of submm galaxies and their role in the history of structure formation is now being investigated: do bright submm sources represent forming ellipticals, or merely short-lived bursts of violent activity in the progenitors of more modest galaxies? What is their relationship, if any, with high-z optically selected galaxies? Wide-field surveys with sensitivities well below the current confusion limit are required to address these issues. If bright submm galaxies are the progenitors of massive ellipticals then they should be strongly clustered, with scale-lengths of ~10Mpc (roughly 30 arcmin)18. A survey of 10 – 100 sq-degs to a flux limit of a few hundred µJy is required. LST would not only give a vast increase in mapping speed over other facilities (see section 5), it would be able to probe objects to much lower star formation rates. Hence, such surveys would detect more less luminous galaxies (currently optically selected), allowing their clustering to be properly assessed, unbiased by obscuration, and comparable with modern-day galaxy populations. Since massive ellipticals dominate the cores of rich clusters, surveys will provide an important tracer of the large-scale structure growth in the early Universe. Key science drivers: • What are the clustering properties of sub-mm galaxies as a function of redshift and luminosity? • What is the role of sub-mm galaxies in the context of Lambda CDM? • How are sub-mm galaxies related to active galactic nuclei, and other high-redshift galaxy populations?
Key requirements for LST: Deep wide area mapping covering 10s of square degrees; maximum wavelength coverage to allow redshift estimation from long-wavelength spectral energy distributions; sufficient angular resolution (2 – 4 arcsec) to allow galaxy counterparts to be unambiguously determined for follow-up spectroscopy.
2.1.5 Cosmic star formation history The Universe began in a uniform state with no real structure. At some point the “Cosmic Dark Ages” came to an end through the birth of the first stars within primordial galaxies. Nuclear energy was converted to light in stellar interiors and had important heating and ionisation effects on the surrounding medium. Exactly how this process began and

subsequently evolved is one of the greatest cosmological puzzles. Recent work in the submm has shown that luminous infrared galaxies evolve more strongly than their more normal optically-bright counterparts. It has also become clear that luminous obscured galaxies at high redshift contribute a substantial fraction (arguably the majority) of the total emitted radiation in the Universe. Roughly half of all the stars that have formed by the present day have probably formed in highly obscured systems. To trace the star-formation history of the various classical galaxies (ellipticals, spirals) over cosmic history with sufficient precision requires a sample size of around 1 million galaxies. A large project such as this would require mapping 10 sq-degrees to 0.02 mJy sensitivity at 850µm; this could be achieved in a few months observing with LST. The high spatial resolution would yield accurate galaxy positions, whilst simultaneous 850/450µm measurements (and preferably also 350µm of the brightest) would allow photometric redshifts to be obtained19. Key science drivers: • What is the evolving bolometric luminosity function of the submm galaxy population? • What is the evolving bolometric luminosity function of galaxy populations elected at shorter IR wavelengths? • Hence clarify the cosmic history of star-formation density, and the role of sub-mm selected galaxies within it.
Key requirements for LST: Deep mapping at sufficient resolution (2 – 4 arcsec) to resolve the background and identify galaxy counterparts; broad wavelength coverage (1mm – 200µm) to allow long-wavelength redshift estimation, the derivation of bolometric luminosities, and the separation of the galaxy populations which dominate at different wavelengths.
2.2 Galactic science case 2.2.1 Solar system studies Understanding the properties of populations of objects such as comets and asteroids are critical to our understanding of the origin of the Solar System. These populations are either primordial from the formation of the Solar System, or created subsequently through collisions. The submm fluxes provide critical data to enable the measurement of sizes down to ~10 m in the Asteroid belt and of order 50 km in the Kuiper Belt (with only optical/IR observations the size can only be very roughly estimated assuming a fixed albedo). Furthermore, the submm fluxes and SED can be used to estimate the surface properties of the regoliths, and the improved sensitivity of LST over existing facilities will enable this to be done over a wide range of size scales. The smaller KB size regime is very interesting for as well as containing most of the KBO mass it is below the cutoff diameter where bodies are no longer held together by gravitational force20. Indeed, they are approaching the sizes of classical comets, and may be the link between the two populations. Key science drivers: • What are the size distribution and albedo of the comet/asteroid populations? • What are the surface/regolith properties, such as thermal inertia, roughness and emissivity? • Is there a link between the smaller Kuiper belt objects and short period comets?
Key requirements for LST: Broad wavelength coverage from 200 to 850µm, coupled with <10 mJy sensitivity (at least at 450/850µm) to detect faint KBOs.
2.2.2 Debris disks around nearby stars Debris disks give us not only an effective “time series” showing how our early planetary system evolved from a circumstellar disk, but observed clumps and cavities have the potential for pinpointing the locations of young planets21. Work so far with single-dish telescopes (JCMT, Spitzer) has lacked sensitivity – limiting studies to only a handful of disks (a problem also for the SMA), as well as angular resolution – only features of order 20 AU and above have been observed for the closest stars. Figure 4 shows the observed debris disk surrounding Vega and a model prediction of the structure of the disk, highlighting that current observational data lack sufficient resolution to fully test the uniqueness of resonance models. Arcsecond imaging with LST would improve this by close to an order of magnitude (down to ~2 AU). This would resolve, for example, gaps in the disk where dust is being accreted by migrating giant planets. The extra sensitivity of a 30m LST would also detect dust mass similar to that in our Solar System around stars as distant as 30pc. Key science drivers: • What fraction of stars has debris dust? Is our Solar System unusual in being relatively dust-free?

• What is the long-term debris evolution of debris around stars? • How does stellar location, mass, metallicity and multiplicity affect the debris mass?
Key requirements for LST: High angular resolution (2 – 4 arcsecs corresponds to 2 – 4 AU for the closest stars); <10mJy sensitivity at 850µm and (preferably) 450µm to measure Solar system dust masses around stars out to ~30pc.
Figure 4 (left): The observed debris disk around Vega5 with 14 arcsec resolution using JCMT/SCUBA. (right): A model prediction16 of the structure of the Vega disk with ~1 arcsec resolution. The location and orbital motion of the driving planet is shown by the diamond and arrow.
2.2.3 Star formation Most stars form in some kind of binary or higher multiple systems, but the evolution of proto-multiples is very poorly known. Tracing the sequence from cold cores through accreting protostars to emerging T Tauri stars requires imaging a molecular cloud a degree or so across – but to obtain an accurate census of all objects needs submm proto-binary systems down to arcsecond scales to be resolved. The 2 – 4 arcsec resolution achievable with LST corresponds to scales of 200 – 400 AU for nearby clouds like Ophiuchus and Taurus. These are the scales on which pre-stellar cores are predicted to begin fragmentation to form binary stars (see Figure 5)22. In addition, the evolving systems are also embedded in a large background (typically only a few percent of a cloud’s mass ends up in young stars), and this background dictates the pre-stellar evolution. The large-field coverage available from LST will be vital for these observations. The key to understanding the formation of the lowest mass stars is to determine the mass function of protostellar clumps down to the sub-stellar limit. This requires large-scale, deep and high angular resolution surveys of the closest star formation regions with the deepest large-scale maps currently reaching limits of ~0.1Jy at 850µm23. The sensitivity achievable with LST will allow considerably lower mass limits to be obtained – potentially to Earth-like masses. For example, in just a couple of minutes LST could achieve a limit of around 1 mJy at 450µm (10σ confusion limit) over the entire field-of-view. Such data will measure the true IMF at its earliest stage, including accounting correctly for resolved binaries, eliminating transient cloud peaks (by spectroscopy to measure gas kinematics) and obtaining true core masses deconvolved from the large-scale background. These goals are not achievable with current single dishes as the cores are merged at moderate resolution. A full understanding of the star formation process requires an understanding of how the rare, massive stars form and shape the evolutionary history of giant molecular clouds and subsequent star and planet formation. The early stages of high-mass star formation are not well understood, largely because they occur so fast and are consequently rare. A full census of high-mass star formation throughout the Galaxy will be possible with LST as the resolution (2 arcsec at 200µm) will resolve OB clusters out to 10 kpc. The resultant statistics will show the rarest of phases and allow an understanding of what defines the highest mass end of the stellar IMF. LST could even resolve the heavily embedded environments surrounding the star. This could provide information on disk structure since gas flowing in through disks is a leading contender to solve the problem of the luminosity of massive stars blowing gas away rather than accreting it. Key science drivers:

• The origin of binarity in star formation • Investigation of the mass function of proto-stellar clumps down to the sub-stellar limit • The effect of massive stars on the ISM
Key requirements for LST: Simultaneous large-area imaging and high angular resolution (2 – 4 arcsec) are crucial for observing multiple scales from entire molecular clouds down to low-mass cores in the Galaxy; sensitivity of ≤10 mJy at 350/450µm to allow cores down to Jupiter masses to be measured over entire clouds.
Figure 5: Simulations of star formation in molecular cloud cores17. Column density plots of the evolution of a region around a central star as it produces a second object. The spiral features shown forming become self-gravitating and form knots long the arms. The scale of each box is 1000 AU so is well-matched to the angular resolution of LST for the nearest clouds.
2.2.4 Supernovae and evolved stars Submillimeter astronomy relies on the existence of interstellar dust, but surprisingly very little is known about its origin. It is generally assumed that about half the dust in the ISM has been produced in supernovae, but there is almost no evidence that this is the case. The ideal way to test this is to observe supernovae remnants (SNR) that are young enough such that little dust will have been swept up from the ISM. However, even young SNRs are too large, with too low surface brightness to be imaged with current facilities. For the few that have been studied so far (including Cas A and Kepler)24 there exists potential confusion with unassociated dust in the line of sight25 as well as separating out the dominant synchrotron emission in the 850µm images. Sensitive large-scale mapping at 450µm (as well as 850µm) with high spatial resolution to identify the extended dust emission in the SNR is required. The other source of dust, evolved stars, produce extended shells that are many arcminutes from the parent stars. In addition, episodic violent ejection can produce rings of enhanced emission that are only a few arcseconds thick. Imaging at 2 – 4 arcsec resolution with LST would trace the inter-ring spacings, and thus show if ejection occurs on regular or random timescales, and (from the ring width and expansion velocity) for how long these episodes last. Although dust is produced by such post-main sequence stars, the physics is poorly understood. Are the shells clumpy, for example, with dust formed only in the densest regions? What are the production rates? Does the dust survive as it meets the harsh interstellar environment at the outer boundary of the envelope? High-resolution imaging is the only way to measure the dust masses in small clumps and a wide field plus high sensitivity is necessary to measure the faint tail of dust at the outer edges of these nebulae. Key science drivers include: • What is the origin of dust in the interstellar medium? • What are the properties of the dust produced?

Key requirements for LST: SNRs: shorter wavelengths and spectral slope to discriminate against synchrotron emission; Evolved stars: wide-field to encompass entire shell with 2 – 4 arcsec resolution to measure rings and inter-ring spacing.
2.2.5 Polarization of dust Polarization studies in the submm give unique information about the dust alignment, magnetic field structure and grain structure that is unavailable at other wavelengths. For example, knowledge of extinction in the submm is a most important property as it is widely used to measure the conversion of measured flux to dust mass. This can only be determined with an accurate knowledge of the grain properties and these are derived from polarization measurements. The ratio of the submm and visible polarization provides unique information to constrain the shape of the dust particles. However, with current instruments the relatively low angular resolution and sensitivity, limit submm polarimetry to only the very brightest regions of clouds. Today, star formation regions have been detected with polarization from ~1% in unresolved central clumps, up to ~20% in the resolved outer regions (see Figure 6). LST could resolve magnetic field structure within protostellar cores (radii of 1000’s AU). This would show whether the field helps to channel gas and control infall rates.
Figure 6: Polarization of 850µm continuum from the NGC2068 star formation region26. Y-axis scale is in arc-minutes. Complex structure can be seen, frequently unresolved by the beam (14 arcsec), at a high level of polarization (up to 12%).
Key science drivers include: • Submm extinction property • Key role of magnetic fields in the star formation process
Key requirements for LST: Additional hardware in form of rotating half-wave plate; large field-of-view to investigate large scale magnetic field structure; high angular resolution (2 – 4 arcsec) to probe field structure in protostellar cores.
3. TELESCOPE DESIGN From the science case the following have emerged as the major requirements for LST:
• To carry out wide-field imaging (tens of degrees) with moderate resolution (2 – 4”) • The ability to image below current confusion limits (0.2 – 0.5 mJy) over selected areas of sky • To operate at the shorter submillimeter wavelengths (350µm or less, with a goal to access the 200µm window)
A move to the shorter wavelengths (350µm or less) is desirable not only for improved angular resolution but also to be closer to the peak wavelength of the emission from dusty pre-stellar cores and of the high-z submm background. From dry sites (e.g. Atacama/South Pole) it is possible to exploit the 200µm atmospheric window for up to 40% of the year.

This would allow far-IR ground-based follow-up at arcsecond resolution in this crucial waveband for the first time. With data longwards of 450µm, it is impossible to distinguish material of different temperatures as the dust spectrum measured is that of the Rayleigh-Jeans tail and has constant slope. In contrast the 200µm points are at the turnover of the emission curve and this turnover determines the temperature. Therefore it would be possible to decide whether a dust core is pre-stellar or contains a warm protostar that has commenced nuclear fusion. Also, by measuring the far-IR/submm colours direct redshift constraints for distant galaxies could be obtained (without optical identification being required). In summary, the scientific drivers for LST dictate a telescope with the top-level requirements outlined in Table 1.
Parameter Requirement Notes
Aperture 30m
<2 arcsecs resolution at 200µm ~10 mJy/√Hz sensitivity at 450µm
Wavelength range 0.2 – 1mm
Operate near the peak of the far-IR/submm background and pre-stellar cores
Field-of-view At least 5 × 5 arcmins
Goal of 10 × 10 arcmins to carry out large-scale surveys
Table 1: Summary of the top-level requirements for 30m submillimeter telescope.
3.2 Opto-mechanical design Most of the challenges associated with designing a 30-m wide-field submillimeter telescope are common to the design of new generation extremely large optical/IRtelescopes27. The submillimeter design relaxes all tolerances because of the longer wavelength and so should result in a telescope that is less complex and far less costly than an optical/IR counterpart. The optical design needs to ensure a wide field-of-view, a fast (low f-ratio) primary to keep the structure as compact as possible, and to provide a convenient location for the instrument bay (the re-imaged field should also keep the array size manageable). Although a prime focus design would be the simplest (and cheapest) option this would not provide a convenient location for the (large) instruments. The proposed optical design for the telescope is shown in Figure 7 and is based on a classical Ritchey-Chretian, 30m clear aperture with an f/1 primary that is aspheric (almost paraboloid) and segmented. The f/15 secondary mirror is convex and hyperboloid. This system is optimized for a 10 arcminute diameter field-of-view and has a concave focal surface (pointing towards the sky and a radius of curvature of 3.4m). The design provides access to a Nasmyth platform which is convenient for the instrument bay.
Figure 7: Optical design for a 30-m wide-field submillimeter telescope. Such a design will allow a convenient location to house an instrument bay. Should it prove necessary to adopt a sky-cancellation scheme (chopping) it is envisaged that this could be achieved using M3.
The surface accuracy required is dictated by the requirement to operate at the shortest wavelength (i.e. 200µm). The overall large-scale surface accuracy of the primary must be better than λ/20 i.e. 10µm rms. This dictates that individual panels must be better than about 5 µm rms. Panels could be made from aluminium supported by a carbon fibre backing structure, which has a low coefficient of thermal expansion as well as providing a strong, low-weight structure.

3.3 Environmental impacts on design There are also a number of environmental issues that will have an impact on the telescope design. These include diurnal temperature variations causing thermal distortions of the telescope optics, wind buffeting causing pointing and tracking drifts, and submillimeter “seeing” causing image shift and smearing.
3.3.1 Diurnal temperature variations The telescope could be used for up to 20 hours a day and so must be capable of maintaining diffraction-limited imaging during diurnal temperature changes. It is well known that the shape of the 15m JCMT dish changes with temperature and this has the effect of moving source structure from the main beam into the sidelobes. Active surface correction can in principle be achieved by fast-reacting actuators that move individual panels to correct for thermal (and gravitational) induced deformations. It should be possible to employ a system of temperature sensors over the main structural elements of LST to measure the thermal expansion of the main structure elements. The temperature sensor output is then fed into a finite element model, which in turn applies the relevant corrections to the actuators on the primary mirror panels. This will allow the telescope to correct for thermal distortions and to “freeze” the surface into its optimum shape.
3.3.2 Pointing requirements With a primary beam of only ~2 arcseconds at 200µm, accurate pointing and tracking is essential. The telescope will need to point locally to at least an accuracy of 0.5 arcsecond. Whilst this is a technical challenge in its own right, wind shake is a major concern and may dictate the need for an enclosure – perhaps incorporating a radome. Alternatively, for an open-air structure, the pointing stability could be maintained using an active real-time correction scheme. The 50m Large Millimeter Telescope (LMT)28 in Mexico plans to achieve this by incorporating inclinometers (mounted near the telescope elevation axis), and temperature sensors on the structure. Together with a finite element model and look-up tables these measurements give information on the structural deformations and can be used to predict and correct pointing behavior. Another possibility is the use of metrology systems to directly measure structural deformations such as the shape of the primary and the location of the secondary with respect to the optimum configuration.
3.3.3 Submillimeter seeing Fluctuations in the atmospheric water vapor (WV) content as it drifts through the telescope beam causes variations in the path-length from source to telescope. This is submillimeter “seeing”29 and causes short-term pointing shifts (which degrade S/N of an observation) as well as image smearing. This is most evident with interferometers (such as the SMA) where corrections for WV variation are made independently for each telescope. The submm seeing on Mauna Kea has a median value ~1 arcsec but in unstable conditions (around sunrise/sunset) can be 5 – 10 arcsecs. Interferometers measure the atmospheric emission at different points across the aperture and apply a tip-tilt correction to the telescope surface and this could be adopted for LST. Seeing variations are set by the time for WV clumps to cross the aperture. With typical winds of 5 m/s, corrections every 6 seconds would be needed for LST. Alternatively, the tilt corrections could be fed into the data reduction and corrections made via an image regridding algorithm. Finally, it may be possible to use “submm guide stars” to perform a shift-and-add correction by using point-like galaxies/quasars in the few mJy flux range (sufficient for good S/N in a few secs integration). In principle, this would correct for both telescope flexure and seeing.
3.4 Site considerations The atmosphere is largely opaque in the submillimeter and it is only by observing from high, dry sites that observations can be undertaken from the ground. Furthermore, the line-of-sight water vapor level has a strong and significant effect on LST sensitivity (as shown in Figure 8). For LST to operate at the shortest submillimeter wavelengths an exceptional site is required. The three best studied sites for submillimeter astronomy, which have been subsequently chosen as sites for large telescopes, are Mauna Kea in Hawaii (4100m), Cerro Chajnantor in Chile (5000m) and the Amundsen-Scott station at the South Pole (2800m). In principle, the South Pole is the best site for a LST, although poor sky coverage as well as the logistics of operation are major detrimental factors. There are also indications that higher peaks, such as the 5700m summit of Cerro Chascon in the vicinity of Chajnantor30, are even drier and could be suitable for a large telescope.

1
10
100
1000
0 1 2 3 4
Precipitable water vapour (mm)
NE
FD (m
Jy/r
tHz)
Antarctica 450µm
850µm
Atacama Mauna Kea
Figure 8: Predicted variation of noise equivalent flux density (NEFD) with level of precipitable water vapour at 450 and 850µm based on SCUBA-2 operating on LST. The shaded boxes represent the PWV in the range of the 25 and 50% quartiles averaged over winter and summer for three sites.
4. INSTRUMENTATION To fully exploit the capabilities of LST requires state-of-the-art instrumentation. Large format imaging arrays, incorporating many thousands of pixels would be ideally complemented by spectroscopic and polarimetric capabilities.
4.1 Imaging arrays Recent advances in detector technology have demonstrated that large-format arrays of many thousands of pixels are now possible for the submillimeter. The wide bandwidths available with continuum instruments, utilising the entire atmospheric window, allows for superb sensitivity. SCUBA-2 is a new generation camera31 under development for the JCMT. It will fill the re-imaged focal plane of the telescope with state-of-the-art transition edge sensors (TES), with signals being read out using multiplexed SQUID amplifiers. SCUBA-2 will have two focal planes each having ~5,000 pixels over a 50 sq-arcmin field-of-view and hence will have an approximate two order of magnitude leap in the number of pixels over existing instruments. Table 2 summarizes the pixel count for SCUBA-2 and extrapolates to what would be required to fill the focal plane of the 30m LST. To fully-populate even a 5 × 5 arcmin field would require at least another order-of-magnitude leap in the total number of pixels over that for SCUBA-2.
Field-of-view
Pixel spacing 200µm 450µm 850µm Total number of pixels to build
~50-sq arcmins (SCUBA-2)
Fλ
0.5Fλ
– 64 × 64 (5120)
64 × 64 (5120)
~10k
5 × 5 arcmin (LST)
0.5Fλ
415 × 415 (178k)
185 × 185 (35k)
98 × 98 (9.5k)
~200k
10 × 10 arcmin (LST)
0.5Fλ
830 × 830 (700k)
370 × 370 (138k)
196 × 196 (38k)
~1000k
Table 2: Pixel counts required for large-format imaging arrays for LST.
There are four main issues to be overcome to realise larger format arrays based on the SCUBA-2 design: (1) processing of silicon wafers that support the TES, (2) device density on the multiplexer wafer, (3) power dissipation in the focal plane, (4) the large volume of read-out wires. The SCUBA-2 focal planes consist of 4 sub-arrays each with 1280 pixels butted together to give the full field. The sub-arrays are currently processed on 3-inch wafers due to the fabrication limitation. It is fair to say that 6-inch or even 8-inch wafers could be fabricated without too much difficulty, realising at

least an increase of at least a factor of 4 in the number of pixels per sub-array. A crucial issue is how to assemble the sub-arrays together to form a focal plane. Figure 9 (left) shows a possible focal plane layout using offset sub-arrays.
Dichroic
4K optics box
Focal planes
Dichroic
4K optics box
Focal planes
Figure 9 (left): Possible focal plane layout with the red boxes representing the arrays and the blue the readout system. If each sub-array was fabricated on a 6-inch wafer (80 × 80 pixels) then the total pixel count would be ~100k. The linear dimension across a diagonal is of order 600mm – well matched to the re-imaged focal plane for a 5 × 5 arcmin field. (right): Possible cryostat design to incorporate two focal planes and a dilution refrigerator system to cool the arrays.
This approach could realize the ~100k pixels needed to fill a 5 × 5 arcmin field at 200 and 350µm on LST. Other issues include having sufficient cooling capacity in the low-temperature refrigerator to contend with heat loads and maintain an optimum detector temperature. For SCUBA-2, heat leaks down the read-out wires and array supports as well as SQUID power dissipation are the main contributors to heat loads. The 20µW power load on the SCUBA-2 dilution refrigerator mK system is containable within the required detector performance. However, 100k arrays will likely increase this load by at least a factor of 5 so the thermal performance will become a major issue. One way to control this is to reduce the number of signal wires coming out of the cryostat. Even with full multiplexing SCUBA-2 needs of order 3500 wires. It may be possible to design a cold CMOS MUX to reduce wire count to a more acceptable level. Figure 9 (right) shows a possible layout for the cryostat. Whilst TES arrays may reach a practical limit of a few 10k pixels, there are other detector technologies that are under development that could realise larger format arrays in the future. For example, kinetic inductance detectors (KIDs) are a simpler device design which has the potential to scale to significantly larger arrays than 10k. They also avoid the complex SQUID readout of TES’s by using frequency domain multiplexing through a single HEMT amplifier. With the advent of the high speed direct digital frequency synthesizers (DDS), a complete digital solution to the large format KIDs readout can also be developed which would reduce the amount of external electronics significantly. As the DDS can be updated at high speeds to generate required frequencies for exciting different resonators one at a time, several resonators can be multiplexed with only one DDS and corresponding IF to base band processor. As this approach results in simple external electronics, it is possible to use an array of DDS and IF receivers to readout very large format KIDs.
4.2 Spectroscopic arrays High-resolution imaging spectroscopy will form an important complement to LST’s capabilities. A spectral resolution of up to 106 or 107 can be achieved only with heterodyne receivers routinely used at ground-based observatories. However, due to the nature of heterodyne detection (requiring a mixer and local oscillator) and the increased system complexity (requiring a backend spectrometer per pixel), to date very few arrays are in operation (or under construction) in the submm (see Table 3). All these arrays have a small number of pixels (~ 5 to 20) compared to direct detection arrays. For the higher-frequency atmospheric windows at 650 and 810 GHz, (460 and 370µm), arrays of 7 pixels have been achieved in the CHAMP+ receiver for the APEX telescope32.

Receiver Frequency # of pixels Built by HERA 230 GHz 2 × 9 IRAM
HARP-B 350 GHz 16 MRAO/UK ATC UK
SMART 490 and 810 GHz 4 KOSMA
CHAMP 490 GHz 2 × 8 MPI Bonn
CHAMP+ 650 and 810 GHz 2 × 7 MPI Bonn / SRON
PoleStar 810 GHz 4 Steward Observatory / KOSMA
STAR 1.6-1.9 THz 4 × 4 Steward
Table 3: Overview of submillimeter heterodyne arrays (in operation or under construction) A useful spectroscopic array for the LST would have at least 50+ pixels in ideally several atmospheric windows including 200µm (1.5 THz). However, extending the pixel count for heterodyne arrays beyond today’s state-of-the-art presents a number of challenges. • Fabrication technique: Heterodyne arrays are currently built by packaging individual mixers and IF amplifiers as
closely as possible. In practice extending this approach to more than ~20 pixels would require a prohibitive effort and cost in fabricating and testing individual mixers. For a large number of pixels, new ways of building arrays need to be developed. One approach is to design and build very simple (SIS or HEB) mixers having few parts and achieving quantum-limited sensitivity by design. This approach has been followed for the CHAMP+ arrays using the simple ALMA band 9 mixer designs and packaged in a hexagonal configuration (see Figure 10). It allows the best mixers to be used in the array, but at the cost of fabricating individual mixers. Another approach (chosen by the THz array STAR developed at Steward Observatory) is to produce several mixers simultaneously in the same block by micro-machining techniques. While this would allow faster mixer fabrication, it needs to ensure the constant high quality and uniformity of all mixers.
• Mixer technology: In the submm two mixer technologies provide best performance. Up to ~1200 GHz (250µm),
Superconductor-insulator-superconductor (SIS) mixers are best, and for higher frequencies, hot-electron-bolometer (HEB) mixers are currently the choice. SIS mixers are approaching quantum-limited sensitivity with large IF bandwidth and are well understood devices, while HEB mixers need more development to improve sensitivity and bandwidth. In any case, producing mixers with uniform characteristics required for an array is challenging.
• System complexity: Each pixel of a heterodyne array needs a mixer with a high-precision feed horn, coaxial cables,
often an IF isolator, a cryogenic IF amplifier, and LO power for pumping the mixer. This results in a significant system complexity (and cost) for large arrays. For example, at present high-performance submm (corrugated) feedhorns and cryogenic IF amplifiers are individually fabricated. Micro-machining could be a way of producing feedhorns quicker and more cost effectively. For the amplifier, integrated circuit designs (MMICs) would allow the fabrication of many units at a reasonable cost. System complexity could be further reduced if these MMICs were integrated into the mixer eliminating the need for cables and isolators. Several groups are working on mixer-amplifier integration and MMIC design and fabrication for such applications. However, for arrays of the size interesting for the LST more development is needed. One challenge lies in reducing complexity without loss of sensitivity and performance. Another challenge is the cooling for the IF amplifiers (the mixers have basically no heat dissipation). State-of-the-art IF amplifiers (e.g. as used in the HIFI instrument for Herschel) dissipate ~2mW per stage which would result in a total heat load of 200mW for an arrays of 50 pixels using two-stage IF amplifiers.
• LO power and distribution: Each mixer needs to be pumped by a local oscillator. The approach used in the arrays
listed in Table 3 is to use one LO and distribute power either quasi-optically or via waveguide couplers among the mixers. This requires an LO of sufficient power which is a major challenge at high frequencies (e.g. 1.5 THz window). Available solid-state LOs consisting of a low frequency oscillator, power amplifiers and a multiplier chain may provide sufficient power at the lower submm frequencies, but are marginal at the higher frequencies. The

distribution of the LO among the different mixers needs to ensure uniform pumping which for large arrays requires careful design of the coupling scheme. An alternative which is starting to show promise is to use an integrated photomixer concept, where light from two external lasers is mixed to generate the LO close to the RF device itself.
Figure 10 (left): ALMA band 9 mixer (600-720 GHz) as an example of a simple design. (right): Seven such mixers in the CHAMP+ 650 GHz array receiver for the APEX telescope.
• Backends: The signal delivered from the mixers is analyzed in an electronic spectrometer (backend). Several
technologies are currently used (digital autocorrelator, filterbanks, acousto-optic spectrometers), each one with its advantages and disadvantages. In any case, an array of e.g. 50 pixels each with an IF bandwidth of 4 GHz (corresponding to 800 km/sec at 1.5 THz) would require a backend covering 200 GHz in total. For a spectral resolution of 107, a significant investment of more than 106 spectral channels would be needed. However, the rapid and continuous improvement in the speed of digital electronics is starting to make these requirements achievable in relatively compact designs, with the possibility of integrating a digitizer and spectrometer from one pixel into a single FPGA chip.
5. COMPARISON WITH OTHER FACILITIES Table 4 lists the existing and proposed facilities operating in the submm and far-infrared together with either their measured or predicted performance. For comparison LST is represented by a wide-field imaging camera with a field-of-view of 25 sq-arcmin.
Telescope /aperture
Instrument Date λ (µm)
Pixels Field-of-view
(arcmin2)
FWHM (arcsec)
Sensitivity (1σ/1sec)
(mJy)
Confusion limit1 (mJy)
Confusion map time2
(hrs) JCMT 15m
SCUBA 1997– 2005
850 450
37 91
4.5 4.2
14 7.5
90 400
0.12 0.06
680 5 × 10⁴
“ SCUBA-2 2006 850 450
5120 5120
51 51
14 7.5
25 80
0.12 0.06
0.5 79
CSO 10.4m
SHARC-II 2005 350 384 2.5 8.5 500 0.09 7000
IRAM 30m
Mambo-2 2005 1200 117 6.0 10 40 0.10 240
LMT 50m
Bolocam-2 2006 1100 151 2.1 5.5 3 0.045 4.6
APEX 12m
Laboca 2006 870 295 11 18 110 0.18 300
“ “C2”
2008? 350 37? 4? 7.5 250? 0.07 3 × 10⁴
Herschel 3.5m
SPIRE 2007 500 350 250
43 88
139
32 32 32
35 24 17
37 34 29
1.2 0.8 0.6
0.3 0.5 0.7

SOFIA 2.7m
HAWC 2008 200 384 9.3 19 560 1.3 11
ALMA 500m
Compact mode
2012 850 450
64 64
0.0223 0.0069
0.4 0.2
1.5 8.0
0.001 0.0005
6 × 10⁴
2 × 10⁷ LST 30m
Large-format camera
2012? 850 450 200
10k 35k 178k
25 25 25
7 3.7 1.7
5 9
50
0.03 0.015 0.008
0.6 8
880
Table 4: Proposed and existing submillimeter facilities Table notes: 1 The 1σ confusion limit due to isotropic high-z galaxies. This definition of confusion adopted in this case is the flux density at which there is more than one source per FWHM beam. 2 The time required to map a 50 sq-arcmin area of sky (SCUBA-2 field-of-view on JCMT) to the 5σ confusion limit. 3 Half-beam spacing is assumed. 5.1 Flux sensitivity The per-pixel point source sensitivity for LST would be at least 10 times better than any currently operating facility (including when SCUBA-2 becomes operational on JCMT). It would also be comparable to ALMA and the LMT. 5.2 Angular resolution and confusion limits The angular resolution of LST would provide an improvement of a factor of 10 over currently planned satellite missions (e.g. Herschel), and a factor of at least 4 over current ground-based single dishes with the exception of the LMT and ALMA. It would also have the potential to observe at the shorter wavelengths with high efficiency. Imaging well below the confusion limits of current single-dish telescopes is a key driver for LST. Since confusion limits will be 10 times lower for LST (operating at 200µm) than JCMT this allows images 10 times deeper to be undertaken with LST before galaxies blend together in the image. 5.3 Dust mass sensitivity A large fraction of the science with LST will be carried out by observing dust emission. For dust at T>30K and objects at z <2, the emission has a spectral index slope of ~2+β, where β=0 for a pure black-body up to β=2 for small ISM grains. Taking β=1, Figure 11 shows the relative gain of LST for a given mass of dust compared with other facilities. The scale is relative to SCUBA at 850µm on the JCMT.
0.1
1
10
100
1000
SCUBA(850)
SCUBA(450)
Mambo-2
SCUBA-2(850)
SCUBA-2(450)
Laboca
APEX/C2
Bolocam-2
SPIRE(350)
ALMA/compact(850)
ALMA/compact(450)
LST(850)
LST(450)
LST(200)
Rel
ativ
e ga
in
Figure 11: Relative dust mass sensitivity per pixel for various facilities compared to SCUBA (850µm) on JCMT. This shows that at the shorter wavelengths LST is roughly 100 times as sensitive per pixel to a given mass of dust than SCUBA..

5.4 Mapping comparison The great advantage of a wide-field LST will be in surveying large areas of sky to low flux limits. Figure 12 shows the relative large-area mapping speeds for the various facilities compared to SCUBA at 850µm.
0.1
1
10
100
1000
10000
100000
1000000
SCUBA(850)
SCUBA(450)
Mambo-2
SCUBA-2(850)
SCUBA-2(450)
Laboca
APEX/C2
Bolocam-2
SPIRE(350)
ALMA/compact(850)
ALMA/compact(450)
LST(850)
LST(450)
LST(200)
Rel
ativ
e ga
in
Figure 12: Relative large-area mapping speeds relative to the performance of SCUBA at 850µm. These are calculated for a fixed area to a given depth (the depth is scaled appropriately at different wavelengths assumed the dust mass sensitivity used in Figure 9).
Figure 12 shows that LST, particularly at the shorter wavelengths, will surpass all existing facilities by factors of 10 – 100 in mapping speed. In particular, it will survey the sky some 100 – 10000 times faster than ALMA operating in compact configuration.
6. SUMMARY Over the next decade a significant void will exist between the capabilities of existing (or planned) single-dish telescopes and the new submm interferometers. Many phenomena visible in the submm extend over several degrees but also contain significant sub-structure on arcsecond scales. To obtain a true, unbiased view of the submillimeter universe, what is really needed is a dedicated large-aperture telescope equipped with state-of-the-art imaging and spectroscopic arrays. Such a facility will offer: • A survey speed allowing coverage of wide areas of sky rapidly and efficiently, so that generous, statistically unbiased samples can be acquired. • Superb sensitivity to quickly detect point sources well below current confusion limits. • High (arcsecond) angular resolution so that galaxies and protostars are separated and resolved (and can be unambiguously identified at other wavelengths) • High fidelity images with correct relative fluxes for all features, regardless of size. In terms of instrumentation it is most likely that 20k pixel focal planes of TES devices, with in-built multiplexers, could be achieved within the next year or two. The step for 20k to 100k+ will require a substantial development programme and may be achievable over a 5-year time-frame. A dedicated development effort is also required to be able to realize large heterodyne arrays. Several groups in the world have started such a development, and a number of leading European
institutes have proposed a dedicated and coordinated R&D effort for large focal plane arrays within the European Union’s Seventh Framework Programme. LST will provide the wide-field complement that is essential to fully-exploit the capabilities of interferometers, such as ALMA. The science possibilities of LST are huge: for example, not only will we see the entire evolutionary progress from pre-stellar cores to emerging T Tauri stars, along a whole cloud complex, but also such fine details as the fragmentation of a young core into a proto-binary stellar system. Similarly, we would move away from the current situation in which we detect oddly-shaped sources in the extragalactic sky, to an era where the structure becomes resolved into a proto-cluster of galaxies, allowing us to determine star formation activity in each member galaxy. The legacy of LST will be undoubtedly to carry out very large-scale surveys to unprecedented depth. For example, detecting proto-galaxies down to a 3σ limit ~ 2mJy at 850µm (the current confusion limit on the JCMT), over the entire accessible sky, would be achievable in about a year (instead of many tens of years even with SCUBA-2 on JCMT).
REFERENCES 1. A. W. Blain, I. Smail, R. J. Ivison, and J.-P. Kneib, "The history of star formation in dusty galaxies", MNRAS 302,
pp. 632-648, 1999 2. W. S. Holland, E. I. Robson, W. K. Gear, C. R. Cunningham, J. F. Lightfoot, T. Jenness, R. J. Ivison, J. A. Stevens,
P. A. R. Ade, M. J. Griffin, W. D. Duncan, J. A. Murphy, and D. A. Naylor, "SCUBA: a common-user submillimetre camera operating on the James Clerk Maxwell Telescope", MNRAS 303, pp. 659-672, 1999
3. D. H. Hughes, S. Serjeant, J. Dunlop, M. Rowan-Robinson, A. W. Blain, R. G. Mann, R. J. Ivison, J. Peacock, A. Efstathiou, W. K. Gear, S. Oliver, A. Lawrence, M. Longair, P. Goldschmidt, and T. Jenness, "High-redshift star formation in the Hubble Deep Field revealed by a submillimetre-wavelength survey", Nature 394, pp. 241-247, 1998
4. W. S. Holland, J. S. Greaves, B. Zuckerman, R. A. Webb, C. McCarthy, I. M. Coulson, D.M. Walther, W. R. F. Dent, W.K. Gear, and I. Robson, "Submillimetre images of dusty debris around nearby stars", Nature 392, pp. 788-790, 1998
5. P. B. Alton, S. Bianchi, R. J. Rand, E. M. Xilouris, J. L. Davies, and M. Trewhella, “Deep Submillimeter Images of NGC 891 - Cold Dust at Larger Galactic Radii”, ApJ 507, L125, 1998
6. J. A. Stevens, and W. K. Gear, “Submillimetre imaging of NGC 3079”, MNRAS 312, L5, 2000 7. A. C. Edge, “The detection of molecular gas in the central galaxies of cooling flow clusters”, MNRAS 328, 762,
2001 8. J.-L. Puget, A. Abergel, J.-P. Bernard, F. Boulanger, W. B. Burton, F.-X Desert, and D. Hartmann, “Tentative
detection of a cosmic far-infrared background with COBE”, A&A 308, L5 9. I. Smail, R. J. Ivison, A. W. Blain, “A Deep Sub-millimeter Survey of Lensing Clusters: A New Window on Galaxy
Formation and Evolution”, ApJ 490, L5, 1997 10. T. R. Greve, R. J. Ivison, F. Bertoldi, J. A. Stevens, J. S. Dunlop, and C. L. Carilli, “A 1200 micron MAMBO
Survey of ELAIS N2 and the Lockman Hole: I. Maps, sources and number counts”, MNRAS 354, 779, 2004 11. S. C. Chapman, A. W. Blain, R. J. Ivison, and Ian Smail, “A median redshift of 2.4 for galaxies bright at
submillimetre wavelengths”, Nature 422, 695, 2003 12. R. Neri, R. Genzel, R. J. Ivison, F. Bertoldi, A. W. Blain, S. C. Chapman, P. Cox, T. R. Greve, A. Omont, and D. T.
Frayer, “Interferometric Observations of Powerful CO Emission from Three Submillimeter Galaxies at z=2.39, 2.51, and 3.35”, ApJ 597, L113, 2003
13. J. S. Dunlop, “SHADES: The SCUBA HAlf-Degree Extragalactic Survey”, In: Starbursts: From 30 Doradus to Lyman Break Galaxies, eds. R. De Grijs and R.M. Gonzalez Delgado. Astrophysics & Space Science Library, Vol. 328, p.121, Dordrecht: Springer, 2005
14. A. J. B. Mortier et al., “The SCUBA Half-Degree Extragalactic Survey – I. Survey motivation, design and data processing”, MNRAS 363, 563, 2005
15. Ian Smail, R. J. Ivison, A. W. Blain, and J.-P. Kneib, “The nature of faint submillimetre-selected galaxies”, MNRAS 331, 495, 2002
16. K. Coppin et al., “The SCUBA Half-Degree Extragalactic Survey – II. Submillimetre maps, source catalogues and number counts”, MNRAS submitted, 2006
17. A. Jameson, M. Longair, and A. Blain, in 'The Third Stromlo Symposium: The Galactic Halo', eds Gibson B.K., Axelrod T.S., Putman M.E., ASP Conference Series, Vol 165, 346, 1999

18. E. van Kampen et al., “The extragalactic submillimetre population: predictions for the SCUBA Half-Degree Extragalactic Survey (SHADES)”, MNRAS 359, 469, 2005
19. I. Aretxaga, D. H. Hughes and J. S. Dunlop, “Confirmation of the effectiveness of submm source redshift estimation based on rest-frame radio-FIR photometry”, MNRAS 358, 1240, 2005
20. M. Pan and R. Sari, “Shaping the Kuiper belt size distribution by shattering large but strengthless bodies”, Icarus 173, 342, 2005
21. M. C. Wyatt, “Resonant Trapping of Planetesimals by Planet Migration: Debris Disk Clumps and Vega's Similarity to the Solar System”, ApJ 598, 1321, 2003
22. S. P. Goodwin, A. P. Whitworth and D. Ward-Thompson, “Simulating star formation in molecular clouds cores: The influence of low levels of turbulence on fragmentation and multiplicity”, A&A 414, 633, 2004
23. D. Johnstone, C. Wilson, G. Moriarty-Schieven, G. Joncas, G. Smith, E. Gregersen, M. Fich, “Large-Area Mapping at 850 Microns. II. Analysis of the Clump Distribution in the rho Ophiuchi Molecular Cloud”, ApJ 545, 327, 2000
24. L. Dunne, S. Eales, R. Ivison, H. Morgan, M. Edmunds, “Type II supernovae as a significant source of interstellar dust”, Nature 424, 285, 2003
25. O. Krause, S. M. Birkmann, G. H. Rieke, D. Lemke, U. Klaas, D. C. Hines, K. D. Gordon, “No cold dust within the supernova remnant Cassiopeia A”, Nature 432, 596, 2004
26. B. Matthews and C. Wilson, “Magnetic Fields in Star-forming Molecular Clouds. I. The First Polarimetry of OMC-3 in Orion A”, ApJ 531, 868, 2000
27. P. Dierickx, J. Beletic, B. Delabre, M. Ferrari, R. Gilmozzi, and N. Hubin, “The optics of the OWL 100-m adaptive telescope”, in Proc of the Backaskog workshop on extremely large telescopes, Torben Andersen, Arne Ardeberg, Roberto Gilmozzi, Eds. p.97, 2000
28. LMT website: http://www.lmtgtm.org 29. E. Archibald, T. Jenness, W. S. Holland, I. M. Coulson, N. E. Jessop, J. A. Stevens, E. I. Robson, R. P. J. Tilanus,
W. D. Duncan, and J. F. Lightfoot, “On the atmospheric limitations of ground-based submillimetre astronomy using array receivers”, MNRAS 336, 1-13, 2002
30. R. Giovanelli, J. Darling, C. Henderson, W. Hoffman, D. Barry, J. Cordes, S. Eikenberry, G. Gull, L. Keller, J. D. Smith, and G. Stacey, “The optical/infrared astronomical quality of high Atacama sites II. Infrared characteristics”, PASP Vol 113, 803-813, 2001
31. W. S. Holland, W. D. Duncan, B. D. Kelly, K. D. Irwin, A. J. Walton, P. A. R. Ade. E. I. Robson, “SCUBA-2: A large format submillimetre camera on the James Clerk Maxwell Telescope”, Proc SPIE Vol. 4855, pp. 1-18, Millimeter and Submillimeter Detectors for Astronomy, Thomas G. Phillips, Jonas Zmuidzinas, Eds. 2003
32. R. Hesper, H. Schaeffer, G. Gerlofsma, C. Kasemann, A. Baryshev, “A Dual-Frequency Mixer Array for CHAMP+”, in Proc. 15th International Symposium on Space Terahertz Technology, 2004.