a liquid xenon positron emission tomograph for small
TRANSCRIPT
1
A liquid Xenon Positron Emission Tomograph for small animal imaging : first experimental results of a prototype cell.
M.-L. Gallin-Martela*1, L. Gallin-Martela, Y. Grondinb, O. Rossettoa, J. Collota, D.
Grondina, S. Jana2, Ph. Martina, F. Mayeta, P. Petita, F. Vezzua
a Laboratoire de Physique Subatomique et de Cosmologie, Université Joseph Fourier Grenoble 1, CNRS/IN2P3, Institut National
Polytechnique de Grenoble, 53 avenue des Martyrs, 38026 Grenoble cedex, France
b Laboratoire TIMC/IMAG, CNRS et Université Joseph Fourier, Pavillon Taillefer, 38706 La Tronche cedex, France
Abstract
A detector using liquid Xenon (LXe) in the scintillation mode is studied for Positron Emission Tomography (PET) of small
animals. Its specific design aims at taking full advantage of the Liquid Xenon scintillation properties. This paper reports on
energy, time and spatial resolution capabilities of the first LXe prototype module equipped with a Position Sensitive Photo-
Multiplier tube (PSPMT) operating in the VUV range (178 nm) and at 165 K. The experimental results show that such a LXe
PET configuration might be a promising solution insensitive to any parallax effect.
Key words : Positron emission tomography (PET), Medical imaging equipment, Liquid Xenon
PACS : 87.57.uk
1 Corresponding author Tel +33 4 76 28 41 28; Fax : +33 4 76 28 40 04 E-mail adress : [email protected] 2 Present address : Service Hospitalier Frédéric Jolliot (SHFJ), CEA, F91401 Orsay, France

2
1 Introduction.
Positron Emission Tomography (PET) is a non-invasive clinical and research imaging
technique in nuclear medicine using radio-labeled molecules to image molecular biological
processes in vivo. It is also a powerful tool in modern clinical applications for cancer
diagnosis. Tremendous experimental efforts on a host of techniques have been made in the
field of PET imaging, in particular towards the development of new generation high
resolution PET cameras dedicated to small animal imaging [1,4]. However, improvements are
still needed with respect to the spatial resolution and sensitivity of the technique for its
application to specific human organs and in particular to small animals. Recent technological
advances have led to the development of dedicated small animal scanners which can be a tool
to measure the kinetics of labeled drugs. The aim is to study interactions between novel drugs
and their biological target, metabolism and morphological changes in animal models of
disease. High time and energy resolution are required as well as DOI measurement for new
generation PET prototypes.
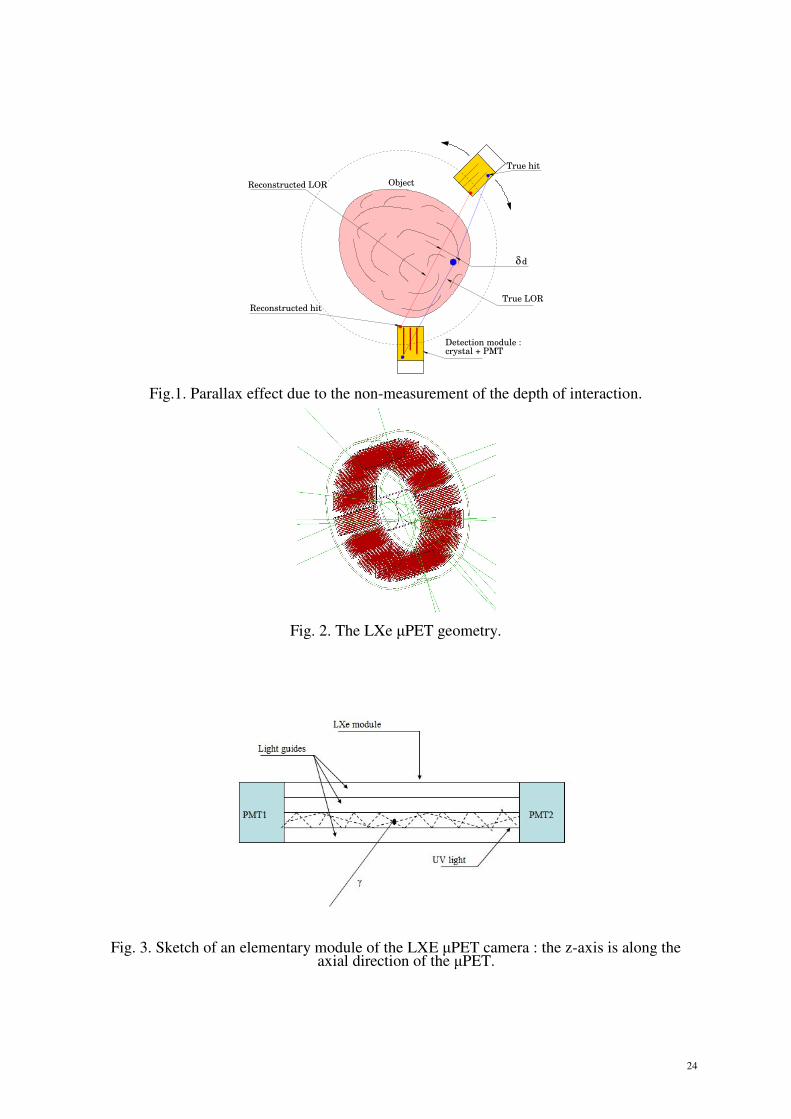
Standard PETs are made of several longitudinal slices of radially-oriented crystals leading to
the main drawback of such a geometry : when measuring the spatial coordinates of each
interacting gamma, while two coordinates are well measured owing to the transverse
granularity of the device, the Depth Of Interaction (DOI) cannot be determined with an
equivalent accuracy. The hit is then reconstructed at the foot of the crystal (see Fig. 1). The
consequence of this parallax effect is therefore a degradation of the resolution in the image
reconstruction for positron annihilation off the PET longitudinal axis. Typically, for a
microPET FOCUS 220, with point like 18F sources, the radial resolution increases from ∼1.3
mm to ∼3.5 mm when the source is shifted from 0 to 8 cm off the axis [5].

3
We describe here a novel design of PET scanner for small animals using the scintillation
properties of the Liquid Xenon in an axial geometry to provide a three dimensional gamma
reconstruction free of parallax error. Liquid Xenon is well known to be an excellent detecting
medium for �-rays due to its high atomic number and density. When compared to commonly
used crystals (see Tab. 1), it appears that its decay time is short : 3 to 30 ns [6,7], the spread
being due to the various scintillation modes of the Xe excimers. Its fast scintillation light yield
is comparable to that of NaI. Several groups have been studying the possibility to use Liquid
Xenon (LXe) as a sensitive medium in PET imaging field, either in a charge collecting mode
[11] or in scintillation mode [12-15], or for other applications (e.g Dark Matter search) [16-
18].
In the proposed PET design, the Xenon is contained in aluminum light guides read at each
end with Position Sensitive PhotoMultiplier Tubes (PSPMT). When designing a LXe-based
PET camera, there are at least three experimental difficulties to overcome:
• the purity of Xenon, where contamination should not exceed a few ppm in scintillation
mode,
• the operating conditions at cryogenic temperature (typically 165 K),
• the detection of UV photons around 178 nm [19].
A LXe PET prototype module has been built and simulated using the GEANT4 [20] Monte
Carlo code linked to the GATE [21] package adapted to this new scanner geometrical
configuration. We first report in this paper on the z (axial) coordinate analytical calculation.
Various models used by other collaborations that also attempt to solve the DOI problem with
a 3D axial geometry detector are discussed. Then a comparison is done between simulation
and experimental data that correspond to our first characterization measurements of the
4
prototype module in terms of energy, time and spatial resolution capabilities which are three
relevant parameters for the optimization of the proposed LXe �PET prototype.
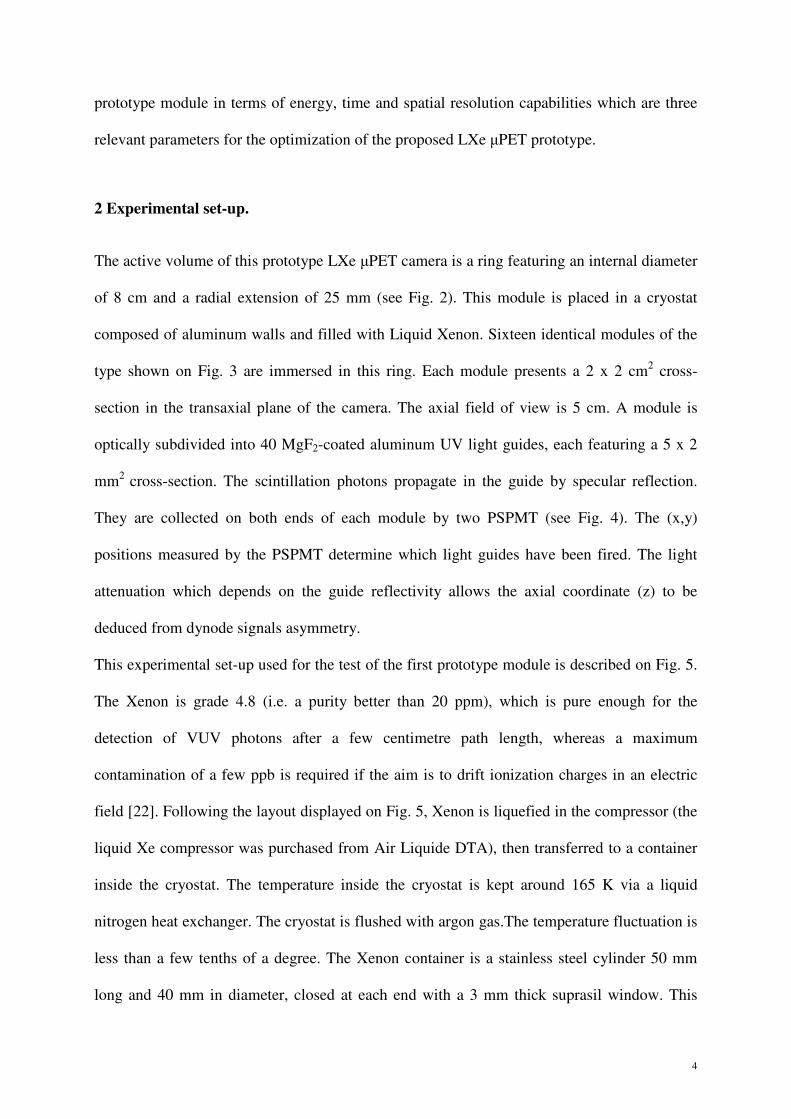
2 Experimental set-up.
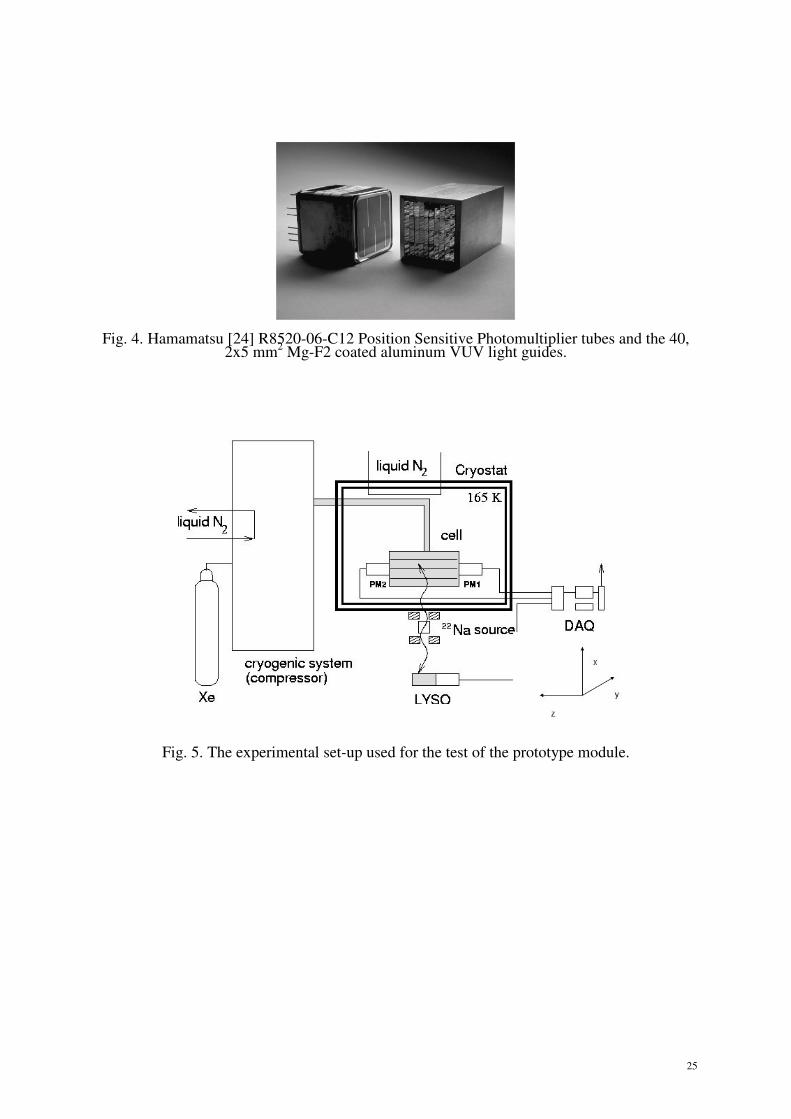
The active volume of this prototype LXe �PET camera is a ring featuring an internal diameter
of 8 cm and a radial extension of 25 mm (see Fig. 2). This module is placed in a cryostat
composed of aluminum walls and filled with Liquid Xenon. Sixteen identical modules of the
type shown on Fig. 3 are immersed in this ring. Each module presents a 2 x 2 cm2 cross-
section in the transaxial plane of the camera. The axial field of view is 5 cm. A module is
optically subdivided into 40 MgF2-coated aluminum UV light guides, each featuring a 5 x 2
mm2 cross-section. The scintillation photons propagate in the guide by specular reflection.
They are collected on both ends of each module by two PSPMT (see Fig. 4). The (x,y)
positions measured by the PSPMT determine which light guides have been fired. The light
attenuation which depends on the guide reflectivity allows the axial coordinate (z) to be
deduced from dynode signals asymmetry.
This experimental set-up used for the test of the first prototype module is described on Fig. 5.
The Xenon is grade 4.8 (i.e. a purity better than 20 ppm), which is pure enough for the
detection of VUV photons after a few centimetre path length, whereas a maximum
contamination of a few ppb is required if the aim is to drift ionization charges in an electric
field [22]. Following the layout displayed on Fig. 5, Xenon is liquefied in the compressor (the
liquid Xe compressor was purchased from Air Liquide DTA), then transferred to a container
inside the cryostat. The temperature inside the cryostat is kept around 165 K via a liquid
nitrogen heat exchanger. The cryostat is flushed with argon gas.The temperature fluctuation is
less than a few tenths of a degree. The Xenon container is a stainless steel cylinder 50 mm
long and 40 mm in diameter, closed at each end with a 3 mm thick suprasil window. This

5
container can house various types of cells (see Fig. 4). An experimental test bench has been
built to allow the x and y measurement and furthermore to evaluate the z-axis localization, the
energy and time resolutions. A 22Na source is mounted on a small carriage moving along the
z-axis, underneath the cryostat. The collimation is done by two pairs of lead collimators
placed respectively at the top and bottom of the 22Na source inducing a 2 mm gap (see Fig. 5).
A LYSO crystal coupled to a photomultiplier tube completes the experimental set-up
providing the coincidence signal. The VUV photons are collected with a PSPMT at each end.
In the present set-up the PSPMTs are not immersed in the LXe and a thin argon gap (0.3 mm)
is kept between the cell quartz window and the PMT entrance window. Photons then
encounter refraction indices of 1.69 (Liquid Xenon [23]), 1.58 (cell quartz window), 1.0 (gas),
and finally 1.58 (PSPMT entrance quartz window) leading to a 36 degree limit angle (LA).
PSPMTs with the required specifications, i.e high Quantum Efficiency (QE) at 178 nm (QE =
20 %) and still working at low temperatures (165 K), are not commercially available yet.
Hamamatsu provided us with two prototype tubes, belonging to the R8520-06-C12 series
[24], having five aluminum strips deposited on their window to reduce the resistivity of the
photocathode at 165 K. Their QE was around 20 %. On the whole however, these tubes were
very satisfactory for exploring the feasibility of a PET based on the Liquid Xenon
scintillation.
The read-out electronics (see Fig. 6) operates at room temperature and is composed of
standard NIM and CAMAC modules. The charge measurement of PSPMT anode signals (6x
and 6y) is performed using gated integrators and 12-bit Analogue to Digital Converters
(QDC). The last dynode signal of each PSPMT is splitted in order to be treated like anode
signals and also to be used for time tagging and experimental set-up triggering. The signals
provided by the PMT coupled to the LYSO crystal are processed in the same way. The time

6
tagging and triggering electronics comprises: two Constant Fraction Discriminators (CFD), a
coincidence module and a Time to Digital Converter (TDC). One CFD processes the LYSO
PMT dynode signal, the second one is fed with the analog sum of the two PSPMT dynode
signals. The coincidence module uses CFD output signal to trigger the TDC, the integrators
and the VME-based data acquisition.
3 The Monte Carlo LXe �PET camera module simulation.
In order to simulate the LXe �PET camera module, the GATE toolkit has been used [21,25].
Each module was created as a square section box divided into 40 smaller boxes of rectangular
section representing the light guides. The LXe material was defined in the material database
file of GATE and assigned to the module. The aluminum coats covering the light guides have
not been simulated in GATE, their influence on the detection of the 511 keV gamma photons
being considered negligible [14,26]. However, UV photon transport in the aluminum guides
and detection resolution were simulated with a custom MC code. The code is able to track
individual scintillation photons from their emission point along the aluminum guide to the
photodetectors, taking into account reflection as well as absorption. However it does not
include the photon detection process operated by the PMTs. The source was a hypothetical
511 keV gamma photon emitter placed at the real distance below the detector. It was a 1
million Becquerel sphere of 1 mm radius. The lead shields of the experiment were also
simulated. The presence of the LYSO acting as a trigger or a "collimator" was taken into
account by simulating additional lead shields such that, combined to the other shields, the
gamma photons are collimated through a square hole of the same area as the LYSO's sensitive
surface. The output data of the GATE simulations consisted in the collection of all
interactions occurring in the detector and in the other simulated components of the set-up. The
most important features that are used for simulating the generation of the UV photons and
7
therefore the detection in our Monte Carlo code are the amount of deposited energy and the
localization of the hits in the detector module.
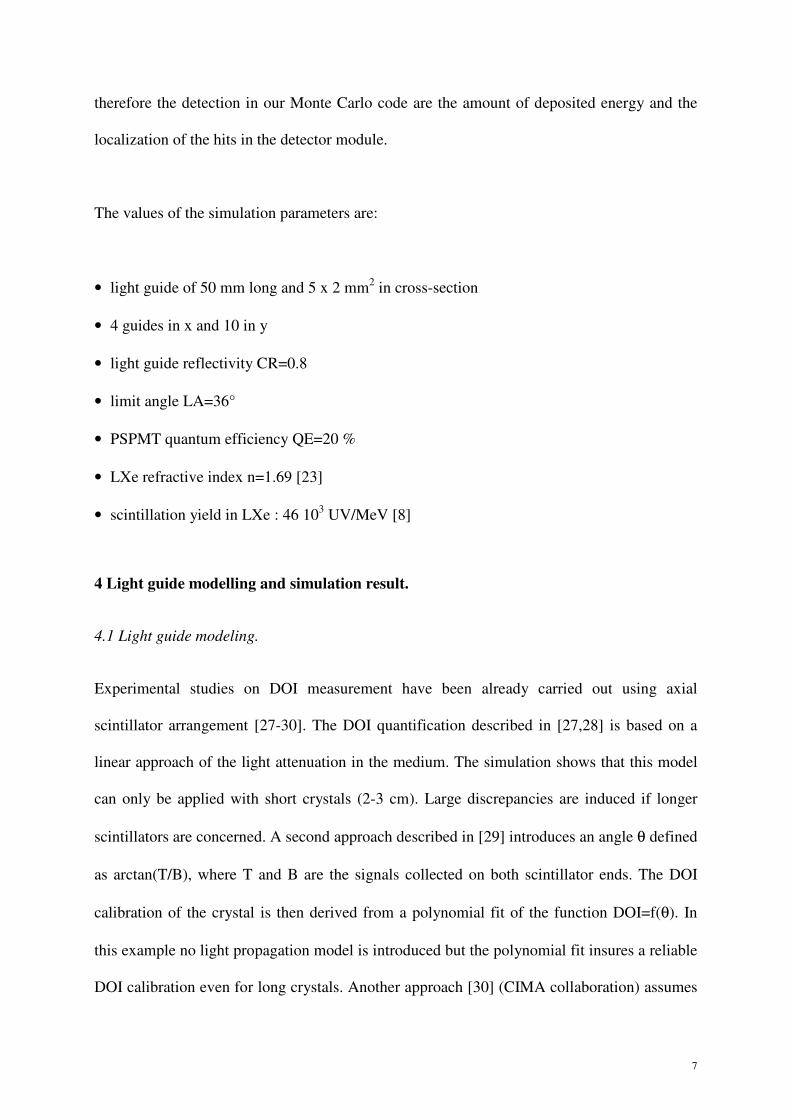
The values of the simulation parameters are:
• light guide of 50 mm long and 5 x 2 mm2 in cross-section
• 4 guides in x and 10 in y
• light guide reflectivity CR=0.8
• limit angle LA=36°
• PSPMT quantum efficiency QE=20 %
• LXe refractive index n=1.69 [23]
• scintillation yield in LXe : 46 103 UV/MeV [8]
4 Light guide modelling and simulation result.
4.1 Light guide modeling.
Experimental studies on DOI measurement have been already carried out using axial
scintillator arrangement [27-30]. The DOI quantification described in [27,28] is based on a
linear approach of the light attenuation in the medium. The simulation shows that this model
can only be applied with short crystals (2-3 cm). Large discrepancies are induced if longer
scintillators are concerned. A second approach described in [29] introduces an angle θ defined
as arctan(T/B), where T and B are the signals collected on both scintillator ends. The DOI
calibration of the crystal is then derived from a polynomial fit of the function DOI=f(θ). In
this example no light propagation model is introduced but the polynomial fit insures a reliable
DOI calibration even for long crystals. Another approach [30] (CIMA collaboration) assumes
8
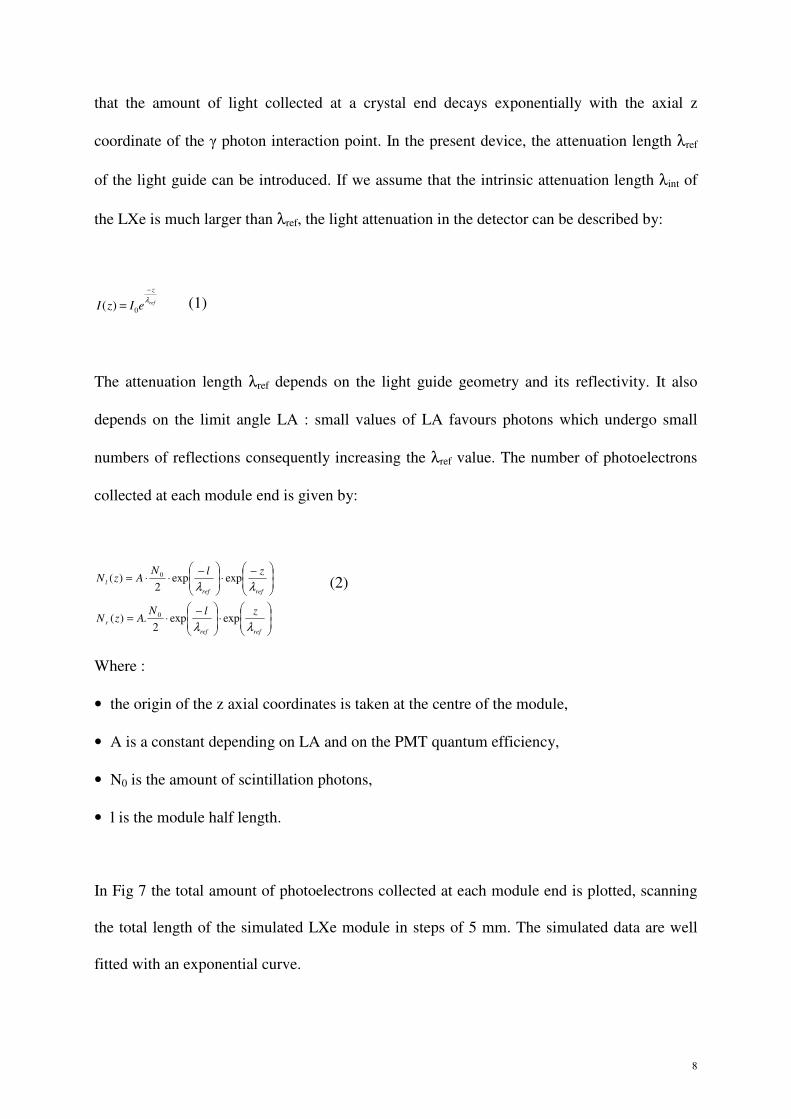
that the amount of light collected at a crystal end decays exponentially with the axial z
coordinate of the � photon interaction point. In the present device, the attenuation length λref
of the light guide can be introduced. If we assume that the intrinsic attenuation length λint of
the LXe is much larger than λref, the light attenuation in the detector can be described by:
ref
z
eIzI λ−
= 0)( (1)
The attenuation length λref depends on the light guide geometry and its reflectivity. It also
depends on the limit angle LA : small values of LA favours photons which undergo small
numbers of reflections consequently increasing the λref value. The number of photoelectrons
collected at each module end is given by:
��
�
�
��
�
�⋅��
�
�
��
�
� −⋅=
��
�
�
��
�
� −⋅��
�
�
��
�
� −⋅⋅=
refrefr
refrefl
zlNAzN
zlNAzN
λλ
λλ
expexp2
.)(
expexp2
)(
0
0
(2)
Where :
• the origin of the z axial coordinates is taken at the centre of the module,
• A is a constant depending on LA and on the PMT quantum efficiency,
• N0 is the amount of scintillation photons,
• l is the module half length.
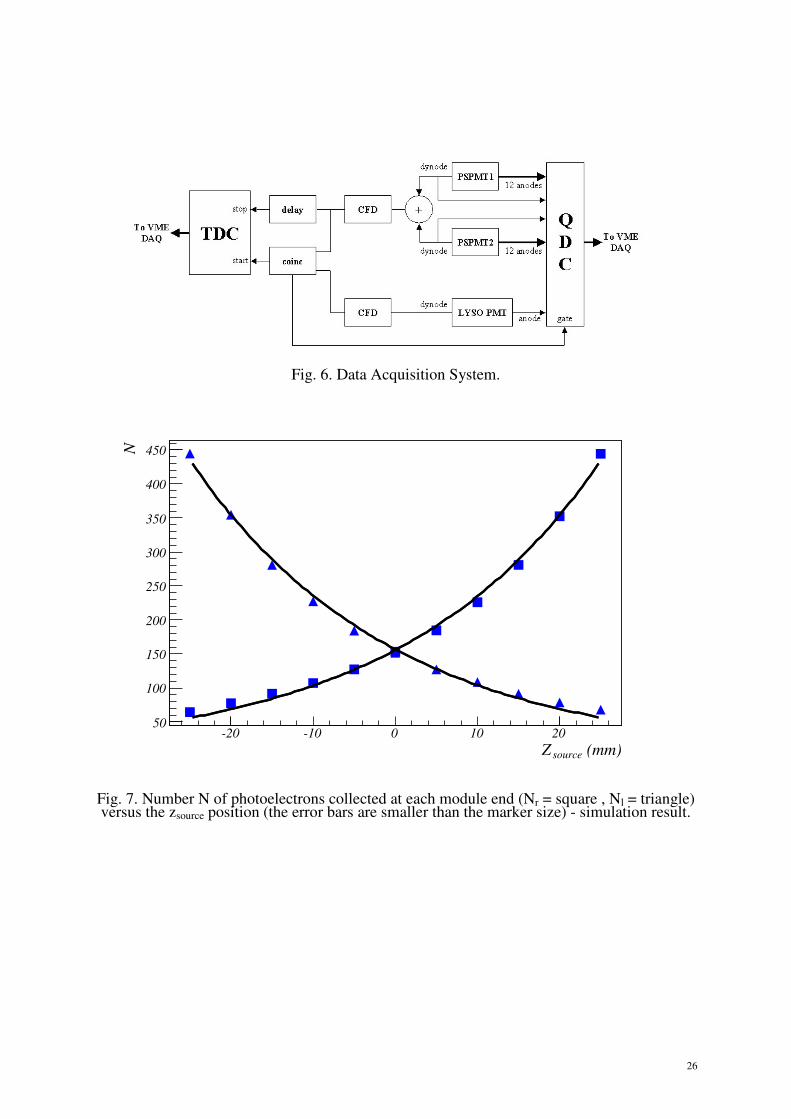
In Fig 7 the total amount of photoelectrons collected at each module end is plotted, scanning
the total length of the simulated LXe module in steps of 5 mm. The simulated data are well
fitted with an exponential curve.
9
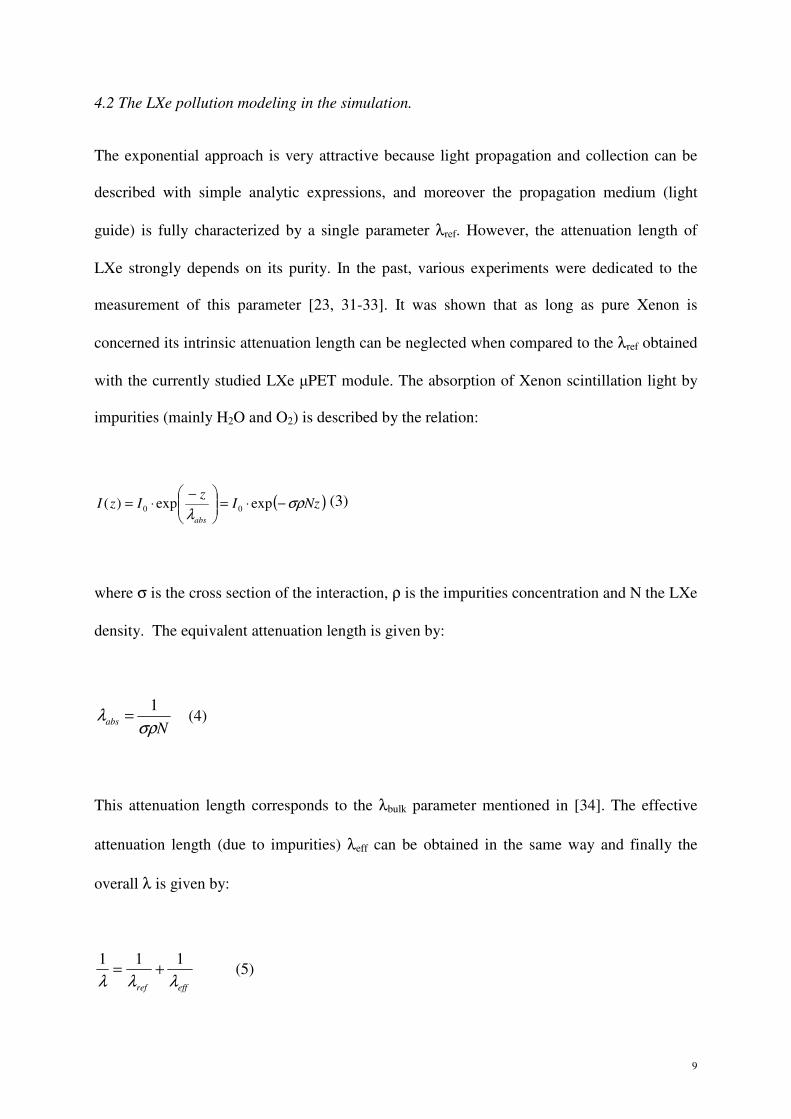
4.2 The LXe pollution modeling in the simulation.
The exponential approach is very attractive because light propagation and collection can be
described with simple analytic expressions, and moreover the propagation medium (light
guide) is fully characterized by a single parameter λref. However, the attenuation length of
LXe strongly depends on its purity. In the past, various experiments were dedicated to the
measurement of this parameter [23, 31-33]. It was shown that as long as pure Xenon is
concerned its intrinsic attenuation length can be neglected when compared to the λref obtained
with the currently studied LXe �PET module. The absorption of Xenon scintillation light by
impurities (mainly H2O and O2) is described by the relation:
( )NzIz
IzIabs
σρλ
−⋅=���
����
� −⋅= expexp)( 00 (3)
where σ is the cross section of the interaction, ρ is the impurities concentration and N the LXe
density. The equivalent attenuation length is given by:
Nabs σρλ 1= (4)
This attenuation length corresponds to the λbulk parameter mentioned in [34]. The effective
attenuation length (due to impurities) λeff can be obtained in the same way and finally the
overall λ is given by:
effref λλλ111 += (5)

10
This relation shows that exponential model allows the LXe pollution to be easily introduced
in the analytic expressions that describe light propagation.
4.3 Determination of the attenuation length λref.
The first step to perform DOI measurement is to qualify the light propagation medium. The
light guide attenuation length λref can be derived from Eq. (2):
refl
r zNN
λ2
ln =���
����
� (6)
In Fig. 8 the expression ln(Nr/Nl) is plotted for a 5 mm step module scanning. It can be seen
that the exponential model is very satisfactory at this stage. The λref value is found to be equal
to 26.5 ± 0.1 mm. In this simulation the 22Na source is perfectly collimated and no ∆z spread
is introduced in the z coordinate of interaction for a given source position. This leads to a
linear trend even for zsource=+/-25 mm which corresponds to the module edges. A small deficit
of UV photons is observed on the module edges when the simulation takes into account a
“beam width”.
4.4 Determination of the interaction point.
The reconstructed z coordinate is derived using Eq.(7).
���
����
�=
l
rrec N
Nz ln
21
refλ (7)

11
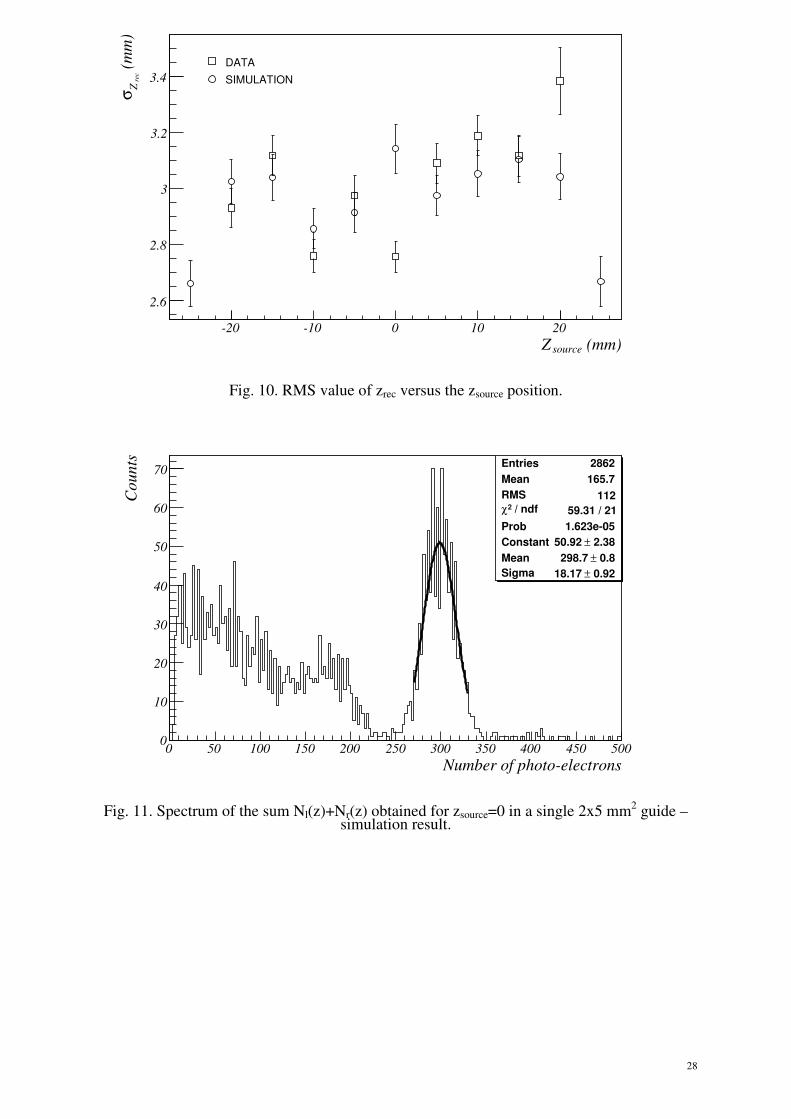
The distribution of the reconstructed zrec position for a source located at zsource= 0 is shown on
Fig. 9. A Gaussian fit of this distribution for different values of zsource provides the axial
resolution of the module. Fig. 10 illustrates the RMS value of z reconstruction versus the
source z position. The average value for σzrec is around 3mm.
4.5 Energy resolution and reconstruction.
The energy resolution can be deduced from the total amount of photo-electrons collected for
each zsource coordinate. The spectrum of the sum Nl(z)+Nr(z) obtained for zsource= 0 is shown in
Fig. 11. A Gaussian fit of the photopeak leads to the σ/� resolution where σ and � are
respectively the RMS and the mean value of the fitted distribution. The best achievable value
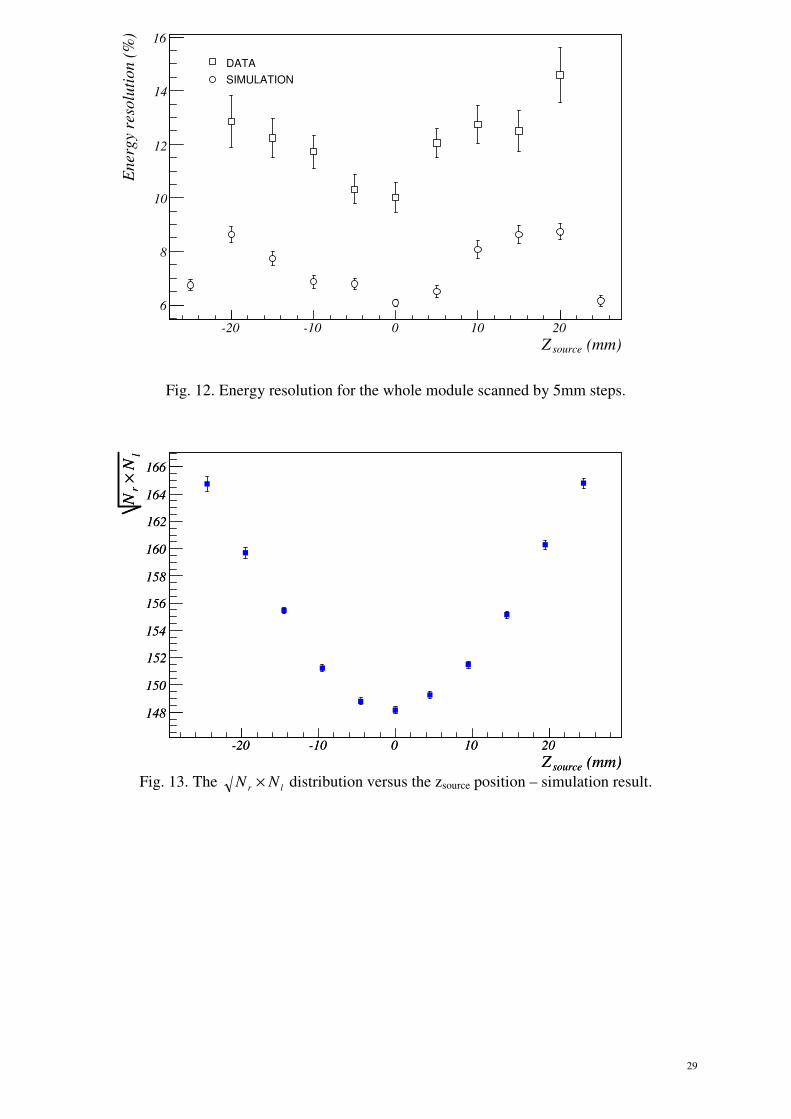
for the energy resolution 6 % is obtained at the module centre. Fig. 12 shows the simulated
energy resolution for the whole module scanned by 5mm steps. It should be stressed that the
impact of the PSPMT on the signal resolution is not included (except for the 20 % quantum
efficiency).
Since the sum Nl+Nr is not a constant along the z-axis, a correcting factor fcor(zrec) has to be
applied to get the reconstructed value of the energy Erec.
511)(
×+=
reccor
lr
zfNNrecE keV (8)
Using the exponential model for Nr and Nl as described by Eq. (2), it appears that :
lrrec NNE ⋅∝ (9)
12
with
��
�
�
��
�
� −⋅⋅=⋅ref
rl
lNAzNzN
λexp
2)()( 0 (10)
should be a constant.
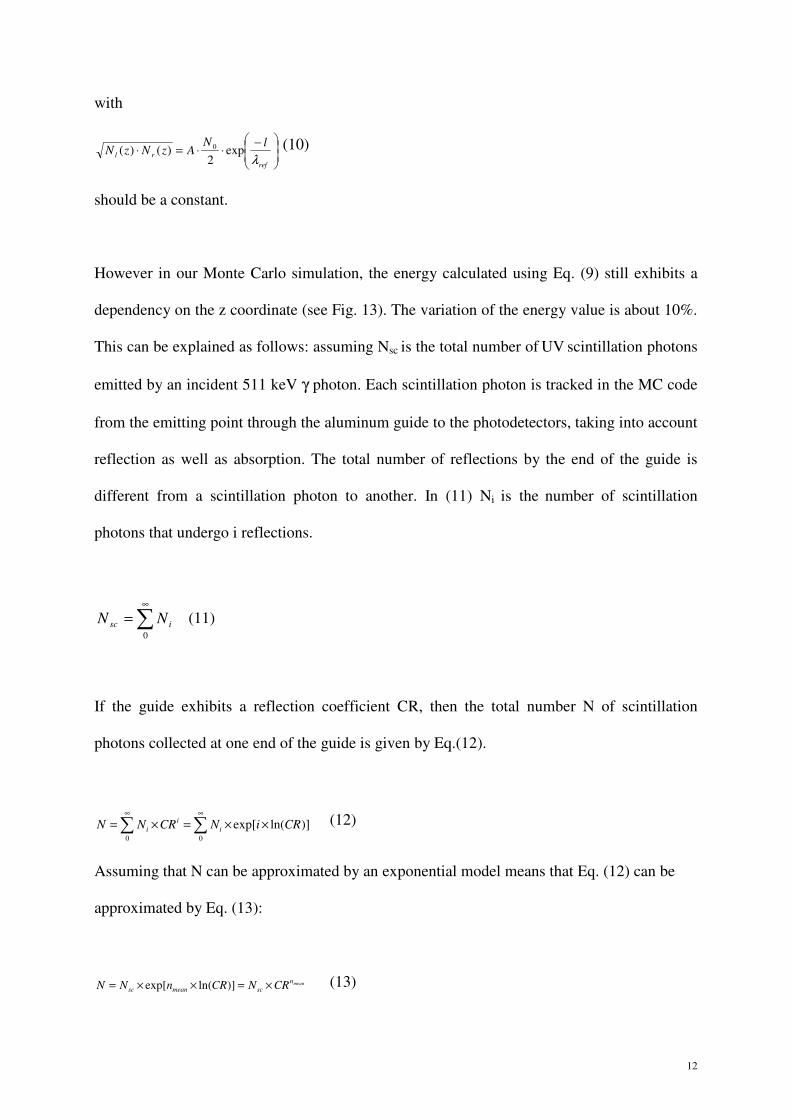
However in our Monte Carlo simulation, the energy calculated using Eq. (9) still exhibits a
dependency on the z coordinate (see Fig. 13). The variation of the energy value is about 10%.
This can be explained as follows: assuming Nsc is the total number of UV scintillation photons
emitted by an incident 511 keV γ photon. Each scintillation photon is tracked in the MC code
from the emitting point through the aluminum guide to the photodetectors, taking into account
reflection as well as absorption. The total number of reflections by the end of the guide is
different from a scintillation photon to another. In (11) Ni is the number of scintillation
photons that undergo i reflections.
�∞
=0
isc NN (11)
If the guide exhibits a reflection coefficient CR, then the total number N of scintillation
photons collected at one end of the guide is given by Eq.(12).
��∞∞
××=×=00
)]ln(exp[ CRiNCRNN ii
i (12)
Assuming that N can be approximated by an exponential model means that Eq. (12) can be
approximated by Eq. (13):
meannscmeansc CRNCRnNN ×=××= )]ln(exp[ (13)
13
Where nmean is the weighted average number of reflections the scintillation photons undergo
for a given interaction point. In our case this approximation leads to a 10% error on the
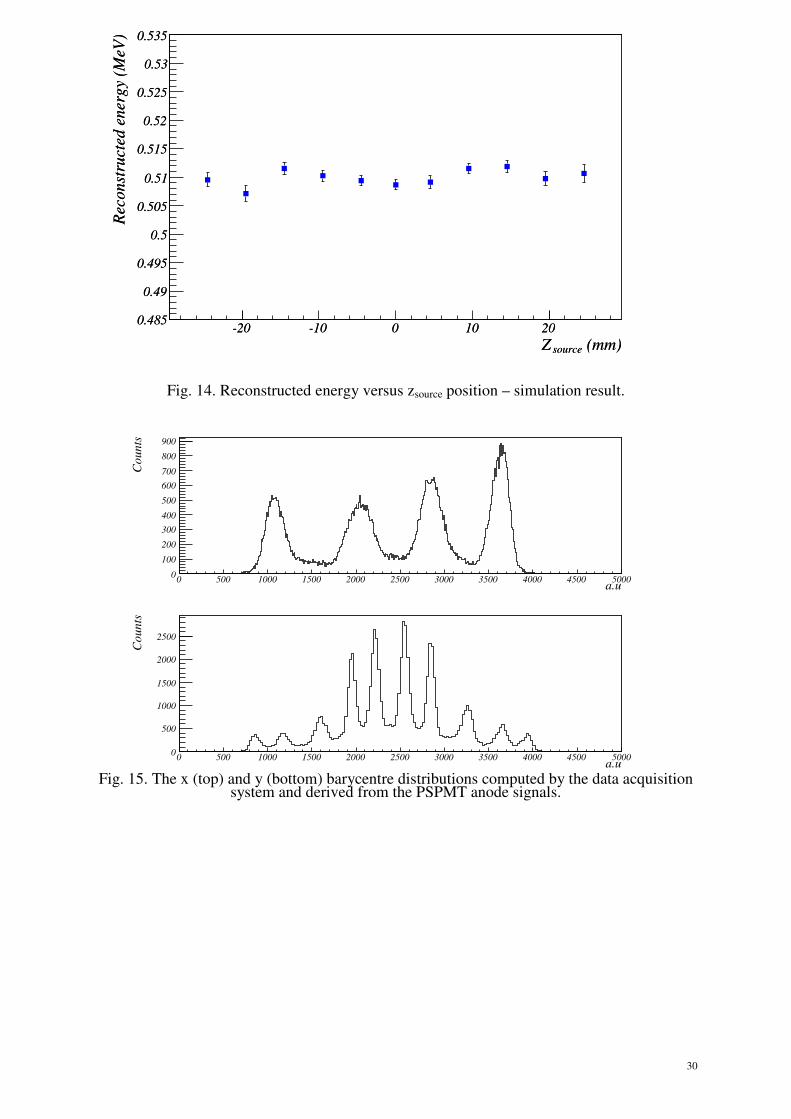
calculated energy which is very satisfactory. To get a more precise value of the energy
deposited by the γ photon it is necessary to apply a correction. As a consequence, in a
calibration phase, a Gaussian fit of the Nr(z)+Nl(z) distribution is done at each z position. The
[Nr(z)+Nl(z)]mean values are stored. This set of points is then fitted using a polynomial
expression. Finally, the simulated data are then corrected according to the zrec value
previously given by Eq. (7). Fig. 14 shows the result of such a correction on the reconstructed
energy, the error is at the level of 1%.
4.6 Discussion.
Simulation shows that the exponential model of the light attenuation is realistic. The z
reconstructed coordinate can be found using the exponential scheme and the effect of Xenon
impurities can be easily introduced in the equations that describe the model. Besides, the main
advantage of this model is to qualify the light propagation medium by a single λref parameter.
However, it must be stressed that the exponential approximation induces an error in the
energy calculation (10% in our case). Given the very satisfactory results obtained when a
polynomial correction is applied, this method has been chosen in the following analysis for
the energy reconstruction. On the contrary the exponential model has been kept for the light
guide characterization and the z-coordinate reconstruction.

14
5 Experimental results.
As mentioned in section 2 the experimental trigger was conditioned by the coincidence of the
LXe cell and the LYSO detector signals. Experimental data analysis was carried out in the
same conditions as in the simulation. However a 1mm step scan of the edges of the LXe cell
revealed a 4 mm gamma beam width limiting the module performance near its edges. This
arose from solid angle calculation once taking into account the source collimation (see section
2). In the present results the scan range of the module was set to +/- 20 mm around the central
position. The edges calibration was also used to precisely determine the module centre from
LYSO detector point of view. In the following analysis this central position is defined as
having z=0. Moreover PSPMT test showed that their response exhibited large fluctuations
over the entrance window and that a response mapping was necessary.
5.1 Transaxial localisation and PSPMT mapping.
The PSPMT calibration was carried out using Xenon scintillation light. The first step to
perform this mapping is to identify the guide in which the γ interaction took place. The
transaxial localisation is derived from a weighted average calculation on the PSPMT anodes
signals. The 40 light guide separation is shown in Fig. 15 (the σx and σy resolutions are
respectively at the level of 1.4 and 0.6 mm). All of the four guides distributed along the x axis
can be isolated whereas the collimation performed by the LYSO detector is such that our data
are mostly accumulated in the 4 guides located close to the centre along the y axis. The
simulation shows that the events reconstructed between two guides are induced by γ rays
undergoing Compton scattering in several guides. Such events cannot be processed by
PSPMTs. Therefore, in the analysis code, cuts are applied to select events that take place in a
single guide. The PSPMTs mapping consists in the determination of a coefficient table that
15
normalize the right and left responses for each guide when the 22Na source is located at the
module centre.
5.2 Determination of the attenuation length λref.
The dynode signals of the two PSPMTs (Nr and Nl) were used to determinate the λref value.
The expression ln(Nr/Nl) is calculated for each position of a 5 mm step scan and then the
mean values are derived from gaussian fits of the distributions. The linear behaviour of the
result (see Fig. 8) indicates that experimental data can also be processed using an exponential
model. This calculation was operated for each of the 16 light guides. The data analysis
showed that the 16 λref values exhibit a 23.9 mm mean value and a 1.0 mm standard deviation.
The simulated attenuation length was found to be equal to 26.5 mm for a light guide
reflectivity equal to 80 %. Assuming a 78 % reflectivity leads to a simulated λref equal to 24
mm.
5.3 The axial resolution.
The determination of the axial resolution was also based on the dynode signals asymmetry.
Data were processed in the same way as in the simulation. The axial resolution is shown in
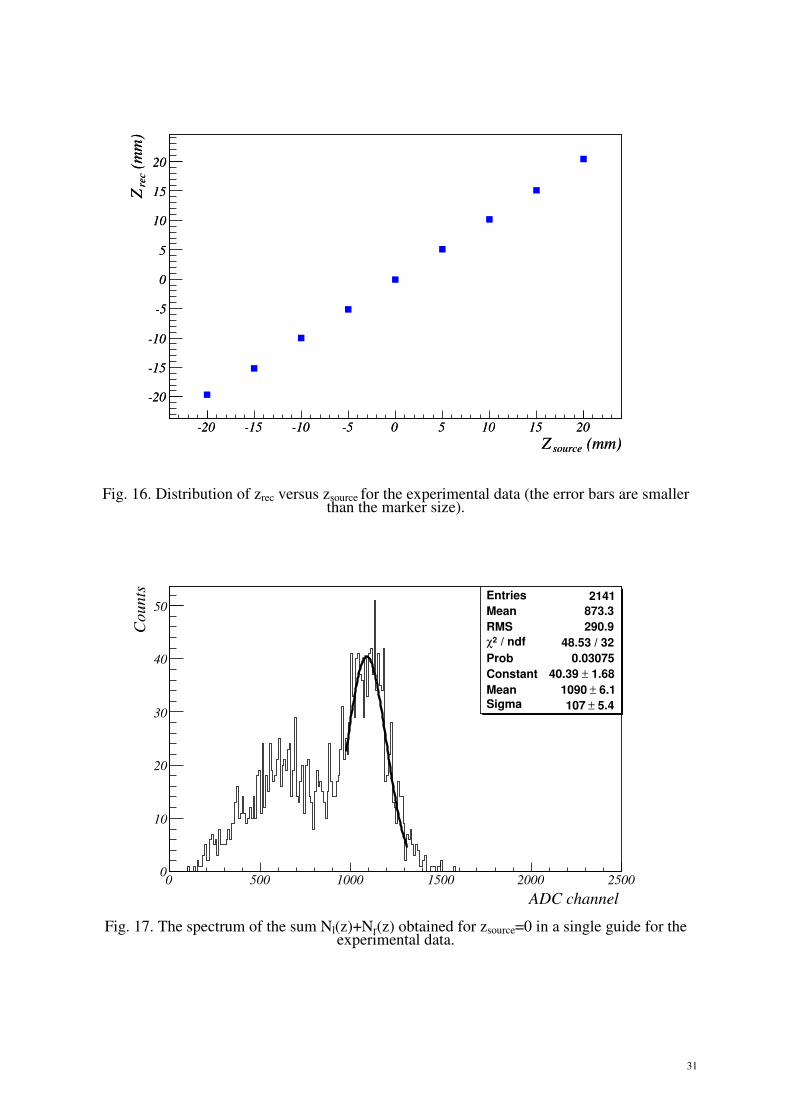
Fig. 10 while the Fig. 16 presents the reconstructed position zrec as a function of the source
position zsource. An axial resolution of 3.0 ± 0.3 mm was obtained since no cuts on the energy
were applied. The effects of such cuts will be presented in section 5.6.
5.4 The energy resolution and reconstruction.
The energy resolution is derived from the fit of the photopeak in the Nr+Nl spectrum. The
spectrum corresponding to zsource=0 is shown in Fig. 17. The energy resolution for the whole
module is shown in Fig. 12. The best energy resolution achievable is about 10 % near the
16
centre position of the module. The energy calculated using Eq. (9) also exhibits a 10 % error.
The energy correction using a polynomial fit reduces this error to 3 %.
5.5 Time resolution.
The time resolution of the module prototype has been measured using the TDC signal. Fig. 18
summarizes the time resolution measurement along the module by step of 5 mm. A mean
value of about 700 ps has been found when no energy cut is applied. It is improved up to 550
ps with an energy cut of 400 keV.
5.6 Summary of the module performances and discussion.
The optimization of the studied Liquid Xenon PET prototype depends on three relevant
parameters:
• the energy resolution at the 511 keV photo-peak that permits to cut down photons
having undergone Compton scattering,
• the time response that helps to level down random coincidence rate,
• the DOI measurement that makes the system insensitive to any parallax effect.
Concerning the first two relevant parameters (see Tab. 2), the tested prototype exhibits a 10%
(RMS) energy resolution and a 550 ps time resolution. Better energy and time resolutions can
be achieved using LXe [35,36] but to optimize these resolutions it is necessary to minimize
the amount of UV photons absorbed before they reach a photo detector. In Ref. [36], detectors
use ultra pure xenon (on line purification is operated) and high reflectivity material such as
Teflon, which would not be appropriate in the present application where specular reflection is
requested. Moreover in Ref. [35,36] the photodetectors are immersed in the LXe to improve
the light collection efficiency. On the contrary, the DOI measurement described in the present
17
paper is straightforward, since determined by the number of pixels in the module, whereas the
z-coordinate relies on UV photon absorption by the detector itself. For instance, a 90%
reflectivity is less favorable than 80%. Consequently the optimal values for z, time and energy
resolutions are a matter of compromise. Furthermore, no purification of the Liquid Xenon is
operated in the perspective of simple experiment handling to satisfy future biology
application. Simulation shows that increasing λref levels up the number of photoelectrons
collected. By doing so, better σE/E and σt resolutions can be achieved but to the detriment of
σz. Nevertheless, if the number of photo electrons collected is increased by using PSPMTs
with higher quantum efficiency or if the present PSPMTs are immersed in the LXe, then
better σE/E, σt and σz. resolutions are reachable. The present 550 ps (RMS) time resolution
would not permit to make the proposed LXe PET prototype a Time-of-Flight PET (TOF-PET)
but would make possible to access on-line to the bio distribution of a medical tracer in
laboratory animals (drug developments).
Concerning the DOI measurement, it has been demonstrated that a 400 keV energy cut
enables to reach a resolution on z of 2.5 ± 0.2 mm (see Tab. 2) which is a promising result
when compared to [34]. A simulation of the present test bench with PSPMTs that time
immersed in the Liquid Xenon shows that a σz at the level of 1.5 mm is reachable.
On the contrary the σx and σy measurements are already very competitive. In our detector
scheme, the transverse coordinates x and y of the interaction point are derived from the
address of the hit guide. With a matrix of 40 light guides each featuring a 5 x 2 mm2 cross
section, the σx and σy resolutions are respectively at the level of 1.4 and 0.6 mm. A second
matrix of 100 light guides each featuring a 2x2 mm2 is currently in test thus exhibiting a σx
and σy resolution of 0.6 mm. Such a resolution would make possible, with the proposed LXe
�PET, to image the distribution of molecular probes at sub-millimeter resolution in laboratory
animals.
18
6 Conclusion.
A first prototype module of a parallax free �PET using LXe in an axial geometry has been
built. A module is optically subdivided into 40, 5 x 2 mm2, MgF2-coated aluminum UV light
guides read on each end by PSPMTs. The light guide modeling has been extensively
discussed. The exponential model chosen has been found to be very attractive since light
propagation can be described with simple analytic expression. Furthermore it allows the LXe
pollution to be easily accounted for. An experimental test bench has been built to measure the
transverse localization of an interaction in the module, i.e. x and y measurements, but also to
evaluate the axial localization (z coordinate), the energy and time resolutions. A Monte-Carlo
simulation of this test bench has been carried out using the GATE-GEANT4 package. Both
experimental and simulated data have been analyzed using the exponential scheme. The
agreement is very satisfactory. The resolution on the z coordinate has been found to be 2.5
mm once the photopeak is isolated with a cut on the reconstructed energy at 400 keV, the best
achievable energy resolution is 10 % on the data and time resolution is about 550 ps. These
results are promising. Better resolutions may be achieved by immersing the PSPMTs in the
LXe, this solution is envisaged in a near future. The simulation of the whole scanner is
underway to quantify its performance on reconstructed images.

19
Acknowledgments.
Financial support from Institut National de Physique Nucléaire et de Physique des Particules
(IN2P3), Région Rhône-Alpes and Université Joseph Fourier is acknowledged. Yves
Carcagno from the LPSC laboratory is thanked for his help in handling the cryogenic part of
the experimental test bench. We are grateful to Eric Perbet from the LPSC laboratory for his
implication in the technical drawings of the mechanical part of the experimental test bench.

20
References.
[1] S. Weber and A. Bauer European. Journal of Nuclear Medicine and Molecular Imaging 31
(2004) 1545.
[2] Y. Yang et al., Phys. Med. Biol. 49 (2004) 2527.
[3] K. Wienhard et al., IEEE Trans. Nucl. Sci. 49 (2001) 104.
[4] Y.C. Tai and D.F. Newport, Journ. of Nucl. Medicine 46 (2005) 3.
[5] S. Jan, private communication, measurement done at CEA/SHFJ.
[6] S. Kubota et al., Phys. Rev. B 20 (1979) 3486.
[7] S. Kubota et al., Nucl. Instr. and Meth. A 196 (1982) 101.
[8] T. Doke et al., Japan. J. Appl. Phys. 41 (2002) 1538.
[9] The Crystal Clear Collaboration : http://crystalclear.web.cern.ch/
[10] S. Eidelman et al., (Particle Data Group), Phys. Lett. B 592(2004) 1.
[11] V. Chepel et al., Nucl. Instr. and Meth A 392 (1997) 427, IEEE Trans. Nucl. Sci. 46
(1999) 1038.
[12] J. Collot et al., Proc. of the IXth Intern. Conference on Calorimetry in High Energy
Physics (CALOR 2000).Oct. 2000, Annecy (France), Eds. B. Aubert et al. (Frascati Physics
Series Vol 21), pp. 305
[13] S. Jan et al., Proc. of International Conference Imaging Technologies in Biomedical
Sciences (ITBS 2001), May 2001, Milos Island (Greece).
[14] S. Jan, PhD Thesis, Université Joseph Fourier (Grenoble, France), Sept. 2002.
[15] F. Nishikido et al., Japanese Journal of Applied Physics 43 (2004) 779.
[16] G.J. Davies et al., Phys. Lett. B320 (1994) 395.
[17] E. Aprile et al., Nucl. Instr. and Meth. A 461 (2001) 256.

21
[18] R. Bernabei et al., Nucl. Instr. and Meth. A 482 (2002) 728.
[19] A. Incicchitti et al., Nucl. Instr. and Meth. A 289 (1990) 236.
[20] S. Agostinelli et al., Nucl. Instr. and Meth. A 506 (2003) 250.
[21] S. Jan et al., Phys. Med. Biol. 49 (2004) 4543-4561.
[22] J. Seguinot et al, Nucl. Instr. and Meth. A 354 (1995) 280.
[23] V.N. Solovov et al., Nucl. Instr. and Meth. A 516 (2004) 462.
[24] Hamamatsu Photonics, 8 Rue du Saule Trapu, Parc du Moulin de Massy, 91300 Massy,
France.
[25] S. Jan et al., GATE User's Guide.
[26] S. Jan et al., IEEE Trans. Nucl. Sci. 52 (2005) 102.
[27] K.S Shah et al., IEEE Trans. Nucl. Sci. 51 (2004) 91.
[28] E. Gramsch et al., IEEE Trans. Nucl. Sci. 50 (2003) 307.
[29] K.C. Burr et al., Nuclear Science Symposium Conference Record, 2003 IEEE Volume 2,
Issue , 19-25 Oct. 2003 Page(s): 877 - 881 Vol.2.
[30] A. Braem et al., Nucl. Instr. and Meth. A 571 (2007) 131.
[31] A. Braem et al., Nucl. Instr. and Meth. A 320 (1992) 228.
[32] N. Ishida et al., Nucl. Instr. and Meth. A 327 (1993) 152.
[33] Baldini et al., Nucl. Instr. And Meth. A 545 (2005) 753.
[34] I. Vivaldi et al., Nucl. Instr. and Meth. A 564 (2006) 506.
[35] T. Doke et al., Nucl. Instr. and Meth. A 569 (2006) 863.
[36] K. Ni et al, JINST 1 (2006) 9004.
22
List of Figures.
1 Parallax effect due to the non-measurement of the depth of interaction. 24
2 The LXe �PET geometry. 24
3 Sketch of an elementary module of the LXE �PET camera : the z-axis is along the axial
direction of the �PET. 24
4 Hamamatsu [24] R8520-06-C12 Position Sensitive Photomultiplier tubes and the 40,
2x5mm2 Mg-F2 coated aluminum VUV light guides. 25
5 The experimental set-up used for the test of the prototype module. 25
6 Data Acquisition System. 26
7 Number N of photoelectrons collected at each module end (Nr = square , Nl = triangle)
versus the zsource position (the error bars are smaller than the marker size) – simulation
result . 26
8 ln(Nr/Nl) versus zsource position (error bars are smaller than the marker size). 27
9 Distribution of the reconstructed zrec position for a source located at zsource=0 - simulation
result . 27
10 RMS value of z rec versus the zsource position . 28
11 Spectrum of the sum Nl(z)+Nr(z) obtained for zsource=0 in a single 2x5 mm2 guide -
simulation result . 28
12 Energy resolution for the whole module scanned by 5mm steps. 29
13 The lr NN × distribution versus the zsource position - simulation result. 29
14 Reconstructed energy versus zsource position - simulation result. 30
15 The x (top) and y (bottom) barycentre distributions computed by the data acquisition
system and derived from the PSPMT anode signals. 30
16 Distribution of zrec versus zsource for the experimental data (error bars are smaller than the
marker size). 31

23
17 The spectrum of the sum Nl(z)+Nr(z) obtained for zsource=0 in a single guide for the
experimental data. 31
18 The time resolution scanned over the whole module by 5 mm steps - experimental data.
32
24
Fig.1. Parallax effect due to the non-measurement of the depth of interaction.
Fig. 2. The LXe �PET geometry.
Fig. 3. Sketch of an elementary module of the LXE �PET camera : the z-axis is along the axial direction of the �PET.
dδ
True hit
Reconstructed hitTrue LOR
Reconstructed LOR Object
Detection module :crystal + PMT
25
Fig. 4. Hamamatsu [24] R8520-06-C12 Position Sensitive Photomultiplier tubes and the 40, 2x5 mm2 Mg-F2 coated aluminum VUV light guides.
Fig. 5. The experimental set-up used for the test of the prototype module.
26
Fig. 6. Data Acquisition System.
Fig. 7. Number N of photoelectrons collected at each module end (Nr = square , Nl = triangle) versus the zsource position (the error bars are smaller than the marker size) - simulation result.
(mm)sourceZ-20 -10 0 10 20
N
50
100
150
200
250
300
350
400
450

27
Fig. 8. ln(Nr/Nl) versus zsource position (the error bars are smaller than the marker size).
Fig. 9. Distribution of the reconstructed zrec position for a source located at zsource=0 - simulation result.
Entries 2862
Mean 0.1612
RMS 5.271
/ ndf 2χ 64.07 / 27
Prob 7.537e-05
Constant 3.6± 134.3
Mean 0.06978± -0.04466
Sigma 0.068± 3.013
(mm)recZ-40 -30 -20 -10 0 10 20 30 40
Cou
nts
0
20
40
60
80
100
120
140
160
180
200
220 Entries 2862
Mean 0.1612
RMS 5.271
/ ndf 2χ 64.07 / 27
Prob 7.537e-05
Constant 3.6± 134.3
Mean 0.06978± -0.04466
Sigma 0.068± 3.013
(mm)sourceZ-20 -10 0 10 20
lN
rN
ln
-2
-1.5
-1
-0.5
0
0.5
1
1.5
2
DATA
SIMULATION
28
Fig. 10. RMS value of zrec versus the zsource position.
Fig. 11. Spectrum of the sum Nl(z)+Nr(z) obtained for zsource=0 in a single 2x5 mm2 guide – simulation result.
Entries 2862Mean 165.7RMS 112
/ ndf 2χ 59.31 / 21Prob 1.623e-05Constant 2.38± 50.92 Mean 0.8± 298.7 Sigma 0.92± 18.17
Number of photo-electrons0 50 100 150 200 250 300 350 400 450 500
Cou
nts
0
10
20
30
40
50
60
70 Entries 2862Mean 165.7RMS 112
/ ndf 2χ 59.31 / 21Prob 1.623e-05Constant 2.38± 50.92 Mean 0.8± 298.7 Sigma 0.92± 18.17
(mm)sourceZ-20 -10 0 10 20
(mm
)re
cZσ
2.6
2.8
3
3.2
3.4DATA
SIMULATION
29
Fig. 12. Energy resolution for the whole module scanned by 5mm steps.
Fig. 13. The lr NN × distribution versus the zsource position – simulation result. (mm)sourceZ
-20 -10 0 10 20
l N× r
N
148
150
152
154
156
158
160
162
164
166
(mm)sourceZ-20 -10 0 10 20
l N× r
N
148
150
152
154
156
158
160
162
164
166
(mm)sourceZ-20 -10 0 10 20
Ene
rgy
reso
lutio
n (%
)
6
8
10
12
14
16
DATASIMULATION
30
Fig. 14. Reconstructed energy versus zsource position – simulation result.
Fig. 15. The x (top) and y (bottom) barycentre distributions computed by the data acquisition system and derived from the PSPMT anode signals.
a.u0 500 1000 1500 2000 2500 3000 3500 4000 4500 5000
Cou
nts
0
100
200
300
400
500
600
700
800
900
a.u0 500 1000 1500 2000 2500 3000 3500 4000 4500 5000
Cou
nts
0
500
1000
1500
2000
2500
(mm)sourceZ-20 -10 0 10 20
Rec
onst
ruct
ed e
nerg
y (M
eV)
0.485
0.49
0.495
0.5
0.505
0.51
0.515
0.52
0.525
0.53
0.535
(mm)sourceZ-20 -10 0 10 20
Rec
onst
ruct
ed e
nerg
y (M
eV)
0.485
0.49
0.495
0.5
0.505
0.51
0.515
0.52
0.525
0.53
0.535
31
Fig. 16. Distribution of zrec versus zsource for the experimental data (the error bars are smaller than the marker size).
Fig. 17. The spectrum of the sum Nl(z)+Nr(z) obtained for zsource=0 in a single guide for the
experimental data.
Entries 2141Mean 873.3RMS 290.9
/ ndf 2χ 48.53 / 32Prob 0.03075Constant 1.68± 40.39 Mean 6.1± 1090 Sigma 5.4± 107
ADC channel0 500 1000 1500 2000 2500
Cou
nts
0
10
20
30
40
50Entries 2141Mean 873.3RMS 290.9
/ ndf 2χ 48.53 / 32Prob 0.03075Constant 1.68± 40.39 Mean 6.1± 1090 Sigma 5.4± 107
(mm)sourceZ-20 -15 -10 -5 0 5 10 15 20
(mm
)re
cZ
-20
-15
-10
-5
0
5
10
15
20
(mm)sourceZ-20 -15 -10 -5 0 5 10 15 20
(mm
)re
cZ
-20
-15
-10
-5
0
5
10
15
20

32
Fig. 18. The time resolution scanned over the whole module by 5 mm steps - experimental data analysis.
(mm)sourceZ-20 -15 -10 -5 0 5 10 15 20
(ns)
tσ
0.3
0.4
0.5
0.6
0.7
0.8
0.9
1

33
List of tables.
1 Comparison of physical properties of LXe and commonly used crystals. Values from [9,10]
otherwise stated. 34
2 Comparison of experimental results and simulation - summary table. 34

34
Scintillator Density (g cm-3) Decay time (ns) Light Yield (UV/MeV) LXe 3.06 3-30 [6,7] 46000 [8] NaI 3.67 230 38000 BGO 7.13 300 9000 LSO 7.4 40 27000
Table 1 : Comparison of physical properties of LXe and commonly used crystals. Values from [9,10], unless otherwise stated.
Experimental data (selection criterion)
Simulation (no PMTs) (selection criterion)
λ 24mm 24mm CR=0.78 et LA=38°
Energy resolution 10% 6%
Z resolution (RMS) 2.5mm (400keV) 3mm
2.5mm (400keV) 3mm
Time resolution (RMS) 550ps (400keV) 700ps
Table 2 : Comparison of experimental results and simulation - summary table.