a logistic analysis with the sensitivity model prof. vester€¦ · report a logistic analysis with...
TRANSCRIPT
REPORT
A logistic analysis with the Sensitivity Model Prof.
Vester
The report approved: 2012-03-19
John Munthe Vice President, Research
Christina Wolf Fredrik Persson Kristian Jelse B2048
March 2012
Organization
IVL Swedish Environmental Research Institute Ltd. Report Summary Project title A logistics analysis with the Sensitivity Model Prof. Vester Address
P.O. Box 5302 SE-400 14 Göteborg Project sponsor
Geodis Wilson Telephone +46 (0)31-725 62 00
Author Christina Wolf Fredrik Persson Kristian Jelse
Title and subtitle of the report A logistic analysis with the Sensitivity Model Prof. Vester Summary During 2010 and 2011, IVL has in a case study together with Geodis Wilson applied the so-called Sensitivity Model Prof. Vester (a system model for which IVL has acquired a license and which is characterized by a very broad approach) in the analysis of a transport flow (clothes) from Asia to Europe. The case study aims to identify relevant control parameters, which help the transport provider and the producer of clothes to optimize and adapt their transport flows according to changed conditions (economic, ecological, social) today and tomorrow. Keyword Analysis, system, transport, logistics, sensitivity
Bibliographic data
IVL Report B2048 The report can be ordered via Homepage: www.ivl.se, e-mail: [email protected], fax+46 (0)8-598 563 90, or via IVL, P.O. Box 21060, SE-100 31 Stockholm Sweden
A logistic analysis with the Sensitivity Model Prof. Vester IVL report B2048
1
Contents
1. Background .................................................................................................................................2 2. Introduction ...............................................................................................................................4 3. Method ........................................................................................................................................6 4. Process during the project ........................................................................................................9 5. Results ...................................................................................................................................... 12
5.1 Systemic role distribution ................................................................................................ 12 5.2 Effect system ..................................................................................................................... 14 5.3 Company analysis ............................................................................................................. 16 5.4 Scenario analysis ............................................................................................................... 18 5.4.1 Scenario 1 – legal measures ................................................................................................ 18 5.4.2 Scenario 2 – fuel prices ...................................................................................................... 20 5.5 Total system evaluation ................................................................................................... 23
6. Evaluation of the process and software of the Sensitivity Model ................................... 31 8. Recommendations .................................................................................................................. 35 9. Literature .................................................................................................................................. 38 10. List of figures .......................................................................................................................... 39

A logistic analysis with the Sensitivity Model Prof. Vester IVL report B2048
2
1. Background For some years now, the transport industry has been receiving growing attention because of its environmental and climate impact, which, moreover, is growing, while other indus-tries have been successful in their efforts to reduce environmental and climate impact. In the transport industry, the growing impact is a result of the globalization of production and trade and an increasing prosperity in countries such as China and India, where more and more people want to take part in the development, among others through increased con-sumption leading to increased transportation of goods as well.
The enhanced focus on the transport industry has already led to positive changes, such as innovations among propulsion technologies and fuels, but also that customers are becom-ing more demanding on environmental aspects of transportation and logistics services. Several new laws and rules to integrate external effects of transportation are discussed among EU politicians, but the legislative process and the adoption of such rules takes a long time, is often not harmonized among different European countries and thus leads to deep uncertainty on how and when industry will be affected. Overall, the realization that "business as usual ' will not be good enough to run a successful business in the future is growing, but how to adjust services, products and processes to new requirements when no one really knows how and when they will be formulated, is a question difficult to answer. A further complicating factor is that trade has become increasingly global, making it necessary to apply a wide focus. In addition, it is not enough anymore to optimize a single aspect, as companies truly striving for sustainability are expected to optimize their economy, their environmental and climate impact, and their social aspects simultaneously.
All this is nothing really new. The insight into these problems exists. What might be miss-ing today though is something else: Transport systems are no isolated systems but exist and develop dependently of other systems. Such another system is for example production, manufacturing products that will later be transported to markets. Again another system is society, where production and transportation takes place. An even larger system is the na-tural environment which is the "host" for all (transport) activities. Any attempt to make parts of the transport system more sustainable while their systemic roles are ignored incurs a high risk of failure. Any attempt to change the transport system while its relations and interactions with other systems are ignored is not sustainable. What is needed to answer this challenge is a new perspective on transports' complex problems and future solutions: The awareness that a lot is interconnected which has been looked at separately and that the knowledge on invisible links behind an object of analysis (here: transport route being af-fected by many factors that are not directly apparent, e.g. consumer behavior, production decisions, etc.) are often more important for the development of a solution than the object itself.
The sometimes invisible relations in the business world, invisible due to lack of overview, complexity, lack of information etc., accompanied by uncertainties and time delays of many different factors, require businesses to learn to deal with complex questions and networks in a professional manner. This kind of “systemic” expertise can be seen as a prerequisite to
A logistic analysis with the Sensitivity Model Prof. Vester IVL report B2048
3
survive in the market also for the next 30 years. At the same time can holistic analyses help companies already today to invest their time and money strategically in terms of research and development: They make it rather clear which and when certain business units or de-partments should be prioritized.
Within the transportation industry, current buzz words are climate-neutral or sustainable transport and logistics. However, looking back at what has been said before, it is question-able whether it is possible to realize sustainable transportation and logistics in an otherwise unsustainable system, for example, in an unsustainable supply chain. In other words: Can a part of a system to be sustainable if the overall system itself is not?
Therefore, the perspective on transportation should be broadened into a more comprehen-sive approach that covers the entire supply chain and even those parameters influencing it from the outside, in order to really achieve a sustainable system, of which transport and logistics are important parts. Ideally, the entire chain and not individual companies should be optimized. This requires knowledge not only on environmentally adapted transportation and logistics, but also on production, product, resource efficiency, waste, organization management and more.
Research in classical supply chain management has started to address new areas such as "greening the supply chain" or "greening suppliers", but so far there are only very few, if any, theoretical descriptions, methods, etc., from which it becomes clear how a supply chain must be controlled so that it can be "green" or sustainable: "If a broad and deeper greening of industry is to be achieved, a greater understanding is needed of the process, i.e. how companies work together in order to bring about environmental change." (Canning and Hanmer-Lloyd, 2001). Research which has attempted to work with the overall system of a supply chain from a sustainability perspective - instead of working separately with its various parts - is still limited and undeveloped. Such research would have as its main ob-jective the coordination of all knowledge related to supply chains and their management, thus establishing new interdisciplinary knowledge from all involved sciences and actors.
Taking the above into account, IVL carried out an internal research project in 2010 to in-vestigate the possibilities of the institute to start work in the field of (sustainable) supply chain management. It became clear that most supply chains nowadays are complex sys-tems, and that was is needed to be able to understand and manage supply chains may not be first and foremost knowledge on all the different elements - raw materials, product de-velopment, production, distribution, waste etc. - but knowledge on how complex systems, regardless of the type of system that is in focus, can be understood and steered towards more sustainability and a higher viability.
After a short market research with regard to available models for systemic analyses, a spe-cific model was chosen for closer examination: The Sensitivity Model Prof. Vester®. The model was tested internally and finally, a full license was acquired.
A logistic analysis with the Sensitivity Model Prof. Vester IVL report B2048
4
2. Introduction With more than 7,000 employees and a global network in over 50 countries, Geodis Wilson is one of the world’s largest freight management companies with offices in Europe, the Americas and the Asia Pacific region as well as in the Middle East and in Africa. The com-pany offers integrated supply chain solutions that deliver cargo by sea and air and specia-lizes in in-depth knowledge of several markets including high-tech, pharmaceuticals, textiles and automotive products as well as marine logistics, industrial projects and other niche markets.
In 2009, Geodis Wilson introduced a fee (Green Service Fee) to be charged when their customers get access to an emission calculator, issue reports and environmental education. These fees are today allocated in an environmental fund, which is completely dedicated to support research in environmental fields as well as internal environmental activities. Re-search projects are selected by Geodis Wilson’s environmental council consisting of repre-sentatives from Geodis Wilson, universities, environmental organizations and customers.
In the beginning of 2010, IVL was contacted by Geodis Wilson who inquired about the institute’s research activities related to transport and logistics. A selection of activities and projects was presented and discussed. Finally, the environmental council decided to spon-sor the analysis of a transport flow importing clothes from China to Europe carried out on behalf of KappAhl. The analysis was to be realized with the help of the Sensitivity model Prof. Vester.
It was decided that the analysis should focus on the transportation of clothes and should cover all transport activities from Geodis Wilson’s terminal in Shanghai to seaports alter-native airports in Denmark and Sweden, as well as further distribution from those termi-nals to KappAhl’s distribution center and finally to the Swedish shops where the clothes are sold. The analysis should not cover any production aspects which are not directly related to transportation and logistics, for example raw materials, social conditions of workers in China, the environmental impact of production etc. Other aspect of production, for example planning expertise and the ability of KappAhl to meet their consumers’ needs, were taken into consideration, as they might impact lead times and on-time deliveries to the shops.
All participants should get the opportunity to apply a new model specifically developed to deal with complex issues. This should increase the knowledge on how problems can be solved with a systemic approach, which is important when looking at globalization with its complex economic dependence relations and current global challenges such as climate change. At the same time, the model is not limited to issues related to climate change or environmental protection. It is equally useful for the analysis of strategic issues discussed at management level.
In addition, different departments of the participating companies and organizations should participate in the project, for example sea freight and land transport. The project thus aimed for an interdisciplinary approach that should help all participants to achieve a holistic view and be able to collaborate more effectively.
A logistic analysis with the Sensitivity Model Prof. Vester IVL report B2048
5
In particular, the participating companies were supposed to get information on present and future parameters that should help them to steer their organizations' transport and logistics activities effectively and efficiently with regard to an uncertain development of environ-mental issues and climate change, customer requirements and new legislation. By learning to deal with complex uncertainties, they hopefully become more flexible and can adapt their processes and services (before they are forced to do so) and use a head-start over other players. The project should create an example of how a certain cooperation between suppliers and a customer in a particular industry (here: textiles) can help all to act more sustainably in the long run. The example may also be transferred to other industries and thus provide a basis for further research and application.
To summarize, the following targets were set up:
− Learn to apply the sensitivity model and increase knowledge on the management of complex issues,
− get insight into how the organization of transport and logistics activities should be designed in order to be able to manage a shifting and uncertain development of en-vironmental and climate requirements, customer needs and legislation,
− identify concrete and relevant control parameters which can help to optimize and adapt transport flows to changed conditions today and tomorrow.
The report is structured as follows: In chapter 3, a description of the Sensitivity Model and its 9 interacting steps is given. Furthermore, the benefits of the model and software as they could be distinguished until today are shortly explained. In chapter 4, a detailed description is given on the work process during the whole project. In chapter 5, all results of all steps of the model will be presented. In chapter 6, an evaluation of the model is carried out, es-pecially of the process and the software functionalities. The report ends with a conclusion and recommendations for Geodis Wilson, for KappAhl and for both together.

A logistic analysis with the Sensitivity Model Prof. Vester IVL report B2048
6
3. Method The Sensitivity Model was developed by Fredrik Vester (1925-2003)1 and is based on trying to find system constellations in which certain problems (for example with regard to envi-ronmental harm, energy distribution, resource use etc.) do not occur in the first place. The overall target of the model it is the ability of any system to survive long-term. It is based on bio-cybernetics which is defined as the science dealing with “recognition, control, and au-tomatic self-regulating of inter-related actions with the lowest energy input possible.” (Vester 2007). In his research and in many projects, Fredrik Vester came across certain shortcomings which seemed to occur either together or separately when dealing with or managing complex problems and systems. He summarized them as follows:
1. Wrong mission statement
2. Collection of large amounts of data without searching for a structure
3. Irreversible concentration of a target
4. Ignorance of side effects
5. Tendency to be controlling too much (leading to a)
6. tendency towards a dictatorial behavior
He found three main reasons why these errors occur very often:
1. Separate analysis of system components
2. No account of feedback effects, frozen index values
3. For short planning horizon
The IT software of the Sensitivity Model is built according to the laws of fuzzy logic. Fuzzy logic uses the diffuse knowledge of real experience and compromises in case of contradic-tory information. The values thus stay flexible, and several conditions can be described, not only binary like on-off, high-low, full-empty etc. That way, fuzzy logic allows similarly flexible steering mechanisms as can be found in ecosystems. Exact values are not im-portant, but rules which can be formulated with words, see chapter 5. Another advantage is the fact that this process also reduces the amount of data usually needed to describe a complex system.
1 Studies of chemistry at the universities of Mainz and Paris, director of the private Study Group for Biology and Environment Ltd., governmental and business consultant in bio-cybernetic strategies in various public and private sectors, full professor for "Interdependence of Technical and Social Change" at the University of German Armed Forces, Munich, professor for Applied Economics at the University of St. Gallen, Switzerland, member of the Club of Rome.
A logistic analysis with the Sensitivity Model Prof. Vester IVL report B2048
7
System Description
Facts, data, problems, goals, first system
map
Set of Variables
Collection of influence factors and indicators
Systemic Matrix of Criteria
Checking for system relevance
Systemic Role Chart
Cybernetic role of the variables in the
system
Effect System
Interlinking of the variables and
feedback-analysis
Simulation
If-then prognoses & policy tests Partial Scenarios
Visualising detailed functions, clusters or
subsystems
System Evaluation
Following the 8 rules of biocybernetics
Influence Matrix
Evaluation of the strength of influences
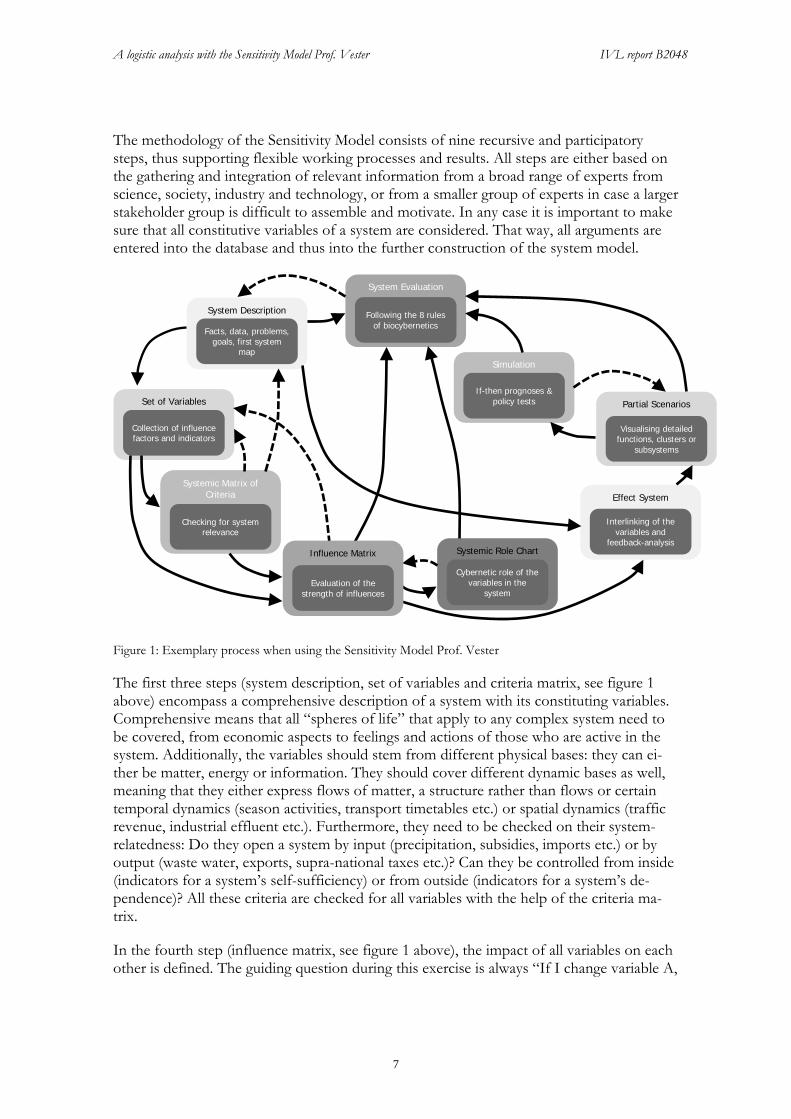
The methodology of the Sensitivity Model consists of nine recursive and participatory steps, thus supporting flexible working processes and results. All steps are either based on the gathering and integration of relevant information from a broad range of experts from science, society, industry and technology, or from a smaller group of experts in case a larger stakeholder group is difficult to assemble and motivate. In any case it is important to make sure that all constitutive variables of a system are considered. That way, all arguments are entered into the database and thus into the further construction of the system model.
Figure 1: Exemplary process when using the Sensitivity Model Prof. Vester
The first three steps (system description, set of variables and criteria matrix, see figure 1 above) encompass a comprehensive description of a system with its constituting variables. Comprehensive means that all “spheres of life” that apply to any complex system need to be covered, from economic aspects to feelings and actions of those who are active in the system. Additionally, the variables should stem from different physical bases: they can ei-ther be matter, energy or information. They should cover different dynamic bases as well, meaning that they either express flows of matter, a structure rather than flows or certain temporal dynamics (season activities, transport timetables etc.) or spatial dynamics (traffic revenue, industrial effluent etc.). Furthermore, they need to be checked on their system-relatedness: Do they open a system by input (precipitation, subsidies, imports etc.) or by output (waste water, exports, supra-national taxes etc.)? Can they be controlled from inside (indicators for a system’s self-sufficiency) or from outside (indicators for a system’s de-pendence)? All these criteria are checked for all variables with the help of the criteria ma-trix.
In the fourth step (influence matrix, see figure 1 above), the impact of all variables on each other is defined. The guiding question during this exercise is always “If I change variable A,
A logistic analysis with the Sensitivity Model Prof. Vester IVL report B2048
8
does variable B also change, and if yes, how much?” Strengths of impacts are given values of 0 to 3:
− 0 = no change at all, − 1 = a change in A brings about only a weak change in B, − 2 = I need to change A a lot in order to achieve an equally big change in B − 3 = A changes little, but B changes a lot
When all boxes have been filled in, the first indications can already be gained (see chapter 5 Results) with the help of the systemic role chart (step 5).
In step 6 (effect system), the specific interplay between the variables is defined. Interest-ingly, the structure of effects between variables behaves often quite differently from the way we might predict after studying only its components. The interplay between variables renders the system’s chain of effects and feedback loops visible.
In step 7 (partial scenarios), particularly interesting parts of the effect system are separated and built up as partial scenarios. Only those parts are selected which supposedly have a high impact on how the system will develop in the future. That way, even though working with partial scenarios, statements on the total system can still be made as the scenarios stem from it. In analogy to living systems, the ‘organism’ (effect system) might be said to com-prise a number of ‘organs’ (partial scenarios) having different functions and consisting in turn of ‘cells’ (the variables) (Vester 2007). In step 8 (simulation), the partial scenarios are simulated according to different “if-then” assumptions, following alternative developments over a defined period of time.
In step 9 (system evaluation), eight basic rules are used to evaluate the total system’s viabi-lity and long-term sustainability, analogous to the criteria of an intact ecosystem. The step serves to deduce suitable strategies and measures for dealing appropriately with the system.
IVL’s choice of the Sensitivity Model was based on the fact that the model is easy to use, transparent, and suitable for many different fields of application. It allows a structured ac-cess to the expertise of different stakeholders and offers a very participatory approach, which is regarded as essential for solving complex problems and in light of a high demand for interdisciplinary ways of working. One considerable advantage of the Sensitivity Model is that is allows to constantly change project findings, definitions and even variables throughout the process without hampering the flow of activities. After having made a change, all subsequent steps will be adjusted automatically, supporting a critical attitude and an openness to correct mistakes at all times. That way, the software itself enhances the quality of results, which is of course also dependent on the expert input.

A logistic analysis with the Sensitivity Model Prof. Vester IVL report B2048
9
4. Process during the project During September and November 2010, several meetings were held between Geodis Wil-son and IVL in order to define the projects’ targets, the system’s boundaries (see chapter 2), prepare for possible problems or obstacles, and choose the projects’ participants. A core team was put together, consisting of Bengt Erlandsson and Maria Svensson from Geodis Wilson, Christina Wolf, Fredrik Persson and Kristian Jelse from IVL and representatives from KappAhl. As stakeholders regularly participating in important meetings, we identified a private consultant with special focus on environmental policy related to transportation, scientific experts from Chalmers, a representative from the shipping industry as well as a shipping expert from Geodis Wilson and representatives from two other companies in-volved in the distribution of KappAhl’ products in Sweden. In December 2010, a one-day kick-off meeting was held at IVL with the core team where the Sensitivity Model was in-troduced, the system boundaries were discussed and confirmed, the project’s scope was agreed upon and where a short risk analysis of the project was presented. This phase can be seen as the “pre-project phase” to define the approach, the project design, deadlines and milestones.
In the next phase or “Module I”, a first two-day workshop in February 2011 was carried out. The aim of the workshop was to cover steps 1-4 of the Sensitivity Model: 1. system description, 2. variable definition, 3. check of variables against certain criteria and 4. impact matrix. The first day focused on a detailed system description and the development of a set of variables. At the end of day 1, the IVL team met in order to refine variable descriptions and check the variables against a set of criteria given by the model to make sure that no important aspect of a complex system was overlooked. The first half of day 2 began with a discussion of the refined variable set. The second half of the day was dedicated to filling in the impact matrix. This step, as it soon became clear, would need more time and we decided to continue to work with the impact matrix with the help of video meetings. During two additional video meetings, the impact matrix was finally filled in by the core team and certain stakeholders.
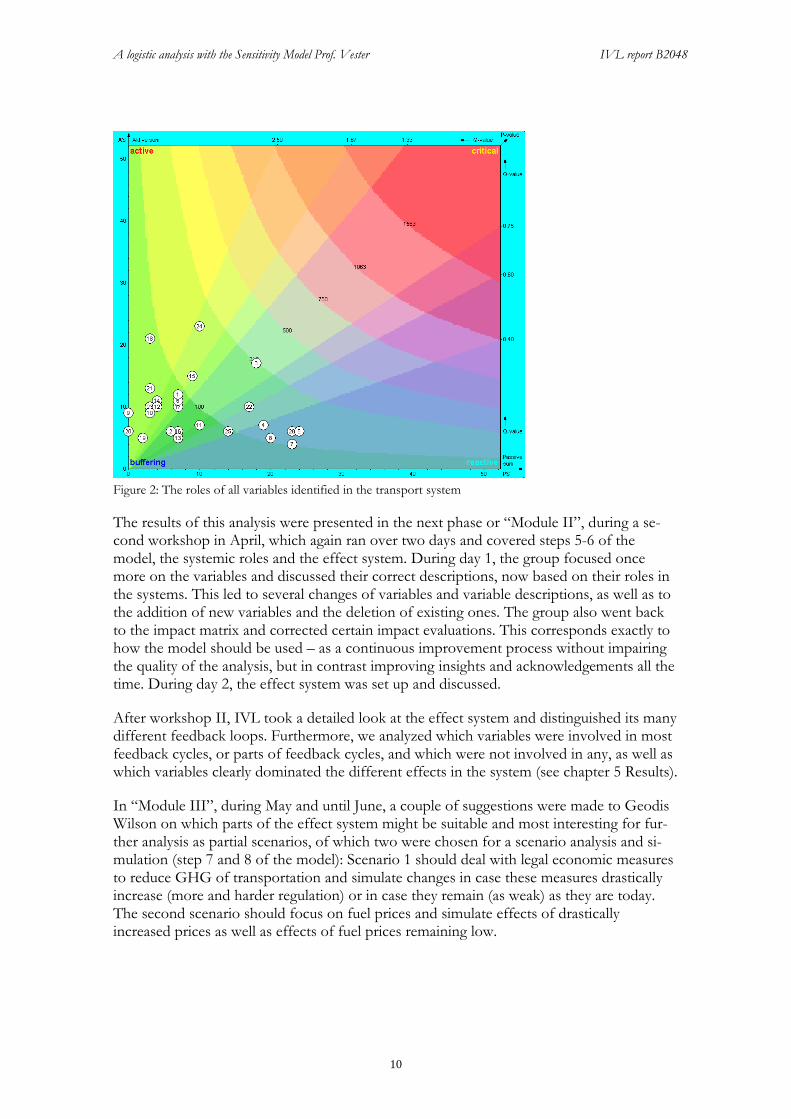
Afterwards, IVL carried out an analysis of the variables’ roles in the system, as they ap-peared after filling out the impact matrix (step 5 systemic roles). For this purpose, the va-lues of 0-3 in the impact matrix were summed up to so-called active and passive totals for each variable, giving information on how active or passive a variable behaves in the system, maybe even its neutrality, if passive and active values are similar. Furthermore, the model calculated the product of active and passive totals as well as their ratio for each variable. The concluding results give information on how far a variable plays a role in the system and how strongly it is involved in events. The resulting distribution of roles among all variables was given in form of a graphic (see figure 2 below), where each number repre-sents a variable. The model helps the user to understand the role of a specific variable by offering a description for all available positions or “boxes” in the graphic.
A logistic analysis with the Sensitivity Model Prof. Vester IVL report B2048
10
Figure 2: The roles of all variables identified in the transport system
The results of this analysis were presented in the next phase or “Module II”, during a se-cond workshop in April, which again ran over two days and covered steps 5-6 of the model, the systemic roles and the effect system. During day 1, the group focused once more on the variables and discussed their correct descriptions, now based on their roles in the systems. This led to several changes of variables and variable descriptions, as well as to the addition of new variables and the deletion of existing ones. The group also went back to the impact matrix and corrected certain impact evaluations. This corresponds exactly to how the model should be used – as a continuous improvement process without impairing the quality of the analysis, but in contrast improving insights and acknowledgements all the time. During day 2, the effect system was set up and discussed.
After workshop II, IVL took a detailed look at the effect system and distinguished its many different feedback loops. Furthermore, we analyzed which variables were involved in most feedback cycles, or parts of feedback cycles, and which were not involved in any, as well as which variables clearly dominated the different effects in the system (see chapter 5 Results).
In “Module III”, during May and until June, a couple of suggestions were made to Geodis Wilson on which parts of the effect system might be suitable and most interesting for fur-ther analysis as partial scenarios, of which two were chosen for a scenario analysis and si-mulation (step 7 and 8 of the model): Scenario 1 should deal with legal economic measures to reduce GHG of transportation and simulate changes in case these measures drastically increase (more and harder regulation) or in case they remain (as weak) as they are today. The second scenario should focus on fuel prices and simulate effects of drastically increased prices as well as effects of fuel prices remaining low.

A logistic analysis with the Sensitivity Model Prof. Vester IVL report B2048
11
At the same time, IVL suggested to Geodis Wilson to carry out a smaller analysis of their company and Geodis Wilson’s prerequisites to act successfully in a changing and uncertain business world, especially with regard to their impact on climate change and the environ-ment. During two meetings with Geodis Wilson’s management team, led by the Vice President, a new set of variables depicting the company as a system of its own, was esta-blished as well as the relation between these variables defined and evaluated. This corres-ponded roughly to steps 1-5 of the model, although with limitations due to budget and time constraints (this analysis was not planned to be carried out from the beginning). After the second meeting with the management team, IVL analyzed in depth all information generated and presented and discussed the results during a third meeting (see chapter 5 Results).
IVL also continued to work with the transport system and in “Module IV” presented a first scenario simulation during the third workshop in September to the core team and stakeholders. Particular focus lied on the establishment of functions describing the effect between two variables (e.g. if fuel prices increase, then transport costs are expected to in-crease as well). These functions were set up initially by IVL but needed discussion and further refinement in consultation with the workshop participants. The afternoon was dedicated to the second scenario and the establishment of all necessary functions in smaller groups. After workshop III, IVL further developed the functions of the second scenario, based on the views and knowledge of the participants and finished the respective simula-tions.
During the “concluding phase”, IVL carried out an evaluation of the total system based on the eight rules suggested by the model (final step 9). At a fourth and last concluding workshop (one day) in November, the results from all steps (impact matrix, systemic roles, effect system, scenario analysis and total evaluation) were presented in a condensed form, focusing on the most important details (see chapter 5, Results).
Additionally, throughout the whole project, IVL presented the work in progress at several meetings with Geodis Wilson’s environmental council.

A logistic analysis with the Sensitivity Model Prof. Vester IVL report B2048
12
5. Results Twenty-six variables were identified and described. For each variable, its current state as well as the optimal state and the worst possible state were indicated on a scale. The direct relationship between each pair of variables was described in the impact matrix. This led to the systemic role distribution (see figure 2 in chapter 4).
5.1 Systemic role distribution
Variables having the same role, according to the definition given by the model, (and despite what their slightly different positions in the graph might indicate) were put together in groups.
The first (and largest) group consisted of nine highly critical and active variables, which at the same time have a certain buffering capacity. These variables are active, meaning that they influence the system directly if they change. On the other side, they cannot be steered or changed by the other variables in the system, which makes it important to watch their development closely. This is especially true for legal economic measures to reduce GHG of transportation, as any new rules and regulations limiting the amount of for example CO2 emissions will affect Geodis Wilson’s core business and that of the other actors in the system.
The second group included all variables which are still active, though less than the ones in group 1. Only two variables were found in this group. Unfortunately, according to the role definition of the model, these variables are weak leavers and desired changes can only be realized with the help of other variables. For example, reduced transport emissions need to be obtained via new demands of the system actors or a higher energy efficiency of transports needs to be realized via product development.
A third group comprises even less active variables with a high buffering capacity. Even though these variables may be able to absorb certain, not too drastic changes over a period of time, changes might happen suddenly in the system once their thresholds are passed. Where on a scale these thresholds are positioned is not a question answered by the model. The model only indicates that these variables have thresholds, which need to be further investigated by the system actors in order to take well-informed decisions. It might be possible to find out more by simply considering the effects of a drastic change in the total amount of goods in the system or by increasing the distance between producers and terminals in a fictive way.
In group 4, slightly reactive variables were positioned. These are variables reacting only little if changes in the system occur and which themselves have no strong effect on other variables. However, they still have the (hidden) capacity to become important for the system, for example if costs and access to textile production capacity suddenly decrease significantly in one country and production therefore needs to be moved to other countries
A logistic analysis with the Sensitivity Model Prof. Vester IVL report B2048
13
or if final consumers decide to buy only clothes produced with ecologically grown cotton or clothes delivered to the market over the shortest possible transport distance.
Group 5 consisted of highly buffering variables. Buffering in this context means that these variables react to system changes but that they absorb them basically, however, of course only if such changes do not exceed certain limits. Lead times for example can be adapted to changes only within certain technical and geographical boundaries, and even though the environment has absorbed many changes in the system during the past years, current research suggests that this absorbing capacity is shrinking. Another important characteristic of variables in this group is that there is no use in keeping them stable at any cost unless they have an effect on active variables.
In group 6, there was only one variable. Group 6 variables are mainly buffering, without a clear action or reaction in case of changes. However, they may help to stabilize the system by way of self-regulation or they can be hidden activators because of their influence on critical variables. Seen from an environmental and climate perspective, air freight is the worst transport mode a producer can choose, as emissions per consignment are very high due to limited freight capacity and high speed over long flight distances, in contrast for example to sea freight. An increased amount of goods in the system might be balanced with a reduced share of air freight, and thus truly help to stabilize the system (within certain limits). However, it is doubtful that there is any automatic self-regulation connected to this process, as the decision to reduce air freight if the total amount of goods in the system increases will be influenced by many other factors than the environment, like time, lost sales, the concluding costs etc.
Group 7 contained highly reactive variables, which, even if they change, do not change the basic constellation of the system (see paragraph below on total system behavior). They are helpful though as indicators or sensors. One might also keep in mind that these variables should not be improved directly with the help of certain short-term measures. Of course, such measures might lead to improvements (often undone by sheer growth), but they do not change the problems of the total system and thus rather cure symptoms instead of leading to real improvements. If they are to be changed, this should happen indirectly via other active variables.
The system as a whole is rather buffering, inert and therefore (at least at first sight) stable. On the other hand, this also means that it is rather difficult for the actors within the system to change it, as the system is influenced to a large degree by external factors. Still, also changes in supposedly very stable systems can (and will) occur, sometimes totally unexpec-ted like the collapse of the nuclear power plant at Fukushima in Japan, sometimes with a certain foreboding like the societal revolutions in the Middle East and North Africa. Such changes evoked by natural catastrophes, people’s values, political power (re)distribution, etc. can definitely change the transport system in many ways as well, even though the probability of them occurring is perceived to be low, and thus they are not fully accounted for in decision-making today.
The systemic role analysis provides information on the position (and thus the function) of each variable in the system. This position is established in dependence of the position of

A logistic analysis with the Sensitivity Model Prof. Vester IVL report B2048
14
the other variables, which means that if one variable changes, this will have an effect (small or large) on all other variables.
What remains unknown is the direction of the effect of one variable on another if changes occur: Does a change of variable A lead to a decrease or increase, improvement or deterio-ration of variable B? In the next subchapter, results will be presented for the analysis of such effects between variables, also called effect system.
5.2 Effect system
All relations between variables which were evaluated in the impact matrix with 2 or 3 (on a scale from 0 to 3) were copied as “effects” into the effect system, followed by the defini-tion of the direction of all effects (increase, decrease, improvement, aggravation, etc.).
This step illustrates how much is happening in the system if variables change, sometimes directly, sometimes also with time delays. It is impossible for humans to be aware of all relations between all variables at the same time, and tools like the Sensitivity Model are thus needed. It is also rather difficult to find out how more than two variables are linked up by just looking at the graph. The Sensitivity Model does this analysis automatically and lists all feedback cycles, sorted by negative and positive feedback cycles, see figure 3 below.
Figure 3: List of positive and negative feed-back cycles in the transport system
All in all, the analysis shows 56 negative and 19 positive feedback cycles. Negative feedback cycles mean that a number of relations or effects between different variables keep a balance or regulate themselves, so that there will be no escalation of a development. They are the type of feedback cycles that every self-regulating system needs, and they should outnumber the positive feedback cycles, which is the case here. Positive feedback cycles, contrary to the word “positive”, mean relations or effects between variables which accelerate and can escalate a development until the collapse of the system. On the other hand, positive feed-back cycles are often needed in order to initiate a development, in this way they can be regarded as “drivers”.
A logistic analysis with the Sensitivity Model Prof. Vester IVL report B2048
15
The Sensitivity Model also gives information on which variables are involved in the feed-back cycles. Quite often, effects in the system do not impact all existing variables or just end or begin at a variable. In the transport system, only 11 variables out of 26 were in-volved in feedback cycles. The most important feedback cycles were analyzed in detail:
1. One short feedback cycle appearing in almost all negative and in half of the positive feedback cycles is the relation between legal economic measures to reduce GHG emissions from transport and the environmental state. The feedback cycle is defined as follows: If the environmental state deteriorates, this will lead to an increase in legal measures in order to improve the environmental states. If the environmental state has improved, the amount of legal measures can be reduced again. The feedback cycle between these two variables is almost a driver for the whole system and active already today, though lacking strength, as laws regulating GHG emissions from transport are still at a minimum level.
2. Legal economic measures to reduce GHG emissions from transport are also involved in a feedback cycle with fuel prices and transport costs. Legal measures might lead to higher fuel prices. This would directly entail increased transport costs. How much of these costs could be integrated into the transport price before freight customers start to react is unclear. However, increased costs combined with unchanged margins or no added value would eventually make it necessary to sell more transports or products in order to balance the costs but this would be opposed to reduced transport emissions and improved environmental state, which again might call for even harder legal measures – and so the feedback cycle continues.
3. The environmental state is basically impacted by transports emissions and these again by share of airfreight. Both transport emissions and share of airfreight can induce, if increased, a deterioration of the environmental state, leading to the developments indicated above.
4. Product development is part of several feedback cycles. A closer analysis shows that it through its different effects influences quite a lot in the system. It also contributes to rendering a company either less or more vulnerable, depending on the direction of the development, with regard to new legal economic measures and changed customer demands.
5. Another important part of several feedback cycles are environmental/CSR demands of the system actors. New demands of transport buyers can ignite product development and have often done so, but this also implies reactivity on the side of the transport supplier. However, new demands can be a driver in the system. Another critical point is the binding force of voluntary demands which the actors in the system might put on each other. In case these demands decrease profit possi-bilities, how long will actors be willing to keep them up? As is the danger with all industry-wide voluntary agreements, demands might be formulated so that they fit the weakest company and not the strongest, which does not really push a powerful overall development.

A logistic analysis with the Sensitivity Model Prof. Vester IVL report B2048
16
At this point in the project, a sound understanding of the system in question had been ac-quired. It became clear though that the transport analysis encompassed a rather general view of a transport flow from China to Sweden, which has the advantage that the insights gained in the process could be interesting for other industries using the same transport flow as well. The disadvantage was that Geodis Wilson did not get any information on how the company as such was prepared for possible changes. IVL therefore suggested a minor company-focused sensitivity analysis before the work with the scenario analyses would continue. To mirror the timely order of events, the next sub-chapter will present the results of this analysis.
5.3 Company analysis
At the second meeting with the management team at Geodis Wilson, a new system description was developed by all participants.
IVL then analyzed all relations and even feedback cycles and put together the results for the third meeting with the management team. In the meeting, a few more relations which had been overlooked the first time were added. Some variables and their impact on and meaning for the system are explained as follows:
o Changed lifestyles (in the surrounding society) This is an active variable in the system, meaning that it impacts the company considerably, though maybe more indirectly, subtly and with certain time delays. This factor cannot be impacted by the company, therefore it is important to monitor changes in lifestyles and lifestyle trends.
o Image of company and services The image of a company is clearly influenced by the values of the sur-rounding society, influencing the conditions under which the respective “li-cense to operate”2 is granted. Certain actions are sanctioned (sometimes un-der certain conditions), others are not. To which extent a company’s core activities are regarded as polluting or damaging for the climate, is of course important as well. A good image is important for the identification of employees with the company. Interestingly, it cannot be “constructed” on the basis of advertising campaigns, flashy websites and brochures, at least not if it is supposed to last and be truly authentic.
o Ability to innovate This variable is very active in the company, it influences many areas which are important for the core business. It is itself mostly influenced by education and information and a future-oriented management.
2 The social acceptance of an organisation and its right to continue its activities. "It is the community, often with the active encouragement of advocacy groups, which has emerged as the force that grants a company's license to operate." (Edward Burke at The Boston College Center for Corporate Community Relations), from: http://www.article13.com/csr/definitions-3.asp.

A logistic analysis with the Sensitivity Model Prof. Vester IVL report B2048
17
o Diversity of services and processes How diverse a company’s services and processes are can be decisive for its future. Diversity enables redundancy, but too diverse services might be difficult to produce at low costs and also difficult to sell. All in all, diversity is a variable that can, if used in a smart way, help the company to keep its balance.
o Production costs, solidity These two variables are very passive, which implies that they can only be influenced with the help of other, more active variables within the company.
o Sales Sales is the company’s “face” towards the customer. As it is so important, changes within sales need to be planned and realized carefully as well as anchored in what the company as a whole wants to achieve.
o Environmentally adapted processes This variable includes those processes which are aimed at reducing energy or other resource consumption in the services the company offers. They are specifically designed to not only fulfill their classical targets such as high efficiency, adaptability to other processes within the company etc., but also to bring down environmental and/ or climate “costs”.
o Quality of services The quality of services is a variable that is influenced by many other vari-ables in the system. It can be an interesting indicator for changes in the company. Quality in the same way as image needs to be developed “organi-cally”, meaning that quality cannot be pushed with single actions but evolves from the interaction of different factors.
o (New) demands leading to changed goods transport services New or changed demands, especially if they come up suddenly and unex-pectedly, can affect the service quality which might not be sufficient any more or which needs to be adapted quickly at high costs.
o Education and information The kind of education employees have and how well they are informed about what is happening in the company is a variable that is crucial for long-term survival. Moreover, this variable can be influenced from inside.
After having gained a good understanding of the systemic behavior of the transport flow, its variables and how they are related with each other, and after analyzing the possibilities of Geodis Wilson to answer to future challenges, the next step in the project was taken: Out of the 26 variables, a few were selected for two scenario analyses in order to better understand the internal and external influences on certain parts of the overall system and the possible consequences of changes in those variables.

A logistic analysis with the Sensitivity Model Prof. Vester IVL report B2048
18
5.4 Scenario analysis
After consulting with Geodis Wilson, two scenarios were selected for a more in-depth study: One scenario should deal with the question of what would happen if legal economic measures to reduce GHG emissions from transportation would be sharpened drastically. The other should look at the consequences of increased or decreased fuel prices.
5.4.1 Scenario 1 – legal measures
This scenario was built up to see the consequences of harsher economic measures on Ge-odis Wilson’s product development, on the CSR/ environmental demands of the system actors, on costs and profit possibilities as well as on emissions and thus on the environ-mental state.
The scenario variables (see figure 4 below) directly taken over from the 26 transport flow variables are:
− CSR/ environmental demands of system actors (Swedish: Miljökrav systemaktörer) − Geodis Wilson’s product development (Swedish: produktutveckling) − Legal economic measures to reduce GHG emissions from transportation (Swedish:
Ekonomiska styrmedel) − Costs of the transport provider (Swedish: Kostnader) − Profit possibilities (Swedish: Vinstmöjligheter)
‘Emissions from transports’ and ‘Environmental state’ were merged into one variable called ‘Emissions and environment’ (Swedish: Emissioner och Miljö). The new variable ‘Critical population’ (Swedish: Kritisk befolkning) includes the meaning of the old variable ‘Value-based consumption’ but is more comprehensive.
The initial states were defined for each variable in the scenarios, as for the 26 system varia-bles in the beginning (the color green implying “ok”, yellow “careful” and orange/red dif-ferent states of “dangerous”). Functions describing the effects of a change of for example the variable ‘Critical population’ on the variable ‘Economic measures’ were defined for all relations between all variables in the scenario.
After this preparatory work was done, a simulation run including 20 iterations was carried out. It was not further defined if one iteration correlates to more than a year, a year, a quarter of a year, one month or any other time measure. This definition would have been very difficult and, as many details in the functions, would be based to a large extent on assumptions and educated guesses.
After 20 iterations, the state of the variables had changed considerably and now looked like this:
A logistic analysis with the Sensitivity Model Prof. Vester IVL report B2048
19
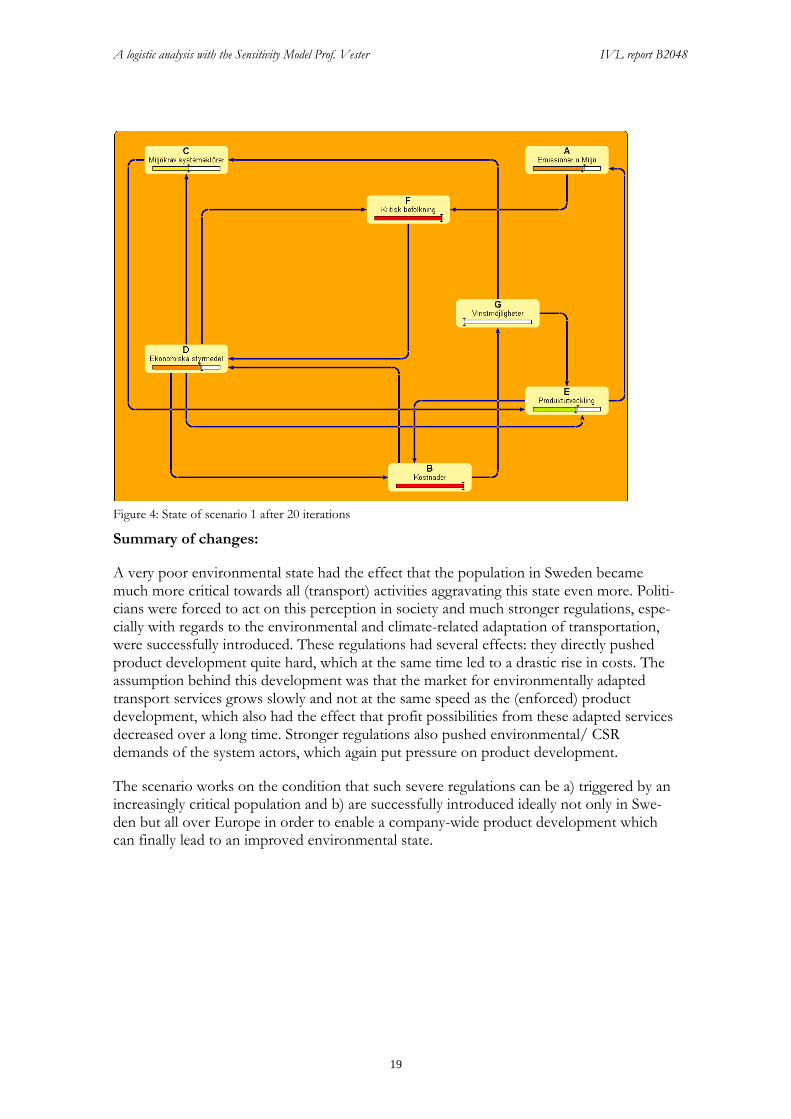
Figure 4: State of scenario 1 after 20 iterations
Summary of changes:
A very poor environmental state had the effect that the population in Sweden became much more critical towards all (transport) activities aggravating this state even more. Politi-cians were forced to act on this perception in society and much stronger regulations, espe-cially with regards to the environmental and climate-related adaptation of transportation, were successfully introduced. These regulations had several effects: they directly pushed product development quite hard, which at the same time led to a drastic rise in costs. The assumption behind this development was that the market for environmentally adapted transport services grows slowly and not at the same speed as the (enforced) product development, which also had the effect that profit possibilities from these adapted services decreased over a long time. Stronger regulations also pushed environmental/ CSR demands of the system actors, which again put pressure on product development.
The scenario works on the condition that such severe regulations can be a) triggered by an increasingly critical population and b) are successfully introduced ideally not only in Swe-den but all over Europe in order to enable a company-wide product development which can finally lead to an improved environmental state.
A logistic analysis with the Sensitivity Model Prof. Vester IVL report B2048
20
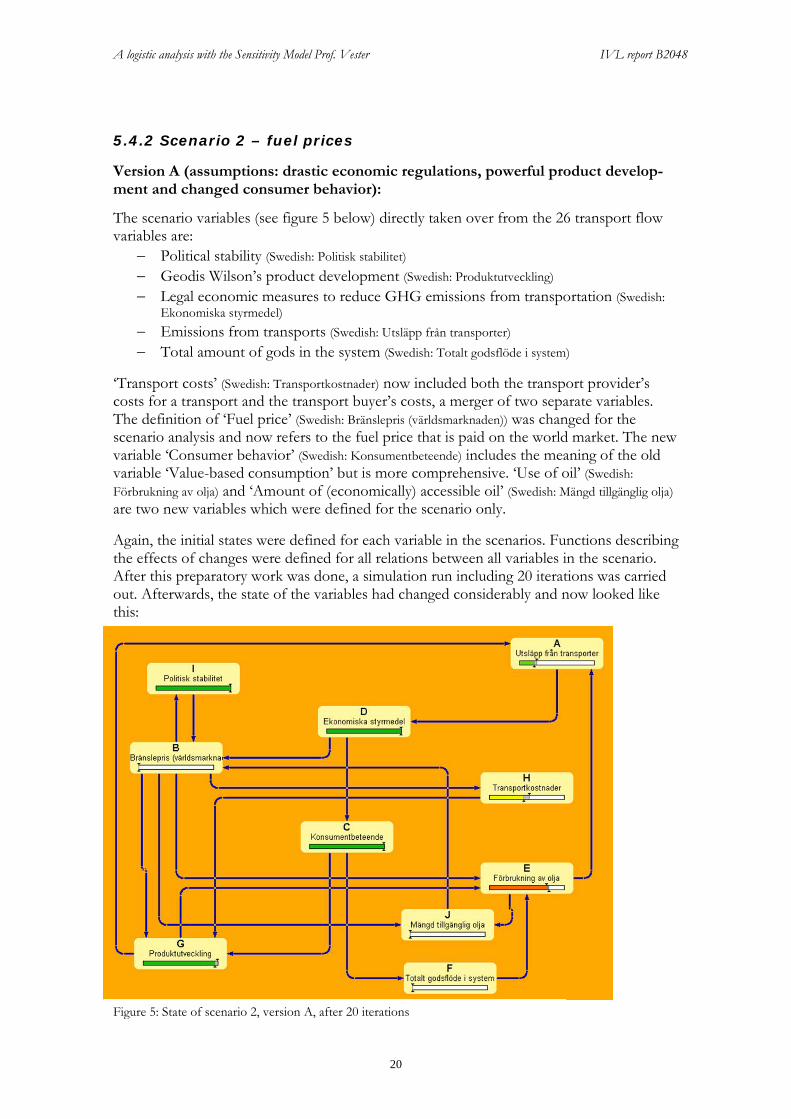
5.4.2 Scenario 2 – fuel prices
Version A (assumptions: drastic economic regulations, powerful product develop-ment and changed consumer behavior):
The scenario variables (see figure 5 below) directly taken over from the 26 transport flow variables are:
− Political stability (Swedish: Politisk stabilitet) − Geodis Wilson’s product development (Swedish: Produktutveckling) − Legal economic measures to reduce GHG emissions from transportation (Swedish:
Ekonomiska styrmedel) − Emissions from transports (Swedish: Utsläpp från transporter) − Total amount of gods in the system (Swedish: Totalt godsflöde i system)
‘Transport costs’ (Swedish: Transportkostnader) now included both the transport provider’s costs for a transport and the transport buyer’s costs, a merger of two separate variables. The definition of ‘Fuel price’ (Swedish: Bränslepris (världsmarknaden)) was changed for the scenario analysis and now refers to the fuel price that is paid on the world market. The new variable ‘Consumer behavior’ (Swedish: Konsumentbeteende) includes the meaning of the old variable ‘Value-based consumption’ but is more comprehensive. ‘Use of oil’ (Swedish: Förbrukning av olja) and ‘Amount of (economically) accessible oil’ (Swedish: Mängd tillgänglig olja) are two new variables which were defined for the scenario only.
Again, the initial states were defined for each variable in the scenarios. Functions describing the effects of changes were defined for all relations between all variables in the scenario. After this preparatory work was done, a simulation run including 20 iterations was carried out. Afterwards, the state of the variables had changed considerably and now looked like this:
Figure 5: State of scenario 2, version A, after 20 iterations

A logistic analysis with the Sensitivity Model Prof. Vester IVL report B2048
21
Summary of changes:
Due to many hard and globally harmonized economic measures, fuel prices on the world marked were kept very low. As a consequence, oil sources like tar sands remained unprofi-table, which reduced the overall amount of economically accessible oil worldwide and thus the use of oil. This could only work if several alternative fuels were introduced at the same time, to the extent needed and at competitive prices (due to economies of scale).
Other factors contributing to the decreased use of oil are product development (more effi-cient solutions, new propulsion technologies, etc.) and consumer behavior. The latter only had an effect if consumer behavior (in Sweden) changed dramatically, so that the total amount of goods in the system was reduced noticeably, for example by consumers buying much fewer conventional and instead more durable clothes, by buying much more second hand clothes, by swapping clothes instead of buying, etc. Only if fewer goods were handled in the system, this led to fewer transports using less oil. Consumer behavior was in the end the decisive means in this scenario to reduce emissions from transportation, supported by product development. It was presumed that product development alone would not have the same effect as all gains in efficiency would be eaten up by an increasing amount of goods in the system, if consumer behavior remained the same as today.
It was further assumed that low fuel prices helped to keep political stability, as the basis for resource struggles was taken away, namely economic benefits. As another consequence of low fuel prices, transport costs decreased continuously, after a first peak due to harsh re-gulations, enforcing a powerful product development which needed time before it paid for itself.
Open questions to Geodis Wilson in case the development as laid out in the scenario should come true:
− Rather harsh regulations changing the core business considerably, which can lead to increased costs – how can Geodis Wilson prepare for this?
− If transport services need to be adapted, what are the options for a service provider like Geodis Wilson? The company does not own any vessels, airplanes or vehicles but is mainly a broker between different parties.
− If alternative fuels and new propulsion technologies are introduced on a large scale, this might also have an effect on costs, at least during a transitional period – how can those costs be handled by Geodis Wilson?
− What can be done by the company and by the industry to steer political developments?
− What is the value of strategic partnerships with customers that go beyond the business relationships of today? Which customers are best suited for such partnerships and according to which criteria?
A logistic analysis with the Sensitivity Model Prof. Vester IVL report B2048
22
Open questions for a clothing company:
− If consumption of clothes in Sweden really decreases, how can producers of clothes react on this trend?
− If higher transporter costs and increasing production costs in China make production and distribution in and from China unprofitable, should production be moved?
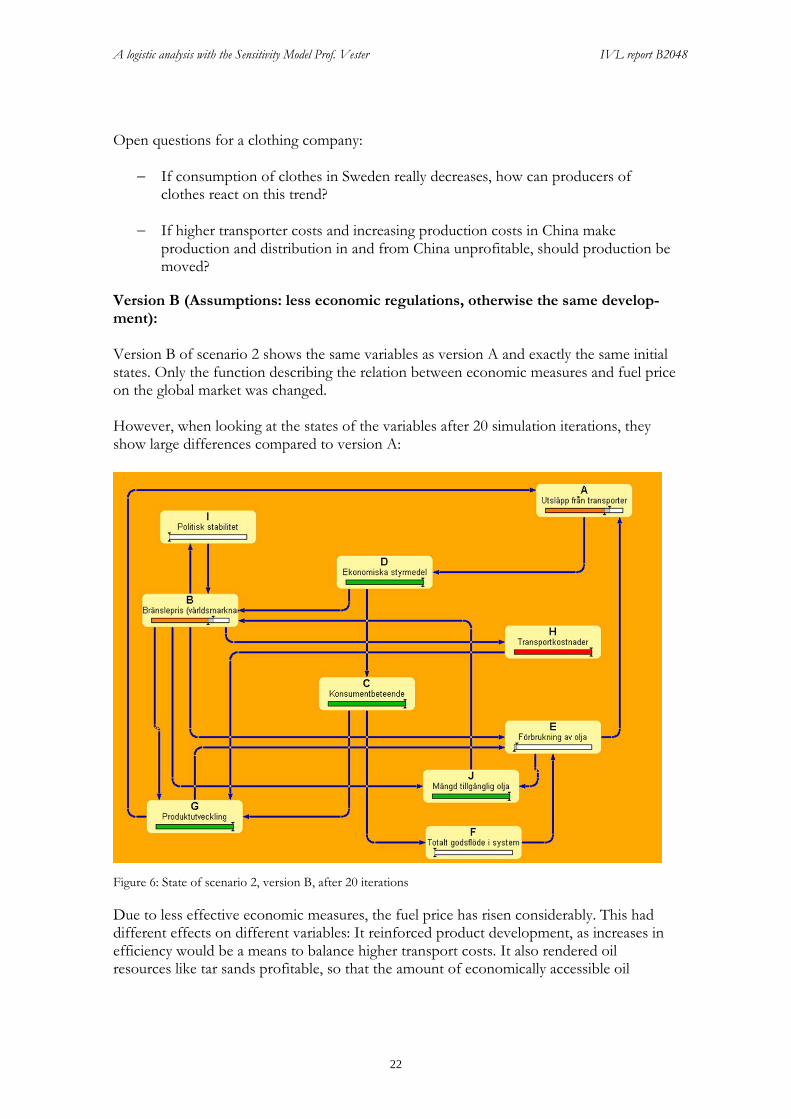
Version B (Assumptions: less economic regulations, otherwise the same develop-ment): Version B of scenario 2 shows the same variables as version A and exactly the same initial states. Only the function describing the relation between economic measures and fuel price on the global market was changed. However, when looking at the states of the variables after 20 simulation iterations, they show large differences compared to version A:
Figure 6: State of scenario 2, version B, after 20 iterations
Due to less effective economic measures, the fuel price has risen considerably. This had different effects on different variables: It reinforced product development, as increases in efficiency would be a means to balance higher transport costs. It also rendered oil resources like tar sands profitable, so that the amount of economically accessible oil

A logistic analysis with the Sensitivity Model Prof. Vester IVL report B2048
23
increased after a transitional period. Still, it took a long time before fuel prices started to go down from an earlier peak, due to the transitional period in which access to cheap oil was limited. Even a powerful product development could not fully absorb these rising costs, which are still very high after 20 rounds.
The only variable finally leading to a reduced use of oil in transportation and thus a more rapid decrease of emissions rather late in the simulation process is again consumer beha-vior. This variable is strengthened by product development, but product development alone could not have the same effect.
Political stability was supposed to decrease with rising fuel prices, showing an alarming state at the end of the simulation.
Additionally, version B was based on the assumption that alternative fuels would not be developed to the same extent as in version A.
To summarize the above, a rather “vicious circle” in the two developments can be identi-fied:
As long as the consumption of clothes does not decline, the total amount of goods in the system will increase. This implies that more needs to be transported, leading to increased use of oil and increased environmental and climate impact. If the use of oil increases, so decreases the amount of economically accessible oil (seen from today’s perspective). This again will push fuel prices up, if not political economic measures become effective and prevent this development. High fuel prices make production of fuel from source like tar sands profitable, entailing an even harder impact on the environment and climate. This will also lead to increasing transport costs, which can be balanced by an adequate product development, but supposedly only until a certain limit. How realistic each scenario is was not evaluated. It is probably doubtful if a global and harmonized effort to keep fuel prices low can be realized. Product development to the extent needed might also be unrealistic, especially in view of the fact that 2010 showed an all-time high record of emissions from fossil sources.
5.5 Total system evaluation
Fredrik Vester based the Sensitivity Model on the science of biocybernetics (see also chap-ter 3). The term “cybernetics” stems from the Greek word “kybernetes”, meaning pilot or steersman. The steersman is regarded as a part of the system, not as a separate entity. His role is to give impulses so that the system can regulate itself. He helps to keep the system in balance by keeping up flexibility and he uses already existing energy and strengths of the system to reinforce it. The starting point of biocybernetics as a science is everything alive, mainly nature and human beings. Processes that serve as examples from nature are e.g. the control of cells, the regulation of enzymes and hormones, the photosynthesis etc. The definition of biocybernetics is the identification, control and self-regulation of interrelated processes with minimal energy use.

A logistic analysis with the Sensitivity Model Prof. Vester IVL report B2048
24
Based on bio-cybernetics research, eight basic rules have been defined by Fredrik Vester, describing how a system should function in order to be long-term sustainable:
1. Self-regulation: The number of negative feedback cycles must outnumber the positive feedback cycles. Positive drivers are needed though, as they can trigger changes. With a larger number of negative feedbacks and some positive drivers, the system is supposed to regulate itself. However, in the case of this transport system, even though the negative feedbacks clearly outnumber the positive feedbacks, this is only a seem-ingly self-regulating system: The deterioration of the environmental state for example does not automatically lead to a regulation of emissions via legal economic measures. Even if there might be a correlation between the environmental state and legal regula-tion, the process is aggravated by time delays and often a lack of harmonization within different countries, let alone a global harmonization. With regard to positive drivers or “motors”, some were identified in the transport sys-tem. Increased profit possibilities make it easier to introduce even more or harder environmental/ CSR demands, thus pushing product development even further etc. The critical aspect here is that environmental/ CSR demands of the system actors are basically understood as voluntary demands (if not, they would be regarded as regulations or laws). Voluntary demands are often based on the weakest actors in the industry and not on the strongest, and thus they hardly set new standards. Moreover, as soon as economic cycles change or a crisis of another type impacts the industry, they are soon reduced, not followed up any longer or even taken back completely. The power of such a “motor”, especially during a longer period of time like 5 to 10 years, is questionable.
2. Independence of growth: In order to follow this rule, the system's function must be independent of quantitative growth. First of all, it needs to be clear what this system’s function really is. Is the main func-tion to produce clothes in China and to transport them to Sweden in order to be sold there? That would not be the system’s function but its process. Is the function instead to provide consumers with a certain fashion experience? Or is the function to provide a certain target group with reasonably-priced clothes? The true function of the system needs to be clear before the second aspect of the rule can be analyzed, the system’s in-dependence of quantitative growth. Functions are often hidden behind obvious pro-cesses and are thus easily confused with them. However, it is worth trying to find out what the true function of any system is, otherwise it is impossible to evaluate if the function could be realized in a different manner (with less energy or raw material use, with a different sourcing, etc.) than done today. Quantitative growth is an aspect that has not been questioned by the system actors un-til now. All actors involved openly follow a strategy of quantitative growth: More shops are to be opened in new countries with the aim to sell more clothes, not different clothes or fewer clothes.
A logistic analysis with the Sensitivity Model Prof. Vester IVL report B2048
25
As margins in the transport industry are small, and as most transport services offered by larger service providers are replaceable, so far the only way to increase profits has been to sell more transport services, also this a strategy of quantitative growth. To be able to sell fewer transport services in the future or much more strictly environmentally adapted services, margins per service would need to be increased, which would make transport service more expensive. It is questionable if this would be accepted by today’s transport customers, especially if only selected providers and not the whole industry followed this path.
3. Orientation on functions: The system must be focused on a function, not on a prod-uct. If the system’s function is to provide a product like for example a car or a camera, the system is completely dependent on selling high enough numbers of this product. As soon as sales decrease, maybe because competitors offer the same product at a better price or an improved product of the same type, those systems are endangered. Pro-ducts are rapidly outdated, and new versions with increased product features need to be developed all the time. Globalization and the rise of production and product compe-tence at low costs for example in China and India have accelerated development cycles even more. The system and its product are completely and impartibly interlinked – if the product ceases to exist, so does the system providing it. Systems providing a function are on the other hand regarded as more flexible and via-ble. Instead of providing a car, an automotive company could for example redefine its main function as being a provider of mobility. Mobility can take many different forms, depending on several factors like age, travel destination, location, budget etc. By providing mobility for different target groups and in different ways, the dependence on one product becomes obsolete. Instead, the different ways of mobility could be developed along with new trends in society, new energy resources, increased or decreased budgets etc. The desire for mobility will most likely not decline or become non-existent, as it is a natural part of human beings and not a desire artificially planted by marketing campaigns. With regard to the system analyzed here, we have a mix of product and service focus. KappAhl clearly focuses on a product group, clothes for different target groups. As such, it competes with several other large Swedish or even European providers of clothes, and is exposed to all changes and cyclical developments of the clothing industry. The providers of transport services are probably a bit more flexible, as their services can be bought by almost all transport customers in Europe and worldwide, but in this lies also the biggest challenge: To develop and advertise unique selling points, differentiating the company from its competitors. Still, the orientation on a function seems to be more natural for the transport provider than for the clothing company.
4. Jiu-jitsu principle: The existing capacity of a system will be utilized according to the principle of jiu-jitsu. Jiu-jitsu is a Japanese martial art and a method of close combat for defeating an armed

A logistic analysis with the Sensitivity Model Prof. Vester IVL report B2048
26
and armored opponent in which one uses no weapon, or only a short weapon. "Jū" can be translated to mean "gentle, supple, flexible, pliable, or yielding." "Jutsu" can be translated to mean "art" or "technique" and represents manipulating the opponent's force against himself rather than confronting it with one's own force (www.wikipedia.com). In contrast to jiu-jitsu, boxing is a sport where both opponents use their own forces to confront each other. What is meant by “jiu-jitsu” in the context of this system is that companies are a part of society, and as such they are affected by changes taking place on different levels of this society (political, value-related, consumption-related, etc.). Such changes currently in-clude among others the overall effort to reduce energy use and decrease environmental and climate impact, increasingly critical and well-informed consumers, an increase in transparency (and, together with it, a higher demand for transparency) evoked by espe-cially the spread of internet access and new social media. Furthermore, a growing inse-curity with regard to future developments concerning for example energy sources, but also the loss of trust in formerly brazen institutions like banks and insurances, and this not on a local but on a global scale. These developments and trends impact society, companies and people on many diffe-rent levels, some very subtle and indirect, some very direct and harsh. They can be re-garded by companies as threats to an established position in the market or they can be regarded as a chance to develop new products, services or even business models. De-pending on their general attitude, companies either show a tendency to conserve the existing status-quo with different means according to the “boxing principle” by fighting against developments. Or they show a tendency to incorporate such developments into their business idea and use their positive power to gain a larger market share or increase profit possibilities, according to the “jiu-jitsu principle” by manipulating existing forces for their own good. Exactly how the jiu-jitsu principle could be used and realized by the system actors in the system at hand has not been discussed in detail in the project. From what could be seen, the two main system actors involved still seem to follow a strategy of keeping the status-quo, though with modifications as a tribute to some of the developments and trends mentioned above. KappAhl for example tries to reduce the environmental and climate impact related to different product life-cycle stages as much as possible. With regard to transportation, it tries to avoid transports by air and instead ships most of the products to Europe. Geodis Wilson also works with the possibilities at hand to decrease environmental and climate impact (for example by using ships which are registered in the “Clean Shipping” database, by a follow-up on environmental policies and guidelines etc.) . If this means that the rule is sufficiently applied is doubtful.
5. Multiple use: Products, functions and organizational structures will be used many times. This is at first sight the rule that is applied best in the system, especially when looking
A logistic analysis with the Sensitivity Model Prof. Vester IVL report B2048
27
at the transport provider. The services offered in this transport flow, the organizational structure behind them and the respective infrastructure in China as well as in Europe are used by many different customers and by several industries (clothing, electronics, other consumer goods). It could be interesting to analyze how this multiple use could be intensified even further with the help of service modifications. It might also be in-teresting to see if business relations with new industries or target groups could be es-tablished that use the same flow. One key problem of multiple-use that was brought up during a workshop was the low use of transportation capacity from Europe back to China.
6. Recycling: Sustainable use is made of all material and energy flows as well as of waste, and abundance is recovered. The guiding question here is where in the system the use of material (raw material or other kinds) can be minimized and where material can be used several times, maybe even in a different function, for example for heating or as a fuel. The aspect of recyc-ling focuses above all on material that comes into the system from outside, in this case basically raw material like cotton or other fibers. KappAhl currently looks at possibili-ties to use recycled clothes and at alternatives for cotton which might be easier to grow and less water-intensive during the production process. As of today, however, the decision on the recycling of clothes mainly has been handed over to consumers who either decide – or not – to buy, sell or exchange clothes “second hand”. The investi-gated system, as described here, is thus a system that is not based on the criteria of recycling. The transport provider mainly uses fossil fuels as some kind of “raw material”, and this fuel is burned during the transport process. The resulting greenhouse gases are not re-cycled, as for example sometimes during the transport of frozen foods, where green-house gases from combustion, depending on the technology, can be re-used for the operation of cooling elements. A closer look would be necessary in order to find out if other materials and/ or waste are produced in the system which could be used somewhere else.
7. Symbiosis: Unlike organisms live together and make mutual use of the same sphere of life. In case of the transport provider, it appears that transport services already have a sym-biotic co-existence with completely different industries like electronics, consumer goods, food, clothes etc. Where ever something is produced, it needs to be transported to the respective market where it can be sold. This appears to be a very sound co-exis-tence, but it is one that also harms the natural environment and the climate, slowly but surely contributing to the destruction of the habitat that enables trade and welfare in the first place. There is no doubt about the fact that transports are needed in order to keep (global and local) economies going. The question thus should be how this sym-biotic relation could be adapted. This might be possible by combining or coupling the knowledge from the transport industry with urban planning to a much larger extent

A logistic analysis with the Sensitivity Model Prof. Vester IVL report B2048
28
than done today. Or by coupling it with the development of infrastructure and energy solutions and by stopping to handle all these fields as separate, independent entities. Another approach to adapt and change existing symbiotic relations towards the better could be to link the interfaces of transport services and other industries at an earlier stage and at more levels than done today. This could mean for example that transport providers plan supply chains together with their customers from the very beginning (and thus much more efficiently) instead of being chosen once the production network already is established. A strategic choice of customers with a clear environmental strat-egy, maybe even with a product marketed specifically as environmentally adapted could be another way to strengthen and improve a symbiotic business for the transport pro-vider. With regard to the clothing company, such a symbiotic relation could be a close cooperation with the producers of washing machines and washing powder. Washing instructions can be found on KappAhl’s website, but it might be possible to go further. Recycling plants and companies using waste from clothes in other processes could also be future “symbiotic” business partners. Even consumers might become part of a symbiosis in some way, if the second-hand system is professionally supported by KappAhl. Respective research projects could be initiated by the industry and are partially already ongoing, as the example of “Mistra Future Fashion” in Sweden shows (http://www.mistra.org/mistraenglish/research/ongoingresearch/mistrafuturefashion.4.7048858132494e1c9a8000364.html).
8. Biological design: Products, services, methods and organization forms should be designed so that they neither harm nature’s structures and functions nor people’s health. Even though technical improvements have been introduced in trucks, trains, ships and airplanes, which have led to sometimes substantial reductions of certain emissions and other environmental damages, a vast amount of transports is still carried out by vehicles and vessels which do not fulfill the latest exhaust emission standards. Furthermore, the majority of all transports worldwide are dependent on fossil fuels, which means that greenhouse gas emissions are still emitted on a very large scale. All relative improvements (emission reductions) are outnumbered by the sheer growth of transport services. This means that the current transport system basically harms nature and people’s health: Air quality especially in large cities declines, the climate is affected by greenhouse gases, biodiversity and natural habitats are destroyed by transport infra-structure, traffic noise causes health problems and the respective socio-economic costs increase etc. It appears rather clear that, apart from their obvious economic and social benefits, transport systems do not consider natural and health aspects to the extent demanded by this rule. The transport system analyzed here is no exception.
Having considered the above-mentioned aspects regarding all rules and entering a con-cluding evaluation into the model, the following estimation of the total system (Figure X below) was suggested by IVL and accepted by the core team participants:
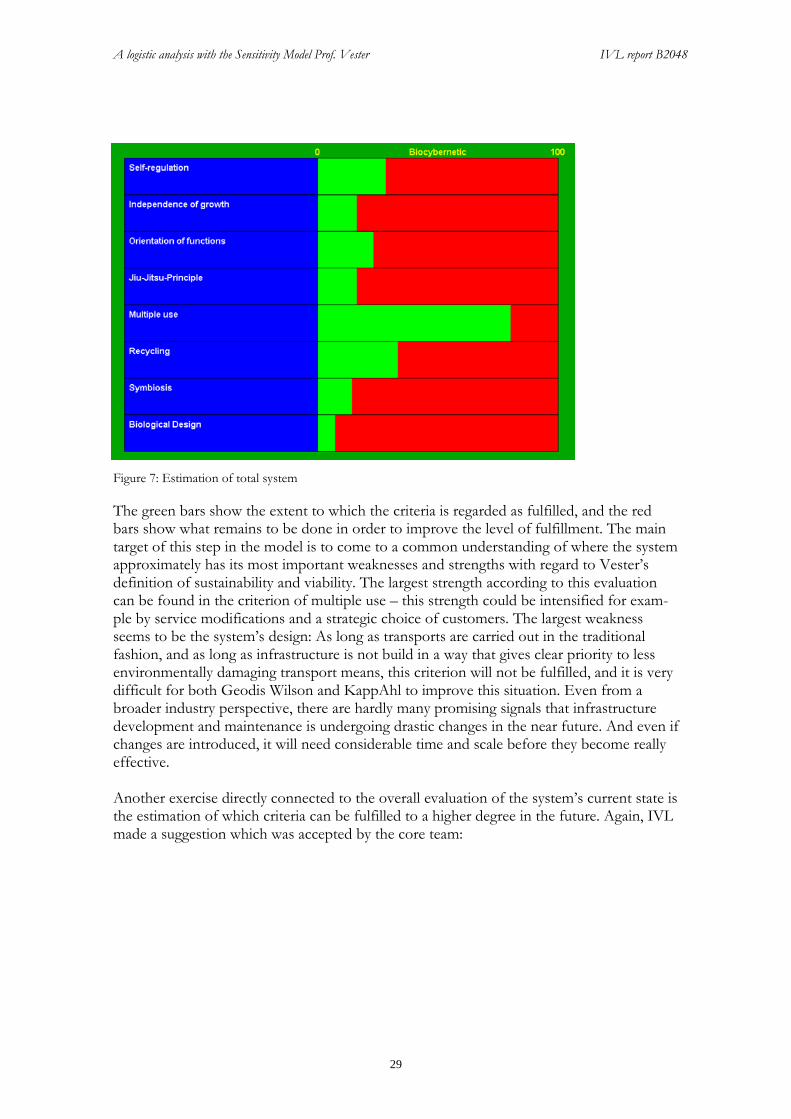
A logistic analysis with the Sensitivity Model Prof. Vester IVL report B2048
29
Figure 7: Estimation of total system
The green bars show the extent to which the criteria is regarded as fulfilled, and the red bars show what remains to be done in order to improve the level of fulfillment. The main target of this step in the model is to come to a common understanding of where the system approximately has its most important weaknesses and strengths with regard to Vester’s definition of sustainability and viability. The largest strength according to this evaluation can be found in the criterion of multiple use – this strength could be intensified for exam-ple by service modifications and a strategic choice of customers. The largest weakness seems to be the system’s design: As long as transports are carried out in the traditional fashion, and as long as infrastructure is not build in a way that gives clear priority to less environmentally damaging transport means, this criterion will not be fulfilled, and it is very difficult for both Geodis Wilson and KappAhl to improve this situation. Even from a broader industry perspective, there are hardly many promising signals that infrastructure development and maintenance is undergoing drastic changes in the near future. And even if changes are introduced, it will need considerable time and scale before they become really effective. Another exercise directly connected to the overall evaluation of the system’s current state is the estimation of which criteria can be fulfilled to a higher degree in the future. Again, IVL made a suggestion which was accepted by the core team:
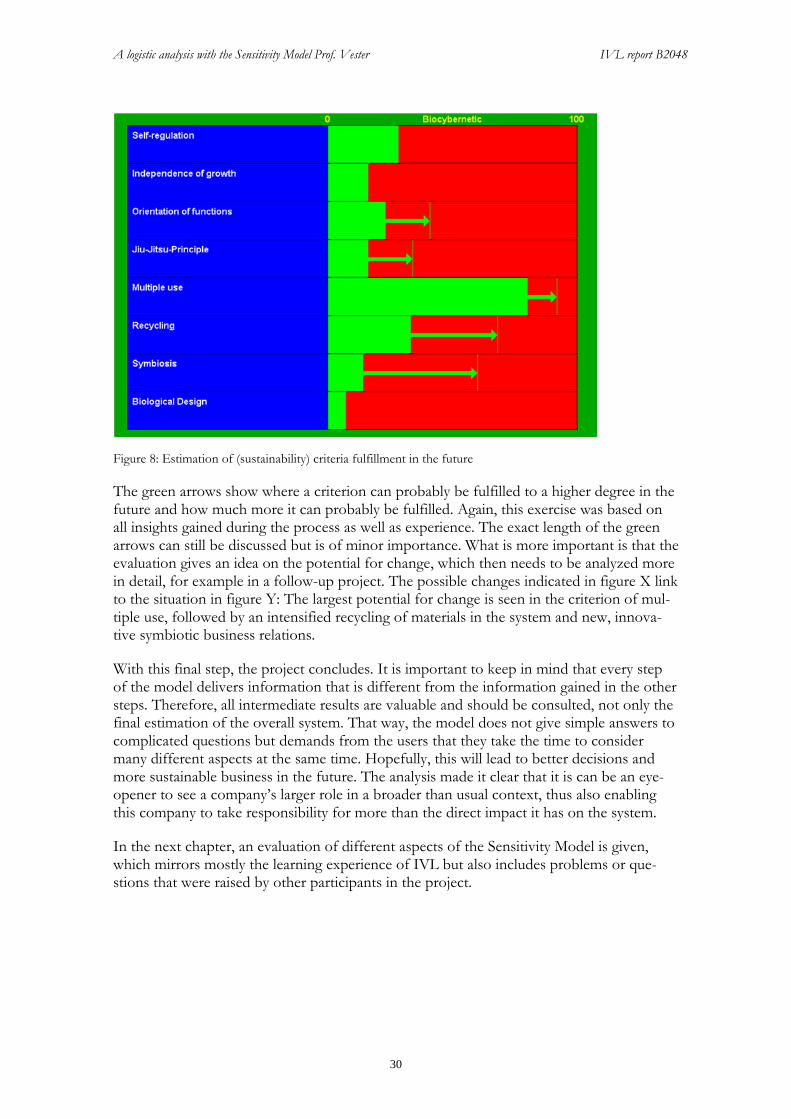
A logistic analysis with the Sensitivity Model Prof. Vester IVL report B2048
30
Figure 8: Estimation of (sustainability) criteria fulfillment in the future
The green arrows show where a criterion can probably be fulfilled to a higher degree in the future and how much more it can probably be fulfilled. Again, this exercise was based on all insights gained during the process as well as experience. The exact length of the green arrows can still be discussed but is of minor importance. What is more important is that the evaluation gives an idea on the potential for change, which then needs to be analyzed more in detail, for example in a follow-up project. The possible changes indicated in figure X link to the situation in figure Y: The largest potential for change is seen in the criterion of mul-tiple use, followed by an intensified recycling of materials in the system and new, innova-tive symbiotic business relations.
With this final step, the project concludes. It is important to keep in mind that every step of the model delivers information that is different from the information gained in the other steps. Therefore, all intermediate results are valuable and should be consulted, not only the final estimation of the overall system. That way, the model does not give simple answers to complicated questions but demands from the users that they take the time to consider many different aspects at the same time. Hopefully, this will lead to better decisions and more sustainable business in the future. The analysis made it clear that it is can be an eye-opener to see a company’s larger role in a broader than usual context, thus also enabling this company to take responsibility for more than the direct impact it has on the system.
In the next chapter, an evaluation of different aspects of the Sensitivity Model is given, which mirrors mostly the learning experience of IVL but also includes problems or que-stions that were raised by other participants in the project.

A logistic analysis with the Sensitivity Model Prof. Vester IVL report B2048
31
6. Evaluation of the process and software of the Sensitivity Model
In general terms, IVL found the Sensitivity Model to be a powerful tool for the gathering of knowledge from different parts of a system. It provides individual actors with the op-portunity to get a bigger picture and see their role in it. It also enables decisions that are based on a deeper understanding of the total system and not only of parts of it.
In the case of this analysis, it might be stated that several of the participants probably had a good overview on and a gut feeling for how parts of the system function. The important addition of the project using the model is thus the helicopter view and the fact that the system description including variables and impacts were established jointly, deepening in-sights and confirming gut feelings or subjective experience on how the system as a whole looks like and behaves. This knowledge can be shared with others using the images and links that had been developed.
With regards to a more detailed evaluation, the following aspects have been identified as potentially difficult or challenging for the work with the model in general:
− The steps within the model can be carried out with large stakeholder input or in the so-called “expert modus”, where just a few experts gather. It is important to be aware of the approach chosen for each project, as it has implications for the results – a broadly rooted acceptance in the case of many different stakeholders participating or a consen-sus among a limited number of participants. The approach of course also depends on the goal of the project and on the willingness of other actors to dedicate a considerable amount of time to such a project, as also the next point mentions.
− The method and the process of the Sensitivity Model demand a strong engagement of all project participants as well as quite some time that everybody needs to dedicate. This needs to be conveyed clearly from the beginning and can become an obstacle if the project is constructed around a question of weak interest to some important stakehol-ders or of interest to only one participant. The best precondition is if all participants feel that they share an important problem and want to solve it. In the case here, there was no concrete problem that the project should help to solve. The task was formulated in rather general terms and thus “fuzzy”, which might have made working with the model more difficult. A guiding question or “theme” could have helped to keep the different analyses more stringent.
− The model and its benefits are not easily explained. There are several reasons for this, one for example being the fact that the model does not deal with “hard” data collection in the first place but is built to a large extent on “soft” personal experience, expertise and feelings and that it allows and even demands a degree of imprecision that feels deeply uncomfortable compared to extrapolations, database analyses, etc. Especially by natural scientists, the model is often experienced as fuzzy and unreliable, which might

A logistic analysis with the Sensitivity Model Prof. Vester IVL report B2048
32
have more to do with the prevailing concepts of good (scientific) learning, solid fact-gathering and trust in a certain type of information than with the model itself. Still, the model and any acceptance of it are deeply impacted by these concepts. It is therefore, amongst others, important to explain Vester’s concept of “fuzzy” clearly in the very be-ginning and to make sure that the participants are aware of the fact that being “fuzzy” is acceptable and even desired in the model.
The following evaluations and aspects relate to the individual steps within the model:
− The system description in step 1 may seem trivial at first, and it is tempting to dedicate very little time to it, as participants probably think that they “know what they are talking about”. This project made it quite clear though that the more work is laid down in this step, the easier it will be later to define the right variables and to stay within the defined system boundaries. A clear picture on the system that is gathered together helps im-mensely in later discussions, and in case of disagreements, the group can always go back to the description as a guiding theme. Looking back at the start of this project, it maybe would have been better to describe the transport industry as a superordinate system and then to describe the transport flow from China to Europe including Geodis Wilson’s services as a minor and subordinate system3. What was done instead was a description of a business relation between Geodis Wilson and a customer, expressed in the form of a certain transport. This approach is not totally false, but it may have made interpretations and attributions of effects and re-lations more difficult than necessary. The definition of the system would also have been significantly easier if clear goal of the project, and a concrete problem to solve, had been identified first.
− Enough time needs to be made for the development of the variables. They are the sys-tem’s backbone and cannot be formulated and described carefully enough. Experience show that participants go back to the description of variables throughout the whole project, as the overall name of a variable is often rather broad and could be interpreted in different ways. Therefore, the explanations and descriptions need to be “watertight”, so that (later) interpretations can be avoided. The difficulty in the present project was sometimes that even until late in the process, participants understood variables (despite their description) differently. They also said that they had difficulties remembering the original meaning of variables that they supposedly had at a specific time. All changes of variables (adding new variables, changing titles and descriptions of exis-ting variables, deleting variables) which are carried out during the project need to be documented in a clear way, otherwise participants become confused or even irritated because they think that they work was ignored and thus a waste of time. It also allows all participants to trace the project’s line of thinking and enhances transparency, something the model explicitly pursues.
3 A similar approach was taken by Fredrik Vester in his study on Ford.
A logistic analysis with the Sensitivity Model Prof. Vester IVL report B2048
33
− The criteria matrix can easily be done by one or two persons instead of the whole wor-king group. This step is essentially only a check-up of the completeness of the variable list and thus does not contribute to any deeper insight into the system itself. The criteria included in the matrix are, however, quite theoretical and difficult to grasp if one does not have previous experience with the model.
− When filling out the impact matrix, a challenge is to remind the participants to always distinguish between direct and indirect effects, as the model requests. It is difficult to bring people to focus only on one line of thought and to not think around the corner, and work with the impact matrix therefore needs special preparation. Another aspect that needs to be considered when working with the impact matrix is the time needed to come to a consensus. Depending of course on the working group size, two full days can easily be spent on this step, one day during which smaller groups fill in their own matrix, and the second day to agree on the consensus matrix for the whole group. The time needed also has to do with the fact that the amount of cells which need to be filled in the impact matrix is proportional to the amount of variables squared. In our case, this lead to 650 cells which needed to be filled. Simply reducing the amount of variables in order to reduce the number of cells in the impact matrix cannot be recom-mended though, as a reduced number of variables would probably miss out important parts of the system. A rough rule of thumb is to not have more than 40 variables and not less than 20 in order to be able to describe a complex system sufficiently, and to prepare participants thoroughly so that they can do this task as efficiently as possible.
− As to the scenario development, it is important to not only provide the direct results of a simulation but also to analyze its respective implications for business, today and maybe even in the future. That step demands some interpretation of the scenario but is of likewise interest for the participants. An aspect that was difficult to grasp for the project participants was the fact that it could not be defined what an iteration or round meant with regard to a specific span of time. There is a risk that due to that gap, participants simply misconceive that an iteration or round is equivalent with one year, for example.
The following aspects relate to the technical condition of the model’s software
− In case there are not sufficient licenses of the model available, Excel files need to be prepared for certain steps of the model, like the impact matrix. Otherwise, it is not pos-sible to work in smaller groups, as is recommended by Vester. Excel has the advantage that it allows to weigh evaluations and to thus prioritize during the work with the con-sensus matrix – a feature which might be useful to integrate into the model directly.
− A large disadvantage is that results noted in the model cannot be exported into common applications such as Excel or Word nor is it possible to export text or tables from Excel or Word into the model. This would make work with the model much easier, especially if participants are involved who do not have access to the license.
All in all, the Sensitivity Model is easy to use in technical terms, but quite challenging be-cause it forces users to think in a systemic and therefore often new way compared to be-

A logistic analysis with the Sensitivity Model Prof. Vester IVL report B2048
34
fore. Especially the first steps, the system description, identification and description of the variables and the set-up of the criteria matrix, need time and participation by the right ac-tors to really give good results. The tool provides no ready-made solutions but supports the process of finding new solutions to complex problems. It does not replace the need to think, but helps to collect, store and prepare data and information in a very structured way, which can ultimately lead to new insights and changed processes and behavior as well as to better management decisions.
The next and final chapter of the report takes up the different findings mentioned in the chapters before and, based on those findings, gives some recommendations to both Geodis Wilson and KappAhl with regard to possible next actions.

A logistic analysis with the Sensitivity Model Prof. Vester IVL report B2048
35
8. Recommendations Recommendations and questions leading to new insights are already taken up during the whole chapter 5 of the report, but some findings deserve to be summarized once more at the end, beginning with advice directed at Geodis Wilson:
It is important for Geodis Wilson to actively acknowledge that the company is part of the society around it and thus is affected by changes in this society, even though these effects may take time or happen indirectly. A lot of information on trends and developments can be gained by listening to representatives of this society (evaluation of newspaper clips, contact with NGO’s, engagement in local activities, etc.). It is likewise important to be an active part of political decisions with regard to the company’s core business, but also with regard to political decisions effecting neighboring fields like infrastructure and energy. There are different decisions taken on different political levels (local, national, interna-tional), but if possible, Geodis Wilson should follow them all.
A decisive cornerstone in the future is the service development. The market for environ-mentally adapted services is small today. At the same time, many statements are issued by experts, interest groups, media and politicians claiming that a drastic reduction of transport emissions is needed to reach the 2-degree target4. Changes affecting the transportation industry are to be expected, but no one knows today when they will really hit and how the market will respond. It is thus important to balance this contradictory situation and while trying to find ways to adapt the service portfolio, to do it carefully in order to not leave the rest of the industry (and the customers) behind. However, the first steps towards service adaptation can be started today, and should be in view of the development needed. At the same time, possibilities to finance these first adaptations need to be found, as customers, as said above, are reluctant to pay.
Service development could also include new fields of activities, for example within infra-structure and energy. Geodis Wilson has a natural interest in how infrastructure in different countries is operated and at which costs, as the company is a constant user of this infra-structure and is directly affected by any changes. The same holds true for energy: Today, Geodis Wilson is almost completely dependent on fossil fuels, even though the company does not own any vehicles, vessels or airplanes. Still, shortages in fossil fuels or drastic price increases as well as the development of alternative fuels in general are of utmost im-portance for the company’s core business. Therefore, it might be useful to establish colla-borations with partners in those fields, again in order to move from pure reaction to action with the help of first-hand knowledge and/ or knowledge ahead of actual developments.
Any changes in the service offer can only be successful if they are firmly backed by high-level management decisions. In order to be able to take such decisions, managers on diffe-rent levels in the company need to be able to make informed choices based on the right knowledge, knowledge that is an integral part of their very own tasks. The integration of 4 The world's target to stay below a global warming of 2 degrees was made at the United Nations conference in Copenhagen in 2009 and was confirmed during the Cancun conference 2010.

A logistic analysis with the Sensitivity Model Prof. Vester IVL report B2048
36
environmental and climate-related information into the classical management tools is a prerequisite for being able to administrate these aspects professionally and to take the right decisions. If not all necessary knowledge can be built up internally at once (at least this might take time), cooperation with research institutes, universities and consultancies can compensate gaps.
Another internal “tool” in planning and realizing changes effectively is sales. The sales force is the face to the customers, sometimes on a daily basis, and even though managers might have learned their part, the best strategies can still fail, if the sales force is not part of the development and adequately educated and prepared. The analysis of Geodis Wilson made it clear that sales are a critical part for the state of the company – it can be a powerful driver of or a powerful hindrance for new developments. Sales need to be educated in environmental matters as well, including all transport modes.
The sales force does not work independently of the rest of the organization, quite the con-trary: Sales can only be successful if they are supported by an operative force and by back office functions that are also educated in line with the company’s overall targets and vision. In order understand how the different parts of Geodis Wilson need to work together to deliver the best possible service, operational and back office personnel profit from education in basic system thinking and environmental aspects, of course adapted to the respective department and the company’s needs.
With regard to KappAhl, several recommendations were developed during the different steps of the model and are summarized as follows:
With regard to transportation, two considerations emerged quite clearly: 1) If KappAhl’s impact on the environment and climate caused by transportation is taken seriously, it is vital to educate and incentivize employees working with transport procurement in such a way that their main goals is broadened to include for example buying the most environ-mentally smart transport solution, of course keeping an eye on price and quality as before. Pulling this information from the transport providers will in turn push those to educate their sales force respectively, thus enabling them to work more actively with different solu-tions in the future. That way, KappAhl can help to either set a driver in motion or to keep that driver going, in the same way a positive feedback cycle works.
2) By doing so, air freight solutions will automatically be scrutinized even harder than today, and, if this is not the case already, it will be common knowledge that this transport mode contributes disproportionally (much) to KappAhl’s footprint. The decision to use airfreight should always be double-checked, for example by looking at the reasons behind it.
With regard to KappAhl’s core business, other aspects were taken up: KappAhl already works with a life-cycle perspective on their products, but maybe this perspective could be enhanced further to include second-hand use of clothes and different forms of recovery of materials. KappAhl also publishes washing advice on their website. Another step in the same direction could be to cooperate with producers of washing detergents and washing machines and to actively contribute to decreasing this energy- and water-intensive process in the life cycle instead of leaving the main responsibility for it to the consumer. Apart

A logistic analysis with the Sensitivity Model Prof. Vester IVL report B2048
37
from publishing washing advice on their website, there might be other ways to make con-sumers aware of how they themselves can reduce their clothes’ impact during different usage stages.
KappAhl already sells clothes produced with ecologically grown cotton. It should be analyzed how this niche could be improved, how prices could be reduced for ecological products and increased for non-ecological ones or how consumers could be informed and directed towards buying less clothes in general. The latter is of course diametrically opposed to the quantitative growth targets of KappAhl and thus hard to consider. Nonetheless, new ideas might spring from such an exercise. Moreover, qualitative growth in parallel with or ultimately instead of (pure) quantitative growth might become a survival factor some day in the future. A signal hinting towards that this is not totally unrealistic is the fact that the World Economic Forum just issued a report in 2012 with the title “More with Less: Scaling Sustainable Consumption and Resource Efficiency". The report takes up industry’s role in making the term ‘sustainability’ applicable for consumers, for example by making sustainable products their standard range of products, and the outdoor clothing provider Patagonia is mentioned as an example of a company that encourages customers to repair old clothes instead of buying new ones. Another example is the existence of research projects like “Future Fashion” where Mistra, the Foundation for strategic environmental research in Sweden, invests ca. 4 million € in a four-year interdisciplinary research project on sustainable fashion.
With these recommendations, the report (and the project) ends. Valid results and insights could be gained for the system in focus, which will hopefully inspire the actors that partici-pated to consider changes in their business processes or even business ideas. If they realize but some of the above recommendations, much can already be gained, both for the envi-ronment and for business. How to transfer some or all of the results of this project into reality is the next step and will be an even more challenging but also more rewarding jour-ney.

A logistic analysis with the Sensitivity Model Prof. Vester IVL report B2048
38
9. Literature Capros, P. et al.: (2008): European Energy and Transport. Trends to 2030 – Update 2007, Report
issued on behalf of the Directorate-General for Energy and Transport, Luxembourg.
Chana, S.-L. et al. (2009): A Sensitivity Model (SM) approach to analyze urban development in Taiwan based on sustainability indicators, in: Environmental Impact Assessment Review, vol. 29, p. 116-125.
Chana, S.-L.; Huang, S.-L. (2004): A systems approach for the development of a sustainable community—the application of the sensitivity model (SM), in: Journal of Environmental Ma-nagement, vol. 72, p. 133-147.
European Commission (2009): A sustainable future for transport. Towards an integrated, technology-led and user-friendly system, Directorate-General for Energy and Transport, Luxembourg.
European Commission (2008): Towards a “Post-Carbon Society”. European research on economic incentives and social behaviour, Conference proceedings, Directorate-General for Research, Socio-economic Sciences and Humanities, Brussels.
European Commission (2006): World Energy Technology Outlook – 2050, Directorate-General for Research and Directorate Energy, Brussels.
Gode, J. et al. (2010): Swedish long-term low carbon scenario. Exploratory study on opportunities and barriers, B1955.
Khan, J. et al. (2001): Att styra mot ett klimatneutralt samhälle, LETS Working Paper.
Nilsson, M. (2011): Höjt oljepris hotar klimatmålen, SvD Opinion, March 29, 2011.
Skinner, I. et al. (2010): EU Transport GHG: Routes to 2050? Towards the decarbonisation of the EU’s transport sector by 2050, Final report produced under the contract ENV.C.3/SER/2008/0053 between European Commission Directorate-General En-vironment and AEA Technology plc.
Sköldberg, H. et al. (2010): Ett fossilbränsleoberoende transportsystem år 2030, Elforsk rapport 10:55, Stockholm.
Steen Petersen, M. et al. (2009): Report on Transport Scenarios with a 20 and 40 year Horizon, Final report, TRANSvision project commissioned by DG TREN.
Transportsystem för hållbar utveckling och konkurrenskraft ((2010). Final report from the project Transport 2030, Kungl. Ingenjörsvetenskapsakademien (IVA), Stockholm.
Vester, Frederic (2007): The art of interconnected thinking. Tools and concepts for a new approach to tackling complexity, Munich.

A logistic analysis with the Sensitivity Model Prof. Vester IVL report B2048
39
10. List of figures Figure 1: Exemplary process when using the Sensitivity Model Prof. Vester
Figure 2: The roles of all variables identified in the transport system
Figure 3: List of positive and negative feed-back cycles in the transport system
Figure 4: State of scenario 1 after 20 iterations
Figure 5: State of scenario 2 after 20 iterations
Figure 6: State of scenario 2, version B after 20 iterations
Figure 7: Estimation of total system
Figure 8: Estimation of (sustainability) criteria fulfillment in the future