a longitudinal survey of newly-released prisoners: … · a longitudinal survey of newly-released...
TRANSCRIPT
A Longitudinal Survey of Newly-Released Prisoners:
Methods and Design of the Boston Reentry Study1
Bruce Western Harvard University
Anthony Braga
Rutgers University
Rhiana Kohl Massachusetts Department of Correction
October 2014
1 Department of Sociology, 33 Kirkland Street, Cambridge MA 02138. E-mail: [email protected]. This research was supported by grant 5R21HD073761-02 from NIH/NICHD and SES-1259013 from the National Science Foundation. We gratefully acknowledge the significant assistance of the Massachusetts Department of Correction.
1
Abstract
With the historic increase in U.S. incarceration rates, large numbers of men and women are being released from prison to poor urban neighborhoods. Because of their severe socioeconomic disadvantage, housing insecurity, and criminal involvement, the recently-incarcerated are an extremely challenging population for social science analysis. Recent survey studies of released prisoners suffer from high rates of non-response. The Boston Reentry Study is a small intensive longitudinal data collection from 122 men and women released from state prison to the Boston area. The study adopts a variety of strategies to maximize survey participation, and data on the household complexity and instability of men and women released from prison. The study illuminates the process of release from prison, advances survey methodology for hard-to-reach populations, and helps describe the fluidity of householding and family relations of poor, prime-age, men and women.

2
Growth in American prison and jail populations over the last forty years has propelled the
US incarceration rate to the highest in the world and made incarceration commonplace for
residents of poor inner-city communities. The US penal system now houses around 2.3 million
people in state and federal prisons and local jails, and incarceration rates are highest among
racial and ethnic minorities and the poor (Western 2006).
Historically high rates of incarceration produced large cohorts of prison releasees – over
600,000 annually – who entered a relatively small number of mostly poor neighborhoods, often
equipped with few social policy supports. Large numbers of prison releases motivated research
on the effects of incarceration on crime and other social and economic outcomes, including
employment, health, and the well-being of children with incarcerated parents (see the reviews of
Wakefield and Uggen 2010, Wildeman and Muller 2012, and Wildeman and Western 2010).
Despite a large body of research studying the effects of incarceration, relatively few
studies have examined in detail the process of leaving prison and entering a community.
Specialized data collections of post-incarceration experiences have mostly been ethnographic,
making field observations on relatively small groups of men and women, often networks of
research subjects in a few neighborhoods (e.g., Harding et al. 2014; Fader 2013; Leverentz
2014). While qualitative research has been invaluable in its account of life in poor communities
under conditions of high incarceration, it often struggles to represent the heterogeneity of prison
releasees. Panel surveys have collected data on relatively large samples of released prisoners. In
some cases, like the Fragile Families Study of Child Well-Being, formerly incarcerated men
were interviewed in a general population survey design (Teitler et al. 2003). In other cases, like
Urban Institute’s Returning Home study, specialized samples of newly-released prison and jail
inmates were interviewed over a one or two year follow-up period (LaVigne and Kachnowski

3
2003). With both general population and specialized data collections, formerly-incarcerated
respondents showed high rates of study attrition and other kinds of nonresponse.
A longitudinal data collection from a sample making the transition from prison to
community offers at least three contributions to research on the effects of incarceration. First, a
major challenge for research is the problem of under-enumeration. The formerly-incarcerated
are a significantly under-counted population that resists observation with traditional methods of
social science data collection. Pettit (2012) describes the incarcerated as “invisible men” whose
under-enumeration distorts conventional measures of poverty and inequality. After release, they
may be “on the run,” as Goffman (2014) describes, evading both researchers and social control
agencies. Large-scale data collections are typically built around close attachment to mainstream
social institutions like stable households, steady employment and, among the poor, enrollment in
social programs. Men and women released from prison are a large hard-to-reach population that
are often only weakly attached to households, often residing with family and friends or in
homeless shelters, and revolving in and out of institutional settings (Travis 2005; Goffman 2014;
Metraux, Roman, and Cho 2007). Employment is often unstable and undocumented, and social
programs are under-used. As a result, the formerly-incarcerated are thus so weakly connected to
mainstream social institutions that they are often inaccessible in standard data collections using
surveys or administrative records (Harding et al. 2011; Kornfeld and Bloom 1999). Those that
are observed in the usual data sources are likely to be relatively advantaged compared to the
general population of those with prison records.
Second, people who go to prison are acutely disadvantaged in many ways that are often
difficult to observe. Life histories of violence and other trauma, cognitive impairment, poor
mental and physical health, addiction, and weak family and community supports may all add to

4
social and economic hardship after prison. The effects of these frequently unobserved
confounding factors may be mistakenly attributed to incarceration. The problem of unobserved
heterogeneity is a key focus of research on the effects of incarceration and motivates analysis
with controlled experiments, difference-in-differences, fixed effects, and instrumental variables
(e.g., Pager 2003; Kling 2006; Western 2002). With detailed data collection on a hard-to-reach
population, the multiple disadvantages of the formerly-incarcerated become a problem for
explanation and analysis instead of just a threat to causal inference.
Third, a detailed data collection from people entering communities after incarceration can
improve understanding of the content of administrative and general-purpose survey data.
Incarceration effects have often been studied by linking correctional data on imprisonment and
prison release to administrative data on outcomes, such as police arrest records or unemployment
insurance records on earnings (Grogger 1995; Kling 2006; Cho and Lalonde 2008; Pettit and
Lyons 2009). Alternatively, incarceration has also been measured in population surveys, where
respondents are asked about their criminal histories. The interpretation of both kinds of data
could be assisted by a specialized data collection that can provide information about the context
in which administrative or general survey data are collected. Arrest records for example are
often interpreted to reflect new criminal conduct but may also be produced by the efforts at
supervision by parole and probation authorities. Similarly, surveys asking about the family
involvement of prison releasees may have difficulty capturing the full complexity of family
relationships in a context of unstable residence and multiple partner fertility (cf., Wakefield and
Wildeman 2013). In short, for a population that is often embedded in a complex web of social
relationships, and weakly attached to mainstream social roles as workers, citizens, and

5
householders, conventional data collections – even in the absence of under-enumeration – may
face serious problems of measurement.
This paper describes the Boston Reentry Study (BRS), a collaboration between
researchers at Harvard University and the Massachusetts Department of Correction (DOC). The
study provides a mixed methods longitudinal data collection from men and women released from
state prisons in Massachusetts and returning to neighborhoods in the Boston area. The BRS is
tailored to the problem of studying release from incarceration in two main ways. First, the survey
instruments are designed to measure special features of the experience of release from
incarceration. Survey modules, for example, obtain detailed information on housing and family
relationships to reflect the fluid living arrangements and patterns of residence in the period
immediately after incarceration. Second, a wide variety of strategies are adopted to maximize
response rates, and retain study participation for a hard-to-reach population who in many cases
have no independent housing and are living with extreme financial insecurity. The BRS is thus
designed to the fill the current gaps in our understanding of the prison-to-community transition,
to address the problems of under-enumeration, measure quantitatively and qualitatively the kinds
of characteristics and contexts that distinguish a uniquely disadvantaged population, and capture
the complexity of householding, family life, employment, and criminal involvement that is
missed in conventional data collections.
We begin by describing the basic design of the study from sample recruitment through
the one year follow-up period. We then describe our main data sources and instruments. This is
followed by a discussion of characteristics of the sample in comparison to the population of
prison releasees to Boston. Finally, we examine the pattern of study retention.
6
Study Design
The Boston Reentry Study aimed to sample all releasees from Massachusetts state prisons
returning to the Boston area. Respondents were scheduled for five interviews over a one-year
follow-up period and again if they were re-incarcerated. Family members were also interviewed
to supplement respondents’ reports. The BRS survey instruments asked a series of core
questions to measure the household structure, family life, and employment of those released
from prison. A series of topical modules were also fielded to obtain more detailed information
about the process of transition out of prison, employment, children and romantic partners, and
life history. To ensure a full accounting of the heterogeneity of the prison population, a variety of
measures were taken to maximize study retention.
Sample Selection and the Baseline Interview
The core sample of the BRS consists of 122 Massachusetts state prison inmates who were
recruited between May 2012 and February 2013.2 Study eligibility required that inmates (a) were
within one month of their scheduled prison release, and (b) provided a post-release address in the
Boston area.
Recruitment into the study was led by the DOC research unit, working with staff contacts
in each of the state correctional facilities. Before the initial data collection began, DOC and
Harvard researchers met with prison staff to introduce the project and describe the research
protocols. DOC research staff then generated a list of inmates who were scheduled to be released
from each of the state prisons to the Boston area. Staff contacts at each DOC facility were given
letters to be distributed among prison inmates eligible for the study. The letter described the
2 We conducted 124 interviews in prison, though two respondents later became ineligible and were not included in main data analysis. One was released out of state to New Jersey, and the second was not released within the time frame of the study.
7
study and invited respondents to participate. The letter identified Harvard University as the
institutional base for the research, emphasized that interviews were only for research purposes,
and described the compensation that was provided for each interview. Recruitment of
respondents to the study varied across institutions. Staff at some facilities had strong interests in
reentry programming, took a keen interest in the research, and actively recruited subjects to the
study. Perhaps because of respondents’ unwillingness to participate at some institutions or the
implementation of the study protocol, recruitment proceeded more slowly at other institutions,
producing under-representation from medium security facilities. Table 1 shows the distribution
of respondents across Massachusetts state correctional facilities, and the total number of releases
to Boston over the study period. The table indicates particularly high levels of study recruitment
from Pondville and Northeastern Correctional Centers, both minimum-security pre-release
centers. A small number of recruits to the study also declined to continue to participate after
meeting at the baseline interview.

8
Table 1. Boston Reentry Study releases and other prison releases to Boston by DOC facility, May 2012 to February 2013.
BRS Total
releases Recruitment
rate (%) Women South Middlesex 1 12 8.3 MCI-Framingham 14 44 31.8 Pre-release/minimum Boston Pre-Release 13 45 28.9 Pondville Correctional Center 18 33 54.5 MCI-Plymouth 1 15 6.7 Northeastern Correctional Center 14 23 60.9 Massachusetts Alcohol and Substance Abuse Center 3 6 50.0 Minimum/medium Old Colony Correctional Center 11 51 21.6 MCI-Shirley 4 36 11.1 North Central Correctional Institution at Gardner 0 16 0.0 Medium MCI-Concord 13 53 24.5 MCI-Norfolk 9 46 19.6 Bay State Correctional Center 0 14 0.0 Massachusetts Treatment Center 3 5 60.0 Bridgewater State Hospital 1 2 50.0 Maximum MCI-Cedar Junction 9 29 31.0 Souza-Baranowski Correctional Center 9 29 31.0 Total (N) 123 459 26.8 Note: One respondent was recruited in the community immediately after prison release. Though eligible and interested in study participation, the respondent was unable to make himself available for an interview until the first few days after release. Two respondents were recruited into the study and are counted here, though they became ineligible for our main sample after release and are not included in follow-up analysis.
The Massachusetts Department of Correction operates 18 facilities throughout the state.
The system includes a state psychiatric hospital, a medical care unit, two women’s facilities, and
fifteen other facilities for men that vary in their custody level from pre-release to maximum

9
security. Prison inmates are released from all security levels to the street following the expiration
of sentences or, conditionally, under the supervision of a parole officer. In addition, about one-
third of the release population in Massachusetts subsequently serves probation. Whereas recent
reentry studies have focused on parolees (LaVigne and Kachnowski 2003; Harding et al. 2014),
the Boston Reentry Study broadly samples from the whole release population. Nearly 40 percent
of the BRS participants are not under any form of supervision. These unsupervised releases now
account for nearly half of all Massachusetts prisoners (and about a quarter nationwide),
providing a valuable contrast with parolees in their conditions of study retention and community
reentry.
Respondents were drawn from 15 of the 18 DOC correctional facilities. We deliberately
did not recruit respondents from the state’s hospital correctional unit, and two other facilities did
not provide eligible respondents who would be released to the Boston area during the study time
frame. Recruiting participants from a variety of state correctional facilities produced a highly
heterogeneous sample. By recruiting from the range of security levels, the respondents vary
widely on length of prison stay, criminal histories, offense severity, and age groups. The survey
also includes Massachusetts’s main women’s prison (MCI-Framingham), and the full sample
includes 15 female respondents. Women have not been a key focus of earlier reentry studies (cf.,
Leverentz 2014), though the rapid increase in female incarceration offers strong motivation for
studying patterns of household attachment and kin relations among formerly-incarcerated women
(Kruttschnitt 2011).
With a respondent selected and a baseline interview scheduled, two interviewers – one
from Harvard and one from the Department of Correction research unit – would visit the prison.
Typically the facility contact (usually a correctional program officer) would meet the

10
interviewers and escort them inside. Most interviews were conducted in offices or classrooms
and were completed by the interviewers with paper and pencil. A handful of interviews were
conducted in more secure settings, either in noncontact units where respondents were behind
plexiglass or in locked booths called therapeutic modules.
The baseline interviews began with introductions where the interviewers identified
themselves and their affiliations and administered a consent form. The consent form described
the research, reassured respondents of the voluntary character of the interviews, and separately
obtained signed consent for the interview, DOC administrative records, unemployment insurance
records, and MassHealth records. Respondents were also asked for a list of secondary contacts
that we could call to help stay in touch after prison release. The interview concluded with
making plans for contact in the community approximately one week after prison release.
Respondents received a form with a phone number and address for the Harvard study team, and a
checklist describing their participation in the consent, the provision of secondary contacts, and
the survey interview. The baseline interview typically lasted about an hour, and collected
information on demographics and social background, dates for the current incarceration, and
information about the conditions of penal confinement. In nearly all cases, the baseline interview
was completed, but a few times respondents were called from the interview for a count of the
prison population. In these cases, the baseline interview was completed at the first follow-up
interview in the community a few weeks later.
At the baseline interview, respondents provided their expected release date, though it was
not always exact, particularly if they were waiting to be released on parole. After respondents
were released from DOC custody, the DOC research staff notified Harvard researchers. Upon
release, we called respondents using the contact information they provided at baseline, typically

11
the phone number of a close family member or friend. In some instances, we had no contact
information for respondents, and they called us upon their release or we located them at
residential or transitional housing programs.
Follow-up and Supplementary Interviews
The baseline interview was generally scheduled about one week before prison release. We then
conducted four planned follow-up interviews: (1) at one week after release, (2) at two months,
(3) at six months, and (4) at twelve months. Each of the follow-up interviews included a core
interview and a topical module. The core interview included questions about the respondent’s
current household, current employment, contact with family, relationships with children,
program participation, criminal activity, contact with the criminal justice system and drug use.
To try and capture the process of transition from prison to community, respondents were asked at
the one-week interview to complete a time-use module. For each day since release, respondents
were asked to describe their main activity, whom they were with, and in which neighborhood
they spent most of their time. The module yields a very detailed picture of the first week after
prison and indicates, for example, a high level of family contact early in the week that gradually
declines over the following seven days (Western et al. 2014). The topical module for the two-
month interview asks about respondents’ romantic relationships after prison release. At the six-
month interview respondents provide an employment history, and additional questions are asked
about job seeking, and earnings. The twelve-month interview includes a module asking about
childhood exposure to violence and other trauma, collects information about the respondent’s
attitude to criminal justice institutions, and asks about the experience of violence and crime in
the year post-release.

12
Post-release interviews were held in the community, or in a prison or jail facility if the
respondent was back in custody (see below). A typical interview setting was a coffee shop in the
respondent’s neighborhood or near the Probation office. Many later interviews took place in
respondents’ homes or residential programs. To improve data quality, we conducted nearly all
interviews in pairs of two Harvard researchers, though several interviews early in the study were
conducted one-on-one due to limited research capacity.
The survey interviews yielded quantitative and qualitative data. Each follow-up interview
consisted of a few hundred closed-ended questions and generally took one to two hours to
complete. In addition to the closed-ended questions, respondents frequently engaged in more
informal conversation or elaborated on their answers. All interviews in the community were
audio-taped3, and extensive notes were taken on the paper-and-pencil interview scripts. Each
interviewer also recorded a set of field notes at the end of each interview, which typically
described noteworthy responses, features of the interview setting, and the demeanor of the
respondent.
In addition to the scheduled interviews, we also conducted interviews with family
members and in the event of re-incarceration. Several protocols were developed for re-
incarceration with the general aim of continuing data collection through returns to custody.
Rather than re-incarceration being a censoring point in the design, re-incarceration interviews
yield comparisons to both the pre-release interviews and to non-recidivists in the rest of the
sample. During the data collection period, the Department of Correction would send the Harvard
research team a list describing the criminal justice status of all respondents.4 Obtained from a
query of the Massachusetts criminal justice information system, the weekly update would
3 A few interviews were not audio-taped due to the respondent’s preference or an audio recorder malfunction. 4 Three respondents did not provide consent for Harvard researchers to access their criminal records and were excluded from these lists provided by the DOC.

13
include a list of new arrests, charges, parole or probation violations, court appearances and re-
incarcerations. Family members and close friends were also a key source of information on
respondents’ custody status and sometimes were able to provide information that did not appear
on the official DOC records. If respondents had returned to state prison, we would arrange with
the Department of Correction for a re-incarceration interview. If respondents were held in county
custody – awaiting trial, re-incarcerated on a violation, or serving a new sentence – we would,
with the assistance of the Department of Correction, arrange for a new interview in county
facilities. All re-incarceration interviews were conducted in MA prisons or county jails, except
for two interviews that took place in Maine county jails.
Follow-up interviews in correctional facilities were completed by two Harvard
researchers. The survey instrument asked about the incident that led to the respondent’s return to
incarceration. It also collected information on respondents’ housing, employment and other
financial support, family, peer networks, and substance use prior to their recent arrest or
violation. The re-incarceration interview included a set of open-ended questions that asked the
respondent for an account of the circumstances surrounding his or her return to prison. If
respondents were in custody for two (or three) consecutive interview periods, we administered
the standard survey instrument at the later interview(s). For example, if a respondent was re-
incarcerated near the 6-month date, we administered the re-incarceration instrument. If that
respondent was still in custody at the 12-month date, we administered an adapted version of the
12 month survey instrument. Respondents who were re-incarcerated close to their 12-month
interview date were given adapted versions of the re-incarceration and 12 month interviews.
We also conducted a round of proxy interviews with key informants whom we expect to
be more stably attached to households. At the baseline interview in prison, we asked respondents

14
to provide contact information for close family or friends who might reliably connect us to the
respondent after prison release. We expected that maintaining contact with friends and family
members might raise the likelihood of retention during the follow-up period. We also asked the
focal respondents for permission to conduct interviews with one of the contacts they provided.
Throughout the follow-up period, respondents typically gave us additional contact information
for family members or close friends as they developed trust in the researchers and gained
understanding in the purpose of the study.
The proxy interviews were usually conducted about eight to twelve months after the focal
respondents’ prison release.5 The majority of proxy respondents were female family members –
mothers and sisters – though we also interviewed partners, grandmothers, aunts, cousins,
brothers, fathers, and adult children.
While proxy interviews with friends and family members were initially conceived as a
retention strategy, they emerged as a key area of substantive interest. In addition to collecting
information about the proxy respondents themselves, interviews with family and friends
provided another source of information about the focal respondents’ childhood, their experience
of incarceration, and on their household and family relationships. The proxy interviews also
aimed to collect data on the focal respondents’ children and gain a better understanding of their
well-being before, during, and after their parents’ incarceration. These interviews thus provided
further context for the outcomes of an acutely disadvantaged population after release from
prison.
5 Several proxy interviews were also conducted after the focal respondents’ 12-month interview date. We sometimes found it easier to schedule an interview with a family member or close friend soon after contact with the focal respondent at the 12-month interview. Because proxy interviews are a later phase of data collection, they are still ongoing at the time of this paper.

15
Sample Characteristics
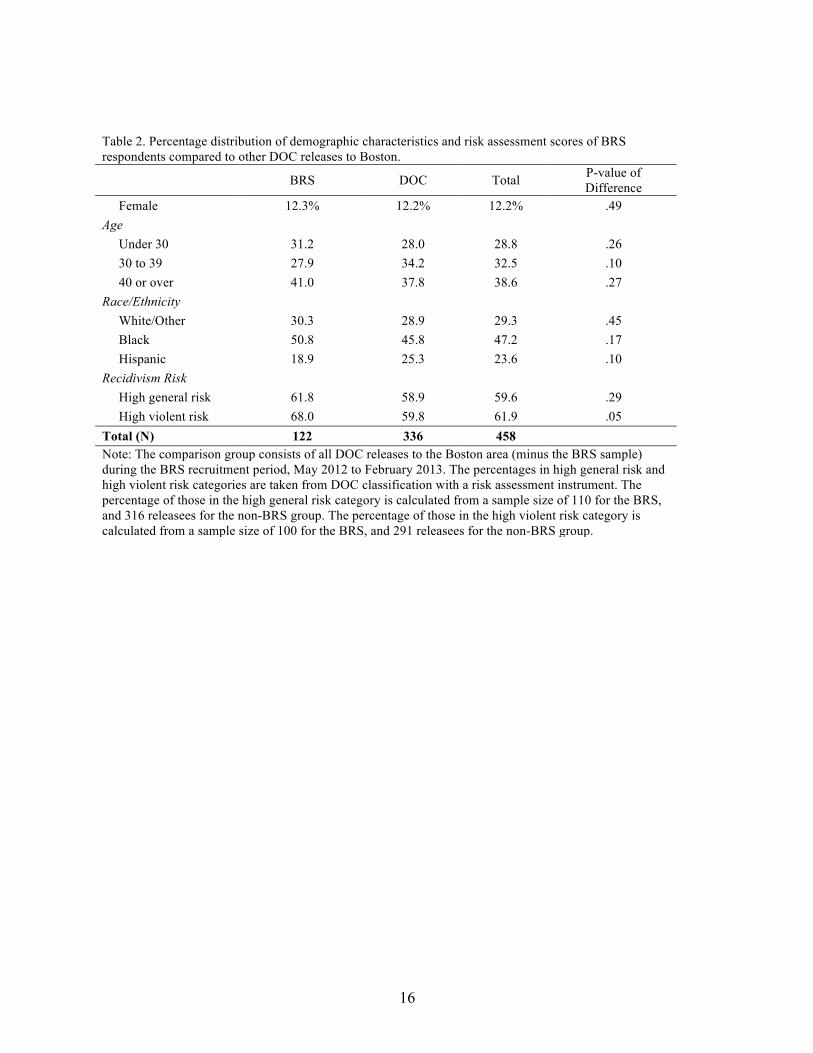
Approximately one-fourth of all prison releases to the Boston area in the recruitment period
participated in the Boston Reentry Study. Table 2 compares the demographic composition and
the recidivism risk of the BRS sample and of other DOC releasees to the Boston area in the study
period. Table 2 shows that the BRS sample is demographically similar to the population of
Boston releases. The risk of violent recidivism, assessed by an instrument administered by the
DOC, is somewhat higher in the BRS sample, though the general recidivism risk of sample
respondents is almost equal to that of the population of releasees.
The criminal justice characteristics of the BRS sample are compared to the general
population of DOC releasees to Boston in Table 3. There are two significant discrepancies
between the study sample and the release population. Prison releases at lower levels of custody
are over-represented in the sample, and releases from medium security facilities are under-
represented. Drug offenders are also under-represented in the study sample (21.3 percent of
respondents compared to 50.3 percent of other releasees).
The discrepancies of custody level and offense type may be due to a large-scale court
review of drug evidence during the time of the data collection. Fabricated drug evidence from
one forensic laboratory caused a large number of court-ordered prison releases at short notice
before inmates could be recruited to the reentry study. Despite the releases, the sample
respondents are representative of the population of releases in terms of length of stay in prison
and may be more representative of released prisoners in a typical year, in the absence of the
crime lab scandal. Indeed, when the releases from the crime lab scandal are removed from the
comparison sample, the BRS sample closely resembles the general release population in their
offense characteristics.
16
Table 2. Percentage distribution of demographic characteristics and risk assessment scores of BRS respondents compared to other DOC releases to Boston.
BRS DOC Total P-value of Difference
Female 12.3% 12.2% 12.2% .49 Age Under 30 31.2 28.0 28.8 .26 30 to 39 27.9 34.2 32.5 .10 40 or over 41.0 37.8 38.6 .27 Race/Ethnicity White/Other 30.3 28.9 29.3 .45 Black 50.8 45.8 47.2 .17 Hispanic 18.9 25.3 23.6 .10 Recidivism Risk High general risk 61.8 58.9 59.6 .29 High violent risk 68.0 59.8 61.9 .05 Total (N) 122 336 458 Note: The comparison group consists of all DOC releases to the Boston area (minus the BRS sample) during the BRS recruitment period, May 2012 to February 2013. The percentages in high general risk and high violent risk categories are taken from DOC classification with a risk assessment instrument. The percentage of those in the high general risk category is calculated from a sample size of 110 for the BRS, and 316 releasees for the non-BRS group. The percentage of those in the high violent risk category is calculated from a sample size of 100 for the BRS, and 291 releasees for the non-BRS group.

17
Table 3. Percentage distribution of incarceration characteristics of BRS respondents compared to other DOC releases to Boston.
BRS DOC Total P-value of Difference
Security Level Min/Pre-Release 44.3 33.3 36.2 .02 Medium 41.8 55.4 51.7 .00 Maximum 13.9 11.3 12.0 .23 Governing Offense Violent 41.0 27.7 31.2 .00 Drug 21.3 50.3 42.6 .00 Property 16.4 12.8 13.8 .17 Sex 3.3 3.3 3.3 .50 Other 18.0 6.0 9.2 .00 Time Served Less than 1 year 21.3 23.2 22.7 .33 1 to 3 years 46.7 47.3 47.2 .45 3 to 10 years 29.5 27.1 27.7 .31 10 or more years 2.5 2.4 2.4 .48 Supervision Status Unsupervised 38.5 - - - Supervised 61.5 - - - Total (N) 122 336 458 Note: The comparison group consists of all DOC releases to the Boston area (minus the BRS sample) during the BRS recruitment period, May 2012 to February 2013. Supervision data not available for other DOC releases during this time period.

18
Study Retention
Panel surveys have collected data on relatively large samples of released prisoners, but these
studies have faced high rates of sample attrition. The Urban Institute’s Returning Home study
interviewed large samples of men and women released from prison and jails in Maryland,
Illinois, Ohio, and Texas (La Vigne and Kachnowski 2003; La Vigne and Mamalian 2003; La
Vigne and Thomson 2003; Watson, Solomon, La Vigne and Travis 2004). The Urban Institute
researchers examined the employment prospects, health, housing opportunities, and family
support for those leaving correctional institutions. Like other data collections with subjects
involved in crime and the criminal justice system, Returning Home encountered a high rate of
study attrition. In the pilot study in Maryland, from an original sample of 324 pre-release
interview respondents, 53 percent were lost by the first post-release interview and at the second
interview the nonresponse rate had climbed to 68 percent. The investigators intentionally
reduced their sample size to roughly half of their original sample, and at the second post-release
interview to one third due to the high cost of survey retention. The Returning Home study
experienced high rates of attrition at all of their study sites. Over the course of a year, attrition
varied from 39 to 68 percent.6
General purpose, population surveys have also been used to study the effects of
incarceration. These surveys include the Fragile Families Study of Child Well-Being and the
1979 and 1997 cohorts of the National Longitudinal Surveys. Fragile Families is a child-based
survey that includes interviews with mothers and fathers (Reichman, Teitler, Garfinkel, and
McLanahan 2001). Histories of incarceration are obtained from fathers, who are also interviewed
if incarcerated in a year of the scheduled survey. Survey nonresponse rates are relatively high
6 The Vera Institute of Justice also conducted a study aimed to follow people in New York City for their first 30 days after release from prison or jail. Only 56 percent of the initial sample completed the study (Nelson, Deess, and Allen 1999).
19
among incarcerated fathers. For example, in the third-year follow up interviews, the survey
nonresponse rate for formerly-incarcerated fathers was 36 percent compared to 18 percent for all
others. The NLSY79 and NLSY97 also interview respondents who are incarcerated at the time of
their scheduled interviews. Both National Longitudinal Surveys sustain a high rate of retention
for formerly-incarcerated respondents. However, the NLSY79 only asked about incarceration in
the 1980 round, and information about later prison or jail stays is provided by an item recording
the respondent’s residence. This measure thus under-estimates the prevalence of short periods of
imprisonment. The NLSY97 provides perhaps the most detailed information about incarceration
among the general population surveys but was not specifically designed to study the social and
economic life of former prisoners, and information on the substantive problem of prison reentry
is scarce.
Retention Strategies
A major goal for the Boston Reentry Study was to maintain a high level of retention among a
diverse group of study participants in the year after their release from prison. As of October
2014, all respondents have reached the 12-month interview phase. The interview response rate
was 96 percent at one week, 92 percent at 2 months, 88 percent at 6 months, and 90 percent at 12
months (Table 4). This represents a high level of retention compared to previous studies on
prisoner reentry, particularly given that nearly 40 percent of the study sample is not under
correctional supervision.
In some cases, researchers were unable to schedule an interview due to, for example, loss
of contact or incarceration, but were able to arrange the next scheduled interview. In these
instances respondents were often asked time-insensitive questions that they had missed from the

20
previous interview, such as the module on prior work history. The number of missing
respondents remained fluid throughout the study period, as researchers would regain contact with
respondents after months without communication. All eligible respondents participated in at least
one follow up interview after prison release.
Table 4 also reports the timing of the follow up interviews. For the most part, interviews
were successfully conducted in line with the follow up schedule. The one and two month
interviews were conducted almost exactly as designed with a median time to follow-up of 7 and
64 days. The standard deviations around these follow up times (6 and 15 days) indicate that most
of the first two follow-up interviews were conducted within a short period of their scheduled
time. The six month and twelve month interviews were, on average, conducted on schedule, but
variation around the median follow-up time increased as the year-long follow-up period
unfolded.
Table 4. Number of completed interviews and response rates, BRS, October 2014.
Time Since Release Baseline 1 week 2 months 6 months 12 months Number of interviews 122 117 112 107 110 Unable to schedule/contact - 4 8 9 11 In custody or hospitalized - 1 2 6 1 Nonresponse rate (%) - 4.1 8.2 12.3 9.8 Median days from release 8 7 64 185 373 S.D. of days from release 40.2 5.9 14.8 20.5 60.3 IQR of days from release 11 3 8 16 27 Note: Release date is respondents' release into the community, which in a few cases was later than release from DOC custody due to a required civil commitment or jail sentence. Does not include two respondents interviewed at baseline who later became ineligible due to a late release date and out-of-state residence. Survey nonresponse includes all those who are un-contacted or unscheduled plus those unreachable through incarceration or hospitalization as a percentage of those eligible to be interviewed. S.D. is the standard deviation around the average follow up time. IQR is the interquartile range between the 25th and 75th percentiles for days from release.
21
Overcoming high rates of survey nonresponse and study attrition required a wide variety
of specialized measures that have often been used with other poor and hard-to-reach populations.
Typical of areas undercounted in the Census, the main reentry neighborhoods in Dorchester,
Roxbury, Mattapan, and Hyde Park contain both pockets of acute poverty and large black and
Latino populations.
Four specific strategies were employed to maintain coverage and participation of the
respondents. Each data collection strategy aimed to increase coverage and study participation, to
be informative about nonresponse and attrition when it did occur, and to provide insight on
scaling up the study.
1. Interview incentives. Previous studies found that incentives can increase participation
among parolees, and increase retention among low-income respondents (Martin et al. 2001). In a
University of Michigan study, parolees were given cash payments for interviews which the
investigators reported as more effective than checks (Harding et al. 2014). Respondents in the
BRS were paid for each completed interview. Because respondents at baseline were so close to
release, we deferred the first payment until the first follow-up interview. At the one-week
interview in the community, respondents thus received two payments, for baseline and follow-
up, a strategy that was effective in the Michigan study. Respondents received the $50 incentive
at the time of all subsequent interviews, at two months, six months, and one year. Proxy
respondents were also paid $50 for their interview. For respondents who were re-incarcerated at
the time of a follow-up interview, we deposited $50 into their prison commissary account.
2. Phone check-ins. We also conducted regular phone check-ins with study respondents
throughout the year after prison release. Between the baseline, 1-week, 2-month, and 6-month
interviews, we phoned respondents every one to two weeks. We checked-in by phone about once

22
a month between the 6-month and 12-month interviews. Phone check-ins were used to update the
respondents’ residential information and to maintain constant contact with respondents to
improve study retention. We also asked a few questions at each check-in relating to residential
stability, employment, drug and alcohol use, and subjective well-being. Responses to these
questions were recorded and form part of the quantitative data collection.
3. Proxy interviews. We expected survey non-response and study attrition to be
concentrated among those who moved between residential addresses and group quarters. The
Fragile Families study demonstrated the value of proxy interviews with related women who are
more strongly attached to households. In particular, women’s interviews significantly
compensated for high rates of survey nonresponse among formerly-incarcerated men (Lopoo and
Western 2005). We elaborated this approach by conducting proxy interviews with close family
and friends who could also help us locate hard-to-find respondents. The baseline interview in
prison obtained a list of contacts to be used to help locate respondents after prison release.
Because we expected proxy respondents to provide interesting information about the
respondent’s family contacts and well-being, we also aimed to conduct at least one substantive
interview with a family member or close friend for each focal respondent. At the baseline
interview, respondents were fully informed of the retention strategies, and we contacted friends
or family members only with respondents’ permission.
4. Enlisting community contacts. When conventional retention strategies were exhausted,
a professional network of legal agencies and community partners was mobilized to re-establish
and maintain contact with the study subjects. For subjects under criminal justice supervision in
the community, the Massachusetts Office of the Commissioner of Probation, and in a few cases
the Boston Police Department, assisted the research team in locating subjects in the community

23
for interviews. For those who were not under official supervision, we tried to reestablish contact
through our connections with a variety of street and community workers operating in the inner-
city neighborhoods where study respondents resided.
Finally, although not formally a retention strategy, we assess attrition and greatly expand
the utility of the survey data by linking to administrative records from the DOC. DOC records
provide three kinds of information. First, the records provide complete adult criminal histories of
the study participants. Criminal history data was periodically updated throughout the follow-up
period after prison release as part of the usual recidivism analysis conducted by the DOC
research division. Second, we also obtain information on prison conduct and programming,
including participation in treatment programs and 12-step and related programs. This will
contribute significantly to data on the conditions of confinement and allow analysis of the
association between program participation and post-release health outcomes. Lastly, the DOC
administers a risk assessment instrument that provides detailed information about the
participants’ criminal history, education, employment, economic status, family and marriage ties,
housing and neighborhood characteristics, and history of alcohol and drug use. These data will
supplement the survey data as well as indicate the risks – like drug use, crime, and housing
insecurity – that are associated with study attrition and criminal recidivism. The availability of
social security numbers through the DOC also opens the possibility of linking interview records
to an array of social service agencies, in particular to Unemployment Insurance and MassHealth,
the state health program for low-income individuals. These records will provide additional
evidence on employment and earnings, as well as health care utilization.

24
Conclusion
Under conditions of historically high incarceration rates, the Boston Reentry Study provides a
unique longitudinal data collection of a cohort of released state prisoners returning to the Boston
area. Through four follow-up interviews conducted over a period of a year, the BRS aimed to
provide information not just about recidivism, and social reintegration after incarceration; it
aimed to systematically describe the complex and fluid patterns of householding, employment,
and family relations that characterize very poor populations who are often tenuously connected
to mainstream social roles around which conventional data collections are typically designed.
Because released prisoners are a hard-to-reach population that are usually under-
enumerated in conventional social surveys, a variety of strategies were adopted to improve
coverage and sustain a high rate of study participation over the one-year follow up period. These
measures produced extremely high rates of survey response, around 90 percent over four follow-
up interviews. The high level of study participation combined with a unique set of survey
instruments oriented to measuring complex patterns of employment, family ties, and
householding promises an original contribution to our understanding of the process of prison
release under the historically novel conditions of very high rates of incarceration in poor
communities.

25
References
Cho, Rosa, and Robert J. Lalonde. 2008. “The Impact of Incarceration in State Prison and the Employment Prospects of Women.” Journal of Quantitative Criminology 24(3). Fader. Jamie J. 2013. Falling Back: Incarceration and Transitions to Adulthood among Urban Youth. New Brunswick, NJ: Rutgers University Press. Goffman, Alice. 2014. On the Run: Fugitive Life in an American City. Chicago: University of Chicago Press. Grogger, Jeffrey. 1995. “The Effect of Arrests on the Employment and Earnings of Young Men.” Quarterly Journal of Economics 110: 51-71. Harding, David J., Jeffrey D. Morenoff, and Jessica JB Wyse. Forthcoming. “Romantic Relationships and Criminal Desistance: Processes and Pathways.” Sociological Forum. Harding, David, Jessica J.B. Wyse, Cheyney Dobson, and Jeffrey D. Morenoff. 2014. “Making Ends Meet After Prison.” Journal of Policy Analysis and Management 33(2): 440-470. Kling, Jeffrey R. 2006. “Incarceration Length, Employment, and Earnings.” American Economic Review 96(3): 863-876. Kornfeld, Robert, and Howard S. Bloom. 1999. “Measuring Program Impacts on Earnings and Employment: Do Unemployment Insurance Wage Reports from Employers Agree with Surveys of Individuals?” Journal of Labor Economics 17: 168-97. Kruttschnitt, Candace. 2011. “Is the Devil in the Details?: Crafting Policy to Mitigate the Collateral Consequences of Parental Incarceration.” Criminology and Public Policy 10(3): 829-837. LaVigne, Nancy G. and Vera Kachnowski. 2003. A Portrait of Prisoner Reentry in Maryland. Washington, DC: Urban Institute. LaVigne, Nancy G. and Cynthia A. Mamalian. 2003. A Portrait of Prisoner Reentry in Illinois. Washington, DC: Urban Institute. La Vigne, Nancy G., and Gillian L. Thomson. 2003. “A Portrait of Prisoner Reentry in Ohio.” Washington, DC: Urban Institute. Leverentz, Andrea. 2014. The Ex-Prisoner’s Dilemma: How Women Negotiate Competing Narratives of Reentry and Desistance. New Brunswick, NJ: Rutgers University Press. Lopoo, Leonard M., and Bruce Western. 2005. “Incarceration and the Formation and Stability of Marital Unions.” Journal of Marriage and Family 67(3): 721-734.

26
Martin, Elizabeth, Denise Abreu, and Franklin Winters. 2001. “Money and Motive: Effects of Incentives on Panel Attrition in the Survey of Income and Program Participation.” Journal of Official Statistics 17: 267—284. Metraux, Stephen, Caterina G. Roman, and Richard S. Cho. 2007. “Incarceration and Homelessness.” Paper prepared for the National Symposium of Homelessness Research, March 1-2, Washington DC. Pettit, Becky. 2012. Invisible Men: Mass Incarceration and the Myth of Black Progress. New York: Russell Sage Foundation. Pettit, Becky, and Christopher Lyons. 2009. “Incarceration and the Legitimate Labor Market: Examining Age Graded Effects on Employment and Wages.” Law and Society Review 43(4): 725-756. Pager, Devah. 2003. “The Mark of a Criminal Record.” American Journal of Sociology 108 (5): 937-975. Reichman, Nancy E., Julien O. Teitler, Irwin Garfinkel, and Sara S. McLanahan. 2001. “Fragile Families: Sample and Design.” Children and Youth Services Review 23: 303-26. Teitler, Julien O., Nancy E. Reichman and Susan Sprachman. 2003. “Costs and Benefits of Improving Response Rates for a Hard-to-Reach Population.” The Public Opinion Quarterly 67(1): 126-138. Travis, Jeremy. 2005. But They All Come Back: Facing the Challenges of Prisoner Reentry. Washington DC: Urban Institute. Visher, Christy A. and Shannon M.E. Courtney. 2007. One Year Out: Experiences of Prisoners Returning to Cleveland. Washington, DC: Urban Institute. Visher, Christy A., Nancy LaVigne, and Jeremy Travis. 2004. Returning Home: Understanding the Challenges of Prisoner Reentry, Maryland Pilot Study: Findings from Baltimore. Washington DC: Urban Institute. Wakefield, Sara and Christopher Wildeman. 2013. Children of the Prison Boom: Mass Incarceration and the Future of the American Inequality. New York, NY: Oxford University Press. Wakefield, Sara and Christopher Uggen. 2010. “Incarceration and Stratification.” Annual Review of Sociology 36:387–406. Watson, Jamie, Amy L. Solomon, Nancy G. LaVigne, and Jeremy Travis. 2004. “A Portrait of Prisoner Reentry in Texas.” Washington, DC: Urban Institute.
27
Western, Bruce. 2002. “The Impact of Incarceration on Wage Mobility and Inequality.” American Sociological Review 67:477-498. Western, Bruce. 2006. Punishment and Inequality in America. New York: Russell Sage Foundation. Western, Bruce, Anthony Braga, Jaclyn Davis, and Catherine Sirois. 2014. “The Stress and Hardship of Leaving Prison.” Under review. Wildeman, Christopher and Christopher Muller. 2012. “Mass Imprisonment and Inequality in Health and Family Life.” Annual Review of Law and Social Science 8:11–30. Wildeman, Christopher and Bruce Western. 2010. “Incarceration in Fragile Families.” Future of Children 20:157–177.