a look at smart grid’s progress and - emmos and outlook for smart grid... · a look at smart...
TRANSCRIPT
A Look at Smart Grid’s Progress and Future
– An Industry Researcher’s Perspective
Prepared for EMMOS 2014 by
Chuck Newton, President
Newton-Evans Research Company
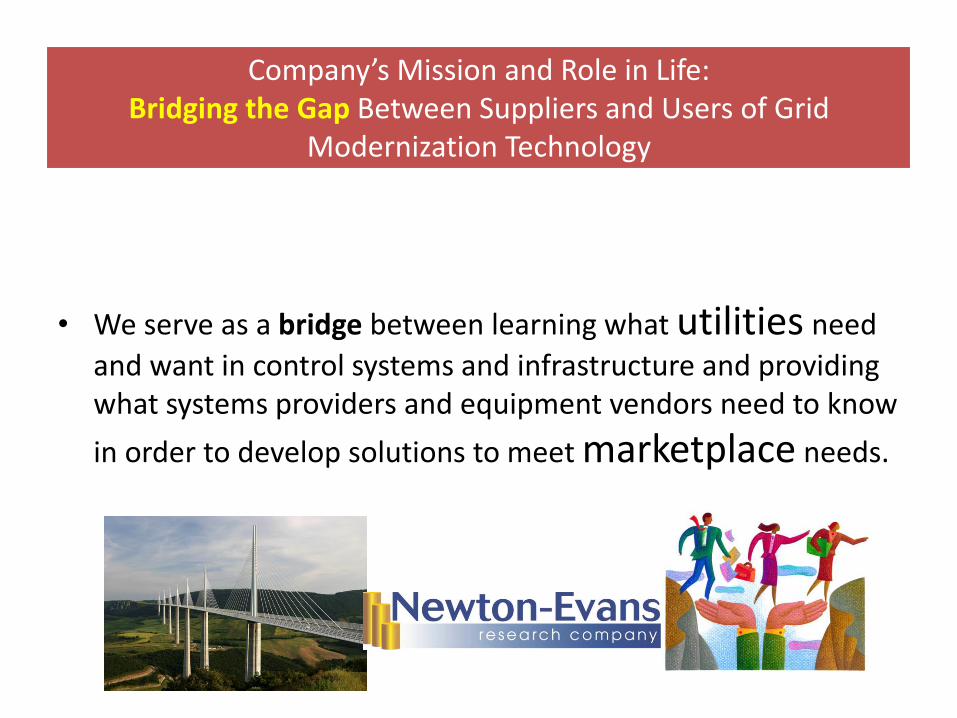
• We serve as a bridge between learning what utilities need
and want in control systems and infrastructure and providing what systems providers and equipment vendors need to know
in order to develop solutions to meet marketplace needs.
Company’s Mission and Role in Life: Bridging the Gap Between Suppliers and Users of Grid
Modernization Technology
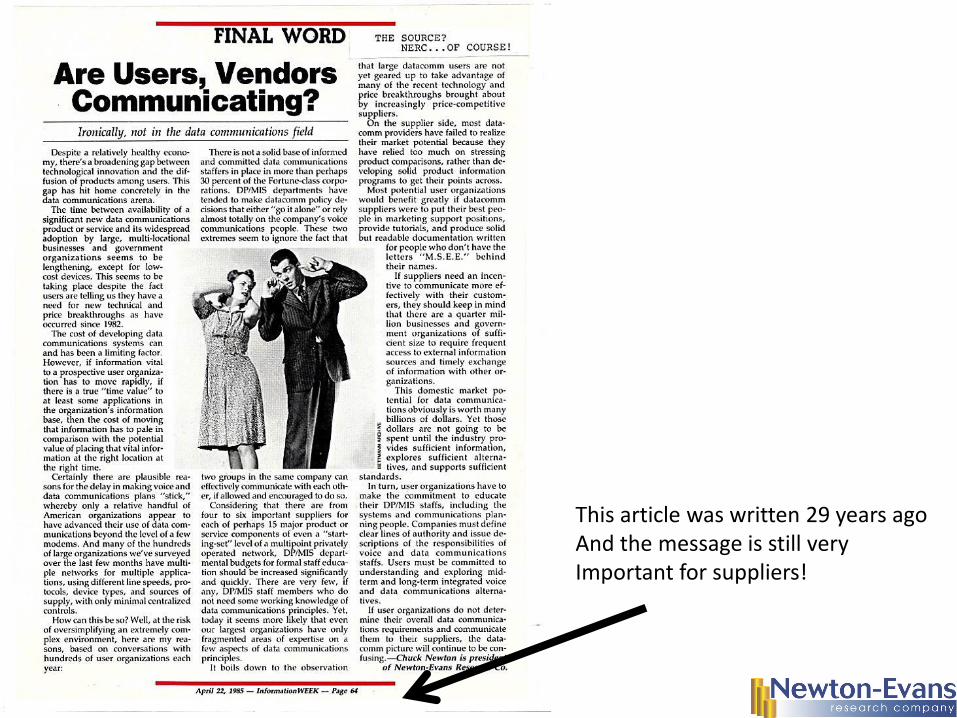
This article was written 29 years ago And the message is still very Important for suppliers!
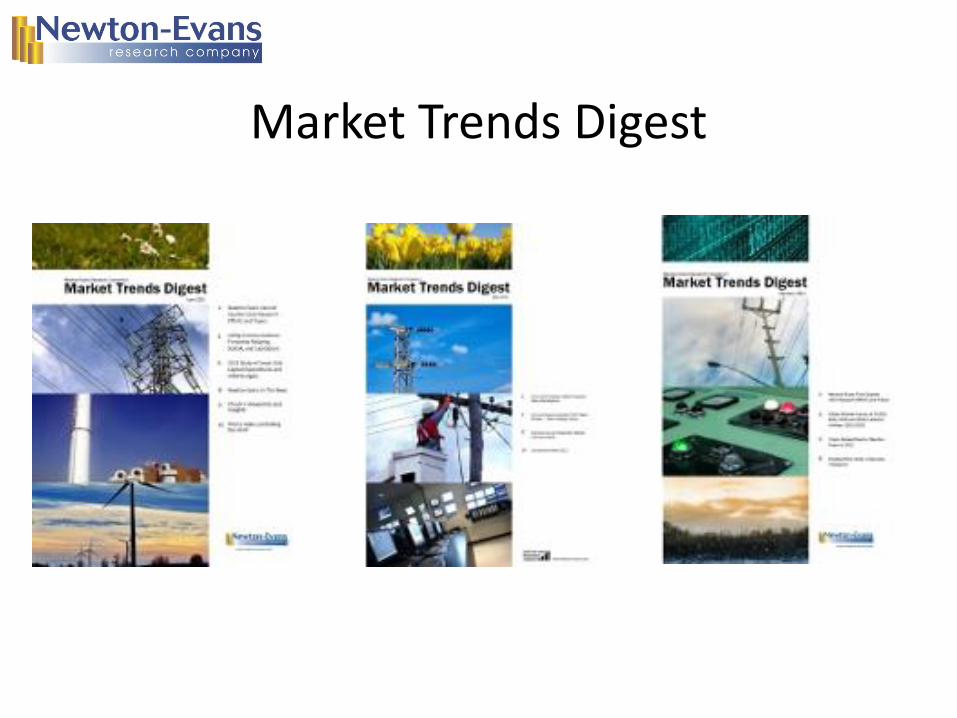
Market Trends Digest
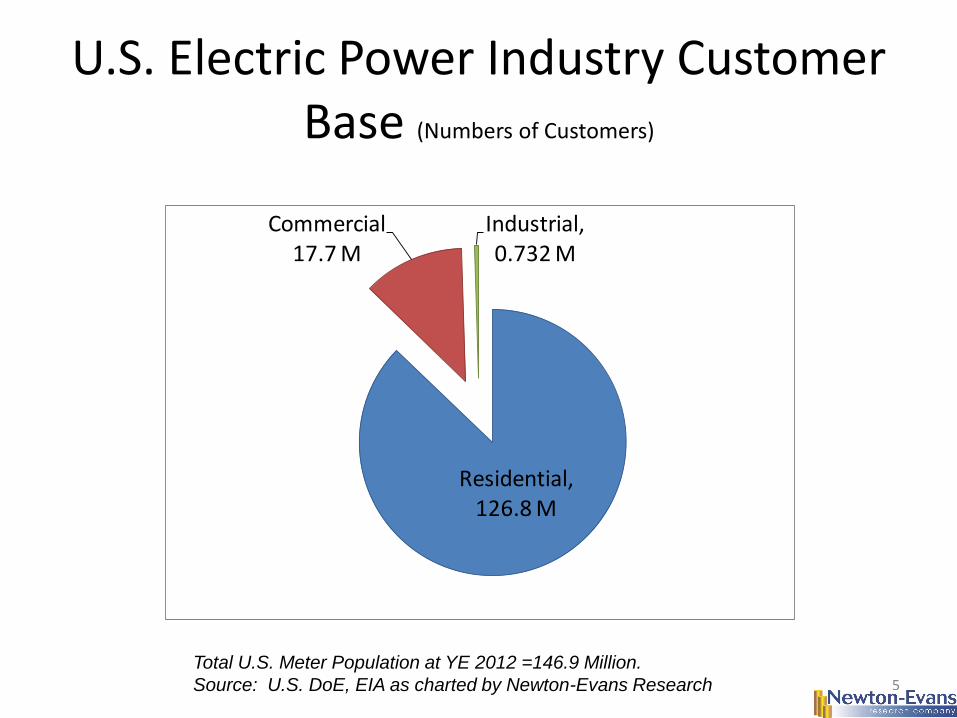
U.S. Electric Power Industry Customer Base (Numbers of Customers)
5
Residential, 126.8 M
Commercial 17.7 M
Industrial, 0.732 M
Total U.S. Meter Population at YE 2012 =146.9 Million.
Source: U.S. DoE, EIA as charted by Newton-Evans Research
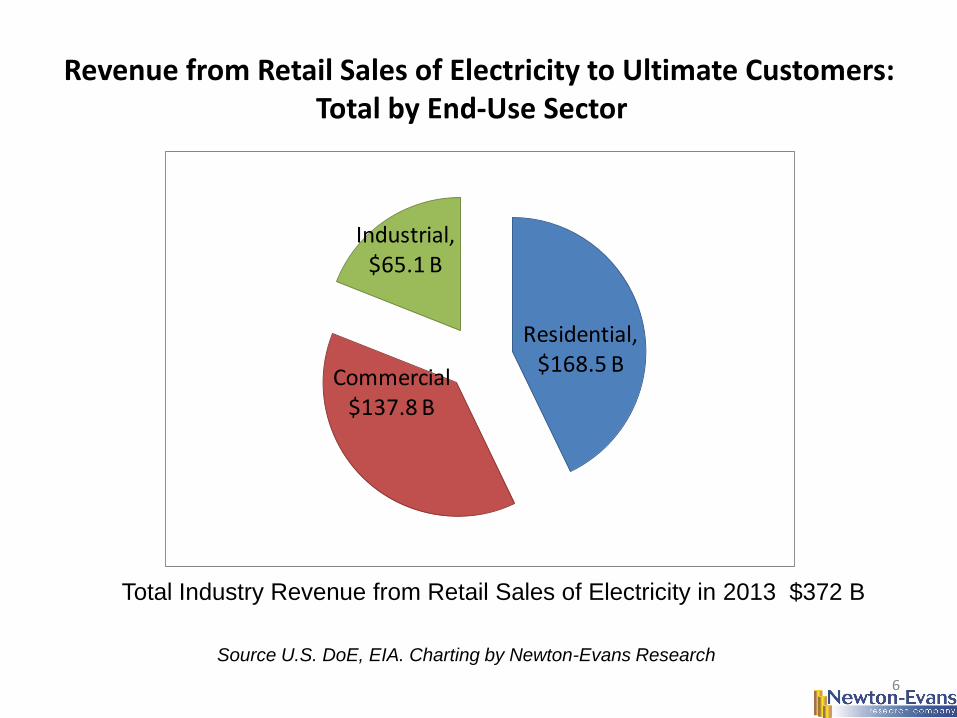
Revenue from Retail Sales of Electricity to Ultimate Customers: Total by End-Use Sector
6
Residential, $168.5 B
Commercial $137.8 B
Industrial, $65.1 B
Total Industry Revenue from Retail Sales of Electricity in 2013 $372 B
Source U.S. DoE, EIA. Charting by Newton-Evans Research
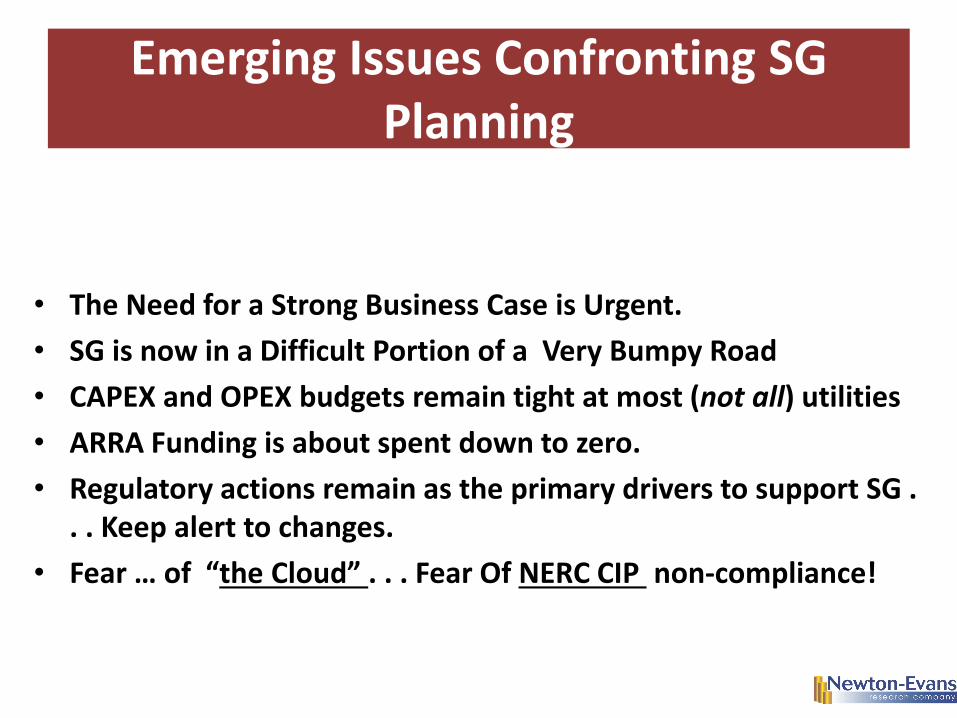
• The Need for a Strong Business Case is Urgent.
• SG is now in a Difficult Portion of a Very Bumpy Road
• CAPEX and OPEX budgets remain tight at most (not all) utilities
• ARRA Funding is about spent down to zero.
• Regulatory actions remain as the primary drivers to support SG . . . Keep alert to changes.
• Fear … of “the Cloud” . . . Fear Of NERC CIP non-compliance!
Emerging Issues Confronting SG Planning
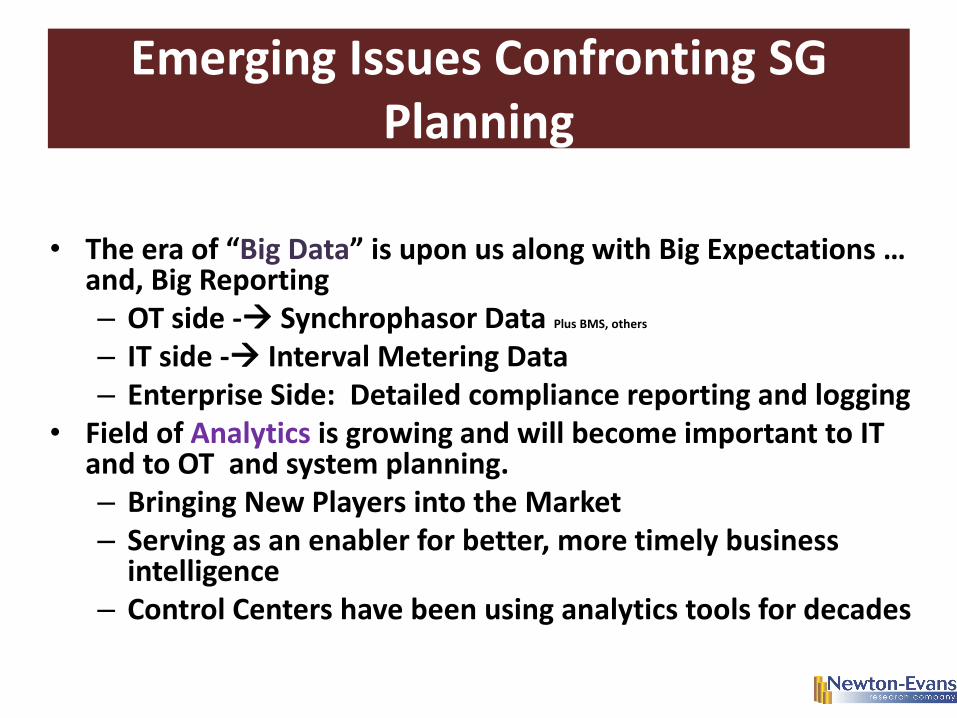
• The era of “Big Data” is upon us along with Big Expectations … and, Big Reporting – OT side - Synchrophasor Data Plus BMS, others
– IT side - Interval Metering Data – Enterprise Side: Detailed compliance reporting and logging
• Field of Analytics is growing and will become important to IT and to OT and system planning. – Bringing New Players into the Market – Serving as an enabler for better, more timely business
intelligence – Control Centers have been using analytics tools for decades
Emerging Issues Confronting SG Planning
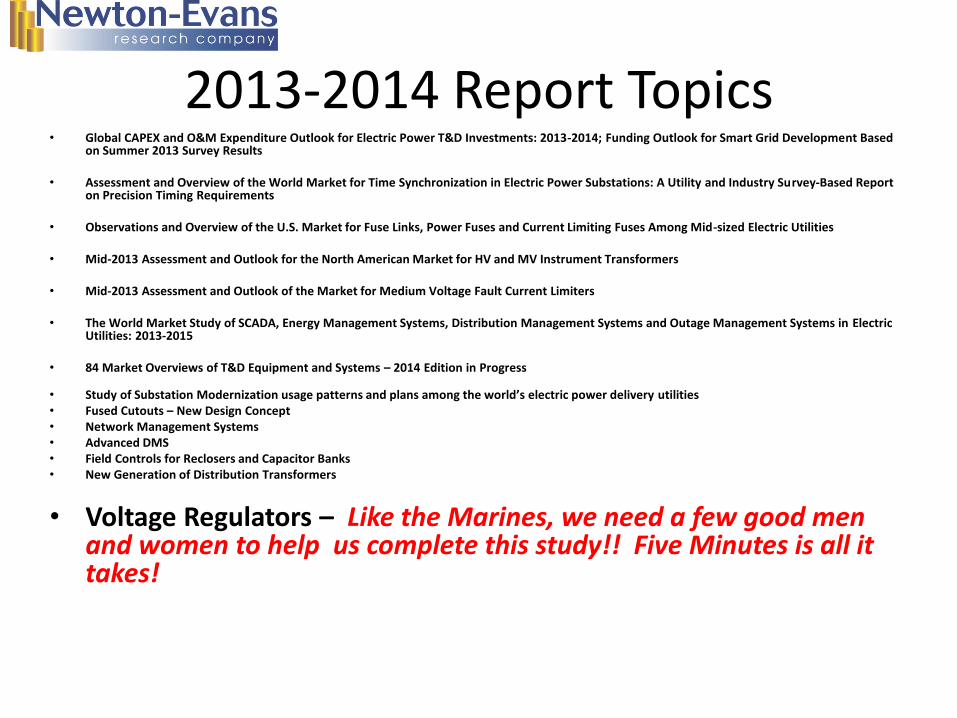
2013-2014 Report Topics • Global CAPEX and O&M Expenditure Outlook for Electric Power T&D Investments: 2013-2014; Funding Outlook for Smart Grid Development Based
on Summer 2013 Survey Results • Assessment and Overview of the World Market for Time Synchronization in Electric Power Substations: A Utility and Industry Survey-Based Report
on Precision Timing Requirements
• Observations and Overview of the U.S. Market for Fuse Links, Power Fuses and Current Limiting Fuses Among Mid-sized Electric Utilities • Mid-2013 Assessment and Outlook for the North American Market for HV and MV Instrument Transformers • Mid-2013 Assessment and Outlook of the Market for Medium Voltage Fault Current Limiters
• The World Market Study of SCADA, Energy Management Systems, Distribution Management Systems and Outage Management Systems in Electric
Utilities: 2013-2015
• 84 Market Overviews of T&D Equipment and Systems – 2014 Edition in Progress
• Study of Substation Modernization usage patterns and plans among the world’s electric power delivery utilities • Fused Cutouts – New Design Concept • Network Management Systems • Advanced DMS • Field Controls for Reclosers and Capacitor Banks • New Generation of Distribution Transformers
• Voltage Regulators – Like the Marines, we need a few good men and women to help us complete this study!! Five Minutes is all it takes!
Key Observations from Recent Newton-Evans Research Programs and Studies Focused on
Operations and Engineering Topics • Newest Substation Study (released in March 2014) finds
utilities continuing to invest in Automation and Modernization upgrades.
• Recent CAPEX/OPEX Study also upbeat on spending outlook overall across nations.
• Manufacturing Capacity to build products and
integrate systems in most SG areas is strong – Key exception today is large-scale energy storage
across all segments
T&D Modernization Trends Affected by DoE’s Investments Program for Smart Grid
• From the 2009-2012 ARRA Smart Grid Investment Program,
(SGIP), there have been some important and continuing developments and trends in the modernization efforts for Transmission and Distribution Operations and Field Engineering: – We will look at the potential for
• Transmission DLR • Synchrophasor Deployments • T&D Control and Monitoring Systems • Distribution Automation Equipment • ADMS = Distribution Automation Platforms • Energy Storage Applications • Key Aspects of Metering Modernization (AMI, MDMS, HAN)
Role of Communications Standards in Smart Grid Developmentof
Communications Standards in Smart Grid Development
• DNP 3 as an IEEE Standard – Key North American Development
• IEC Standards for Substation Comms Critical Internationally. (61850, 60870 et al)
• Precision Timing Protocols – IEEE 1588
• Secure, Robust and Resilient: Hallmarks of a Smart Communications Network Design for the Smart Grid
• Multiple Tiers of communications architecture required
Role of Telecommunications
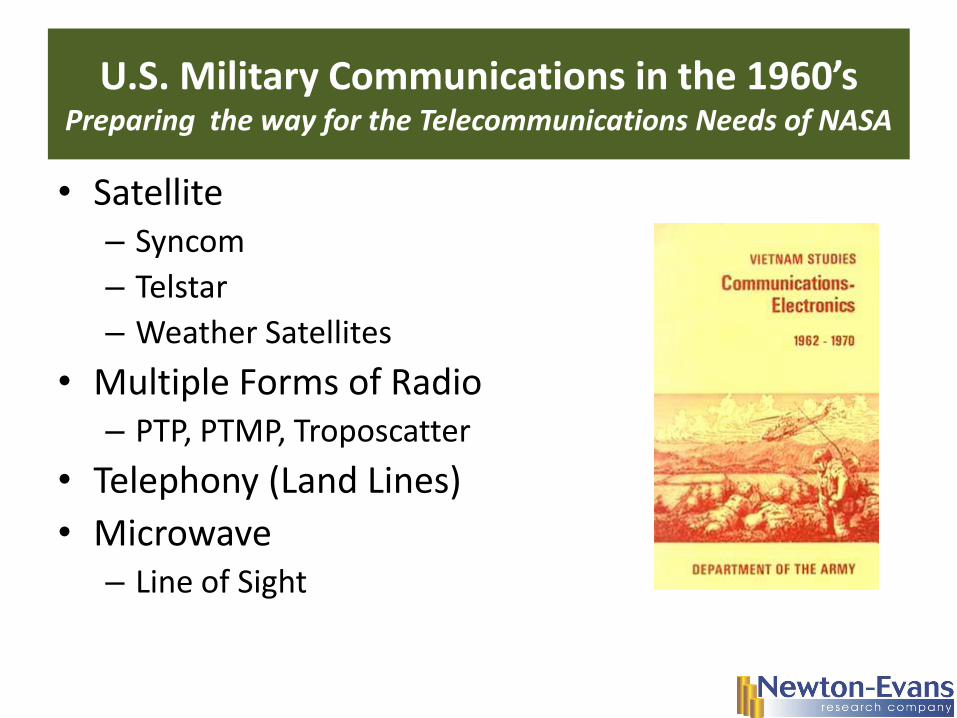
U.S. Military Communications in the 1960’s Preparing the way for the Telecommunications Needs of NASA
• Satellite – Syncom
– Telstar
– Weather Satellites
• Multiple Forms of Radio – PTP, PTMP, Troposcatter
• Telephony (Land Lines)
• Microwave – Line of Sight
Key Observations from Recent Newton-Evans Research Programs and Studies Focused on
Operations and Engineering Topics • Newest Substation Study (released in 1Q2014) finds
utilities continuing to invest in Automation and Modernization upgrades. – Most are able to stay within their 3 year plans for spending.
• Recent CAPEX/OPEX Study also somewhat upbeat on spending outlook overall.
• Manufacturing Capacity to build products and integrate
systems in most SG areas is strong – Key exception today is large-scale energy storage across
all segments
Role of Cyber Security in Smart Grid Development
Cyber Security: Still Time to Heed the Warning Signals
• The information being provided by government and regulatory officials in many Western and Asia-Pacific nations is indeed relevant to both aspects of grid security – cyber and physical.
• It seems that FERC has been keenly interested lately in physical security, while NERC, DOE, DHS, NIST and others are clearly focused on improving cyber-security and the White House promoting its own cyber-framework efforts.
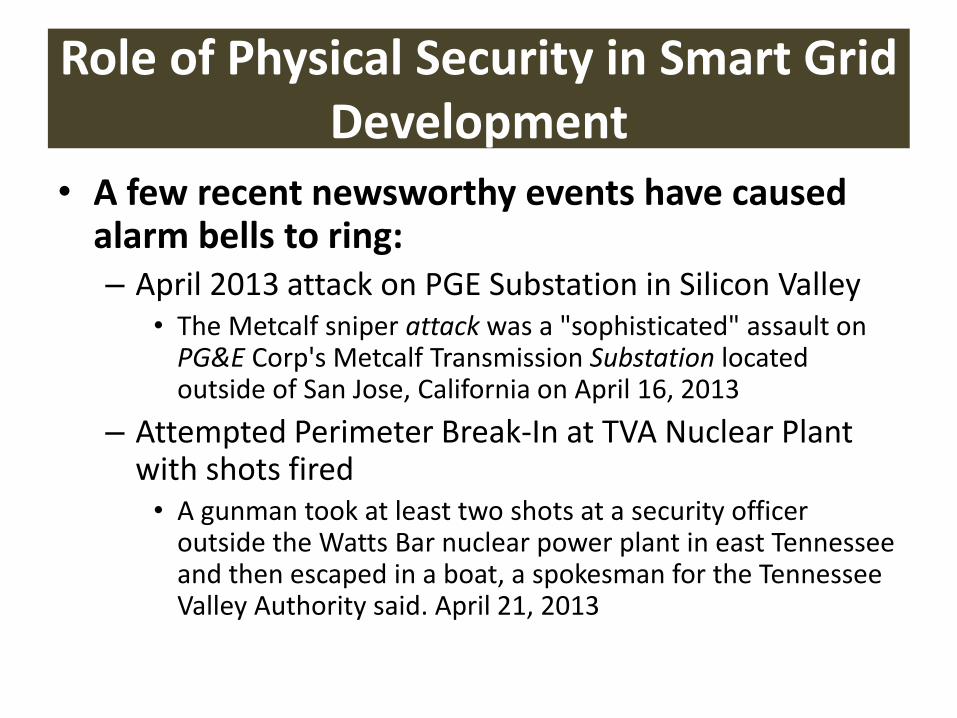
• A few recent newsworthy events have caused alarm bells to ring: – April 2013 attack on PGE Substation in Silicon Valley
• The Metcalf sniper attack was a "sophisticated" assault on PG&E Corp's Metcalf Transmission Substation located outside of San Jose, California on April 16, 2013
– Attempted Perimeter Break-In at TVA Nuclear Plant with shots fired • A gunman took at least two shots at a security officer
outside the Watts Bar nuclear power plant in east Tennessee and then escaped in a boat, a spokesman for the Tennessee Valley Authority said. April 21, 2013
Role of Physical Security in Smart Grid Development
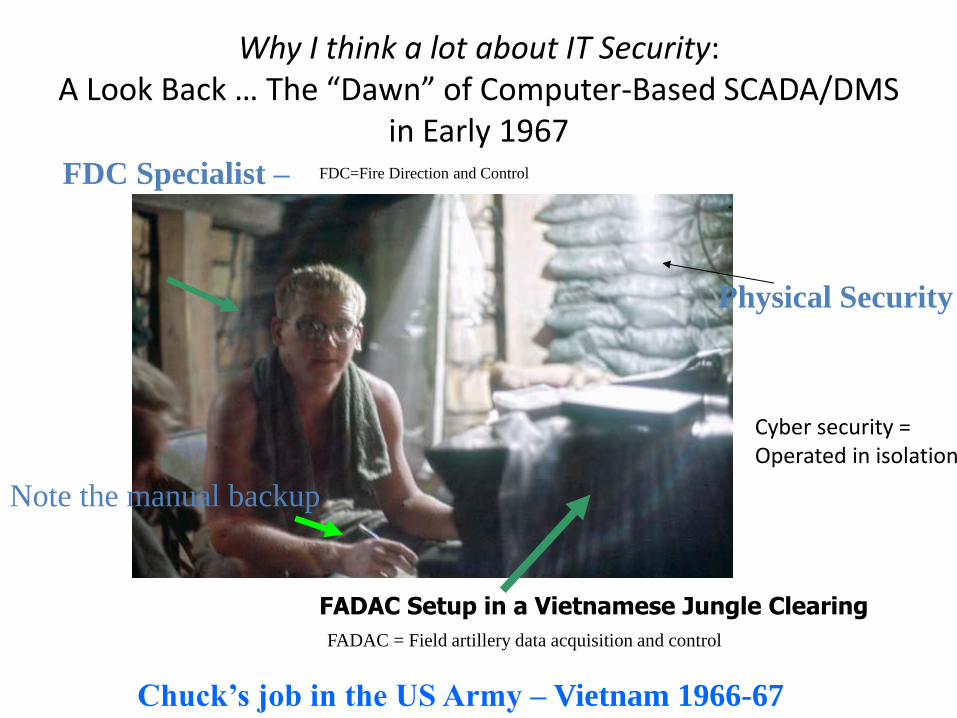
Why I think a lot about IT Security: A Look Back … The “Dawn” of Computer-Based SCADA/DMS
in Early 1967
FADAC Setup in a Vietnamese Jungle Clearing
FDC Specialist –
Note the manual backup
Physical Security
FADAC = Field artillery data acquisition and control
Chuck’s job in the US Army – Vietnam 1966-67
FDC=Fire Direction and Control
Cyber security = Operated in isolation
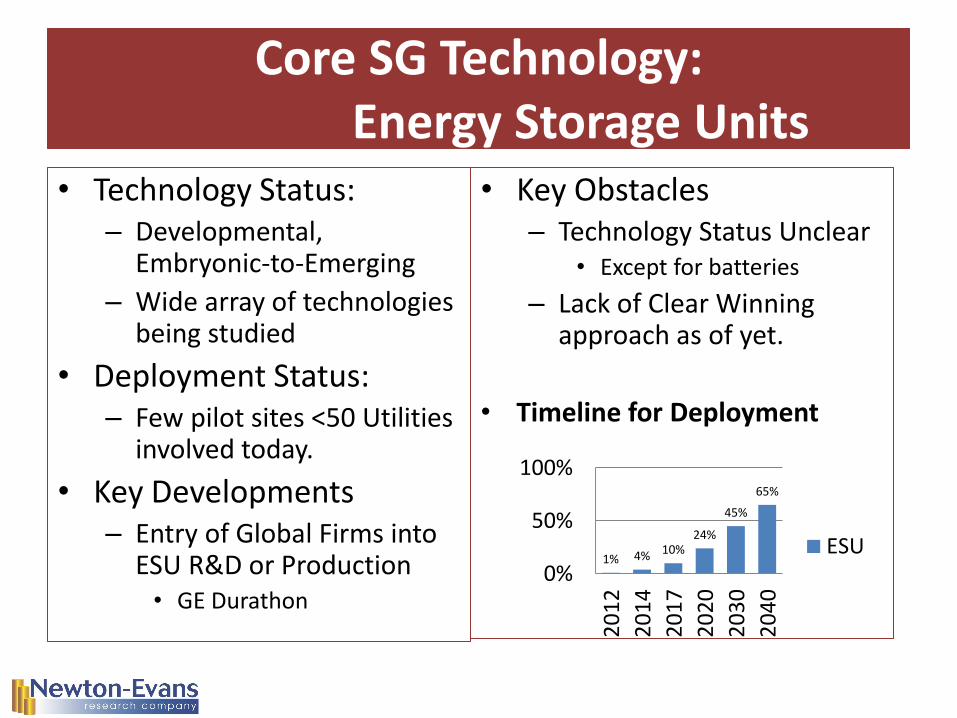
Core SG Technology: Energy Storage Units
• Technology Status: – Developmental,
Embryonic-to-Emerging
– Wide array of technologies being studied
• Deployment Status: – Few pilot sites <50 Utilities
involved today.
• Key Developments – Entry of Global Firms into
ESU R&D or Production • GE Durathon
• Key Obstacles – Technology Status Unclear
• Except for batteries
– Lack of Clear Winning approach as of yet.
• Timeline for Deployment
1% 4% 10% 24%
45%
65%
0%
50%
100%
20
12
20
14
20
17
20
20
20
30
20
40
ESU
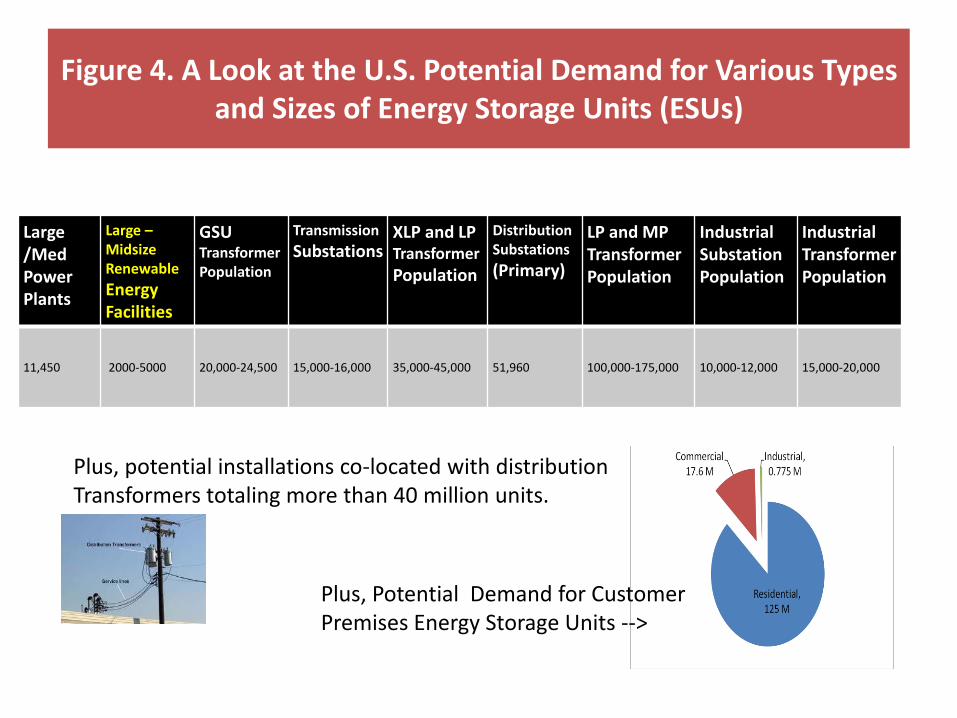
Large /Med Power Plants
Large –Midsize Renewable
Energy Facilities
GSU Transformer Population
Transmission
Substations XLP and LP Transformer
Population
Distribution Substations
(Primary)
LP and MP Transformer Population
Industrial Substation Population
Industrial Transformer Population
11,450 2000-5000 20,000-24,500 15,000-16,000 35,000-45,000 51,960 100,000-175,000 10,000-12,000 15,000-20,000
Figure 4. A Look at the U.S. Potential Demand for Various Types and Sizes of Energy Storage Units (ESUs)
Plus, Potential Demand for Customer Premises Energy Storage Units -->
Plus, potential installations co-located with distribution Transformers totaling more than 40 million units.
Dynamic Line Ratings
• A transmission grid’s power transfer capacity is not constant and is primarily controlled by three elements: stability, voltage limits, and thermal ratings Of the three, thermal ratings (Dynamic Line Ratings) represent the greatest opportunity to quickly, reliably and economically utilize the grid’s true capacity Dynamic Line Ratings can be used along with other Smart Grid technologies (FACTS, Security Analysis) to reliably optimize and manage the power transfer capacity of the grid in real time The more completely and accurately the grid capacity is known, in real time, the more effective and reliable the management of the Smart Grid will be .
Source: The Valley Group – Nexans
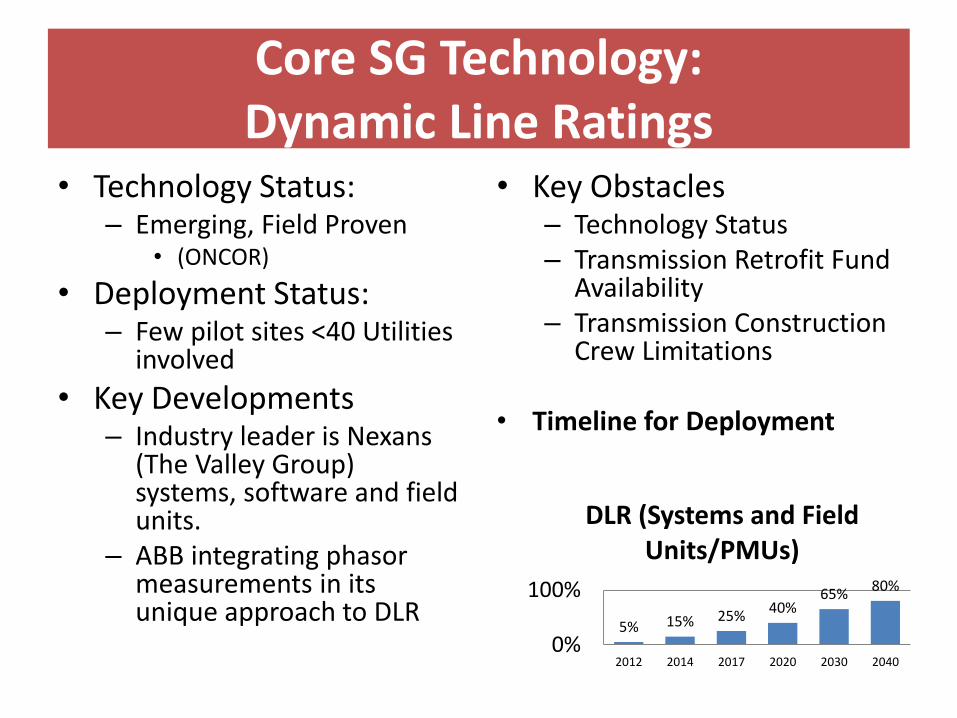
Core SG Technology: Dynamic Line Ratings
• Technology Status: – Emerging, Field Proven
• (ONCOR)
• Deployment Status: – Few pilot sites <40 Utilities
involved
• Key Developments – Industry leader is Nexans
(The Valley Group) systems, software and field units.
– ABB integrating phasor measurements in its unique approach to DLR
• Key Obstacles – Technology Status – Transmission Retrofit Fund
Availability – Transmission Construction
Crew Limitations
• Timeline for Deployment
5% 15% 25% 40%
65% 80%
0%
100%
2012 2014 2017 2020 2030 2040
DLR (Systems and Field Units/PMUs)
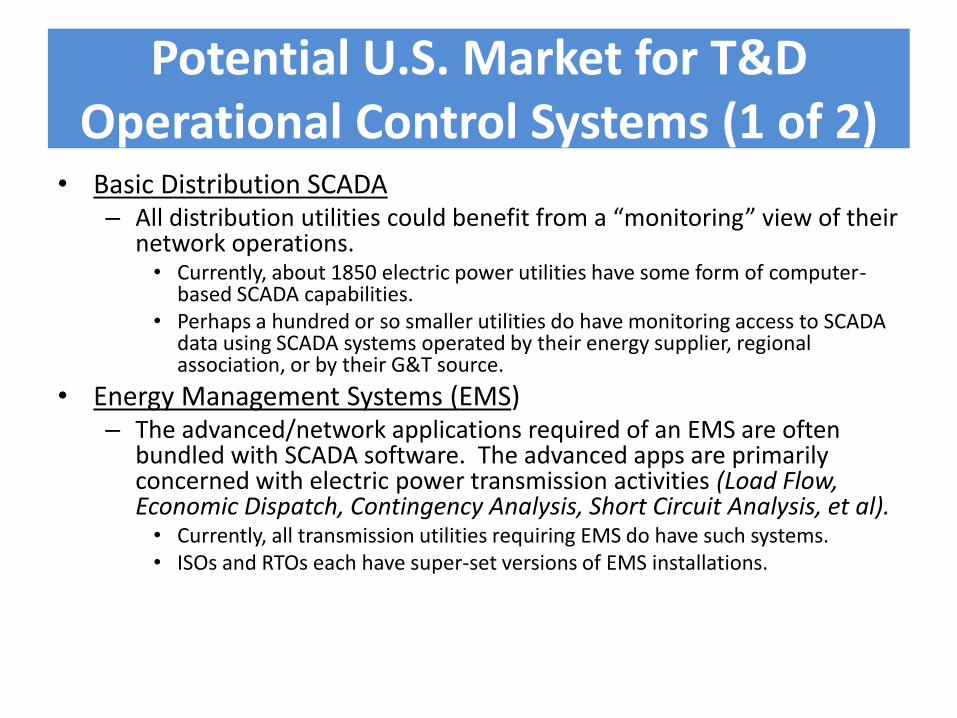
Potential U.S. Market for T&D Operational Control Systems (1 of 2)
• Basic Distribution SCADA – All distribution utilities could benefit from a “monitoring” view of their
network operations. • Currently, about 1850 electric power utilities have some form of computer-
based SCADA capabilities. • Perhaps a hundred or so smaller utilities do have monitoring access to SCADA
data using SCADA systems operated by their energy supplier, regional association, or by their G&T source.
• Energy Management Systems (EMS) – The advanced/network applications required of an EMS are often
bundled with SCADA software. The advanced apps are primarily concerned with electric power transmission activities (Load Flow, Economic Dispatch, Contingency Analysis, Short Circuit Analysis, et al). • Currently, all transmission utilities requiring EMS do have such systems. • ISOs and RTOs each have super-set versions of EMS installations.
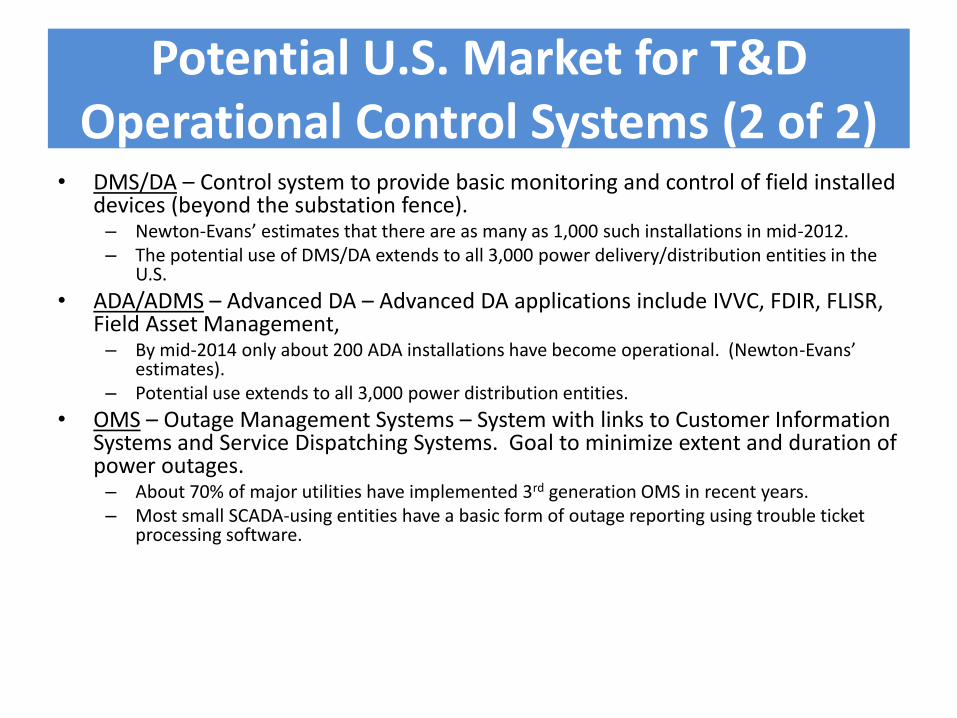
Potential U.S. Market for T&D Operational Control Systems (2 of 2)
• DMS/DA – Control system to provide basic monitoring and control of field installed devices (beyond the substation fence). – Newton-Evans’ estimates that there are as many as 1,000 such installations in mid-2012. – The potential use of DMS/DA extends to all 3,000 power delivery/distribution entities in the
U.S.
• ADA/ADMS – Advanced DA – Advanced DA applications include IVVC, FDIR, FLISR, Field Asset Management, – By mid-2014 only about 200 ADA installations have become operational. (Newton-Evans’
estimates). – Potential use extends to all 3,000 power distribution entities.
• OMS – Outage Management Systems – System with links to Customer Information Systems and Service Dispatching Systems. Goal to minimize extent and duration of power outages. – About 70% of major utilities have implemented 3rd generation OMS in recent years. – Most small SCADA-using entities have a basic form of outage reporting using trouble ticket
processing software.
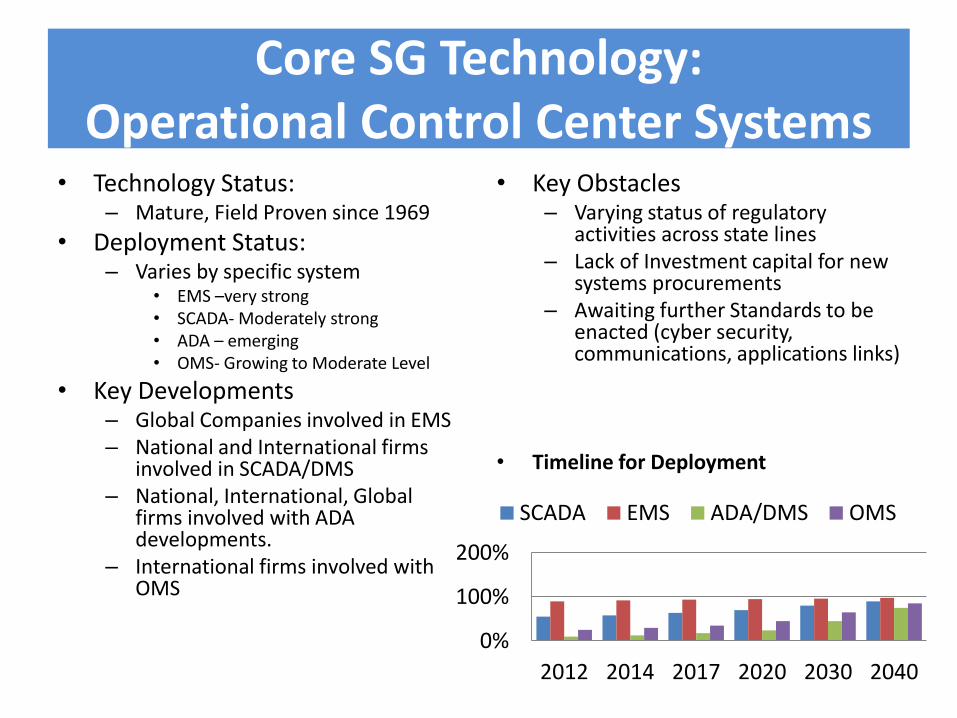
Core SG Technology: Operational Control Center Systems
• Technology Status: – Mature, Field Proven since 1969
• Deployment Status: – Varies by specific system
• EMS –very strong • SCADA- Moderately strong • ADA – emerging • OMS- Growing to Moderate Level
• Key Developments – Global Companies involved in EMS – National and International firms
involved in SCADA/DMS – National, International, Global
firms involved with ADA developments.
– International firms involved with OMS
• Key Obstacles – Varying status of regulatory
activities across state lines – Lack of Investment capital for new
systems procurements – Awaiting further Standards to be
enacted (cyber security, communications, applications links)
• Timeline for Deployment
0%
100%
200%
2012 2014 2017 2020 2030 2040
SCADA EMS ADA/DMS OMS
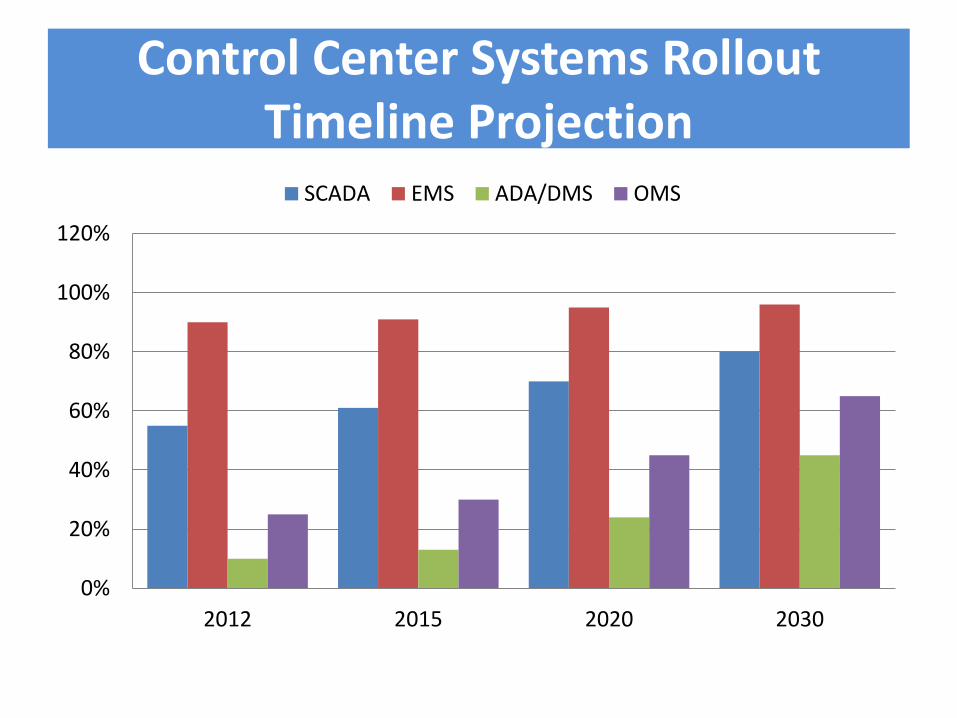
Control Center Systems Rollout Timeline Projection
0%
20%
40%
60%
80%
100%
120%
2012 2015 2020 2030
SCADA EMS ADA/DMS OMS
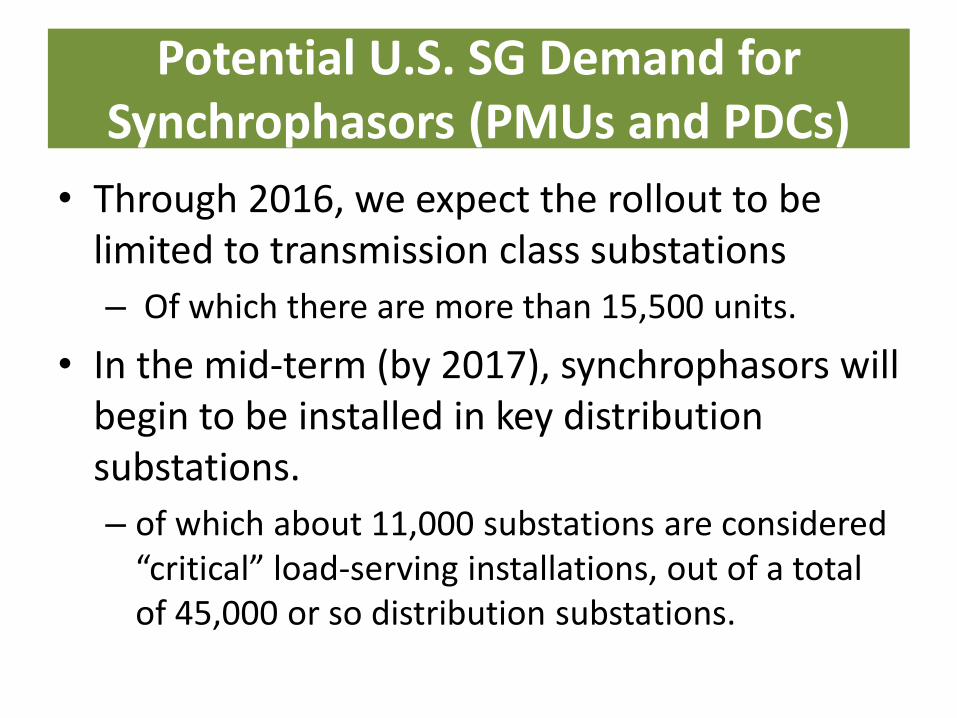
Potential U.S. SG Demand for Synchrophasors (PMUs and PDCs)
• Through 2016, we expect the rollout to be limited to transmission class substations
– Of which there are more than 15,500 units.
• In the mid-term (by 2017), synchrophasors will begin to be installed in key distribution substations.
– of which about 11,000 substations are considered “critical” load-serving installations, out of a total of 45,000 or so distribution substations.
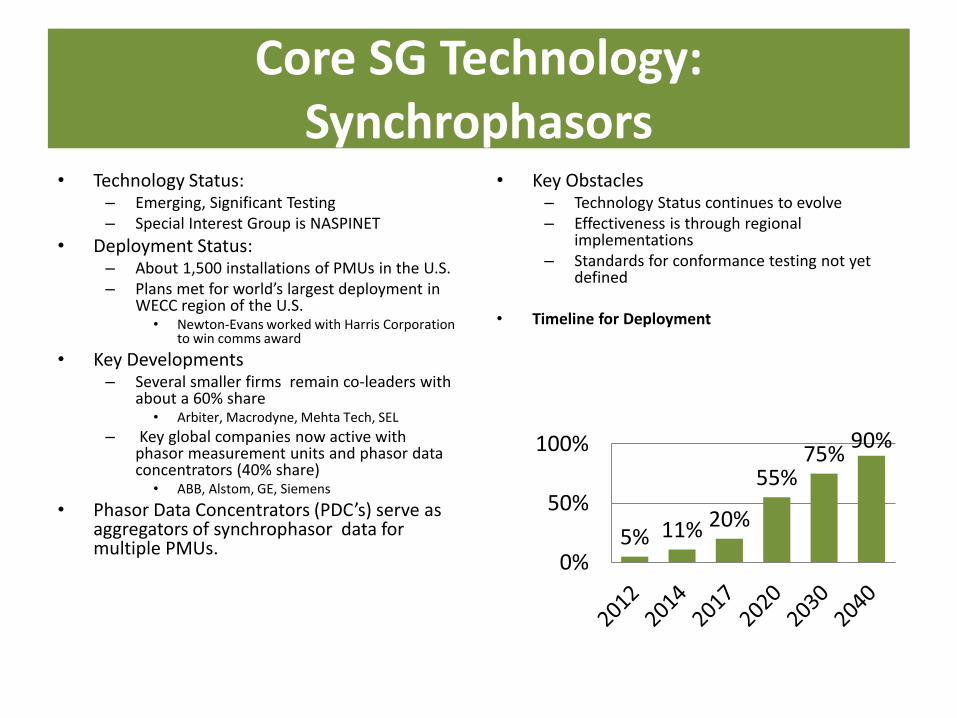
Core SG Technology: Synchrophasors
• Technology Status: – Emerging, Significant Testing – Special Interest Group is NASPINET
• Deployment Status: – About 1,500 installations of PMUs in the U.S. – Plans met for world’s largest deployment in
WECC region of the U.S. • Newton-Evans worked with Harris Corporation
to win comms award
• Key Developments – Several smaller firms remain co-leaders with
about a 60% share • Arbiter, Macrodyne, Mehta Tech, SEL
– Key global companies now active with phasor measurement units and phasor data concentrators (40% share)
• ABB, Alstom, GE, Siemens
• Phasor Data Concentrators (PDC’s) serve as aggregators of synchrophasor data for multiple PMUs.
• Key Obstacles – Technology Status continues to evolve – Effectiveness is through regional
implementations – Standards for conformance testing not yet
defined
• Timeline for Deployment
5% 11% 20%
55% 75%
90%
0%
50%
100%
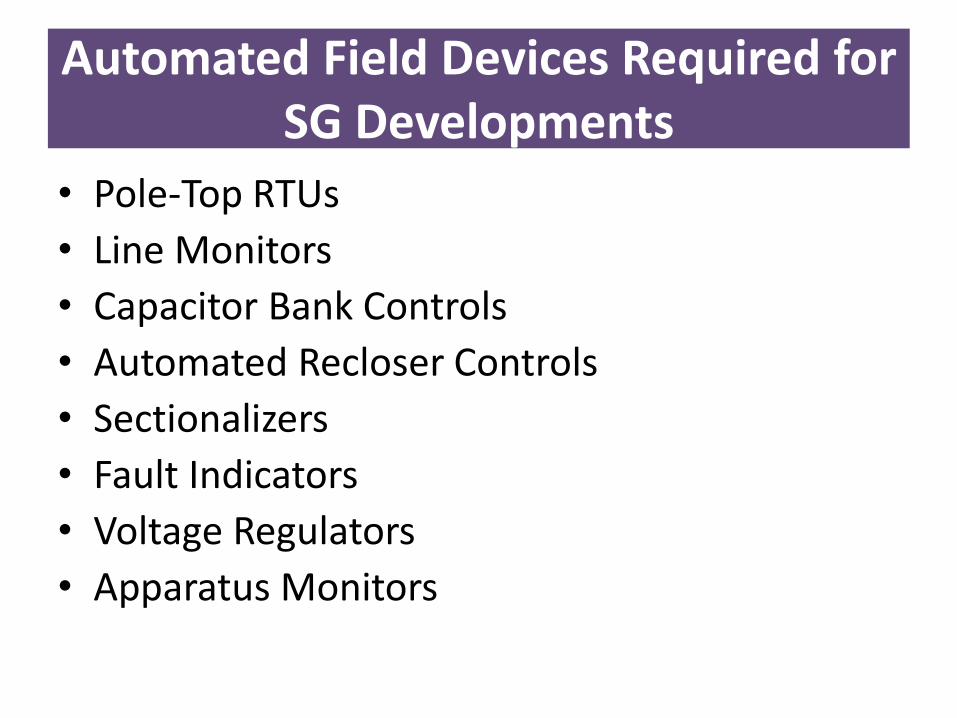
Automated Field Devices Required for SG Developments
• Pole-Top RTUs
• Line Monitors
• Capacitor Bank Controls
• Automated Recloser Controls
• Sectionalizers
• Fault Indicators
• Voltage Regulators
• Apparatus Monitors
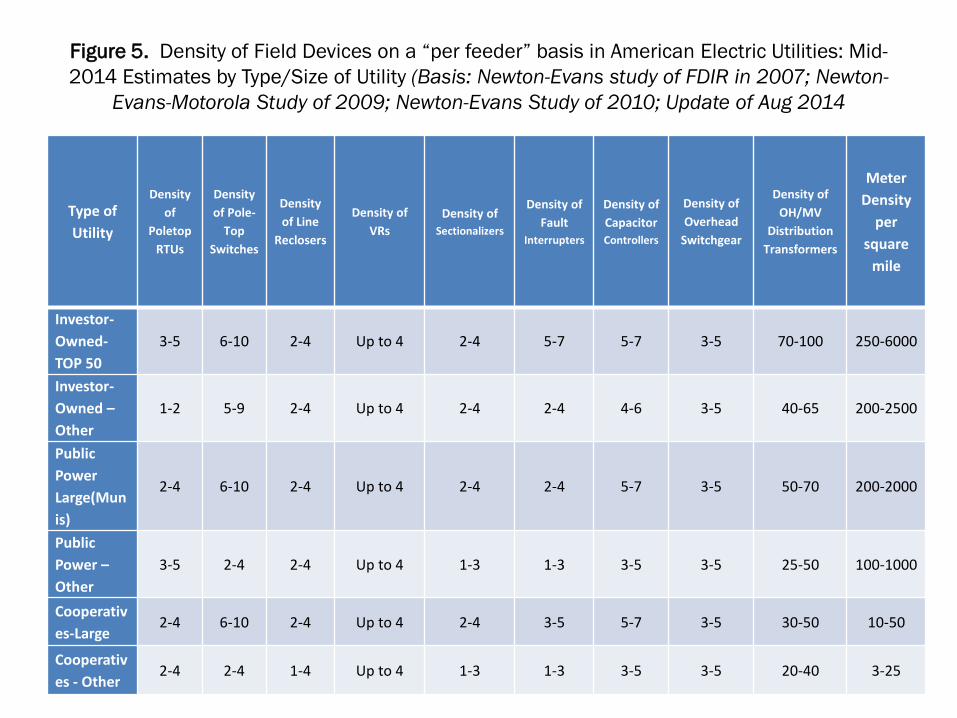
Figure 5. Density of Field Devices on a “per feeder” basis in American Electric Utilities: Mid-
2014 Estimates by Type/Size of Utility (Basis: Newton-Evans study of FDIR in 2007; Newton-
Evans-Motorola Study of 2009; Newton-Evans Study of 2010; Update of Aug 2014
Type of
Utility
Density
of
Poletop
RTUs
Density
of Pole-
Top
Switches
Density
of Line
Reclosers
Density of
VRs
Density of
Sectionalizers
Density of
Fault
Interrupters
Density of
Capacitor
Controllers
Density of
Overhead
Switchgear
Density of
OH/MV
Distribution
Transformers
Meter
Density
per
square
mile
Investor-
Owned-
TOP 50
3-5 6-10 2-4 Up to 4 2-4 5-7 5-7 3-5 70-100 250-6000
Investor-
Owned –
Other
1-2 5-9 2-4 Up to 4 2-4 2-4 4-6 3-5 40-65 200-2500
Public
Power
Large(Mun
is)
2-4 6-10 2-4 Up to 4 2-4 2-4 5-7 3-5 50-70 200-2000
Public
Power –
Other
3-5 2-4 2-4 Up to 4 1-3 1-3 3-5 3-5 25-50 100-1000
Cooperativ
es-Large 2-4 6-10 2-4 Up to 4 2-4 3-5 5-7 3-5 30-50 10-50
Cooperativ
es - Other 2-4 2-4 1-4 Up to 4 1-3 1-3 3-5 3-5 20-40 3-25
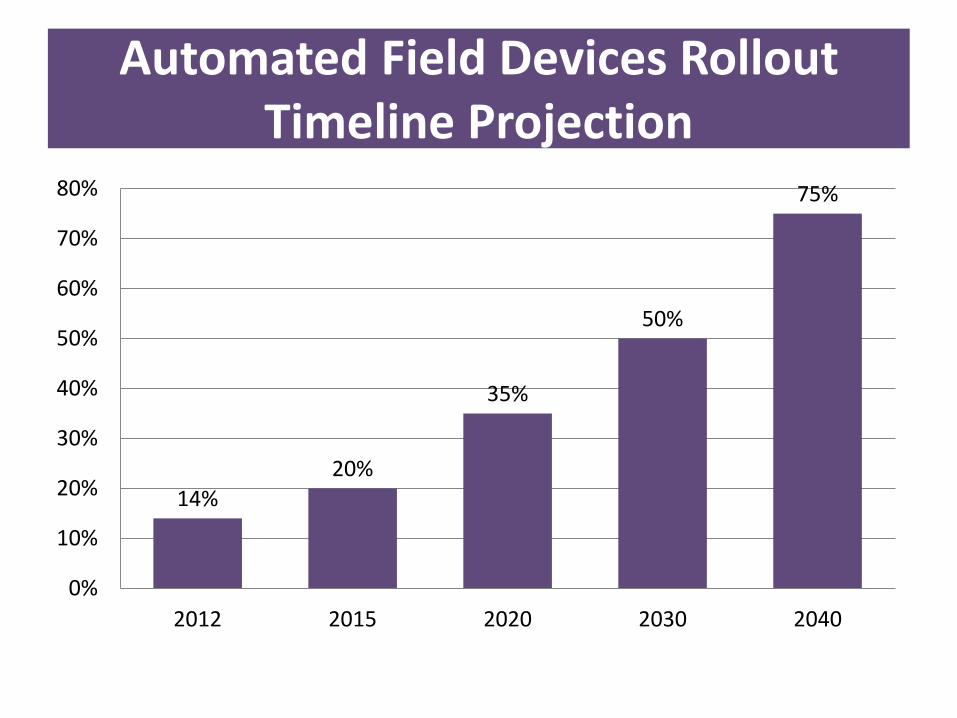
Automated Field Devices Rollout Timeline Projection
14%
20%
35%
50%
75%
0%
10%
20%
30%
40%
50%
60%
70%
80%
2012 2015 2020 2030 2040
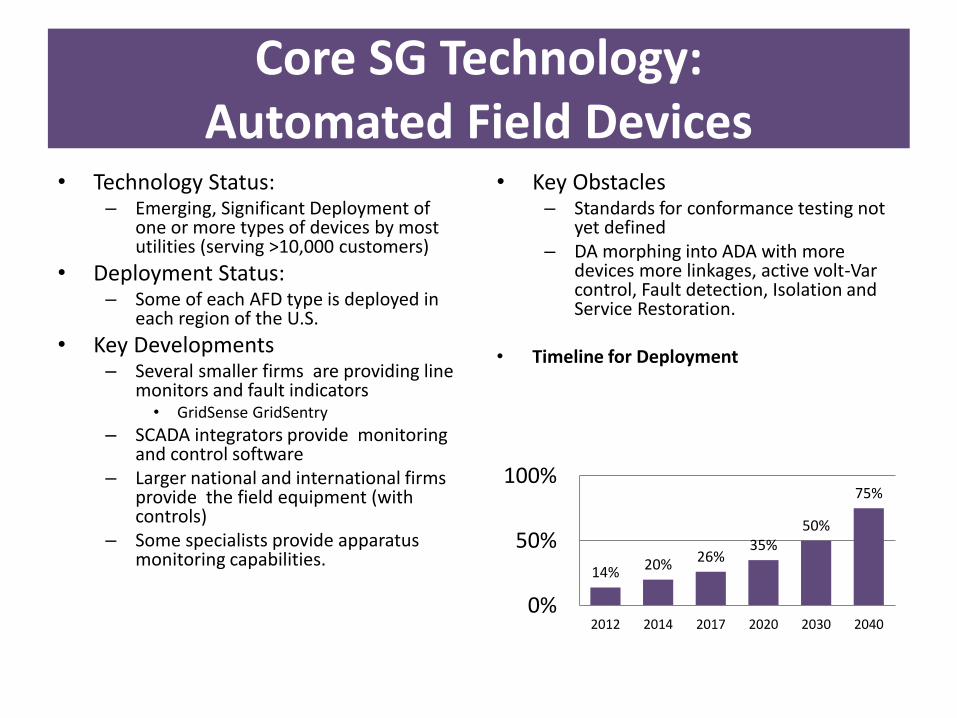
Core SG Technology: Automated Field Devices
• Technology Status: – Emerging, Significant Deployment of
one or more types of devices by most utilities (serving >10,000 customers)
• Deployment Status: – Some of each AFD type is deployed in
each region of the U.S.
• Key Developments – Several smaller firms are providing line
monitors and fault indicators • GridSense GridSentry
– SCADA integrators provide monitoring and control software
– Larger national and international firms provide the field equipment (with controls)
– Some specialists provide apparatus monitoring capabilities.
• Key Obstacles – Standards for conformance testing not
yet defined – DA morphing into ADA with more
devices more linkages, active volt-Var control, Fault detection, Isolation and Service Restoration.
• Timeline for Deployment
14% 20% 26% 35%
50%
75%
0%
50%
100%
2012 2014 2017 2020 2030 2040
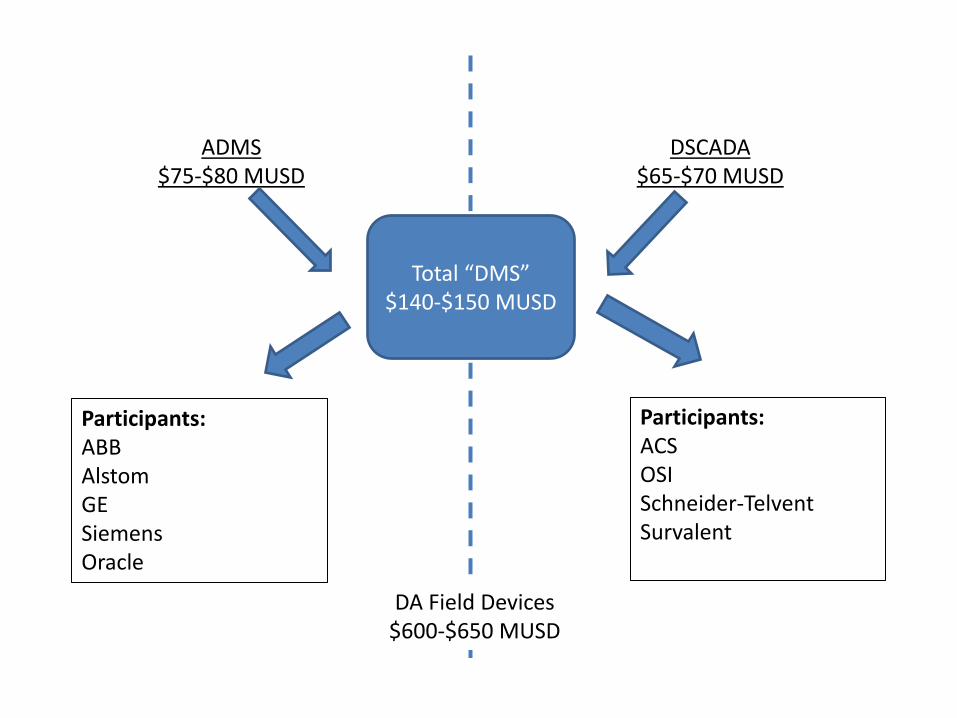
Total “DMS” $140-$150 MUSD
ADMS $75-$80 MUSD
DSCADA $65-$70 MUSD
Participants: ACS OSI Schneider-Telvent Survalent
Participants: ABB Alstom GE Siemens Oracle
DA Field Devices $600-$650 MUSD
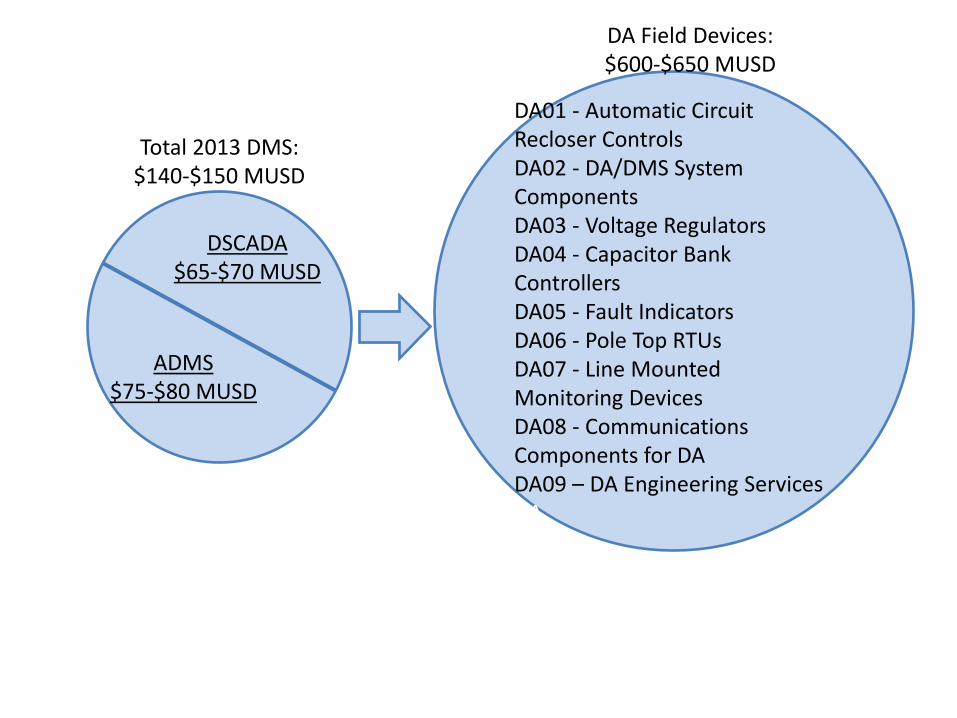
ADMS $75-$80 MUSD
DSCADA $65-$70 MUSD
Total 2013 DMS: $140-$150 MUSD
DA01 - Automatic Circuit Recloser Controls DA02 - DA/DMS System Components DA03 - Voltage Regulators DA04 - Capacitor Bank Controllers DA05 - Fault Indicators DA06 - Pole Top RTUs DA07 - Line Mounted Monitoring Devices DA08 - Communications Components for DA DA09 – DA Engineering Services DA
DA Field Devices: $600-$650 MUSD
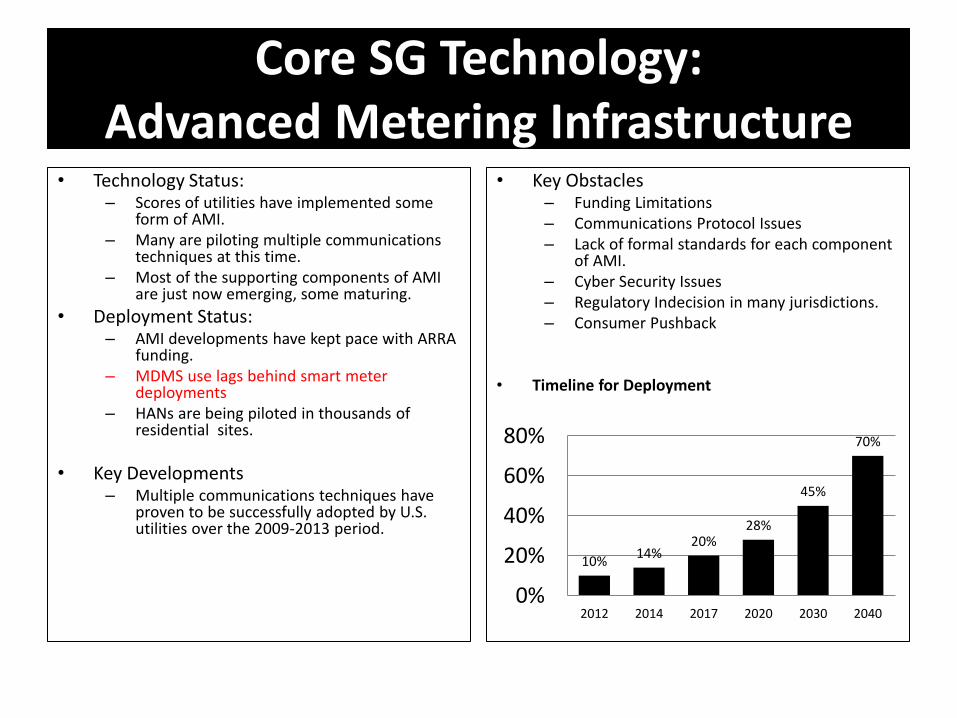
Core SG Technology: Advanced Metering Infrastructure
• Technology Status: – Scores of utilities have implemented some
form of AMI. – Many are piloting multiple communications
techniques at this time. – Most of the supporting components of AMI
are just now emerging, some maturing.
• Deployment Status: – AMI developments have kept pace with ARRA
funding. – MDMS use lags behind smart meter
deployments – HANs are being piloted in thousands of
residential sites.
• Key Developments – Multiple communications techniques have
proven to be successfully adopted by U.S. utilities over the 2009-2013 period.
• Key Obstacles – Funding Limitations – Communications Protocol Issues – Lack of formal standards for each component
of AMI. – Cyber Security Issues – Regulatory Indecision in many jurisdictions. – Consumer Pushback
• Timeline for Deployment
10% 14%
20% 28%
45%
70%
0%
20%
40%
60%
80%
2012 2014 2017 2020 2030 2040
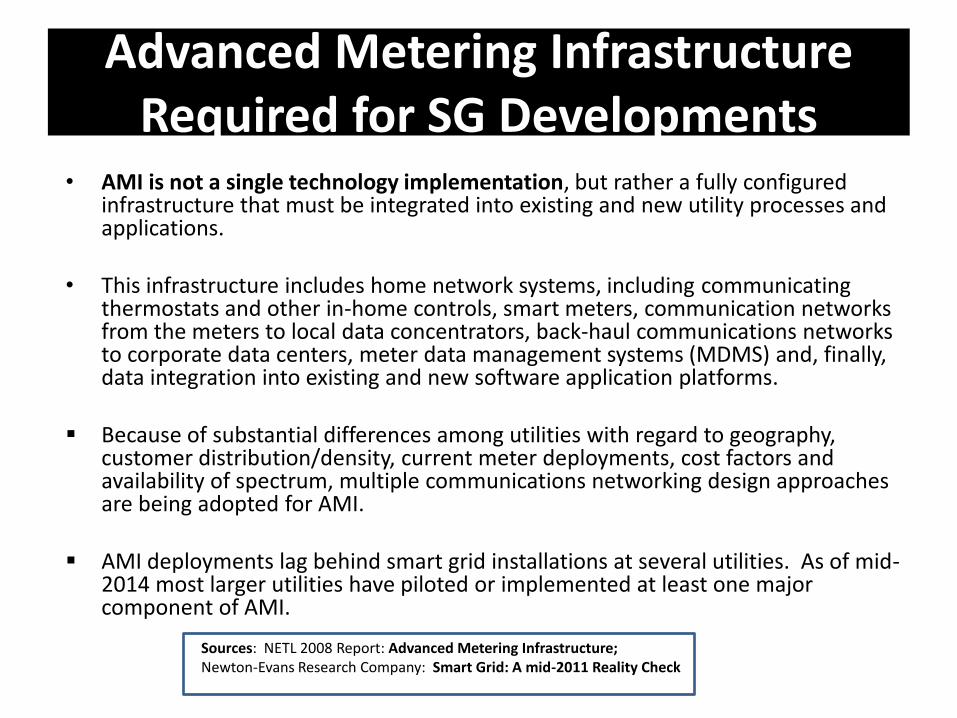
Advanced Metering Infrastructure Required for SG Developments
• AMI is not a single technology implementation, but rather a fully configured infrastructure that must be integrated into existing and new utility processes and applications.
• This infrastructure includes home network systems, including communicating thermostats and other in-home controls, smart meters, communication networks from the meters to local data concentrators, back-haul communications networks to corporate data centers, meter data management systems (MDMS) and, finally, data integration into existing and new software application platforms.
Because of substantial differences among utilities with regard to geography, customer distribution/density, current meter deployments, cost factors and availability of spectrum, multiple communications networking design approaches are being adopted for AMI.
AMI deployments lag behind smart grid installations at several utilities. As of mid-2014 most larger utilities have piloted or implemented at least one major component of AMI.
Sources: NETL 2008 Report: Advanced Metering Infrastructure; Newton-Evans Research Company: Smart Grid: A mid-2011 Reality Check
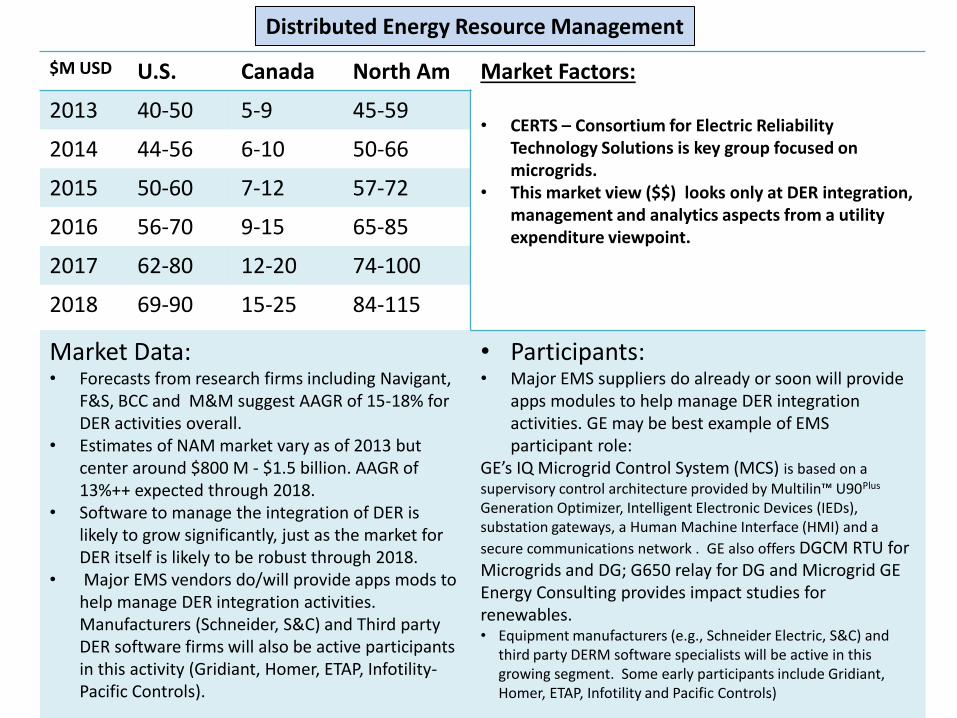
Distributed Energy Resource Management
$M USD U.S. Canada North Am Market Factors:
• CERTS – Consortium for Electric Reliability Technology Solutions is key group focused on microgrids.
• This market view ($$) looks only at DER integration, management and analytics aspects from a utility expenditure viewpoint.
2013 40-50 5-9 45-59
2014 44-56 6-10 50-66
2015 50-60 7-12 57-72
2016 56-70 9-15 65-85
2017 62-80 12-20 74-100
2018 69-90 15-25 84-115
Market Data: • Forecasts from research firms including Navigant,
F&S, BCC and M&M suggest AAGR of 15-18% for DER activities overall.
• Estimates of NAM market vary as of 2013 but center around $800 M - $1.5 billion. AAGR of 13%++ expected through 2018.
• Software to manage the integration of DER is likely to grow significantly, just as the market for DER itself is likely to be robust through 2018.
• Major EMS vendors do/will provide apps mods to help manage DER integration activities. Manufacturers (Schneider, S&C) and Third party DER software firms will also be active participants in this activity (Gridiant, Homer, ETAP, Infotility-Pacific Controls).
• Participants: • Major EMS suppliers do already or soon will provide
apps modules to help manage DER integration activities. GE may be best example of EMS participant role:
GE’s IQ Microgrid Control System (MCS) is based on a supervisory control architecture provided by Multilin™ U90Plus Generation Optimizer, Intelligent Electronic Devices (IEDs), substation gateways, a Human Machine Interface (HMI) and a
secure communications network . GE also offers DGCM RTU for Microgrids and DG; G650 relay for DG and Microgrid GE Energy Consulting provides impact studies for renewables. • Equipment manufacturers (e.g., Schneider Electric, S&C) and
third party DERM software specialists will be active in this growing segment. Some early participants include Gridiant, Homer, ETAP, Infotility and Pacific Controls)
A Look at Smart Grid’s Progress and Future
– An Industry Researcher’s Perspective
Charles W. Newton, President Newton-Evans Research Company
Thanks for Sitting In!