a look to the future - cibcwm.comresearch.cibcwm.com/.../a_look_to_the_future_2013.pdf · cibc a...
TRANSCRIPT

2013 Edition
A Look to the Future

CIBC A Look to the Future – 2013 Edition
tABLE oF ContEnts
ForEword 1
Infrastructure, Energy and TradeHon. Jim Prentice, P.C., Q.C., senior Executive Vice President and Vice Chairman
2
mACro outLook
Macro Outlook: Canada and the USAvery shenfeld, managing director and Chief Economist
4
Macro Outlook: EuropeJeremy stretch, Executive director, macro strategy
9
Macro Outlook: AsiaPatrick Bennett, Executive director, macro strategy
13
Macro Outlook: Latin America and the CaribbeanJohn H. welch, Executive director, macro strategy
15
InVEstInG
FX Strategy: G3Jeremy stretch, Executive director, macro strategy
17
FX Strategy: AsiaPatrick Bennett, Executive director, macro strategy
19
FX Strategy: Latin AmericaJohn H. welch, Executive director, macro strategy
21
Rates Strategytim self, Executive director, macro strategy
24
Commodities Strategykatherine spector, Executive director, macro strategymike tran, director, macro strategy
28
Canadian Government Credit Strategywarren Lovely, Executive director, macro strategy
31
Corporate Credit StrategyJoanna Zapior, managing director and Head, macro strategy
34
Agriculture: Drought/Weather Extends the CycleJacob Bout, Executive director, Equity research
38
Oil: Uncertainty Reigns…AgainAndrew Potter, managing director, Equity research
41
Metals and Mining: Selective Approach is PrudentAlec kodatsky, Executive director, Equity research
44
Gold: A Safety Net for Further Quantitative EasingBarry Cooper, managing director, Equity research
47
Infrastructure Spending: Unlikely to Go HigherPaul Lechem, managing director, Equity research
50

CIBC A Look to the Future – 2013 Edition
tABLE oF ContEnts
Financial Services: Resilience in Uncertain Timesrobert sedran, Executive director, Equity research
52
REITs: A Goldilocks Environment with Valuations to MatchAlex Avery, Executive director, Equity research
55
Portfolio StrategyPeter Gibson, managing director, Portfolio strategy & Quantitative Analysis
57
FundInG
Bond Financingsusan rimmer, managing director, Head of debt Capital markets, Corporates & Financials
61
Government Finance: The Near-Perfect Storm Continuesdoug Bartlett, managing director, Head of Government Finance & Infrastructuresunil Bhutani, managing director and Head, Government origination
63
Infrastructure Finance: The Name is Bond. P3 BondCliff Inskip, managing director, Head of Infrastructure & Project Finance
66
Equity Markets Outlookscott smith, managing director & Co-Head, Equity Capital marketsdan nowlan, managing director & Co-Head, Equity Capital markets
69
Canadian M&A: Reasons for Optimismmike Boyd, managing director, Head of m&A and deputy Head of Global Investment Banking
71
Global Mining: Impact of Chinese Economythys terblanche, managing director, Investment Banking, Global mining GroupJames Yang, managing director, Investment Banking, Global mining Group
74
Canadian Energy: Industry Evolutionmark Horsfall, managing director, Investment Banking, Head of Global Energy
77
Corporate Credit Products: Another Blockbuster YearJacqueline orenstein, director, Loan syndications, Corporate Credit Products
79
mArkEt InFrAstruCturE uPdAtE
Rising Costs of Eligible Collateral Provides Equity Finance OpportunitiesGreg king, Executive director, Prime services Group, securities Lending
83
VolatilityBill Bamber, managing director, Equity structured Products
86
Focus on Adaptationdarren sumarah, Executive director, Prime services Groupthomas kalafatis, managing director and Head, Prime services Group
88
Electronic Evolution: Execution to Centralized ClearingJim Ginis, Executive director, e-solutions Group
90
dIsCLosurEs 93
1
CIBC A Look to the Future – 2013 Edition
ForEword
ForewordA calm environment poses a new set of challenges for investors, issuers and risk managers alike. during the suite of chapters of the financial crisis, we grew accustomed to event risk, headline risk, and a general “battle stations” mentality that led issuers to take financing where they could get it, investors to take yield where they could find it, and risk managers to seek stability when they could afford it. we have now entered a period of relative calm, which has brought a commensurate resumption of the quest for growth and the acceptance of more risk. It is in that light that we are pleased to present our 2013 edition of A Look to the Future.
what permeates this year’s edition is a sense that 2014, not 2013, will be the turning point in many markets. that said, there is much to do in 2013. many of our contributors suggest that this period of relative calm may present the governments of the world with a needed opportunity to modernize our foundations. we describe the opportunities that will exist in infrastructure finance, which is an area of particular interest and expertise for CIBC. Beyond the bricks and mortar, governments will also have a chance this year to examine their monetary paradigms, such as the underpinnings of the Euro, Asia’s role in the provision of global liquidity, and yet another round of quantitative easing in the united states. In the developing world, government decisions have an even more direct impact on economies and markets. our analysts draw a detailed picture of that region. In the energy complex, governments will be called upon to provide more clarity on both the transportation of energy as well as its ownership. our contributors offer in-depth views and predictions on these issues.
Here in Canada, there is reason to expect continued stability and prosperity and ample opportunity to invest in it. Investors will enjoy the choice of investing in our governments as well as in the debt and equity of one of the strongest financial systems in the world. Indirect opportunities may also arise in cross-border m&A, which we analyze both from our vantage point as well as from other points in the world like Asia. we also examine risks from the variable that hobbled many other parts of the world – the ordinary household.
with global risk levels subsiding, the challenges to generate returns in a relatively flat environment are significant. this will lead our clients to employ more sophisticated strategies to increase yield or reduce risk. securities lending and liquidity swaps can be used as yield overlays. Hedging tools exist that allow for more advanced management of volatility. Alternative methods of gaining exposure to energy are discussed. A more comprehensive approach to investing in the planet’s food chain is presented, as is an alternative way to benefit from quantitative easing.
the banking and execution systems that enable our clients to implement their strategies are in a heightened state of evolution. we discuss both the regulatory developments affecting this change and ways to navigate efficiently through the increasing complexities.
with the global financial crisis appearing to subside, it may be time to move on. our objective in this year’s edition of A Look to the Future is to suggest some destinations.
sincerely,
Quentin BroadEquity research
Eric MétivierCapital markets trading
Joanna Zapiormacro strategy

2
CIBC A Look to the Future – 2013 Edition
ForEword
Infrastructure, Energy and tradeHon. Jim Prentice, P.C., Q.C., senior Executive Vice
President and Vice Chairman
Infrastructure investment continues to be one of the
critical drivers of economic growth in Canada. It is
one of the most important differentiators between
Canada and the rest of the G8 and G20 nations.
no other nation has the depth and range of
potential infrastructure investments, particularly in
the energy sector.
In 2011, CIBC released a report titled “Energizing
Infrastructure” that described the economic effect
of infrastructure investment in Canada. CIBC
economists estimated that the economic spinoffs
associated with $300 billion dollars of energy
infrastructure investments would create over one
million incremental jobs in Canada.
nothing has changed over the past year to diminish
the importance of that study.
what has changed?
If infrastructure investment will help drive a
continued and strong made in Canada recovery,
my belief is that we now need to fundamentally
shift our approach to our energy trading partners.
In particular, we need to understand what is
happening south of the border and in Asia with
respect to our energy exports.
For years now, for decades in fact, we have
been going about our business in a certain way:
comfortable and content within the north American
marketplace. we are, and we have been, a critical
supplier of energy to the world’s largest economy.
there are some who refer to Canada as a global
energy superpower. mere ownership of resources,
however, does not make any country a superpower.
we do have resources, financial strength, an open
for business environment, a strong financial sector
and strong capital market.
But there is one thing that we are missing and
that is customers. of the oil we export, 99 percent
goes to the united states. And that makes Canada
a price taker not a price maker. other colleagues
in this report will focus on the details of price
differentials in the oil marketplace. But when one
customer controls your export future that is more
than a nuisance or an inconvenience. It is a major
vulnerability. It means that we are selling our
hydrocarbons into the united states at a discount
that has been as high as 35 percent to world prices.
And today we have no other options.
to complicate matters, us energy production is
increasing at a pace that few, if any, saw coming.
thanks to advances in exploration and technology,
American crude oil production is at its highest
levels in 14 years. A 2012 International Energy
Agency study suggests that by around 2020 the
united states is on track to become the largest
oil producing nation on earth – and will be a net
oil exporter by 2030 and effectively energy self
sufficient. this does not bode well for the current
export focus of our oil sector.
this is an industry that has become truly global in the
space of a few years. And infrastructure investment
is one of the primary roadblocks to Canada’s future
economic success. Initiatives like the keystone XL
pipeline or northern Gateway or the kinder morgan
pipeline each hold promise for Canada to ship more
of our oil production into markets to get a higher
return on our energy exports.
Even if the current obama administration gives its
final assent to the keystone XL pipeline this will not

3
CIBC A Look to the Future – 2013 Edition
ForEword
resolve Canada’s export challenge. Growth in long-
term demand for oil is not going to be American. It’s
not going to be European. It is going to be Asian.
If demand is going to be Asian, then Canada needs
access to its west coast to move our oil production.
this brings us back to infrastructure. we cannot
underestimate the scope of the challenge to get
our products to the west coast. the constitutional
and legal issues surrounding west coast energy
corridors, terminals and shipping are extraordinarily
difficult. But we do need to get there. whether by
pipeline, rail or other options means west coast
access should be seen as a national priority. It means
that governments and the private sector need to
re-engage on environmental and Aboriginal issues
immediately.
these same arguments apply to Canada’s east coast
and to how we ensure market access for our hydro
electricity capacity both in Canada and to the us.
Lower Churchill, Plan nord (now called Le nord
pour tous) nuclear options in ontario each point to
the need for greater domestic co-operation and a
greater focus on how to best get Canada’s green
and renewable electricity to thirsty markets in the
united states.
when one looks at the infrastructure financing
opportunities of Lower Churchill (an estimated
$6.2 bln investment), Québec’s Plan nord, ontario’s
proposed nuclear facilities ($33 bln), manitoba’s
Conawapa Hydro development ($5.0 bln), Alberta’s
northwest upgrader ($6.5 bln) or Alberta and BC’s
northern Gateway pipeline ($6.0 bln) these are
investments that will fundamentally change the
infrastructure, energy and trade picture in Canada,
in north America and globally.
As an investment choice, infrastructure has an
attractive risk profile with lower default rates
compared with corporate bonds in both developed
and emerging markets. CIBC is well positioned to
support infrastructure opportunities and investors.
Infrastructure, energy and trade are the three balls
to keep ones eye on in 2013.
4
CIBC A Look to the Future – 2013 Edition
mACro outLook
macro outlook: Canada and the usAvery shenfeld, Economics
this can’t be the new normal. If the world’s economies are ever to return to full employment, there will have to be some years in which global growth accelerates, and Canada ceases to rely on building ever more houses and putting its households deeper into debt as a cover for a lacklustre export market.
WAIT UNTIL NEXT, NEXT YEAR
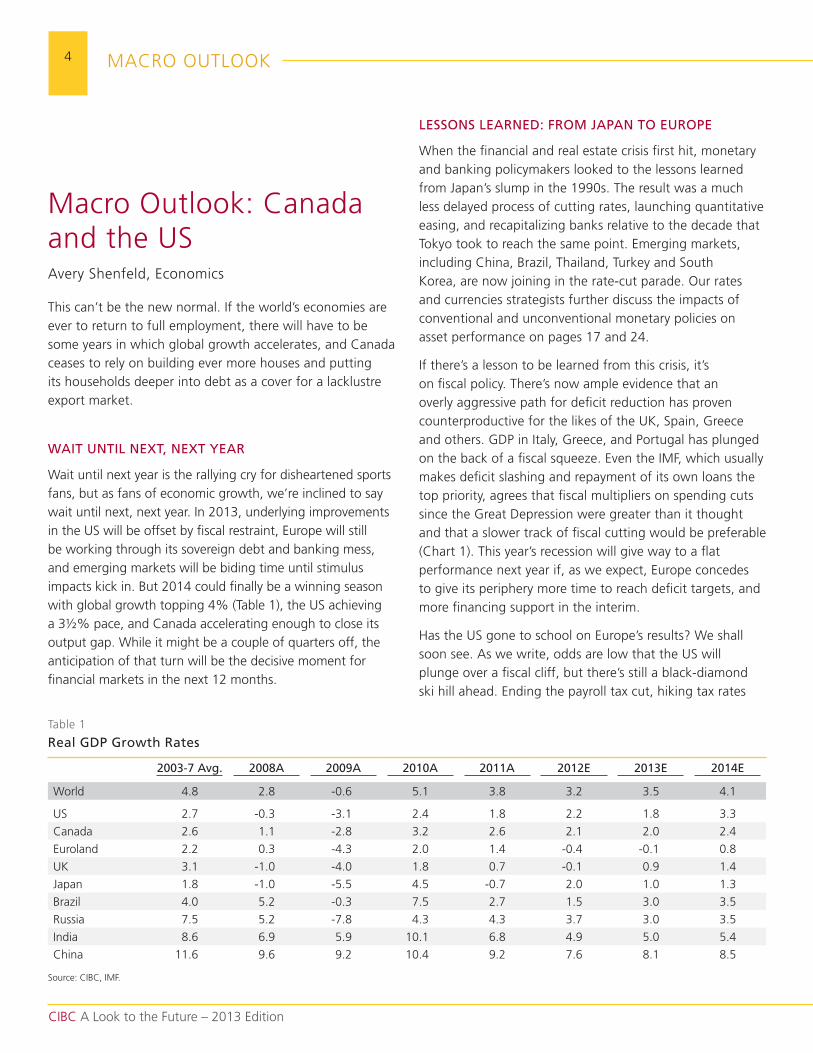
wait until next year is the rallying cry for disheartened sports fans, but as fans of economic growth, we’re inclined to say wait until next, next year. In 2013, underlying improvements in the us will be offset by fiscal restraint, Europe will still be working through its sovereign debt and banking mess, and emerging markets will be biding time until stimulus impacts kick in. But 2014 could finally be a winning season with global growth topping 4% (table 1), the us achieving a 3½% pace, and Canada accelerating enough to close its output gap. while it might be a couple of quarters off, the anticipation of that turn will be the decisive moment for financial markets in the next 12 months.
LESSONS LEARNED: FROM JAPAN TO EUROPE
when the financial and real estate crisis first hit, monetary and banking policymakers looked to the lessons learned from Japan’s slump in the 1990s. the result was a much less delayed process of cutting rates, launching quantitative easing, and recapitalizing banks relative to the decade that tokyo took to reach the same point. Emerging markets, including China, Brazil, thailand, turkey and south korea, are now joining in the rate-cut parade. our rates and currencies strategists further discuss the impacts of conventional and unconventional monetary policies on asset performance on pages 17 and 24.
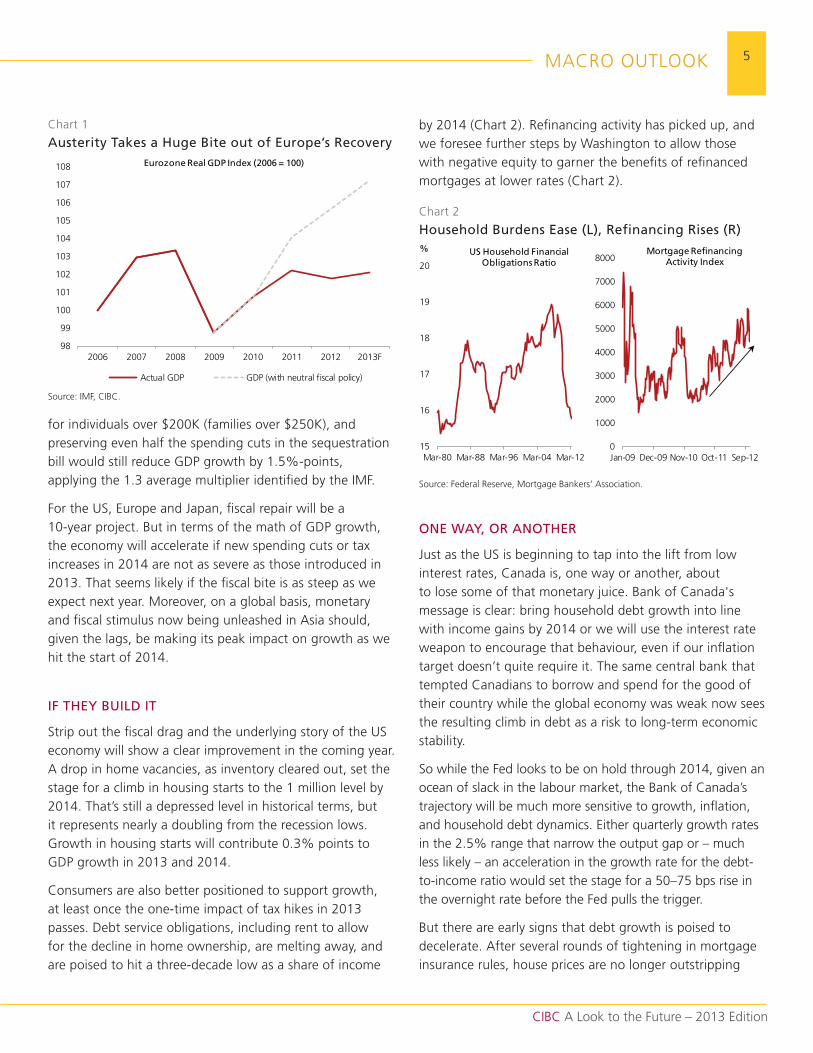
If there’s a lesson to be learned from this crisis, it’s on fiscal policy. there’s now ample evidence that an overly aggressive path for deficit reduction has proven counterproductive for the likes of the uk, spain, Greece and others. GdP in Italy, Greece, and Portugal has plunged on the back of a fiscal squeeze. Even the ImF, which usually makes deficit slashing and repayment of its own loans the top priority, agrees that fiscal multipliers on spending cuts since the Great depression were greater than it thought and that a slower track of fiscal cutting would be preferable (Chart 1). this year’s recession will give way to a flat performance next year if, as we expect, Europe concedes to give its periphery more time to reach deficit targets, and more financing support in the interim.
Has the us gone to school on Europe’s results? we shall soon see. As we write, odds are low that the us will plunge over a fiscal cliff, but there’s still a black-diamond ski hill ahead. Ending the payroll tax cut, hiking tax rates
table 1
Real GDP Growth Rates
2003-7 Avg. 2008A 2009A 2010A 2011A 2012E 2013E 2014E
world 4.8 2.8 -0.6 5.1 3.8 3.2 3.5 4.1
us 2.7 -0.3 -3.1 2.4 1.8 2.2 1.8 3.3
Canada 2.6 1.1 -2.8 3.2 2.6 2.1 2.0 2.4
Euroland 2.2 0.3 -4.3 2.0 1.4 -0.4 -0.1 0.8
uk 3.1 -1.0 -4.0 1.8 0.7 -0.1 0.9 1.4
Japan 1.8 -1.0 -5.5 4.5 -0.7 2.0 1.0 1.3
Brazil 4.0 5.2 -0.3 7.5 2.7 1.5 3.0 3.5
russia 7.5 5.2 -7.8 4.3 4.3 3.7 3.0 3.5
India 8.6 6.9 5.9 10.1 6.8 4.9 5.0 5.4
China 11.6 9.6 9.2 10.4 9.2 7.6 8.1 8.5
source: CIBC, ImF.
5
CIBC A Look to the Future – 2013 Edition
mACro outLook
for individuals over $200k (families over $250k), and preserving even half the spending cuts in the sequestration bill would still reduce GdP growth by 1.5%-points, applying the 1.3 average multiplier identified by the ImF.
For the us, Europe and Japan, fiscal repair will be a 10-year project. But in terms of the math of GdP growth, the economy will accelerate if new spending cuts or tax increases in 2014 are not as severe as those introduced in 2013. that seems likely if the fiscal bite is as steep as we expect next year. moreover, on a global basis, monetary and fiscal stimulus now being unleashed in Asia should, given the lags, be making its peak impact on growth as we hit the start of 2014.
IF THEY BUILD IT
strip out the fiscal drag and the underlying story of the us economy will show a clear improvement in the coming year. A drop in home vacancies, as inventory cleared out, set the stage for a climb in housing starts to the 1 million level by 2014. that’s still a depressed level in historical terms, but it represents nearly a doubling from the recession lows. Growth in housing starts will contribute 0.3% points to GdP growth in 2013 and 2014.
Consumers are also better positioned to support growth, at least once the one-time impact of tax hikes in 2013 passes. debt service obligations, including rent to allow for the decline in home ownership, are melting away, and are poised to hit a three-decade low as a share of income
98
99
100
101
102
103
104
105
106
107
108
2006 2007 2008 2009 2010 2011 2012 2013F
Actual GdP GdP (with neutral fiscal policy)
Eurozone Real GDP Index (2006 = 100)
by 2014 (Chart 2). refinancing activity has picked up, and we foresee further steps by washington to allow those with negative equity to garner the benefits of refinanced mortgages at lower rates (Chart 2).
ONE WAY, OR ANOTHER
Just as the us is beginning to tap into the lift from low interest rates, Canada is, one way or another, about to lose some of that monetary juice. Bank of Canada's message is clear: bring household debt growth into line with income gains by 2014 or we will use the interest rate weapon to encourage that behaviour, even if our inflation target doesn’t quite require it. the same central bank that tempted Canadians to borrow and spend for the good of their country while the global economy was weak now sees the resulting climb in debt as a risk to long-term economic stability.
so while the Fed looks to be on hold through 2014, given an ocean of slack in the labour market, the Bank of Canada’s trajectory will be much more sensitive to growth, inflation, and household debt dynamics. Either quarterly growth rates in the 2.5% range that narrow the output gap or – much less likely – an acceleration in the growth rate for the debt-to-income ratio would set the stage for a 50–75 bps rise in the overnight rate before the Fed pulls the trigger.
But there are early signs that debt growth is poised to decelerate. After several rounds of tightening in mortgage insurance rules, house prices are no longer outstripping
Chart 2
Household Burdens Ease (L), Refinancing Rises (R)
source: Federal reserve, mortgage Bankers’ Association.
Chart 1
Austerity Takes a Huge Bite out of Europe’s Recovery
source: ImF, CIBC.
0
1000
2000
3000
4000
5000
6000
7000
8000
Jan-09 dec-09 nov-10 oct-11 sep-12
Mortgage Refinancing Activity Index
15
16
17
18
19
20
mar-80 mar-88 mar-96 mar-04 mar-12
US Household Financial Obligations Ratio
%
6
CIBC A Look to the Future – 2013 Edition
mACro outLook
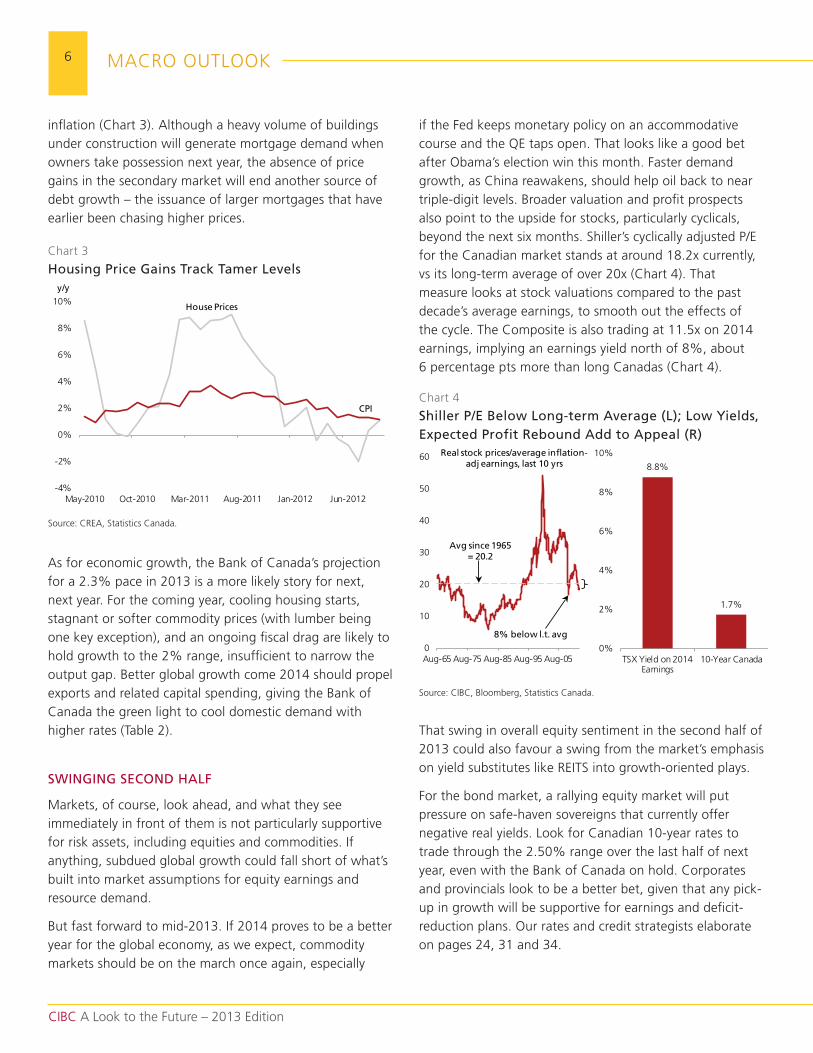
if the Fed keeps monetary policy on an accommodative course and the QE taps open. that looks like a good bet after obama’s election win this month. Faster demand growth, as China reawakens, should help oil back to near triple-digit levels. Broader valuation and profit prospects also point to the upside for stocks, particularly cyclicals, beyond the next six months. shiller’s cyclically adjusted P/E for the Canadian market stands at around 18.2x currently, vs its long-term average of over 20x (Chart 4). that measure looks at stock valuations compared to the past decade’s average earnings, to smooth out the effects of the cycle. the Composite is also trading at 11.5x on 2014 earnings, implying an earnings yield north of 8%, about 6 percentage pts more than long Canadas (Chart 4).
that swing in overall equity sentiment in the second half of 2013 could also favour a swing from the market’s emphasis on yield substitutes like rEIts into growth-oriented plays.
For the bond market, a rallying equity market will put pressure on safe-haven sovereigns that currently offer negative real yields. Look for Canadian 10-year rates to trade through the 2.50% range over the last half of next year, even with the Bank of Canada on hold. Corporates and provincials look to be a better bet, given that any pick-up in growth will be supportive for earnings and deficit-reduction plans. our rates and credit strategists elaborate on pages 24, 31 and 34.
0
10
20
30
40
50
60
Aug-65 Aug-75 Aug-85 Aug-95 Aug-05
Avg since 1965 = 20.2
8% below l.t. avg
Real stock prices/average inflation-adj earnings, last 10 yrs 8.8%
1.7%
0%
2%
4%
6%
8%
10%
tsX Yield on 2014Earnings
10-Year Canada
inflation (Chart 3). Although a heavy volume of buildings under construction will generate mortgage demand when owners take possession next year, the absence of price gains in the secondary market will end another source of debt growth – the issuance of larger mortgages that have earlier been chasing higher prices.
As for economic growth, the Bank of Canada’s projection for a 2.3% pace in 2013 is a more likely story for next, next year. For the coming year, cooling housing starts, stagnant or softer commodity prices (with lumber being one key exception), and an ongoing fiscal drag are likely to hold growth to the 2% range, insufficient to narrow the output gap. Better global growth come 2014 should propel exports and related capital spending, giving the Bank of Canada the green light to cool domestic demand with higher rates (table 2).
SWINGING SECOND HALF
markets, of course, look ahead, and what they see immediately in front of them is not particularly supportive for risk assets, including equities and commodities. If anything, subdued global growth could fall short of what’s built into market assumptions for equity earnings and resource demand.
But fast forward to mid-2013. If 2014 proves to be a better year for the global economy, as we expect, commodity markets should be on the march once again, especially
Chart 3
Housing Price Gains Track Tamer Levels
source: CrEA, statistics Canada.
-4%
-2%
0%
2%
4%
6%
8%
10%
may-2010 oct-2010 mar-2011 Aug-2011 Jan-2012 Jun-2012
CPI
House Prices
y/y
Chart 4
Shiller P/E Below Long-term Average (L); Low Yields, Expected Profit Rebound Add to Appeal (R)
source: CIBC, Bloomberg, statistics Canada.
7
CIBC A Look to the Future – 2013 Edition
mACro outLook
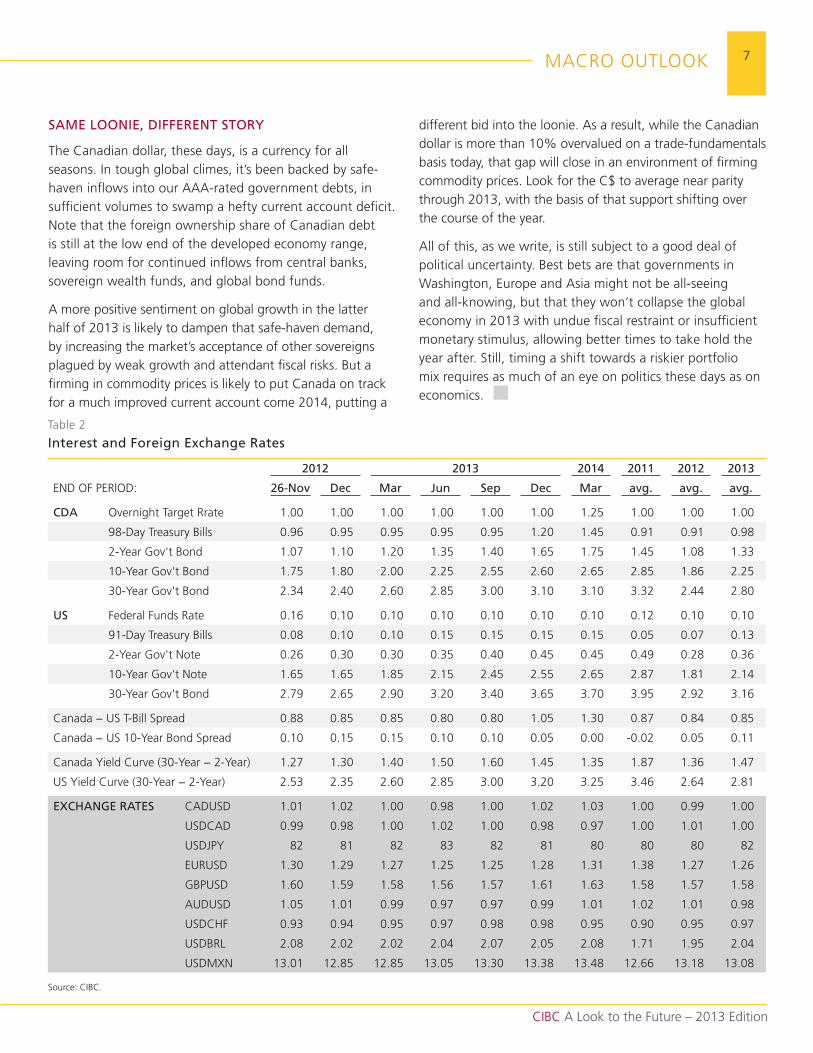
SAME LOONIE, DIFFERENT STORY
the Canadian dollar, these days, is a currency for all seasons. In tough global climes, it’s been backed by safe-haven inflows into our AAA-rated government debts, in sufficient volumes to swamp a hefty current account deficit. note that the foreign ownership share of Canadian debt is still at the low end of the developed economy range, leaving room for continued inflows from central banks, sovereign wealth funds, and global bond funds.
A more positive sentiment on global growth in the latter half of 2013 is likely to dampen that safe-haven demand, by increasing the market’s acceptance of other sovereigns plagued by weak growth and attendant fiscal risks. But a firming in commodity prices is likely to put Canada on track for a much improved current account come 2014, putting a
different bid into the loonie. As a result, while the Canadian dollar is more than 10% overvalued on a trade-fundamentals basis today, that gap will close in an environment of firming commodity prices. Look for the C$ to average near parity through 2013, with the basis of that support shifting over the course of the year.
All of this, as we write, is still subject to a good deal of political uncertainty. Best bets are that governments in washington, Europe and Asia might not be all-seeing and all-knowing, but that they won’t collapse the global economy in 2013 with undue fiscal restraint or insufficient monetary stimulus, allowing better times to take hold the year after. still, timing a shift towards a riskier portfolio mix requires as much of an eye on politics these days as on economics.
table 2
Interest and Foreign Exchange Rates
2012 2013 2014 2011 2012 2013
End oF PErIod: 26-Nov Dec Mar Jun Sep Dec Mar avg. avg. avg.
CDA overnight target rrate 1.00 1.00 1.00 1.00 1.00 1.00 1.25 1.00 1.00 1.00
98-day treasury Bills 0.96 0.95 0.95 0.95 0.95 1.20 1.45 0.91 0.91 0.98
2-Year Gov't Bond 1.07 1.10 1.20 1.35 1.40 1.65 1.75 1.45 1.08 1.33
10-Year Gov't Bond 1.75 1.80 2.00 2.25 2.55 2.60 2.65 2.85 1.86 2.25
30-Year Gov't Bond 2.34 2.40 2.60 2.85 3.00 3.10 3.10 3.32 2.44 2.80
US Federal Funds rate 0.16 0.10 0.10 0.10 0.10 0.10 0.10 0.12 0.10 0.10
91-day treasury Bills 0.08 0.10 0.10 0.15 0.15 0.15 0.15 0.05 0.07 0.13
2-Year Gov't note 0.26 0.30 0.30 0.35 0.40 0.45 0.45 0.49 0.28 0.36
10-Year Gov't note 1.65 1.65 1.85 2.15 2.45 2.55 2.65 2.87 1.81 2.14
30-Year Gov't Bond 2.79 2.65 2.90 3.20 3.40 3.65 3.70 3.95 2.92 3.16
Canada − us t-Bill spread 0.88 0.85 0.85 0.80 0.80 1.05 1.30 0.87 0.84 0.85
Canada − us 10-Year Bond spread 0.10 0.15 0.15 0.10 0.10 0.05 0.00 -0.02 0.05 0.11
Canada Yield Curve (30-Year − 2-Year) 1.27 1.30 1.40 1.50 1.60 1.45 1.35 1.87 1.36 1.47
us Yield Curve (30-Year − 2-Year) 2.53 2.35 2.60 2.85 3.00 3.20 3.25 3.46 2.64 2.81
EXCHANGE RATES CAdusd 1.01 1.02 1.00 0.98 1.00 1.02 1.03 1.00 0.99 1.00
usdCAd 0.99 0.98 1.00 1.02 1.00 0.98 0.97 1.00 1.01 1.00
usdJPY 82 81 82 83 82 81 80 80 80 82
Eurusd 1.30 1.29 1.27 1.25 1.25 1.28 1.31 1.38 1.27 1.26
GBPusd 1.60 1.59 1.58 1.56 1.57 1.61 1.63 1.58 1.57 1.58
Audusd 1.05 1.01 0.99 0.97 0.97 0.99 1.01 1.02 1.01 0.98
usdCHF 0.93 0.94 0.95 0.97 0.98 0.98 0.95 0.90 0.95 0.97
usdBrL 2.08 2.02 2.02 2.04 2.07 2.05 2.08 1.71 1.95 2.04
usdmXn 13.01 12.85 12.85 13.05 13.30 13.38 13.48 12.66 13.18 13.08
source: CIBC.
8
CIBC A Look to the Future – 2013 Edition
mACro outLook
usd/CAd: Buy Low, sell Highmeaghan stoll-kimball, FX structuring
robert Gunja, FX structuring
Bipan rai, macro strategy
“Canadian dollar performance continues to be a battle between domestic fundamentals, external risk dynamics, commodity prices and implied rates.” – Jeremy Stretch, Macro Strategy, GPS House Views (November 21, 2012).
As our FX strategist notes, we anticipate that the “tug-of-war” between both strong bearish and bullish influences will keep usd/CAd range bound for the foreseeable future.
on one hand, the Bank of Canada is one of the few central banks with a somewhat hawkish bias. Add that detail to Canada’s AAA sovereign credit status and solid domestic fundamentals, and the Canadian dollar should benefit from central bank reserve recycling as well as foreign portfolio inflows. However, external risk dynamics may arrest any further Canadian dollar
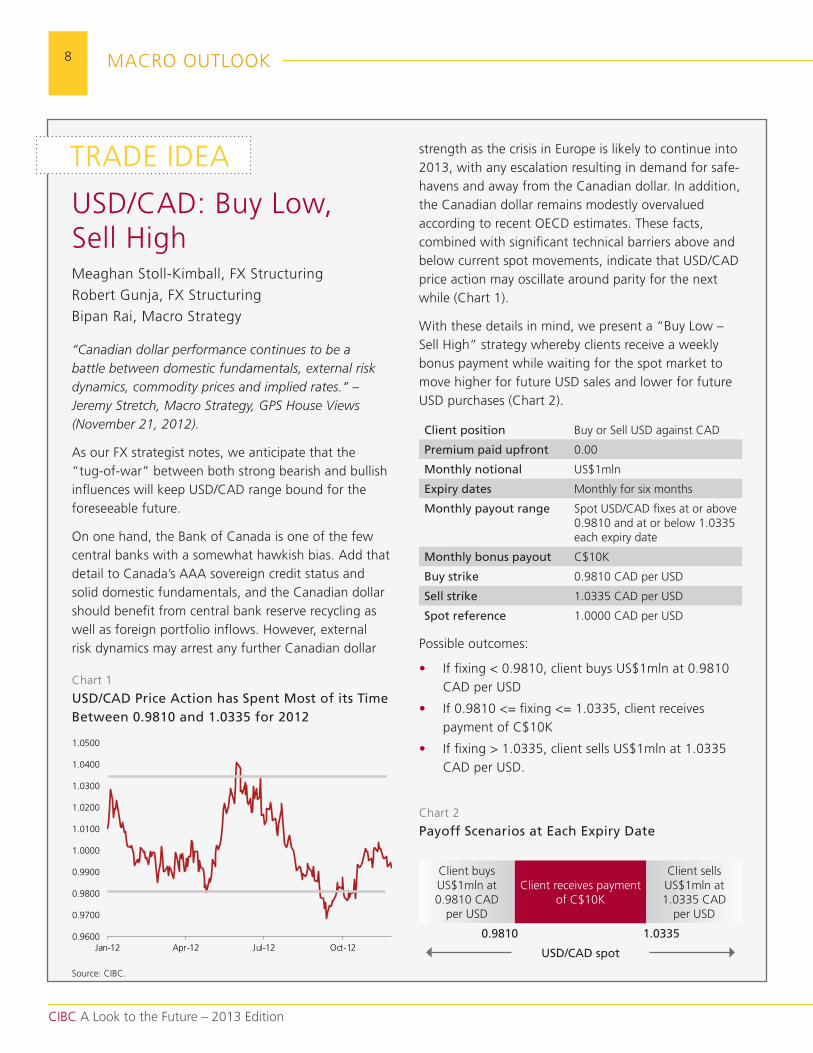
trAdE IdEA strength as the crisis in Europe is likely to continue into 2013, with any escalation resulting in demand for safe-havens and away from the Canadian dollar. In addition, the Canadian dollar remains modestly overvalued according to recent oECd estimates. these facts, combined with significant technical barriers above and below current spot movements, indicate that usd/CAd price action may oscillate around parity for the next while (Chart 1).
with these details in mind, we present a “Buy Low – sell High” strategy whereby clients receive a weekly bonus payment while waiting for the spot market to move higher for future usd sales and lower for future usd purchases (Chart 2).
Client position Buy or sell usd against CAd
Premium paid upfront 0.00
Monthly notional us$1mln
Expiry dates monthly for six months
Monthly payout range spot usd/CAd fixes at or above 0.9810 and at or below 1.0335 each expiry date
Monthly bonus payout C$10k
Buy strike 0.9810 CAd per usd
Sell strike 1.0335 CAd per usd
Spot reference 1.0000 CAd per usd
Possible outcomes:
• If fixing < 0.9810, client buys us$1mln at 0.9810 CAd per usd
• If 0.9810 <= fixing <= 1.0335, client receives payment of C$10k
• If fixing > 1.0335, client sells us$1mln at 1.0335 CAd per usd.
Chart 1
USD/CAD Price Action has Spent Most of its Time Between 0.9810 and 1.0335 for 2012
Chart 2
Payoff Scenarios at Each Expiry Date
Client buys us$1mln at 0.9810 CAd
per usd
Client receives payment of C$10k
Client sells us$1mln at 1.0335 CAd
per usd
0.9810 1.0335
USD/CAD spot
source: CIBC.
0.9600
0.9700
0.9800
0.9900
1.0000
1.0100
1.0200
1.0300
1.0400
1.0500
Jan-12 Apr-12 Jul-12 oct-12
9
CIBC A Look to the Future – 2013 Edition
mACro outLook
macro outlook: EuropeJeremy stretch, macro strategy
A year ago in this publication, in the article entitled “unlucky 13,” we concluded that “in 2012 the eurozone faces rising recession risks, a more pro-active monetary stance from the European Central Bank (ECB), a more pro-active draghi-led ECB, alongside a belated recognition from policymakers that the ECB will have to make a concession into buying more bonds, likely on an unsterilized basis… this would provide the necessary circuit breaker to ongoing uncertainty, despite the inherent political headaches it will bring forth for Chancellor merkel.”
It would appear that our underlying analysis proved broadly prescient, albeit discussion of deflationary tendencies may have proved misplaced (even though many in Germany may still argue that the ECB has failed its monetary mandate).
THE PROBLEM, AS WE ENTER 2013
the problem, as we enter 2013, a year which will mark the 20th anniversary of implementation of the maastricht treaty creating the eurozone, is that we face another year where we are set to struggle to generate positive growth, even at a pan-European level. moreover, the inherent design flaws of the system remain unsolved, competitiveness remains an issue, and we continue to see band-aid solutions rather than broad-based and meaningful structural reform, the latter perhaps paralysed, at least in part, by the ongoing political timetable, notably headed by Germany as elections loom in the autumn.
what is clear is that we have seen a more proactive monetary policy stance, formulated by mario draghi, which has bought the politicians time. Initial market support came through the Long term refinancing operation (Ltro) process, easing near-term bank funding constraints. more recently, in the wake of the late July reference to do “whatever it takes,” the ECB President outlined the process of outright monetary transactions (omt), which (subject to a sovereign state asking for assistance and agreeing to
strictly enforced conditionality, including signing up to an Esm assistance programme), would see the ECB purchasing bonds at the front end of the curve.
the omt announcement at the september ECB meeting may have helped arrest yields and spreads at the longer end of the curve. However, the reticence to ask for such assistance by sovereign states, such as spain, in large part due to fears relating to the conditionality tied to any support, has seen yield curves steepen and spreads versus German Bunds widen once more. Again it can be argued that the politicians are gradually frittering away the precious time provided for them by the ECB.
while there is some evidence of the impact of structural reforms – for example, some reduction in labour costs in places such as Greece and Ireland – progress is likely to be slow. meanwhile, the process of internal devaluation, wage cuts and rising unemployment is hugely damaging to economic confidence, undermining consumer behaviour. therefore, Europe’s key concern remains the ongoing deterioration in baseline fundamentals, a slide which risks aggregate activity in the eurozone in 2013 again struggling to reach positive territory, this after a modest contraction of around 0.4% this year.
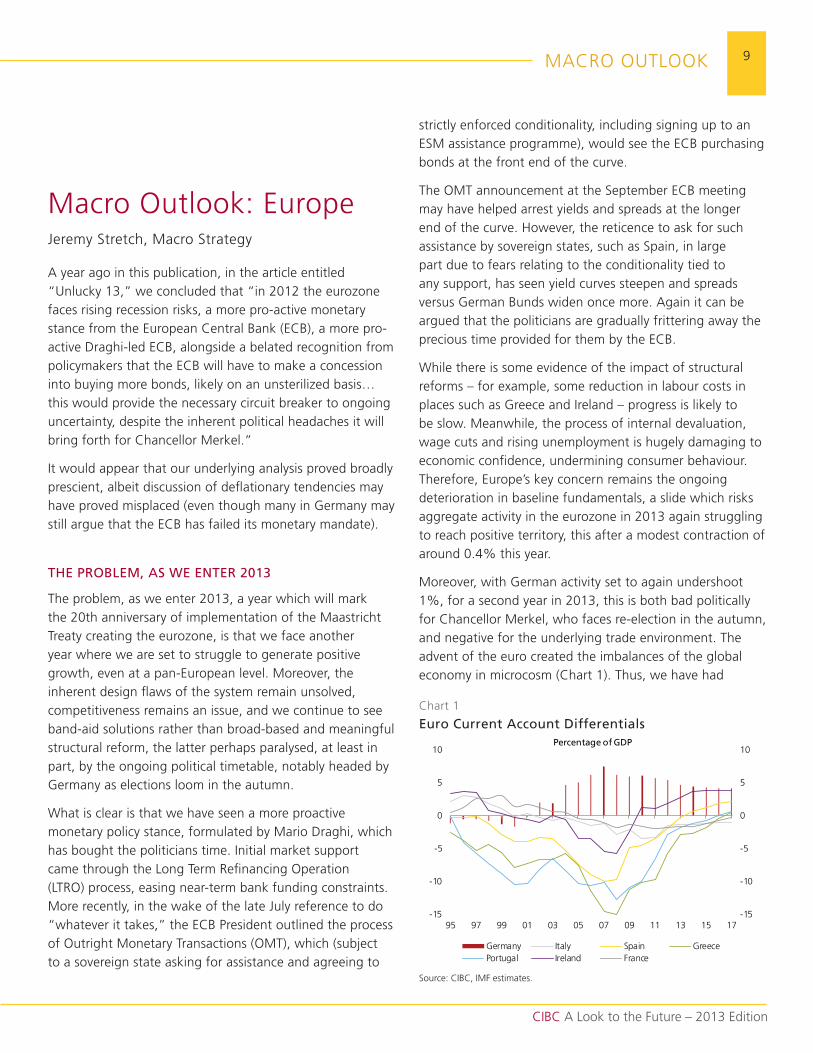
moreover, with German activity set to again undershoot 1%, for a second year in 2013, this is both bad politically for Chancellor merkel, who faces re-election in the autumn, and negative for the underlying trade environment. the advent of the euro created the imbalances of the global economy in microcosm (Chart 1). thus, we have had
Chart 1
Euro Current Account Differentials
source: CIBC, ImF estimates.
-15
-10
-5
0
5
10
-15
-10
-5
0
5
10
95 97 99 01 03 05 07 09 11 13 15 17
Germany Italy spain GreecePortugal Ireland France
Percentage of GDP
10
CIBC A Look to the Future – 2013 Edition
mACro outLook
England in terms of unsterilized bond purchases. while the omt programme does buy time for the politicians, the process of capping front-end yields does little to alleviate broader fundamental weakness and reverse a lack of competitiveness.
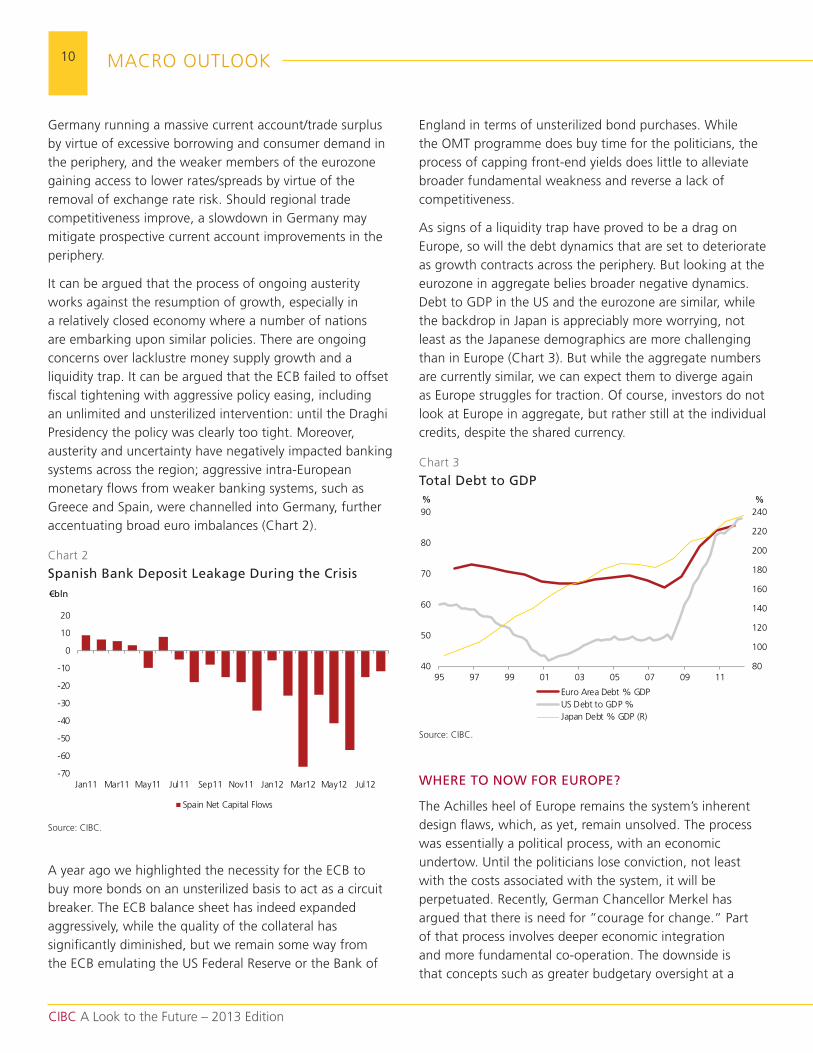
As signs of a liquidity trap have proved to be a drag on Europe, so will the debt dynamics that are set to deteriorate as growth contracts across the periphery. But looking at the eurozone in aggregate belies broader negative dynamics. debt to GdP in the us and the eurozone are similar, while the backdrop in Japan is appreciably more worrying, not least as the Japanese demographics are more challenging than in Europe (Chart 3). But while the aggregate numbers are currently similar, we can expect them to diverge again as Europe struggles for traction. of course, investors do not look at Europe in aggregate, but rather still at the individual credits, despite the shared currency.
WHERE TO NOW FOR EUROPE?
the Achilles heel of Europe remains the system’s inherent design flaws, which, as yet, remain unsolved. the process was essentially a political process, with an economic undertow. until the politicians lose conviction, not least with the costs associated with the system, it will be perpetuated. recently, German Chancellor merkel has argued that there is need for ”courage for change.” Part of that process involves deeper economic integration and more fundamental co-operation. the downside is that concepts such as greater budgetary oversight at a
Germany running a massive current account/trade surplus by virtue of excessive borrowing and consumer demand in the periphery, and the weaker members of the eurozone gaining access to lower rates/spreads by virtue of the removal of exchange rate risk. should regional trade competitiveness improve, a slowdown in Germany may mitigate prospective current account improvements in the periphery.
It can be argued that the process of ongoing austerity works against the resumption of growth, especially in a relatively closed economy where a number of nations are embarking upon similar policies. there are ongoing concerns over lacklustre money supply growth and a liquidity trap. It can be argued that the ECB failed to offset fiscal tightening with aggressive policy easing, including an unlimited and unsterilized intervention: until the draghi Presidency the policy was clearly too tight. moreover, austerity and uncertainty have negatively impacted banking systems across the region; aggressive intra-European monetary flows from weaker banking systems, such as Greece and spain, were channelled into Germany, further accentuating broad euro imbalances (Chart 2).
A year ago we highlighted the necessity for the ECB to buy more bonds on an unsterilized basis to act as a circuit breaker. the ECB balance sheet has indeed expanded aggressively, while the quality of the collateral has significantly diminished, but we remain some way from the ECB emulating the us Federal reserve or the Bank of
Chart 2
Spanish Bank Deposit Leakage During the Crisis
Chart 3
Total Debt to GDP
source: CIBC.
source: CIBC.
-70
-60
-50
-40
-30
-20
-10
0
10
20
Jan11 mar11 may11 Jul11 sep11 nov11 Jan12 mar12 may12 Jul12
spain net Capital Flows
€bln
80
100
120
140
160
180
200
220
240
40
50
60
70
80
90
95 97 99 01 03 05 07 09 11
%
Euro Area debt % GdPus debt to GdP %Japan debt % GdP (r)
%

11
CIBC A Look to the Future – 2013 Edition
mACro outLook
supranational level render an increasing loss of national sovereignty and democratic legitimacy.
the process of reform across the last three years has largely been by virtue of a reactive crisis mentality. A current example could be the case of spain where only the discipline of the market will likely pressure spain to ask for omt assistance. similar criticism could be levelled at such concepts as pan-European banking supervision and unified bank deposit insurance, a process which should help mitigate liquidity leakage across the region. while laudable, the progress towards such integration has slowed since mid- year crisis dynamics.
thus, we are left with a eurozone facing negative growth dynamics and risks of a negative debt spiral. Indeed, even the International monetary Fund (ImF) is now questioning the wisdom of its previous assumptions of the fiscal multiplier, i.e. the risk of austerity being more than self-defeating, not least as tax increases and spending cuts occur across the region. structural reforms and internal devaluations will over time improve competitiveness, but questions remain over the political appetite to carry the process through to fruition: for example, spanish youth unemployment is already 54%.
For some, the cost is likely to prove too high. Greece may see its debt written down again, but the ability of the three-party coalition to maintain course remains in extreme
doubt as the power base of the three-party government continues to erode. However, political dynamics may suggest that Greece soldier on inside the euro, at least until after German elections in the autumn, in part because the unintended consequences of ejection are too high to quantify. while the ECB has bought time for the politicians, the inability to take tough decisions, outside of a crisis, continues to weigh upon the eurozone. For now, the political timetable, notably the German poll, may continue to constrain decisions despite merkel and others talking about reforms.
thus we are left with the uncorrected design flaws of the euro’s founding fathers. debt mutualisation, more co-ordinated political decision-making, and pan-European banking reforms remain – as 12 months ago – mere objectives. As a consequence, we are unlikely to see a durable move away from an ongoing crisis mentality, policy decisions remaining reactive. the ongoing deterioration of the fundamentals, in part due to the negative impacts of the fiscal multiplier, underlines that much onus remains on the ECB’s shoulders, despite its best efforts to push the burden of reform back to the national governments. Election uncertainties and fundamental weakness underline that the basis of the euro project remains fragile at best, at least until there are signs of a relatively improved fundamental backdrop. that seems unlikely in the year ahead.
12
CIBC A Look to the Future – 2013 Edition
mACro outLook
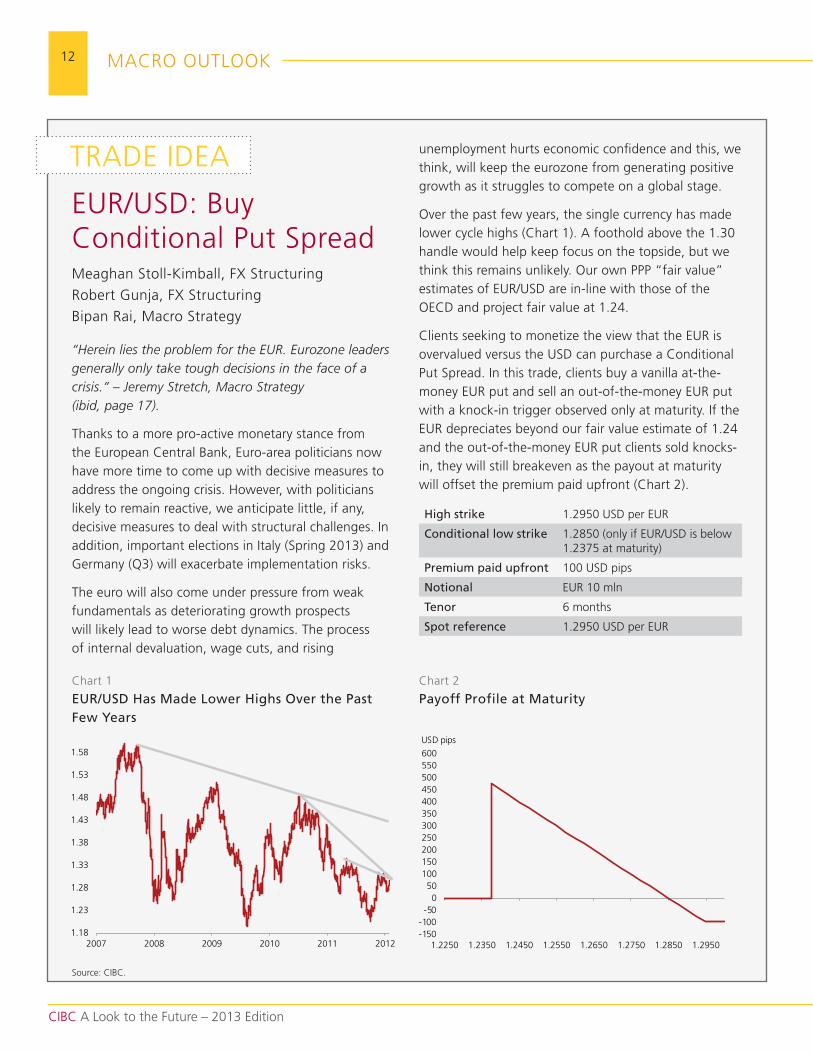
trAdE IdEA unemployment hurts economic confidence and this, we think, will keep the eurozone from generating positive growth as it struggles to compete on a global stage.
over the past few years, the single currency has made lower cycle highs (Chart 1). A foothold above the 1.30 handle would help keep focus on the topside, but we think this remains unlikely. our own PPP “fair value” estimates of Eur/usd are in-line with those of the oECd and project fair value at 1.24.
Clients seeking to monetize the view that the Eur is overvalued versus the usd can purchase a Conditional Put spread. In this trade, clients buy a vanilla at-the-money Eur put and sell an out-of-the-money Eur put with a knock-in trigger observed only at maturity. If the Eur depreciates beyond our fair value estimate of 1.24 and the out-of-the-money Eur put clients sold knocks-in, they will still breakeven as the payout at maturity will offset the premium paid upfront (Chart 2).
High strike 1.2950 usd per Eur
Conditional low strike 1.2850 (only if Eur/usd is below 1.2375 at maturity)
Premium paid upfront 100 usd pips
Notional Eur 10 mln
Tenor 6 months
Spot reference 1.2950 usd per Eur
Eur/usd: Buy Conditional Put spreadmeaghan stoll-kimball, FX structuring
robert Gunja, FX structuring
Bipan rai, macro strategy
“Herein lies the problem for the EUR. Eurozone leaders generally only take tough decisions in the face of a crisis.” – Jeremy Stretch, Macro Strategy (ibid, page 17).
thanks to a more pro-active monetary stance from the European Central Bank, Euro-area politicians now have more time to come up with decisive measures to address the ongoing crisis. However, with politicians likely to remain reactive, we anticipate little, if any, decisive measures to deal with structural challenges. In addition, important elections in Italy (spring 2013) and Germany (Q3) will exacerbate implementation risks.
the euro will also come under pressure from weak fundamentals as deteriorating growth prospects will likely lead to worse debt dynamics. the process of internal devaluation, wage cuts, and rising
Chart 1
EUR/USD Has Made Lower Highs Over the Past Few Years
Chart 2
Payoff Profile at Maturity
source: CIBC.
-150-100-50
050
100150200250300350400450500550600
1.2250 1.2350 1.2450 1.2550 1.2650 1.2750 1.2850 1.2950
usd pips
1.18
1.23
1.28
1.33
1.38
1.43
1.48
1.53
1.58
2007 2008 2009 2010 2011 2012

13
CIBC A Look to the Future – 2013 Edition
mACro outLook
efforts to prop up already slowing growth, cements the lower run rate in the region. Investors and the market as a whole need to accept that the run rate has simply shifted lower. As a recent us Conference Board global outlook noted, when discussing prospects for the BrIC nations, the so-called low-hanging fruit of cheap labour and imported technology has already been picked. the future offers plenty of opportunities, but challenges as well.
Asia at a slightly lower run rate and less than recent trends is not all bad. And there is certainly a greater sense of calm in a belief that Asian policymakers are able to engineer soft landings for their respective economies and that flows of liquidity into the region will be managed without causing local asset bubbles and inflation. Easing cycles have been under way in Asia for some time, although we believe more can be done. Asian policymakers, not unlike policymakers elsewhere, have a morbid fear of inflation. we think that is misplaced in the current global environment and would like to see greater easing delivered, though we are not convinced that will happen.
Asian economic activity has long been based on exporting cheap goods to the rest of the world. when global demand collapsed in 2008, China responded with a massive stimulus program, underpinned by bank lending, that would bring forward a large portion of infrastructure planned for the next 10 years. we continue to view those programs as well planned and well executed, and responsible for maintaining China’s stunning rate of growth until this year. But economic risk, identified even back in 2008, was that, come 2012–2013 and if global demand had not recovered, there would be no more stimulus levers to pull.
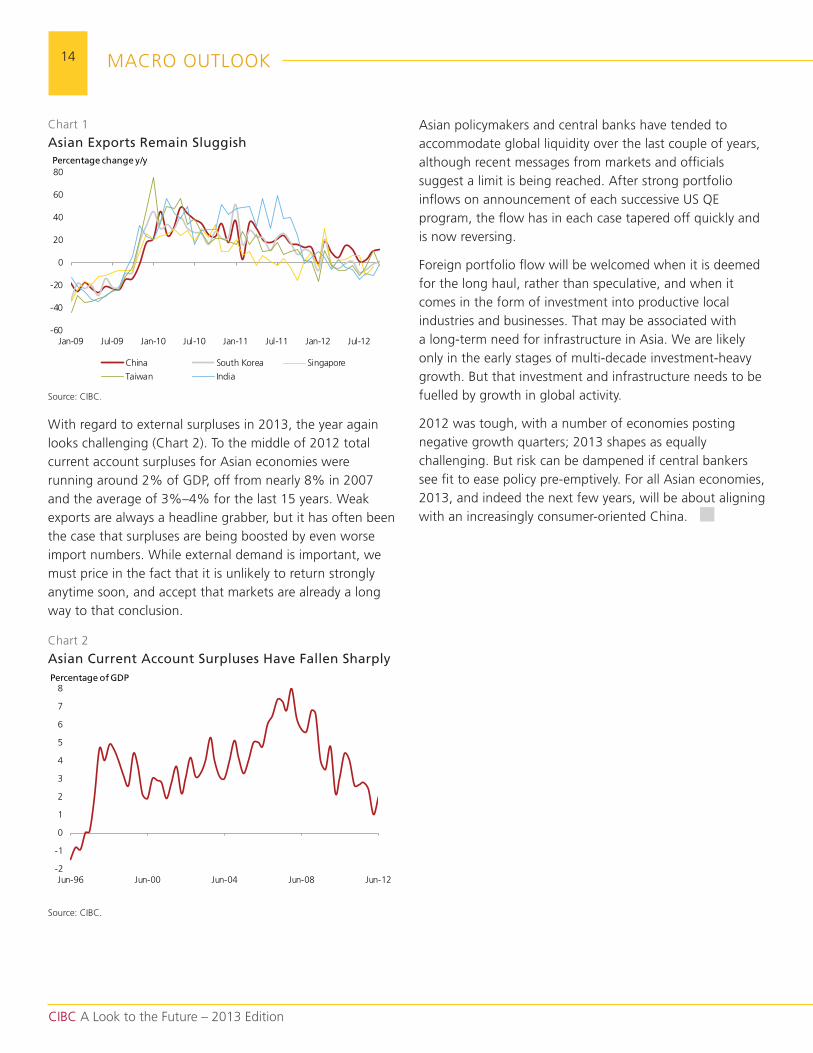
we now face 2013 and global demand has not returned (Chart 1). In aggregate, demand looks to have stabilized; while Europe remains weak, the us has picked up some slack. Asian demand is important for the global economy, but China and its neighbours are not the world’s marginal consumer. the state of Asian and Chinese import demand in 2012 has demonstrated that fact. on Chinese demand specifically, imports are nowhere near the levels that Chinese leaders were targeting just a year ago. the investment-led boom of the last few years has simply run its course.
macro outlook: AsiaPatrick Bennett, macro strategy
Asian economies fared less well than was commonly expected in 2012 with perceived resilience of the region undone by ongoing tough external conditions that, in turn, fed through to weaker domestic activity. Heading into 2013 the prospects are not significantly brighter. there are pockets of opinion that forecast an economic rebound but, with China re-orienting its economic plan and the rest of the world hanging on the belief that a mix of austerity and monetary profligacy will magically turn the tide, those ideas are fanciful.
ASIA MUDDLES THROUGH, AGAIN
2013 is shaping up as another year of Asia “muddling through” with sluggish exports again feeding into weak domestic demand. At the same, time policymakers will attempt to manage inflows of capital founded on global quantitative easing programs.
still, Asia growth in 2013 will be far from a disaster. Any region that posts aggregate GdP growth of around 5% is clearly doing well. But what is changing with regards to Asia, and an issue that we believe is not yet well priced, is that boom times are behind us and won’t be returning for the foreseeable future. Asia’s capacity generally, and China’s specifically, to influence global outcomes continues to be overplayed.
China recently confirmed new leadership of Xi Jingping and Li keqiang, who will officially take the reins in march. China’s growth model is still that of the 12th five-year plan that runs through 2015 and seeks to emphasize domestic consumption over investment. despite ongoing speculation (very little, if any of it, from China), 2013 will not be the year that China announces new huge stimulus plans and, thus, supports the bulk commodity and capital goods exporters and, in turn, its trade partners.
Global demand is not suddenly going to rebound, and China’s economic reorientation, even before considering
14
CIBC A Look to the Future – 2013 Edition
mACro outLook
with regard to external surpluses in 2013, the year again looks challenging (Chart 2). to the middle of 2012 total current account surpluses for Asian economies were running around 2% of GdP, off from nearly 8% in 2007 and the average of 3%–4% for the last 15 years. weak exports are always a headline grabber, but it has often been the case that surpluses are being boosted by even worse import numbers. while external demand is important, we must price in the fact that it is unlikely to return strongly anytime soon, and accept that markets are already a long way to that conclusion.
Asian policymakers and central banks have tended to accommodate global liquidity over the last couple of years, although recent messages from markets and officials suggest a limit is being reached. After strong portfolio inflows on announcement of each successive us QE program, the flow has in each case tapered off quickly and is now reversing.
Foreign portfolio flow will be welcomed when it is deemed for the long haul, rather than speculative, and when it comes in the form of investment into productive local industries and businesses. that may be associated with a long-term need for infrastructure in Asia. we are likely only in the early stages of multi-decade investment-heavy growth. But that investment and infrastructure needs to be fuelled by growth in global activity.
2012 was tough, with a number of economies posting negative growth quarters; 2013 shapes as equally challenging. But risk can be dampened if central bankers see fit to ease policy pre-emptively. For all Asian economies, 2013, and indeed the next few years, will be about aligning with an increasingly consumer-oriented China.
Chart 1
Asian Exports Remain Sluggish
Chart 2
Asian Current Account Surpluses Have Fallen Sharply
source: CIBC.
source: CIBC.
-60
-40
-20
0
20
40
60
80
Jan-09 Jul-09 Jan-10 Jul-10 Jan-11 Jul-11 Jan-12 Jul-12
China south korea singapore
taiwan India
Percentage change y/y
-2
-1
0
1
2
3
4
5
6
7
8
Jun-96 Jun-00 Jun-04 Jun-08 Jun-12
Percentage of GDP
15
CIBC A Look to the Future – 2013 Edition
mACro outLook
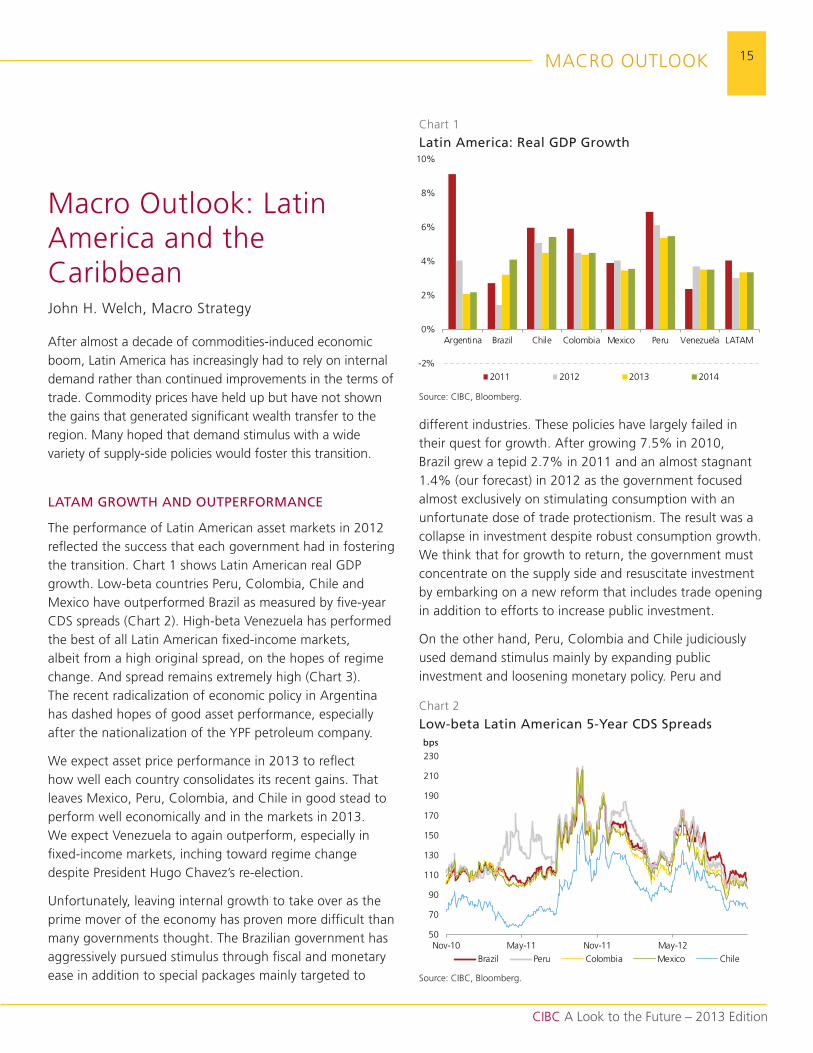
different industries. these policies have largely failed in their quest for growth. After growing 7.5% in 2010, Brazil grew a tepid 2.7% in 2011 and an almost stagnant 1.4% (our forecast) in 2012 as the government focused almost exclusively on stimulating consumption with an unfortunate dose of trade protectionism. the result was a collapse in investment despite robust consumption growth. we think that for growth to return, the government must concentrate on the supply side and resuscitate investment by embarking on a new reform that includes trade opening in addition to efforts to increase public investment.
on the other hand, Peru, Colombia and Chile judiciously used demand stimulus mainly by expanding public investment and loosening monetary policy. Peru and
Chart 1
Latin America: Real GDP Growth
Chart 2
Low-beta Latin American 5-Year CDS Spreads
source: CIBC, Bloomberg.
source: CIBC, Bloomberg.
-2%
0%
2%
4%
6%
8%
10%
Argentina Brazil Chile Colombia mexico Peru Venezuela LAtAm
2011 2012 2013 2014
50
70
90
110
130
150
170
190
210
230
nov-10 may-11 nov-11 may-12
Brazil Peru Colombia mexico Chile
bps
macro outlook: Latin America and the CaribbeanJohn H. welch, macro strategy
After almost a decade of commodities-induced economic boom, Latin America has increasingly had to rely on internal demand rather than continued improvements in the terms of trade. Commodity prices have held up but have not shown the gains that generated significant wealth transfer to the region. many hoped that demand stimulus with a wide variety of supply-side policies would foster this transition.
LATAM GROWTH AND OUTPERFORMANCE
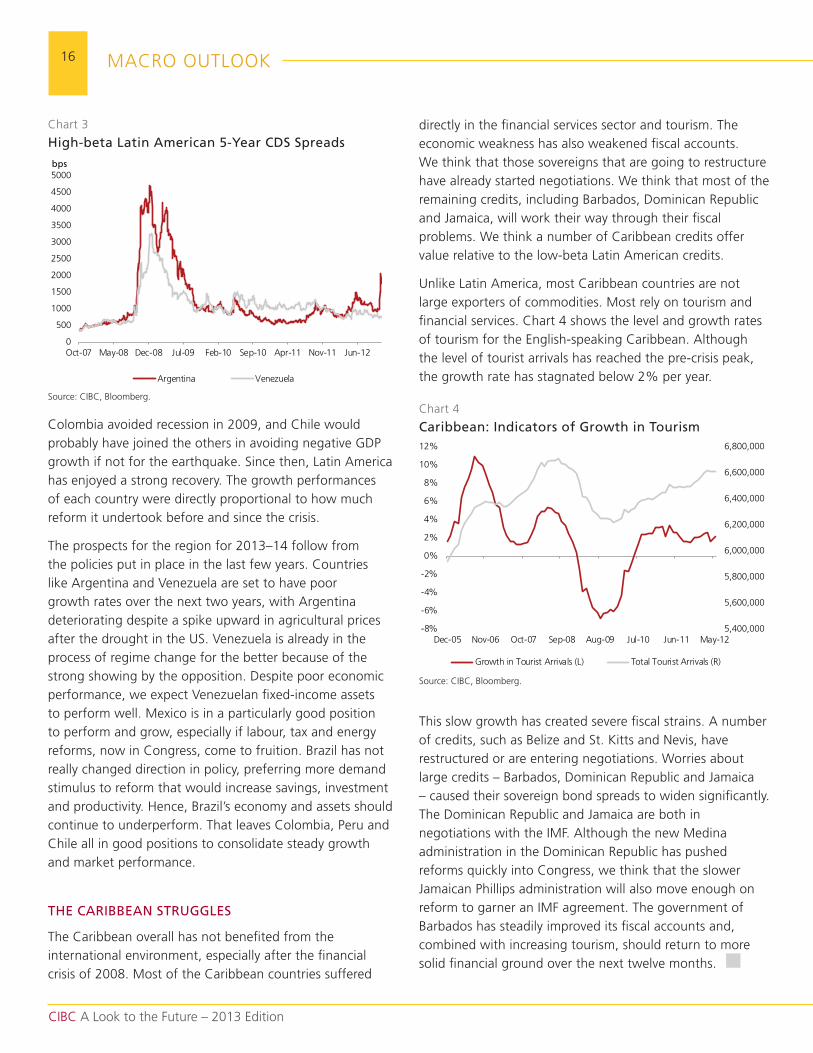
the performance of Latin American asset markets in 2012 reflected the success that each government had in fostering the transition. Chart 1 shows Latin American real GdP growth. Low-beta countries Peru, Colombia, Chile and mexico have outperformed Brazil as measured by five-year Cds spreads (Chart 2). High-beta Venezuela has performed the best of all Latin American fixed-income markets, albeit from a high original spread, on the hopes of regime change. And spread remains extremely high (Chart 3). the recent radicalization of economic policy in Argentina has dashed hopes of good asset performance, especially after the nationalization of the YPF petroleum company.
we expect asset price performance in 2013 to reflect how well each country consolidates its recent gains. that leaves mexico, Peru, Colombia, and Chile in good stead to perform well economically and in the markets in 2013. we expect Venezuela to again outperform, especially in fixed-income markets, inching toward regime change despite President Hugo Chavez’s re-election.
unfortunately, leaving internal growth to take over as the prime mover of the economy has proven more difficult than many governments thought. the Brazilian government has aggressively pursued stimulus through fiscal and monetary ease in addition to special packages mainly targeted to
16
CIBC A Look to the Future – 2013 Edition
mACro outLook
directly in the financial services sector and tourism. the economic weakness has also weakened fiscal accounts. we think that those sovereigns that are going to restructure have already started negotiations. we think that most of the remaining credits, including Barbados, dominican republic and Jamaica, will work their way through their fiscal problems. we think a number of Caribbean credits offer value relative to the low-beta Latin American credits.
unlike Latin America, most Caribbean countries are not large exporters of commodities. most rely on tourism and financial services. Chart 4 shows the level and growth rates of tourism for the English-speaking Caribbean. Although the level of tourist arrivals has reached the pre-crisis peak, the growth rate has stagnated below 2% per year.
this slow growth has created severe fiscal strains. A number of credits, such as Belize and st. kitts and nevis, have restructured or are entering negotiations. worries about large credits – Barbados, dominican republic and Jamaica – caused their sovereign bond spreads to widen significantly. the dominican republic and Jamaica are both in negotiations with the ImF. Although the new medina administration in the dominican republic has pushed reforms quickly into Congress, we think that the slower Jamaican Phillips administration will also move enough on reform to garner an ImF agreement. the government of Barbados has steadily improved its fiscal accounts and, combined with increasing tourism, should return to more solid financial ground over the next twelve months.
Colombia avoided recession in 2009, and Chile would probably have joined the others in avoiding negative GdP growth if not for the earthquake. since then, Latin America has enjoyed a strong recovery. the growth performances of each country were directly proportional to how much reform it undertook before and since the crisis.
the prospects for the region for 2013–14 follow from the policies put in place in the last few years. Countries like Argentina and Venezuela are set to have poor growth rates over the next two years, with Argentina deteriorating despite a spike upward in agricultural prices after the drought in the us. Venezuela is already in the process of regime change for the better because of the strong showing by the opposition. despite poor economic performance, we expect Venezuelan fixed-income assets to perform well. mexico is in a particularly good position to perform and grow, especially if labour, tax and energy reforms, now in Congress, come to fruition. Brazil has not really changed direction in policy, preferring more demand stimulus to reform that would increase savings, investment and productivity. Hence, Brazil’s economy and assets should continue to underperform. that leaves Colombia, Peru and Chile all in good positions to consolidate steady growth and market performance.
THE CARIBBEAN STRUGGLES
the Caribbean overall has not benefited from the international environment, especially after the financial crisis of 2008. most of the Caribbean countries suffered
Chart 3
High-beta Latin American 5-Year CDS Spreads
Chart 4
Caribbean: Indicators of Growth in Tourism
source: CIBC, Bloomberg.
source: CIBC, Bloomberg.
0
500
1000
1500
2000
2500
3000
3500
4000
4500
5000
oct-07 may-08 dec-08 Jul-09 Feb-10 sep-10 Apr-11 nov-11 Jun-12
Argentina Venezuela
bps
5,400,000
5,600,000
5,800,000
6,000,000
6,200,000
6,400,000
6,600,000
6,800,000
-8%
-6%
-4%
-2%
0%
2%
4%
6%
8%
10%
12%
dec-05 nov-06 oct-07 sep-08 Aug-09 Jul-10 Jun-11 may-12
Growth in tourist Arrivals (L) total tourist Arrivals (r)
17
CIBC A Look to the Future – 2013 Edition
InVEstInG
FX strategy: G3Jeremy stretch, macro strategy
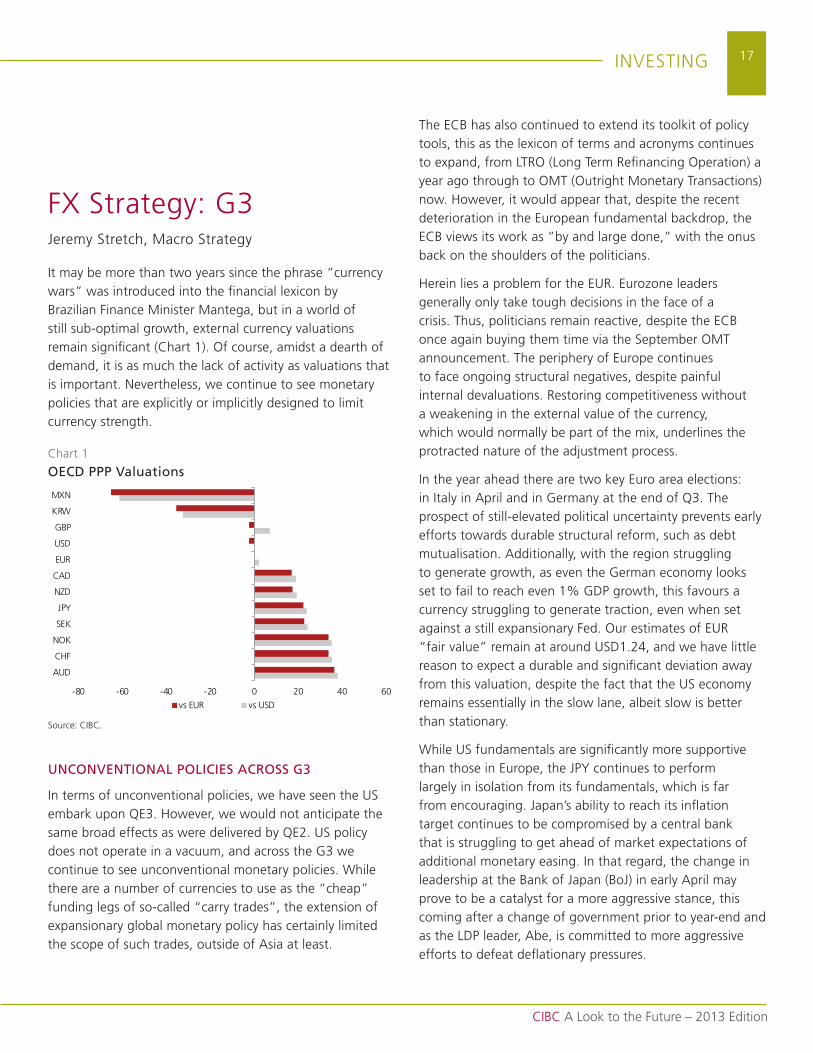
It may be more than two years since the phrase “currency wars” was introduced into the financial lexicon by Brazilian Finance minister mantega, but in a world of still sub-optimal growth, external currency valuations remain significant (Chart 1). of course, amidst a dearth of demand, it is as much the lack of activity as valuations that is important. nevertheless, we continue to see monetary policies that are explicitly or implicitly designed to limit currency strength.
UNCONVENTIONAL POLICIES ACROSS G3
In terms of unconventional policies, we have seen the us embark upon QE3. However, we would not anticipate the same broad effects as were delivered by QE2. us policy does not operate in a vacuum, and across the G3 we continue to see unconventional monetary policies. while there are a number of currencies to use as the “cheap” funding legs of so-called “carry trades”, the extension of expansionary global monetary policy has certainly limited the scope of such trades, outside of Asia at least.
the ECB has also continued to extend its toolkit of policy tools, this as the lexicon of terms and acronyms continues to expand, from Ltro (Long term refinancing operation) a year ago through to omt (outright monetary transactions) now. However, it would appear that, despite the recent deterioration in the European fundamental backdrop, the ECB views its work as ”by and large done,” with the onus back on the shoulders of the politicians.
Herein lies a problem for the Eur. Eurozone leaders generally only take tough decisions in the face of a crisis. thus, politicians remain reactive, despite the ECB once again buying them time via the september omt announcement. the periphery of Europe continues to face ongoing structural negatives, despite painful internal devaluations. restoring competitiveness without a weakening in the external value of the currency, which would normally be part of the mix, underlines the protracted nature of the adjustment process.
In the year ahead there are two key Euro area elections: in Italy in April and in Germany at the end of Q3. the prospect of still-elevated political uncertainty prevents early efforts towards durable structural reform, such as debt mutualisation. Additionally, with the region struggling to generate growth, as even the German economy looks set to fail to reach even 1% GdP growth, this favours a currency struggling to generate traction, even when set against a still expansionary Fed. our estimates of Eur ”fair value” remain at around usd1.24, and we have little reason to expect a durable and significant deviation away from this valuation, despite the fact that the us economy remains essentially in the slow lane, albeit slow is better than stationary.
while us fundamentals are significantly more supportive than those in Europe, the JPY continues to perform largely in isolation from its fundamentals, which is far from encouraging. Japan’s ability to reach its inflation target continues to be compromised by a central bank that is struggling to get ahead of market expectations of additional monetary easing. In that regard, the change in leadership at the Bank of Japan (BoJ) in early April may prove to be a catalyst for a more aggressive stance, this coming after a change of government prior to year-end and as the LdP leader, Abe, is committed to more aggressive efforts to defeat deflationary pressures.
Chart 1
OECD PPP Valuations
source: CIBC.
-80 -60 -40 -20 0 20 40 60
Aud
CHF
nok
sEk
JPY
nZd
CAd
Eur
usd
GBP
krw
mXn
vs Eur vs usd
18
CIBC A Look to the Future – 2013 Edition
InVEstInG
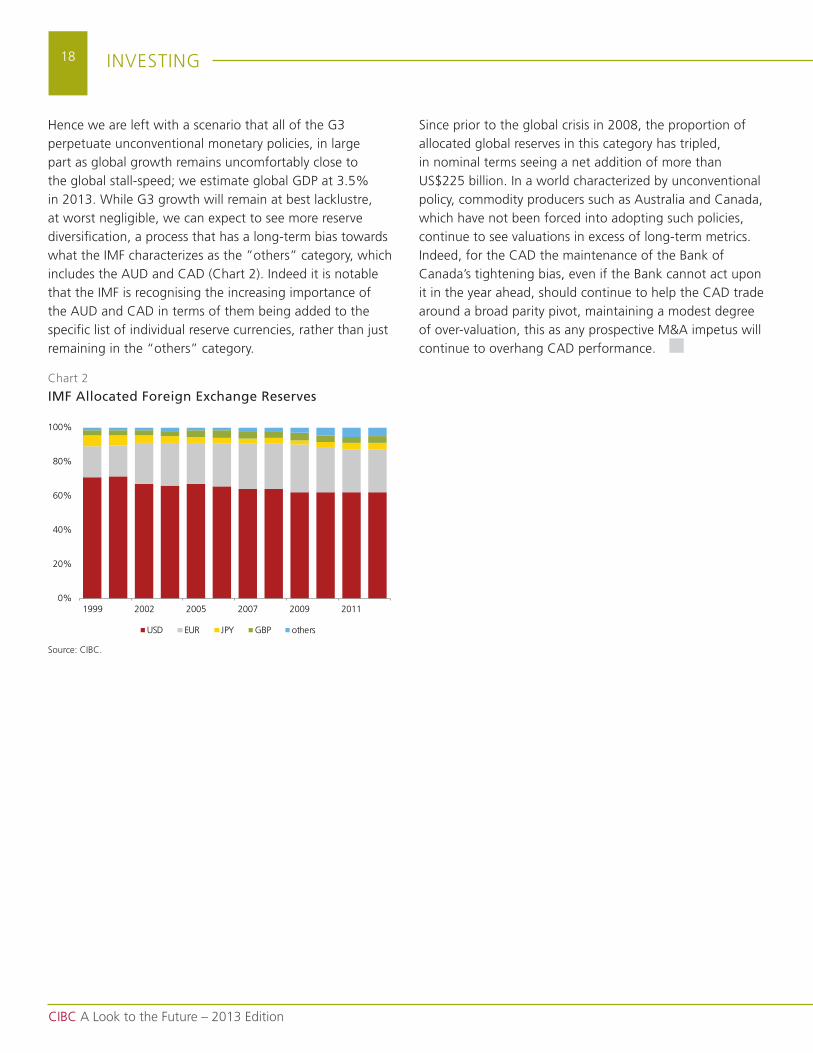
Hence we are left with a scenario that all of the G3 perpetuate unconventional monetary policies, in large part as global growth remains uncomfortably close to the global stall-speed; we estimate global GdP at 3.5% in 2013. while G3 growth will remain at best lacklustre, at worst negligible, we can expect to see more reserve diversification, a process that has a long-term bias towards what the ImF characterizes as the ”others” category, which includes the Aud and CAd (Chart 2). Indeed it is notable that the ImF is recognising the increasing importance of the Aud and CAd in terms of them being added to the specific list of individual reserve currencies, rather than just remaining in the “others” category.
Chart 2
IMF Allocated Foreign Exchange Reserves
0%
20%
40%
60%
80%
100%
1999 2002 2005 2007 2009 2011
Hun
dred
s
usd Eur JPY GBP others
source: CIBC.
since prior to the global crisis in 2008, the proportion of allocated global reserves in this category has tripled, in nominal terms seeing a net addition of more than us$225 billion. In a world characterized by unconventional policy, commodity producers such as Australia and Canada, which have not been forced into adopting such policies, continue to see valuations in excess of long-term metrics. Indeed, for the CAd the maintenance of the Bank of Canada’s tightening bias, even if the Bank cannot act upon it in the year ahead, should continue to help the CAd trade around a broad parity pivot, maintaining a modest degree of over-valuation, this as any prospective m&A impetus will continue to overhang CAd performance.
19
CIBC A Look to the Future – 2013 Edition
InVEstInG
FX strategy: AsiaPatrick Bennett, macro strategy
Asian currency strategy in 2013 will broadly comprise buying upon occasions of weakness against the us dollar. such an approach is founded on a number of assumptions: 1) that there is market acceptance that external demand is likely to remain soft through the year; 2) that the global economy will avoid a calamitous event; and 3) that, very importantly, liquidity provided by widespread quantitative easing will remain in play and, in turn, find attraction in Asian assets.
BEST PERFORMER IN 2013
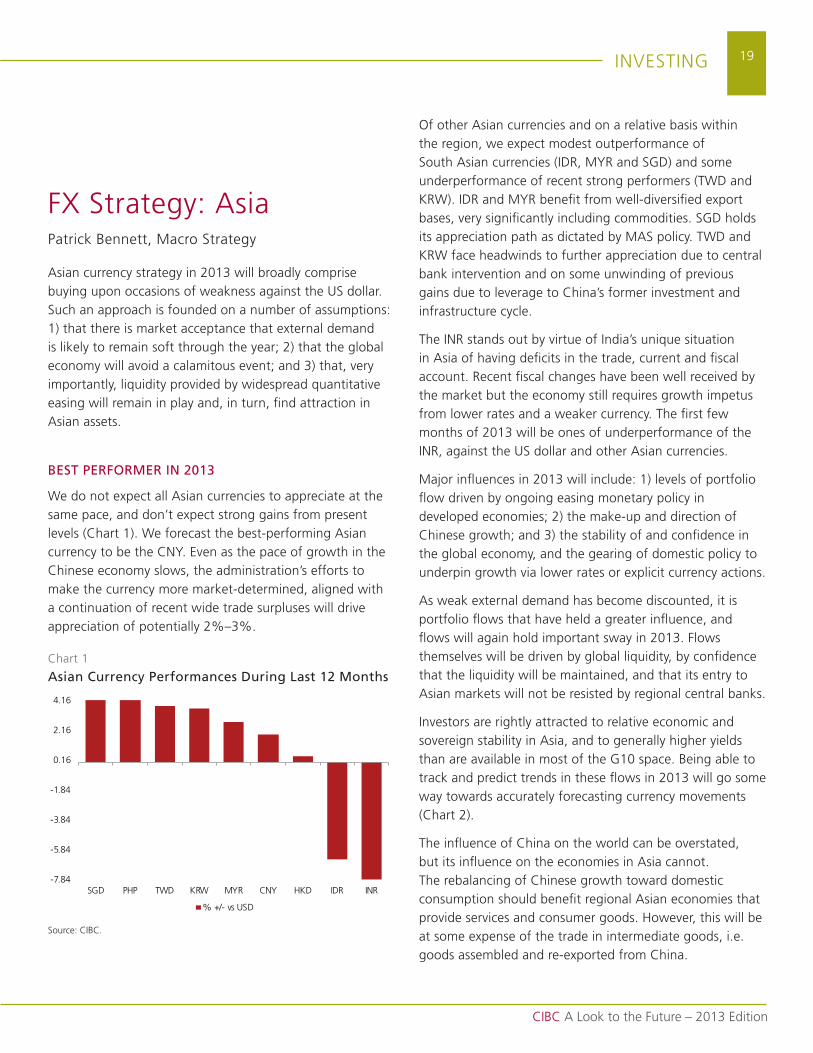
we do not expect all Asian currencies to appreciate at the same pace, and don’t expect strong gains from present levels (Chart 1). we forecast the best-performing Asian currency to be the CnY. Even as the pace of growth in the Chinese economy slows, the administration’s efforts to make the currency more market-determined, aligned with a continuation of recent wide trade surpluses will drive appreciation of potentially 2%–3%.
of other Asian currencies and on a relative basis within the region, we expect modest outperformance of south Asian currencies (Idr, mYr and sGd) and some underperformance of recent strong performers (twd and krw). Idr and mYr benefit from well-diversified export bases, very significantly including commodities. sGd holds its appreciation path as dictated by mAs policy. twd and krw face headwinds to further appreciation due to central bank intervention and on some unwinding of previous gains due to leverage to China’s former investment and infrastructure cycle.
the Inr stands out by virtue of India’s unique situation in Asia of having deficits in the trade, current and fiscal account. recent fiscal changes have been well received by the market but the economy still requires growth impetus from lower rates and a weaker currency. the first few months of 2013 will be ones of underperformance of the Inr, against the us dollar and other Asian currencies.
major influences in 2013 will include: 1) levels of portfolio flow driven by ongoing easing monetary policy in developed economies; 2) the make-up and direction of Chinese growth; and 3) the stability of and confidence in the global economy, and the gearing of domestic policy to underpin growth via lower rates or explicit currency actions.
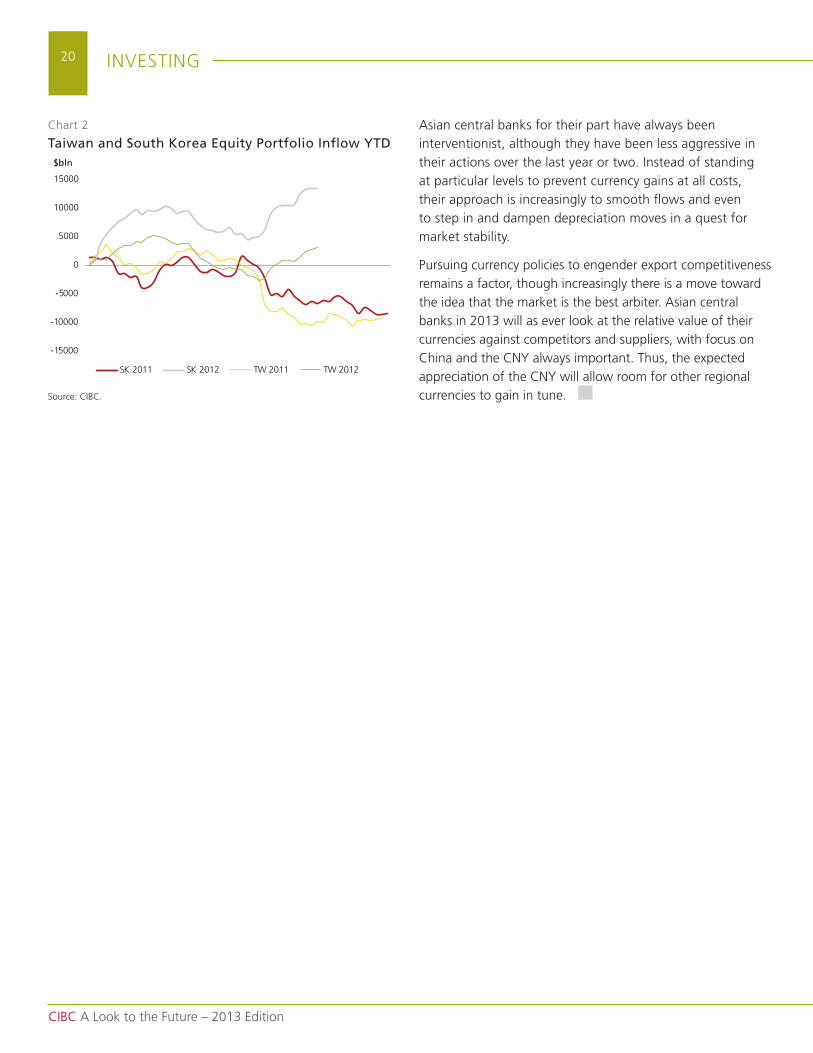
As weak external demand has become discounted, it is portfolio flows that have held a greater influence, and flows will again hold important sway in 2013. Flows themselves will be driven by global liquidity, by confidence that the liquidity will be maintained, and that its entry to Asian markets will not be resisted by regional central banks.
Investors are rightly attracted to relative economic and sovereign stability in Asia, and to generally higher yields than are available in most of the G10 space. Being able to track and predict trends in these flows in 2013 will go some way towards accurately forecasting currency movements (Chart 2).
the influence of China on the world can be overstated, but its influence on the economies in Asia cannot. the rebalancing of Chinese growth toward domestic consumption should benefit regional Asian economies that provide services and consumer goods. However, this will be at some expense of the trade in intermediate goods, i.e. goods assembled and re-exported from China.
Chart 1
Asian Currency Performances During Last 12 Months
source: CIBC.
-7.84
-5.84
-3.84
-1.84
0.16
2.16
4.16
sGd PHP twd krw mYr CnY Hkd Idr Inr
% +/- vs usd
20
CIBC A Look to the Future – 2013 Edition
InVEstInG
Asian central banks for their part have always been interventionist, although they have been less aggressive in their actions over the last year or two. Instead of standing at particular levels to prevent currency gains at all costs, their approach is increasingly to smooth flows and even to step in and dampen depreciation moves in a quest for market stability.
Pursuing currency policies to engender export competitiveness remains a factor, though increasingly there is a move toward the idea that the market is the best arbiter. Asian central banks in 2013 will as ever look at the relative value of their currencies against competitors and suppliers, with focus on China and the CnY always important. thus, the expected appreciation of the CnY will allow room for other regional currencies to gain in tune.
Chart 2
Taiwan and South Korea Equity Portfolio Inflow YTD
source: CIBC.
-15000
-10000
-5000
0
5000
10000
15000
$bln
sk 2011 sk 2012 tw 2011 tw 2012
21
CIBC A Look to the Future – 2013 Edition
InVEstInG
FX strategy: Latin AmericaJohn H. welch, macro strategy
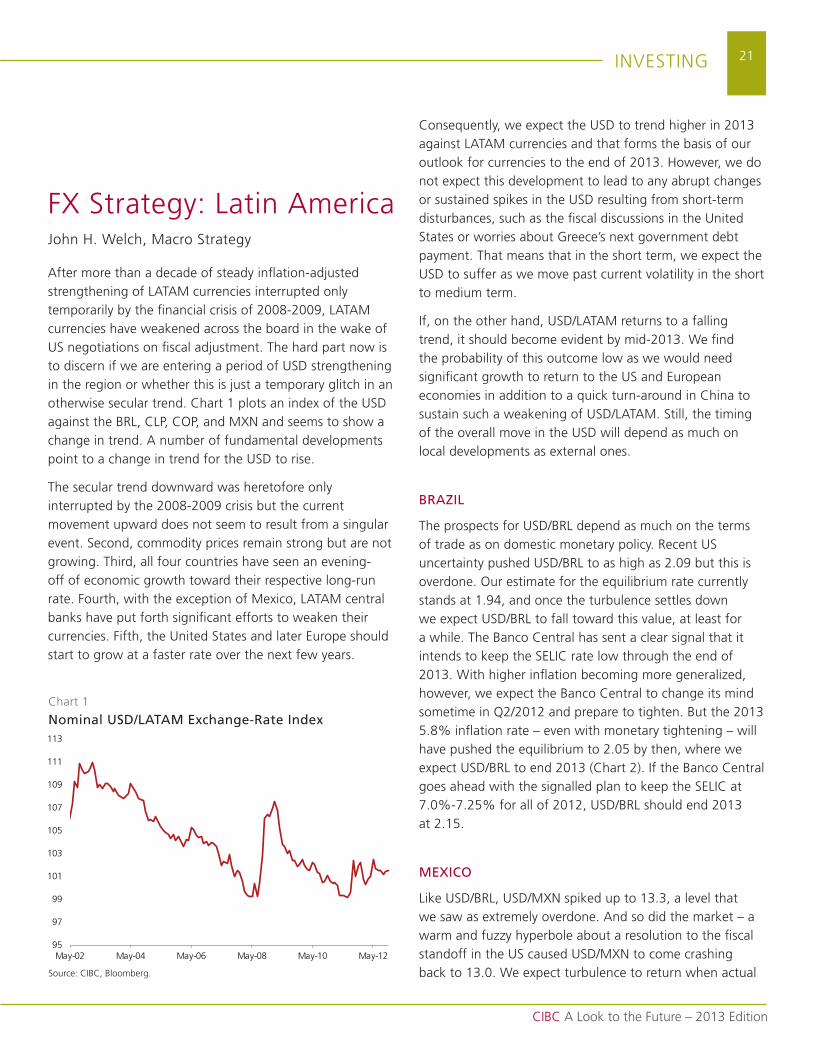
After more than a decade of steady inflation-adjusted strengthening of LAtAm currencies interrupted only temporarily by the financial crisis of 2008-2009, LAtAm currencies have weakened across the board in the wake of us negotiations on fiscal adjustment. the hard part now is to discern if we are entering a period of usd strengthening in the region or whether this is just a temporary glitch in an otherwise secular trend. Chart 1 plots an index of the usd against the BrL, CLP, CoP, and mXn and seems to show a change in trend. A number of fundamental developments point to a change in trend for the usd to rise.
the secular trend downward was heretofore only interrupted by the 2008-2009 crisis but the current movement upward does not seem to result from a singular event. second, commodity prices remain strong but are not growing. third, all four countries have seen an evening-off of economic growth toward their respective long-run rate. Fourth, with the exception of mexico, LAtAm central banks have put forth significant efforts to weaken their currencies. Fifth, the united states and later Europe should start to grow at a faster rate over the next few years.
Consequently, we expect the usd to trend higher in 2013 against LAtAm currencies and that forms the basis of our outlook for currencies to the end of 2013. However, we do not expect this development to lead to any abrupt changes or sustained spikes in the usd resulting from short-term disturbances, such as the fiscal discussions in the united states or worries about Greece’s next government debt payment. that means that in the short term, we expect the usd to suffer as we move past current volatility in the short to medium term.
If, on the other hand, usd/LAtAm returns to a falling trend, it should become evident by mid-2013. we find the probability of this outcome low as we would need significant growth to return to the us and European economies in addition to a quick turn-around in China to sustain such a weakening of usd/LAtAm. still, the timing of the overall move in the usd will depend as much on local developments as external ones.
BRAZIL
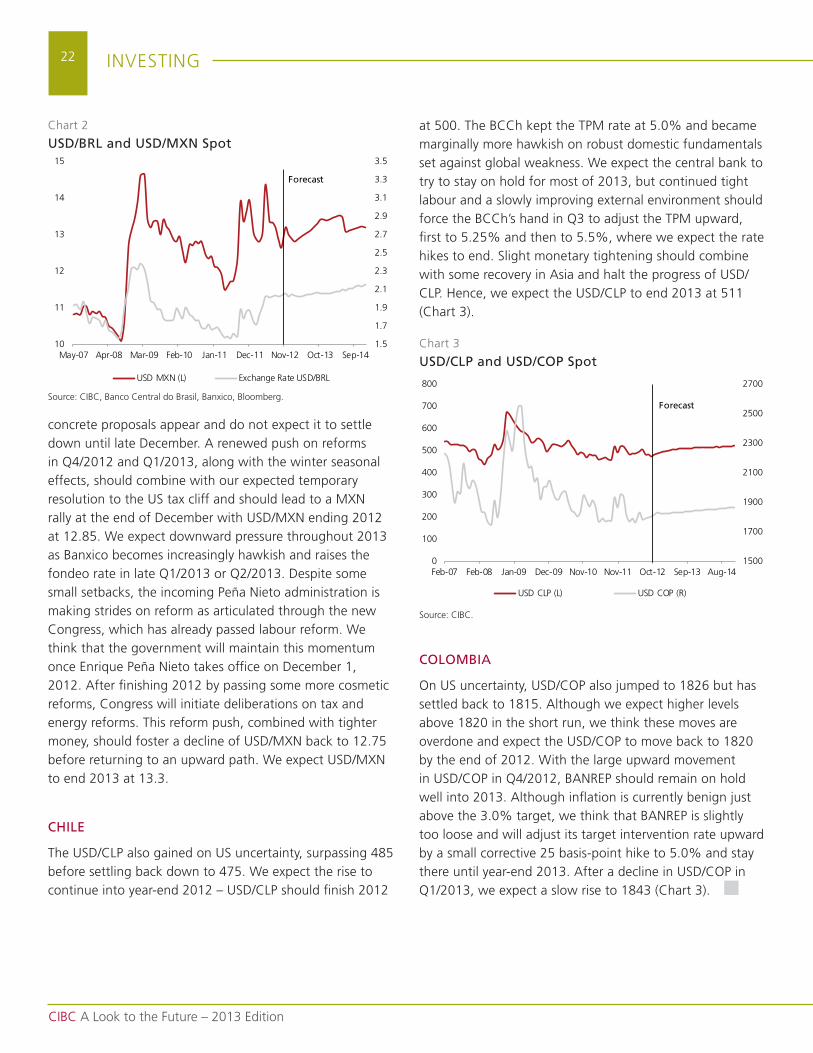
the prospects for usd/BrL depend as much on the terms of trade as on domestic monetary policy. recent us uncertainty pushed usd/BrL to as high as 2.09 but this is overdone. our estimate for the equilibrium rate currently stands at 1.94, and once the turbulence settles down we expect usd/BrL to fall toward this value, at least for a while. the Banco Central has sent a clear signal that it intends to keep the sELIC rate low through the end of 2013. with higher inflation becoming more generalized, however, we expect the Banco Central to change its mind sometime in Q2/2012 and prepare to tighten. But the 2013 5.8% inflation rate – even with monetary tightening – will have pushed the equilibrium to 2.05 by then, where we expect usd/BrL to end 2013 (Chart 2). If the Banco Central goes ahead with the signalled plan to keep the sELIC at 7.0%-7.25% for all of 2012, usd/BrL should end 2013 at 2.15.
MEXICO
Like usd/BrL, usd/mXn spiked up to 13.3, a level that we saw as extremely overdone. And so did the market – a warm and fuzzy hyperbole about a resolution to the fiscal standoff in the us caused usd/mXn to come crashing back to 13.0. we expect turbulence to return when actual
Chart 1
Nominal USD/LATAM Exchange-Rate Index
source: CIBC, Bloomberg.
95
97
99
101
103
105
107
109
111
113
may-02 may-04 may-06 may-08 may-10 may-12
22
CIBC A Look to the Future – 2013 Edition
InVEstInG
at 500. the BCCh kept the tPm rate at 5.0% and became marginally more hawkish on robust domestic fundamentals set against global weakness. we expect the central bank to try to stay on hold for most of 2013, but continued tight labour and a slowly improving external environment should force the BCCh’s hand in Q3 to adjust the tPm upward, first to 5.25% and then to 5.5%, where we expect the rate hikes to end. slight monetary tightening should combine with some recovery in Asia and halt the progress of usd/CLP. Hence, we expect the usd/CLP to end 2013 at 511 (Chart 3).
COLOMBIA
on us uncertainty, usd/CoP also jumped to 1826 but has settled back to 1815. Although we expect higher levels above 1820 in the short run, we think these moves are overdone and expect the usd/CoP to move back to 1820 by the end of 2012. with the large upward movement in usd/CoP in Q4/2012, BAnrEP should remain on hold well into 2013. Although inflation is currently benign just above the 3.0% target, we think that BAnrEP is slightly too loose and will adjust its target intervention rate upward by a small corrective 25 basis-point hike to 5.0% and stay there until year-end 2013. After a decline in usd/CoP in Q1/2013, we expect a slow rise to 1843 (Chart 3).
concrete proposals appear and do not expect it to settle down until late december. A renewed push on reforms in Q4/2012 and Q1/2013, along with the winter seasonal effects, should combine with our expected temporary resolution to the us tax cliff and should lead to a mXn rally at the end of december with usd/mXn ending 2012 at 12.85. we expect downward pressure throughout 2013 as Banxico becomes increasingly hawkish and raises the fondeo rate in late Q1/2013 or Q2/2013. despite some small setbacks, the incoming Peña nieto administration is making strides on reform as articulated through the new Congress, which has already passed labour reform. we think that the government will maintain this momentum once Enrique Peña nieto takes office on december 1, 2012. After finishing 2012 by passing some more cosmetic reforms, Congress will initiate deliberations on tax and energy reforms. this reform push, combined with tighter money, should foster a decline of usd/mXn back to 12.75 before returning to an upward path. we expect usd/mXn to end 2013 at 13.3.
CHILE
the usd/CLP also gained on us uncertainty, surpassing 485 before settling back down to 475. we expect the rise to continue into year-end 2012 – usd/CLP should finish 2012
Chart 2
USD/BRL and USD/MXN Spot
source: CIBC, Banco Central do Brasil, Banxico, Bloomberg.
1.5
1.7
1.9
2.1
2.3
2.5
2.7
2.9
3.1
3.3
3.5
10
11
12
13
14
15
may-07 Apr-08 mar-09 Feb-10 Jan-11 dec-11 nov-12 oct-13 sep-14
usd mXn (L) Exchange rate usd/BrL
Forecast
Chart 3
USD/CLP and USD/COP Spot
source: CIBC.
1500
1700
1900
2100
2300
2500
2700
0
100
200
300
400
500
600
700
800
Feb-07 Feb-08 Jan-09 dec-09 nov-10 nov-11 oct-12 sep-13 Aug-14
usd CLP (L) usd CoP (r)
Forecast
23
CIBC A Look to the Future – 2013 Edition
InVEstInG
trAdE IdEA
usd/BrL: Buy a two-sided Butterflymeaghan stoll-kimball, FX structuring
robert Gunja, FX structuring
Bipan rai, macro strategy
“Unfortunately, using internal growth to take over as the prime mover of the economy has proven more difficult than many governments thought” – John H. Welch, Macro Strategy (ibid, page 15).
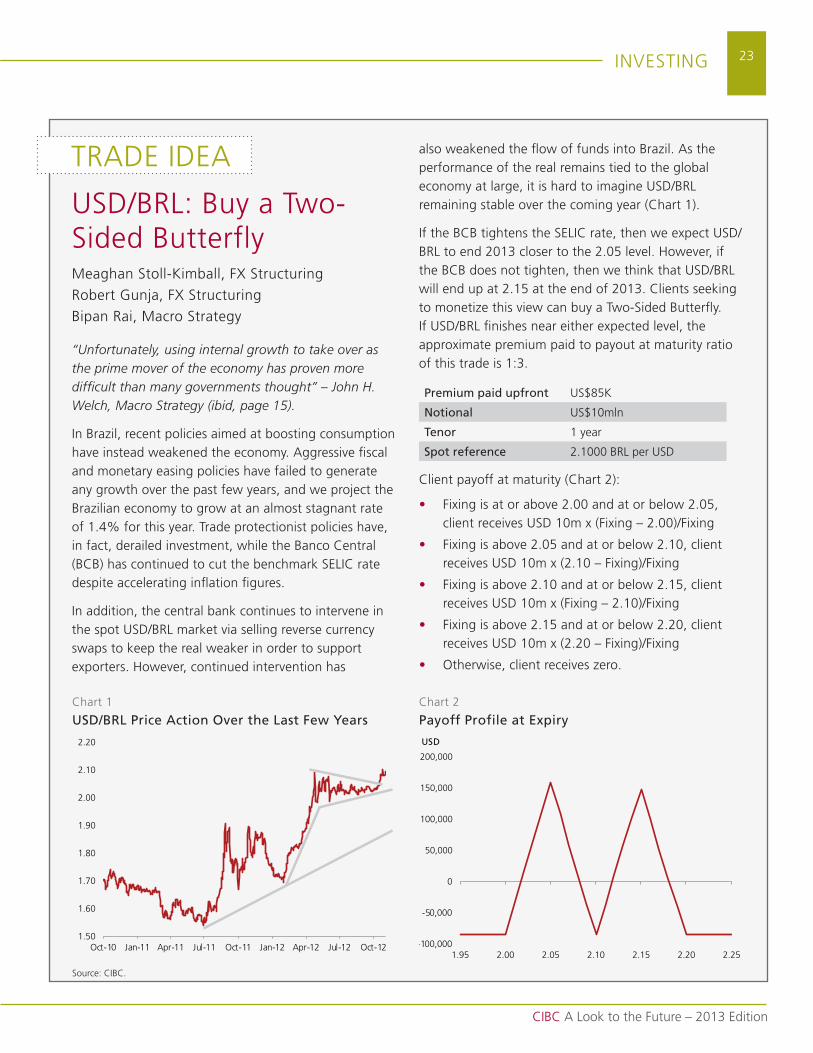
In Brazil, recent policies aimed at boosting consumption have instead weakened the economy. Aggressive fiscal and monetary easing policies have failed to generate any growth over the past few years, and we project the Brazilian economy to grow at an almost stagnant rate of 1.4% for this year. trade protectionist policies have, in fact, derailed investment, while the Banco Central (BCB) has continued to cut the benchmark sELIC rate despite accelerating inflation figures.
In addition, the central bank continues to intervene in the spot usd/BrL market via selling reverse currency swaps to keep the real weaker in order to support exporters. However, continued intervention has
also weakened the flow of funds into Brazil. As the performance of the real remains tied to the global economy at large, it is hard to imagine usd/BrL remaining stable over the coming year (Chart 1).
If the BCB tightens the sELIC rate, then we expect usd/BrL to end 2013 closer to the 2.05 level. However, if the BCB does not tighten, then we think that usd/BrL will end up at 2.15 at the end of 2013. Clients seeking to monetize this view can buy a two-sided Butterfly. If usd/BrL finishes near either expected level, the approximate premium paid to payout at maturity ratio of this trade is 1:3.
Premium paid upfront us$85k
Notional us$10mln
Tenor 1 year
Spot reference 2.1000 BrL per usd
Client payoff at maturity (Chart 2):
• Fixing is at or above 2.00 and at or below 2.05, client receives usd 10m x (Fixing – 2.00)/Fixing
• Fixing is above 2.05 and at or below 2.10, client receives usd 10m x (2.10 – Fixing)/Fixing
• Fixing is above 2.10 and at or below 2.15, client receives usd 10m x (Fixing – 2.10)/Fixing
• Fixing is above 2.15 and at or below 2.20, client receives usd 10m x (2.20 – Fixing)/Fixing
• otherwise, client receives zero.
Chart 1
USD/BRL Price Action Over the Last Few YearsChart 2
Payoff Profile at Expiry
source: CIBC.
-100,000
-50,000
0
50,000
100,000
150,000
200,000
1.95 2.00 2.05 2.10 2.15 2.20 2.25
USD
1.50
1.60
1.70
1.80
1.90
2.00
2.10
2.20
oct-10 Jan-11 Apr-11 Jul-11 oct-11 Jan-12 Apr-12 Jul-12 oct-12
24
CIBC A Look to the Future – 2013 Edition
InVEstInG
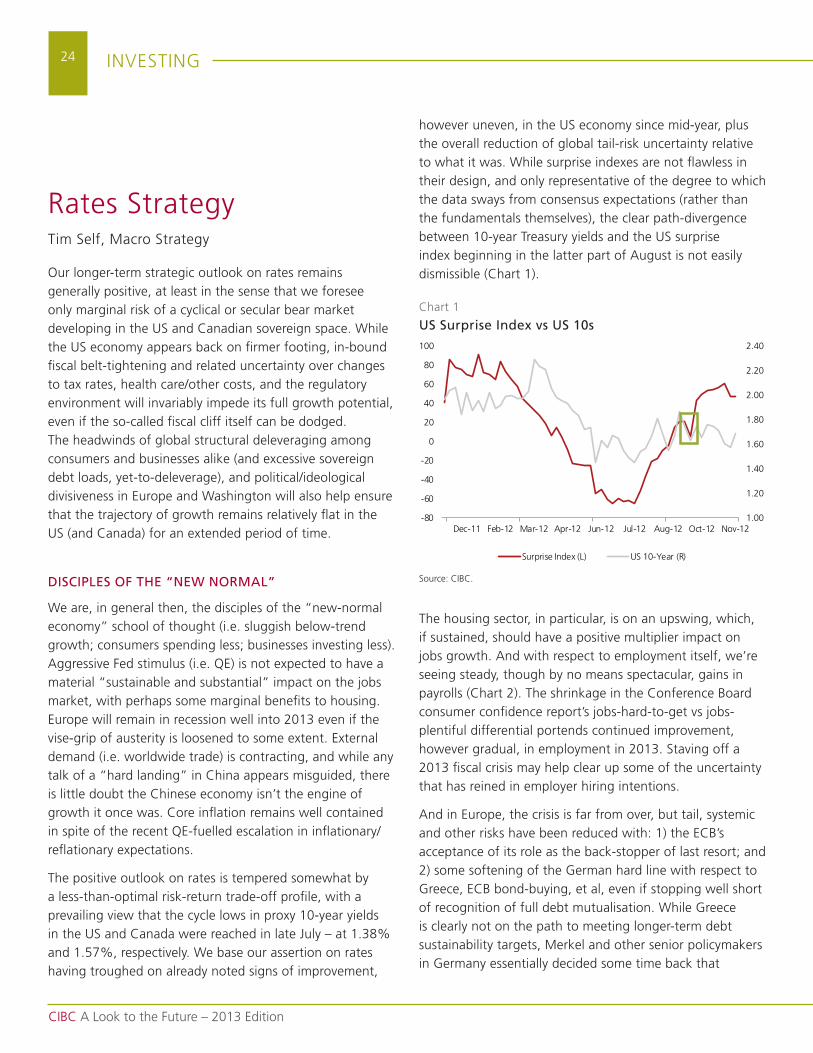
however uneven, in the us economy since mid-year, plus the overall reduction of global tail-risk uncertainty relative to what it was. while surprise indexes are not flawless in their design, and only representative of the degree to which the data sways from consensus expectations (rather than the fundamentals themselves), the clear path-divergence between 10-year treasury yields and the us surprise index beginning in the latter part of August is not easily dismissible (Chart 1).
the housing sector, in particular, is on an upswing, which, if sustained, should have a positive multiplier impact on jobs growth. And with respect to employment itself, we’re seeing steady, though by no means spectacular, gains in payrolls (Chart 2). the shrinkage in the Conference Board consumer confidence report’s jobs-hard-to-get vs jobs-plentiful differential portends continued improvement, however gradual, in employment in 2013. staving off a 2013 fiscal crisis may help clear up some of the uncertainty that has reined in employer hiring intentions.
And in Europe, the crisis is far from over, but tail, systemic and other risks have been reduced with: 1) the ECB’s acceptance of its role as the back-stopper of last resort; and 2) some softening of the German hard line with respect to Greece, ECB bond-buying, et al, even if stopping well short of recognition of full debt mutualisation. while Greece is clearly not on the path to meeting longer-term debt sustainability targets, merkel and other senior policymakers in Germany essentially decided some time back that
rates strategytim self, macro strategy
our longer-term strategic outlook on rates remains generally positive, at least in the sense that we foresee only marginal risk of a cyclical or secular bear market developing in the us and Canadian sovereign space. while the us economy appears back on firmer footing, in-bound fiscal belt-tightening and related uncertainty over changes to tax rates, health care/other costs, and the regulatory environment will invariably impede its full growth potential, even if the so-called fiscal cliff itself can be dodged. the headwinds of global structural deleveraging among consumers and businesses alike (and excessive sovereign debt loads, yet-to-deleverage), and political/ideological divisiveness in Europe and washington will also help ensure that the trajectory of growth remains relatively flat in the us (and Canada) for an extended period of time.
DISCIPLES OF THE “NEW NORMAL”
we are, in general then, the disciples of the “new-normal economy” school of thought (i.e. sluggish below-trend growth; consumers spending less; businesses investing less). Aggressive Fed stimulus (i.e. QE) is not expected to have a material “sustainable and substantial” impact on the jobs market, with perhaps some marginal benefits to housing. Europe will remain in recession well into 2013 even if the vise-grip of austerity is loosened to some extent. External demand (i.e. worldwide trade) is contracting, and while any talk of a “hard landing” in China appears misguided, there is little doubt the Chinese economy isn’t the engine of growth it once was. Core inflation remains well contained in spite of the recent QE-fuelled escalation in inflationary/reflationary expectations.
the positive outlook on rates is tempered somewhat by a less-than-optimal risk-return trade-off profile, with a prevailing view that the cycle lows in proxy 10-year yields in the us and Canada were reached in late July – at 1.38% and 1.57%, respectively. we base our assertion on rates having troughed on already noted signs of improvement,
Chart 1
US Surprise Index vs US 10s
source: CIBC.
1.00
1.20
1.40
1.60
1.80
2.00
2.20
2.40
-80
-60
-40
-20
0
20
40
60
80
100
nov-12oct-12Aug-12Jul-12Jun-12Apr-12mar-12Feb-12dec-11
surprise Index (L) us 10-Year (r)
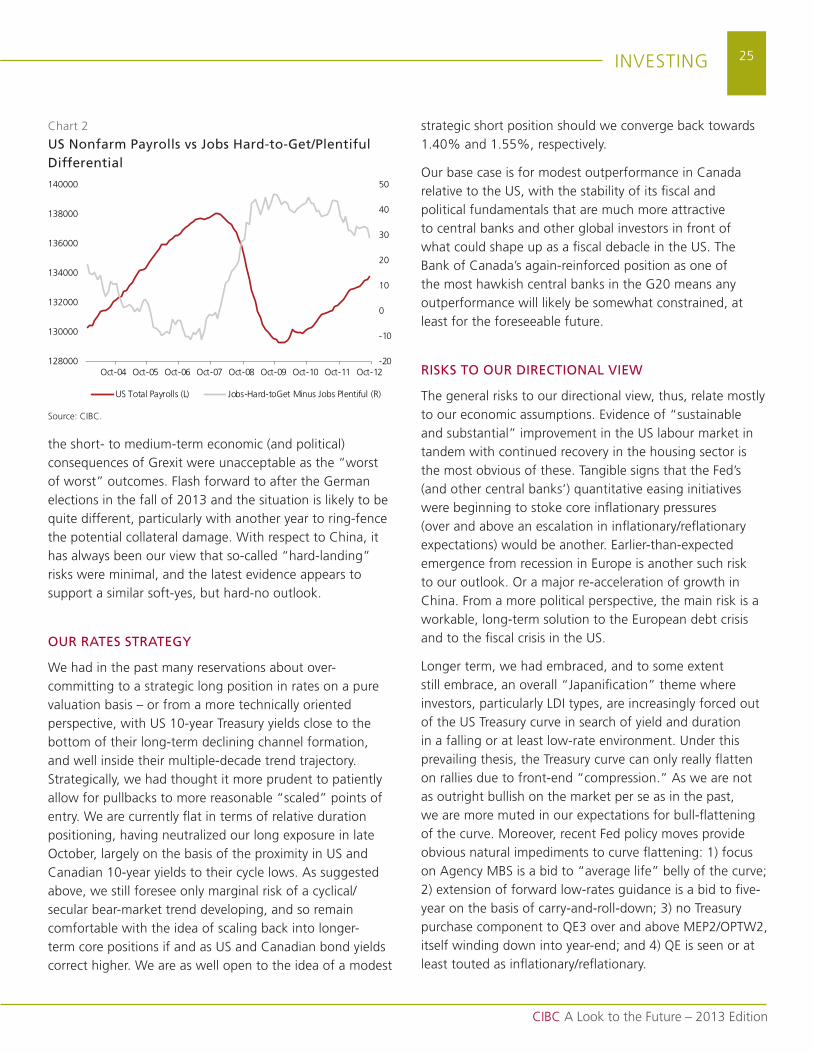
25
CIBC A Look to the Future – 2013 Edition
InVEstInG
the short- to medium-term economic (and political) consequences of Grexit were unacceptable as the “worst of worst” outcomes. Flash forward to after the German elections in the fall of 2013 and the situation is likely to be quite different, particularly with another year to ring-fence the potential collateral damage. with respect to China, it has always been our view that so-called “hard-landing” risks were minimal, and the latest evidence appears to support a similar soft-yes, but hard-no outlook.
OUR RATES STRATEGY
we had in the past many reservations about over-committing to a strategic long position in rates on a pure valuation basis – or from a more technically oriented perspective, with us 10-year treasury yields close to the bottom of their long-term declining channel formation, and well inside their multiple-decade trend trajectory. strategically, we had thought it more prudent to patiently allow for pullbacks to more reasonable “scaled” points of entry. we are currently flat in terms of relative duration positioning, having neutralized our long exposure in late october, largely on the basis of the proximity in us and Canadian 10-year yields to their cycle lows. As suggested above, we still foresee only marginal risk of a cyclical/secular bear-market trend developing, and so remain comfortable with the idea of scaling back into longer-term core positions if and as us and Canadian bond yields correct higher. we are as well open to the idea of a modest
strategic short position should we converge back towards 1.40% and 1.55%, respectively.
our base case is for modest outperformance in Canada relative to the us, with the stability of its fiscal and political fundamentals that are much more attractive to central banks and other global investors in front of what could shape up as a fiscal debacle in the us. the Bank of Canada’s again-reinforced position as one of the most hawkish central banks in the G20 means any outperformance will likely be somewhat constrained, at least for the foreseeable future.
RISKS TO OUR DIRECTIONAL VIEW
the general risks to our directional view, thus, relate mostly to our economic assumptions. Evidence of “sustainable and substantial” improvement in the us labour market in tandem with continued recovery in the housing sector is the most obvious of these. tangible signs that the Fed’s (and other central banks’) quantitative easing initiatives were beginning to stoke core inflationary pressures (over and above an escalation in inflationary/reflationary expectations) would be another. Earlier-than-expected emergence from recession in Europe is another such risk to our outlook. or a major re-acceleration of growth in China. From a more political perspective, the main risk is a workable, long-term solution to the European debt crisis and to the fiscal crisis in the us.
Longer term, we had embraced, and to some extent still embrace, an overall “Japanification” theme where investors, particularly LdI types, are increasingly forced out of the us treasury curve in search of yield and duration in a falling or at least low-rate environment. under this prevailing thesis, the treasury curve can only really flatten on rallies due to front-end “compression.” As we are not as outright bullish on the market per se as in the past, we are more muted in our expectations for bull-flattening of the curve. moreover, recent Fed policy moves provide obvious natural impediments to curve flattening: 1) focus on Agency mBs is a bid to “average life” belly of the curve; 2) extension of forward low-rates guidance is a bid to five-year on the basis of carry-and-roll-down; 3) no treasury purchase component to QE3 over and above mEP2/oPtw2, itself winding down into year-end; and 4) QE is seen or at least touted as inflationary/reflationary.
Chart 2
US Nonfarm Payrolls vs Jobs Hard-to-Get/Plentiful Differential
source: CIBC.
-20
-10
0
10
20
30
40
50
128000
130000
132000
134000
136000
138000
140000
oct-12oct-11oct-10oct-09oct-08oct-07oct-06oct-05oct-04
us total Payrolls (L) Jobs-Hard-toGet minus Jobs Plentiful (r)
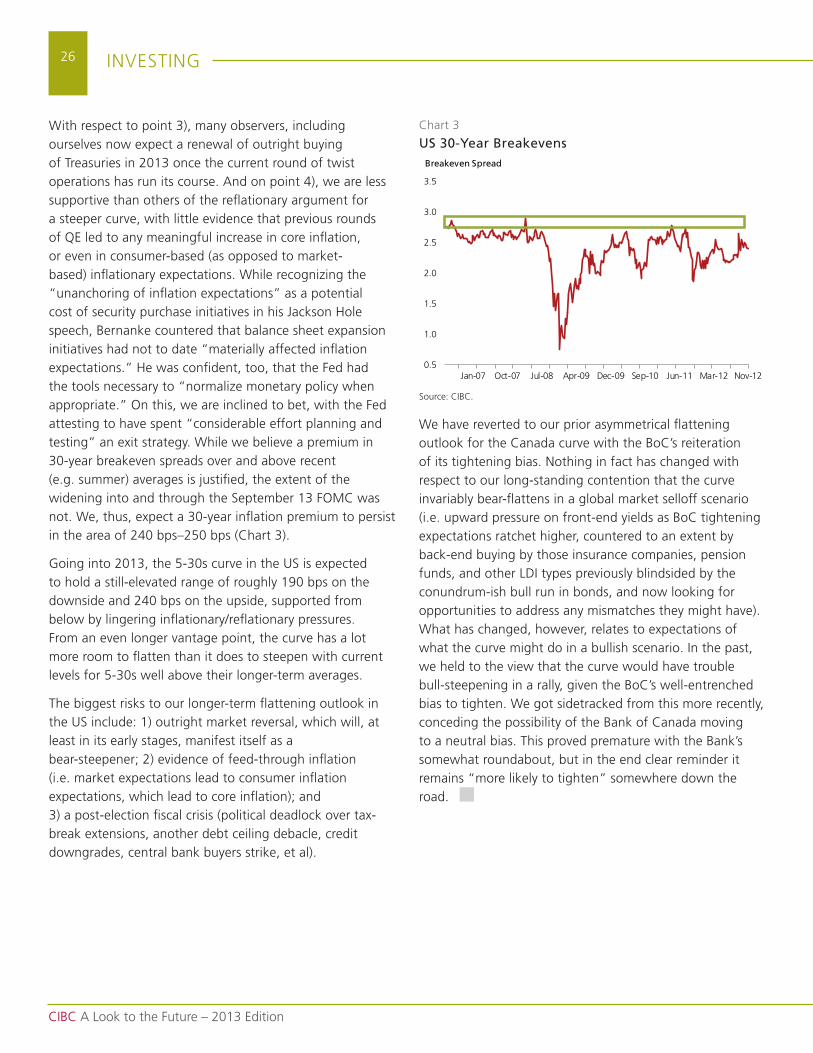
26
CIBC A Look to the Future – 2013 Edition
InVEstInG
we have reverted to our prior asymmetrical flattening outlook for the Canada curve with the BoC’s reiteration of its tightening bias. nothing in fact has changed with respect to our long-standing contention that the curve invariably bear-flattens in a global market selloff scenario (i.e. upward pressure on front-end yields as BoC tightening expectations ratchet higher, countered to an extent by back-end buying by those insurance companies, pension funds, and other LdI types previously blindsided by the conundrum-ish bull run in bonds, and now looking for opportunities to address any mismatches they might have). what has changed, however, relates to expectations of what the curve might do in a bullish scenario. In the past, we held to the view that the curve would have trouble bull-steepening in a rally, given the BoC’s well-entrenched bias to tighten. we got sidetracked from this more recently, conceding the possibility of the Bank of Canada moving to a neutral bias. this proved premature with the Bank’s somewhat roundabout, but in the end clear reminder it remains “more likely to tighten” somewhere down the road.
with respect to point 3), many observers, including ourselves now expect a renewal of outright buying of treasuries in 2013 once the current round of twist operations has run its course. And on point 4), we are less supportive than others of the reflationary argument for a steeper curve, with little evidence that previous rounds of QE led to any meaningful increase in core inflation, or even in consumer-based (as opposed to market-based) inflationary expectations. while recognizing the “unanchoring of inflation expectations” as a potential cost of security purchase initiatives in his Jackson Hole speech, Bernanke countered that balance sheet expansion initiatives had not to date “materially affected inflation expectations.” He was confident, too, that the Fed had the tools necessary to “normalize monetary policy when appropriate.” on this, we are inclined to bet, with the Fed attesting to have spent “considerable effort planning and testing” an exit strategy. while we believe a premium in 30-year breakeven spreads over and above recent (e.g. summer) averages is justified, the extent of the widening into and through the september 13 FomC was not. we, thus, expect a 30-year inflation premium to persist in the area of 240 bps–250 bps (Chart 3).
Going into 2013, the 5-30s curve in the us is expected to hold a still-elevated range of roughly 190 bps on the downside and 240 bps on the upside, supported from below by lingering inflationary/reflationary pressures. From an even longer vantage point, the curve has a lot more room to flatten than it does to steepen with current levels for 5-30s well above their longer-term averages.
the biggest risks to our longer-term flattening outlook in the us include: 1) outright market reversal, which will, at least in its early stages, manifest itself as a bear-steepener; 2) evidence of feed-through inflation (i.e. market expectations lead to consumer inflation expectations, which lead to core inflation); and 3) a post-election fiscal crisis (political deadlock over tax-break extensions, another debt ceiling debacle, credit downgrades, central bank buyers strike, et al).
Chart 3
US 30-Year Breakevens
source: CIBC.
0.5
1.0
1.5
2.0
2.5
3.0
3.5
nov-12mar-12Jun-11sep-10dec-09Apr-09Jul-08oct-07Jan-07
Breakeven Spread
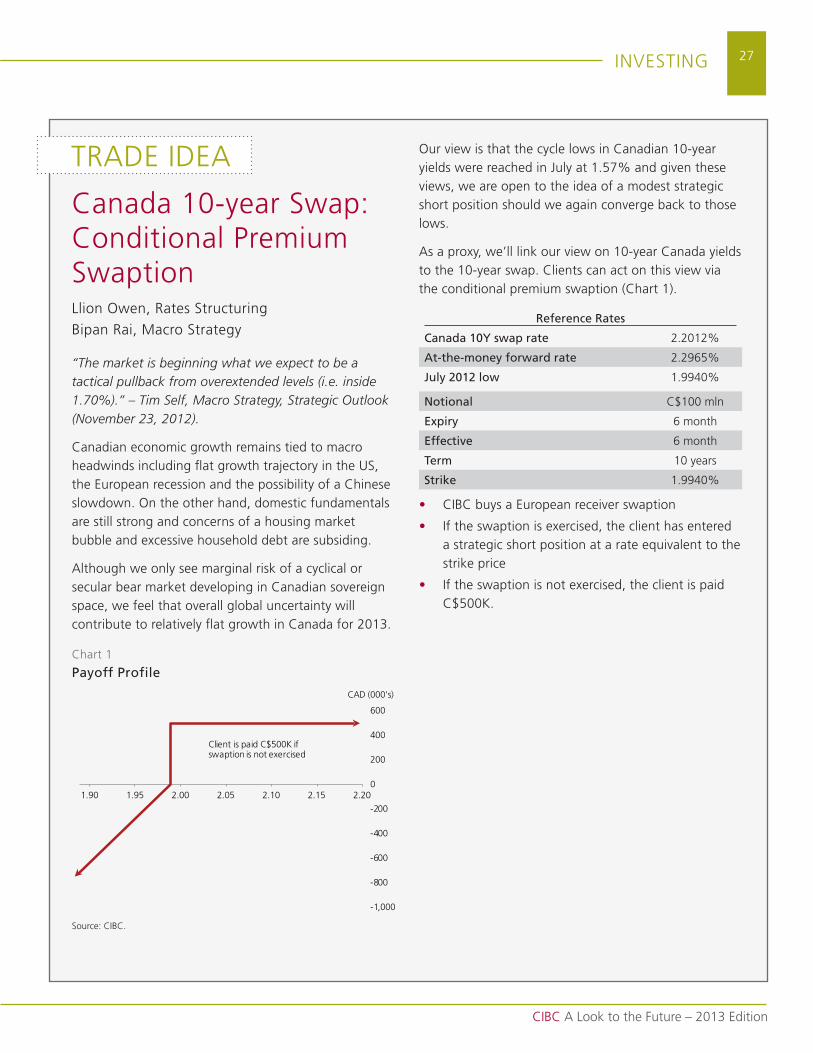
27
CIBC A Look to the Future – 2013 Edition
InVEstInG
trAdE IdEA
Canada 10-year swap: Conditional Premium swaptionLlion owen, rates structuring
Bipan rai, macro strategy
“The market is beginning what we expect to be a tactical pullback from overextended levels (i.e. inside 1.70%).” – Tim Self, Macro Strategy, Strategic Outlook (November 23, 2012).
Canadian economic growth remains tied to macro headwinds including flat growth trajectory in the us, the European recession and the possibility of a Chinese slowdown. on the other hand, domestic fundamentals are still strong and concerns of a housing market bubble and excessive household debt are subsiding.
Although we only see marginal risk of a cyclical or secular bear market developing in Canadian sovereign space, we feel that overall global uncertainty will contribute to relatively flat growth in Canada for 2013.
our view is that the cycle lows in Canadian 10-year yields were reached in July at 1.57% and given these views, we are open to the idea of a modest strategic short position should we again converge back to those lows.
As a proxy, we’ll link our view on 10-year Canada yields to the 10-year swap. Clients can act on this view via the conditional premium swaption (Chart 1).
Reference Rates
Canada 10Y swap rate 2.2012%
At-the-money forward rate 2.2965%
July 2012 low 1.9940%
Notional C$100 mln
Expiry 6 month
Effective 6 month
Term 10 years
Strike 1.9940%
• CIBC buys a European receiver swaption
• If the swaption is exercised, the client has entered a strategic short position at a rate equivalent to the strike price
• If the swaption is not exercised, the client is paid C$500k.
Chart 1
Payoff Profile
source: CIBC.
-1,000
-800
-600
-400
-200
0
200
400
600
2.202.152.102.052.001.951.90
CAd (000's)
Client is paid C$500k if swaption is not exercised
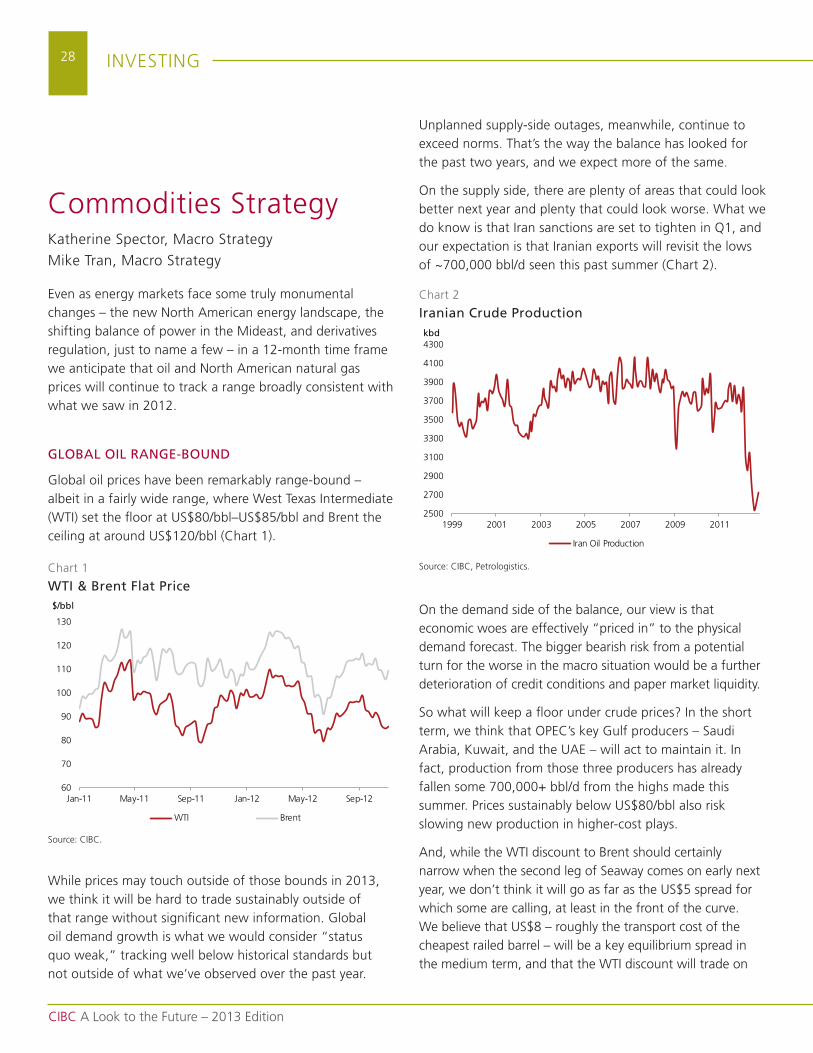
28
CIBC A Look to the Future – 2013 Edition
InVEstInG
unplanned supply-side outages, meanwhile, continue to exceed norms. that’s the way the balance has looked for the past two years, and we expect more of the same.
on the supply side, there are plenty of areas that could look better next year and plenty that could look worse. what we do know is that Iran sanctions are set to tighten in Q1, and our expectation is that Iranian exports will revisit the lows of ~700,000 bbl/d seen this past summer (Chart 2).
on the demand side of the balance, our view is that economic woes are effectively “priced in” to the physical demand forecast. the bigger bearish risk from a potential turn for the worse in the macro situation would be a further deterioration of credit conditions and paper market liquidity.
so what will keep a floor under crude prices? In the short term, we think that oPEC’s key Gulf producers – saudi Arabia, kuwait, and the uAE – will act to maintain it. In fact, production from those three producers has already fallen some 700,000+ bbl/d from the highs made this summer. Prices sustainably below us$80/bbl also risk slowing new production in higher-cost plays.
And, while the wtI discount to Brent should certainly narrow when the second leg of seaway comes on early next year, we don’t think it will go as far as the us$5 spread for which some are calling, at least in the front of the curve. we believe that us$8 – roughly the transport cost of the cheapest railed barrel – will be a key equilibrium spread in the medium term, and that the wtI discount will trade on
Commodities strategykatherine spector, macro strategy
mike tran, macro strategy
Even as energy markets face some truly monumental changes – the new north American energy landscape, the shifting balance of power in the mideast, and derivatives regulation, just to name a few – in a 12-month time frame we anticipate that oil and north American natural gas prices will continue to track a range broadly consistent with what we saw in 2012.
GLOBAL OIL RANGE-BOUND
Global oil prices have been remarkably range-bound – albeit in a fairly wide range, where west texas Intermediate (wtI) set the floor at us$80/bbl–us$85/bbl and Brent the ceiling at around us$120/bbl (Chart 1).
while prices may touch outside of those bounds in 2013, we think it will be hard to trade sustainably outside of that range without significant new information. Global oil demand growth is what we would consider “status quo weak,” tracking well below historical standards but not outside of what we’ve observed over the past year.
Chart 1
WTI & Brent Flat Price
source: CIBC.
60
70
80
90
100
110
120
130
Jan-11 may-11 sep-11 Jan-12 may-12 sep-12
$/bbl
wtI Brent
Chart 2
Iranian Crude Production
source: CIBC, Petrologistics.
2500
2700
2900
3100
3300
3500
3700
3900
4100
4300
1999 2001 2003 2005 2007 2009 2011
kbd
Iran oil Production
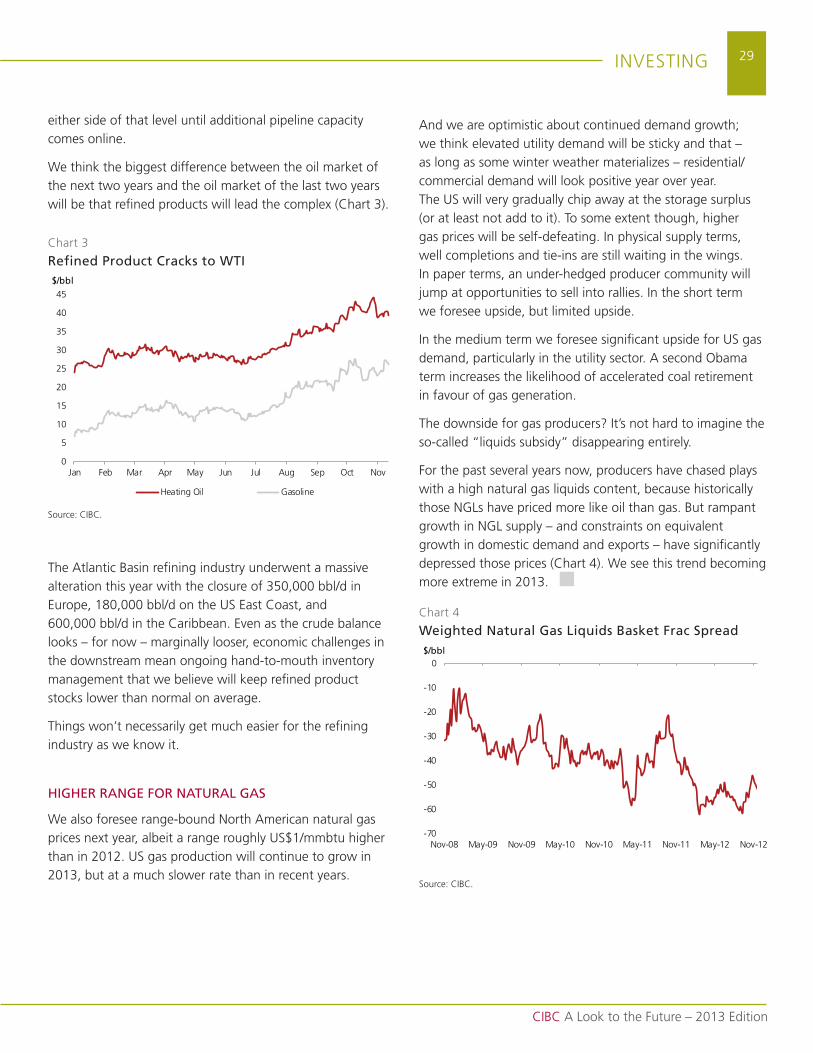
29
CIBC A Look to the Future – 2013 Edition
InVEstInG
either side of that level until additional pipeline capacity comes online.
we think the biggest difference between the oil market of the next two years and the oil market of the last two years will be that refined products will lead the complex (Chart 3).
the Atlantic Basin refining industry underwent a massive alteration this year with the closure of 350,000 bbl/d in Europe, 180,000 bbl/d on the us East Coast, and 600,000 bbl/d in the Caribbean. Even as the crude balance looks – for now – marginally looser, economic challenges in the downstream mean ongoing hand-to-mouth inventory management that we believe will keep refined product stocks lower than normal on average.
things won’t necessarily get much easier for the refining industry as we know it.
HIGHER RANGE FOR NATURAL GAS
we also foresee range-bound north American natural gas prices next year, albeit a range roughly us$1/mmbtu higher than in 2012. us gas production will continue to grow in 2013, but at a much slower rate than in recent years.
And we are optimistic about continued demand growth; we think elevated utility demand will be sticky and that – as long as some winter weather materializes – residential/commercial demand will look positive year over year. the us will very gradually chip away at the storage surplus (or at least not add to it). to some extent though, higher gas prices will be self-defeating. In physical supply terms, well completions and tie-ins are still waiting in the wings. In paper terms, an under-hedged producer community will jump at opportunities to sell into rallies. In the short term we foresee upside, but limited upside.
In the medium term we foresee significant upside for us gas demand, particularly in the utility sector. A second obama term increases the likelihood of accelerated coal retirement in favour of gas generation.
the downside for gas producers? It’s not hard to imagine the so-called “liquids subsidy” disappearing entirely.
For the past several years now, producers have chased plays with a high natural gas liquids content, because historically those nGLs have priced more like oil than gas. But rampant growth in nGL supply – and constraints on equivalent growth in domestic demand and exports – have significantly depressed those prices (Chart 4). we see this trend becoming more extreme in 2013.
Chart 3
Refined Product Cracks to WTI
Chart 4
Weighted Natural Gas Liquids Basket Frac Spread
source: CIBC.
source: CIBC.
0
5
10
15
20
25
30
35
40
45
Jan Feb mar Apr may Jun Jul Aug sep oct nov
$/bbl
Heating oil Gasoline
-70
-60
-50
-40
-30
-20
-10
0
nov-08 may-09 nov-09 may-10 nov-10 may-11 nov-11 may-12 nov-12
$/bbl
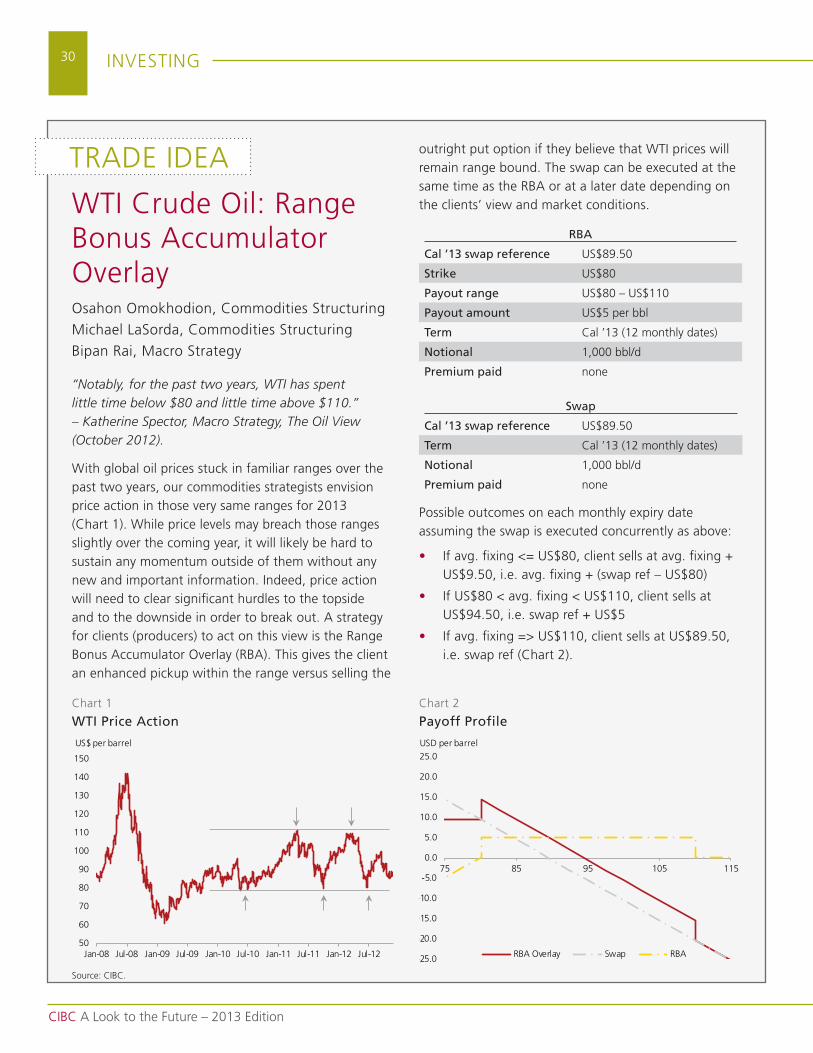
30
CIBC A Look to the Future – 2013 Edition
InVEstInG
outright put option if they believe that wtI prices will remain range bound. the swap can be executed at the same time as the rBA or at a later date depending on the clients’ view and market conditions.
RBA
Cal ’13 swap reference us$89.50
Strike us$80
Payout range us$80 – us$110
Payout amount us$5 per bbl
Term Cal ’13 (12 monthly dates)
Notional 1,000 bbl/d
Premium paid none
Swap
Cal ’13 swap reference us$89.50
Term Cal ’13 (12 monthly dates)
Notional 1,000 bbl/d
Premium paid none
Possible outcomes on each monthly expiry date assuming the swap is executed concurrently as above:
• If avg. fixing <= us$80, client sells at avg. fixing + us$9.50, i.e. avg. fixing + (swap ref – us$80)
• If us$80 < avg. fixing < us$110, client sells at us$94.50, i.e. swap ref + us$5
• If avg. fixing => us$110, client sells at us$89.50, i.e. swap ref (Chart 2).
trAdE IdEA
source: CIBC.
Chart 1
WTI Price ActionChart 2
Payoff Profile
wtI Crude oil: range Bonus Accumulator overlayosahon omokhodion, Commodities structuring
michael Lasorda, Commodities structuring
Bipan rai, macro strategy
“Notably, for the past two years, WTI has spent little time below $80 and little time above $110.” – Katherine Spector, Macro Strategy, The Oil View (October 2012).
with global oil prices stuck in familiar ranges over the past two years, our commodities strategists envision price action in those very same ranges for 2013 (Chart 1). while price levels may breach those ranges slightly over the coming year, it will likely be hard to sustain any momentum outside of them without any new and important information. Indeed, price action will need to clear significant hurdles to the topside and to the downside in order to break out. A strategy for clients (producers) to act on this view is the range Bonus Accumulator overlay (rBA). this gives the client an enhanced pickup within the range versus selling the
50
60
70
80
90
100
110
120
130
140
150
Jan-08 Jul-08 Jan-09 Jul-09 Jan-10 Jul-10 Jan-11 Jul-11 Jan-12 Jul-12
us$ per barrel
-25.0
-20.0
-15.0
-10.0
-5.0
0.0
5.0
10.0
15.0
20.0
25.0
75 85 95 105 115
usd per barrel
rBA overlay swap rBA
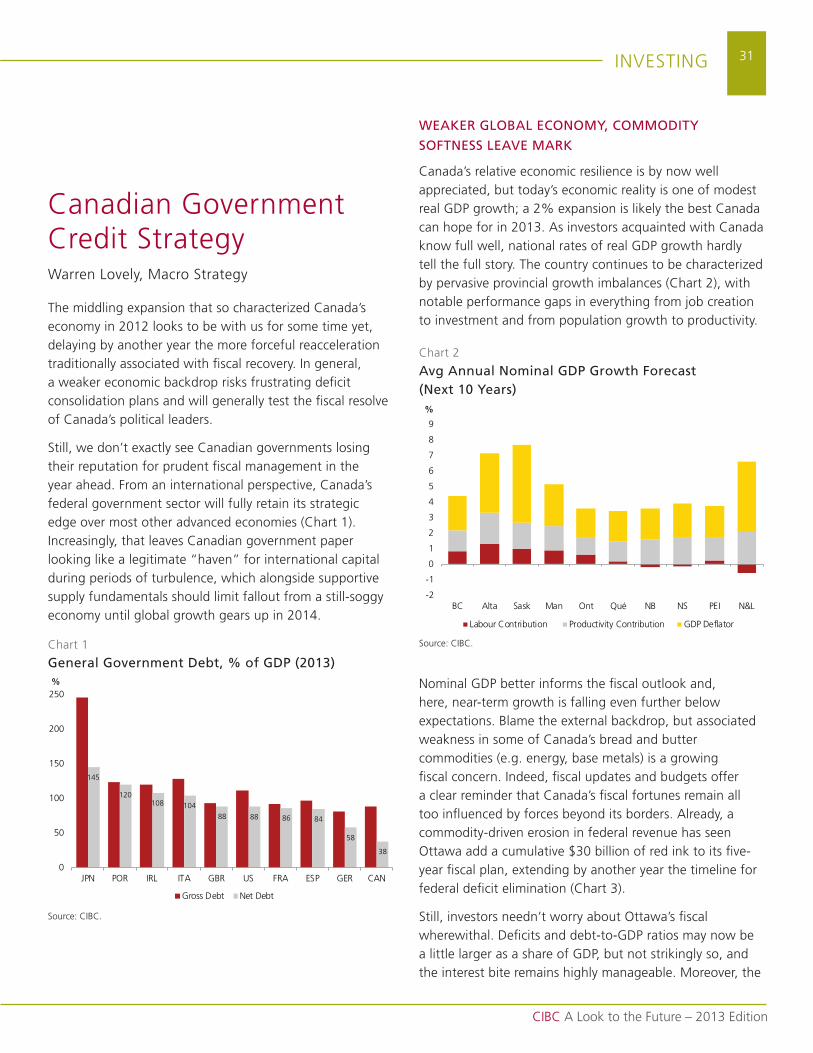
31
CIBC A Look to the Future – 2013 Edition
InVEstInG
Canadian Government Credit strategywarren Lovely, macro strategy
the middling expansion that so characterized Canada’s economy in 2012 looks to be with us for some time yet, delaying by another year the more forceful reacceleration traditionally associated with fiscal recovery. In general, a weaker economic backdrop risks frustrating deficit consolidation plans and will generally test the fiscal resolve of Canada’s political leaders.
still, we don’t exactly see Canadian governments losing their reputation for prudent fiscal management in the year ahead. From an international perspective, Canada’s federal government sector will fully retain its strategic edge over most other advanced economies (Chart 1). Increasingly, that leaves Canadian government paper looking like a legitimate “haven” for international capital during periods of turbulence, which alongside supportive supply fundamentals should limit fallout from a still-soggy economy until global growth gears up in 2014.
WEAKER GLOBAL ECONOMY, COMMODITY
SOFTNESS LEAVE MARK
Canada’s relative economic resilience is by now well appreciated, but today’s economic reality is one of modest real GdP growth; a 2% expansion is likely the best Canada can hope for in 2013. As investors acquainted with Canada know full well, national rates of real GdP growth hardly tell the full story. the country continues to be characterized by pervasive provincial growth imbalances (Chart 2), with notable performance gaps in everything from job creation to investment and from population growth to productivity.
nominal GdP better informs the fiscal outlook and, here, near-term growth is falling even further below expectations. Blame the external backdrop, but associated weakness in some of Canada’s bread and butter commodities (e.g. energy, base metals) is a growing fiscal concern. Indeed, fiscal updates and budgets offer a clear reminder that Canada’s fiscal fortunes remain all too influenced by forces beyond its borders. Already, a commodity-driven erosion in federal revenue has seen ottawa add a cumulative $30 billion of red ink to its five-year fiscal plan, extending by another year the timeline for federal deficit elimination (Chart 3).
still, investors needn’t worry about ottawa’s fiscal wherewithal. deficits and debt-to-GdP ratios may now be a little larger as a share of GdP, but not strikingly so, and the interest bite remains highly manageable. moreover, the
Chart 1
General Government Debt, % of GDP (2013)
145
120108 104
88 88 86 84
58
38
0
50
100
150
200
250
JPn Por IrL ItA GBr us FrA EsP GEr CAn
%
Gross debt net debt
source: CIBC.
Chart 2
Avg Annual Nominal GDP Growth Forecast (Next 10 Years)
source: CIBC.
-2
-1
0
1
2
3
4
5
6
7
8
9
BC Alta sask man ont Qué nB ns PEI n&L
%
Labour Contribution Productivity Contribution GdP deflator
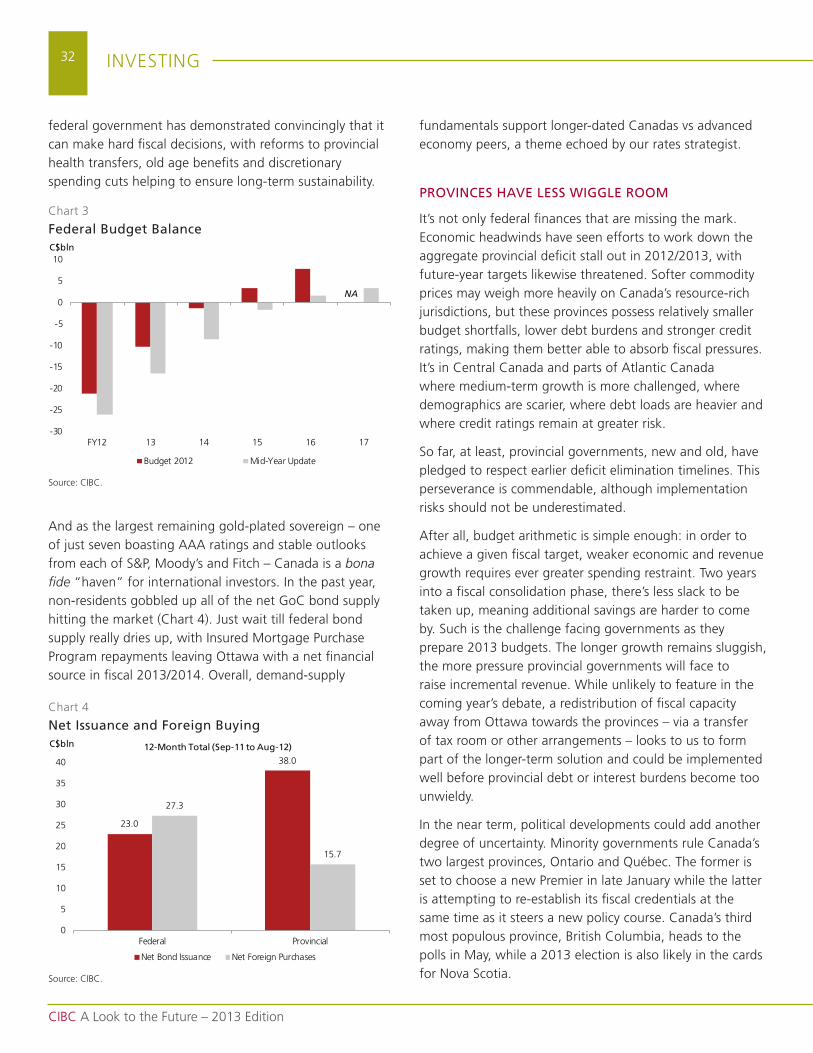
32
CIBC A Look to the Future – 2013 Edition
InVEstInG
federal government has demonstrated convincingly that it can make hard fiscal decisions, with reforms to provincial health transfers, old age benefits and discretionary spending cuts helping to ensure long-term sustainability.
And as the largest remaining gold-plated sovereign – one of just seven boasting AAA ratings and stable outlooks from each of s&P, moody’s and Fitch – Canada is a bona fide “haven” for international investors. In the past year, non-residents gobbled up all of the net GoC bond supply hitting the market (Chart 4). Just wait till federal bond supply really dries up, with Insured mortgage Purchase Program repayments leaving ottawa with a net financial source in fiscal 2013/2014. overall, demand-supply
fundamentals support longer-dated Canadas vs advanced economy peers, a theme echoed by our rates strategist.
PROVINCES HAVE LESS WIGGLE ROOM
It’s not only federal finances that are missing the mark. Economic headwinds have seen efforts to work down the aggregate provincial deficit stall out in 2012/2013, with future-year targets likewise threatened. softer commodity prices may weigh more heavily on Canada’s resource-rich jurisdictions, but these provinces possess relatively smaller budget shortfalls, lower debt burdens and stronger credit ratings, making them better able to absorb fiscal pressures. It’s in Central Canada and parts of Atlantic Canada where medium-term growth is more challenged, where demographics are scarier, where debt loads are heavier and where credit ratings remain at greater risk.
so far, at least, provincial governments, new and old, have pledged to respect earlier deficit elimination timelines. this perseverance is commendable, although implementation risks should not be underestimated.
After all, budget arithmetic is simple enough: in order to achieve a given fiscal target, weaker economic and revenue growth requires ever greater spending restraint. two years into a fiscal consolidation phase, there’s less slack to be taken up, meaning additional savings are harder to come by. such is the challenge facing governments as they prepare 2013 budgets. the longer growth remains sluggish, the more pressure provincial governments will face to raise incremental revenue. while unlikely to feature in the coming year’s debate, a redistribution of fiscal capacity away from ottawa towards the provinces – via a transfer of tax room or other arrangements – looks to us to form part of the longer-term solution and could be implemented well before provincial debt or interest burdens become too unwieldy.
In the near term, political developments could add another degree of uncertainty. minority governments rule Canada’s two largest provinces, ontario and Québec. the former is set to choose a new Premier in late January while the latter is attempting to re-establish its fiscal credentials at the same time as it steers a new policy course. Canada’s third most populous province, British Columbia, heads to the polls in may, while a 2013 election is also likely in the cards for nova scotia.
Chart 3
Federal Budget Balance
Chart 4
Net Issuance and Foreign Buying
source: CIBC.
source: CIBC.
-30
-25
-20
-15
-10
-5
0
5
10
FY12 13 14 15 16 17
C$bln
Budget 2012 mid-Year update
NA
23.0
38.0
27.3
15.7
0
5
10
15
20
25
30
35
40
Federal Provincial
C$bln
net Bond Issuance net Foreign Purchases
12-Month Total (Sep-11 to Aug-12)
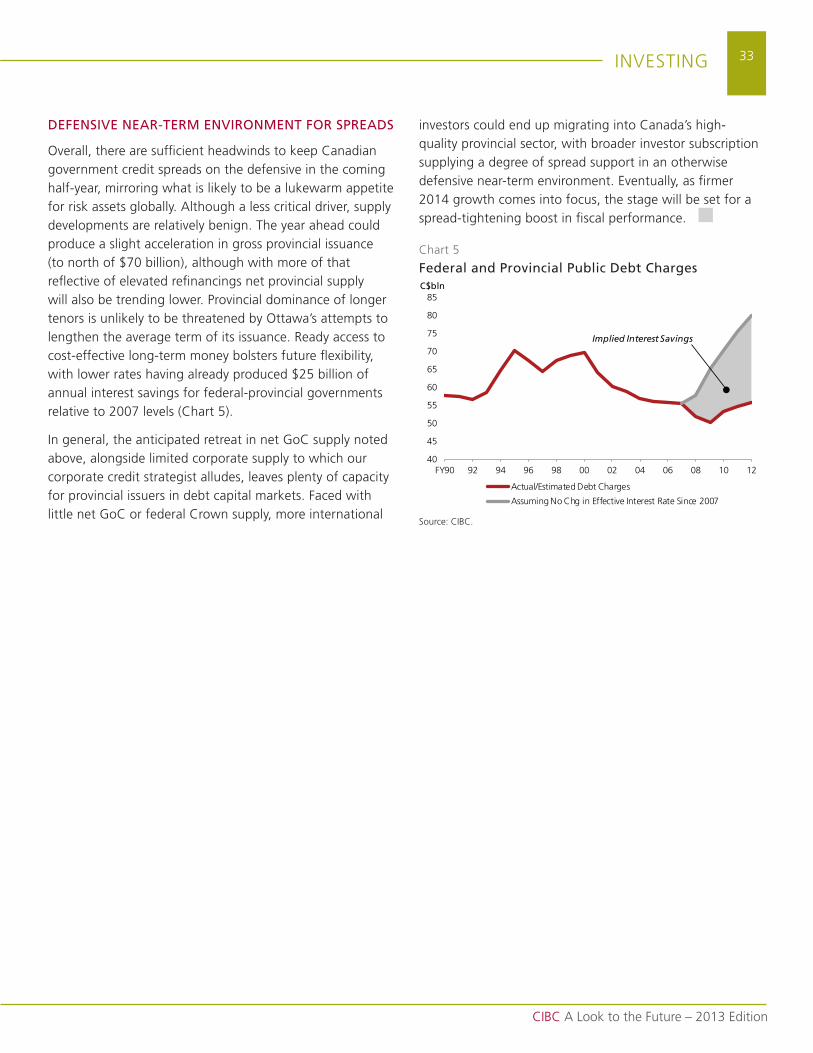
33
CIBC A Look to the Future – 2013 Edition
InVEstInG
DEFENSIVE NEAR-TERM ENVIRONMENT FOR SPREADS
overall, there are sufficient headwinds to keep Canadian government credit spreads on the defensive in the coming half-year, mirroring what is likely to be a lukewarm appetite for risk assets globally. Although a less critical driver, supply developments are relatively benign. the year ahead could produce a slight acceleration in gross provincial issuance (to north of $70 billion), although with more of that reflective of elevated refinancings net provincial supply will also be trending lower. Provincial dominance of longer tenors is unlikely to be threatened by ottawa’s attempts to lengthen the average term of its issuance. ready access to cost-effective long-term money bolsters future flexibility, with lower rates having already produced $25 billion of annual interest savings for federal-provincial governments relative to 2007 levels (Chart 5).
In general, the anticipated retreat in net GoC supply noted above, alongside limited corporate supply to which our corporate credit strategist alludes, leaves plenty of capacity for provincial issuers in debt capital markets. Faced with little net GoC or federal Crown supply, more international
investors could end up migrating into Canada’s high-quality provincial sector, with broader investor subscription supplying a degree of spread support in an otherwise defensive near-term environment. Eventually, as firmer 2014 growth comes into focus, the stage will be set for a spread-tightening boost in fiscal performance.
Chart 5
Federal and Provincial Public Debt Charges
source: CIBC.
40
45
50
55
60
65
70
75
80
85
FY90 92 94 96 98 00 02 04 06 08 10 12
C$bln
Actual/Estimated debt Charges
Assuming no Chg in Effective Interest rate since 2007
Implied Interest Savings
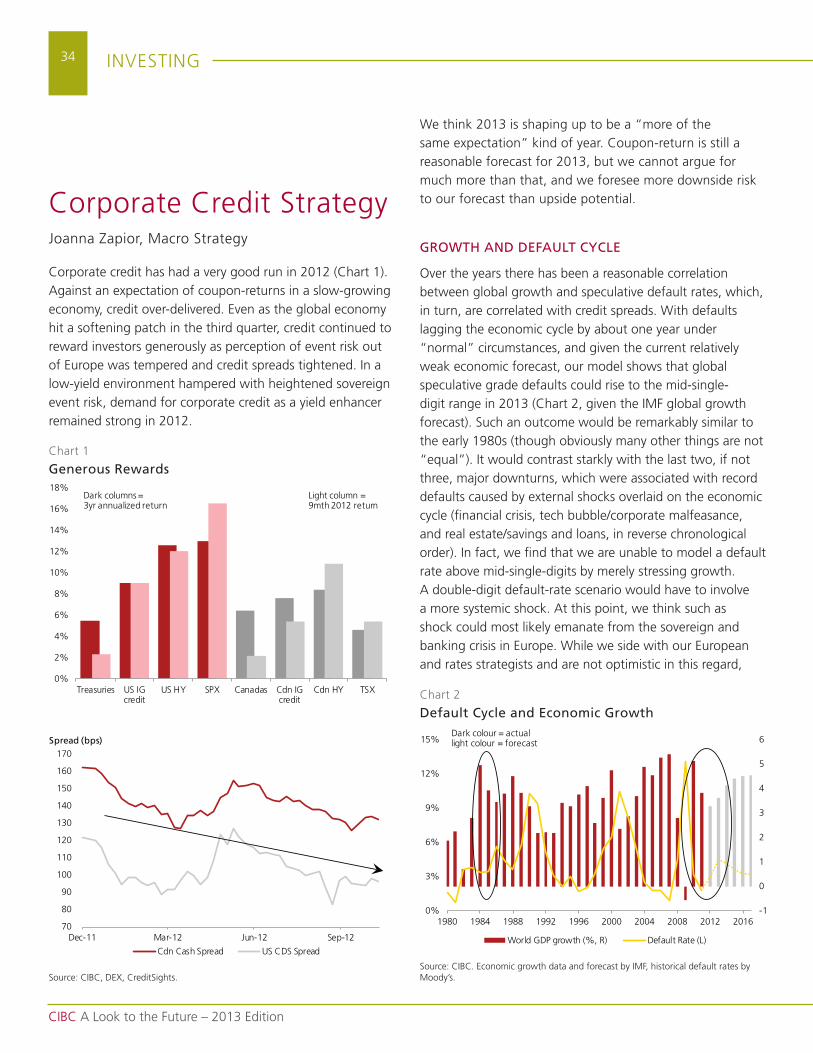
34
CIBC A Look to the Future – 2013 Edition
InVEstInG
Corporate Credit strategy Joanna Zapior, macro strategy
Corporate credit has had a very good run in 2012 (Chart 1). Against an expectation of coupon-returns in a slow-growing economy, credit over-delivered. Even as the global economy hit a softening patch in the third quarter, credit continued to reward investors generously as perception of event risk out of Europe was tempered and credit spreads tightened. In a low-yield environment hampered with heightened sovereign event risk, demand for corporate credit as a yield enhancer remained strong in 2012.
we think 2013 is shaping up to be a “more of the same expectation” kind of year. Coupon-return is still a reasonable forecast for 2013, but we cannot argue for much more than that, and we foresee more downside risk to our forecast than upside potential.
GROWTH AND DEFAULT CYCLE
over the years there has been a reasonable correlation between global growth and speculative default rates, which, in turn, are correlated with credit spreads. with defaults lagging the economic cycle by about one year under “normal” circumstances, and given the current relatively weak economic forecast, our model shows that global speculative grade defaults could rise to the mid-single-digit range in 2013 (Chart 2, given the ImF global growth forecast). such an outcome would be remarkably similar to the early 1980s (though obviously many other things are not “equal”). It would contrast starkly with the last two, if not three, major downturns, which were associated with record defaults caused by external shocks overlaid on the economic cycle (financial crisis, tech bubble/corporate malfeasance, and real estate/savings and loans, in reverse chronological order). In fact, we find that we are unable to model a default rate above mid-single-digits by merely stressing growth. A double-digit default-rate scenario would have to involve a more systemic shock. At this point, we think such as shock could most likely emanate from the sovereign and banking crisis in Europe. while we side with our European and rates strategists and are not optimistic in this regard,
Chart 1
Generous Rewards
Chart 2
Default Cycle and Economic Growth
source: CIBC, dEX, Creditsights.source: CIBC. Economic growth data and forecast by ImF, historical default rates by moody’s.
0%
2%
4%
6%
8%
10%
12%
14%
16%
18%
treasuries us IGcredit
us HY sPX Canadas Cdn IGcredit
Cdn HY tsX
dark columns = 3yr annualized return
Light column = 9mth 2012 return
-1
0
1
2
3
4
5
6
0%
3%
6%
9%
12%
15%
1980 1984 1988 1992 1996 2000 2004 2008 2012 2016
world GdP growth (%, r) default rate (L)
dark colour = actual light colour = forecast
70
80
90
100
110
120
130
140
150
160
170
dec-11 mar-12 Jun-12 sep-12
Cdn Cash spread us Cds spread
Spread (bps)
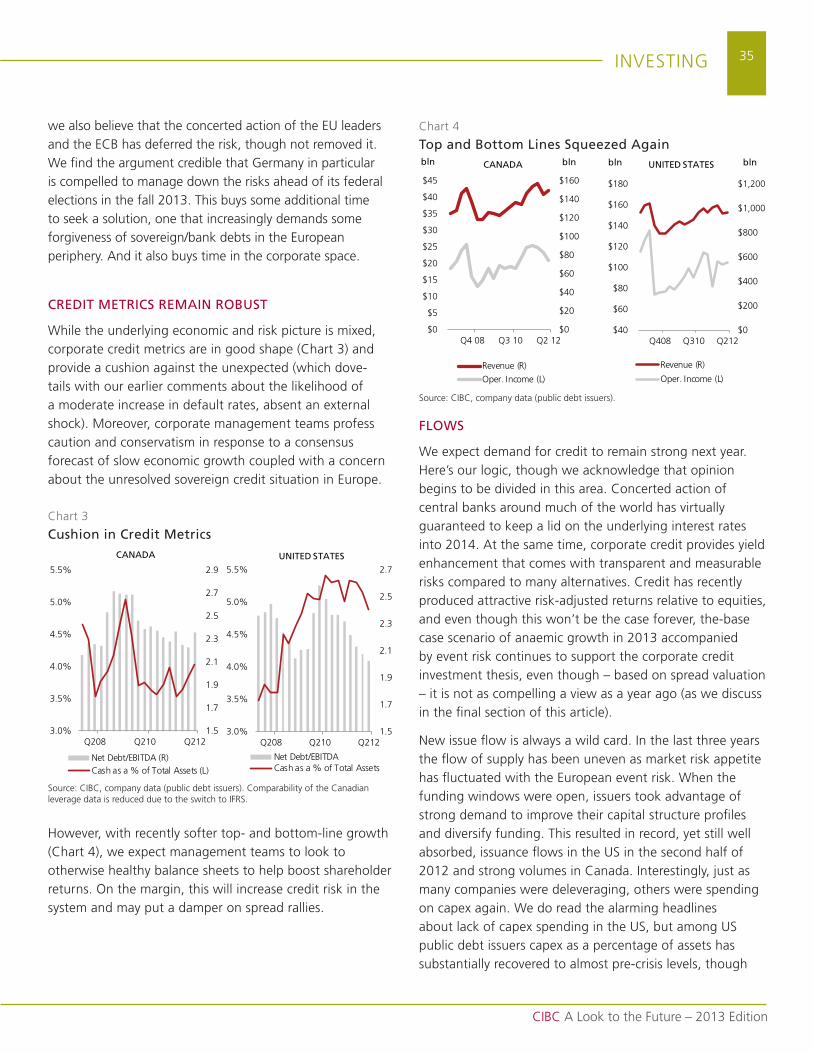
35
CIBC A Look to the Future – 2013 Edition
InVEstInG
FLOWS
we expect demand for credit to remain strong next year. Here’s our logic, though we acknowledge that opinion begins to be divided in this area. Concerted action of central banks around much of the world has virtually guaranteed to keep a lid on the underlying interest rates into 2014. At the same time, corporate credit provides yield enhancement that comes with transparent and measurable risks compared to many alternatives. Credit has recently produced attractive risk-adjusted returns relative to equities, and even though this won’t be the case forever, the-base case scenario of anaemic growth in 2013 accompanied by event risk continues to support the corporate credit investment thesis, even though – based on spread valuation – it is not as compelling a view as a year ago (as we discuss in the final section of this article).
new issue flow is always a wild card. In the last three years the flow of supply has been uneven as market risk appetite has fluctuated with the European event risk. when the funding windows were open, issuers took advantage of strong demand to improve their capital structure profiles and diversify funding. this resulted in record, yet still well absorbed, issuance flows in the us in the second half of 2012 and strong volumes in Canada. Interestingly, just as many companies were deleveraging, others were spending on capex again. we do read the alarming headlines about lack of capex spending in the us, but among us public debt issuers capex as a percentage of assets has substantially recovered to almost pre-crisis levels, though
we also believe that the concerted action of the Eu leaders and the ECB has deferred the risk, though not removed it. we find the argument credible that Germany in particular is compelled to manage down the risks ahead of its federal elections in the fall 2013. this buys some additional time to seek a solution, one that increasingly demands some forgiveness of sovereign/bank debts in the European periphery. And it also buys time in the corporate space.
CREDIT METRICS REMAIN ROBUST
while the underlying economic and risk picture is mixed, corporate credit metrics are in good shape (Chart 3) and provide a cushion against the unexpected (which dove-tails with our earlier comments about the likelihood of a moderate increase in default rates, absent an external shock). moreover, corporate management teams profess caution and conservatism in response to a consensus forecast of slow economic growth coupled with a concern about the unresolved sovereign credit situation in Europe.
However, with recently softer top- and bottom-line growth (Chart 4), we expect management teams to look to otherwise healthy balance sheets to help boost shareholder returns. on the margin, this will increase credit risk in the system and may put a damper on spread rallies.
Chart 3
Cushion in Credit Metrics
Chart 4
Top and Bottom Lines Squeezed Again
source: CIBC, company data (public debt issuers). Comparability of the Canadian leverage data is reduced due to the switch to IFrs.
source: CIBC, company data (public debt issuers).
3.0%
3.5%
4.0%
4.5%
5.0%
5.5%
1.5
1.7
1.9
2.1
2.3
2.5
2.7
2.9
Q212Q210Q208
net debt/EBItdA (r)Cash as a % of total Assets (L)
CANADA
$0
$5
$10
$15
$20
$25
$30
$35
$40
$45
$0
$20
$40
$60
$80
$100
$120
$140
$160
Q2 12Q3 10Q4 08
revenue (r)
oper. Income (L)
CANADAbln bln
3.0%
3.5%
4.0%
4.5%
5.0%
5.5%
1.5
1.7
1.9
2.1
2.3
2.5
2.7
Q212Q210Q208
net debt/EBItdACash as a % of total Assets
UNITED STATES
$40
$60
$80
$100
$120
$140
$160
$180
$0
$200
$400
$600
$800
$1,000
$1,200
Q212Q310Q408
revenue (r)
oper. Income (L)
UNITED STATESbln bln
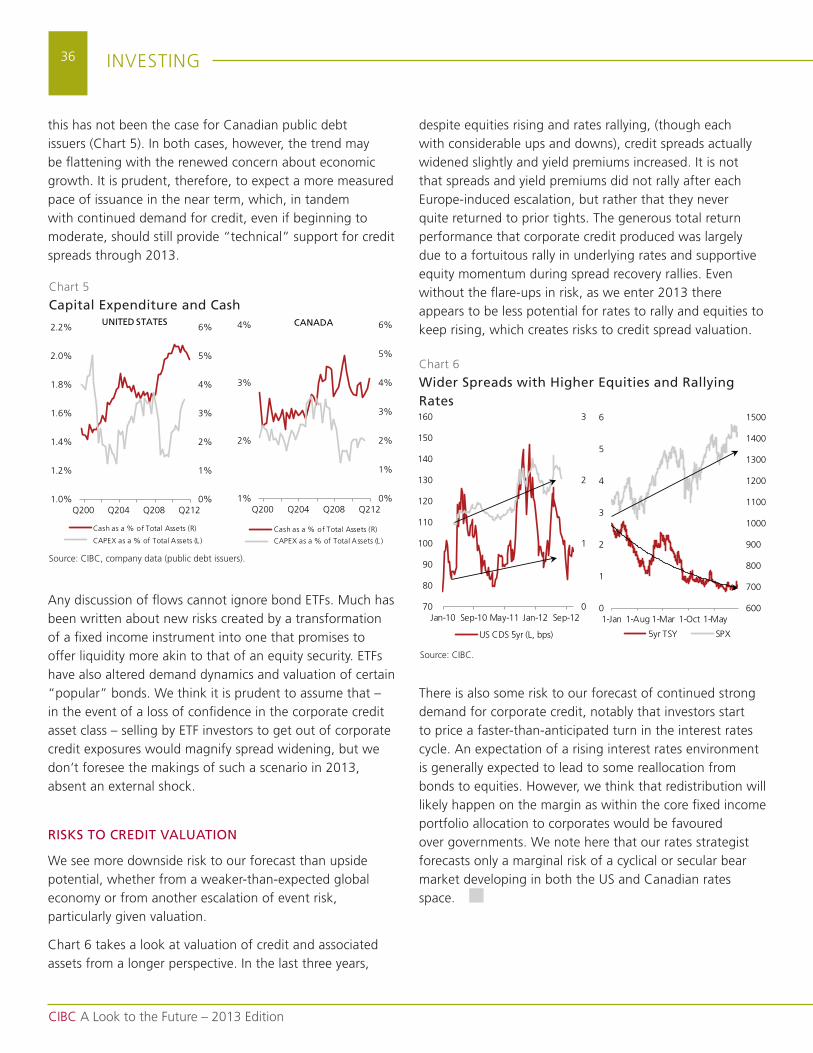
36
CIBC A Look to the Future – 2013 Edition
InVEstInG
this has not been the case for Canadian public debt issuers (Chart 5). In both cases, however, the trend may be flattening with the renewed concern about economic growth. It is prudent, therefore, to expect a more measured pace of issuance in the near term, which, in tandem with continued demand for credit, even if beginning to moderate, should still provide “technical” support for credit spreads through 2013.
Any discussion of flows cannot ignore bond EtFs. much has been written about new risks created by a transformation of a fixed income instrument into one that promises to offer liquidity more akin to that of an equity security. EtFs have also altered demand dynamics and valuation of certain “popular” bonds. we think it is prudent to assume that – in the event of a loss of confidence in the corporate credit asset class – selling by EtF investors to get out of corporate credit exposures would magnify spread widening, but we don’t foresee the makings of such a scenario in 2013, absent an external shock.
RISKS TO CREDIT VALUATION
we see more downside risk to our forecast than upside potential, whether from a weaker-than-expected global economy or from another escalation of event risk, particularly given valuation.
Chart 6 takes a look at valuation of credit and associated assets from a longer perspective. In the last three years,
despite equities rising and rates rallying, (though each with considerable ups and downs), credit spreads actually widened slightly and yield premiums increased. It is not that spreads and yield premiums did not rally after each Europe-induced escalation, but rather that they never quite returned to prior tights. the generous total return performance that corporate credit produced was largely due to a fortuitous rally in underlying rates and supportive equity momentum during spread recovery rallies. Even without the flare-ups in risk, as we enter 2013 there appears to be less potential for rates to rally and equities to keep rising, which creates risks to credit spread valuation.
there is also some risk to our forecast of continued strong demand for corporate credit, notably that investors start to price a faster-than-anticipated turn in the interest rates cycle. An expectation of a rising interest rates environment is generally expected to lead to some reallocation from bonds to equities. However, we think that redistribution will likely happen on the margin as within the core fixed income portfolio allocation to corporates would be favoured over governments. we note here that our rates strategist forecasts only a marginal risk of a cyclical or secular bear market developing in both the us and Canadian rates space.
Chart 5
Capital Expenditure and Cash
source: CIBC, company data (public debt issuers).
1.0%
1.2%
1.4%
1.6%
1.8%
2.0%
2.2%
0%
1%
2%
3%
4%
5%
6%
Q212Q208Q204Q200
Cash as a % of total Assets (r)
CAPEX as a % of total Assets (L )
UNITED STATES
1%
2%
3%
4%
0%
1%
2%
3%
4%
5%
6%
Q212Q208Q204Q200
Cash as a % of total Assets (r)
CAPEX as a % of total Assets (L )
CANADA
Chart 6
Wider Spreads with Higher Equities and Rallying Rates
source: CIBC.
0
1
2
3
70
80
90
100
110
120
130
140
150
160
Jan-10 sep-10 may-11 Jan-12 sep-12
us Cds 5yr (L, bps)
600
700
800
900
1000
1100
1200
1300
1400
1500
0
1
2
3
4
5
6
1-Jan 1-Aug 1-mar 1-oct 1-may
5yr tsY sPX
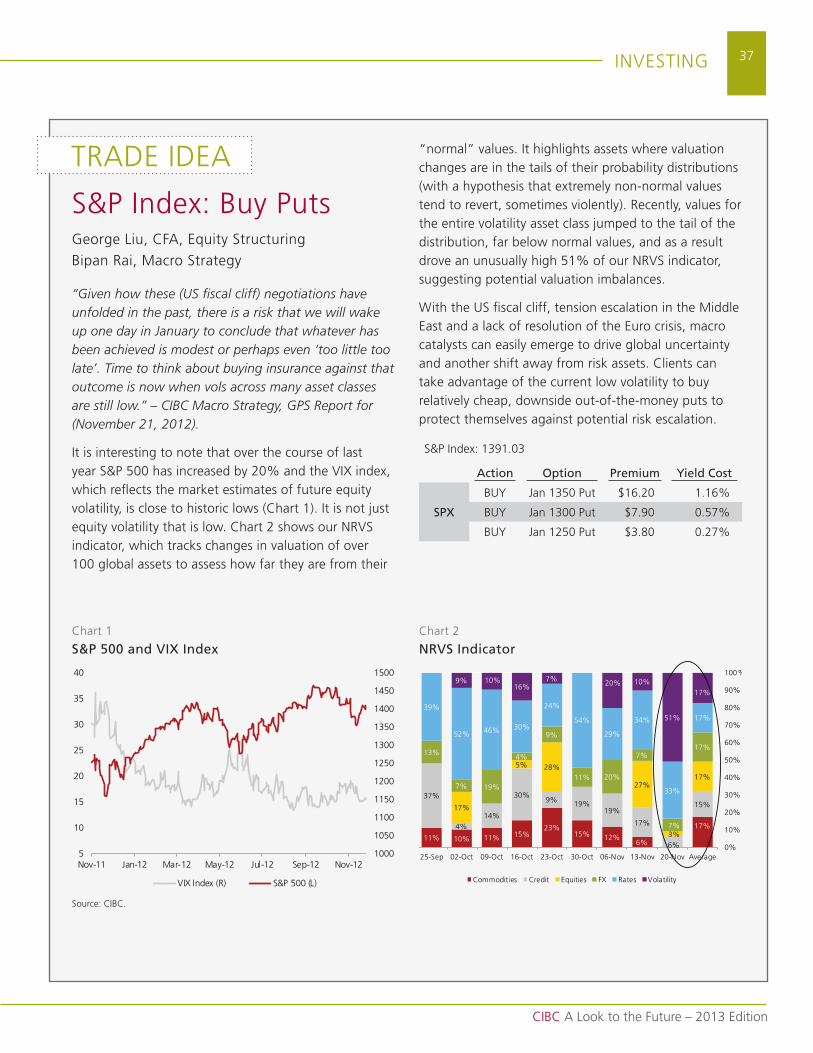
37
CIBC A Look to the Future – 2013 Edition
InVEstInG
trAdE IdEA
s&P Index: Buy PutsGeorge Liu, CFA, Equity structuring
Bipan rai, macro strategy
“Given how these (US fiscal cliff) negotiations have unfolded in the past, there is a risk that we will wake up one day in January to conclude that whatever has been achieved is modest or perhaps even ‘too little too late’. Time to think about buying insurance against that outcome is now when vols across many asset classes are still low.” – CIBC Macro Strategy, GPS Report for (November 21, 2012).
It is interesting to note that over the course of last year s&P 500 has increased by 20% and the VIX index, which reflects the market estimates of future equity volatility, is close to historic lows (Chart 1). It is not just equity volatility that is low. Chart 2 shows our nrVs indicator, which tracks changes in valuation of over 100 global assets to assess how far they are from their
“normal” values. It highlights assets where valuation changes are in the tails of their probability distributions (with a hypothesis that extremely non-normal values tend to revert, sometimes violently). recently, values for the entire volatility asset class jumped to the tail of the distribution, far below normal values, and as a result drove an unusually high 51% of our nrVs indicator, suggesting potential valuation imbalances.
with the us fiscal cliff, tension escalation in the middle East and a lack of resolution of the Euro crisis, macro catalysts can easily emerge to drive global uncertainty and another shift away from risk assets. Clients can take advantage of the current low volatility to buy relatively cheap, downside out-of-the-money puts to protect themselves against potential risk escalation.
s&P Index: 1391.03
Action Option Premium Yield Cost
SPX
BuY Jan 1350 Put $16.20 1.16%
BuY Jan 1300 Put $7.90 0.57%
BuY Jan 1250 Put $3.80 0.27%
Chart 1
S&P 500 and VIX IndexChart 2
NRVS Indicator
source: CIBC.
1000
1050
1100
1150
1200
1250
1300
1350
1400
1450
1500
5
10
15
20
25
30
35
40
nov-11 Jan-12 mar-12 may-12 Jul-12 sep-12 nov-12
VIX Index (r) s&P 500 (L)
17%
6%12%15%
23%15%11%10%11%
15%
6%
17%
19%19%9%
30%
14%4%
37%
17%
3%
27%
28%5%
17%
17%
7%
7%
20%11%
9%
4%
19%7%
13%
17%
33%
34%
29%
54%
24%
30%46%52%
39%
17%
51%
10%20%7%16%
9% 10%
0%
10%
20%
30%
40%
50%
60%
70%
80%
90%
100%
Average20-nov13-nov06-nov30-oct23-oct16-oct09-oct02-oct25-sep
Commodit ies Credit Equities FX rates Volatility
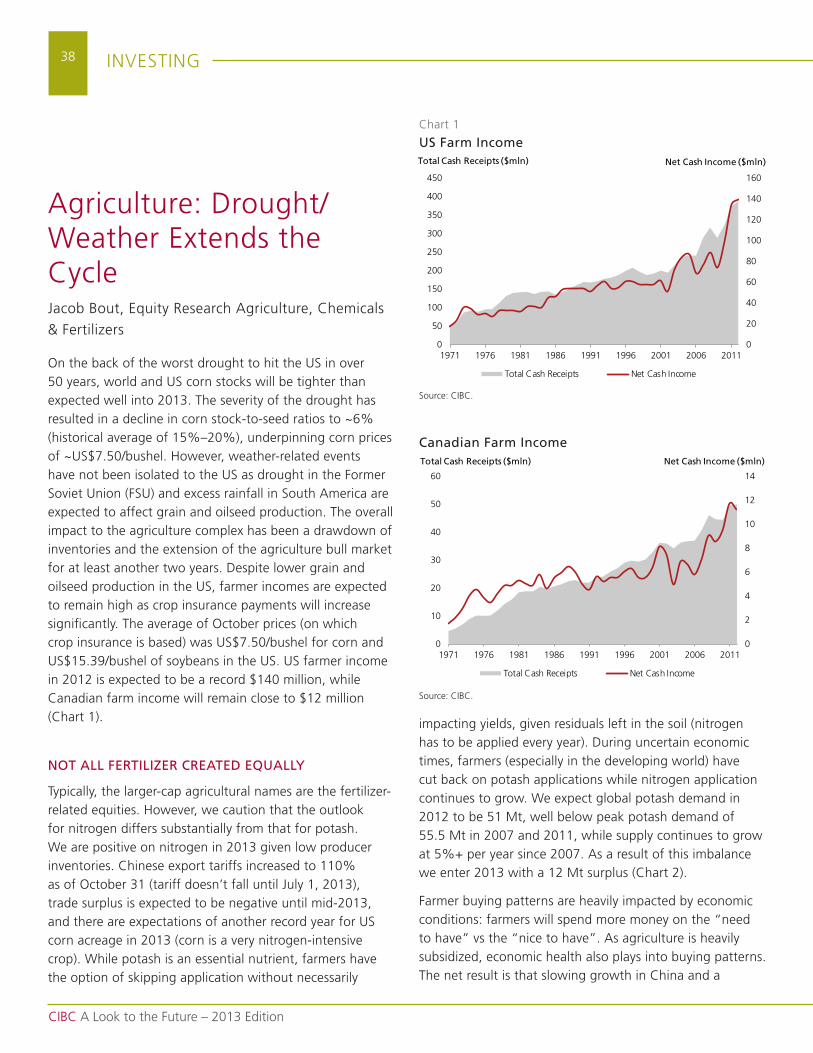
38
CIBC A Look to the Future – 2013 Edition
InVEstInG
Agriculture: drought/weather Extends the CycleJacob Bout, Equity research Agriculture, Chemicals
& Fertilizers
on the back of the worst drought to hit the us in over 50 years, world and us corn stocks will be tighter than expected well into 2013. the severity of the drought has resulted in a decline in corn stock-to-seed ratios to ~6% (historical average of 15%–20%), underpinning corn prices of ~us$7.50/bushel. However, weather-related events have not been isolated to the us as drought in the Former soviet union (Fsu) and excess rainfall in south America are expected to affect grain and oilseed production. the overall impact to the agriculture complex has been a drawdown of inventories and the extension of the agriculture bull market for at least another two years. despite lower grain and oilseed production in the us, farmer incomes are expected to remain high as crop insurance payments will increase significantly. the average of october prices (on which crop insurance is based) was us$7.50/bushel for corn and us$15.39/bushel of soybeans in the us. us farmer income in 2012 is expected to be a record $140 million, while Canadian farm income will remain close to $12 million (Chart 1).
NOT ALL FERTILIZER CREATED EQUALLY
typically, the larger-cap agricultural names are the fertilizer-related equities. However, we caution that the outlook for nitrogen differs substantially from that for potash. we are positive on nitrogen in 2013 given low producer inventories. Chinese export tariffs increased to 110% as of october 31 (tariff doesn’t fall until July 1, 2013), trade surplus is expected to be negative until mid-2013, and there are expectations of another record year for us corn acreage in 2013 (corn is a very nitrogen-intensive crop). while potash is an essential nutrient, farmers have the option of skipping application without necessarily
impacting yields, given residuals left in the soil (nitrogen has to be applied every year). during uncertain economic times, farmers (especially in the developing world) have cut back on potash applications while nitrogen application continues to grow. we expect global potash demand in 2012 to be 51 mt, well below peak potash demand of 55.5 mt in 2007 and 2011, while supply continues to grow at 5%+ per year since 2007. As a result of this imbalance we enter 2013 with a 12 mt surplus (Chart 2).
Farmer buying patterns are heavily impacted by economic conditions: farmers will spend more money on the “need to have” vs the “nice to have”. As agriculture is heavily subsidized, economic health also plays into buying patterns. the net result is that slowing growth in China and a
Chart 1
US Farm Income
source: CIBC.
0
20
40
60
80
100
120
140
160
0
50
100
150
200
250
300
350
400
450
1971 1976 1981 1986 1991 1996 2001 2006 2011
total Cash receipts net Cash Income
Total Cash Receipts ($mln) Net Cash Income ($mln)
Canadian Farm Income
source: CIBC.
0
2
4
6
8
10
12
14
0
10
20
30
40
50
60
1971 1976 1981 1986 1991 1996 2001 2006 2011
total Cash receipts net Cash Income
Total Cash Receipts ($mln) Net Cash Income ($mln)
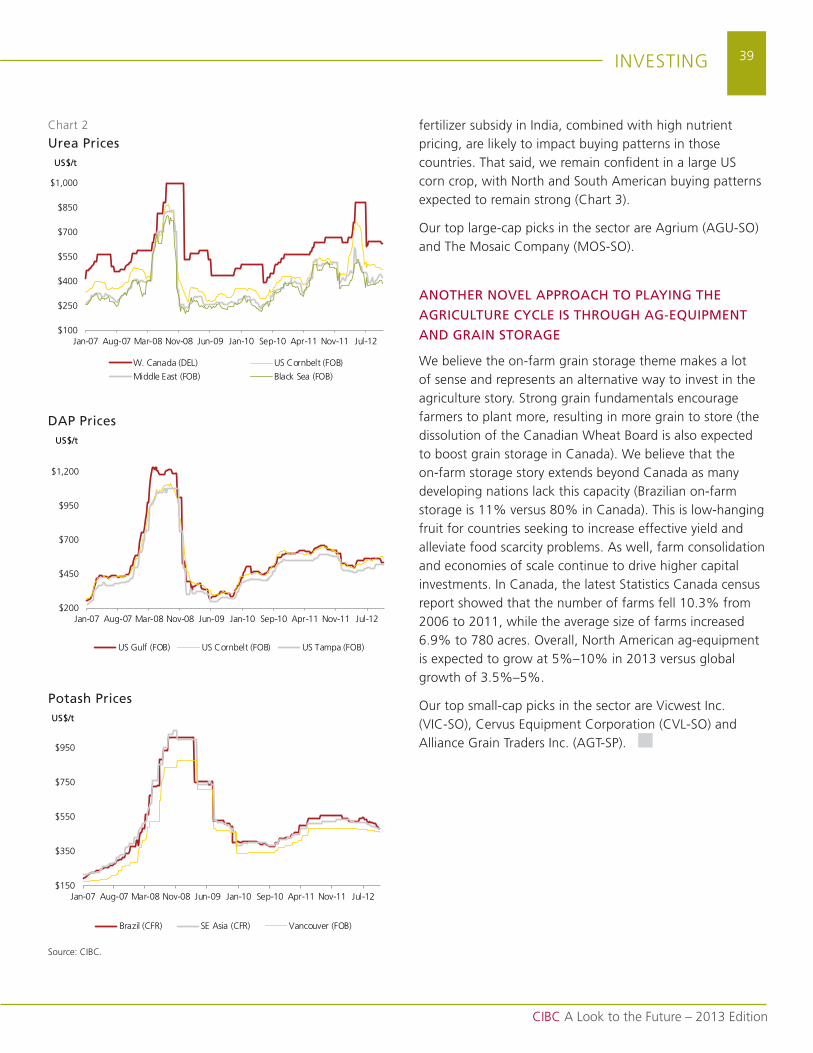
39
CIBC A Look to the Future – 2013 Edition
InVEstInG
fertilizer subsidy in India, combined with high nutrient pricing, are likely to impact buying patterns in those countries. that said, we remain confident in a large us corn crop, with north and south American buying patterns expected to remain strong (Chart 3).
our top large-cap picks in the sector are Agrium (AGu-so) and the mosaic Company (mos-so).
ANOTHER NOVEL APPROACH TO PLAYING THE
AGRICULTURE CYCLE IS THROUGH AG-EQUIPMENT
AND GRAIN STORAGE
we believe the on-farm grain storage theme makes a lot of sense and represents an alternative way to invest in the agriculture story. strong grain fundamentals encourage farmers to plant more, resulting in more grain to store (the dissolution of the Canadian wheat Board is also expected to boost grain storage in Canada). we believe that the on-farm storage story extends beyond Canada as many developing nations lack this capacity (Brazilian on-farm storage is 11% versus 80% in Canada). this is low-hanging fruit for countries seeking to increase effective yield and alleviate food scarcity problems. As well, farm consolidation and economies of scale continue to drive higher capital investments. In Canada, the latest statistics Canada census report showed that the number of farms fell 10.3% from 2006 to 2011, while the average size of farms increased 6.9% to 780 acres. overall, north American ag-equipment is expected to grow at 5%–10% in 2013 versus global growth of 3.5%–5%.
our top small-cap picks in the sector are Vicwest Inc. (VIC-so), Cervus Equipment Corporation (CVL-so) and Alliance Grain traders Inc. (AGt-sP).
Chart 2
Urea Prices
$100
$250
$400
$550
$700
$850
$1,000
Jan-07 Aug-07 mar-08 nov-08 Jun-09 Jan-10 sep-10 Apr-11 nov-11 Jul-12
US$/t
w. Canada (dEL) us Cornbelt (FoB)
middle East (FoB) Black sea (FoB)
Potash Prices
source: CIBC.
$150
$350
$550
$750
$950
Jan-07 Aug-07 mar-08 nov-08 Jun-09 Jan-10 sep-10 Apr-11 nov-11 Jul-12
US$/t
Brazil (CFr) sE Asia (CFr) Vancouver (FoB)
DAP Prices
$200
$450
$700
$950
$1,200
Jan-07 Aug-07 mar-08 nov-08 Jun-09 Jan-10 sep-10 Apr-11 nov-11 Jul-12
US$/t
us Gulf (FoB) us Cornbelt (FoB) us tampa (FoB)
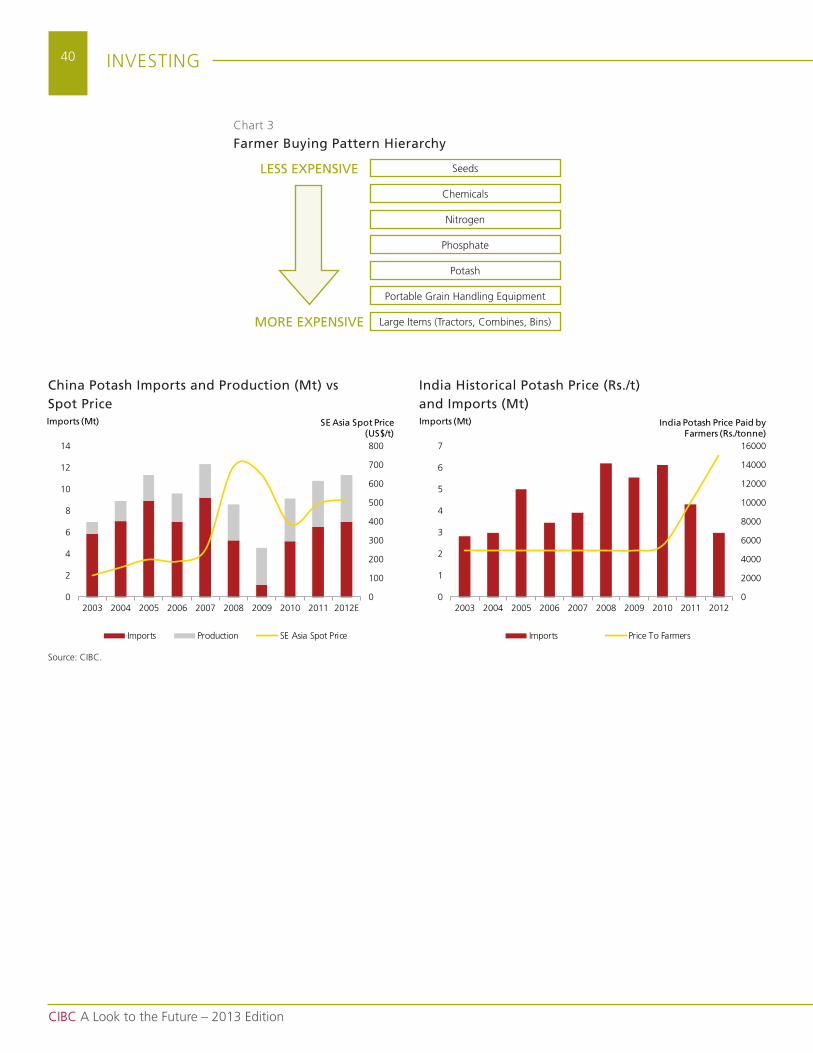
40
CIBC A Look to the Future – 2013 Edition
InVEstInG
China Potash Imports and Production (Mt) vs Spot Price
0
100
200
300
400
500
600
700
800
0
2
4
6
8
10
12
14
2003 2004 2005 2006 2007 2008 2009 2010 2011 2012E
Imports Production sE Asia spot Price
SE Asia Spot Price (US$/t)
Imports (Mt)
India Historical Potash Price (Rs./t) and Imports (Mt)
source: CIBC.
0
2000
4000
6000
8000
10000
12000
14000
16000
0
1
2
3
4
5
6
7
2003 2004 2005 2006 2007 2008 2009 2010 2011 2012
Imports Price to Farmers
India Potash Price Paid by Farmers (Rs./tonne)
Imports (Mt)
Chart 3
Farmer Buying Pattern Hierarchy
seeds
Phosphate
Chemicals
Potash
nitrogen
Portable Grain Handling Equipment
Large Items (tractors, Combines, Bins)
LESS EXPENSIVE
MORE EXPENSIVE
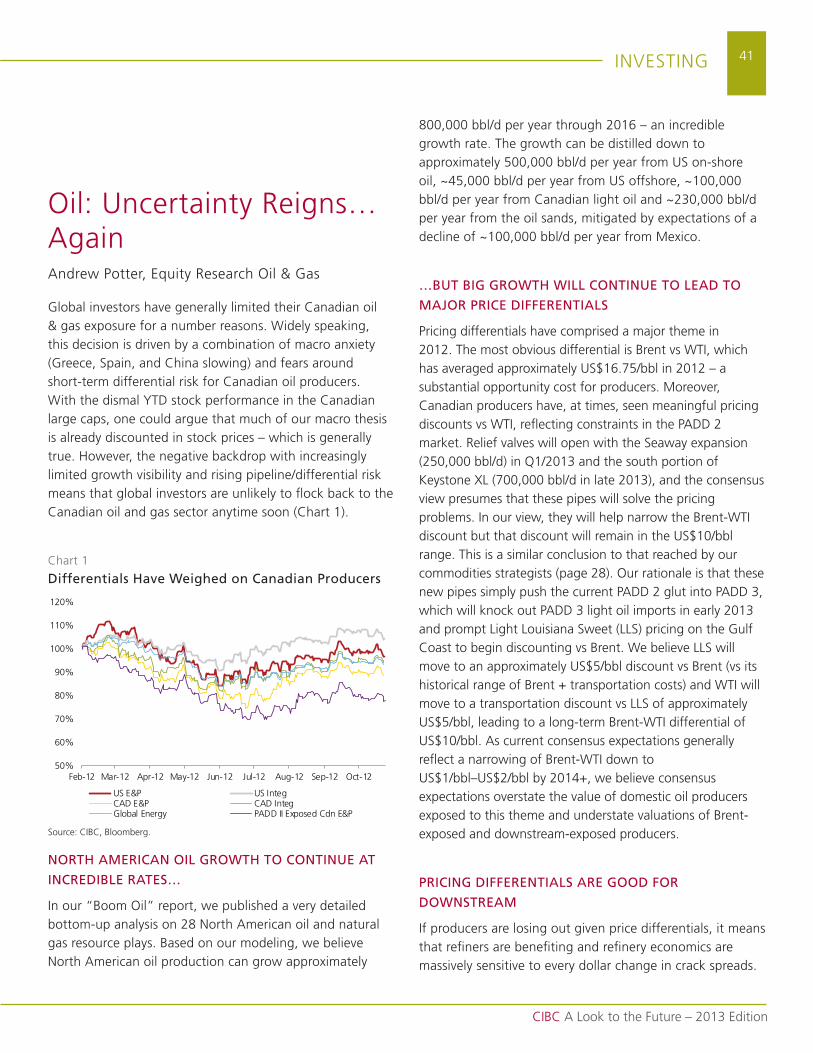
41
CIBC A Look to the Future – 2013 Edition
InVEstInG
oil: uncertainty reigns… AgainAndrew Potter, Equity research oil & Gas
Global investors have generally limited their Canadian oil & gas exposure for a number reasons. widely speaking, this decision is driven by a combination of macro anxiety (Greece, spain, and China slowing) and fears around short-term differential risk for Canadian oil producers. with the dismal Ytd stock performance in the Canadian large caps, one could argue that much of our macro thesis is already discounted in stock prices – which is generally true. However, the negative backdrop with increasingly limited growth visibility and rising pipeline/differential risk means that global investors are unlikely to flock back to the Canadian oil and gas sector anytime soon (Chart 1).
NORTH AMERICAN OIL GROWTH TO CONTINUE AT
INCREDIBLE RATES…
In our “Boom oil” report, we published a very detailed bottom-up analysis on 28 north American oil and natural gas resource plays. Based on our modeling, we believe north American oil production can grow approximately
800,000 bbl/d per year through 2016 – an incredible growth rate. the growth can be distilled down to approximately 500,000 bbl/d per year from us on-shore oil, ~45,000 bbl/d per year from us offshore, ~100,000 bbl/d per year from Canadian light oil and ~230,000 bbl/d per year from the oil sands, mitigated by expectations of a decline of ~100,000 bbl/d per year from mexico.
…BUT BIG GROWTH WILL CONTINUE TO LEAD TO
MAJOR PRICE DIFFERENTIALS
Pricing differentials have comprised a major theme in 2012. the most obvious differential is Brent vs wtI, which has averaged approximately us$16.75/bbl in 2012 – a substantial opportunity cost for producers. moreover, Canadian producers have, at times, seen meaningful pricing discounts vs wtI, reflecting constraints in the PAdd 2 market. relief valves will open with the seaway expansion (250,000 bbl/d) in Q1/2013 and the south portion of keystone XL (700,000 bbl/d in late 2013), and the consensus view presumes that these pipes will solve the pricing problems. In our view, they will help narrow the Brent-wtI discount but that discount will remain in the us$10/bbl range. this is a similar conclusion to that reached by our commodities strategists (page 28). our rationale is that these new pipes simply push the current PAdd 2 glut into PAdd 3, which will knock out PAdd 3 light oil imports in early 2013 and prompt Light Louisiana sweet (LLs) pricing on the Gulf Coast to begin discounting vs Brent. we believe LLs will move to an approximately us$5/bbl discount vs Brent (vs its historical range of Brent + transportation costs) and wtI will move to a transportation discount vs LLs of approximately us$5/bbl, leading to a long-term Brent-wtI differential of us$10/bbl. As current consensus expectations generally reflect a narrowing of Brent-wtI down to us$1/bbl–us$2/bbl by 2014+, we believe consensus expectations overstate the value of domestic oil producers exposed to this theme and understate valuations of Brent-exposed and downstream-exposed producers.
PRICING DIFFERENTIALS ARE GOOD FOR
DOWNSTREAM
If producers are losing out given price differentials, it means that refiners are benefiting and refinery economics are massively sensitive to every dollar change in crack spreads.
Chart 1
Differentials Have Weighed on Canadian Producers
source: CIBC, Bloomberg.
50%
60%
70%
80%
90%
100%
110%
120%
Feb-12 mar-12 Apr-12 may-12 Jun-12 Jul-12 Aug-12 sep-12 oct-12
us E&P us IntegCAd E&P CAd IntegGlobal Energy PAdd II Exposed Cdn E&P

42
CIBC A Look to the Future – 2013 Edition
InVEstInG
It is no secret that PAdd 2&4 and Canadian refiners have been reaping super-normal cash flows in 2011 and 2012. most investors believe this phenomenon to be very short term and have assigned very low valuations to refiners or integrateds that are gaining from this theme. we believe there will be a recognition in 2013 that price differentials are here to stay, and that will keep downstream margins elevated in the long term (albeit decreasing from current record levels). As investors recognize the strategic value of downstream, we expect to see a gradual re-rating of downstream-oriented names [in Canada that is suncor Energy Inc. (su-so), Cenovus Energy Inc. (CVE-so), Husky Energy Inc. (HsE-sP) and Imperial oil Limited (Imo-sP)].
2013 WILL BE A DEFINING YEAR FOR CANADIAN
PIPELINE POLITICS
Pipeline capacity out of western Canada is adequate for the short term, but substantial progress must be made on this front in 2013. Progress (or lack thereof) will have a big impact on sentiment towards Canadian oil producers. we estimate that pipeline capacity out of the western Canadian sedimentary Basin (wCsB) could effectively be full in the 2014 time frame (our production forecasts are higher than consensus), suggesting little room for error/politicking in bringing on new pipeline capacity.
there are ~2.9 mmbbl/d of long-haul pipeline proposals on the table (out of western Canada). that sounds like a lot until one considers that two of the largest (the proposed 525,000 bbl/d Gateway and 450,000 bbl/d tmX expansion through BC) face ever-increasing political risk; we assign no better than 50/50 odds that these pipes are built before the end of the decade. the proposed transCanada mainline conversion (estimated ~600,000 bbl/d) is compelling but very early stage and could also provoke some political backlash in Québec. we also note that the 2.9 mmbbl/d proposed capacity is quickly depleted given our forecast of 100,000 bbl/d per year growth in Canadian conventional oil and 230,000 bbl/d per year growth in oil sands (or ~300,000 bbl/d when blended). Canada needs pipe – and lots of it – to avoid the opportunity cost of stranding over a million barrels a day of potential crude oil growth.
GAS OUTLOOK IMPROVES
natural gas prices remain a roller-coaster but we believe
the next leg looks sustainably stronger, thanks to a major shift away from gas to oil drilling. In this we also agree with our commodities strategists (page 29). while a supply correction is long overdue, our bottom-up modeling suggests that us gas production remains static in 2013 while Canadian production continues to decline. this is a sharp change to the +3 bcf/d per year us growth over the past three years. the gas cycle is more sustainable this time around as the us rig fleet is largely drilling higher-return oil and liquids plays, implying that a big ramp-up in gas drilling will only transpire if pricing is sufficient to move rigs from oil plays to gas – which, in our view, is difficult to justify until the us$5/mcf range on most plays.
GOOD OPPORTUNITY STILL IN QUALITY GAS
PRODUCERS
For the first time in many years, the outlook for natural gas prices looks quite attractive. with tightening storage balances in 2013/2014 and a rig count that will likely be slow to return to gas drilling, gas prices should move into the us$4/mcf range in 2013. with some marquee gas players, such as Encana (ECA-sP), already reflecting relatively high gas prices (~us$4.50/mcf), we favour mid- to small-cap producers or large-cap companies that have material gas assets but that the market has been slower to re-rate for that value. our top picks for gas exposure are: talisman Energy Inc. (tLm-so) in the large caps, tourmaline oil Corp. [tou-so] in the mid caps, and Painted Pony Petroleum Ltd. (PPY-so) in the small caps.
NORTH AMERICAN LNG IS ADVANCING
we published a major report on north American LnG in early 2012, with the key takeaway being that north American LnG is viable and that we would see a resource grab for strategic gas assets in 2012 – even during a low gas-price year. this thesis has proven largely correct. In the us, construction has started on the first LnG export terminal (sabine Pass). Export approvals are still pending on a number of other us terminals, and we expect several approvals to occur in H1/2013 (later than originally expected, with decisions being deferred until after the us Presidential election). Canadian LnG has been on a more mixed path.
on the negative side, the Apache-led (APA-nYsE) kitimat LnG project (1.4 bcf/d) is about one year behind schedule

43
CIBC A Look to the Future – 2013 Edition
InVEstInG
for signing off-take agreements, and its significant lead is rapidly eroding. despite the delays we remain optimistic on this project although we would not be surprised if ownership were to change hands. on the positive side Petronas and royal dutch (rds.A-nYsE) formalized plans for their projects and, consequently, there has been major deal flow, with Petronas bidding $5.5 billion for Progress Energy resources Corp. (PrQ-sP), PetroChina (Ptr-nYsE) buying a +us$1 billion of gas assets from royal dutch, and mitsubishi (8058-t) signing a $2.9 billion joint venture with Encana to supply its share of the rds project. more recently Exxonmobil Corporation (Xom-nYsE) has offered $3.1 billion for Celtic Exploration Ltd. (CLt-sP), partly motivated by LnG opportunity. we believe there are still more deals to be done to consolidate the massive resource required to build these facilities, but further deal announcements will wait until the Canadian government firms its rules regarding acquisitions by state-owned Enterprises (soEs). we believe the next most likely sellers of gas resource for LnG are talisman Energy and Painted Pony Petroleum.
M&A – CANADIAN SECTOR RIPE FOR MORE
CONSOLIDATION…BUT PENDING GOVERNMENT
CLARITY
A major theme from last year’s edition of Look to the Future was the increasing potential for big-cap m&A in Canada given how absurdly low valuations had become. that theme has started to play out with CnooC Ltd. (CEo-nYsE) bidding us$15.1 billion for nexen Inc. (nXY-su) and Petronas bidding $5.5 billion for Progress. we foresee the potential for other m&A transactions if the Canadian government establishes guidelines for acquisitions of Canadian companies by soEs. Companies such as talisman Energy, Encana and Canadian oil sands Limited (Cos-su) would, in our view, be the most likely big-cap m&A targets.
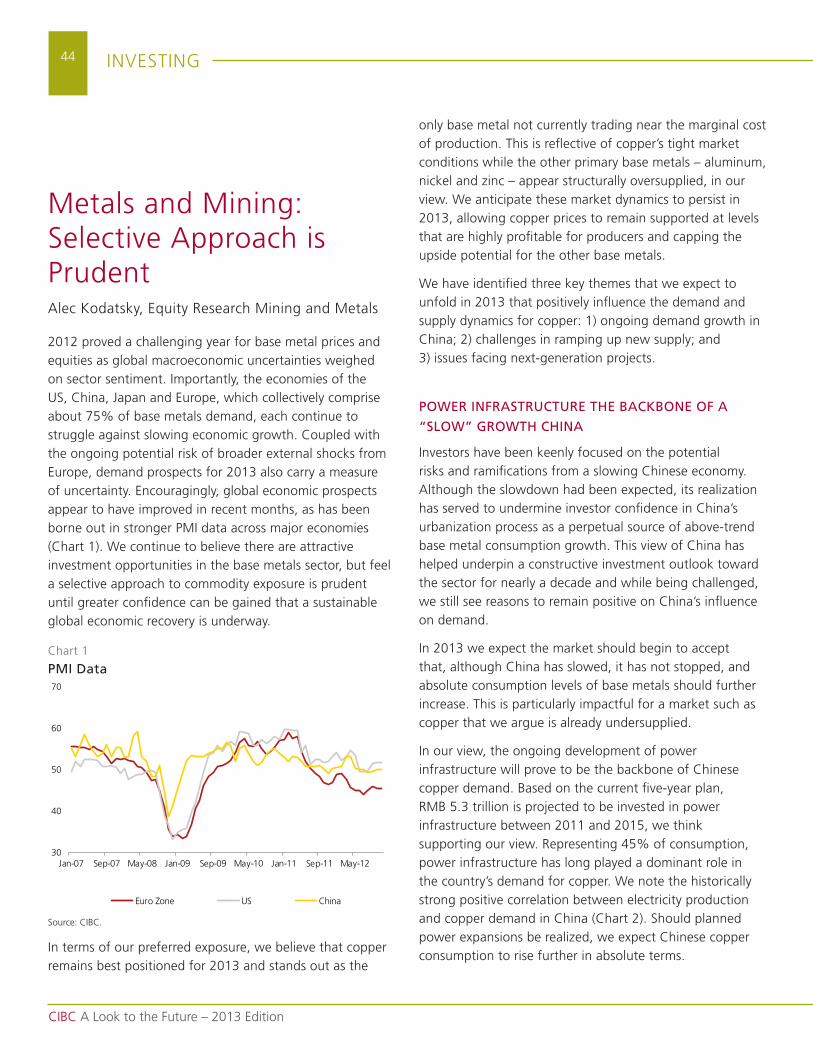
44
CIBC A Look to the Future – 2013 Edition
InVEstInG
only base metal not currently trading near the marginal cost of production. this is reflective of copper’s tight market conditions while the other primary base metals – aluminum, nickel and zinc – appear structurally oversupplied, in our view. we anticipate these market dynamics to persist in 2013, allowing copper prices to remain supported at levels that are highly profitable for producers and capping the upside potential for the other base metals.
we have identified three key themes that we expect to unfold in 2013 that positively influence the demand and supply dynamics for copper: 1) ongoing demand growth in China; 2) challenges in ramping up new supply; and 3) issues facing next-generation projects.
POWER INFRASTRUCTURE THE BACKBONE OF A
“SLOW” GROWTH CHINA
Investors have been keenly focused on the potential risks and ramifications from a slowing Chinese economy. Although the slowdown had been expected, its realization has served to undermine investor confidence in China’s urbanization process as a perpetual source of above-trend base metal consumption growth. this view of China has helped underpin a constructive investment outlook toward the sector for nearly a decade and while being challenged, we still see reasons to remain positive on China’s influence on demand.
In 2013 we expect the market should begin to accept that, although China has slowed, it has not stopped, and absolute consumption levels of base metals should further increase. this is particularly impactful for a market such as copper that we argue is already undersupplied.
In our view, the ongoing development of power infrastructure will prove to be the backbone of Chinese copper demand. Based on the current five-year plan, rmB 5.3 trillion is projected to be invested in power infrastructure between 2011 and 2015, we think supporting our view. representing 45% of consumption, power infrastructure has long played a dominant role in the country’s demand for copper. we note the historically strong positive correlation between electricity production and copper demand in China (Chart 2). should planned power expansions be realized, we expect Chinese copper consumption to rise further in absolute terms.
metals and mining: selective Approach is PrudentAlec kodatsky, Equity research mining and metals
2012 proved a challenging year for base metal prices and equities as global macroeconomic uncertainties weighed on sector sentiment. Importantly, the economies of the us, China, Japan and Europe, which collectively comprise about 75% of base metals demand, each continue to struggle against slowing economic growth. Coupled with the ongoing potential risk of broader external shocks from Europe, demand prospects for 2013 also carry a measure of uncertainty. Encouragingly, global economic prospects appear to have improved in recent months, as has been borne out in stronger PmI data across major economies (Chart 1). we continue to believe there are attractive investment opportunities in the base metals sector, but feel a selective approach to commodity exposure is prudent until greater confidence can be gained that a sustainable global economic recovery is underway.
In terms of our preferred exposure, we believe that copper remains best positioned for 2013 and stands out as the
Chart 1
PMI Data
source: CIBC.
30
40
50
60
70
Jan-07 sep-07 may-08 Jan-09 sep-09 may-10 Jan-11 sep-11 may-12
Euro Zone us China
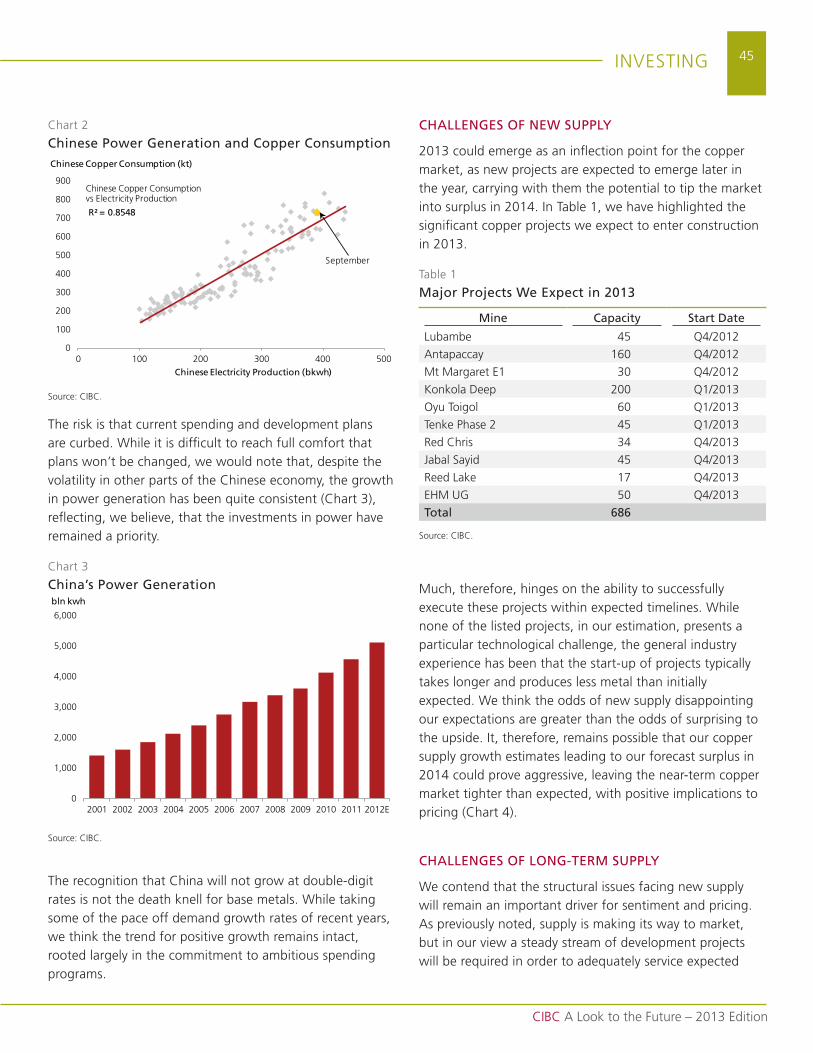
45
CIBC A Look to the Future – 2013 Edition
InVEstInG
the risk is that current spending and development plans are curbed. while it is difficult to reach full comfort that plans won’t be changed, we would note that, despite the volatility in other parts of the Chinese economy, the growth in power generation has been quite consistent (Chart 3), reflecting, we believe, that the investments in power have remained a priority.
the recognition that China will not grow at double-digit rates is not the death knell for base metals. while taking some of the pace off demand growth rates of recent years, we think the trend for positive growth remains intact, rooted largely in the commitment to ambitious spending programs.
CHALLENGES OF NEW SUPPLY
2013 could emerge as an inflection point for the copper market, as new projects are expected to emerge later in the year, carrying with them the potential to tip the market into surplus in 2014. In table 1, we have highlighted the significant copper projects we expect to enter construction in 2013.
much, therefore, hinges on the ability to successfully execute these projects within expected timelines. while none of the listed projects, in our estimation, presents a particular technological challenge, the general industry experience has been that the start-up of projects typically takes longer and produces less metal than initially expected. we think the odds of new supply disappointing our expectations are greater than the odds of surprising to the upside. It, therefore, remains possible that our copper supply growth estimates leading to our forecast surplus in 2014 could prove aggressive, leaving the near-term copper market tighter than expected, with positive implications to pricing (Chart 4).
CHALLENGES OF LONG-TERM SUPPLY
we contend that the structural issues facing new supply will remain an important driver for sentiment and pricing. As previously noted, supply is making its way to market, but in our view a steady stream of development projects will be required in order to adequately service expected
Chart 3
China’s Power Generation
source: CIBC.
0
1,000
2,000
3,000
4,000
5,000
6,000
2001 2002 2003 2004 2005 2006 2007 2008 2009 2010 2011 2012E
bln kwh
Chart 2
Chinese Power Generation and Copper Consumption
source: CIBC.
R² = 0.8548
0
100
200
300
400
500
600
700
800
900
0 100 200 300 400 500Chinese Electricity Production (bkwh)
Chinese Copper Consumptionvs Electricity Production
september
Chinese Copper Consumption (kt)
table 1
Major Projects We Expect in 2013
Mine Capacity Start Date
Lubambe 45 Q4/2012
Antapaccay 160 Q4/2012
mt margaret E1 30 Q4/2012
konkola deep 200 Q1/2013
oyu toigol 60 Q1/2013
tenke Phase 2 45 Q1/2013
red Chris 34 Q4/2013
Jabal sayid 45 Q4/2013
reed Lake 17 Q4/2013
EHm uG 50 Q4/2013
Total 686
source: CIBC.
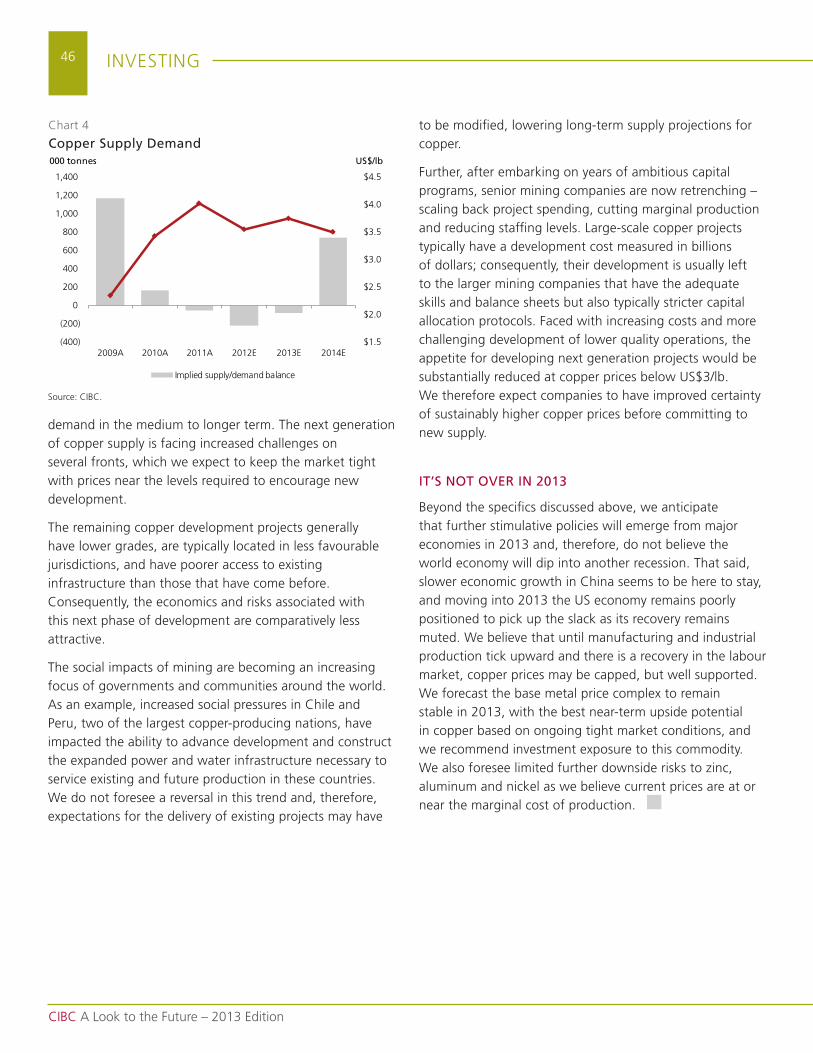
46
CIBC A Look to the Future – 2013 Edition
InVEstInG
demand in the medium to longer term. the next generation of copper supply is facing increased challenges on several fronts, which we expect to keep the market tight with prices near the levels required to encourage new development.
the remaining copper development projects generally have lower grades, are typically located in less favourable jurisdictions, and have poorer access to existing infrastructure than those that have come before. Consequently, the economics and risks associated with this next phase of development are comparatively less attractive.
the social impacts of mining are becoming an increasing focus of governments and communities around the world. As an example, increased social pressures in Chile and Peru, two of the largest copper-producing nations, have impacted the ability to advance development and construct the expanded power and water infrastructure necessary to service existing and future production in these countries. we do not foresee a reversal in this trend and, therefore, expectations for the delivery of existing projects may have
Chart 4
Copper Supply Demand
source: CIBC.
$1.5
$2.0
$2.5
$3.0
$3.5
$4.0
$4.5
(400)
(200)
0
200
400
600
800
1,000
1,200
1,400
2009A 2010A 2011A 2012E 2013E 2014E
Implied supply/demand balance
000 tonnes US$/lb
to be modified, lowering long-term supply projections for copper.
Further, after embarking on years of ambitious capital programs, senior mining companies are now retrenching – scaling back project spending, cutting marginal production and reducing staffing levels. Large-scale copper projects typically have a development cost measured in billions of dollars; consequently, their development is usually left to the larger mining companies that have the adequate skills and balance sheets but also typically stricter capital allocation protocols. Faced with increasing costs and more challenging development of lower quality operations, the appetite for developing next generation projects would be substantially reduced at copper prices below us$3/lb. we therefore expect companies to have improved certainty of sustainably higher copper prices before committing to new supply.
IT’S NOT OVER IN 2013
Beyond the specifics discussed above, we anticipate that further stimulative policies will emerge from major economies in 2013 and, therefore, do not believe the world economy will dip into another recession. that said, slower economic growth in China seems to be here to stay, and moving into 2013 the us economy remains poorly positioned to pick up the slack as its recovery remains muted. we believe that until manufacturing and industrial production tick upward and there is a recovery in the labour market, copper prices may be capped, but well supported. we forecast the base metal price complex to remain stable in 2013, with the best near-term upside potential in copper based on ongoing tight market conditions, and we recommend investment exposure to this commodity. we also foresee limited further downside risks to zinc, aluminum and nickel as we believe current prices are at or near the marginal cost of production.
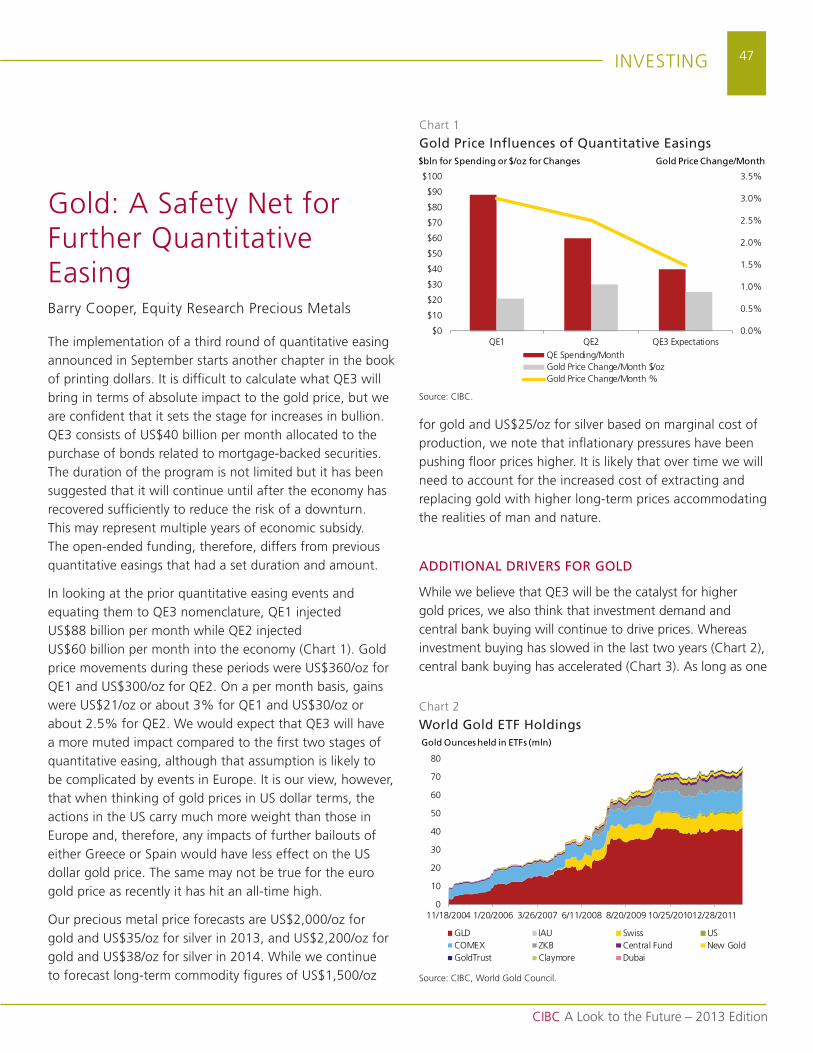
47
CIBC A Look to the Future – 2013 Edition
InVEstInG
Gold: A safety net for Further Quantitative EasingBarry Cooper, Equity research Precious metals
the implementation of a third round of quantitative easing announced in september starts another chapter in the book of printing dollars. It is difficult to calculate what QE3 will bring in terms of absolute impact to the gold price, but we are confident that it sets the stage for increases in bullion. QE3 consists of us$40 billion per month allocated to the purchase of bonds related to mortgage-backed securities. the duration of the program is not limited but it has been suggested that it will continue until after the economy has recovered sufficiently to reduce the risk of a downturn. this may represent multiple years of economic subsidy. the open-ended funding, therefore, differs from previous quantitative easings that had a set duration and amount.
In looking at the prior quantitative easing events and equating them to QE3 nomenclature, QE1 injected us$88 billion per month while QE2 injected us$60 billion per month into the economy (Chart 1). Gold price movements during these periods were us$360/oz for QE1 and us$300/oz for QE2. on a per month basis, gains were us$21/oz or about 3% for QE1 and us$30/oz or about 2.5% for QE2. we would expect that QE3 will have a more muted impact compared to the first two stages of quantitative easing, although that assumption is likely to be complicated by events in Europe. It is our view, however, that when thinking of gold prices in us dollar terms, the actions in the us carry much more weight than those in Europe and, therefore, any impacts of further bailouts of either Greece or spain would have less effect on the us dollar gold price. the same may not be true for the euro gold price as recently it has hit an all-time high.
our precious metal price forecasts are us$2,000/oz for gold and us$35/oz for silver in 2013, and us$2,200/oz for gold and us$38/oz for silver in 2014. while we continue to forecast long-term commodity figures of us$1,500/oz
for gold and us$25/oz for silver based on marginal cost of production, we note that inflationary pressures have been pushing floor prices higher. It is likely that over time we will need to account for the increased cost of extracting and replacing gold with higher long-term prices accommodating the realities of man and nature.
ADDITIONAL DRIVERS FOR GOLD
while we believe that QE3 will be the catalyst for higher gold prices, we also think that investment demand and central bank buying will continue to drive prices. whereas investment buying has slowed in the last two years (Chart 2), central bank buying has accelerated (Chart 3). As long as one
Chart 1
Gold Price Influences of Quantitative Easings
source: CIBC.
0.0%
0.5%
1.0%
1.5%
2.0%
2.5%
3.0%
3.5%
$0
$10
$20
$30
$40
$50
$60
$70
$80
$90
$100
QE1 QE2 QE3 ExpectationsQE spending/monthGold Price Change/month $/ozGold Price Change/month %
Gold Price Change/Month$bln for Spending or $/oz for Changes
Chart 2
World Gold ETF Holdings
source: CIBC, world Gold Council.
0
10
20
30
40
50
60
70
80
11/18/2004 1/20/2006 3/26/2007 6/11/2008 8/20/2009 10/25/201012/28/2011
GLd IAu swiss usComEX ZkB Central Fund new GoldGoldtrust Claymore dubai
Gold Ounces held in ETFs (mln)
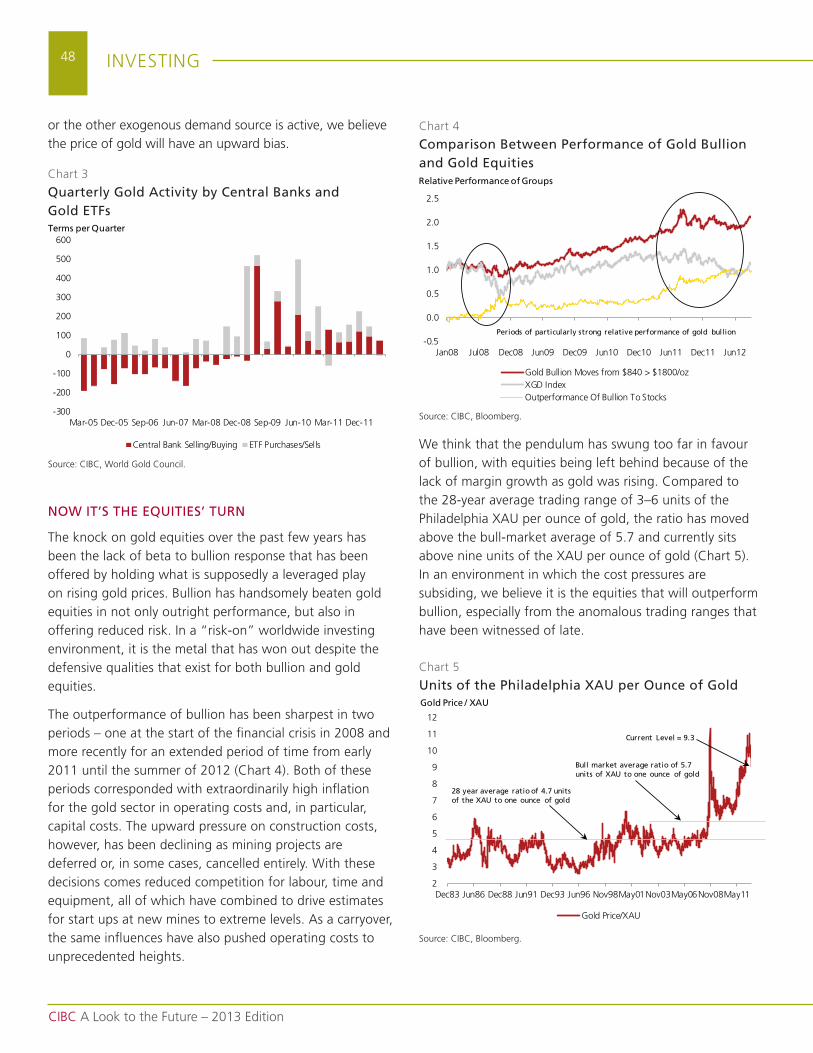
48
CIBC A Look to the Future – 2013 Edition
InVEstInG
we think that the pendulum has swung too far in favour of bullion, with equities being left behind because of the lack of margin growth as gold was rising. Compared to the 28-year average trading range of 3–6 units of the Philadelphia XAu per ounce of gold, the ratio has moved above the bull-market average of 5.7 and currently sits above nine units of the XAu per ounce of gold (Chart 5). In an environment in which the cost pressures are subsiding, we believe it is the equities that will outperform bullion, especially from the anomalous trading ranges that have been witnessed of late.
or the other exogenous demand source is active, we believe the price of gold will have an upward bias.
NOW IT’S THE EQUITIES’ TURN
the knock on gold equities over the past few years has been the lack of beta to bullion response that has been offered by holding what is supposedly a leveraged play on rising gold prices. Bullion has handsomely beaten gold equities in not only outright performance, but also in offering reduced risk. In a “risk-on” worldwide investing environment, it is the metal that has won out despite the defensive qualities that exist for both bullion and gold equities.
the outperformance of bullion has been sharpest in two periods – one at the start of the financial crisis in 2008 and more recently for an extended period of time from early 2011 until the summer of 2012 (Chart 4). Both of these periods corresponded with extraordinarily high inflation for the gold sector in operating costs and, in particular, capital costs. the upward pressure on construction costs, however, has been declining as mining projects are deferred or, in some cases, cancelled entirely. with these decisions comes reduced competition for labour, time and equipment, all of which have combined to drive estimates for start ups at new mines to extreme levels. As a carryover, the same influences have also pushed operating costs to unprecedented heights.
Chart 3
Quarterly Gold Activity by Central Banks and Gold ETFs
source: CIBC, world Gold Council.
-300
-200
-100
0
100
200
300
400
500
600
mar-05 dec-05 sep-06 Jun-07 mar-08 dec-08 sep-09 Jun-10 mar-11 dec-11
Central Bank selling/Buying EtF Purchases/sells
Terms per Quarter
Chart 4
Comparison Between Performance of Gold Bullion and Gold Equities
source: CIBC, Bloomberg.
-0.5
0.0
0.5
1.0
1.5
2.0
2.5
Jan08 Jul08 dec08 Jun09 dec09 Jun10 dec10 Jun11 dec11 Jun12
Gold Bullion moves from $840 > $1800/ozXGd Indexoutperformance of Bullion to stocks
Periods of particularly strong relative performance of gold bullion
Relative Performance of Groups
Chart 5
Units of the Philadelphia XAU per Ounce of Gold
source: CIBC, Bloomberg.
2
3
4
5
6
7
8
9
10
11
12
dec83 Jun86 dec88 Jun91 dec93 Jun96 nov98may01nov03may06nov08may11
Gold Price/XAu
28 year average ratio of 4.7 units of the XAU to one ounce of gold
Bull market average ratio of 5.7 units of XAU to one ounce of gold
Current Level = 9.3
Gold Price / XAU

49
CIBC A Look to the Future – 2013 Edition
InVEstInG
with valuations offered throughout the sector, we think that investors should focus on fundamental parameters that differentiate gold companies from one another leading to increased appeal for share price appreciation. Among these are:
1) Reserve Growth:
replacing reserves has become a challenge for large gold producers, with the prospects for growing reserves almost totally absent in the sector. Among the large-cap names with the best track record of growing reserves are Yamana Gold Inc. (AuY-so), Agnico-Eagle mines Limited (AEm-sP) and new Gold Inc. (nGd-sP).
2) Production Growth:
while not as rare as reserve growth, production growth has become anaemic for the largest gold companies as they strive to deliver some aspect of investor appeal. Among those companies with the greatest two-year production growth are Goldcorp Inc. (GG-so), Eldorado Gold Corporation (EGo-sP), Banro Corporation (BAA-sP), Yamana Gold, and Agnico-Eagle mines.
3) Asset Quality:
discounted cash flow (dCF) valuations can take into account the quality of an asset but these calculations fail to capture the market sentiment for various mines. High-grade deposits command higher multiples than do low-grade ones. Companies with a disproportional amount of high grade in their portfolio include Goldcorp, Centerra Gold Inc. (CG-so), and tahoe resources Inc. (tHo-sP)
4) Low Political Risk:
opportunity often awaits the investor who ventures into high-risk regions of the world but often the threat of political instability accompanies the potential reward. there is a bigger audience for safe jurisdictions and, as such, demand for these stocks tends to be higher despite valuation differences. Among the stocks with the lowest political risk are Agnico-Eagle mines, Goldcorp, and osisko mining Corporation (osk-so).
5) Dividends:
the partnership between investors and companies has become enhanced with the advent of increased dividends. most companies have either started dividend policies (if none existed) or instituted novel payout structures that are related to a combination of performance and commodity price movement. Included in the group leading the way in dividend policies that are unique in the industry are newmont mining Corporation (nEm-sP), silver wheaton Corp. (sLw-so) and Eldorado Gold.
6) Value:
Gold equities have never been cheaper and now many trade well below s&P averages for traditional metrics such as P/E ratios. P/CF and nAV are more traditionally held metrics that gold companies are measured by, but all value techniques have merit. Among the least expensive producers are AngloGold Ashanti Limited (AnG-so), Barrick Gold Corporation (ABX-sP), Centerra, and IAmGoLd Corporation (IAG-sP).
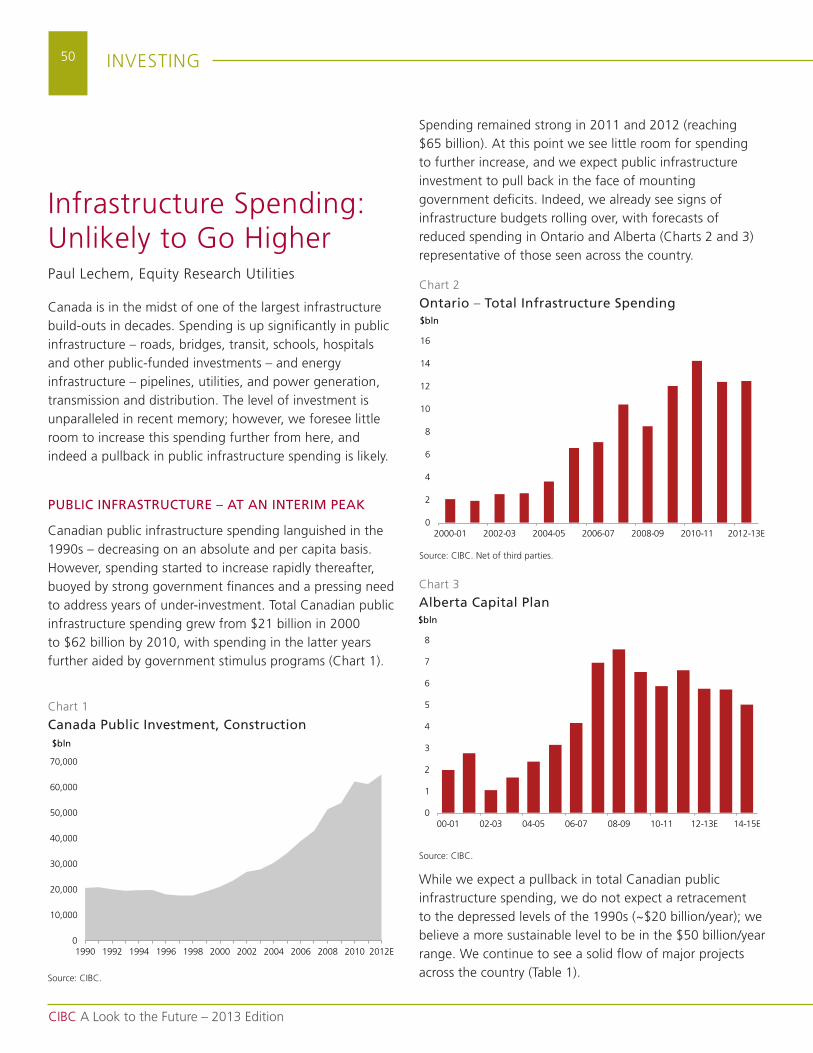
50
CIBC A Look to the Future – 2013 Edition
InVEstInG
spending remained strong in 2011 and 2012 (reaching $65 billion). At this point we see little room for spending to further increase, and we expect public infrastructure investment to pull back in the face of mounting government deficits. Indeed, we already see signs of infrastructure budgets rolling over, with forecasts of reduced spending in ontario and Alberta (Charts 2 and 3) representative of those seen across the country.
while we expect a pullback in total Canadian public infrastructure spending, we do not expect a retracement to the depressed levels of the 1990s (~$20 billion/year); we believe a more sustainable level to be in the $50 billion/year range. we continue to see a solid flow of major projects across the country (table 1).
Infrastructure spending: unlikely to Go HigherPaul Lechem, Equity research utilities
Canada is in the midst of one of the largest infrastructure build-outs in decades. spending is up significantly in public infrastructure – roads, bridges, transit, schools, hospitals and other public-funded investments – and energy infrastructure – pipelines, utilities, and power generation, transmission and distribution. the level of investment is unparalleled in recent memory; however, we foresee little room to increase this spending further from here, and indeed a pullback in public infrastructure spending is likely.
PUBLIC INFRASTRUCTURE – AT AN INTERIM PEAK
Canadian public infrastructure spending languished in the 1990s – decreasing on an absolute and per capita basis. However, spending started to increase rapidly thereafter, buoyed by strong government finances and a pressing need to address years of under-investment. total Canadian public infrastructure spending grew from $21 billion in 2000 to $62 billion by 2010, with spending in the latter years further aided by government stimulus programs (Chart 1).
Chart 1
Canada Public Investment, Construction
source: CIBC.
0
10,000
20,000
30,000
40,000
50,000
60,000
70,000
1990 1992 1994 1996 1998 2000 2002 2004 2006 2008 2010 2012E
$bln
Chart 2
Ontario – Total Infrastructure Spending
0
2
4
6
8
10
12
14
16
2000-01 2002-03 2004-05 2006-07 2008-09 2010-11 2012-13E
$bln
source: CIBC. net of third parties.
Chart 3
Alberta Capital Plan
source: CIBC.
0
1
2
3
4
5
6
7
8
00-01 02-03 04-05 06-07 08-09 10-11 12-13E 14-15E
$bln
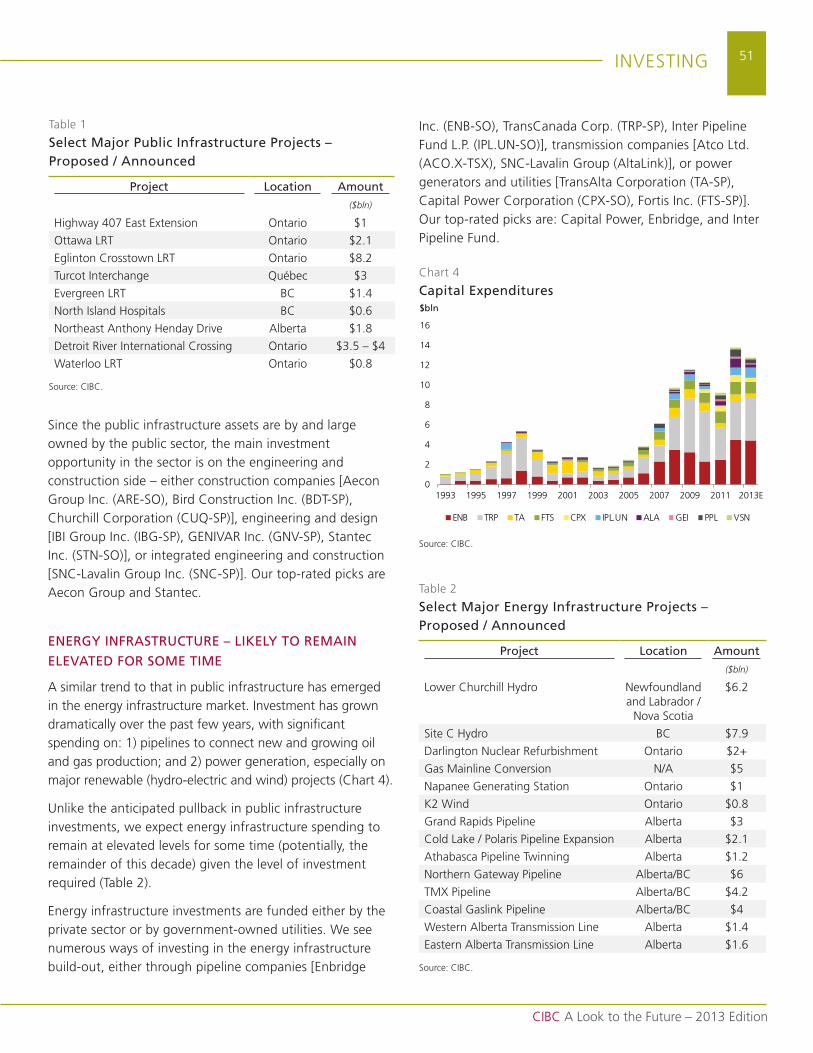
51
CIBC A Look to the Future – 2013 Edition
InVEstInG
Inc. (EnB-so), transCanada Corp. (trP-sP), Inter Pipeline Fund L.P. (IPL.un-so)], transmission companies [Atco Ltd. (ACo.X-tsX), snC-Lavalin Group (AltaLink)], or power generators and utilities [transAlta Corporation (tA-sP), Capital Power Corporation (CPX-so), Fortis Inc. (Fts-sP)]. our top-rated picks are: Capital Power, Enbridge, and Inter Pipeline Fund.
since the public infrastructure assets are by and large owned by the public sector, the main investment opportunity in the sector is on the engineering and construction side – either construction companies [Aecon Group Inc. (ArE-so), Bird Construction Inc. (Bdt-sP), Churchill Corporation (CuQ-sP)], engineering and design [IBI Group Inc. (IBG-sP), GEnIVAr Inc. (GnV-sP), stantec Inc. (stn-so)], or integrated engineering and construction [snC-Lavalin Group Inc. (snC-sP)]. our top-rated picks are Aecon Group and stantec.
ENERGY INFRASTRUCTURE – LIKELY TO REMAIN
ELEVATED FOR SOME TIME
A similar trend to that in public infrastructure has emerged in the energy infrastructure market. Investment has grown dramatically over the past few years, with significant spending on: 1) pipelines to connect new and growing oil and gas production; and 2) power generation, especially on major renewable (hydro-electric and wind) projects (Chart 4).
unlike the anticipated pullback in public infrastructure investments, we expect energy infrastructure spending to remain at elevated levels for some time (potentially, the remainder of this decade) given the level of investment required (table 2).
Energy infrastructure investments are funded either by the private sector or by government-owned utilities. we see numerous ways of investing in the energy infrastructure build-out, either through pipeline companies [Enbridge
Chart 4
Capital Expenditures
source: CIBC.
0
2
4
6
8
10
12
14
16
1993 1995 1997 1999 2001 2003 2005 2007 2009 2011 2013E
EnB trP tA Fts CPX IPL.un ALA GEI PPL Vsn
$bln
table 1
Select Major Public Infrastructure Projects – Proposed / Announced
Project Location Amount($bln)
Highway 407 East Extension ontario $1
ottawa Lrt ontario $2.1
Eglinton Crosstown Lrt ontario $8.2
turcot Interchange Québec $3
Evergreen Lrt BC $1.4
north Island Hospitals BC $0.6
northeast Anthony Henday drive Alberta $1.8
detroit river International Crossing ontario $3.5 – $4
waterloo Lrt ontario $0.8
source: CIBC.
table 2
Select Major Energy Infrastructure Projects – Proposed / Announced
Project Location Amount($bln)
Lower Churchill Hydro newfoundland and Labrador /
nova scotia
$6.2
site C Hydro BC $7.9
darlington nuclear refurbishment ontario $2+
Gas mainline Conversion n/A $5
napanee Generating station ontario $1
k2 wind ontario $0.8
Grand rapids Pipeline Alberta $3
Cold Lake / Polaris Pipeline Expansion Alberta $2.1
Athabasca Pipeline twinning Alberta $1.2
northern Gateway Pipeline Alberta/BC $6
tmX Pipeline Alberta/BC $4.2
Coastal Gaslink Pipeline Alberta/BC $4
western Alberta transmission Line Alberta $1.4
Eastern Alberta transmission Line Alberta $1.6
source: CIBC.

52
CIBC A Look to the Future – 2013 Edition
InVEstInG
Financial services: resilience in uncertain timesrobert sedran, Equity research Banks and Insurance
For both the economy and the markets, the road back from the depths of the liquidity crisis has been an uneven one. notwithstanding the fact that most indexes seem set to end the year in positive territory, economic growth has been uninspiring and market volatility has been elevated. Against that backdrop, Canadian financial services firms have worked to adapt to the new slower-growing normal while still pushing their franchises forward in search of growth. Although visibility remains poor, we expect these themes to continue in 2013. In other words, we do not assume an environment next year that is appreciably better or worse than the one in which we are currently operating.
CANADIAN BANKS – SLOWING BUT STILL GROWING
the Canadian banks had another strong year in 2012 with earnings growth generally better than expected, helped by solid loan growth and resilient market-sensitive revenues, and complemented by ongoing acquisition activity. that stronger performance increases our confidence with our 2013 estimates and – by extension – increases our comfort with our constructive investment thesis for the sector.
Housing, Housing and Housing are Top Three
Concerns
with residential mortgages comprising approximately 40% of loans outstanding for the large Canadian banks (and that does not include home equity lines of credit), there is no more important asset class for banks and their customers than housing. the combination of a steady climb in house prices and an associated steady climb in consumer leverage has raised the concern that, like so many other markets around the world, the Canadian market is at risk
of a severe correction. though the structure of the market (especially the fact that high ratio mortgages require insurance) would likely protect the banks from much of the direct impact, there is no way to escape the impact on the broader economy.
Even if one is sympathetic to these concerns, such a correction would require a catalyst – like a big increase in interest rates or a surge in unemployment (which would also require a catalyst). A scenario in which economic growth continues implies that unemployment levels are stable as well. our assumption is for a gradual correction in housing prices that will be felt more through a slowdown in loan origination than it will through a spike in loan losses.
Elevated Consumer Debt Weighs on Growth
A look at some of the key earnings drivers illustrates why we assume organic growth rates are slowing. For the largest revenue category – net interest income – the assumed growth rate is constrained by forecasts on both key components. one of the factors behind the strong housing market has been the fact that consumers have taken advantage of falling interest rates to increase their financial leverage. with that leverage at historic highs, we assume asset growth will be hindered by the diminishing power of that catalyst.
At the same time, margin pressure has not abated. Low interest rates with a flat yield curve and intense competition will weigh on the margin again in 2013, especially with the prospect of higher rates being pushed back by lacklustre economic growth. the combination of these two items leads to our expectation that there will still be some growth in this line item in 2013, but also that the growth rate will be slower than it was in 2011 and 2012.
the volatility in capital markets-related revenues – trading, in particular – has settled down somewhat as banks have managed their trading inventories more closely. Correspondingly, we have taken our expectations for these lines higher since the probability of a bad quarter that will drag annual numbers lower has lessened. our annual estimates, however, assume that market conditions overall remain subdued and so we look for little progress in this category.

53
CIBC A Look to the Future – 2013 Edition
InVEstInG
individual banks. now that minimums have been achieved, we expect that to change. Capital remains a strength and the reason that we expect banks to remain active on acquisition opportunities as global banks are forced to retrench in order to build or preserve capital. several such deals occurred during the year. we expect that activity to continue.
Gradual Growth, Compelling Dividends
with growth slowing and concerns about the housing market and consumer debt omnipresent, we see little opportunity for material expansion in trading multiples despite the fact that they sit comfortably below historical levels. At the same time, with solid results, safe and growing dividends and the capital deployment opportunity, we see little reason for a decline in trading multiples. As such, we expect the shares to track with earnings growth, which when combined with growing dividends produce a total return profile in the high-single-digit to low-double-digit range. our stock selections favour banks that we believe can show more rapid revenue growth while controlling cost. we rate Bank of nova scotia (Bns-so) and td Bank (td-so) sector outperformers.
CANADIAN LIFECOS – NO LONGER JUST WAITING
FOR BETTER TIMES
there is no question that the operating environment continues to weigh on the life insurance sector. regardless of an individual lifeco’s risk positioning upon entering the crisis many years ago, a fundamental tenet for an industry selling long-dated products is that market forces – interest rates, in particular – must co-operate. with interest rates near historic lows and little prospect for a dramatic reversal in those rates, long-dated products are no longer economical for customers, shareholders and regulators.
while for a time there was little response from the industry as players waited for more normal conditions to return, the potential that previously unthinkable rates might persist for a prolonged period has forced action. the size and nature of the required restructuring has depended on individual company positioning and risk tolerance prior to the downturn, but the common threads have been clear. Pricing has increased, capital-intensive products have been
As for loan losses, higher levels of consumer debt have made the banks more vulnerable to an economic shock, but our base case assumes that losses as a percentage of loans outstanding will remain at trough levels. we expect loan losses to grow with the loan book in 2013.
Finally, as the revenue outlook has slowed, expenses have become a bigger focus. we do not foresee major expense initiatives or staff reductions, but we do expect all firms to tighten their control on cost as they work to protect operating leverage. In our view, the larger banks are better positioned to secure operating leverage in 2013.
Dividend Growth to Track Earnings Growth
the dividend story for the Canadian banks is a positive one. to be sure, the double-digit growth rates of the past will not return since payout ratios for most banks have little room to expand while domestic earnings growth rates have begun to slow. However, we do anticipate ongoing increases in dividends that roughly track with earnings growth (i.e. in the area of 5% to 7% annually). with an average dividend yield of over 4% (or more than three times the yield of five-year Canada bonds) and the expectation that gradual growth in dividends will continue for all banks, dividend yield is a very attractive component of the risk-reward profile.
Strong Balance Sheets Bring Opportunity
one of the themes of the post-crisis period has been the reregulation of the industry, with the Basel reforms being the most far-reaching changes. none of the banks have been named global systemically important banks (sIBs), but we do expect them to be classified as domestic sIBs, which implies that there will be an incremental buffer beyond the new Basel III minimum applied. All banks are now in compliance with Basel III minimum and in all cases they are well positioned to meet any incremental requirements.
that said, differences among banks are beginning to emerge. Banks with stronger ratios have announced share buybacks or acquisitions with cash, while banks with comparatively weaker positions raise fresh equity to fund acquisitions. until now, the focus on capital has been more about how quickly the sector can meet the new standards and less about the relative positioning of the

54
CIBC A Look to the Future – 2013 Edition
InVEstInG
de-emphasized or discontinued and hedging programs have taken risk levels materially lower.
Market Forces Remain Key to Better Book Value
Growth
Although market sensitivity has come down, there is no question that all companies would be much better off with higher interest rates and equity markets. our base-case assumption is that sluggish economic growth and low interest rates will persist into next year and so we expect book value growth to be constrained by sub-par profitability and ongoing – though perhaps smaller – charges to build reserves to reflect both the level of interest rates and adverse policyholder behaviour.
However, our base case does show the potential for modest book value growth in coming years, which, when combined with the repositioning of the businesses, the decline in new business strain that should accompany the
higher pricing, and our view that core earnings power has troughed, implies that the outlook for the shares no longer warrants extreme caution. In other words, while there is still opportunity to trade the lifecos based on shifting market sentiment, that trading should be done around core positions that reflect the gradually improving nature of the long-term risk-reward profile for the space.
Book Value Growth – Not Multiple Expansion –
is Needed
In terms of the basis for valuation, we continue to believe that upside in share prices should be tied to growth in book value rather than simply the hope that the multiple will expand on those same book values. multiple expansion must be accompanied by expansion in core profitability and the associated pick-up in book value per share. we currently have no sector outperformer-rated names in this sector.
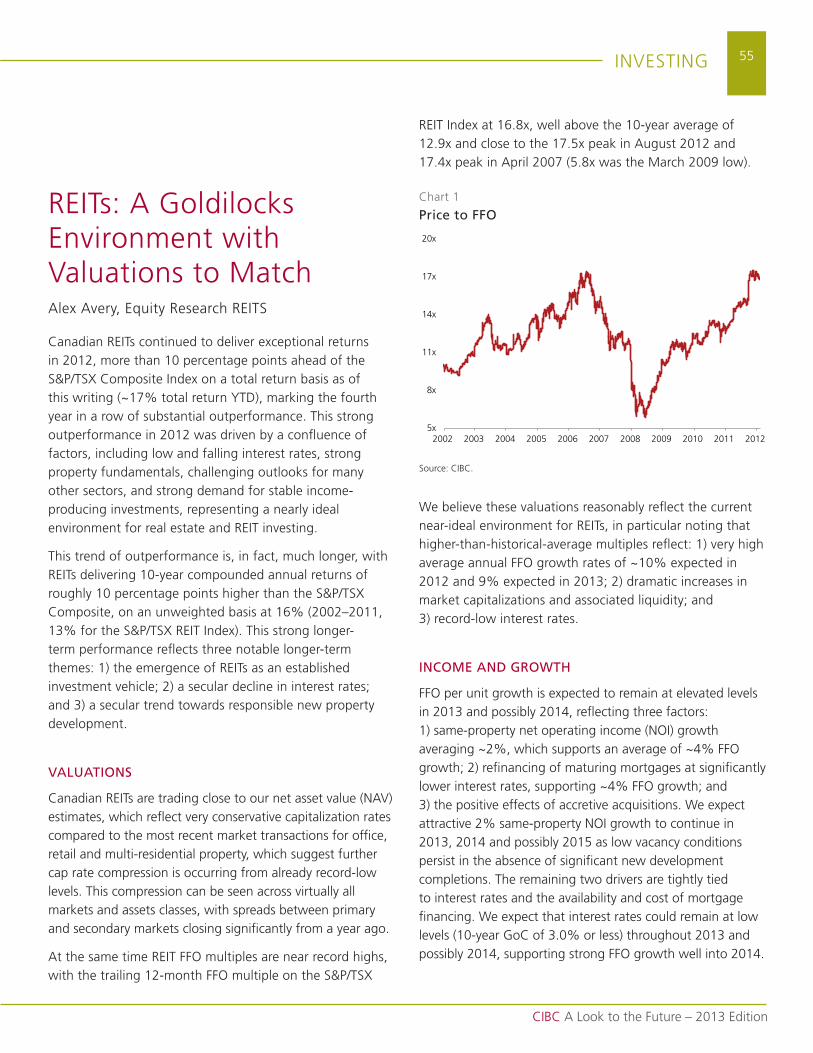
55
CIBC A Look to the Future – 2013 Edition
InVEstInG
rEIts: A Goldilocks Environment with Valuations to matchAlex Avery, Equity research rEIts
Canadian rEIts continued to deliver exceptional returns in 2012, more than 10 percentage points ahead of the s&P/tsX Composite Index on a total return basis as of this writing (~17% total return Ytd), marking the fourth year in a row of substantial outperformance. this strong outperformance in 2012 was driven by a confluence of factors, including low and falling interest rates, strong property fundamentals, challenging outlooks for many other sectors, and strong demand for stable income-producing investments, representing a nearly ideal environment for real estate and rEIt investing.
this trend of outperformance is, in fact, much longer, with rEIts delivering 10-year compounded annual returns of roughly 10 percentage points higher than the s&P/tsX Composite, on an unweighted basis at 16% (2002–2011, 13% for the s&P/tsX rEIt Index). this strong longer-term performance reflects three notable longer-term themes: 1) the emergence of rEIts as an established investment vehicle; 2) a secular decline in interest rates; and 3) a secular trend towards responsible new property development.
VALUATIONS
Canadian rEIts are trading close to our net asset value (nAV) estimates, which reflect very conservative capitalization rates compared to the most recent market transactions for office, retail and multi-residential property, which suggest further cap rate compression is occurring from already record-low levels. this compression can be seen across virtually all markets and assets classes, with spreads between primary and secondary markets closing significantly from a year ago.
At the same time rEIt FFo multiples are near record highs, with the trailing 12-month FFo multiple on the s&P/tsX
rEIt Index at 16.8x, well above the 10-year average of 12.9x and close to the 17.5x peak in August 2012 and 17.4x peak in April 2007 (5.8x was the march 2009 low).
we believe these valuations reasonably reflect the current near-ideal environment for rEIts, in particular noting that higher-than-historical-average multiples reflect: 1) very high average annual FFo growth rates of ~10% expected in 2012 and 9% expected in 2013; 2) dramatic increases in market capitalizations and associated liquidity; and 3) record-low interest rates.
INCOME AND GROWTH
FFo per unit growth is expected to remain at elevated levels in 2013 and possibly 2014, reflecting three factors: 1) same-property net operating income (noI) growth averaging ~2%, which supports an average of ~4% FFo growth; 2) refinancing of maturing mortgages at significantly lower interest rates, supporting ~4% FFo growth; and 3) the positive effects of accretive acquisitions. we expect attractive 2% same-property noI growth to continue in 2013, 2014 and possibly 2015 as low vacancy conditions persist in the absence of significant new development completions. the remaining two drivers are tightly tied to interest rates and the availability and cost of mortgage financing. we expect that interest rates could remain at low levels (10-year GoC of 3.0% or less) throughout 2013 and possibly 2014, supporting strong FFo growth well into 2014.
Chart 1
Price to FFO
5x
8x
11x
14x
17x
20x
2002 2003 2004 2005 2006 2007 2008 2009 2010 2011 2012
source: CIBC.

56
CIBC A Look to the Future – 2013 Edition
InVEstInG
MOVE TO MARKET WEIGHT
As trailing multiples moved to the higher end of the historical range during 2012, to levels fairly reflecting the near-ideal current environment, we reduced our sector weighting from overweight to market weight in september 2012. with average yields of 5.6% and FFo growth close to 10%, we expect total returns of 10% to 15%, reflecting yield income and earnings growth with flat to modestly lower multiples.
EYES ON THE HORIZON, SCANNING FOR CLOUDS
we expect that the current very favourable environment could persist through at least 2013, and possibly longer, allowing for continued attractive returns for investors and continued growth of the sector. However, given the backdrop of things nearly as good as it gets on all fronts, it’s prudent to be vigilant in monitoring for threats to the outlook. there are three primary potential threats to our outlook for rEIts, though none look concerning at this point, in our opinion: 1) a significant increase in interest rates – higher interest rates would negatively impact rEIt valuations through higher cap rates and lower multiples, as well as FFo growth prospects, as refinancing gains and accretive acquisition opportunities would diminish; 2) a material increase in new development activity – the threat with the most potential for significant and enduring damage to FFo and AFFo; development appears balanced at most, in certain markets, and constrained in others; and 3) a robust economic recovery – which would certainly divert capital towards other more economically sensitive asset classes and sectors, lowering rEIt valuations.
while none of these threats appear material in the near term, it’s worth noting that the absence of these threats doesn’t equate to the continued benefit from their opposite. Falling interest rates were critical factors in rEIt performance and FFo growth – but the benefit of low rates decays over time as debt is rolled to market and cap rates reach new equilibrium levels. the absence of recent development has led to the low vacancy rates we see today and rising rental rates, which will likely drive more development in the future. And the prospect of continued stable, but modest economic growth only maintains a rEIt-favourable environment, rather than improving the existing one.
IPOs DELIVER GROWTH PROSPECTS
one area of great interest in the current rEIt environment is new initial public offerings (IPo). we expect we could see more IPos in 2013, following three in 2012, as well as a number of other new entities arriving via CPCs, spin-offs and other means. these generally smaller entities offer much greater per-unit growth potential than the largest of Canadian rEIts, reflecting the vastly greater impact of acquisitions on smaller balance sheets and income statements relative to much larger, established rEIts. As the market for the primary asset classes of retail, office and multi-residential real estate has become dramatically more competitive and operating fundamentals reach peak levels, many of these new entrants focus on asset classes considered secondary or where fundamentals have yet to reach landlords’ markets. Examples in Canada today could include industrial property, seniors housing, and self storage.
Another area of opportunity appears to be IPos with foreign property in markets where conditions are moderate but expected to improve. these IPos offer the potential for much-greater-than-average growth in the Canadian market, where valuation upside appears somewhat limited, but also carry more risk relating to limited public operating track records, often unfamiliar management teams, and less favourable property fundamentals. In our view, these new IPos represent the best opportunity to generate above-average returns in 2013.
GOOD VISIBILITY – FOR A LITTLE WHILE
overall, the outlook for a continued favourable environment for rEIt operating performance and investment demand appears likely to continue well into 2013, and possibly into 2014. the risk of too much development (which could threaten operating performance) remains a threat in late 2015 at the earliest, while the risk of a significant increase in interest rates (which could hit valuations) appears modest until at least late 2013. In the interim, rEIts should continue to provide attractive income and growth in a muted economic growth environment, and provide excellent portfolio diversification characteristics, supporting their continued appeal in 2013.
57
CIBC A Look to the Future – 2013 Edition
InVEstInG
Portfolio strategyPeter Gibson, Equity research Portfolio strategy and
Quantitative Analysis
our asset mix models indicate that the s&P 500 and the tsX are undervalued based on the level of 10-year us bond yields, but in an environment such as this, the downward trend in roE worldwide warns of a very significant risk of another global recession. successful asset mix timing of equities demands sufficiently low interest rates And corporate profit growth in the same way that successful stock investments require low P/Es And a rising E. Another non-north American global recession has been implied for months based on the decline in E and roE around the world. worse, heavily debt-burdened western economies cannot easily deal with another recession and, especially, after trillions of dollars of quantitative easing. Another recession would imply that the Fed policy and fiat money quite simply failed to prevent an even bigger crisis.
so, quite candidly, what are the relevant observations for successful investing in this environment? First, as predicted, Europe is back in recession due to inaction, and thus the improbability of maintaining a currency union, in our opinion, still looms. this is a danger for equity investors and the required financial action by the Europeans now seems almost insurmountable. second, the us safe-haven status strategy has been invaluable in creating the conditions for some stability in the domestic us economy But the fiscal cliff continues to be threatening. In north America, interest rates are close to 250-year lows thanks to our relative safety, “rELAtIVE” being the operative word. this observation becomes even more apparent when we differentiate between north American companies with domestic versus international revenue exposures. the s&P 500 companies with significant international revenues are, on average, hurting due to significant global economic weakness, while the “domestically” oriented s&P 500 companies are hanging on. In fact, so far, the “domestic” tsX and s&P 500 companies both appear to be enduring the economic weakness.
our short-term timing signals indicate that the s&P 500 is oversold at approximately 1,324. It is possible, therefore, that the s&P 500 retreats to these levels or lower (i.e. 1,300) after peaking recently at 1,470. we believe that this retreat is fueled by uncertainty around the future of the Euro, the fiscal cliff and other possible us tax policy changes, although, in general, there are still other geopolitical issues to be concerned with. understandably, all of these concerns make it difficult to be a rational investor.
THE US MuST AND WILL ADDRESS THE FISCAL CLIFF
ISSUES
unfortunately, decisions have to be made. so, our view is that the fiscal cliff issues will be postponed and then diluted and, therefore, another rally in us equity prices is likely in 2013. In addition, the Euro may not survive 2013 but the Europeans have not yet given up and, therefore, austerity will appear to be less urgent. this would be consistent with our earlier view of the need for globally coordinated easing that would, and did, lift equity prices earlier this year, even though fundamentals, i.e. roE, were deteriorating. we believe that without more aggressive easing policies, the fragile domestic us recovery may be compromised and that could trigger a global debt crisis. If the European currency union breakup is not postponed, then that too could trigger a sufficient shock that would threaten the us economy, sending shockwaves through the global economy. the Fed, however, will use any just cause to “ease”.
It is likely that interest rates will remain very low, on average, for a very long time but we need lower oil prices urgently as well. Lower oil prices and low interest rates should lift north America-oriented stock prices from current levels to higher levels in 2013. the recent s&P 500 level is getting close to becoming oversold and so it may be early but there is a justification for increasing equities exposure to stocks that still have profit growth and attractive valuation.
separately, the CIBC Investment strategy Committee (IsC) has meaningfully higher targets for the tsX and s&P 500 to the end of 2013 combined with a modest backup in 10-year us bond yields. In the last few days, it would appear that the equity index targets are becoming a bit aggressive and the
58
CIBC A Look to the Future – 2013 Edition
InVEstInG
anticipated backup in bond yields is likely greater than what will actually be experienced. Furthermore, the Fed continues to signal a desire to keep rates very low for a very long time. more likely, the tsX and s&P 500 will generate an 8–11% return from these levels at various times and bond yields will remain at or below 2% rather than backing up to 2.3% as expected earlier. the global economy is weakening and this will lead to slightly lower or sustainably low bond yields and it best be that way, as a backup in bond yields in this weak environment would be unthinkable. similarly, the weakness in corporate profitability will likely restrain tsX and s&P 500 returns.
NEW TECHNOLOGIES, PRODUCTIVITY GROWTH MUST
BE THE NEW MANHATTAN PROJECT
we are concerned about the fiscal cliff as the us is already in a fragile recovery; furthermore, the political divide seems to be holding the us economy hostage. we believe that there is no choice in finding a compromise that satisfies investors. It is likely though that any political inability to deal with the fiscal cliff will also be met with unprecedented attempts by the Fed to calm markets. Good leadership on the fiscal cliff issue should underpin another equity market rally into or during 2013. It is now critical for real leadership in politics and for a new manhattan project focused on new energy-related technological innovation. It may be the only way the world can experience the urgent need for stronger GdP growth without the risk of higher inflation and higher bond yields. we, therefore, maintain a worried but slightly optimistic view of equity market returns to the end of 2013 or, at least, midway through 2013 depending on how long it takes for the European currency union to reach its likely crisis.
TSX AND S&P 500 P/E COMPARISONS
the recent bottom-up aggregate earnings for the tsX were 793.85. Based on a more conservative version of the CIBC analyst earnings growth over the next 12 months (10% assumed EPs growth), the one-year forward earnings should be approximately 873.24. this would imply that the forward tsX target of 13,500 now implies nearly a 15.46 multiple of earnings, which is slightly aggressive, especially since we know that the tsX energy and materials sector roE is falling rapidly and these two sectors alone account for 44.8% of the tsX market capitalization.
we know that in a similar environment in the 1800’s, a normalized P/E was about 14 times earnings. we also know that the “street” believes tsX earnings will grow 17.9% over the next year resulting in a P/E of 14.4x one year out. At the present time, this street earnings growth rate seems highly improbable unless commodity prices rise sharply. A sharp rise in commodity prices, however, would likely destabilize global growth; therefore, we believe earnings growth for the next twelve months is overstated and the 13,500 target for the tsX has become aggressive. the tsX may reach these levels as a result of growing optimism if the s&P 500 can reach the 1,550 which itself is based on a more realistic P/E in the range of 14.5x.
the recent s&P 500 P/E is about 13.5x trailing earnings. Expected “street” earnings growth, presently, is about 11% weighted and 8.9% median. After eliminating outliers and taking into account recent negative revenue surprises and questionable, but slight, recent positive earnings surprises, as well as recent negative earnings revisions, we would expect 6% earnings growth for the s&P 500 at best. this is less than the street aggregate growth of 8%, and even the 6% rate may be too aggressive given that 46% of the s&P 500 derives a large portion of its revenues from international markets and in this segment, roE is falling rapidly. we may be at the beginning of an earnings recession, and we almost certainly are if the fiscal cliff issues are not dealt with appropriately and immediately. A 6% earnings growth assumption for the time being would imply a 14.62 multiple at 1,550 for the s&P 500 one year out. this is close to the expected normalized P/E level; for the time being, however, we prefer to buy when the multiple is closer to 12x and we believe that over the next decade, the trailing P/E for the s&P 500 will generally contract and eventually reach 7-9x earnings (table 1).
OUR ASSET MIX MODEL: INTEREST RATE FLOOR/
CEILING ANALYSIS
recently, the 10-year us treasury bond yields have been on the order of 1.59% and established its all-time low several months ago at approximately 1.44%. our asset mix models imply that the tsX and s&P 500 are undervalued if we only look at interest rate levels. we also know that since 1998, us bond yields and stock prices have tended to rise and fall together and so higher targets for the tsX and s&P 500 would imply some backup in bond yields i.e. tsX rise from
59
CIBC A Look to the Future – 2013 Edition
InVEstInG
11,800 to 13,500 and yields rise from 1.7% to 2.5% in Canada.
If the us rates are held down long enough to generate sufficient us economic growth, then eventually rates would be expected to rise as confidence returned. we do not see this happening at present and, in fact, we are more concerned about global economic weakness. If confidence did improve, however, and bond yields rose to the “natural” implied level then we would estimate that bond yield level to be about 2.7% to 3.1% based on whether the level of 10-year us treasuries is a function of the inflation rate implied by tIPs (2.1%) or the Cleveland Fed Index of Inflation (1.53%).
unfortunately, our extremely important estimate of the bond yield ceiling (the bond yield level that implies when stocks are significantly overvalued) has also fallen sharply over the last few months. the current ceiling is 3.12% and it has fallen from 3.65% as corporate profitability weakened, equity markets rallied at first and normal risk premia adjusted. this means that the 3.12% ceiling is not much different now than the “natural” floor of 2.7% to 3.1%. thankfully, the us economy enjoys an “artificially” low environment for us bond yields due to its safe-haven status and, in time, it will become clear that expected inflation will be meaningfully lower than most investors currently believe. the real question is: Can the us economy generate sufficient productivity growth to keep GdP growth at 1.5% to 2% as inflation falls to lower levels to the satisfaction of the bond markets?
SEVERAL CRUCIAL STRATEGIES TO OVERALL RETURNS
Economic growth will be challenged in the years ahead and this one fact is serious in the context of unprecedented government and consumer debt levels. As a result, answers
to several strategic questions will be crucial to overall returns:
1) where are we relative to the crucial interest rate floors and ceilings, and is roE growth acceptable overall or, at least, good in relevant sectors?
2) Have we eliminated all possible torpedo stocks from the portfolio, which is all the more important in a chronically low overall equity return environment?
3) does the core equity portfolio start with a build around good, reasonably high-yielding stocks with a strong likelihood of maintaining or growing their yield?
4) do we have the right sector emphasis based on roE growth rates?
5) do price momentum trends favour the index overall and/or specific sectors?
ASSET CLASS RETURNS AND RECOMMENDED
ASSET MIX
the IsC maintains an optimistic outlook for the tsX and the s&P 500 to the end of 2013 based on the urgent need for a solution to the fiscal-cliff dilemma, at least one more concerted effort to rescue the European currency union, and the likely imminent improvement in money supply growth rates in Asia, specifically China. Investors should not be complacent, however; there is ample evidence to support the view that the global economy is slipping back into recession, which could trigger some unintended consequences.
one of our recent strategy articles pointed to a likely short-term market correction with the higher index targets being maintained. us “domestic” roE growth, however, is on the edge of a knife and must remain stable or, better
table 1
TSX and S&P 500 P/E Comparisons
Recent Index Price Divided by Trailing Bottom up Aggregate Earnings
Bottom up P/E’s from GPS
ISC Forward Price Target Divided by Forward Street
Earnings
ISC Forward Price Target Divided by Bottom up
Aggregate CIBC Analyst Earnings
Weighted Median
TSX 11,811.38 / 793.85 = 14.88x 16.75 13.44 13,500 / 935.95 = 14.42x 13,500 / 873.24 = 15.46xS&P 500 1,353.33 / 100.27 = 13.5x 15.29 14.70 1,550 / 108.12 = 14.34x 1,550 / 106 = 14.62x
source: CIBC.

60
CIBC A Look to the Future – 2013 Edition
InVEstInG
As a result, we remain overweight equities; we illustrate our asset mix for the Income and Growth and Growth profiles in table 2. these recommended asset mix weights are predicted on a longer-term view of asset-class returns, rather than short-term corrections.
yet, improve. At present, the recent market correction has pushed the two-year implied return for the tsX and the s&P 500 to 17.77% and 16.26%, respectively. the IsC scenario indicates that 10-year us bond yields are currently expected to rise as well, with a backup in yields to 2.3% by the end of 2013.
If recent corporate profit weakness continues, however, then it will be necessary to reduce the two-year equity returns, and correspondingly reduce the bond losses since yield would likely stay below 2% for much longer than the committee currently believes.
we clearly acknowledge this risk, but it seems highly improbable that central banks will simply give up at this stage on rescuing the global economy from recession, a global debt crisis, a backup of the European currency union and an unwind of speculative real estate excesses in China.
table 2
Our Asset Mix
Asset Mix Profile Current Asset Mix Allowable Range
Income & Growth 55% Equities 30 – 60% Equities
35% Bonds 30 – 60% Bonds
10% tbills 0 – 40% tbills
Growth 65% Equities 20 – 70% Equities
30% Bonds 20 – 70% Bonds
5% tbills 0 – 50% tbills
source: CIBC.
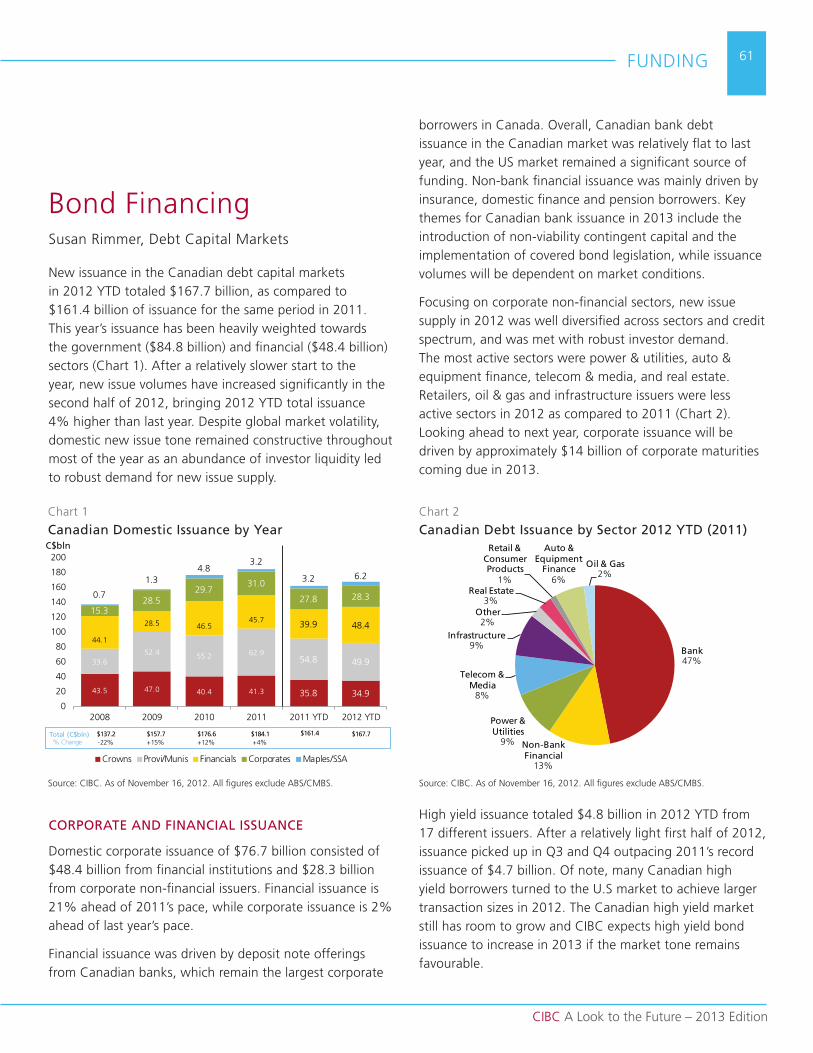
CIBC A Look to the Future – 2013 Edition
FundInG 61
Bond Financingsusan rimmer, debt Capital markets
new issuance in the Canadian debt capital markets in 2012 Ytd totaled $167.7 billion, as compared to $161.4 billion of issuance for the same period in 2011. this year’s issuance has been heavily weighted towards the government ($84.8 billion) and financial ($48.4 billion) sectors (Chart 1). After a relatively slower start to the year, new issue volumes have increased significantly in the second half of 2012, bringing 2012 Ytd total issuance 4% higher than last year. despite global market volatility, domestic new issue tone remained constructive throughout most of the year as an abundance of investor liquidity led to robust demand for new issue supply.
CORPORATE AND FINANCIAL ISSUANCE
domestic corporate issuance of $76.7 billion consisted of $48.4 billion from financial institutions and $28.3 billion from corporate non-financial issuers. Financial issuance is 21% ahead of 2011’s pace, while corporate issuance is 2% ahead of last year’s pace.
Financial issuance was driven by deposit note offerings from Canadian banks, which remain the largest corporate
43.5 47.0 40.4 41.3
33.652.4 55.2 62.9
44.1
28.5 46.545.7
15.328.5
29.731.0
0.7
1.34.8
3.2
35.8 34.9
54.8 49.9
39.9 48.4
27.8 28.3
3.2 6.2
0
20
40
60
80
100
120
140
160
180
200
2008 2009 2010 2011 2011 Ytd 2012 Ytd
Crowns Provi/munis Financials Corporates maples/ssA
Total (C$bln)% Change
$137.2-22%
C$bln
$157.7+15%
$176.6+12%
$184.1+4%
$161.4 $167.7
borrowers in Canada. overall, Canadian bank debt issuance in the Canadian market was relatively flat to last year, and the us market remained a significant source of funding. non-bank financial issuance was mainly driven by insurance, domestic finance and pension borrowers. key themes for Canadian bank issuance in 2013 include the introduction of non-viability contingent capital and the implementation of covered bond legislation, while issuance volumes will be dependent on market conditions.
Focusing on corporate non-financial sectors, new issue supply in 2012 was well diversified across sectors and credit spectrum, and was met with robust investor demand. the most active sectors were power & utilities, auto & equipment finance, telecom & media, and real estate. retailers, oil & gas and infrastructure issuers were less active sectors in 2012 as compared to 2011 (Chart 2). Looking ahead to next year, corporate issuance will be driven by approximately $14 billion of corporate maturities coming due in 2013.
High yield issuance totaled $4.8 billion in 2012 Ytd from 17 different issuers. After a relatively light first half of 2012, issuance picked up in Q3 and Q4 outpacing 2011’s record issuance of $4.7 billion. of note, many Canadian high yield borrowers turned to the u.s market to achieve larger transaction sizes in 2012. the Canadian high yield market still has room to grow and CIBC expects high yield bond issuance to increase in 2013 if the market tone remains favourable.
Chart 1
Canadian Domestic Issuance by Year
source: CIBC. As of november 16, 2012. All figures exclude ABs/CmBs.
Chart 2
Canadian Debt Issuance by Sector 2012 YTD (2011)
source: CIBC. As of november 16, 2012. All figures exclude ABs/CmBs.
Bank47%
Non-Bank Financial
13%
Power & Utilities
9%
Telecom & Media
8%
Infrastructure9%
Other2%
Real Estate3%
Retail & Consumer Products
1%
Auto & Equipment
Finance6%
Oil & Gas2%
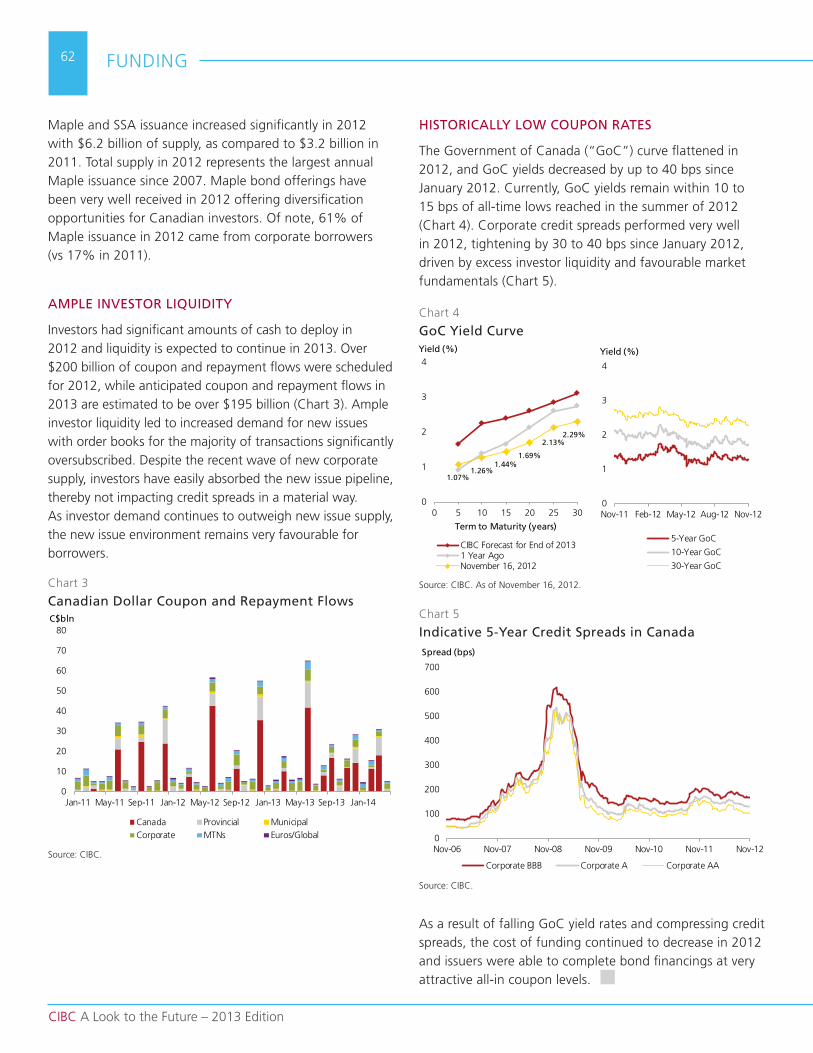
CIBC A Look to the Future – 2013 Edition
FundInG62
maple and ssA issuance increased significantly in 2012 with $6.2 billion of supply, as compared to $3.2 billion in 2011. total supply in 2012 represents the largest annual maple issuance since 2007. maple bond offerings have been very well received in 2012 offering diversification opportunities for Canadian investors. of note, 61% of maple issuance in 2012 came from corporate borrowers (vs 17% in 2011).
AMPLE INVESTOR LIQUIDITY
Investors had significant amounts of cash to deploy in 2012 and liquidity is expected to continue in 2013. over $200 billion of coupon and repayment flows were scheduled for 2012, while anticipated coupon and repayment flows in 2013 are estimated to be over $195 billion (Chart 3). Ample investor liquidity led to increased demand for new issues with order books for the majority of transactions significantly oversubscribed. despite the recent wave of new corporate supply, investors have easily absorbed the new issue pipeline, thereby not impacting credit spreads in a material way. As investor demand continues to outweigh new issue supply, the new issue environment remains very favourable for borrowers.
HISTORICALLY LOW COUPON RATES
the Government of Canada (“GoC”) curve flattened in 2012, and GoC yields decreased by up to 40 bps since January 2012. Currently, GoC yields remain within 10 to 15 bps of all-time lows reached in the summer of 2012 (Chart 4). Corporate credit spreads performed very well in 2012, tightening by 30 to 40 bps since January 2012, driven by excess investor liquidity and favourable market fundamentals (Chart 5).
As a result of falling GoC yield rates and compressing credit spreads, the cost of funding continued to decrease in 2012 and issuers were able to complete bond financings at very attractive all-in coupon levels.
Chart 3
Canadian Dollar Coupon and Repayment Flows
Chart 4
GoC Yield Curve
source: CIBC.
source: CIBC. As of november 16, 2012.
0
10
20
30
40
50
60
70
80
Jan-11 may-11 sep-11 Jan-12 may-12 sep-12 Jan-13 may-13 sep-13 Jan-14
Canada Provincial municipalCorporate mtns Euros/Global
C$bln
1.07%1.26%
1.44%1.69%
2.13%2.29%
0
1
2
3
4
0 5 10 15 20 25 30
Term to Maturity (years)
CIBC Forecast for End of 20131 Year Agonovember 16, 2012
Yield (%)
0
1
2
3
4
nov-11 Feb-12 may-12 Aug-12 nov-12
5-Year GoC
10-Year GoC
30-Year GoC
Yield (%)
0
100
200
300
400
500
600
700
nov-06 nov-07 nov-08 nov-09 nov-10 nov-11 nov-12
Corporate BBB Corporate A Corporate AA
Spread (bps)
Chart 5
Indicative 5-Year Credit Spreads in Canada
source: CIBC.
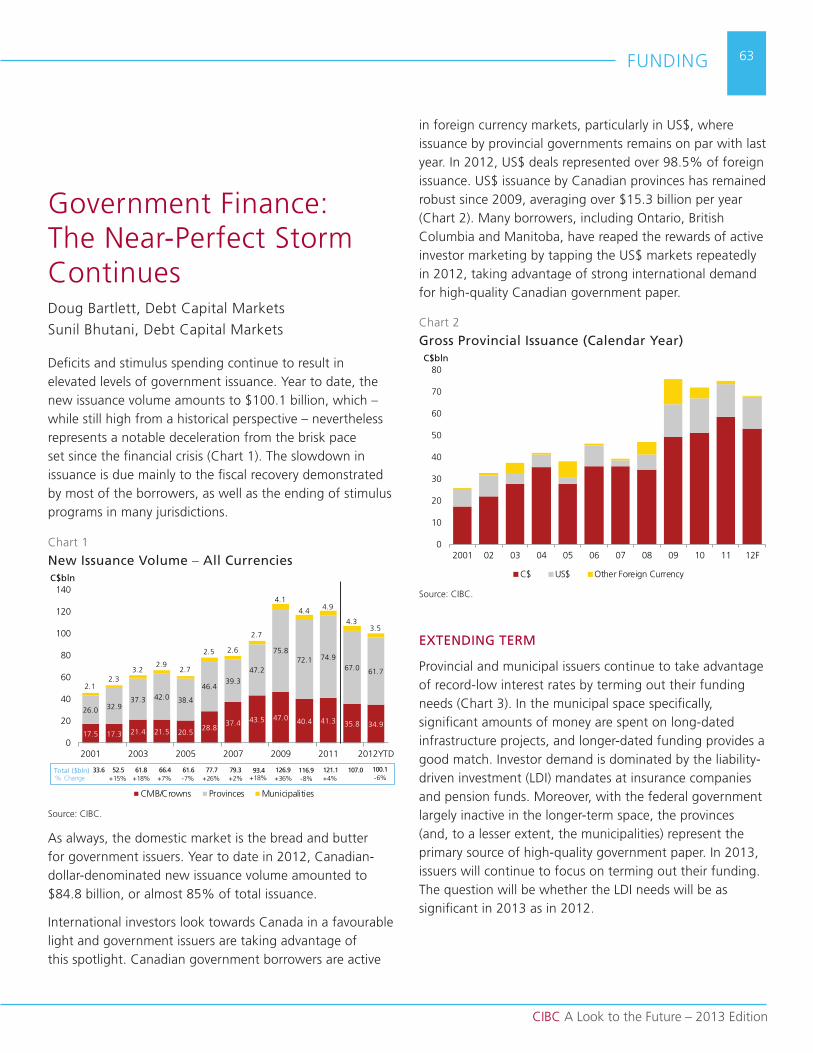
CIBC A Look to the Future – 2013 Edition
FundInG 63
Government Finance: the near-Perfect storm Continuesdoug Bartlett, debt Capital markets
sunil Bhutani, debt Capital markets
deficits and stimulus spending continue to result in elevated levels of government issuance. Year to date, the new issuance volume amounts to $100.1 billion, which – while still high from a historical perspective – nevertheless represents a notable deceleration from the brisk pace set since the financial crisis (Chart 1). the slowdown in issuance is due mainly to the fiscal recovery demonstrated by most of the borrowers, as well as the ending of stimulus programs in many jurisdictions.
As always, the domestic market is the bread and butter for government issuers. Year to date in 2012, Canadian-dollar-denominated new issuance volume amounted to $84.8 billion, or almost 85% of total issuance.
International investors look towards Canada in a favourable light and government issuers are taking advantage of this spotlight. Canadian government borrowers are active
17.5 17.3 21.4 21.5 20.528.8
37.4 43.5 47.0 40.4 41.3 35.8 34.9
26.0 32.937.3 42.0 38.4
46.439.3
47.2
75.872.1 74.9
67.0 61.7
2.12.3
3.22.9
2.7
2.5 2.6
2.7
4.1
4.4 4.9
4.33.5
0
20
40
60
80
100
120
140
2001 2003 2005 2007 2009 2011 2012Ytd
CmB/Crowns Provinces municipalities
Total ($bln)% Change
33.6 52.5+15%
61.8+18%
100.1-6%
107.0121.1+4%
116.9-8%
126.9+36%
93.4+18%
79.3+2%
77.7+26%
61.6-7%
66.4+7%
C$bln
in foreign currency markets, particularly in us$, where issuance by provincial governments remains on par with last year. In 2012, us$ deals represented over 98.5% of foreign issuance. us$ issuance by Canadian provinces has remained robust since 2009, averaging over $15.3 billion per year (Chart 2). many borrowers, including ontario, British Columbia and manitoba, have reaped the rewards of active investor marketing by tapping the us$ markets repeatedly in 2012, taking advantage of strong international demand for high-quality Canadian government paper.
EXTENDING TERM
Provincial and municipal issuers continue to take advantage of record-low interest rates by terming out their funding needs (Chart 3). In the municipal space specifically, significant amounts of money are spent on long-dated infrastructure projects, and longer-dated funding provides a good match. Investor demand is dominated by the liability-driven investment (LdI) mandates at insurance companies and pension funds. moreover, with the federal government largely inactive in the longer-term space, the provinces (and, to a lesser extent, the municipalities) represent the primary source of high-quality government paper. In 2013, issuers will continue to focus on terming out their funding. the question will be whether the LdI needs will be as significant in 2013 as in 2012.
Chart 1
New Issuance Volume – All Currencies
source: CIBC.
Chart 2
Gross Provincial Issuance (Calendar Year)
source: CIBC.
0
10
20
30
40
50
60
70
80
2001 02 03 04 05 06 07 08 09 10 11 12F
C$ us$ other Foreign Currency
C$bln
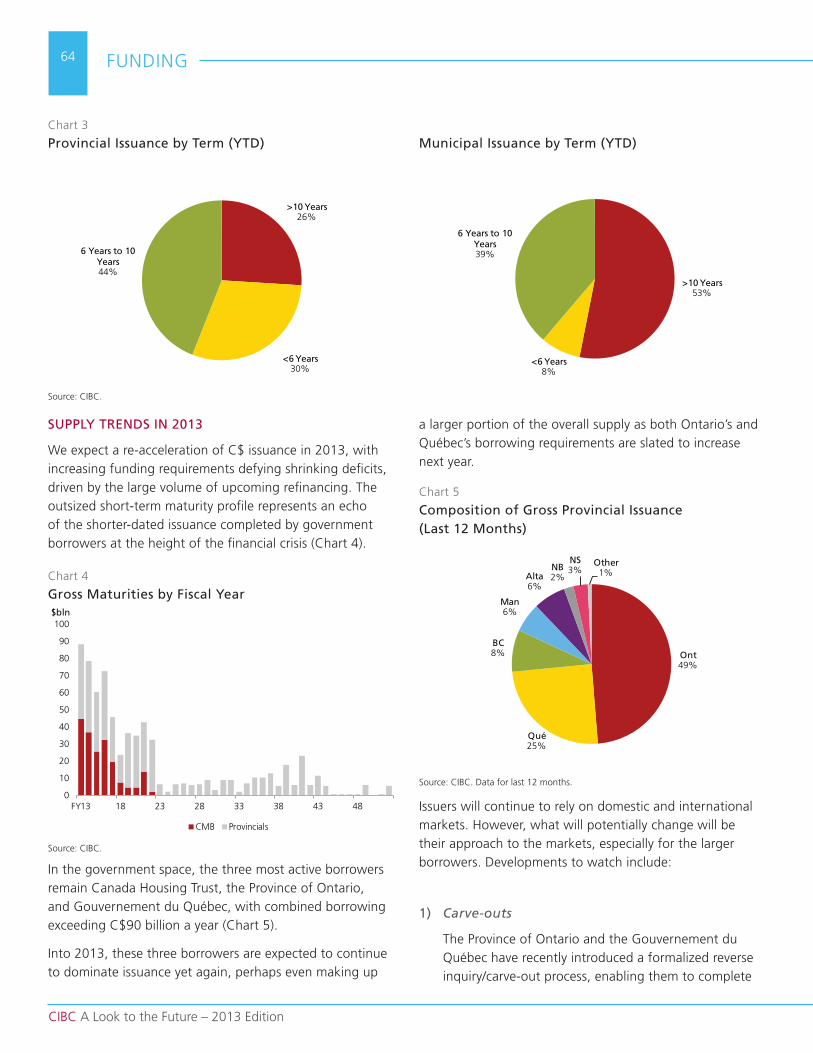
CIBC A Look to the Future – 2013 Edition
FundInG64
SUPPLY TRENDS IN 2013
we expect a re-acceleration of C$ issuance in 2013, with increasing funding requirements defying shrinking deficits, driven by the large volume of upcoming refinancing. the outsized short-term maturity profile represents an echo of the shorter-dated issuance completed by government borrowers at the height of the financial crisis (Chart 4).
In the government space, the three most active borrowers remain Canada Housing trust, the Province of ontario, and Gouvernement du Québec, with combined borrowing exceeding C$90 billion a year (Chart 5).
Into 2013, these three borrowers are expected to continue to dominate issuance yet again, perhaps even making up
a larger portion of the overall supply as both ontario’s and Québec’s borrowing requirements are slated to increase next year.
Issuers will continue to rely on domestic and international markets. However, what will potentially change will be their approach to the markets, especially for the larger borrowers. developments to watch include:
1) Carve-outs
the Province of ontario and the Gouvernement du Québec have recently introduced a formalized reverse inquiry/carve-out process, enabling them to complete
Municipal Issuance by Term (YTD)
source: CIBC.
>10 Years53%
<6 Years8%
6 Years to 10 Years39%
Chart 3
Provincial Issuance by Term (YTD)
>10 Years26%
<6 Years30%
6 Years to 10 Years44%
Chart 4
Gross Maturities by Fiscal Year
source: CIBC.
0
10
20
30
40
50
60
70
80
90
100
FY13 18 23 28 33 38 43 48
CmB Provincials
$bln
Chart 5
Composition of Gross Provincial Issuance (Last 12 Months)
source: CIBC. data for last 12 months.
Ont49%
Qué25%
BC8%
Man6%
Alta6%
NB2%
NS3%
Other1%

CIBC A Look to the Future – 2013 Edition
FundInG 65
their borrowing requirements in an increasingly efficient manner through the accommodation of large lead orders. In 2012, ontario raised $2.45 billion in carve-outs, or $4.7 billion in deals involving carve-outs. Québec raised $300 million with a one-off benchmark re-opening. From an issuer perspective, accomodating these large investor orders represents a delicate balancing act which has worked out so far. As such, we may see an uptick in reverse inquiry/carve-out activity in 2013 as borrowing programs increase.
2) International Investor Interest
As more international investors, notably central banks, add Canada to the approved list, international investor participation is likely to expand even more in 2013. this could potentially increase the amount issued by government issuers in Canadian dollars as the strong bid to Canada diminishes international arbitrage opportunities.
3) Prefunding
Given the low interest rate environment and large borrowing programs, many provinces have been prefunding future years’ requirements. ontario has borrowed incremental funds and bought back its short-dated bonds to reduce shorter-term refinancing risk. Québec is building up a liquidity fund in addition to its usual practice of prefunding for part of the next year’s requirements.
4) upcoming Political uncertainty
2013 will see a number of election and leadership changes. In the coming months, a leadership change for the Province of ontario (January 25, 2013) and a
provincial election for the Province of British Columbia (may 13, 2013) will likely interrupt issuance. similarly, the Province of nova scotia must call a provincial election by 2014 but may choose to do so in 2013, and Québec may hold another election given the minority government.
5) Investor Marketing and Transparency
As investors seek diversification within the government credit profile, issuers are responding with a significant uptick in their investor marketing efforts. not only is this prevalent in the provincial issuance market, but it is even more pronounced in the municipal market as issuers compete for shelf space. Combine that with the increased transparency required by issuers (given amplified market volatility), and one may conclude that the days of cloak-and-dagger issuance taking the market by surprise are long gone. As volatility is expected to remain elevated in 2013, we expect well-telegraphed deals in the upcoming year.
6) Return of SSA Borrowers
Canadian and international investors are showing a renewed level of interest in Canadian dollar offerings by sovereigns, supranationals & Agencies (ssAs). Year to date, seven ssA issues have priced in Canadian dollars, aggregating to $1.575 billion. this compares with four issues ($560 million) in 2011 and six issues ($450 million) in 2010. Canadian investors are looking to enhance yield and international investors are looking to increase their Canadian dollar holdings with “recognizable” credits – and ssAs meet these criteria. the interest remains largely concentrated in shorter-dated benchmark terms (three & five years).
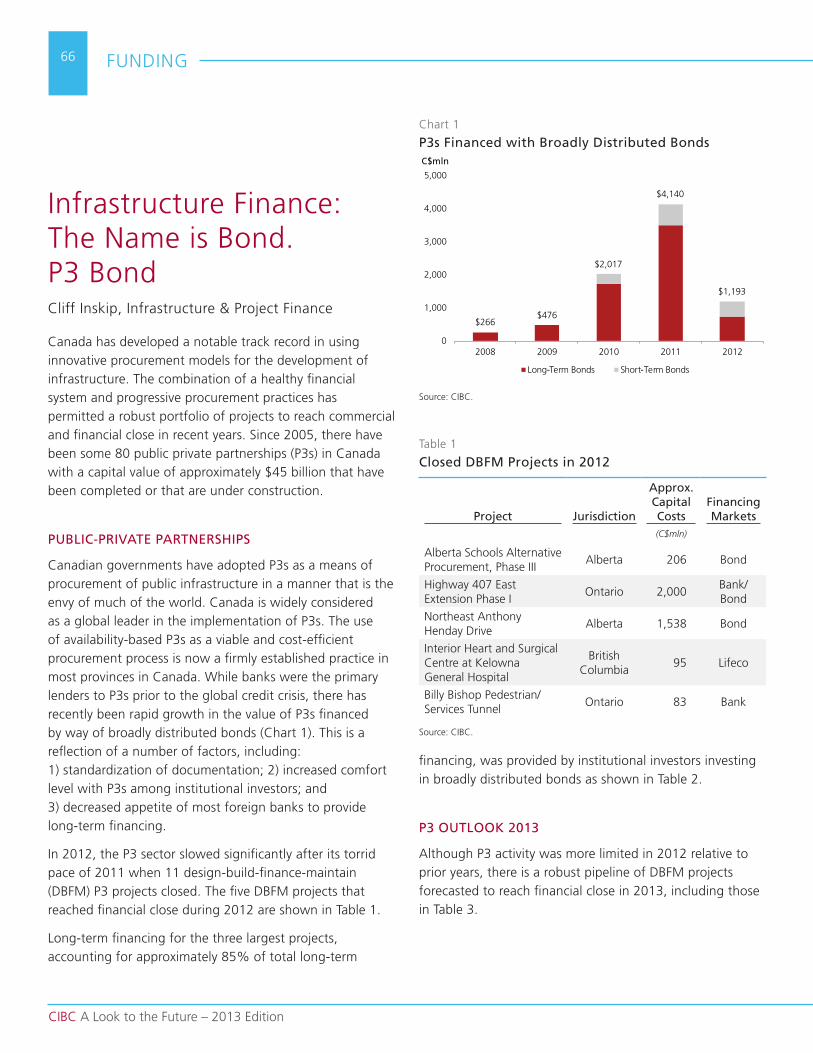
CIBC A Look to the Future – 2013 Edition
FundInG66
Infrastructure Finance: the name is Bond. P3 BondCliff Inskip, Infrastructure & Project Finance
Canada has developed a notable track record in using innovative procurement models for the development of infrastructure. the combination of a healthy financial system and progressive procurement practices has permitted a robust portfolio of projects to reach commercial and financial close in recent years. since 2005, there have been some 80 public private partnerships (P3s) in Canada with a capital value of approximately $45 billion that have been completed or that are under construction.
PUBLIC-PRIVATE PARTNERSHIPS
Canadian governments have adopted P3s as a means of procurement of public infrastructure in a manner that is the envy of much of the world. Canada is widely considered as a global leader in the implementation of P3s. the use of availability-based P3s as a viable and cost-efficient procurement process is now a firmly established practice in most provinces in Canada. while banks were the primary lenders to P3s prior to the global credit crisis, there has recently been rapid growth in the value of P3s financed by way of broadly distributed bonds (Chart 1). this is a reflection of a number of factors, including: 1) standardization of documentation; 2) increased comfort level with P3s among institutional investors; and 3) decreased appetite of most foreign banks to provide long-term financing.
In 2012, the P3 sector slowed significantly after its torrid pace of 2011 when 11 design-build-finance-maintain (dBFm) P3 projects closed. the five dBFm projects that reached financial close during 2012 are shown in table 1.
Long-term financing for the three largest projects, accounting for approximately 85% of total long-term
financing, was provided by institutional investors investing in broadly distributed bonds as shown in table 2.
P3 OUTLOOK 2013
Although P3 activity was more limited in 2012 relative to prior years, there is a robust pipeline of dBFm projects forecasted to reach financial close in 2013, including those in table 3.
$266$476
$2,017
$4,140
$1,193
0
1,000
2,000
3,000
4,000
5,000
2008 2009 2010 2011 2012
Long-term Bonds short-term Bonds
C$mln
Chart 1
P3s Financed with Broadly Distributed Bonds
source: CIBC.
table 1
Closed DBFM Projects in 2012
Project Jurisdiction
Approx. Capital Costs
Financing Markets
(C$mln)
Alberta schools Alternative Procurement, Phase III
Alberta 206 Bond
Highway 407 East Extension Phase I
ontario 2,000Bank/Bond
northeast Anthony Henday drive
Alberta 1,538 Bond
Interior Heart and surgical Centre at kelowna General Hospital
British Columbia
95 Lifeco
Billy Bishop Pedestrian/services tunnel
ontario 83 Bank
source: CIBC.
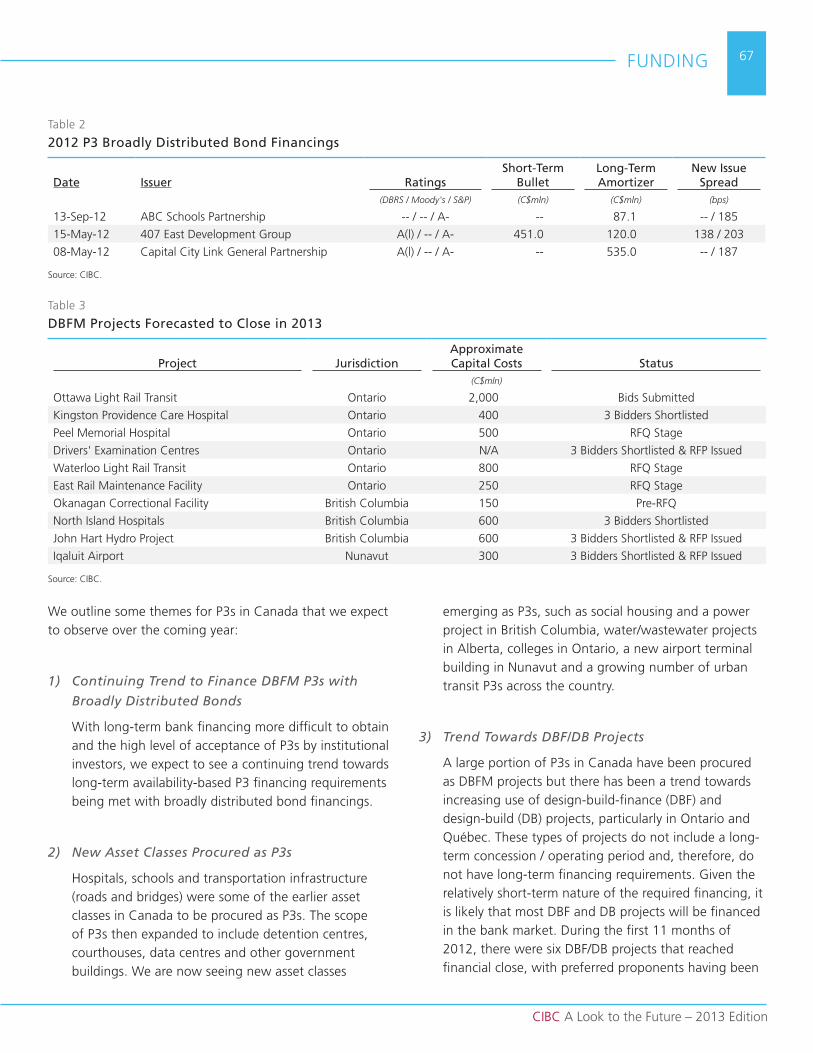
CIBC A Look to the Future – 2013 Edition
FundInG 67
we outline some themes for P3s in Canada that we expect to observe over the coming year:
1) Continuing Trend to Finance DBFM P3s with
Broadly Distributed Bonds
with long-term bank financing more difficult to obtain and the high level of acceptance of P3s by institutional investors, we expect to see a continuing trend towards long-term availability-based P3 financing requirements being met with broadly distributed bond financings.
2) New Asset Classes Procured as P3s
Hospitals, schools and transportation infrastructure (roads and bridges) were some of the earlier asset classes in Canada to be procured as P3s. the scope of P3s then expanded to include detention centres, courthouses, data centres and other government buildings. we are now seeing new asset classes
table 3
DBFM Projects Forecasted to Close in 2013
Project JurisdictionApproximate Capital Costs Status
(C$mln)
ottawa Light rail transit ontario 2,000 Bids submitted
kingston Providence Care Hospital ontario 400 3 Bidders shortlisted
Peel memorial Hospital ontario 500 rFQ stage
drivers' Examination Centres ontario n/A 3 Bidders shortlisted & rFP Issued
waterloo Light rail transit ontario 800 rFQ stage
East rail maintenance Facility ontario 250 rFQ stage
okanagan Correctional Facility British Columbia 150 Pre-rFQ
north Island Hospitals British Columbia 600 3 Bidders shortlisted
John Hart Hydro Project British Columbia 600 3 Bidders shortlisted & rFP Issued
Iqaluit Airport nunavut 300 3 Bidders shortlisted & rFP Issued
source: CIBC.
emerging as P3s, such as social housing and a power project in British Columbia, water/wastewater projects in Alberta, colleges in ontario, a new airport terminal building in nunavut and a growing number of urban transit P3s across the country.
3) Trend Towards DBF/DB Projects
A large portion of P3s in Canada have been procured as dBFm projects but there has been a trend towards increasing use of design-build-finance (dBF) and design-build (dB) projects, particularly in ontario and Québec. these types of projects do not include a long-term concession / operating period and, therefore, do not have long-term financing requirements. Given the relatively short-term nature of the required financing, it is likely that most dBF and dB projects will be financed in the bank market. during the first 11 months of 2012, there were six dBF/dB projects that reached financial close, with preferred proponents having been
table 2
2012 P3 Broadly Distributed Bond Financings
Date Issuer RatingsShort-Term
Bullet Long-Term Amortizer
New Issue Spread
(DBRS / Moody's / S&P) (C$mln) (C$mln) (bps)
13-sep-12 ABC schools Partnership -- / -- / A- -- 87.1 -- / 185
15-may-12 407 East development Group A(l) / -- / A- 451.0 120.0 138 / 203
08-may-12 Capital City Link General Partnership A(l) / -- / A- -- 535.0 -- / 187
source: CIBC.

CIBC A Look to the Future – 2013 Edition
FundInG68
identified for five others. dBF/dB projects expected to close in 2013 include Evergreen Line rapid transit, sudbury Biosolids, City of winnipeg Police station, ottawa sheffords Park Arena, sro renewal initiative and Humber College Infrastructure Project.
4) Additional Projects at the Federal
Government Level
PPP Canada launched its operations in 2009 as a federal P3 office 1) to facilitate a broader use of P3s in Canada through, inter alia, the $1.2 billion P3 Canada fund and 2) to identify and advance P3 opportunities at the federal level.
PPP Canada contributes funds to a variety of P3 projects across Canada being undertaken by other levels of government. the Chief Peguis trail Extension project, which involved a dBFm contract for a section of highway and a pedestrian bridge, was successfully procured as a P3 by the City of winnipeg. It was the first project with PPP Canada funding to reach substantial completion. the project opened in december 2011.
In addition, PPP Canada acts as a procurement agent for certain federal P3 projects. All federal infrastructure projects involving an asset with a life-span of at least 20 years and a capital cost of $100 million or more are subject to a P3 screen to determine whether a P3 may be a suitable procurement option. we expect, over time, to see an increasing number of federal projects procured as P3s, potentially including the transport, defense, security and real estate sectors. the largest potential candidates for federal P3s include the Champlain Bridge and the new International trade Crossing.
5) Additional Projects at the Municipal
Government Level
Historically, many municipalities have been hesitant to use the P3 model because their projects have typically been relatively small, the procurement process demands a high level of expertise that is only worth developing if there is a reasonable pipeline of projects and, in some cases, municipalities haven’t been convinced of the merits of using P3s for their particular projects. However, with PPP Canada potentially providing 25% of the required funding for approved projects, there has been a significant increase in interest by municipalities to pursue P3s, and we expect this to translate into growth in municipal P3s in 2013 and beyond. with more municipal P3s and the general maturing of the P3 market, we expect to see more small projects procured as P3s.
UNTIL NEXT TIME MR. BOND
Canada is a market that generally requires committed financing as part of P3 bid submissions. most developers and equity participants have a preference for long-term financing that matches the tenor of the bid concession as opposed to shorter-term financing, which introduces refinancing risk. developers have historically had a high level of familiarity with bank financing but have readily adapted to working with investment dealers and institutional investors. For larger availability-based dBFm projects in particular, we expect the vast majority of long-term financing will be done in the bond market as institutional investors have become comfortable with the availability-based P3 model and investment dealers have been very willing to underwrite these transactions at the bid stage.

CIBC A Look to the Future – 2013 Edition
FundInG 69
Equity markets outlookdan nowlan, Equity Capital markets
scott smith, Equity Capital markets
total equity issuance in 2012 has been in line with the prior two years, in the $40–$45 billion range. the key issuing sectors remain “yield” and natural resources, though 2012 also saw a notable increase in issuance from more defensive sectors, such as pipelines and utilities (P&u) and real estate.
Yield-oriented issuance has accounted for almost 80% of
all issuance thus far in 2012, continuing an upward trend from 71% in 2011 and 58% in 2010 (Chart 1).
Although resource- and P&u-based issuance still represented over 50% of volumes in 2012, the composition of that issuance changed substantially from 2011, as mining volumes dropped from 18% to 11%, oil and gas dropped from 25% to 20%, and P&u rose from 8% to 17%, with much of this increase coming from preferred share issuance by P&u companies (Chart 2).
VOLATILITY AND IPOs
In 2012, the Canadian equity market was driven by an interplay between volatility and the flow of Initial Public offerings (IPos), often seen as the leading edge of the so-called “risk-on” trade. Both continue to impact the longer-term growth prospects of this market.
1) Volatility
since 2008 there have been three notable spikes in volatility in each of 2009, 2010 and 2011 (Chart 3). the record-setting volatility observed in late 2008 was driven by the us mortgage crisis, which evolved into global financial upheaval. the volatility spike in 2010 was focused on Greece specifically, grew to encompass the entire eurozone by 2011, and was compounded
Mining11% Paper & Forest
Products0%
Real Estate16%
Industrial Products
2%
Pipelines & Utilities
17%Oil & Gas20%
Financial Services
14%
TMT2%
Consumer Products
2%
Other5%
RSPs11%
12 Months Ending October 31, 2012
Mining18%
Paper & Forest Products
0%
Real Estate10%
Industrial Products
4%
Pipelines & Utilities
8%Oil & Gas
25%
Financial Services
8%
TMT3%
Consumer Products
2%
Other6%
RSPs16%
12 Months Ending October 31, 2011
Chart 2
Canadian Historical Equity Issuance
source: CIBC.$28.8 $28.4 $39.6
$27.7 $31.1 $32.7
$25.4
$11.1
$20.9
$20.1 $12.5 $8.8
$54.2
$39.5
$60.5
$47.8 $43.6 $41.5
53.2%
71.9%65.5%
58.0%
71.2%78.8%
2007 2008 2009 2010 2011 2012Ytd
Yield Issuance other Issuance
Chart 1
Issuance Levels
source: CIBC.
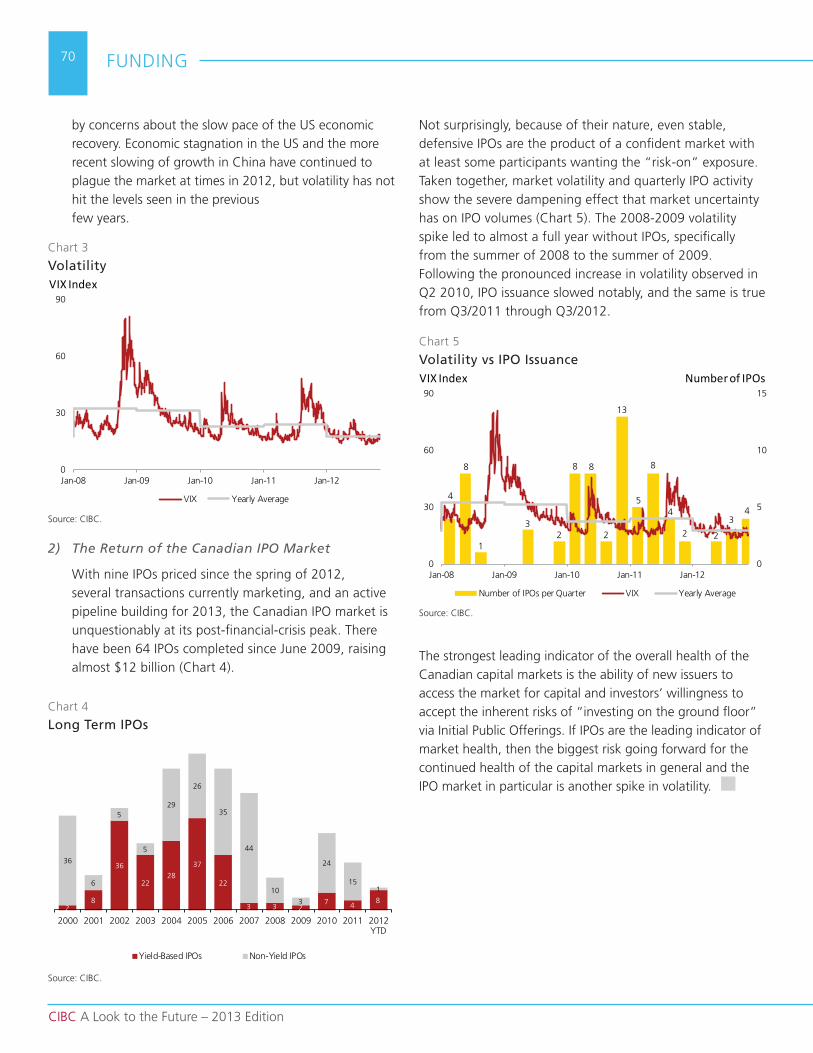
CIBC A Look to the Future – 2013 Edition
FundInG70
by concerns about the slow pace of the us economic recovery. Economic stagnation in the us and the more recent slowing of growth in China have continued to plague the market at times in 2012, but volatility has not hit the levels seen in the previous few years.
2) The Return of the Canadian IPO Market
with nine IPos priced since the spring of 2012, several transactions currently marketing, and an active pipeline building for 2013, the Canadian IPo market is unquestionably at its post-financial-crisis peak. there have been 64 IPos completed since June 2009, raising almost $12 billion (Chart 4).
not surprisingly, because of their nature, even stable, defensive IPos are the product of a confident market with at least some participants wanting the “risk-on” exposure. taken together, market volatility and quarterly IPo activity show the severe dampening effect that market uncertainty has on IPo volumes (Chart 5). the 2008-2009 volatility spike led to almost a full year without IPos, specifically from the summer of 2008 to the summer of 2009. Following the pronounced increase in volatility observed in Q2 2010, IPo issuance slowed notably, and the same is true from Q3/2011 through Q3/2012.
the strongest leading indicator of the overall health of the Canadian capital markets is the ability of new issuers to access the market for capital and investors’ willingness to accept the inherent risks of “investing on the ground floor” via Initial Public offerings. If IPos are the leading indicator of market health, then the biggest risk going forward for the continued health of the capital markets in general and the IPo market in particular is another spike in volatility.
0
30
60
90
Jan-08 Jan-09 Jan-10 Jan-11 Jan-12
VIX Yearly Average
VIX Index
Chart 3
Volatility
source: CIBC.
4
8
1
32
8 8
2
13
5
8
4
2 2
34
0
5
10
15
0
30
60
90
Jan-08 Jan-09 Jan-10 Jan-11 Jan-12
number of IPos per Quarter VIX Yearly Average
VIX Index Number of IPOs
Chart 5
Volatility vs IPO Issuance
source: CIBC.
28
36
2228
37
22
3 3 27 4
8
36
6
5
5
29
26
35
44
10
3
24
151
2000 2001 2002 2003 2004 2005 2006 2007 2008 2009 2010 2011 2012Ytd
Yield-Based IPos non-Yield IPos
Chart 4
Long Term IPOs
source: CIBC.
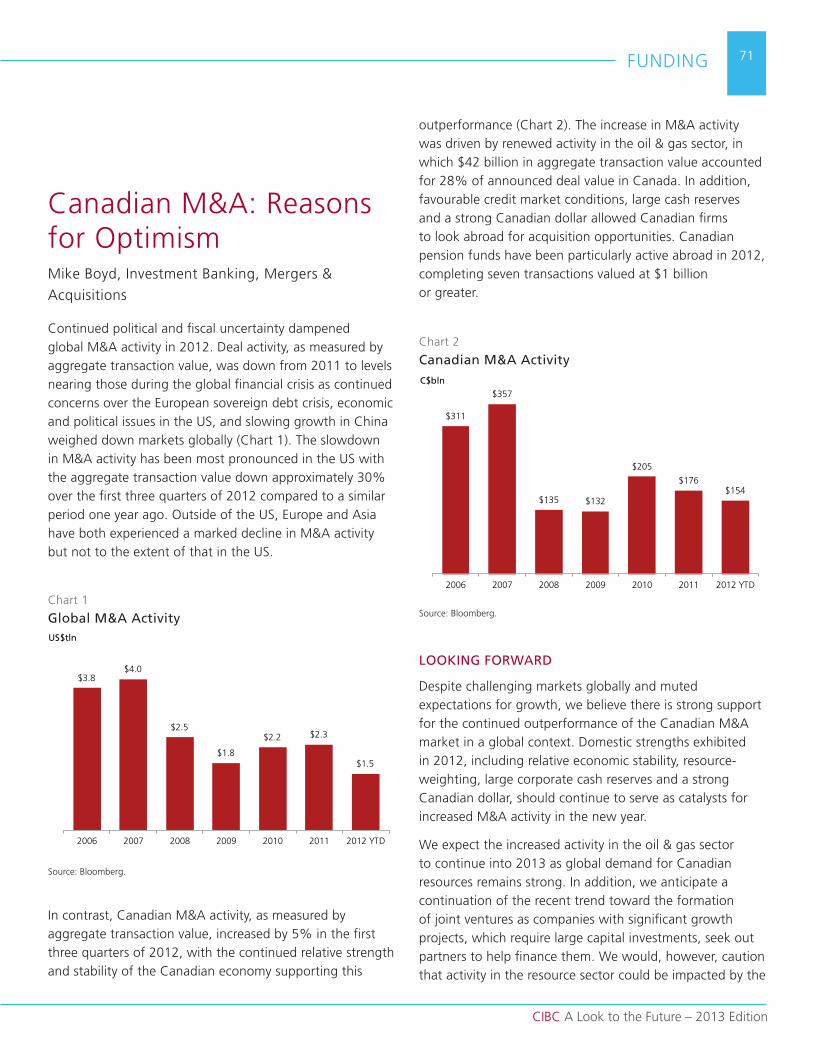
CIBC A Look to the Future – 2013 Edition
FundInG 71
Canadian m&A: reasons for optimismmike Boyd, Investment Banking, mergers &
Acquisitions
Continued political and fiscal uncertainty dampened global m&A activity in 2012. deal activity, as measured by aggregate transaction value, was down from 2011 to levels nearing those during the global financial crisis as continued concerns over the European sovereign debt crisis, economic and political issues in the us, and slowing growth in China weighed down markets globally (Chart 1). the slowdown in m&A activity has been most pronounced in the us with the aggregate transaction value down approximately 30% over the first three quarters of 2012 compared to a similar period one year ago. outside of the us, Europe and Asia have both experienced a marked decline in m&A activity but not to the extent of that in the us.
In contrast, Canadian m&A activity, as measured by aggregate transaction value, increased by 5% in the first three quarters of 2012, with the continued relative strength and stability of the Canadian economy supporting this
outperformance (Chart 2). the increase in m&A activity was driven by renewed activity in the oil & gas sector, in which $42 billion in aggregate transaction value accounted for 28% of announced deal value in Canada. In addition, favourable credit market conditions, large cash reserves and a strong Canadian dollar allowed Canadian firms to look abroad for acquisition opportunities. Canadian pension funds have been particularly active abroad in 2012, completing seven transactions valued at $1 billion or greater.
LOOKING FORWARD
despite challenging markets globally and muted expectations for growth, we believe there is strong support for the continued outperformance of the Canadian m&A market in a global context. domestic strengths exhibited in 2012, including relative economic stability, resource-weighting, large corporate cash reserves and a strong Canadian dollar, should continue to serve as catalysts for increased m&A activity in the new year.
we expect the increased activity in the oil & gas sector to continue into 2013 as global demand for Canadian resources remains strong. In addition, we anticipate a continuation of the recent trend toward the formation of joint ventures as companies with significant growth projects, which require large capital investments, seek out partners to help finance them. we would, however, caution that activity in the resource sector could be impacted by the
$3.8$4.0
$2.5
$1.8
$2.2 $2.3
$1.5
2006 2007 2008 2009 2010 2011 2012 Ytd
US$tln
Chart 1
Global M&A Activity
source: Bloomberg.
source: Bloomberg.
$311
$357
$135 $132
$205
$176$154
2006 2007 2008 2009 2010 2011 2012 Ytd
C$bln
Chart 2
Canadian M&A Activity
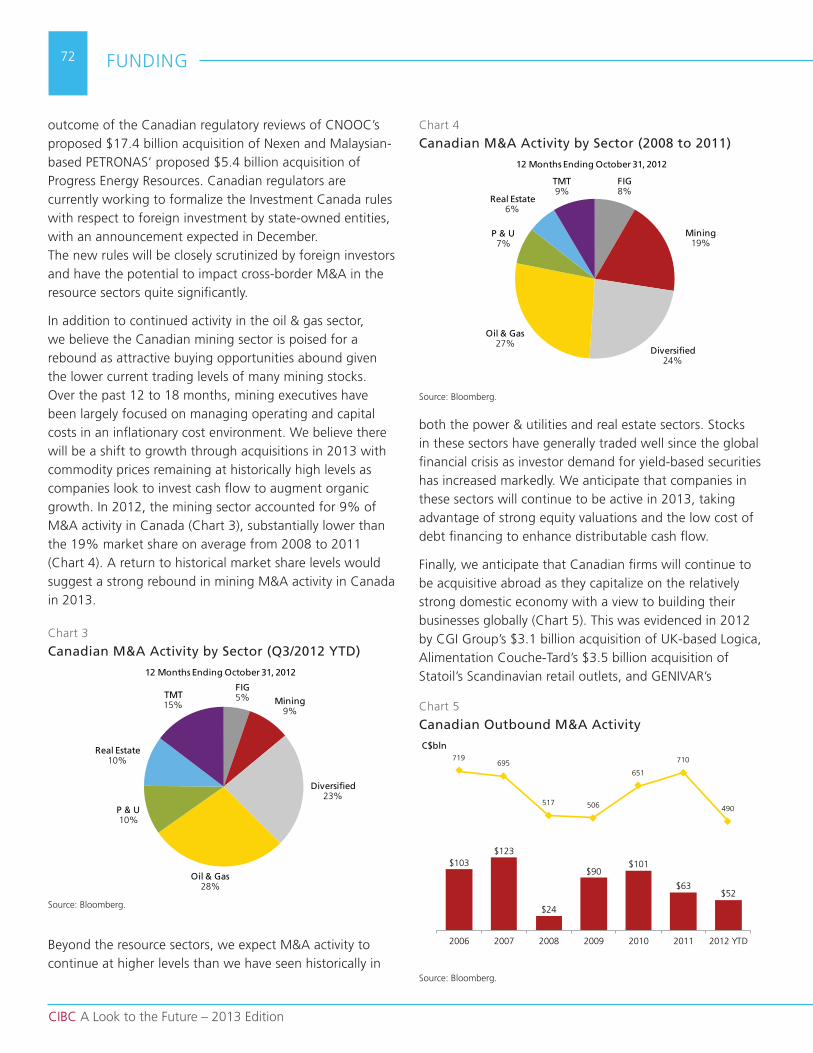
CIBC A Look to the Future – 2013 Edition
FundInG72
outcome of the Canadian regulatory reviews of CnooC’s proposed $17.4 billion acquisition of nexen and malaysian-based PEtronAs’ proposed $5.4 billion acquisition of Progress Energy resources. Canadian regulators are currently working to formalize the Investment Canada rules with respect to foreign investment by state-owned entities, with an announcement expected in december. the new rules will be closely scrutinized by foreign investors and have the potential to impact cross-border m&A in the resource sectors quite significantly.
In addition to continued activity in the oil & gas sector, we believe the Canadian mining sector is poised for a rebound as attractive buying opportunities abound given the lower current trading levels of many mining stocks. over the past 12 to 18 months, mining executives have been largely focused on managing operating and capital costs in an inflationary cost environment. we believe there will be a shift to growth through acquisitions in 2013 with commodity prices remaining at historically high levels as companies look to invest cash flow to augment organic growth. In 2012, the mining sector accounted for 9% of m&A activity in Canada (Chart 3), substantially lower than the 19% market share on average from 2008 to 2011 (Chart 4). A return to historical market share levels would suggest a strong rebound in mining m&A activity in Canada in 2013.
Beyond the resource sectors, we expect m&A activity to continue at higher levels than we have seen historically in
both the power & utilities and real estate sectors. stocks in these sectors have generally traded well since the global financial crisis as investor demand for yield-based securities has increased markedly. we anticipate that companies in these sectors will continue to be active in 2013, taking advantage of strong equity valuations and the low cost of debt financing to enhance distributable cash flow.
Finally, we anticipate that Canadian firms will continue to be acquisitive abroad as they capitalize on the relatively strong domestic economy with a view to building their businesses globally (Chart 5). this was evidenced in 2012 by CGI Group’s $3.1 billion acquisition of uk-based Logica, Alimentation Couche-tard’s $3.5 billion acquisition of statoil’s scandinavian retail outlets, and GEnIVAr’s
FIG8%
Mining19%
Diversified24%
Oil & Gas27%
P & U7%
Real Estate6%
TMT9%
12 Months Ending October 31, 2012
Chart 4
Canadian M&A Activity by Sector (2008 to 2011)
Chart 3
Canadian M&A Activity by Sector (Q3/2012 YTD)
FIG5% Mining
9%
Diversified23%
Oil & Gas28%
P & U10%
Real Estate10%
TMT15%
12 Months Ending October 31, 2012
source: Bloomberg.
source: Bloomberg.
source: Bloomberg.
$103$123
$24
$90$101
$63$52
719695
517 506
651
710
490
2006 2007 2008 2009 2010 2011 2012 Ytd
C$bln
Chart 5
Canadian Outbound M&A Activity
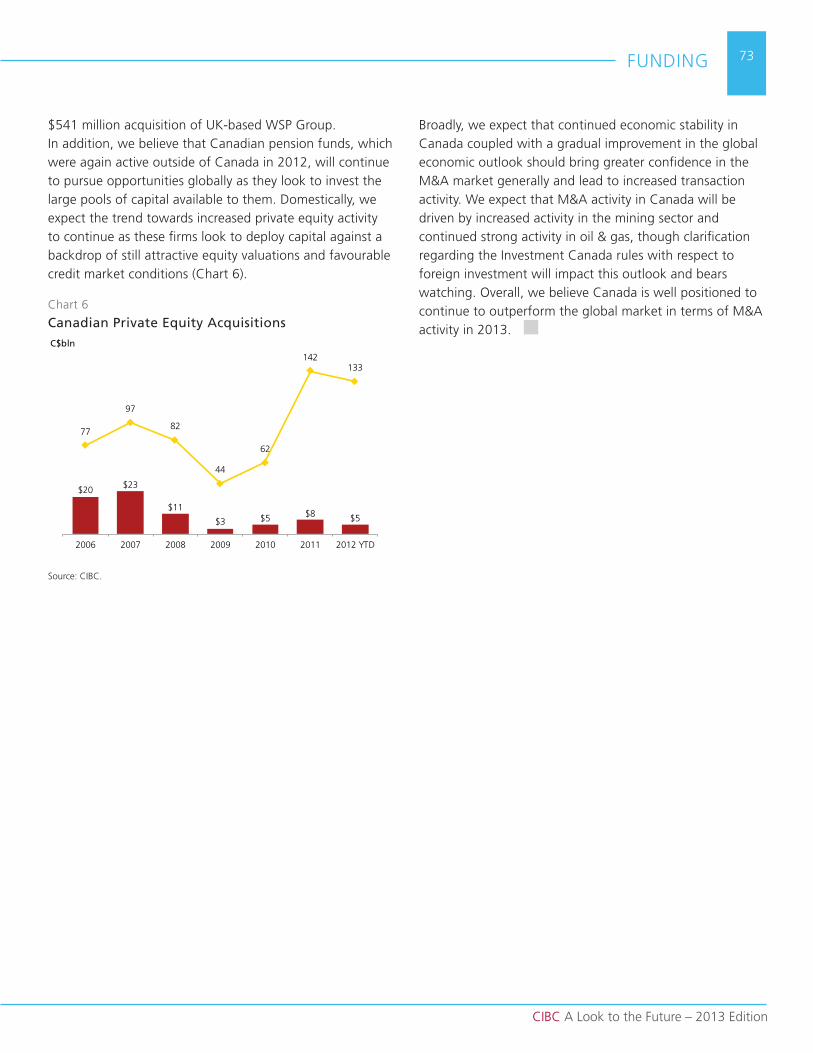
CIBC A Look to the Future – 2013 Edition
FundInG 73
Broadly, we expect that continued economic stability in Canada coupled with a gradual improvement in the global economic outlook should bring greater confidence in the m&A market generally and lead to increased transaction activity. we expect that m&A activity in Canada will be driven by increased activity in the mining sector and continued strong activity in oil & gas, though clarification regarding the Investment Canada rules with respect to foreign investment will impact this outlook and bears watching. overall, we believe Canada is well positioned to continue to outperform the global market in terms of m&A activity in 2013.
$541 million acquisition of uk-based wsP Group. In addition, we believe that Canadian pension funds, which were again active outside of Canada in 2012, will continue to pursue opportunities globally as they look to invest the large pools of capital available to them. domestically, we expect the trend towards increased private equity activity to continue as these firms look to deploy capital against a backdrop of still attractive equity valuations and favourable credit market conditions (Chart 6).
$20 $23
$11
$3 $5 $8 $5
77
97
82
44
62
142133
2006 2007 2008 2009 2010 2011 2012 Ytd
C$bln
Chart 6
Canadian Private Equity Acquisitions
source: CIBC.
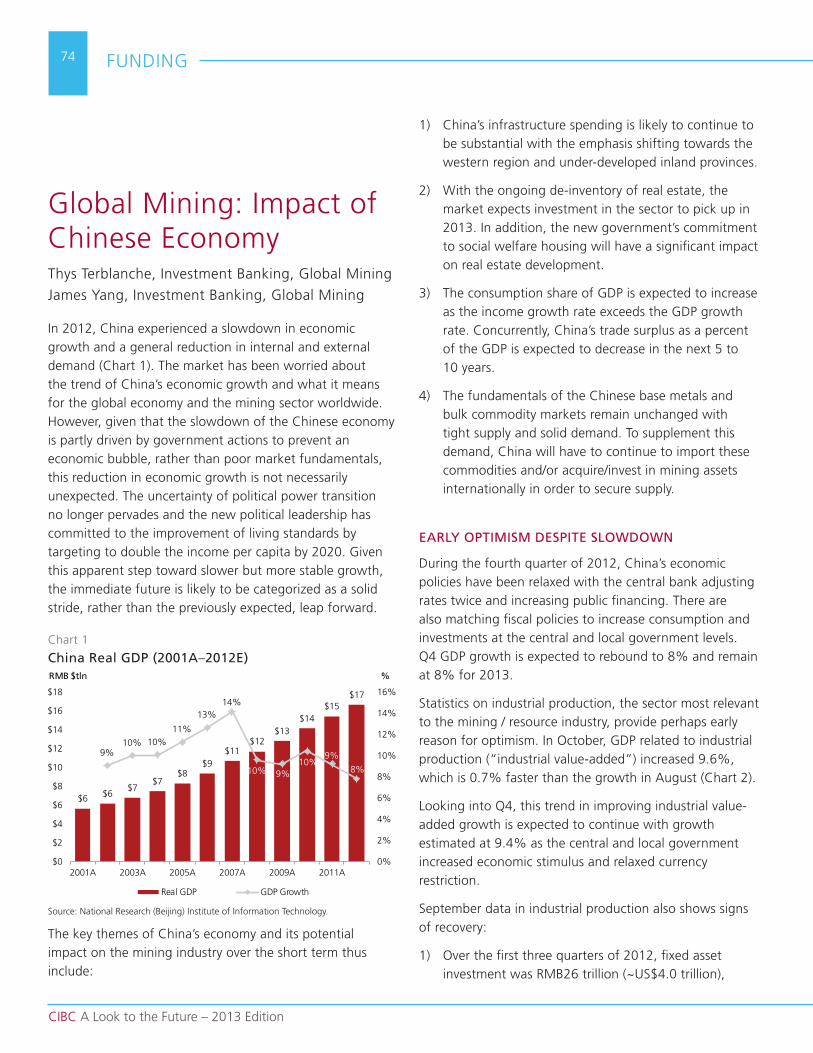
CIBC A Look to the Future – 2013 Edition
FundInG74
Global mining: Impact of Chinese Economythys terblanche, Investment Banking, Global mining
James Yang, Investment Banking, Global mining
In 2012, China experienced a slowdown in economic growth and a general reduction in internal and external demand (Chart 1). the market has been worried about the trend of China’s economic growth and what it means for the global economy and the mining sector worldwide. However, given that the slowdown of the Chinese economy is partly driven by government actions to prevent an economic bubble, rather than poor market fundamentals, this reduction in economic growth is not necessarily unexpected. the uncertainty of political power transition no longer pervades and the new political leadership has committed to the improvement of living standards by targeting to double the income per capita by 2020. Given this apparent step toward slower but more stable growth, the immediate future is likely to be categorized as a solid stride, rather than the previously expected, leap forward.
the key themes of China’s economy and its potential impact on the mining industry over the short term thus include:
1) China’s infrastructure spending is likely to continue to be substantial with the emphasis shifting towards the western region and under-developed inland provinces.
2) with the ongoing de-inventory of real estate, the market expects investment in the sector to pick up in 2013. In addition, the new government’s commitment to social welfare housing will have a significant impact on real estate development.
3) the consumption share of GdP is expected to increase as the income growth rate exceeds the GdP growth rate. Concurrently, China’s trade surplus as a percent of the GdP is expected to decrease in the next 5 to 10 years.
4) the fundamentals of the Chinese base metals and bulk commodity markets remain unchanged with tight supply and solid demand. to supplement this demand, China will have to continue to import these commodities and/or acquire/invest in mining assets internationally in order to secure supply.
EARLY OPTIMISM DESPITE SLOWDOWN
during the fourth quarter of 2012, China’s economic policies have been relaxed with the central bank adjusting rates twice and increasing public financing. there are also matching fiscal policies to increase consumption and investments at the central and local government levels. Q4 GdP growth is expected to rebound to 8% and remain at 8% for 2013.
statistics on industrial production, the sector most relevant to the mining / resource industry, provide perhaps early reason for optimism. In october, GdP related to industrial production (“industrial value-added”) increased 9.6%, which is 0.7% faster than the growth in August (Chart 2).
Looking into Q4, this trend in improving industrial value-added growth is expected to continue with growth estimated at 9.4% as the central and local government increased economic stimulus and relaxed currency restriction.
september data in industrial production also shows signs of recovery:
1) over the first three quarters of 2012, fixed asset investment was rmB26 trillion (~us$4.0 trillion),
$6 $6$7
$7$8
$9$11
$12$13
$14$15
$17
9%10% 10%
11%
13%14%
10% 9%10%
9%
8%
0%
2%
4%
6%
8%
10%
12%
14%
16%
$0
$2
$4
$6
$8
$10
$12
$14
$16
$18
2001A 2003A 2005A 2007A 2009A 2011A
%RMB $tln
real GdP GdP Growth
Chart 1
China Real GDP (2001A–2012E)
source: national research (Beijing) Institute of Information technology.
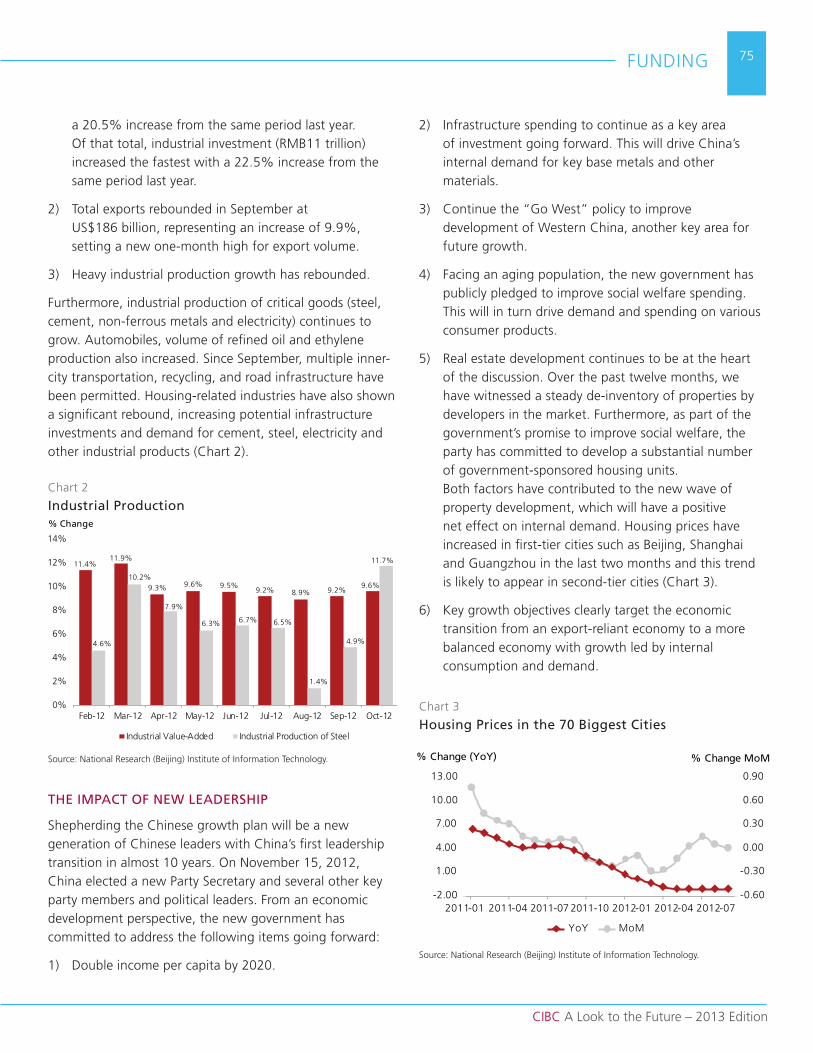
CIBC A Look to the Future – 2013 Edition
FundInG 75
2) Infrastructure spending to continue as a key area of investment going forward. this will drive China’s internal demand for key base metals and other materials.
3) Continue the “Go west” policy to improve development of western China, another key area for future growth.
4) Facing an aging population, the new government has publicly pledged to improve social welfare spending. this will in turn drive demand and spending on various consumer products.
5) real estate development continues to be at the heart of the discussion. over the past twelve months, we have witnessed a steady de-inventory of properties by developers in the market. Furthermore, as part of the government’s promise to improve social welfare, the party has committed to develop a substantial number of government-sponsored housing units. Both factors have contributed to the new wave of property development, which will have a positive net effect on internal demand. Housing prices have increased in first-tier cities such as Beijing, shanghai and Guangzhou in the last two months and this trend is likely to appear in second-tier cities (Chart 3).
6) key growth objectives clearly target the economic transition from an export-reliant economy to a more balanced economy with growth led by internal consumption and demand.
a 20.5% increase from the same period last year. of that total, industrial investment (rmB11 trillion) increased the fastest with a 22.5% increase from the same period last year.
2) total exports rebounded in september at us$186 billion, representing an increase of 9.9%, setting a new one-month high for export volume.
3) Heavy industrial production growth has rebounded.
Furthermore, industrial production of critical goods (steel, cement, non-ferrous metals and electricity) continues to grow. Automobiles, volume of refined oil and ethylene production also increased. since september, multiple inner-city transportation, recycling, and road infrastructure have been permitted. Housing-related industries have also shown a significant rebound, increasing potential infrastructure investments and demand for cement, steel, electricity and other industrial products (Chart 2).
THE IMPACT OF NEW LEADERSHIP
shepherding the Chinese growth plan will be a new generation of Chinese leaders with China’s first leadership transition in almost 10 years. on november 15, 2012, China elected a new Party secretary and several other key party members and political leaders. From an economic development perspective, the new government has committed to address the following items going forward:
1) double income per capita by 2020.
11.4%11.9%
9.3% 9.6% 9.5%9.2% 8.9% 9.2%
9.6%
4.6%
10.2%
7.9%
6.3% 6.7% 6.5%
1.4%
4.9%
11.7%
0%
2%
4%
6%
8%
10%
12%
14%
Feb-12 mar-12 Apr-12 may-12 Jun-12 Jul-12 Aug-12 sep-12 oct-12
% Change
Industrial Value-Added Industrial Production of steel
2011-01-2.00
1.00
YoY MoM
4.00
7.00
10.00
13.00
-0.60
-0.30
0.00
0.30
0.60
0.90
2011-04 2012-01 2012-04 2012-07
% Change (YoY) % Change MoM
- - - -- - -
2011-07 2011-10
Chart 2
Industrial Production
Chart 3
Housing Prices in the 70 Biggest Cities
source: national research (Beijing) Institute of Information technology.
source: national research (Beijing) Institute of Information technology.
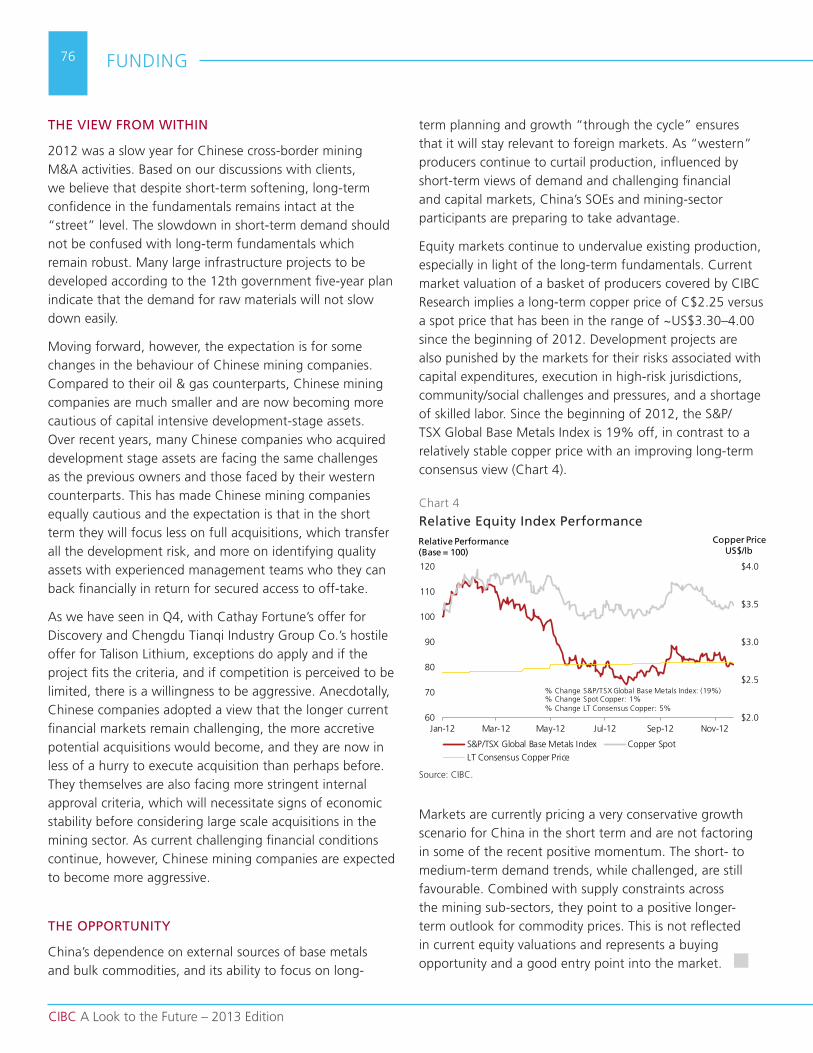
CIBC A Look to the Future – 2013 Edition
FundInG76
THE VIEW FROM WITHIN
2012 was a slow year for Chinese cross-border mining m&A activities. Based on our discussions with clients, we believe that despite short-term softening, long-term confidence in the fundamentals remains intact at the “street” level. the slowdown in short-term demand should not be confused with long-term fundamentals which remain robust. many large infrastructure projects to be developed according to the 12th government five-year plan indicate that the demand for raw materials will not slow down easily.
moving forward, however, the expectation is for some changes in the behaviour of Chinese mining companies. Compared to their oil & gas counterparts, Chinese mining companies are much smaller and are now becoming more cautious of capital intensive development-stage assets. over recent years, many Chinese companies who acquired development stage assets are facing the same challenges as the previous owners and those faced by their western counterparts. this has made Chinese mining companies equally cautious and the expectation is that in the short term they will focus less on full acquisitions, which transfer all the development risk, and more on identifying quality assets with experienced management teams who they can back financially in return for secured access to off-take.
As we have seen in Q4, with Cathay Fortune’s offer for discovery and Chengdu tianqi Industry Group Co.’s hostile offer for talison Lithium, exceptions do apply and if the project fits the criteria, and if competition is perceived to be limited, there is a willingness to be aggressive. Anecdotally, Chinese companies adopted a view that the longer current financial markets remain challenging, the more accretive potential acquisitions would become, and they are now in less of a hurry to execute acquisition than perhaps before. they themselves are also facing more stringent internal approval criteria, which will necessitate signs of economic stability before considering large scale acquisitions in the mining sector. As current challenging financial conditions continue, however, Chinese mining companies are expected to become more aggressive.
THE OPPORTUNITY
China’s dependence on external sources of base metals and bulk commodities, and its ability to focus on long-
term planning and growth “through the cycle” ensures that it will stay relevant to foreign markets. As “western” producers continue to curtail production, influenced by short-term views of demand and challenging financial and capital markets, China’s soEs and mining-sector participants are preparing to take advantage.
Equity markets continue to undervalue existing production, especially in light of the long-term fundamentals. Current market valuation of a basket of producers covered by CIBC research implies a long-term copper price of C$2.25 versus a spot price that has been in the range of ~us$3.30–4.00 since the beginning of 2012. development projects are also punished by the markets for their risks associated with capital expenditures, execution in high-risk jurisdictions, community/social challenges and pressures, and a shortage of skilled labor. since the beginning of 2012, the s&P/tsX Global Base metals Index is 19% off, in contrast to a relatively stable copper price with an improving long-term consensus view (Chart 4).
markets are currently pricing a very conservative growth scenario for China in the short term and are not factoring in some of the recent positive momentum. the short- to medium-term demand trends, while challenged, are still favourable. Combined with supply constraints across the mining sub-sectors, they point to a positive longer-term outlook for commodity prices. this is not reflected in current equity valuations and represents a buying opportunity and a good entry point into the market.
$2.0
$2.5
$3.0
$3.5
$4.0
60
70
80
90
100
110
120
Jan-12 mar-12 may-12 Jul-12 sep-12 nov-12
Copper Price US$/lb
s&P/tsX Global Base metals Index Copper spotLt Consensus Copper Price
% Change s&P/tsX Global Base metals Index: (19%)% Change spot Copper: 1%% Change Lt Consensus Copper: 5%
Relative Performance (Base = 100)
Chart 4
Relative Equity Index Performance
source: CIBC.

CIBC A Look to the Future – 2013 Edition
FundInG 77
Canadian Energy: Industry Evolutionmark Horsfall, Investment Banking, Global Energy
Canadian oil & gas producers, like their American cousins, have been reinventing their business models over the past few years through the advent of sophisticated and rapidly evolving technologies used to stimulate and exploit unconventional resources. these technologies include the widespread adoption of horizontal drilling and the use of multi-stage fracturing to stimulate reservoirs. technology has evolved to the point where there is little doubt that vast quantities of previously inaccessible hydrocarbons are now available to supplement the north American supply picture for decades to come.
the north American natural gas sector was the first to experience the consequences of these new technological approaches. the onslaught of new production volumes from plays such as the marcellus, Haynesville and montney has had the effect of driving prices to multi-year lows. As upstream capital is rationed and end-users (principally power producers) increasingly substitute natural gas for coal, sentiment has improved somewhat but the reality is that, regardless of storage levels (which are still elevated), there are huge stocks of natural gas in the ground, available to supply the market on reasonably short notice.
on the liquids side of the equation, north American tight oil plays such as the Eagleford, Bakken and duvernay combined with the reinvigoration of previously declining areas, such as the Permian basin, promise to deliver huge increases in light oil production that almost no one foresaw until relatively recently.
IMPLICATIONS OF TECHNOLOGY FOR CANADIAN
PRODUCERS
Canadian producers increasingly have to contend with a competitive assault on their traditional export market (the usA) from that very customer, in the form of growing
domestic supply. As production growth in the Lower 48 has accelerated, it has put downward pressure on benchmark prices for Canadian oil & gas production and increased location differentials.
At the same time, higher per well capital costs associated with longer laterals and more numerous fracs per well argue for larger balance sheets and greater financial liquidity. As a consequence of these trends, the stakes have never been higher for management teams to identify and exploit the “sweet spots” of their chosen plays and to achieve top-quartile operating performance within them.
the increased focus on developing a westward energy transportation corridor and coastal export infrastructure in British Columbia is a logical extension of the factors described above. the need to access global (Asian) end-markets in order to mitigate the impact of increased competition in our traditional export market is paramount.
EQUITY ISSUANCE
traditional equity investors in the public market are becoming ever more discerning in what they look for in a growth story. the preponderance of public equity investors (institutional and retail) require a dividend to entice them. owing to the factors above, however, dividends are difficult to sustain and lower-margin businesses (e.g. oil sands) in particular are not getting financed in the public markets.
we expect to see continued relative growth in the amount of private equity investment in the western Canadian sedimentary Basin, sourced from an array of sophisticated and deep-pocketed financial sponsors, including Canadian pension funds, large us private equity houses and emerging market sovereign wealth funds.
where possible, we also anticipate further partnering between Canadian producers and foreign industry participants (mainly national oil companies) in the form of joint ventures as an equity substitute. However, we think these relationships will be reserved for the larger resource opportunities, usually operated by larger producers.
DEBT ISSUANCE
the very low interest rate environment that has stimulated so much dividend demand among equity investors is likely

CIBC A Look to the Future – 2013 Edition
FundInG78
to continue in 2013. As a result, we expect fixed income investors to continue to adjust their risk tolerance and pay up for yield. Accordingly, we anticipate further growth in the Canadian high yield market where investors attracted to the “alpha” offered by E&P borrowers meet issuers attracted to the all-in cost, duration and flexible covenant aspects of these instruments.
M&A
the difficult intersection of low netbacks and high capital costs has recently made the boards of directors and shareholders of many Canadian producers more open-minded to the prospect of a sale of their companies and/
or key assets. this is particularly so when the high premia offered in recent control transactions are considered. However, cash buyers are limited and dominated by national oil companies and super-majors. they can afford to be selective and are generally looking for large resource in place (often to match with export plans), high liquids content and great management teams.
we anticipate considerable value to change hands in the m&A market in 2013. Activity is likely to be lumpy but there is the potential for one or two quite large transactions to occur. the clarity provided by updated Investment Canada rules expected by the beginning of 2013 will have a large bearing on this outcome.
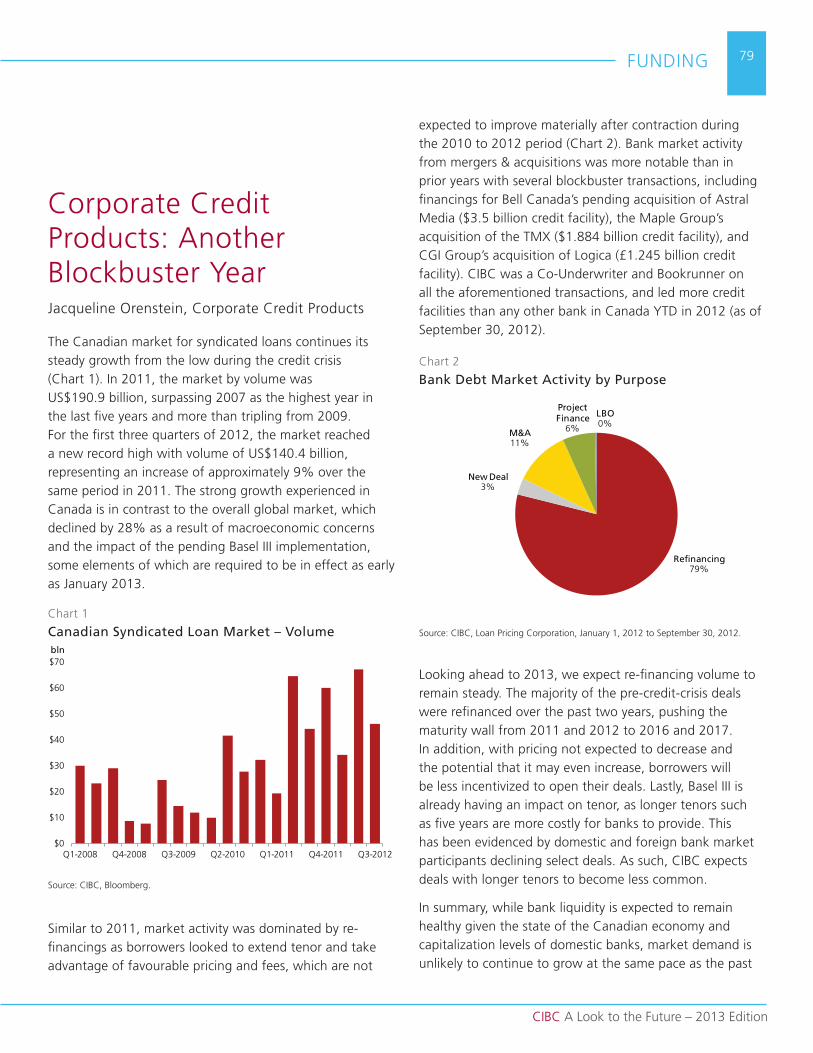
CIBC A Look to the Future – 2013 Edition
FundInG 79
Corporate Credit Products: Another Blockbuster YearJacqueline orenstein, Corporate Credit Products
the Canadian market for syndicated loans continues its steady growth from the low during the credit crisis (Chart 1). In 2011, the market by volume was us$190.9 billion, surpassing 2007 as the highest year in the last five years and more than tripling from 2009. For the first three quarters of 2012, the market reached a new record high with volume of us$140.4 billion, representing an increase of approximately 9% over the same period in 2011. the strong growth experienced in Canada is in contrast to the overall global market, which declined by 28% as a result of macroeconomic concerns and the impact of the pending Basel III implementation, some elements of which are required to be in effect as early as January 2013.
similar to 2011, market activity was dominated by re-financings as borrowers looked to extend tenor and take advantage of favourable pricing and fees, which are not
expected to improve materially after contraction during the 2010 to 2012 period (Chart 2). Bank market activity from mergers & acquisitions was more notable than in prior years with several blockbuster transactions, including financings for Bell Canada’s pending acquisition of Astral media ($3.5 billion credit facility), the maple Group’s acquisition of the tmX ($1.884 billion credit facility), and CGI Group’s acquisition of Logica (£1.245 billion credit facility). CIBC was a Co-underwriter and Bookrunner on all the aforementioned transactions, and led more credit facilities than any other bank in Canada Ytd in 2012 (as of september 30, 2012).
Looking ahead to 2013, we expect re-financing volume to remain steady. the majority of the pre-credit-crisis deals were refinanced over the past two years, pushing the maturity wall from 2011 and 2012 to 2016 and 2017. In addition, with pricing not expected to decrease and the potential that it may even increase, borrowers will be less incentivized to open their deals. Lastly, Basel III is already having an impact on tenor, as longer tenors such as five years are more costly for banks to provide. this has been evidenced by domestic and foreign bank market participants declining select deals. As such, CIBC expects deals with longer tenors to become less common.
In summary, while bank liquidity is expected to remain healthy given the state of the Canadian economy and capitalization levels of domestic banks, market demand is unlikely to continue to grow at the same pace as the past
$0
$10
$20
$30
$40
$50
$60
$70
Q1-2008 Q4-2008 Q3-2009 Q2-2010 Q1-2011 Q4-2011 Q3-2012
bln
Chart 1
Canadian Syndicated Loan Market – Volume
source: CIBC, Bloomberg.
Refinancing79%
New Deal3%
M&A11%
Project Finance
6%
LBO0%
Chart 2
Bank Debt Market Activity by Purpose
source: CIBC, Loan Pricing Corporation, January 1, 2012 to september 30, 2012.
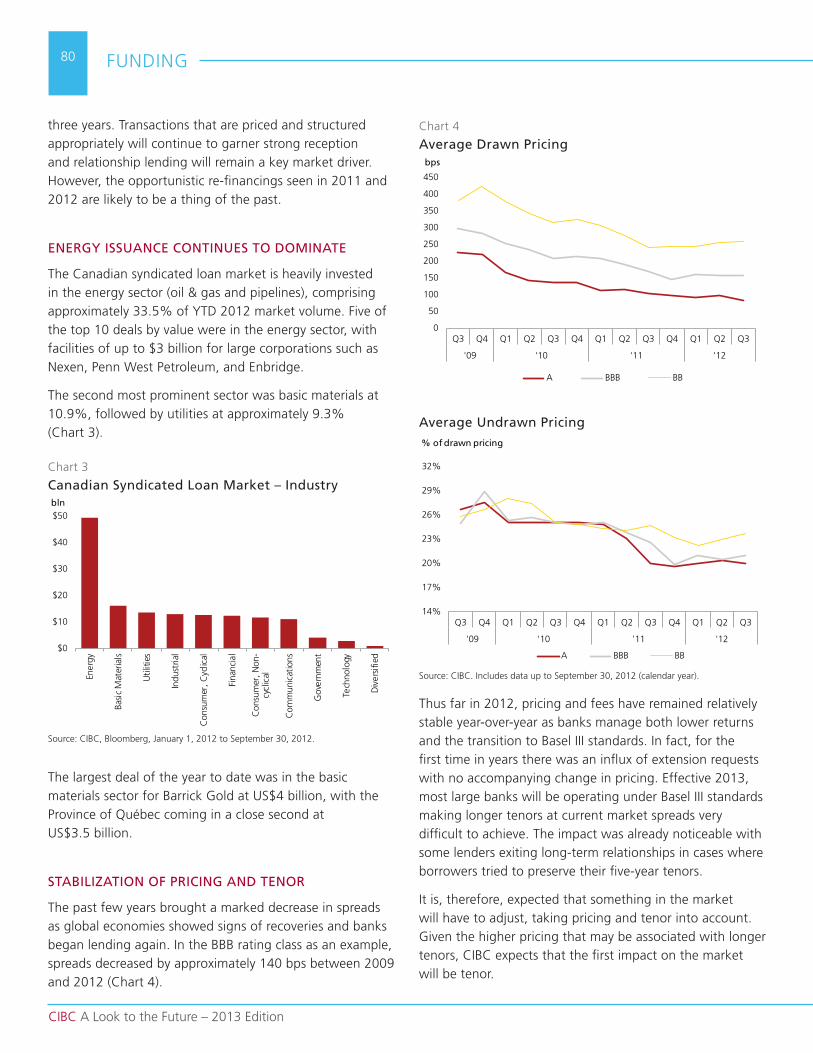
CIBC A Look to the Future – 2013 Edition
FundInG80
three years. transactions that are priced and structured appropriately will continue to garner strong reception and relationship lending will remain a key market driver. However, the opportunistic re-financings seen in 2011 and 2012 are likely to be a thing of the past.
ENERGY ISSUANCE CONTINUES TO DOMINATE
the Canadian syndicated loan market is heavily invested in the energy sector (oil & gas and pipelines), comprising approximately 33.5% of Ytd 2012 market volume. Five of the top 10 deals by value were in the energy sector, with facilities of up to $3 billion for large corporations such as nexen, Penn west Petroleum, and Enbridge.
the second most prominent sector was basic materials at 10.9%, followed by utilities at approximately 9.3% (Chart 3).
the largest deal of the year to date was in the basic materials sector for Barrick Gold at us$4 billion, with the Province of Québec coming in a close second at us$3.5 billion.
STABILIZATION OF PRICING AND TENOR
the past few years brought a marked decrease in spreads as global economies showed signs of recoveries and banks began lending again. In the BBB rating class as an example, spreads decreased by approximately 140 bps between 2009 and 2012 (Chart 4).
thus far in 2012, pricing and fees have remained relatively stable year-over-year as banks manage both lower returns and the transition to Basel III standards. In fact, for the first time in years there was an influx of extension requests with no accompanying change in pricing. Effective 2013, most large banks will be operating under Basel III standards making longer tenors at current market spreads very difficult to achieve. the impact was already noticeable with some lenders exiting long-term relationships in cases where borrowers tried to preserve their five-year tenors.
It is, therefore, expected that something in the market will have to adjust, taking pricing and tenor into account. Given the higher pricing that may be associated with longer tenors, CIBC expects that the first impact on the market will be tenor.
0
50
100
150
200
250
300
350
400
450
Q3Q2Q1Q4Q3Q2Q1Q4Q3Q2Q1Q4Q3
'12'11'10'09
bps
A BBB BB
Chart 4
Average Drawn Pricing
14%
17%
20%
23%
26%
29%
32%
Q3Q2Q1Q4Q3Q2Q1Q4Q3Q2Q1Q4Q3
'12'11'10'09
A BBB BB
% of drawn pricing
Average Undrawn Pricing
source: CIBC. Includes data up to september 30, 2012 (calendar year).
$0
$10
$20
$30
$40
$50
Ener
gy
Basi
c m
ater
ials
util
ities
Indu
stria
l
Con
sum
er, C
yclic
al
Fina
ncia
l
Con
sum
er, n
on-
cycl
ical
Com
mun
icat
ions
Gov
ernm
ent
tech
nolo
gy
div
ersi
fied
bln
Chart 3
Canadian Syndicated Loan Market – Industry
source: CIBC, Bloomberg, January 1, 2012 to september 30, 2012.
CIBC A Look to the Future – 2013 Edition
FundInG 81
For the most part, however, four- and five-year tenors remained achievable in 2012 and borrowers came to market to extend their deals knowing that the same window of opportunity may not exist in 2013.
CANADIAN SUPPLY REMAINS STRONG ALTHOUGH
PARTICIPANTS ARE MORE SELECTIVE
the majority of credit financing is provided by Canada’s top six banks, representing 81% of the market share by bookrunner volume. this market composition has remained relatively consistent over the past five years.
Bulge-bracket us firms are the next largest lenders, although we anticipate this mix to potentially shift in 2013. As a result of higher funding costs and return hurdles, functions of both Basel III and the state of the us economy, us bank behaviour in the Canadian syndicated loan market has become less predictable with an increased emphasis on ancillary revenues. European banks, once very prevalent in the Canadian market, also exited numerous relationships in 2012 as part of a broader effort to reduce loan exposures and repatriate capital to home markets. Global industries, such as mining and energy, are exceptions where foreign banks continue to participate.
on the flip side, the Asian and Indian banks continue to aggressively deploy capital in Canada, which is seen by head offices as a conservative and stable economy in which to invest. often not requiring ancillary revenues and with the ability to write meaningful tickets for borrowers with stable credit profiles, they have helped to fill the void left by other foreign banks.
several trends have emerged as a result of less predictable foreign bank behaviour. these include advance calls to institutions to gauge their support ahead of a formal deal launch, as well as targeting oversubscriptions by asking existing lenders to increase, or inviting new lenders, in order to protect against any potential declines. overall, while oversubscription levels have decreased since 2011, market supply remains strong and deals continue to circle.
LEVERAGED LENDING
the Canadian leveraged loan market (defined as lending to borrowers with external or implied credit ratings of BB+ or
lower) has experienced strong support in 2012 from a broad variety of schedule I and other lenders, as well as a number of institutional investors. the bank lending market continues to be predominately “buy-and-hold” versus the us leveraged loan market, which is underpinned by an institutional investor base and a robust secondary market. the bank market tends to be more conservative than the institutional loan market, resulting in limited Canadian market capacity for borrowers with credit profiles below BB-. this trend continued in 2012, with only a small percentage of deals, mostly of smaller size (e.g. <$250 million), executed at lower ratings. Conversely, for borrowers with a strong BB credit profile, there is capacity in the $1 billion range.
us leveraged loan market issuance has been robust in 2012 due to record-breaking collateralized loan obligation (CLo) issuance and a search for yield amidst a low-interest-rate environment. the result has been attractive terms for borrowers, including aggressive structures (e.g. covenant-lite, dividend recapitalizations) and rates. Accordingly, numerous Canadian borrowers have successfully accessed this market and reduced their reliance on the traditional bank market, either exclusively with us syndications or with Canadian/us cross-border syndications (e.g. telesat, Q9 networks, Progressive waste). the strength of the Canadian and us high yield bond markets has also reduced some demand for sub-investment-grade lending.
For the majority of Canadian borrowers, however, home turf remains an attractive place to raise sub-investment-grade bank debt. Canadian market participants are hungry for yield, and well structured and well priced funded-debt opportunities. deals continue to exhibit two to three maintenance financial covenants, amortization (although it may be somewhat back-ended), as well as fulsome negative covenant packages, including limitations on distributions. tenors of up to five years are achievable, depending on the economics, sector and deal size. similar to the investment grade market, spreads have stabilized after seeing the most marked decline amongst the rating classes since the credit crisis. For small deals with strong bank-borrower relationships, pricing has declined to a level only marginally higher than that achieved by investment grade borrowers. External ratings are not a requirement within the Canadian bank market and, in fact, most borrowers forgo the process unless access to the broader debt markets is required for alternative sources of capital.

CIBC A Look to the Future – 2013 Edition
FundInG82
the bulk of leveraged buyout (LBo)/financial sponsor transactions in the Canadian loan market involve mid-market companies. while the Canadian LBo market tends to be more conservative than its us counterpart, it provides a cost-effective way for borrowers to raise Canadian dollars and leverage lending relationships either through an all-Canadian solution, or a Canada-us cross-border solution (for larger transactions). throughout 2012, appropriately structured and priced transactions for strong credits across the ratings spectrum with strong financial sponsorship were well subscribed with good support from a broad group of lenders active in the Canadian market.
Looking into 2013, CIBC expects the leveraged lending landscape to remain strong with ample supply for well-structured deals. the impact of Basel III will be less prevalent in this rating category given the absence of backstop facilities and the current level of spreads relative to banks’ funding costs. the stabilization of spreads in the stronger ratings categories will limit any further compression on pricing as lenders look at relative pricing across borrowers.
83
CIBC A Look to the Future – 2013 Edition
mArkEt InFrAstruCturE uPdAtE
rising Costs of Eligible Collateral Provides Equity Finance opportunities Greg king, securities Lending
In the current environment of depressed returns, investors everywhere are searching for low-risk opportunities to enhance yield. the rising cost of eligible collateral can provide investors with a low-risk securities lending strategy to do just that.
the liquidity crisis of 2008 continues to have profound effects on financial markets in 2013. demand for collateral has grown as unsecuritized markets for all but the most creditworthy have disappeared. Globally, the demand for term securities finance has increased markedly as brokers and banks have moved to shore up funding gaps laid bare during the crisis and extend liquidity coverage ratios. the International monetary Fund (ImF) has estimated that Basel III liquidity ratio requirements alone will increase demand by $2 trillion–$4 trillion. regulation mandating that all standardized otC derivatives be cleared through central clearing counterparties (CCPs) by the end of 2012 will further increase demand as participants are required to provide collateral for margining. Although the Bank of International settlements (BIs) concluded that major dealers have sufficient unencumbered assets to meet initial margin requirements, there are many who foresee a looming collateral squeeze.
with banking systems awash with cash and the sovereign debt issuance continuing largely unabated in most G20 members, intuitively the supply of collateral would not appear to support fears that a collateral squeeze is imminent. the difference between the two views lies in the dichotomy of collateral.
DICHOTOMY OF COLLATERAL – “ELIGIBLE” AND
“OTHER”
All collateral is not created equal. Central banks and
payment/settlement systems accept cash and certain oECd sovereign and supranational debt as “eligible” collateral. Although central banks’ collateral requirements became more accommodative during the 2008/2009 liquidity crisis, equities, covered bonds and corporate bonds were not included. on the other hand, much of the global supply of liquid, high-quality assets is held by mutual funds, insurance companies, pension funds and foreign exchange reserves.
regulatory and policy restrictions aside (e.g. nI 81–102 does not permit Canadian mutual funds to accept equities as collateral), to the extent that these risk-averse investors lend their liquid, high-quality securities, their lists of acceptable collateral tend to mirror the eligible collateral of the central banks and payment systems and are weighted most heavily to open (overnight) or very short-term tenors. whether or not a full-blown squeeze of epic proportions develops for “eligible” collateral remains to be seen. However, given broadening of demand for “eligible” collateral and the shrinking of eligible supply with ongoing sovereign downgrades, it seems reasonably clear that the relative price of eligible collateral will remain under upward pressure. over the past several years, a growing trend has emerged of banks seeking to use “liquidity swaps” to address the collateral mismatch.
THE USE OF LIQUIDITY SWAPS TO ADDRESS
COLLATERAL MISMATCHES
the uk’s Financial services Authority (FsA) first published guidance on liquidity swap transactions in July 2011 in response to the growing usage of liquidity swaps and its concerns over the potential impact of large-scale asset encumbrance and systemic risk. the FsA provided finalized guidance in February 2012, outlining requirements for adequate risk management processes and controls. short-term liquidity swaps (defined as under one year) were specifically excluded.
Increasingly, banks and other financial market participants are turning to liquidity swaps to address the mismatch of eligible collateral demand and available collateral supply. Liquidity swaps, also referred to as collateral upgrade/downgrade trades, are a hybrid between a securities lending transaction and a repo, and transform the liquidity profiles of the participants. they are non-cash transactions, involving a lender of eligible collateral and a borrower that provides other non-eligible collateral in exchange
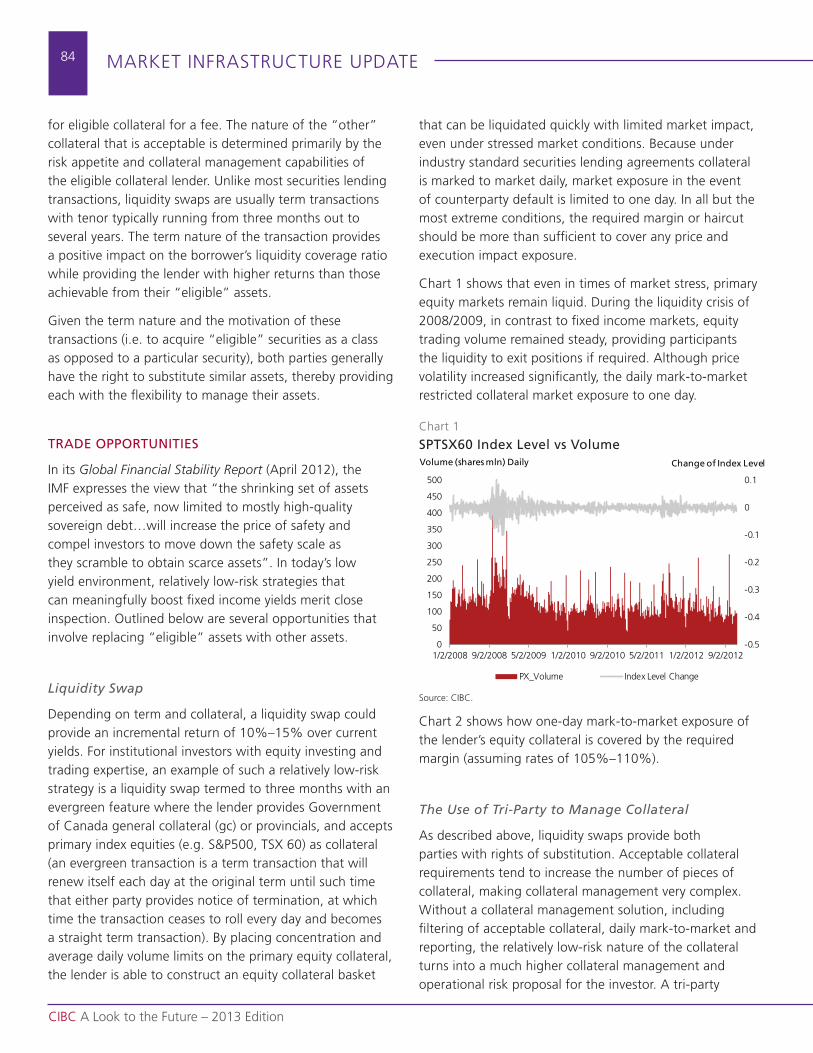
84
CIBC A Look to the Future – 2013 Edition
mArkEt InFrAstruCturE uPdAtE
for eligible collateral for a fee. the nature of the “other” collateral that is acceptable is determined primarily by the risk appetite and collateral management capabilities of the eligible collateral lender. unlike most securities lending transactions, liquidity swaps are usually term transactions with tenor typically running from three months out to several years. the term nature of the transaction provides a positive impact on the borrower’s liquidity coverage ratio while providing the lender with higher returns than those achievable from their “eligible” assets.
Given the term nature and the motivation of these transactions (i.e. to acquire “eligible” securities as a class as opposed to a particular security), both parties generally have the right to substitute similar assets, thereby providing each with the flexibility to manage their assets.
TRADE OPPORTUNITIES
In its Global Financial Stability Report (April 2012), the ImF expresses the view that “the shrinking set of assets perceived as safe, now limited to mostly high-quality sovereign debt…will increase the price of safety and compel investors to move down the safety scale as they scramble to obtain scarce assets”. In today’s low yield environment, relatively low-risk strategies that can meaningfully boost fixed income yields merit close inspection. outlined below are several opportunities that involve replacing “eligible” assets with other assets.
Liquidity Swap
depending on term and collateral, a liquidity swap could provide an incremental return of 10%–15% over current yields. For institutional investors with equity investing and trading expertise, an example of such a relatively low-risk strategy is a liquidity swap termed to three months with an evergreen feature where the lender provides Government of Canada general collateral (gc) or provincials, and accepts primary index equities (e.g. s&P500, tsX 60) as collateral (an evergreen transaction is a term transaction that will renew itself each day at the original term until such time that either party provides notice of termination, at which time the transaction ceases to roll every day and becomes a straight term transaction). By placing concentration and average daily volume limits on the primary equity collateral, the lender is able to construct an equity collateral basket
that can be liquidated quickly with limited market impact, even under stressed market conditions. Because under industry standard securities lending agreements collateral is marked to market daily, market exposure in the event of counterparty default is limited to one day. In all but the most extreme conditions, the required margin or haircut should be more than sufficient to cover any price and execution impact exposure.
Chart 1 shows that even in times of market stress, primary equity markets remain liquid. during the liquidity crisis of 2008/2009, in contrast to fixed income markets, equity trading volume remained steady, providing participants the liquidity to exit positions if required. Although price volatility increased significantly, the daily mark-to-market restricted collateral market exposure to one day.
Chart 2 shows how one-day mark-to-market exposure of the lender’s equity collateral is covered by the required margin (assuming rates of 105%–110%).
The use of Tri-Party to Manage Collateral
As described above, liquidity swaps provide both parties with rights of substitution. Acceptable collateral requirements tend to increase the number of pieces of collateral, making collateral management very complex. without a collateral management solution, including filtering of acceptable collateral, daily mark-to-market and reporting, the relatively low-risk nature of the collateral turns into a much higher collateral management and operational risk proposal for the investor. A tri-party
Chart 1
SPTSX60 Index Level vs Volume
source: CIBC.
-0.5
-0.4
-0.3
-0.2
-0.1
0
0.1
0
50
100
150
200
250
300
350
400
450
500
1/2/2008 9/2/2008 5/2/2009 1/2/2010 9/2/2010 5/2/2011 1/2/2012 9/2/2012
PX_Volume Index Level Change
Change of Index LevelVolume (shares mln) Daily
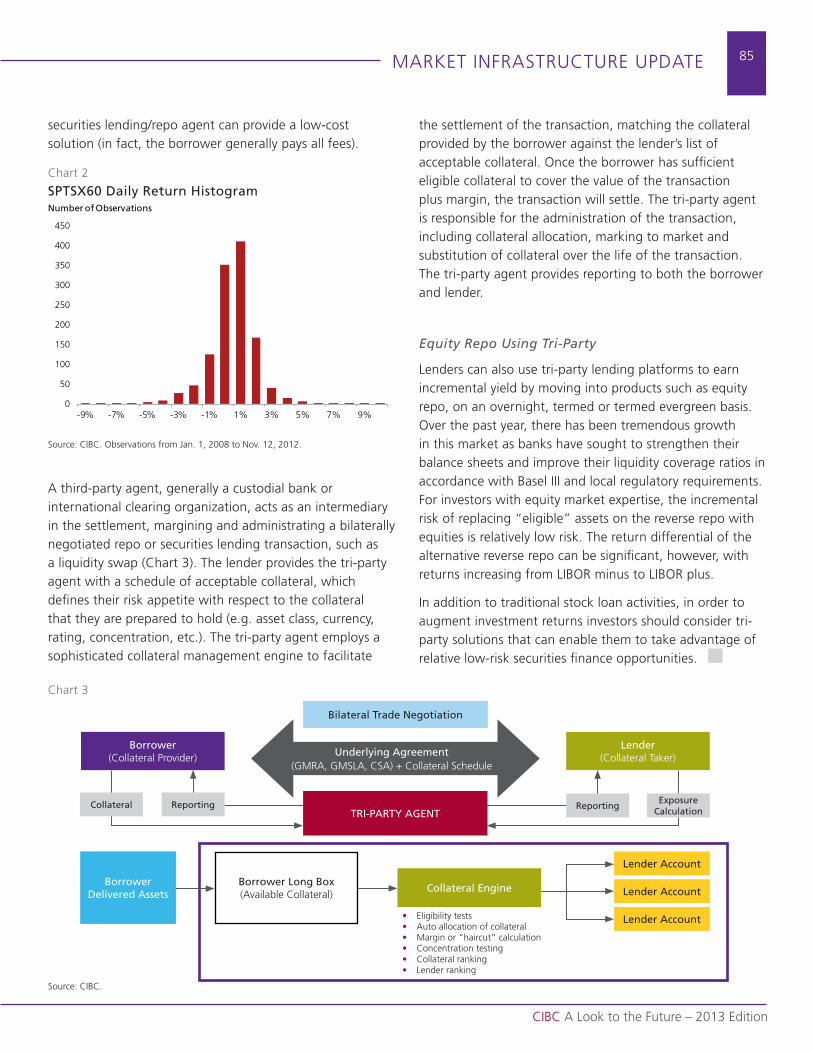
85
CIBC A Look to the Future – 2013 Edition
mArkEt InFrAstruCturE uPdAtE
securities lending/repo agent can provide a low-cost solution (in fact, the borrower generally pays all fees).
A third-party agent, generally a custodial bank or international clearing organization, acts as an intermediary in the settlement, margining and administrating a bilaterally negotiated repo or securities lending transaction, such as a liquidity swap (Chart 3). the lender provides the tri-party agent with a schedule of acceptable collateral, which defines their risk appetite with respect to the collateral that they are prepared to hold (e.g. asset class, currency, rating, concentration, etc.). the tri-party agent employs a sophisticated collateral management engine to facilitate
the settlement of the transaction, matching the collateral provided by the borrower against the lender’s list of acceptable collateral. once the borrower has sufficient eligible collateral to cover the value of the transaction plus margin, the transaction will settle. the tri-party agent is responsible for the administration of the transaction, including collateral allocation, marking to market and substitution of collateral over the life of the transaction. the tri-party agent provides reporting to both the borrower and lender.
Equity Repo using Tri-Party
Lenders can also use tri-party lending platforms to earn incremental yield by moving into products such as equity repo, on an overnight, termed or termed evergreen basis. over the past year, there has been tremendous growth in this market as banks have sought to strengthen their balance sheets and improve their liquidity coverage ratios in accordance with Basel III and local regulatory requirements. For investors with equity market expertise, the incremental risk of replacing “eligible” assets on the reverse repo with equities is relatively low risk. the return differential of the alternative reverse repo can be significant, however, with returns increasing from LIBor minus to LIBor plus.
In addition to traditional stock loan activities, in order to augment investment returns investors should consider tri-party solutions that can enable them to take advantage of relative low-risk securities finance opportunities.
Chart 3
source: CIBC.
Lender (Collateral taker)
Borrower (Collateral Provider)
Bilateral Trade Negotiation
Borrower Long Box (Available Collateral)
Lender Account
Lender Account
Lender Account
ReportingExposure
CalculationReportingCollateral
Borrower Delivered Assets
Collateral Engine
• Eligibility tests• Auto allocation of collateral• margin or “haircut” calculation• Concentration testing• Collateral ranking• Lender ranking
Underlying Agreement(GmrA, GmsLA, CsA) + Collateral schedule
TRI-PARTY AGENT
Chart 2
SPTSX60 Daily Return Histogram
source: CIBC. observations from Jan. 1, 2008 to nov. 12, 2012.
0
50
100
150
200
250
300
350
400
450
-9% -7% -5% -3% -1% 1% 3% 5% 7% 9%
Number of Observations
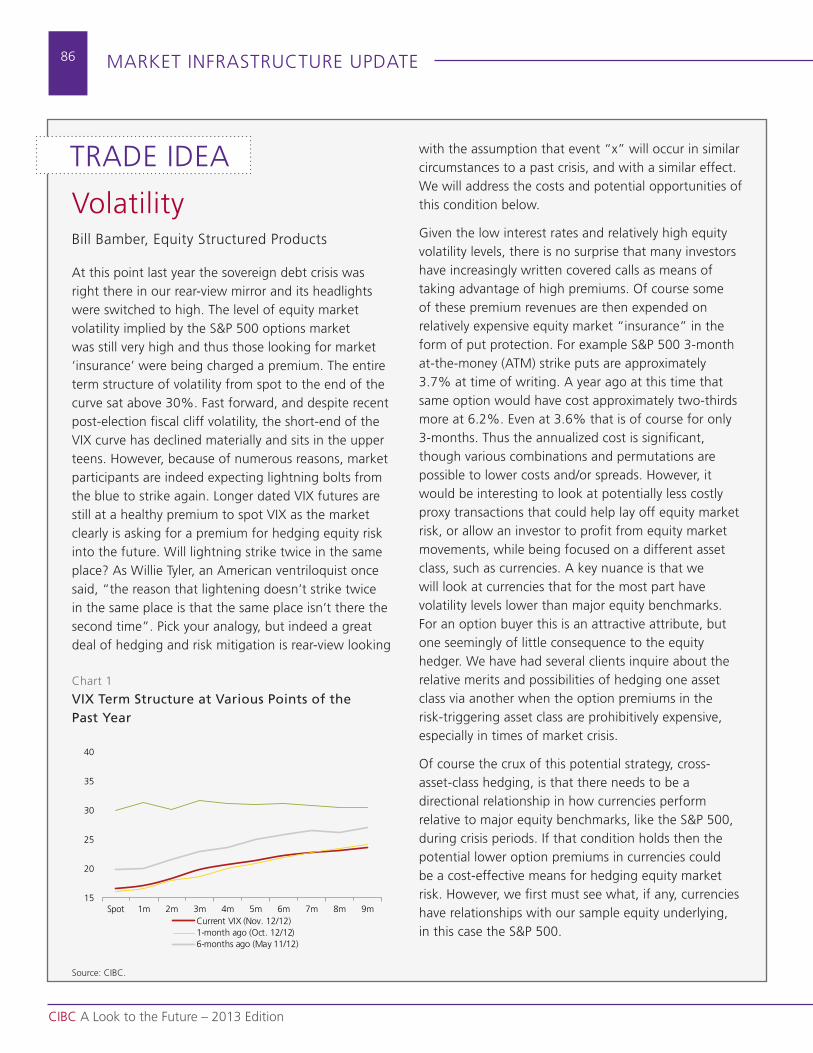
86
CIBC A Look to the Future – 2013 Edition
mArkEt InFrAstruCturE uPdAtE
VolatilityBill Bamber, Equity structured Products
At this point last year the sovereign debt crisis was right there in our rear-view mirror and its headlights were switched to high. the level of equity market volatility implied by the s&P 500 options market was still very high and thus those looking for market ‘insurance’ were being charged a premium. the entire term structure of volatility from spot to the end of the curve sat above 30%. Fast forward, and despite recent post-election fiscal cliff volatility, the short-end of the VIX curve has declined materially and sits in the upper teens. However, because of numerous reasons, market participants are indeed expecting lightning bolts from the blue to strike again. Longer dated VIX futures are still at a healthy premium to spot VIX as the market clearly is asking for a premium for hedging equity risk into the future. will lightning strike twice in the same place? As willie tyler, an American ventriloquist once said, “the reason that lightening doesn’t strike twice in the same place is that the same place isn’t there the second time”. Pick your analogy, but indeed a great deal of hedging and risk mitigation is rear-view looking
with the assumption that event “x” will occur in similar circumstances to a past crisis, and with a similar effect. we will address the costs and potential opportunities of this condition below.
Given the low interest rates and relatively high equity volatility levels, there is no surprise that many investors have increasingly written covered calls as means of taking advantage of high premiums. of course some of these premium revenues are then expended on relatively expensive equity market “insurance” in the form of put protection. For example s&P 500 3-month at-the-money (Atm) strike puts are approximately 3.7% at time of writing. A year ago at this time that same option would have cost approximately two-thirds more at 6.2%. Even at 3.6% that is of course for only 3-months. thus the annualized cost is significant, though various combinations and permutations are possible to lower costs and/or spreads. However, it would be interesting to look at potentially less costly proxy transactions that could help lay off equity market risk, or allow an investor to profit from equity market movements, while being focused on a different asset class, such as currencies. A key nuance is that we will look at currencies that for the most part have volatility levels lower than major equity benchmarks. For an option buyer this is an attractive attribute, but one seemingly of little consequence to the equity hedger. we have had several clients inquire about the relative merits and possibilities of hedging one asset class via another when the option premiums in the risk-triggering asset class are prohibitively expensive, especially in times of market crisis.
of course the crux of this potential strategy, cross-asset-class hedging, is that there needs to be a directional relationship in how currencies perform relative to major equity benchmarks, like the s&P 500, during crisis periods. If that condition holds then the potential lower option premiums in currencies could be a cost-effective means for hedging equity market risk. However, we first must see what, if any, currencies have relationships with our sample equity underlying, in this case the s&P 500.
Chart 1
VIX Term Structure at Various Points of the Past Year
15
20
25
30
35
40
spot 1m 2m 3m 4m 5m 6m 7m 8m 9mCurrent VIX (nov. 12/12)1-month ago (oct. 12/12)6-months ago (may 11/12)
source: CIBC.
trAdE IdEA
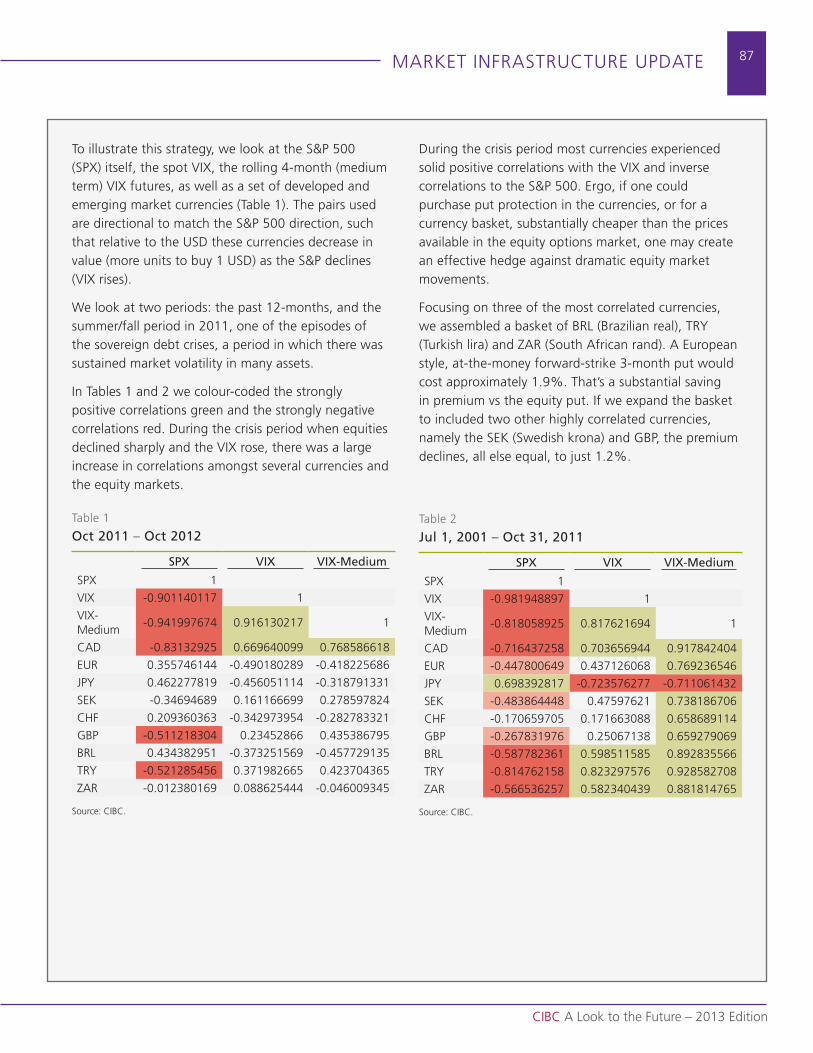
87
CIBC A Look to the Future – 2013 Edition
mArkEt InFrAstruCturE uPdAtE
to illustrate this strategy, we look at the s&P 500 (sPX) itself, the spot VIX, the rolling 4-month (medium term) VIX futures, as well as a set of developed and emerging market currencies (table 1). the pairs used are directional to match the s&P 500 direction, such that relative to the usd these currencies decrease in value (more units to buy 1 usd) as the s&P declines (VIX rises).
we look at two periods: the past 12-months, and the summer/fall period in 2011, one of the episodes of the sovereign debt crises, a period in which there was sustained market volatility in many assets.
In tables 1 and 2 we colour-coded the strongly positive correlations green and the strongly negative correlations red. during the crisis period when equities declined sharply and the VIX rose, there was a large increase in correlations amongst several currencies and the equity markets.
table 1
Oct 2011 – Oct 2012
SPX VIX VIX-Medium
sPX 1
VIX -0.901140117 1
VIX-medium
-0.941997674 0.916130217 1
CAd -0.83132925 0.669640099 0.768586618
Eur 0.355746144 -0.490180289 -0.418225686
JPY 0.462277819 -0.456051114 -0.318791331
sEk -0.34694689 0.161166699 0.278597824
CHF 0.209360363 -0.342973954 -0.282783321
GBP -0.511218304 0.23452866 0.435386795
BrL 0.434382951 -0.373251569 -0.457729135
trY -0.521285456 0.371982665 0.423704365
ZAr -0.012380169 0.088625444 -0.046009345
source: CIBC.
during the crisis period most currencies experienced solid positive correlations with the VIX and inverse correlations to the s&P 500. Ergo, if one could purchase put protection in the currencies, or for a currency basket, substantially cheaper than the prices available in the equity options market, one may create an effective hedge against dramatic equity market movements.
Focusing on three of the most correlated currencies, we assembled a basket of BrL (Brazilian real), trY (turkish lira) and ZAr (south African rand). A European style, at-the-money forward-strike 3-month put would cost approximately 1.9%. that’s a substantial saving in premium vs the equity put. If we expand the basket to included two other highly correlated currencies, namely the sEk (swedish krona) and GBP, the premium declines, all else equal, to just 1.2%.
table 2
Jul 1, 2001 – Oct 31, 2011
SPX VIX VIX-Medium
sPX 1
VIX -0.981948897 1
VIX-medium
-0.818058925 0.817621694 1
CAd -0.716437258 0.703656944 0.917842404
Eur -0.447800649 0.437126068 0.769236546
JPY 0.698392817 -0.723576277 -0.711061432
sEk -0.483864448 0.47597621 0.738186706
CHF -0.170659705 0.171663088 0.658689114
GBP -0.267831976 0.25067138 0.659279069
BrL -0.587782361 0.598511585 0.892835566
trY -0.814762158 0.823297576 0.928582708
ZAr -0.566536257 0.582340439 0.881814765
source: CIBC.

88
CIBC A Look to the Future – 2013 Edition
mArkEt InFrAstruCturE uPdAtE
Focus on Adaptationdarren sumarah, Prime services Group
thomas kalafatis, Prime services Group
the entire financial services industry is making adjustments in response to changes to its environment. Equity volumes are down across the globe, with volumes in north America down 20%–40% compared to a few years ago. Buy-side firms are concerned about reduced inflows, the rise of EtFs, and generating performance in difficult markets. sell-side firms are worried about increased regulatory uncertainty surrounding fees and regulations restricting proprietary trading activity. regulators are concerned about the rise of electronic trading and are updating regulations to ensure confidence in the equity markets.
HOW THE INDUSTRY WILL ADJUST
Here are some trends and themes we have identified from our discussions with clients and predictions on how the industry will evolve in 2013:
1) More Services with Same Resources
the current low-volume environment will impact buy-side and sell-side firms. while a catalyst for volume growth in 2013 is not currently apparent, firms will have to focus on providing higher-quality services with the same resources until volume rebounds.
Buy-side
Multi-Asset Responsibilities for Traders: Buy-side firms are looking to reduce mErs to compete with EtFs. Buy-side traders that traditionally focused on equities have begun trading other asset classes including options and FX.
Segregation/Automation of Flows: trading desks have been segregating and automating the execution of small-volume/low-impact order flow. By automating these flows, the buy-side trader has more time to focus on the execution of large orders with potential price impact, and on alpha creation. we forsee this trend continuing into 2013.
Stock Loan and Collateral Upgrade Trades: Pension and hedge fund accounts have been exploring stock loan and collateral upgrade trades as a way to add alpha to their performance. we see this trend continuing with more traditional asset managers entering the space in 2013.
Further Consolidation: declining volumes coupled with the regulatory uncertainty associated with trading equities has created a difficult environment for electronic market-making firms. this, coupled with ever-increasing technology costs, which include building infrastructure to support the latest microwave routing technology, will lead to smaller players shutting down or being bought by larger players.
Sell-side
Reduced Staff at Global Banks: Global sell-side firms built for a bullish environment will need to reduce staff. we have already seen this with recent announcements of massive layoffs at bulge-bracket firms. we expect the same trend amongst independent brokerages next year given current volumes, with the possibility of consolidation in the space. the challenge these firms will face will be providing similar-quality services with reduced resources.
Identifying the Firm’s Unique Niche and Value Proposition: the reduced volume environment will mean there will be more competition amongst sell-side firms. Buy-side firms will pay firms that are providing value and continue to reduce the size of the broker list. these trends tend to favour large firms that can accommodate multiple trading channels (program trading, agency and electronic execution) and smaller niche firms that can provide a unique service. next year will continue to be a difficult environment for second-tier sell-side firms without electronic capabilities or agency-only broker-dealers. there will be fewer discretionary commission dollars available.
2) Barbell Strategy Deployment Leads to New
Opportunities – Focus on the Bar, Not the Bell
the existing environment of low volumes, rising technology costs, and low interest rates are challenges to profitability. the increase in electronic and automated trading in recent years has made the identification of market inefficiencies more difficult to detect and act upon. the majority of clients are looking at two primary time horizons to generate returns: long-term buy and hold, and electronic market-
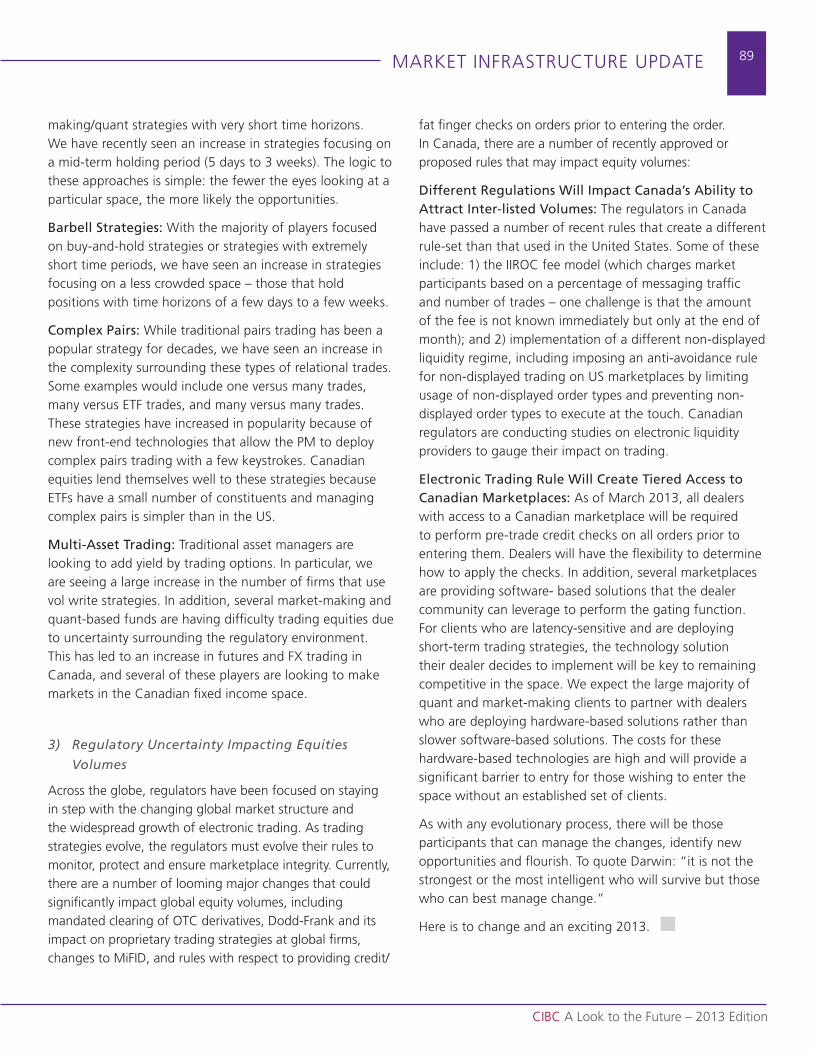
89
CIBC A Look to the Future – 2013 Edition
mArkEt InFrAstruCturE uPdAtE
making/quant strategies with very short time horizons. we have recently seen an increase in strategies focusing on a mid-term holding period (5 days to 3 weeks). the logic to these approaches is simple: the fewer the eyes looking at a particular space, the more likely the opportunities.
Barbell Strategies: with the majority of players focused on buy-and-hold strategies or strategies with extremely short time periods, we have seen an increase in strategies focusing on a less crowded space – those that hold positions with time horizons of a few days to a few weeks.
Complex Pairs: while traditional pairs trading has been a popular strategy for decades, we have seen an increase in the complexity surrounding these types of relational trades. some examples would include one versus many trades, many versus EtF trades, and many versus many trades. these strategies have increased in popularity because of new front-end technologies that allow the Pm to deploy complex pairs trading with a few keystrokes. Canadian equities lend themselves well to these strategies because EtFs have a small number of constituents and managing complex pairs is simpler than in the us.
Multi-Asset Trading: traditional asset managers are looking to add yield by trading options. In particular, we are seeing a large increase in the number of firms that use vol write strategies. In addition, several market-making and quant-based funds are having difficulty trading equities due to uncertainty surrounding the regulatory environment. this has led to an increase in futures and FX trading in Canada, and several of these players are looking to make markets in the Canadian fixed income space.
3) Regulatory uncertainty Impacting Equities
Volumes
Across the globe, regulators have been focused on staying in step with the changing global market structure and the widespread growth of electronic trading. As trading strategies evolve, the regulators must evolve their rules to monitor, protect and ensure marketplace integrity. Currently, there are a number of looming major changes that could significantly impact global equity volumes, including mandated clearing of otC derivatives, dodd-Frank and its impact on proprietary trading strategies at global firms, changes to miFId, and rules with respect to providing credit/
fat finger checks on orders prior to entering the order. In Canada, there are a number of recently approved or proposed rules that may impact equity volumes:
Different Regulations Will Impact Canada’s Ability to Attract Inter-listed Volumes: the regulators in Canada have passed a number of recent rules that create a different rule-set than that used in the united states. some of these include: 1) the IIroC fee model (which charges market participants based on a percentage of messaging traffic and number of trades – one challenge is that the amount of the fee is not known immediately but only at the end of month); and 2) implementation of a different non-displayed liquidity regime, including imposing an anti-avoidance rule for non-displayed trading on us marketplaces by limiting usage of non-displayed order types and preventing non-displayed order types to execute at the touch. Canadian regulators are conducting studies on electronic liquidity providers to gauge their impact on trading.
Electronic Trading Rule Will Create Tiered Access to Canadian Marketplaces: As of march 2013, all dealers with access to a Canadian marketplace will be required to perform pre-trade credit checks on all orders prior to entering them. dealers will have the flexibility to determine how to apply the checks. In addition, several marketplaces are providing software- based solutions that the dealer community can leverage to perform the gating function. For clients who are latency-sensitive and are deploying short-term trading strategies, the technology solution their dealer decides to implement will be key to remaining competitive in the space. we expect the large majority of quant and market-making clients to partner with dealers who are deploying hardware-based solutions rather than slower software-based solutions. the costs for these hardware-based technologies are high and will provide a significant barrier to entry for those wishing to enter the space without an established set of clients.
As with any evolutionary process, there will be those participants that can manage the changes, identify new opportunities and flourish. to quote darwin: “it is not the strongest or the most intelligent who will survive but those who can best manage change.”
Here is to change and an exciting 2013.

90
CIBC A Look to the Future – 2013 Edition
mArkEt InFrAstruCturE uPdAtE
Electronic Evolution: Execution to Centralized Clearing Jim Ginis, e-solutions Group
According to a 2011 report published by Greenwich, electronic trading now tops 60% of global FX trading volume. Electronic execution over the past two decades has grown as more client segments across hedge funds, asset managers, corporates and retail investors have requested direct access to a financial institution’s liquidity pools. Product enhancements evolved to include trading controls, reporting, governance and allocations. the internal risk management teams of financial institutions have also requested developments in automated credit checks and fast market controls in order to minimize risk when trading with various counterparties. we should not be surprised that, after the 2008 financial crisis and the passing of the dodd-Frank Act, electronic execution is the preferred choice for regulators.
ELECTRONIC ACCESS TO LIQUIDITY POOLS
Electronic FX execution had historically serviced the interbank market with trading venues, such as reuters matching and Electronic Brokering services (EBs). over time clients have been requesting electronic access to bank liquidity pools, and financial institutions have responded by providing various channels to access this market. one method is a single dealer platform where a client may access a bank’s aggregated liquidity. single dealer platforms are evolving to include multiple asset classes, and are now providing additional features such as research, trade ideas and analytics. A second method is a multi-dealer platform, where third-party vendors offer a platform to source multiple bank liquidity pools. A third method for more sophisticated market participants is an Application Programming Interface (API), a direct connection between the two participants’ servers.
multiple ways to access liquidity and maintain internal controls empower clients and strengthen relationships. A robust e-Commerce offering will provide pre-trade, trade and post-trade solutions to meet a client’s internal risk and compliance requirements.
Asset managers require an automatic upload of FX instructions, which are bulked up by currency pair and tenor. once a trade is executed, a post- trade tool is required to allocate splits across various accounts and provide straight-through processing into the client’s back-office systems. Hedge funds require different controls. those with multi-asset trading strategies source liquidity through various institutions and require trading limits to ensure that potential input errors have control mechanisms. Electronic platforms provide administrative tools to limit each user to a maximum trade size and minimize “fat finger” errors.
Corporate clients may request electronic market access for FX while maintaining internal controls on trading and settlement. the treasurer may only permit an associate to trade on selected currency pairs or up to a specified notional amount. their back office may separate duties where one user confirms transactions and a second one releases the payments electronically. Limitations may also be placed on the settlement details, restricting any new instructions or wire payments from being sent out unless they have been pre-approved by a signing officer of the corporation. this step enhances controls and minimizes risk concerning outgoing wires.
PROVIDING BANK LIQUIDITY AND FAST MARKET
CONTROLS
today financial institutions are required to source their own liquidity at a faster rate. due to the speed of electronic trading, humans increasingly become challenged in managing risk fast enough to service all electronic and direct dealing clients at the same time. A systematic algorithmic risk trading engine is used to access multiple sources of liquidity and mitigate risk. the successful deployment of an engine is dependent on an institution’s technology infrastructure, controls and the expertise to develop and execute complex mathematical models.
Financial institutions with a reasonable amount of FX flow will match up clients who are buying with those that

91
CIBC A Look to the Future – 2013 Edition
mArkEt InFrAstruCturE uPdAtE
are selling. A diverse client base allows a firm to execute this strategy more effectively. when there is a gap in this process, the firm can source liquidity from direct API connections to other financial institutions. this enables banks to leverage their global relationships to source cheaper liquidity for their clients. A second method is accessing various Electronic Crossing networks (ECns), the main ones being EBs, reuters, Currenex, Hotspot and the CmE. ECns have matching engines and act as brokers between buyers and sellers. A low-latency infrastructure is critical in managing any API and ECn relationships. Co-location, the process by which one connects one’s servers in close proximity to other market participants is necessary for executing a successful risk management strategy.
Fast market controls and instantaneous credit checks are also needed when implementing a smArt routing engine. the pre-trading and trading controls implemented on behalf of clients are also applied when a financial institution sources liquidity to manage risk. since 2008 there has been an increased focus on counterparty risk and financial institutions are more cautious in extending too much credit to any other single entity. Pre-trading controls have been put in place to limit the notional amount that can be transacted with each individual counterparty. specific trading limits are pre-approved by internal credit and risk teams, and automated intra-day reporting is used to monitor adherence to these limits.
As we’ve seen from recent market history, with increased volatility and flash crash events, the human component of a complex trading system is critical. the long-term trend arising from increasing automation may be less human interaction in High Frequency trading (HFt) and computer-based trading, but the importance of that interaction increases almost exponentially. trading algorithms that were once the purview of sophisticated institutional traders are now available to retail investors. decreasing technology costs and the expansion of electronic trading to other asset classes point to more complex trading environments.
CONTROLS HAVE LED TO DODD-FRANK
Gary Gensler, the Chairman of the Commodities and Futures trading Commission, has stated the following regarding the dodd-Frank Act: “the wall street reform bill will for the first time bring comprehensive regulation
to the swaps marketplace. swap dealers will be subject to robust oversight. standardized derivatives will be required to trade on open platforms and be submitted for clearing to central counterparties. the commission looks forward to implementing the dodd-Frank bill to lower risk, promote transparency and protect the American public.”
the intention is to have standard derivatives traded on a regulated exchange or via a swap Execution Facility (sEF) in the us [and a multilateral trading Facility (mtF) in Europe]. A Central Counterparty Clearing House (CCP) will serve the purpose of providing default insurance for each of the two parties involved in a transaction. most foreign exchange products are exempt from the dodd-Frank Act with the exception of non-deliverable forwards (ndFs) and most likely FX options. It has been mandated that these transactions must be reported to and cleared by a CCP. margin, which will act as the insurance against default, will be required in order for one to participate as a direct counterparty within each jurisdictional CCP. Capital requirements for margin may be prohibitive for smaller institutions to directly participate in a CCP, and larger institutions will act as agents on behalf of others in dealing with counterparties.
End-users may be required to take action to ensure they are compliant of these new regulations. there is an “end-user exemption” clause in the dodd-Frank Act that excludes those that are not “financial entities,” as well as situations where a swap is used to hedge or mitigate commercial risk. most corporate clients under this definition would be exempt. the dodd-Frank Act was passed in the us with the intention that all global participants would abide by the same rules internationally. to date, there has been no cohesive strategy across financial regulators in the us, uk, European Commission or Asia. In the us, these new regulatory requirements are to go live in early 2013 with the deadline for reporting in march.
will clearing houses offer otC products, negating the need for a prime broker? this question centers on how cost and profitability will be spread among participants. Banks quote through challenging times because it is potentially profitable to do so but also out of historical obligation to service their clients. non-banks trade because it suits at that time. A central market place has the potential to remove the franchise value, bringing potential liquidity gaps that at times will not be filled.

92
CIBC A Look to the Future – 2013 Edition
mArkEt InFrAstruCturE uPdAtE
MORE QUESTIONS TO CONSIDER
It is inevitable that electronic trading will continue to grow. Its evolution from direct market access to product enhancements for minimizing risk has led to the preferred regulatory medium of transacting under the dodd-Frank Act. the pace of change in traded markets has never been greater. Established platforms are in decline but a host of new participants show there is an acceptance that old relationships and values are constantly redefined. A client may be a competitor if it shares market flow, but often flow between partners is profitable if in proportion. If one is deciding when to trade on the terms that suit, being the
driver of pricing and production flow will constantly bring new opportunity and new participants. will clients pay for the flow and service? Clearing? will the spread reduction witnessed in many markets prove too much over the long term?
these important questions about the next wave of changes in financial markets will be heightened as significant investments are made to automate and bring efficiencies, with trade netting/suppression reducing operational costs.
Interesting times for us all as we move on apace.

dIsCLosurEs
CIBC A Look to the Future – 2013 Edition
93
ImPortAnt dIsCLosurEs:Analyst Certification: Each CIBC world markets research analyst named on the front page of this research report, or at the beginning of any subsection hereof, hereby certifies that (i) the recommendations and opinions expressed herein accurately reflect such research analyst’s personal views about the company and securities that are the subject of this report and all other companies and securities mentioned in this report that are covered by such research analyst and (ii) no part of the research analyst’s compensation was, is, or will be, directly or indirectly, related to the specific recommendations or views expressed by such research analyst in this report.
Potential Conflicts of Interest: Equity research analysts employed by CIBC world markets are compensated from revenues generated by various CIBC world markets businesses, including the CIBC world markets Investment Banking department. research analysts do not receive compensation based upon revenues from specific investment banking transactions. CIBC world markets generally prohibits any research analyst and any member of his or her household from executing trades in the securities of a company that such research analyst covers. Additionally, CIBC world markets generally prohibits any research analyst from serving as an officer, director or advisory board member of a company that such analyst covers.
In addition to 1% ownership positions in covered companies that are required to be specifically disclosed in this report, CIBC world markets may have a long position of less than 1% or a short position or deal as principal in the securities discussed herein, related securities or in options, futures or other derivative instruments based thereon.
recipients of this report are advised that any or all of the foregoing arrangements, as well as more specific disclosures set forth below, may at times give rise to potential conflicts of interest.

dIsCLosurEs
CIBC A Look to the Future – 2013 Edition
94
IMPORTANT DISCLOSURE FOOTNOTES FOR COMPANIES MENTIONED IN THIS REPORT THAT ARE COVERED BY
CIBC WORLD MARKETS INC.:
Stock Prices as of 12/03/2012: Aecon Group Inc. (2g) (ArE-tsX, C$10.62, sector outperformer) Agnico-Eagle mines Limited (2g, 7) (AEm-nYsE, us$55.80, sector Performer) Agrium Inc. (2g, 7) (AGu-nYsE, us$102.02, sector outperformer) Alimentation Couche-tard Inc. (2g, 12) (Atd.B-tsX, C$49.07, sector Performer) Alliance Grain traders Inc. (2g) (AGt-tsX, C$11.35, sector Performer) AltaGas Ltd. (2a, 2c, 2e, 2g, 7) (ALA-tsX, C$34.54, sector outperformer) AngloGold Ashanti Limited (2g) (AnG-sA, r269.81, sector outperformer) Astral media Inc. (2g, 12, 13) (ACm.A-tsX, C$45.75, restricted) Bank of nova scotia (2a, 2b, 2c, 2d, 2e, 2g, 3a, 3c, 7) (Bns-tsX, C$56.00, sector outperformer) Banro Corporation (2a, 2c, 2e, 2g) (BAA-tsX, C$3.31, sector Performer) Barrick Gold Corporation (2a, 2b, 2d, 2e, 2g, 7) (ABX-nYsE, us$34.53, sector Performer) BCE Inc. (2a, 2c, 2e, 2g, 7, 9, Cd7, Cd11) (BCE-tsX, C$42.06, restricted) Bird Construction Inc. (2g) (Bdt-tsX, C$13.83, sector Performer) Canadian oil sands Limited (2a, 2b, 2d, 2e, 2g, 7) (Cos-tsX, C$20.16, sector underperformer) Capital Power Corporation (2a, 2c, 2e, 2g, 7) (CPX-tsX, C$21.83, sector outperformer) Celtic Exploration Ltd. (2a, 2c, 2e, 2g) (CLt-tsX, C$26.13, sector Performer) Cenovus Energy Inc. (2a, 2c, 2e, 2g, 7) (CVE-tsX, C$33.36, sector outperformer) Centerra Gold Inc. (2g) (CG-tsX, C$8.91, sector outperformer) Cervus Equipment Corporation (2a, 2c, 2e, 2g) (CVL-tsX, C$18.36, sector outperformer) CGI Group Inc. (2a, 2e, 2g, 9, 12) (GIB.A-tsX, C$22.80, sector outperformer) Churchill Corporation (2g) (CuQ-tsX, C$8.14, sector Performer) Eldorado Gold Corporation (2g, 7) (EGo-nYsE, us$14.48, sector Performer) Enbridge Inc. (2a, 2c, 2e, 2g, 7, Cd26) (EnB-tsX, C$40.22, sector outperformer) Encana Corporation (2a, 2d, 2e, 2g, 7, 9) (ECA-nYsE, us$21.79, sector Performer) Fortis Inc. (2a, 2c, 2e, 2g, 7) (Fts-tsX, C$33.38, sector Performer) GEnIVAr Inc. (2a, 2c, 2e, 2g, 7) (GnV-tsX, C$20.60, sector Performer) Gibson Energy Inc. (2a, 2c, 2e, 2g) (GEI-tsX, C$22.86, sector Performer) Goldcorp Inc. (2g, 7) (GG-nYsE, us$38.70, sector outperformer) Husky Energy Inc. (2a, 2c, 2e, 2g) (HsE-tsX, C$27.88, sector Performer) IAmGoLd Corporation (2a, 2e, 2g, 7) (IAG-nYsE, us$11.83, sector Performer) IBI Group Inc. (2a, 2c, 2e, 2g) (IBG-tsX, C$6.70, sector Performer) Imperial oil Limited (2g) (Imo-tsX, C$42.35, sector Performer) Inter Pipeline Fund L.P. (2a, 2c, 2e, 2g) (IPL.un-tsX, C$22.49, sector outperformer) new Gold Inc. (2g) (nGd-tsX, C$10.55, sector Performer) newmont mining Corporation (2a, 2c, 2e, 2g, 4a, 4b) (nEm-nYsE, us$47.09, sector Performer) nexen Inc. (2a, 2c, 2e, 2g, 7) (nXY-tsX, C$24.39, sector underperformer) osisko mining Corporation (2g) (osk-tsX, C$8.10, sector outperformer) Painted Pony Petroleum Ltd. (2g) (PPY-V, C$10.95, sector outperformer) Pembina Pipeline Corporation (2a, 2c, 2e, 2g, 7) (PPL-tsX, C$28.13, sector outperformer) Penn west Petroleum Ltd. (2a, 2e, 2g, 7) (Pwt-tsX, C$11.10, sector outperformer) Progress Energy resources Corp. (2g) (PrQ-tsX, C$20.18, sector Performer) Progressive waste solutions Ltd. (2g, 4a, 4b, 7) (BIn-nYsE, us$20.80, sector Performer) silver wheaton Corp. (2g, 7) (sLw-nYsE, us$36.76, sector outperformer)

dIsCLosurEs
CIBC A Look to the Future – 2013 Edition
95
snC-Lavalin Group Inc. (2g, 7) (snC-tsX, C$39.40, sector Performer) stantec Inc. (2g) (stn-tsX, C$37.26, sector outperformer) suncor Energy Inc. (2g, 3a, 3c, 7, 9) (su-tsX, C$32.46, sector outperformer) tahoe resources Inc. (2g) (tHo-tsX, C$17.69, sector Performer) talisman Energy Inc. (2a, 2c, 2e, 2g, 3a, 3c, 7) (tLm-nYsE, us$11.22, sector outperformer) td Bank (2a, 2c, 2e, 2g, 3a, 3c, 7) (td-tsX, C$82.98, sector outperformer) the mosaic Company (2g) (mos-nYsE, us$54.06, sector outperformer) tmX Group Inc. (2a, 2e, 7, 9, Cd25) (X-tsX, C$49.30, sector Performer) tourmaline oil Corp. (2a, 2c, 2e, 2g) (tou-tsX, C$33.02, sector outperformer) transAlta Corporation (2a, 2c, 2e, 2g, 7, 9) (tA-tsX, C$14.95, sector Performer) transCanada Corp. (2g, 4a, 4b, 7) (trP-tsX, C$45.98, sector Performer) Veresen Inc. (2a, 2c, 2e, 2g) (Vsn-tsX, C$12.68, sector Performer) Vicwest Inc. (2g, 7) (VIC-tsX, C$12.00, sector outperformer) Yamana Gold Inc. (2a, 2e, 2g, 7) (AuY-nYsE, us$18.80, sector outperformer)
COMPANIES MENTIONED IN THIS REPORT THAT ARE NOT COVERED BY CIBC WORLD MARKETS INC.:
Stock Prices as of 12/03/2012: Apache Corp. (APA-nYsE, us$77.09, not rated) Atco Ltd. (ACo.X-tsX, C$76.15, not rated) CnooC Ltd. (CEo-nYsE, us$213.16, not rated) discovery metals Limited (dmL-Aus, A$1.65, not rated) Exxonmobil Corporation (Xom-nYsE, us$88.14, not rated) mitsubishi Corp (8058-t, ¥1552.00, not rated) PetroChina (Ptr-nYsE, us$133.15, not rated) royal dutch shell (rds.A-nYsE, us$66.97, not rated) statoil AsA (sto-nYsE, us$24.39, not rated) talison Lithium Limited (tLH-tsX, C$6.99, not rated)
Important disclosure footnotes that correspond to the footnotes in this table may be found in the “Key to Important Disclosure Footnotes” section of this report.

dIsCLosurEs
CIBC A Look to the Future – 2013 Edition
96
KEY TO IMPORTANT DISCLOSURE FOOTNOTES:
1 CIBC world markets Corp. makes a market in the securities of this company.
2a this company is a client for which a CIBC world markets company has performed investment banking services in the past 12 months.
2b CIBC world markets Corp. has managed or co-managed a public offering of securities for this company in the past 12 months.
2c CIBC world markets Inc. has managed or co-managed a public offering of securities for this company in the past 12 months.
2d CIBC world markets Corp. has received compensation for investment banking services from this company in the past 12 months.
2e CIBC world markets Inc. has received compensation for investment banking services from this company in the past 12 months.
2f CIBC world markets Corp. expects to receive or intends to seek compensation for investment banking services from this company in the next 3 months.
2g CIBC world markets Inc. expects to receive or intends to seek compensation for investment banking services from this company in the next 3 months.
3a this company is a client for which a CIBC world markets company has performed non-investment banking, securities-related services in the past 12 months.
3b CIBC world markets Corp. has received compensation for non-investment banking, securities-related services from this company in the past 12 months.
3c CIBC world markets Inc. has received compensation for non-investment banking, securities-related services from this company in the past 12 months.
4a this company is a client for which a CIBC world markets company has performed non-investment banking, non-securities-related services in the past 12 months.
4b CIBC world markets Corp. has received compensation for non-investment banking, non-securities-related services from this company in the past 12 months.
4c CIBC world markets Inc. has received compensation for non-investment banking, non-securities-related services from this company in the past 12 months.
5a the CIBC world markets Corp. analyst(s) who covers this company also has a long position in its common equity securities.
5b A member of the household of a CIBC world markets Corp. research analyst who covers this company has a long position in the common equity securities of this company.
6a the CIBC world markets Inc. fundamental analyst(s) who covers this company also has a long position in its common equity securities.
6b A member of the household of a CIBC world markets Inc. fundamental research analyst who covers this company has a long position in the common equity securities of this company.
7 CIBC world markets Corp., CIBC world markets Inc., and their affiliates, in the aggregate, beneficially own 1% or more of a class of equity securities issued by this company.
8 An executive of CIBC world markets Inc. or any analyst involved in the preparation of this research report has provided services to this company for remuneration in the past 12 months.
9 A senior executive member or director of Canadian Imperial Bank of Commerce (“CIBC”), the parent company to CIBC world markets Inc. and CIBC world markets Corp., or a member of his/her household is an officer, director or advisory board member of this company or one of its subsidiaries.

dIsCLosurEs
CIBC A Look to the Future – 2013 Edition
97
10 Canadian Imperial Bank of Commerce (“CIBC”), the parent company to CIBC world markets Inc. and CIBC world markets Corp., has a significant credit relationship with this company.
11 the equity securities of this company are restricted voting shares.
12 the equity securities of this company are subordinate voting shares.
13 the equity securities of this company are non-voting shares.
14 the equity securities of this company are limited voting shares.
Cd7 Jim Prentice, senior Executive Vice President and Vice Chairman, CIBC, is on the Board of directors of BCE Inc.
Cd11 CIBC world markets Inc is acting as financial advisor to rogers Communications Inc with respect to the acquisition by rogers and BCE Inc of a controlling interest in maple Leaf sports and Entertainment.
Cd25 CIBC world markets Inc. owns or controls an equity interest in tmX Group Limited and tmX Group Inc. in excess of 1% of the issued and outstanding equity securities thereof and has a nominee director serving on the board thereof. In addition, Canadian Imperial Bank of Commerce, the parent to CIBC world markets Inc., is a lender to tmX Group Limited under its credit facilities. As such, CIBC world markets Inc. may be considered to have an economic interest in tmX Group Limited and tmX Group Inc.
Cd26 CIBC world markets Inc. is an underwriter for Enbridge Energy Income Fund Holding Inc. subscription receipts offering.
CIBC WORLD MARKETS INC. PRICE CHART
For price and performance information charts required under nYsE and nAsd rules, please visit CIBC on the web at http://apps.cibcwm.com/sec2711 or write to CIBC world markets Inc., Brookfield Place, 161 Bay street, 4th Floor, toronto, ontario m5J 2s8, Attn: research disclosure Chart request.
CIBC WORLD MARKETS INC. STOCK RATING SYSTEM
Abbreviation Rating Description
Stock Ratings
so sector outperformer stock is expected to outperform the sector during the next 12–18 months.
sP sector Performer stock is expected to perform in line with the sector during the next 12–18 months.
su sector underperformer stock is expected to underperform the sector during the next 12–18 months.
nr not rated CIBC world markets does not maintain an investment recommendation on the stock.
r restricted CIBC world markets is restricted*** from rating the stock.
Sector Weightings**
o overweight sector is expected to outperform the broader market averages.
m market weight sector is expected to equal the performance of the broader market averages.
u underweight sector is expected to underperform the broader market averages.
nA none sector rating is not applicable.
**Broader market averages refer to the s&P 500 in the u.s. and the s&P/tsX Composite in Canada. “speculative” indicates that an investment in this security involves a high amount of risk due to volatility and/or liquidity issues. ***restricted due to a potential conflict of interest.

dIsCLosurEs
CIBC A Look to the Future – 2013 Edition
98
RATINGS DISTRIBUTION*: CIBC WORLD MARKETS INC. COVERAGE UNIVERSE
(as of 03 Dec 2012) Count Percent Inv. Banking Relationships Count Percent
sector outperformer (Buy) 143 38.9% sector outperformer (Buy) 141 98.6%
sector Performer (Hold/neutral) 176 47.8% sector Performer (Hold/neutral) 171 97.2%
sector underperformer (sell) 29 7.9% sector underperformer (sell) 27 93.1%
restricted 19 5.2% restricted 19 100.0%
*Although the investment recommendations within the three-tiered, relative stock rating system utilized by CIBC world markets Inc. do not correlate to buy, hold and sell recommendations, for the purposes of complying with nYsE and nAsd rules, CIBC world markets Inc. has assigned buy ratings to securities rated sector outperformer, hold ratings to securities rated sector Performer, and sell ratings to securities rated sector underperformer without taking into consideration the analyst’s sector weighting.
Important disclosures required by IIroC rule 3400, including potential conflicts of interest information, our system for rating investment opportunities and our dissemination policy can be obtained by visiting CIBC world markets on the web at http://researchcentral.cibcwm.com under “Quick Links” or by writing to CIBC world markets Inc., Brookfield Place, 161 Bay street, 4th Floor, toronto, ontario m5J 2s8, Attention: research disclosures request.

LegaL DiscLaimer
This report is issued and approved for distribution by (a) in Canada, CIBC World Markets Inc., a member of the Investment Industry Regulatory Organization of Canada (“IIROC”), the Toronto Stock Exchange, the TSX Venture Exchange and a Member of the Canadian Investor Protection Fund, (b) in the United Kingdom, CIBC World Markets plc, which is regulated by the Financial Services Authority (“FSA”), (c) in Australia to wholesale clients only, CIBC Australia Ltd, a company regulated by the ASIC with AFSL license number 240603 and ACN 000 067 256, and (d) in Japan, CIBC World Markets (Japan) Inc., a registered Type 1 Financial product provider with the registration number Director General of Kanto Finance Bureau #218 (collectively, “CIBC World Markets”) and (e) in the United States either by (i) CIBC World Markets Inc. for distribution only to U.S. Major Institutional Investors (“MII”) (as such term is defined in SEC Rule 15a-6) or (ii) CIBC World Markets Corp., a member of the Financial Industry Regulatory Authority (“FINRA”). U.S. MIIs receiving this report from CIBC World Markets Inc. (the Canadian broker-dealer) are required to effect transactions (other than negotiating their terms) in securities discussed in the report through CIBC World Markets Corp. (the U.S. broker-dealer).
This report is provided, for informational purposes only, to institutional investor and retail clients of CIBC World Markets in Canada, and does not constitute an offer or solicitation to buy or sell any securities discussed herein in any jurisdiction where such offer or solicitation would be prohibited. This document and any of the products and information contained herein are not intended for the use of private investors in the United Kingdom. Such investors will not be able to enter into agreements or purchase products mentioned herein from CIBC World Markets plc. The comments and views expressed in this document are meant for the general interests of wholesale clients of CIBC Australia Ltd.
This report has been prepared by the CIBC group and is issued in Hong Kong by Canadian Imperial Bank of Commerce, Hong Kong Branch, a registered institution under the Securities and Futures Ordinance, Cap 571 (the “SFO”). This report is intended for “professional investors” only (within the meaning of the SFO) and has been prepared for general circulation and does not take into account the objectives, financial situation or needs of any recipient. Any recipient in Hong Kong who has any questions or requires further information on any matter arising from or relating to this report should contact Canadian Imperial Bank of Commerce, Hong Kong Branch at Suite 3602, Cheung Kong Centre, 2 Queen’s Road Central, Hong Kong (telephone number: +852 2841 6111). Orders for Hong Kong listed securities will be executed by Canadian Imperial Bank of Commerce, Hong Kong Branch. Canadian Imperial Bank of Commerce, Hong Kong Branch has entered into an arrangement with its broker-dealer affiliates worldwide to execute orders for securities listed outside of Hong Kong for Hong Kong clients.
This report is intended for distribution in Singapore solely to accredited investors, expert investors and institutional investors (each, “eligible recipients”). Eligible recipients should contact Danny Tan at Canadian Imperial Bank of Commerce, Singapore Branch at 16 Collyer Quay #04-02 Singapore 049318 (telephone number + 65-6423 3806) in respect of any matter arising from or in connection with this report.
The securities mentioned in this report may not be suitable for all types of investors. This report does not take into account the investment objectives, financial situation or specific needs of any particular client of CIBC World Markets. Recipients should consider this report as only a single factor in making an investment decision and should not rely solely on investment recommendations contained herein, if any, as a substitution for the exercise of independent judgment of the merits and risks of investments. The analyst writing the report is not a person or company with actual, implied or apparent authority to act on behalf of any issuer mentioned in the report. Before making an investment decision with respect to any security recommended in this report, the recipient should consider whether such recommendation is appropriate given the recipient’s particular investment needs, objectives and financial circumstances. CIBC World Markets suggests that, prior to acting on any of the recommendations herein, Canadian retail clients of CIBC World Markets contact one of our client advisers in your jurisdiction to discuss your particular circumstances. Non-client recipients of this report who are not institutional investor clients of CIBC World Markets should consult with an independent financial advisor prior to making any investment decision based on this report or for any necessary explanation of its contents. CIBC World Markets will not treat non-client recipients as its clients solely by virtue of their receiving this report.
Past performance is not a guarantee of future results, and no representation or warranty, express or implied, is made regarding future performance of any security mentioned in this report. The price of the securities mentioned in this report and the income they produce may fluctuate and/or be adversely affected by exchange rates, and investors may realize losses on investments in such securities, including the loss of investment principal. CIBC World Markets accepts no liability for any loss arising from the use of information contained in this report, except to the extent that liability may arise under specific statutes or regulations applicable to CIBC World Markets.
Information, opinions and statistical data contained in this report were obtained or derived from sources believed to be reliable, but CIBC World Markets does not represent that any such information, opinion or statistical data is accurate or complete (with the exception of information contained in the Important Disclosures section of this report provided by CIBC World Markets or individual research analysts), and they should not be relied upon as such. All estimates, opinions and recommendations expressed herein constitute judgments as of the date of this report and are subject to change without notice.
Nothing in this report constitutes legal, accounting or tax advice. Since the levels and bases of taxation can change, any reference in this report to the impact of taxation should not be construed as offering tax advice on the tax consequences of investments. As with any investment having potential tax implications, clients should consult with their own independent tax adviser.
This report may provide addresses of, or contain hyperlinks to, Internet web sites. CIBC World Markets has not reviewed the linked Internet web site of any third party and takes no responsibility for the contents thereof. Each such address or hyperlink is provided solely for the recipient’s convenience and information, and the content of linked third party web sites is not in any way incorporated into this document. Recipients who choose to access such third-party web sites or follow such hyperlinks do so at their own risk.
Although each company issuing this report is a wholly owned subsidiary of Canadian Imperial Bank of Commerce (“CIBC”), each is solely responsible for its contractual obligations and commitments, and any securities products offered or recommended to or purchased or sold in any client accounts (i) will not be insured by the Federal Deposit Insurance Corporation (“FDIC”), the Canada Deposit Insurance Corporation or other similar deposit insurance, (ii) will not be deposits or other obligations of CIBC, (iii) will not be endorsed or guaranteed by CIBC, and (iv) will be subject to investment risks, including possible loss of the principal invested. The CIBC trademark is used under license.
© 2012 CIBC World Markets Inc. All rights reserved. Unauthorized use, distribution, duplication or disclosure without the prior written permission of CIBC World Markets is prohibited by law and may result in prosecution.

Contributorsinstitutional Equity rEsEarCh
agriCulturE, ChEmiCals & fErtilizErs
ConstruCtion & EnginEEring
EnErgy: oil & gas finanCial institutions mEtals & mining
Jacob Bout, CFA416 [email protected]
Paul Lechem416 [email protected]
Andrew Potter, CFA403 [email protected]
Robert Sedran, CFA416 [email protected]
Barry Cooper416 [email protected]
Alec Kodatsky416 [email protected]
Portfolio stratEgy & quantitativE analysis
rEal EstatE & rEits
Peter Gibson416 [email protected]
Alex Avery, CFA, MRICS416 [email protected]
EConomiCs
Avery Shenfeld416 [email protected]
maCro stratEgy
CommoditiEs CorPoratE CrEdit CurrEnCiEs govErnmEnt ratEsKatherine Spector212 [email protected]
Joanna Zapior416 [email protected]
Jeremy Stretch+44 (0) 207 [email protected]
Warren Lovely416 [email protected]
Tim Self416 [email protected]
Mike [email protected]
Bipan Rai416 [email protected]
Patrick Bennett+852 3907 [email protected]
John H. Welch416 [email protected]
Equity markEts
Equity CaPital markEts
PrimE sErviCEs E-solutions
Dan Nowlan416 [email protected]
Thomas Kalafatis416 [email protected]
Darren Sumarah416 [email protected]
Jim Ginis416 [email protected]
Scott Smith416 [email protected]
Greg King416 [email protected]
CaPital markEts trading
dEbt CaPital markEts Equity struCturEd ProduCts
CommoditiEs struCturing
fx struCturing
Susan Rimmer416 [email protected]
Sunil [email protected]
Bill Bamber416 [email protected]
Michael LaSorda416 [email protected]
Robert Gunja416 [email protected]
Doug Bartlett416 [email protected]
Cliff Inskip416 [email protected]
George Liu416 [email protected]
Osahon Omokhodion416 [email protected]
Llion Owen416 [email protected]
Meaghan Stoll-Kimball416 [email protected]
invEstmEnt banking CorPoratE CrEdit ProduCts
global EnErgy global mining m&a loan syndiCationsMark Horsfall403 [email protected]
Thy Terblanche416 [email protected]
James J. Yang+8610 6566 [email protected]
Michael Boyd416 [email protected]
Jacqueline Orenstein416 [email protected]
ExECutivE Editorial tEam
Quentin Broad416 [email protected]
Eric Métivier416 [email protected]
Joanna Zapior416 [email protected]