a loose fit: india and the briics ulrich bartsch
TRANSCRIPT

A Loose Fit: India and the BRIICS
Ulrich Bartsch

Themes
• Not an optimal currency area: economic cycles in India and the BRIICS .• Monetary policy through the rear-view mirror.• India’s medium- to long-term prospects: no-one pays the debt.• Work hard to make a living: reforms are needed to tackle structural
barriers to growth.

BRIICS: Divergence in Economic Cycles
-4.0
-2.0
0.0
2.0
4.0
6.0
8.0
10.0
12.0
14.0
16.0
18.0
Jan-
07
Apr-
07
Jul-0
7
Oct
-07
Jan-
08
Apr-
08
Jul-0
8
Oct
-08
Jan-
09
Apr-
09
Jul-0
9
Oct
-09
Jan-
10
Apr-
10
Jul-1
0
Oct
-10
Jan-
11
Apr-
11
Jul-1
1
Oct
-11
CPI Inflation
Source: IFS
-20.0
-15.0
-10.0
-5.0
0.0
5.0
10.0
15.0
20.0
Mar
-98
Oct
-98
May
-99
Dec
-99
Jul-0
0
Feb-
01
Sep-
01
Apr-
02
Nov
-02
Jun-
03
Jan-
04
Aug-
04
Mar
-05
Oct
-05
May
-06
Dec
-06
Jul-0
7
Feb-
08
Sep-
08
Apr-
09
Nov
-09
Jun-
10
Jan-
11
Aug-
11
GDP Growth

Divergence: India’s monetary policy
• Flexible exchange rate as a shock absorber
• Capital controls enhance monetary policy independence
• Foreign reserves to create confidence
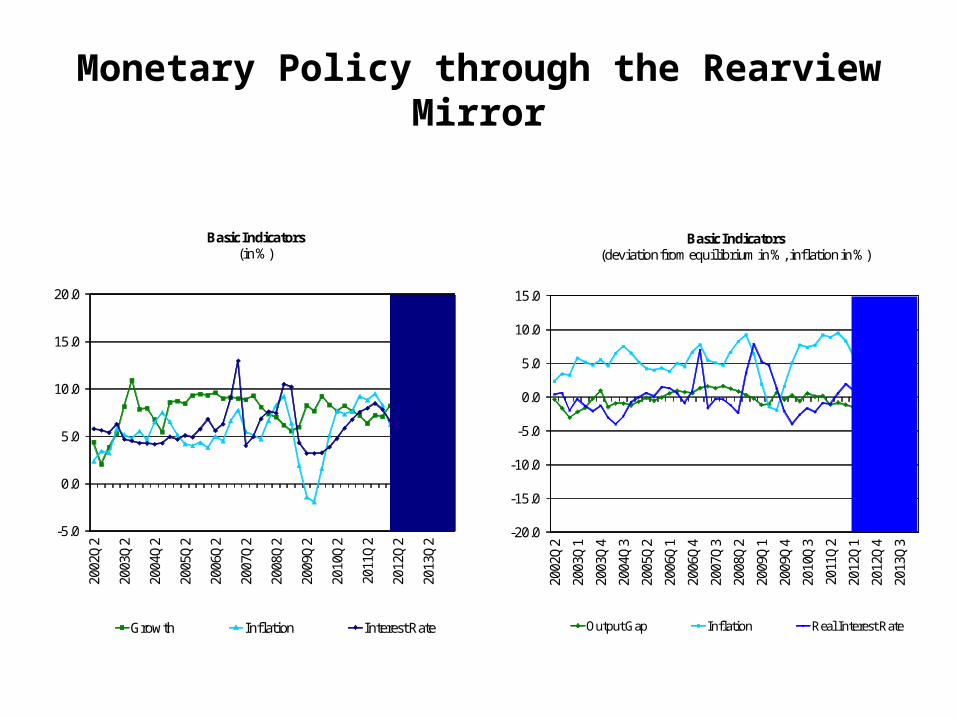
Monetary Policy through the Rearview Mirror
-5.0
0.0
5.0
10.0
15.0
20.0
2002
Q2
2003
Q2
2004
Q2
2005
Q2
2006
Q2
2007
Q2
2008
Q2
2009
Q2
2010
Q2
2011
Q2
2012
Q2
2013
Q2
Basic Indicators(in %)
Growth Inflation Interest Rate
-20.0
-15.0
-10.0
-5.0
0.0
5.0
10.0
15.0
2002
Q2
2003
Q1
2003
Q4
2004
Q3
2005
Q2
2006
Q1
2006
Q4
2007
Q3
2008
Q2
2009
Q1
2009
Q4
2010
Q3
2011
Q2
2012
Q1
2012
Q4
2013
Q3
Basic Indicators(deviation from equilibrium in %, inflation in %)
Output Gap Inflation Real Interest Rate

Something for Nothing: India’s Debt Dynamics19
96
1997
1998
1999
2000
2001
2002
2003
2004
2005
2006
2007
2008
2009
2010
-12.0
-8.0
-4.0
0.0
4.0
8.0
12.0
-12.0
-8.0
-4.0
0.0
4.0
8.0
12.0r - g Real Int. Rate Real GDP Gr. Rate
Interest Rate and GDP Growth Rate, 1999-2010

Unfavorable Debt Dynamics: Aging Populations in the OECD Countries
Example: GermanyRising welfare costs, falling labor supply, low growth

The Developed Countries are Bankrupt!
Surce: IMF, Fiscal Monitor April 2011, http://www.imf.org/external/pubs/ft/fm/2011/01/pdf/fm1101.pdf


Demographic Transition in India
• The Indian population is among the youngest in the world; only now (2010s) can we see the beginning of the demographic transition to lower dependency ratios.
• The transition comes not only from demographic changes: increasing numbers of women enter the (paid) labor force.
• India will reap the maximum benefit of the transition around 2040 – far later than most other big countries, China included.
• This also means large additions to the labor force: 1 million people per month over the next 20 years.
• Job and skill creation are the biggest challenges.
75000 55000 35000 15000 5000 25000 45000 65000
15-1920-2425-2930-3435-3940-4445-4950-5455-5960-6465-6970-7475-7980-8485-8990-9495-99100+
Males Population in Thousands Females
2040
75000 55000 35000 15000 5000 25000 45000 65000
15-1920-2425-2930-3435-3940-4445-4950-5455-5960-6465-6970-7475-7980-8485-8990-9495-99100+
Males Population in Thousands Females
2020
75000 55000 35000 15000 5000 25000 45000 65000
15-1920-2425-2930-3435-3940-4445-4950-5455-5960-6465-6970-7475-7980-8485-8990-9495-99100+
2000
75000 55000 35000 15000 5000 25000 45000 65000
15-1920-2425-2930-3435-3940-4445-4950-5455-5960-6465-6970-7475-7980-8485-8990-9495-99100+
1980
Educational attainment by age group, 1980-2040
No education Primary Secondary Tertiary

Constraints to Growth of Industry
• Land– Archaic rules, eminent domain use leads to discontent (the increase in the value of land from
conversion to industrial, commercial, and residential uses is often not captured by the original owners, who feel cheated), poor land use planning.
• Power– Most surveys of entrepreneurs indicate availability of reliable power as a major constraint. – The constraint is more binding for medium and small firms, as most large firms have captive
generators (which also raises costs).– Large increase in power generation required to sustain high growth – fuel availability constraints.
• Use of natural resources– Hydropower expansion is hampered by conflicts over water and forests.– Conflicts over mining impede exploitation of minerals.
• Environmental regulation– Years of loose enforcement and corruption have created a legacy of destruction, change in
enforcement has stopped projects in late stages of execution, created regulatory uncertainty.

US and Europe Slowing, India and China Catching Up
• From the middle of the last century, Western Europe started diverging from the rest of the world.
• In the 1800s, the US and Western Europe both experienced accelerated per capita GDP growth because of the industrial revolution.
• Growth in India and China continued to be very slow until the 1970s, when it started accelerating in China, and less so in India.
• China and India had the same per capita income in 1973, but then China pulled ahead.
• Since the 1990s, growth in the US and Western Europe is slowing, giving India and China room to catch up.
0 1000 1500 1600 1700 1820 1870 1913 1950 1973 1998 20101
10
100
1000
10000
100000
Per Capita GDP, 0-2010(in constant 1990 U.S. dollars, log scale)
North America Western Europe China India
Source: Angus Maddison, worldeconomy.org.

India and China Regaining their Place in the World Economy?
• Throughout much of recorded history, India and China held a dominant position in world production and income.
• Only in the 1600s, Western Europe started its rise as a global economic force, complemented by the US from the 1800s.
• From 1700s to the turn of the millennium, the global share of China and India fell from 50 to 15 percent.
• Since the 1970s, a turnaround has become visible, and China in particular is increasing its share in the global economy.
0 1000 1500 1600 1700 1820 1870 1913 1950 1973 1998 20100.0
10.0
20.0
30.0
40.0
50.0
60.0
70.0
80.0
Share in World GDP(in percent)
Total Western Europe United StatesChina India

Final Remarks
• Continued fast growth in India critically depends on removing structural constraints.
• The government is tackling some of them including with new laws and regulation.
• Political leadership required to address politically sensitive issues, such as losses in the electricity sector.
• If structural constraints can be loosened, India could benefit from a strong rise in the economically active population – the demographic dividend – well into the 21st century.
• India could reclaim the place in the world economy it held up to the 17th century, when it accounted for 25% of world GDP.